Search for Quark Substructure in 7 TeV pp Collisions with ... · Search for Quark Substructure in 7...
30
Search for Quark Substructure in 7 TeV pp Collisions with the ATLAS Detector Frank Berghaus SUPERVISOR: Michel Lefebvre University of Victoria June 12, 2012
Transcript of Search for Quark Substructure in 7 TeV pp Collisions with ... · Search for Quark Substructure in 7...

Search for Quark Substructure in 7 TeV ppCollisions with the ATLAS Detector
Frank Berghaus
SUPERVISOR: Michel Lefebvre
University of Victoria
June 12, 2012
Introduction ATLAS and the LHC
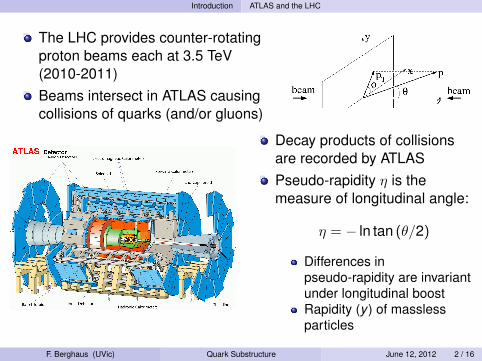
The LHC provides counter-rotatingproton beams each at 3.5 TeV(2010-2011)Beams intersect in ATLAS causingcollisions of quarks (and/or gluons)
Decay products of collisionsare recorded by ATLASPseudo-rapidity η is themeasure of longitudinal angle:
η = − ln tan (θ/2)
Differences inpseudo-rapidity are invariantunder longitudinal boostRapidity (y ) of masslessparticles
F. Berghaus (UVic) Quark Substructure June 12, 2012 2 / 16

Introduction Quark Compositeness
Quark Compositeness
Are quarks fundamental particles or composite objects?Constituents are generally called preonsPreons may reveal themselves at an energy scale Λ
Expect to see the effects of composite nature if√
s is sufficientlyhigh
At lower energies quarks appear point-likeSearch for deviation in dijet cross-section from QCD prediction
A 4-fermion contact interaction should become evident for anobservation of quark compositenessIf data agrees well with QCD set a limit on Λ
Aside: Composite nature could also be observed by finding aquark resonance
F. Berghaus (UVic) Quark Substructure June 12, 2012 3 / 16

Introduction Quark Compositeness
Quark Contact Interactions (CI)
Effects of contact interactions should appear if√
s is sufficientlylargeIf Λ >
√s interactions between constituents are suppressed, with
quarks appearing point-like→ dominant contribution to crosssection from 4-fermion contact term
4-fermion contact term in Lagrangian
Lqqqq (Λ) =ξg2
2Λ2 ΨLqγ
µΨLqΨL
qγµΨLq
g2/4π = 1, Ψ are the left handed quarksξ = +1 (−1) is destructive (constructive)interference with QCDExclusion limits change by ∼1 % dependingon the choice of ξ
F. Berghaus (UVic) Quark Substructure June 12, 2012 4 / 16

Measurement Observable: χ
Sensitive Observables
QCD at LO looks like Rutherford scattering in the centre-of-massframe:
d σdΩ∼ 1
sin4 (Θ/2)
Contact interactions are expected to yield a more isotropicspectrumUseful angular variable in hadron collider experiment is χ:
χ = e|y1−y2| =1 + cosΘ
1− cosΘ
y1 is the rapidity of the leading (in pT ) jety2 is the rapidity of the sub-leading (in pT ) jetInvariant under Lorentz boosts along the beam (z)
F. Berghaus (UVic) Quark Substructure June 12, 2012 5 / 16
Measurement Observable: χ
Expected Distribution
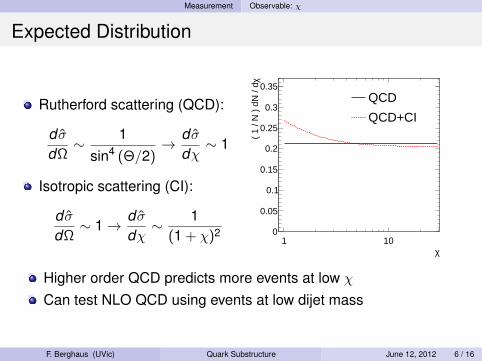
Rutherford scattering (QCD):
d σdΩ∼ 1
sin4 (Θ/2)→ d σ
dχ∼ 1
Isotropic scattering (CI):
d σdΩ∼ 1→ d σ
dχ∼ 1
(1 + χ)2
χ1 10
χ(
1 / N
) d
N /
d
0
0.05
0.1
0.15
0.2
0.25
0.3
0.35QCD
QCD+CI
Higher order QCD predicts more events at low χ
Can test NLO QCD using events at low dijet mass
F. Berghaus (UVic) Quark Substructure June 12, 2012 6 / 16

Measurement Distribution
Data Distributions
|2
-y1
|y = eχ
1 10
χ d
N /
d×
( 1
/ N )
0
0.05
0.1
0.15
0.2
0.25
0.3
0.35 < 800 GeV ( +0.00 )jj520 < m
< 1200 GeV ( +0.04 )jj800 < m
< 1600 GeV ( +0.08 )jj1200 < m
< 2000 GeV ( +0.12 )jj1600 < m
< 7000 GeV ( +0.18 )jj2000 < m
QCD Prediction
= 5000 GeVΛQCI with
ATLAS WorkIn Progress
2010 data L = 36 pb−1
Low χ implies largescattering angleData and MC predictionare normalized per mjj binOffset each mjj bin fordisplayQCD and CI prediction iscorrected to NLO usingk-factors derived from QCDNLO calculations for CIhave recently becomeavailable [5]
F. Berghaus (UVic) Quark Substructure June 12, 2012 7 / 16

Analysis Methodology
Likelihood Function
Counting events in bins of mjj and χ so binned Poisson Likelihood:
L(n|Λ) =
Nbins∏j=0
(µj(Λ)nj
nj !· e−µj (Λ)
)
nj is the number of recorded events in bin jµj (Λ) is the number of events predicted for bin j at CI scale Λ
Shape only analysis: The MC is normalized to contain the samenumber of events as the data in each mjj binSince we only have MC simulation for some discrete points in Λ fit:
µj(Λ) ∼ a0︸︷︷︸QCD
+ a1Λ−4︸ ︷︷ ︸CI
+ a2Λ−2︸ ︷︷ ︸Interference
F. Berghaus (UVic) Quark Substructure June 12, 2012 8 / 16

Analysis Methodology
Test Statistics
Maximum likelihood ratio
Q(Λ) = −2 ln
(L(n|Λ)
L(n|Λ)
)
Λ is the most likely value of Λ found byminimizing −2 ln L(n|Λ)
where n stands for the data recorded or pseudo-experiments
F. Berghaus (UVic) Quark Substructure June 12, 2012 9 / 16

Analysis Methodology
p-Value for Q (Maximum Likelihood Ratio)
Create pseudo-experiments bydrawing Poisson random numbers ineach bin centred on theMC-prediction for Λ =∞Fill likelihood distribution with Q fromeach pseudo-experimentDetermine the fraction ofpseudo-experiments with Q greaterthan the data
ATLAS WorkIn Progress
p-Value from ATLAS data:0.95
The p-value is the probability of observinga more extreme Q given QCD than thedata: PQCD(Q(∞) ≥ Qdata(∞))
F. Berghaus (UVic) Quark Substructure June 12, 2012 10 / 16

Analysis Methodology
Definition of Confidence Limits
Extend the idea of the p-value to be computed from our predictionat some Λ [6]:
CLs+b(Λ) = PQCD+CI(Q(Λ) ≥ Qdata(Λ))
Previous ATLAS exclusion limit was set at CLs+b < 0.05 (the 95 %exclusion limit)A more conservative approach corrects for the QCD likelihooddistribution assuming Λ:
CLs(Λ) =PQCD+CI(Q(Λ) ≥ Qdata(Λ))
1− PQCD(Q(Λ) ≤ Qdata(Λ))
CMS used this definition in their recent paper
F. Berghaus (UVic) Quark Substructure June 12, 2012 11 / 16

Analysis Results
Λ Limit using CLs with Q
[TeV]Λ
2 3 4 5 6 7
sC
L
0.04
0.05
0.06
0.07
0.08
0.09
0.1
observed
expected
σ 1±expected
σ 2±expected
ATLAS WorkIn Progress
Using 2010 ATLASdata L = 36 pb−1
Test statistic
Q = −2 lnL(n|Λ)
L(n|Λ)
Observed 95 %CLs limit = 5.36 TeVExpected 95 %CLs limit = 5.31 TeV
F. Berghaus (UVic) Quark Substructure June 12, 2012 12 / 16

Analysis Errors
Systematic Effects
ExperimentalJet Energy Scale (∼ 0.1% change to CLs)
Could cause excess of events at high jj
Jet pT resolution (∼ 0.1% change to CLs)Minimal bin-to-bin migration in mjj
Theoretical:Factorization (µf ) and renormalization (µr ) scale choice(∼ 1.3% change to CLs)
Dominant effect
Parton distribution function errors (∼ 0.2% change to CLs)
Angular observable minimizes the effect of all of theseuncertaintiesSystematic effects are included through Bayesian integration
F. Berghaus (UVic) Quark Substructure June 12, 2012 13 / 16

Analysis Errors
Effect on Limits
ATLAS Work In ProgressCLs CLs+b
Effect Obs [TeV] Exp [TeV] Obs [TeV] Exp [TeV]No Systematics 5.36 5.31 5.60 5.48MC Statistics 5.36 5.31 5.59 5.49Jet pT Resolution 5.37 5.31 5.60 5.49Jet Energy Scale 5.37 5.31 5.60 5.49µf /µr Scale Choice 5.29 5.21 5.54 5.40PDF Fit Errors 5.37 5.32 5.60 5.50All1 5.29 5.20 5.52 5.41
1Assuming effects are independentF. Berghaus (UVic) Quark Substructure June 12, 2012 14 / 16

Analysis Errors
Previous Limitswith ξ = −1
Limits [TeV]Experiment
√s [TeV] L [fb−1] observed expected Stat
ATLAS 7 4.8 7.8 8.7 CLs+bCMS 7 2.2 10.5 9.7 CLsD0 1.96 0.7 2.82 2.75 binned χ2
CDF2 1.96 0.106 1.4 - binned χ2
All limits based on χ and mjj [1, 2, 3, 4]ATLAS also performed measurement using the centrality ratiofinely binned in mjj to get a 95 % CLs+b exclusion of 7.6 TeV(expected 8.2 TeV)
2CDF paper is from 1996, while D0’s is from 2009F. Berghaus (UVic) Quark Substructure June 12, 2012 15 / 16

Summary
SummaryATLAS Work In Progress
An exclusion limit for quark compositeness has been obtainedfrom the 2010 data-set
Λ > 5.29 TeV at 95% CLs 7 TeV Collisions L = 36 pb−1
Accounted For:Jet energy scale uncertaintyJet pT resolutionFactorization and renormalization scaleuncertaintyPDF fit errorsStatistical limitations of simulated events
F. Berghaus (UVic) Quark Substructure June 12, 2012 16 / 16

Appendix Data-set
Event Cleaning and Selection
GRL: Require LHC stable beam, good conditions for the Innerdetector and calorimetersUsing single jet triggers on efficiency plateau
Cleaning cuts:One primary vertex with at least five tracksAll jets pass quality cuts
Selection CutsLeading jet pT > 60 GeVSub-leading jet pT > 30 GeVDijet rapidity separation |y?| = |(y1 − y2)/2| < 1.7Dijet boost |y | = |(y1 + y2)/2| < 1.1
F. Berghaus (UVic) Quark Substructure June 12, 2012 17 / 16

Appendix Data-set
Total Data For Analysis
ATLAS Work In Progressmjj Bin [TeV] Periods A-E Periods F-Imin max L1 Item L [pb−1] EF Item L [pb−1].52 .8 J30 2.00 j50_jetNoEF 0.25.8 1.2 J55 3.11 j77_jetNoEF 6.461.2 1.6 J55 3.11 j95_NoAlg 33.171.6 2.0 J55 3.11 j95_NoAlg 33.172.0 ∞ J55 3.11 j95_NoAlg 33.17
Trigger selection guarantees ∼100 % efficiency in each mjj binTotal 2010 data: ∼36 pb−1
F. Berghaus (UVic) Quark Substructure June 12, 2012 18 / 16

Appendix Exclusion Limits
Test Statistics
Likelihood ratio (reference tomost probable)
Q(Λ) = −2 ln
(L(n|Λ)
L(n|Λ)
)
Λ is the most likely value of Λfound by minimizing−2 ln L(n|Λ)
Likelihood ratio (reference toQCD)
q(Λ) = −2 ln(
L(n|Λ)
L(n|∞)
)
Λ =∞ implies the likelihoodof QCD given the data
where n stands for the data recorded or pseudo-experiments
F. Berghaus (UVic) Quark Substructure June 12, 2012 19 / 16

Appendix Exclusion Limits
Λ Limit using CLs+b with Q
[TeV]Λ
2 3 4 5 6 7
s+b
CL
0.04
0.05
0.06
0.07
0.08
0.09
0.1
observed
expected
σ 1±expected
σ 2±expected
ATLAS WorkIn Progress
Using 2010 ATLASdata L = 36 pb−1
Using test statistic
Q = −2 lnL(n|Λ)
L(n|Λ)
Observed 95 %CLs+b limit = 5.60 TeVExpected 95 %CLs+b limit = 5.48 TeV
F. Berghaus (UVic) Quark Substructure June 12, 2012 20 / 16

Appendix Exclusion Limits
Λ Limit using CLs+b with q
ATLAS WorkIn Progress
Using 2010 ATLASdata L = 36 pb−1
Using test statistic
q = −2 lnL(n|Λ)
L(n|∞)
Observed 95 %CLs+b limit = 5.85 TeVExpected 95 %CLs+b limit = 5.70 TeV
F. Berghaus (UVic) Quark Substructure June 12, 2012 21 / 16

Appendix Exclusion Limits
Λ Limit using CLs with q
ATLAS WorkIn Progress
Using 2010 ATLASdata L = 36 pb−1
Using test statistic
q = −2 lnL(n|Λ)
L(n|∞)
Observed 95 %CLs limit = 5.54 TeVExpected 95 %CLs limit = 5.47 TeV
F. Berghaus (UVic) Quark Substructure June 12, 2012 22 / 16
Appendix Review
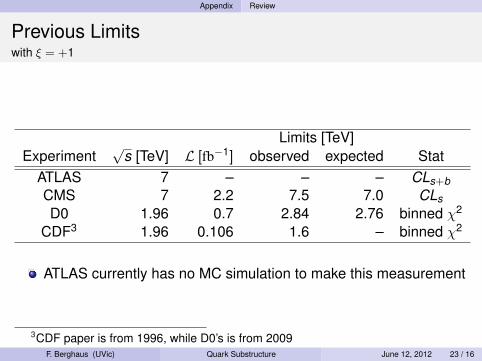
Previous Limitswith ξ = +1
Limits [TeV]Experiment
√s [TeV] L [fb−1] observed expected Stat
ATLAS 7 – – – CLs+bCMS 7 2.2 7.5 7.0 CLsD0 1.96 0.7 2.84 2.76 binned χ2
CDF3 1.96 0.106 1.6 – binned χ2
ATLAS currently has no MC simulation to make this measurement
3CDF paper is from 1996, while D0’s is from 2009F. Berghaus (UVic) Quark Substructure June 12, 2012 23 / 16

Appendix PDF Fits
QCI Simulation Fits Residuals
-4Λ = αIndex of
0 2 4 6 8 10 12
MC
σ)
) /
α(fit
) -
nα(
MC
( n
-6
-4
-2
0
2
-4Λ = αIndex of
0 2 4 6 8 10 12
MC
σ)
) /
α(fit
) -
nα(
MC
( n
-3
-2
-1
0
1
2
-4Λ = αIndex of
0 2 4 6 8 10 12
MC
σ)
) /
α(fit
) -
nα(
MC
( n
-3
-2
-1
0
1
2
3
4
-4Λ = αIndex of
0 2 4 6 8 10 12
MC
σ)
) /
α(fit
) -
nα(
MC
( n
-2
-1
0
1
2
-4Λ = αIndex of
0 2 4 6 8 10 12
MC
σ)
) /
α(fit
) -
nα(
MC
( n
-2
-1.5
-1
-0.5
0
0.5
1
-4Λ = αIndex of
0 2 4 6 8 10 12
MC
σ)
) /
α(fit
) -
nα(
MC
( n
-2
-1.5
-1
-0.5
0
0.5
1
1.5
2
-4Λ = αIndex of
0 2 4 6 8 10 12
MC
σ)
) /
α(fit
) -
nα(
MC
( n
-1
-0.5
0
0.5
1
1.5
-4Λ = αIndex of
0 2 4 6 8 10 12
MC
σ)
) /
α(fit
) -
nα(
MC
( n
-1
-0.5
0
0.5
1
1.5
-4Λ = αIndex of
0 2 4 6 8 10 12
MC
σ)
) /
α(fit
) -
nα(
MC
( n
-1
-0.5
0
0.5
1
1.5
-4Λ = αIndex of
0 2 4 6 8 10 12
MC
σ)
) /
α(fit
) -
nα(
MC
( n
-1.5
-1
-0.5
0
0.5
1
1.5
2
-4Λ = αIndex of
0 2 4 6 8 10 12
MC
σ)
) /
α(fit
) -
nα(
MC
( n
-1.5
-1
-0.5
0
0.5
1
1.5
2
2.5
ATLAS WorkIn Progress
F. Berghaus (UVic) Quark Substructure June 12, 2012 24 / 16

Appendix Systematics
Factorization/renormalization Scale Choice
Large (∼ 20%) variationacross χDominant effectPrior:
µr and µf picked from 1x
between 0.5 and 2.0 each
χ1 10
(nom
inal
)σ
)/ fµ, rµ(σ0.5
0.6
0.7
0.8
0.9
1
1.1
1.2
1.3
1.4
1.5
2 ) = ( 2.0, 2.0 ) Qf
µ, r
µ( 2 ) = ( 0.5, 0.5 ) Q
fµ,
rµ(
2 ) = ( 1.0, 2.0 ) Qf
µ, r
µ( 2 ) = ( 1.0, 0.5 ) Q
fµ,
rµ(
2 ) = ( 2.0, 1.0 ) Qf
µ, r
µ( 2 ) = ( 0.5, 1.0 ) Q
fµ,
rµ(
2 ) = ( 1.0, 1.0 ) Qf
µ, r
µ(
F. Berghaus (UVic) Quark Substructure June 12, 2012 25 / 16
Appendix Systematics
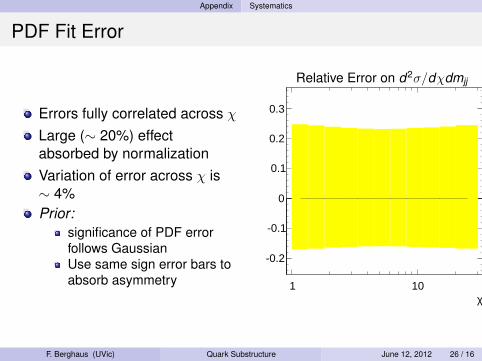
PDF Fit Error
Errors fully correlated across χLarge (∼ 20%) effectabsorbed by normalizationVariation of error across χ is∼ 4%Prior:
significance of PDF errorfollows GaussianUse same sign error bars toabsorb asymmetry
χ1 10
-0.2
-0.1
0
0.1
0.2
0.3
Relative Error on d2σ/dχdmjj
F. Berghaus (UVic) Quark Substructure June 12, 2012 26 / 16

Appendix Summary
Table to Calculated Exclusion Limits
ATLAS Work In Progress
StatQ = −2 ln L(n|Λ)
L(n|Λ)q = −2 ln L(n|Λ)
L(n|Λ=inf)
obs [TeV] exp [TeV] obs [TeV] exp [TeV]CLs+b 5.60 5.48 5.85 5.70CLs 5.36 5.31 5.54 5.47
As presented above
F. Berghaus (UVic) Quark Substructure June 12, 2012 27 / 16

Appendix References
Bibliography I
The ATLAS Collaboration“Search for New Phenomena in Dijet Mass and AngularDistributions”47th Rencontres de Moriond on Electroweak Interactions andUnified TheoriesATLAS-CONF-2012-038
S. Chatrchyan et al. [CMS Collaboration],“Search for quark compositeness in dijet angular distributions frompp collisions at sqrt(s) = 7 TeV,”JHEP 1205, 055 (2012)[arXiv:1202.5535 [hep-ex]]
F. Abe et al. [CDF Collaboration],“Measurement of dijet angular distributions at CDF,”Phys. Rev. Lett. 77, 5336 (1996)
F. Berghaus (UVic) Quark Substructure June 12, 2012 28 / 16

Appendix References
Bibliography II
V. M. Abazov et al. [D0 Collaboration],“Measurement of dijet angular distributions at s**(1/2) = 1.96-TeVand searches for quark compositeness and extra spatialdimensions,”Phys. Rev. Lett. 103, 191803 (2009)
J. Gao et al“Next-to-leading QCD effect on the quark compositeness search atthe LHC”Phys. Rev. Lett. 106, 142001 (2011)
T. Junk“Confidence level computation for combining searches with smallstatistics”Nuclear Instruments and Methods 434, Pages 435-443 (1999)
F. Berghaus (UVic) Quark Substructure June 12, 2012 29 / 16

Appendix References
Bibliography III
M. Cacciari and G. P. Salam, Phys. Lett. B 641, 57 (2006)[hep-ph/0512210].
S. Catani and M. H. Seymour, Nucl. Phys. B 485, 291 (1997)[Erratum-ibid. B 510, 503 (1998)] [arXiv:hep-ph/9605323].
T. Carli, D. Clements, A. Cooper-Sarkar, C. Gwenlan, G. P. Salam,F. Siegert, P. Starovoitov and M. Sutton, Eur. Phys. J. C 66, 503(2010) [arXiv:0911.2985 [hep-ph]].
F. Berghaus (UVic) Quark Substructure June 12, 2012 30 / 16