Seaports & Pomorskie Region - PTMEW · 2013-06-19 · Seaports & Pomorskie Region presentation on...
16
Seaports & Pomorskie Region presentation on the basis of TransBaltic research project The assessment of influence of Gdańsk and Gdynia sea ports on the social and economic situation in the Pomorskie Region TRANSPORT WEEK 2012 Dr Maciej Matczak Department of Transport Systems, Gdynia Maritime University Actia Consulting/ Actia Forum Ltd
Transcript of Seaports & Pomorskie Region - PTMEW · 2013-06-19 · Seaports & Pomorskie Region presentation on...

Seaports & Pomorskie Region
presentation on the basis of
TransBaltic research project The assessment of influence of Gdańsk and Gdynia sea ports on the social and
economic situation in the Pomorskie Region
TRANSPORT WEEK 2012
Dr Maciej Matczak Department of Transport Systems, Gdynia Maritime University
Actia Consulting/ Actia Forum Ltd

Services: • Business Consulting (Actia Consulting); • Events, (Actia Conferences) • Public Relations & Public Affairs.
Clients: • Transport, • Infrastructure development, • Tourist market, • Public sector, • Energy sector.
Actia Consulting/Actia Forum Sp. z o.o.

Interrelation of the quantitative nature:
• Labour market on the seaport sector,
• The number of entities operating in the ports,
• The gross value added and gross domestic product,
• The scope of investment,
• The volume of public income (taxes),
• The role of seaports in the Regional trade,
• Externalities of seaports hinterland traffic.
The qualitative nature of interrelation: cooperative (cluster) relations, the possibilities of creating activity of high value added , strategic meaning of the sea ports?
Scope of research
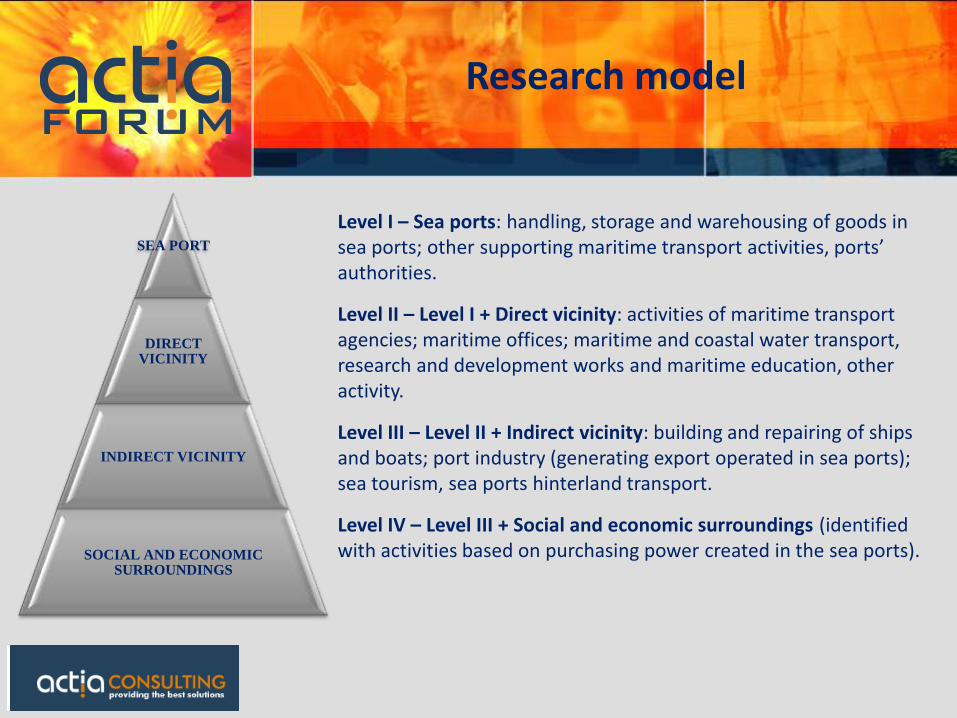
Level I – Sea ports: handling, storage and warehousing of goods in sea ports; other supporting maritime transport activities, ports’ authorities.
Level II – Level I + Direct vicinity: activities of maritime transport agencies; maritime offices; maritime and coastal water transport, research and development works and maritime education, other activity.
Level III – Level II + Indirect vicinity: building and repairing of ships and boats; port industry (generating export operated in sea ports); sea tourism, sea ports hinterland transport.
Level IV – Level III + Social and economic surroundings (identified with activities based on purchasing power created in the sea ports).
Research model
SEA PORT
DIRECT VICINITY
INDIRECT VICINITY
SOCIAL AND ECONOMIC SURROUNDINGS

Labour market
Level I 4 482
Level II 13 388
Level III 59 378
Level IV 114 519
%
Level I 0,54%
Level II 1,61%
Level III 7,14%
Level IV 13,76%
80
90
100
110
120
130
140
2004 2005 2006 2007 2008 2009 2010
Seaports
Port direct vicinity
Port indirect vicinity
Port social and economic surroundings

The level and development of the number of seaport sector entities
Level I 190
Level II 1 045
Level III 14 822
Level IV 32 334
%
Level I 0,07%
Level II 0,40%
Level III 5,70%
Level IV 12,43%
0
50
100
150
200
2004 2005 2006 2007 2008 2009 2010
Seaports
Port direct vicinity
Port indirect vicinity
Port social and economic surroundings

Gross Added Value in seaports
GAV M zloty
Level I 489,9
Level II 1 339,2
Level III 4 850,7
Level IV 10 581,5
%
Level I 0,76%
Level II 2,07%
Level III 7,49%
Level IV 16,34%
20,0% 18,9% 17,9%
20,0% 17,9%
16,6% 16,3%
0,0%
5,0%
10,0%
15,0%
20,0%
25,0%
0
2 000
4 000
6 000
8 000
10 000
12 000
14 000
2004 2005 2006 2007 2008 2009 2010
Seaports
Port direct vicinity
Port indirect vicinity
Port social and economic surroundings
Share in % within the region

Investments of the seaports sector
m zloty
Level I 239,2
Level II 521,7
Level III 2 194,1
Level IV 3 359,5
%
Level I 1,2%
Level II 2,8%
Level III 12,5%
Level IV 19,1%
0,0 50,0 100,0 150,0 200,0 250,0
Maritime transport
R&D
Maritime agencies
Other activity of maritime transport …
Other
Stevedoring, storage and warehousing
Port authorities
Port administration buildings and infrastructure
equipment
means of transport

Public incomes Gross salary and Personal Income Tax (PIT)
0,00 zł 1 000,00 zł 2 000,00 zł 3 000,00 zł 4 000,00 zł 5 000,00 zł 6 000,00 zł
Sea tourism
Seaport industry
Hinterland transport
Stevedoring, storage and warehousing
Port administration
Shipyards
Other
R&D
Port authorities
Other activity of maritime transport support
Maritime transport agencies
Maritime transport
Region Thou. zloty
Level I 618 Level II 2 043 Level III 7 187 Level IV 13 263
Cities Thou. zloty
Level I 19 159 Level II 63 312 Level III 222 759 Level IV 411 075

Public incomes Gross profit and Company Income Tax (CIT)
Region Thou. zloty
Level I 970
Level II 2 290
Level III 10 127
Level IV 14 647
Cities Thou. zloty
Level I 562
Level II 1 327
Level III 5 866
Level IV 8 485
0
50
100
150
200
2004 2005 2006 2007 2008 2009 2010
Growth of the gross profit
Seaports
Port direct vicinity
Port indirect vicinity
Port social and economic surroundings

Public income Retail property tax
0,0%
2,0%
4,0%
6,0%
8,0%
10,0%
12,0%
14,0%
16,0%
18,0%
0,00
10,00
20,00
30,00
40,00
50,00
60,00
70,00
2004 2005 2006 2007 2008 2009
Level I - retail tax income (m zloty)
Level II - retail tax income (m zloty)
Level I - the share in the income of cities (%)
Level II - the share in the income of cities (%)

Public income
PIT
(2010)
CIT
(2010)
Retail property
tax
(2009)
Pomorskie Region
(Level IV) 24,7% 6,4% -
Cities of Gdańsk & Gdynia
(Level II) 8,3% 2,1% 16,6%

Multiple effects
0
5
10
15
20
25
Labour GAV GDP Investments Taxes
2,0 1,7 2,0 1,3 1,4
12,2
8,9
12,2
9,4 9,4
24,6
20,6
24,6
14,9 14,1
Seaports Port direct vicinity Port indirect vicinity Port social and economic surroundings

Region in seaports operation and ports in the Regional foreign trade
23,2%
10,5%
0,0%
5,0%
10,0%
15,0%
20,0%
25,0%
30,0%
2004 2005 2006 2007 2008 2009
Share of sea ports of Gdańsk and Gdynia in servicing the commercial exchange of the Region
Share of the region in trade volumes of the sea ports of Gdańsk and Gdynia.

Externalities of the seaports hinterland transport
0,000
10,000
20,000
30,000
40,000
50,000
60,000
70,000
80,000
23,470
46,663
Externalities of the seports hinterland transport
(Marco Polo, mln Euro)
Gdynia
Gdańsk
2,77%
78,16%
19,07%
Road haulage in Region
Road haulage outside the Region
Rail traffic

Thank you Dr Maciej Matczak
Actia Consulting/Actia Forum
www.actiaconsulting.pl


![Kujawsko Pomorskie [1]](https://static.fdocuments.in/doc/165x107/61a335135f9c7e4761222707/kujawsko-pomorskie-1.jpg)