seafood should come · 2019-10-30 · “Future expansion of seafood should come from aquaculture,...
63
Transcript of seafood should come · 2019-10-30 · “Future expansion of seafood should come from aquaculture,...

“Future expansion of seafood should come from aquaculture, which is one of the fastest growing food production sectors in the world.”
EAT-Lancet Commision report, February 2019
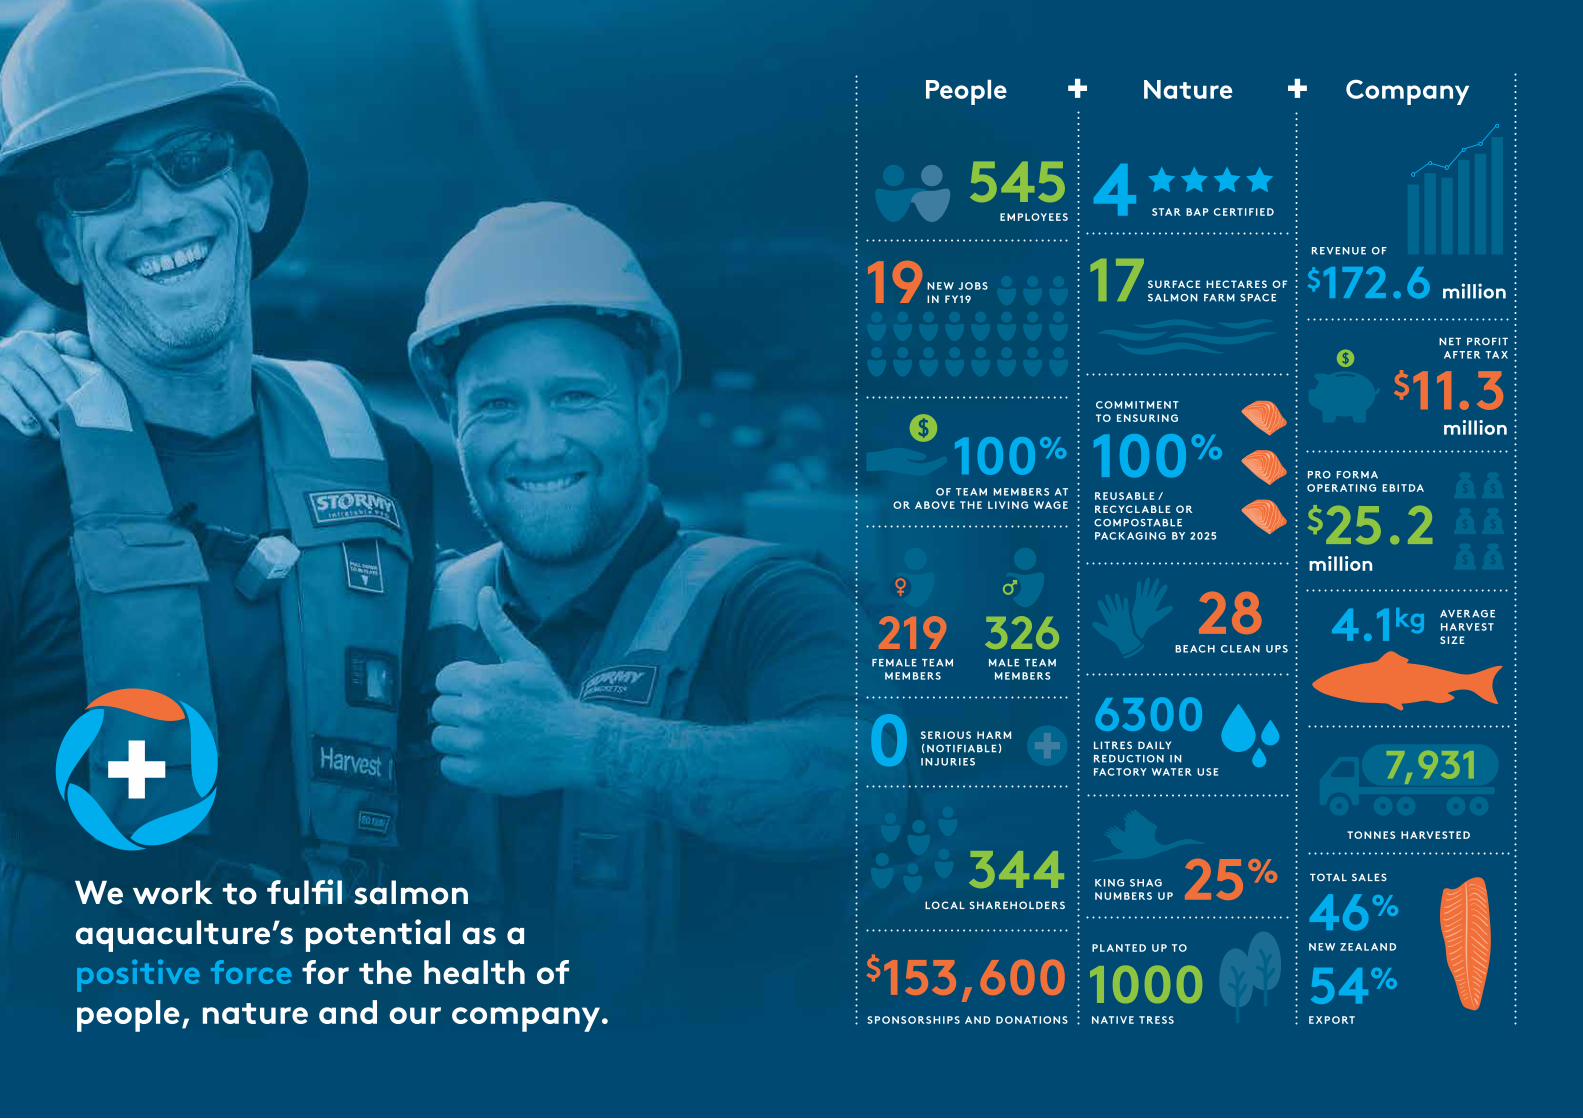
100%
344
326219
0 6300
28
17
1000
NEW JOBS IN F Y1919
$153,600
545
OF TE AM MEMBERS AT OR ABOVE THE LIVING WAGE
LO CAL SHAREHOLDERS
MALE TE AM MEMBERS
FEMALE TE AM MEMBERS
46%
54%
TOTAL SALES
NEW ZE AL AND
EXPORT
People Nature Company
$11.3
$172.6
$25.2
million
million
million
NET PROFIT AF TER TA X
SERIOUS HARM (NOTIFIABLE) INJURIES
LITRES DAILY REDUCTION IN FACTORY WATER USE
NATIVE TRESS
PL ANTED UP TO
BE ACH CLE AN UPS
SURFACE HECTARES OF SALMON FARM SPACE
SPONSORSHIPS AND D ONATIONS
PRO FORMA OPER ATING EBITDA
REVENUE OF
We work to fulfil salmon aquaculture’s potential as a positive force for the health of people, nature and our company.
COMMITMENT TO ENSURING
REUSABLE / RECYCL ABLE OR COMPOSTABLE PACK AGING BY 2025
100%
TONNES HARVESTED
7,931
KING SHAG NUMBERS UP 25%
4 STAR BAP CERTIFIEDEMPLOYEES
4.1kg AVER AGE HARVEST SIZE
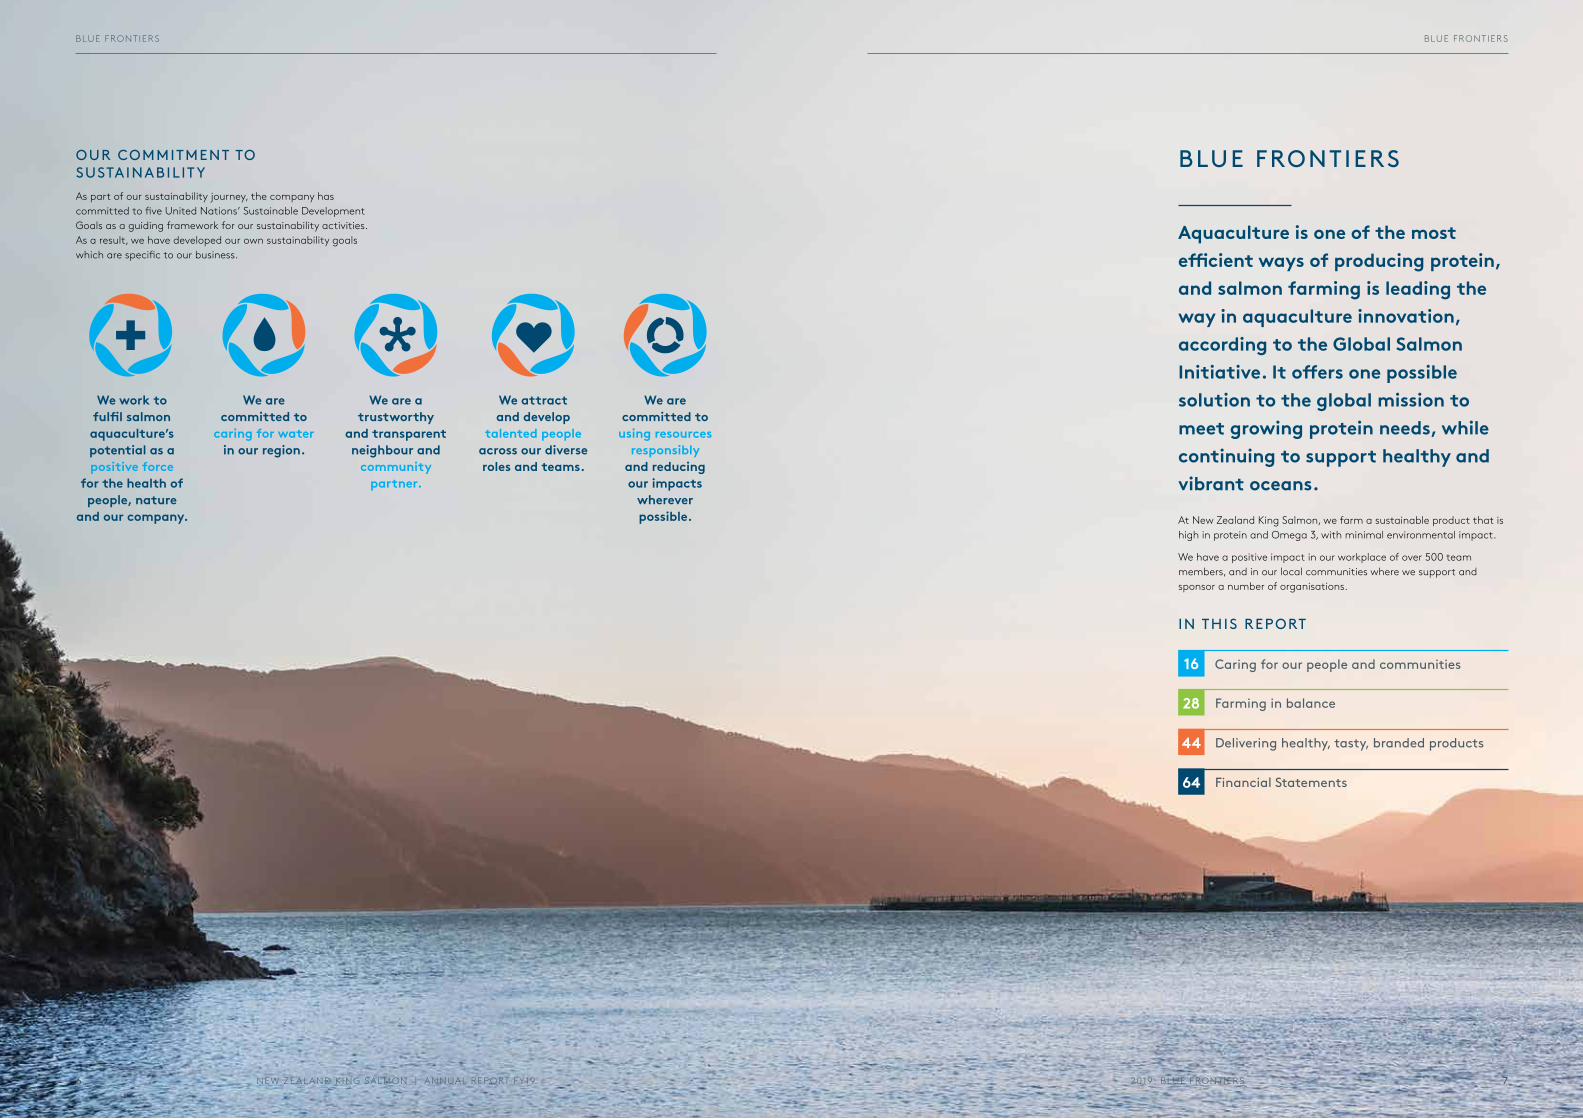
BLUE FRONTIERS
Aquaculture is one of the most efficient ways of producing protein, and salmon farming is leading the way in aquaculture innovation, according to the Global Salmon Initiative. It offers one possible solution to the global mission to meet growing protein needs, while continuing to support healthy and vibrant oceans.
At New Zealand King Salmon, we farm a sustainable product that is high in protein and Omega 3, with minimal environmental impact.
We have a positive impact in our workplace of over 500 team members, and in our local communities where we support and sponsor a number of organisations.
We are a trustworthy
and transparent neighbour and
community partner.
We attract and develop
talented people across our diverse roles and teams.
We are committed to
using resources responsibly
and reducing our impacts
wherever possible.
We work to fulfil salmon aquaculture’s potential as a positive force
for the health of people, nature
and our company.
We are committed to
caring for water in our region.
OUR COMMITMENT TO SUSTAINABILIT YAs part of our sustainability journey, the company has committed to five United Nations’ Sustainable Development Goals as a guiding framework for our sustainability activities. As a result, we have developed our own sustainability goals which are specific to our business.
IN THIS REPORT
Caring for our people and communities
Farming in balance
Delivering healthy, tasty, branded products
Financial Statements
44
64
28
16
2019: BLUE FRONTIERSNEW ZEAL AND KING SALMON | ANNUAL REPORT FY19 76
BLUE FRONTIERS BLUE FRONTIERS
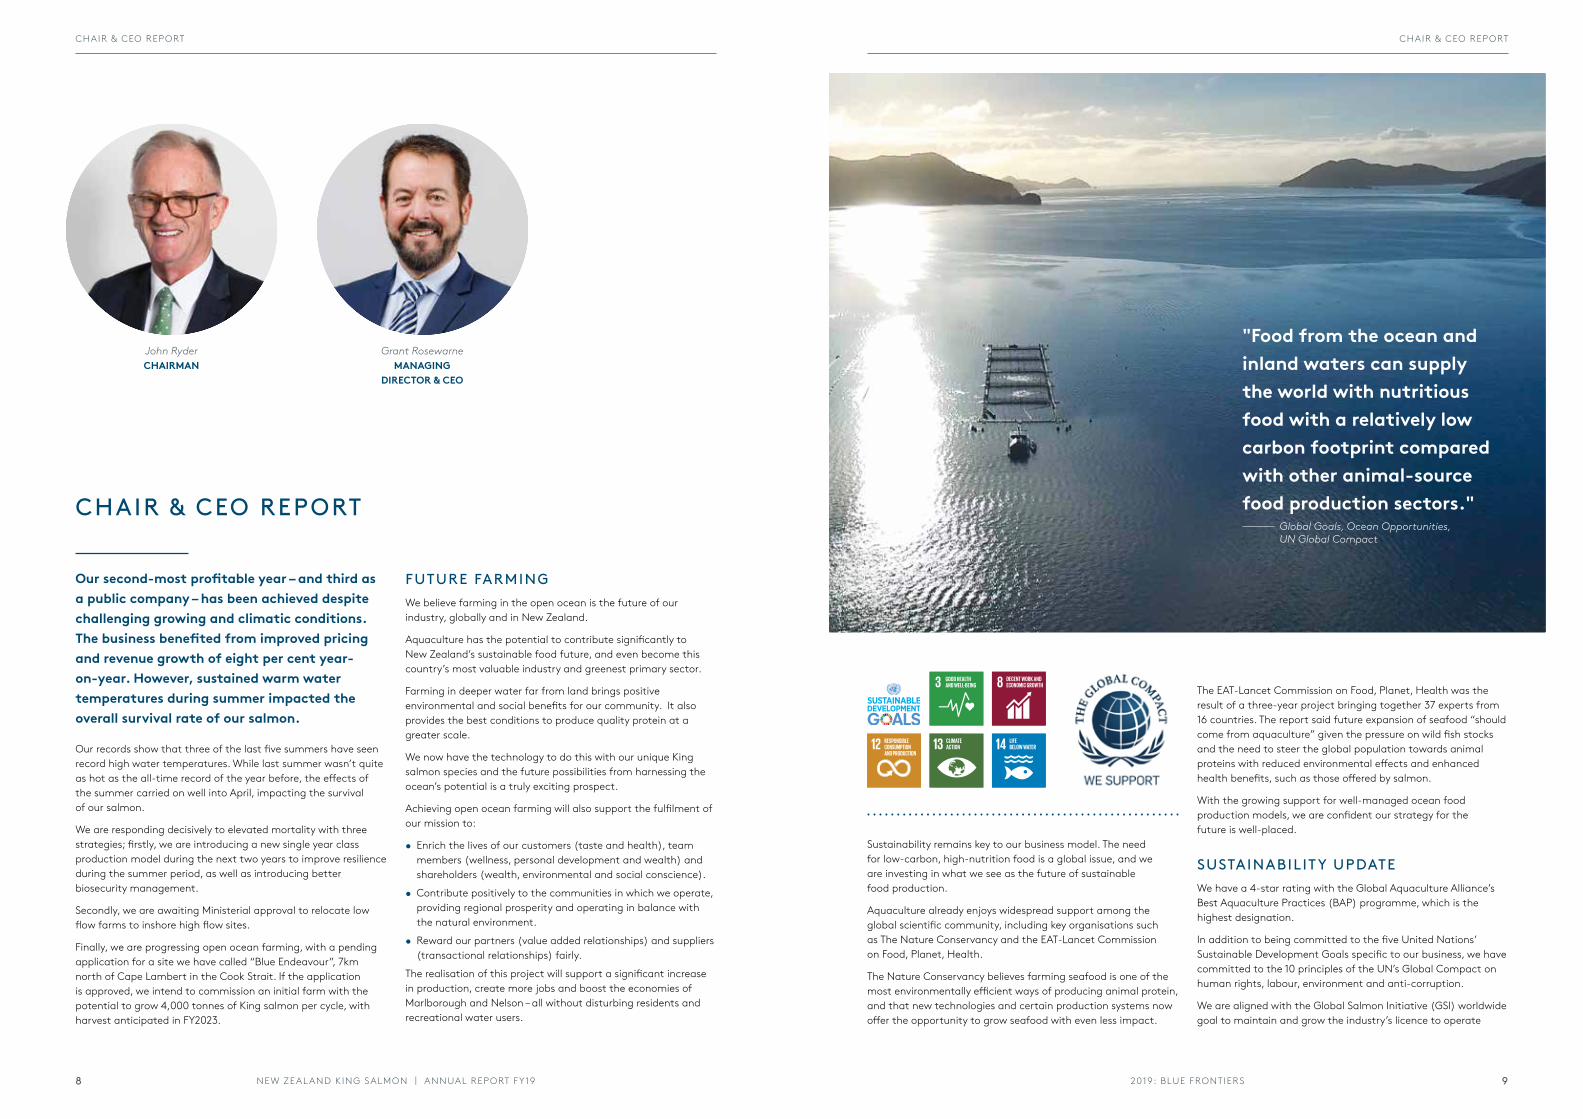
CHAIR & CEO REPORT
John RyderCHAIRMAN
Grant RosewarneMANAGING
DIRECTOR & CEO
Our second-most profitable year – and third as a public company – has been achieved despite challenging growing and climatic conditions. The business benefited from improved pricing and revenue growth of eight per cent year-on-year. However, sustained warm water temperatures during summer impacted the overall survival rate of our salmon.
Our records show that three of the last five summers have seen record high water temperatures. While last summer wasn’t quite as hot as the all-time record of the year before, the effects of the summer carried on well into April, impacting the survival of our salmon.
We are responding decisively to elevated mortality with three strategies; firstly, we are introducing a new single year class production model during the next two years to improve resilience during the summer period, as well as introducing better biosecurity management.
Secondly, we are awaiting Ministerial approval to relocate low flow farms to inshore high flow sites.
Finally, we are progressing open ocean farming, with a pending application for a site we have called “Blue Endeavour”, 7km north of Cape Lambert in the Cook Strait. If the application is approved, we intend to commission an initial farm with the potential to grow 4,000 tonnes of King salmon per cycle, with harvest anticipated in FY2023.
Sustainability remains key to our business model. The need for low-carbon, high-nutrition food is a global issue, and we are investing in what we see as the future of sustainable food production.
Aquaculture already enjoys widespread support among the global scientific community, including key organisations such as The Nature Conservancy and the EAT-Lancet Commission on Food, Planet, Health.
The Nature Conservancy believes farming seafood is one of the most environmentally efficient ways of producing animal protein, and that new technologies and certain production systems now offer the opportunity to grow seafood with even less impact.
The EAT-Lancet Commission on Food, Planet, Health was the result of a three-year project bringing together 37 experts from 16 countries. The report said future expansion of seafood “should come from aquaculture” given the pressure on wild fish stocks and the need to steer the global population towards animal proteins with reduced environmental effects and enhanced health benefits, such as those offered by salmon.
With the growing support for well-managed ocean food production models, we are confident our strategy for the future is well-placed.
SUSTAINABILIT Y UPDATEWe have a 4-star rating with the Global Aquaculture Alliance’s Best Aquaculture Practices (BAP) programme, which is the highest designation.
In addition to being committed to the five United Nations’ Sustainable Development Goals specific to our business, we have committed to the 10 principles of the UN’s Global Compact on human rights, labour, environment and anti-corruption.
We are aligned with the Global Salmon Initiative (GSI) worldwide goal to maintain and grow the industry’s licence to operate
"Food from the ocean and inland waters can supply the world with nutritious food with a relatively low carbon footprint compared with other animal-source food production sectors."
Global Goals, Ocean Opportunities, UN Global Compact
FUTURE FARMINGWe believe farming in the open ocean is the future of our industry, globally and in New Zealand.
Aquaculture has the potential to contribute significantly to New Zealand’s sustainable food future, and even become this country’s most valuable industry and greenest primary sector.
Farming in deeper water far from land brings positive environmental and social benefits for our community. It also provides the best conditions to produce quality protein at a greater scale.
We now have the technology to do this with our unique King salmon species and the future possibilities from harnessing the ocean’s potential is a truly exciting prospect.
Achieving open ocean farming will also support the fulfilment of our mission to:
• Enrich the lives of our customers (taste and health), team members (wellness, personal development and wealth) and shareholders (wealth, environmental and social conscience).
• Contribute positively to the communities in which we operate, providing regional prosperity and operating in balance with the natural environment.
• Reward our partners (value added relationships) and suppliers (transactional relationships) fairly.
The realisation of this project will support a significant increase in production, create more jobs and boost the economies of Marlborough and Nelson – all without disturbing residents and recreational water users.
2019: BLUE FRONTIERSNEW ZEAL AND KING SALMON | ANNUAL REPORT FY19 98
CHAIR & CEO REPORT CHAIR & CEO REPORT
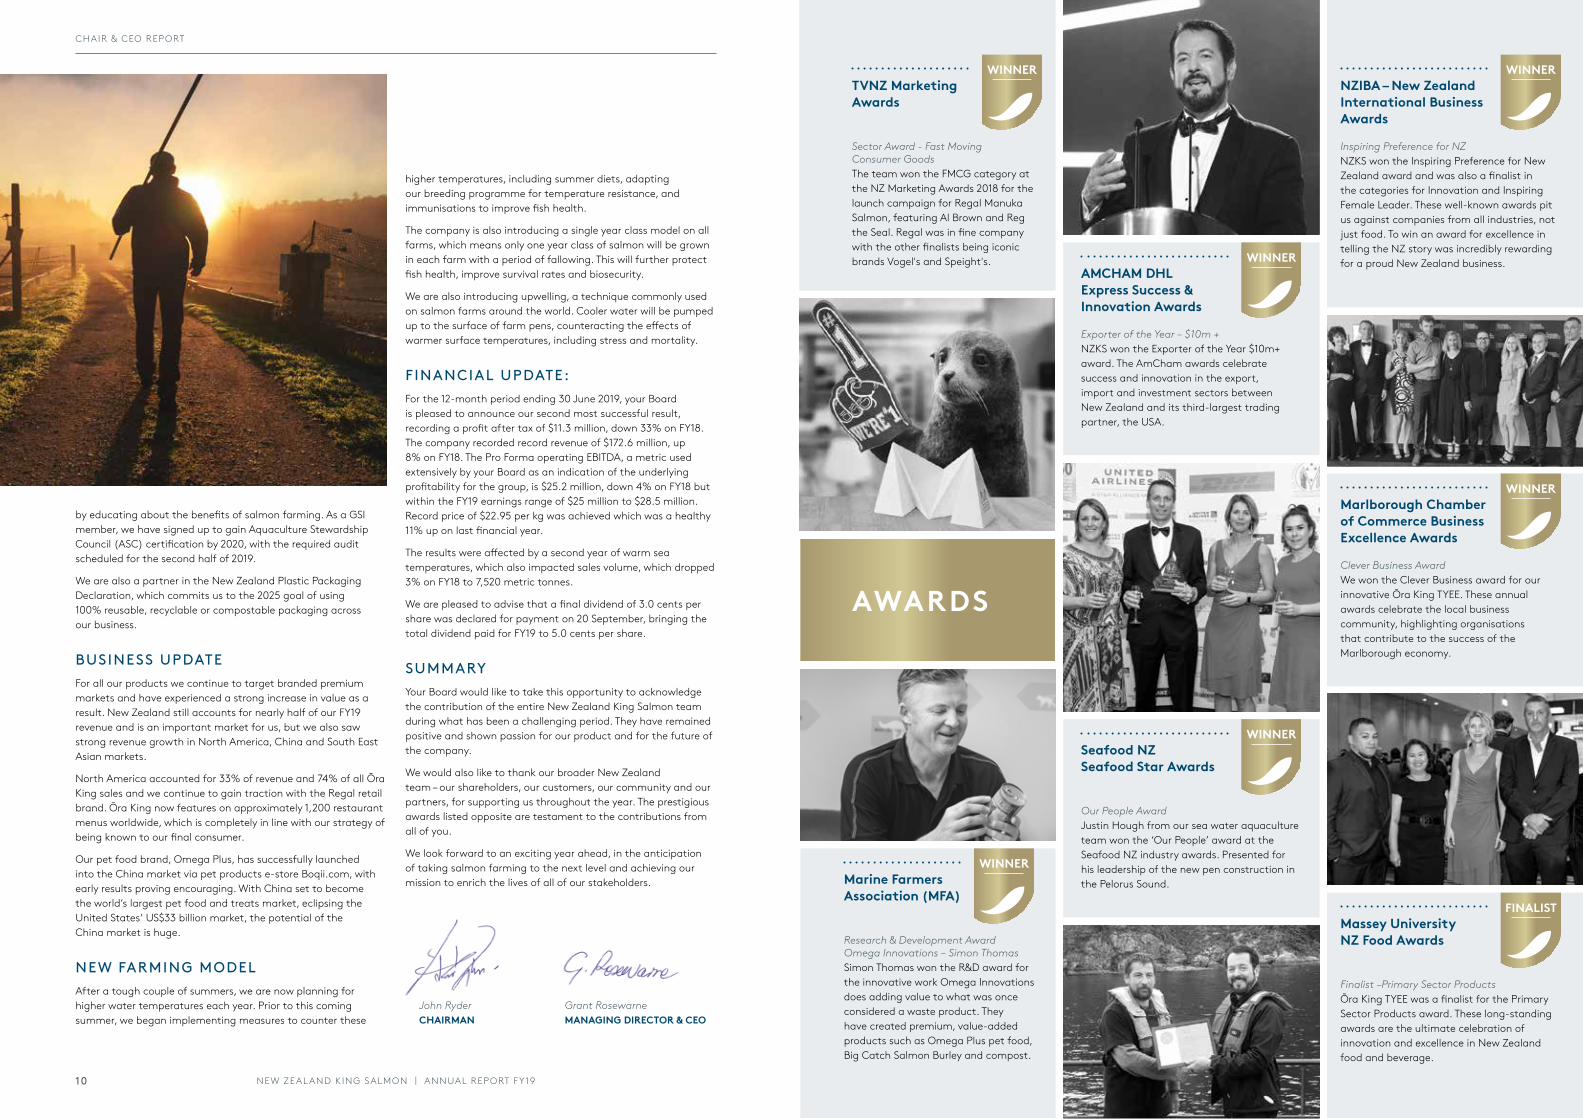
AMCHAM DHL Express Success & Innovation Awards
WINNER
Exporter of the Year – $10m +NZKS won the Exporter of the Year $10m+ award. The AmCham awards celebrate success and innovation in the export, import and investment sectors between New Zealand and its third-largest trading partner, the USA.
TVNZ Marketing Awards
WINNER
Sector Award - Fast Moving Consumer GoodsThe team won the FMCG category at the NZ Marketing Awards 2018 for the launch campaign for Regal Manuka Salmon, featuring Al Brown and Reg the Seal. Regal was in fine company with the other finalists being iconic brands Vogel's and Speight's.
by educating about the benefits of salmon farming. As a GSI member, we have signed up to gain Aquaculture Stewardship Council (ASC) certification by 2020, with the required audit scheduled for the second half of 2019.
We are also a partner in the New Zealand Plastic Packaging Declaration, which commits us to the 2025 goal of using 100% reusable, recyclable or compostable packaging across our business.
BUSINESS UPDATEFor all our products we continue to target branded premium markets and have experienced a strong increase in value as a result. New Zealand still accounts for nearly half of our FY19 revenue and is an important market for us, but we also saw strong revenue growth in North America, China and South East Asian markets.
North America accounted for 33% of revenue and 74% of all Ōra King sales and we continue to gain traction with the Regal retail brand. Ōra King now features on approximately 1,200 restaurant menus worldwide, which is completely in line with our strategy of being known to our final consumer.
Our pet food brand, Omega Plus, has successfully launched into the China market via pet products e-store Boqii.com, with early results proving encouraging. With China set to become the world’s largest pet food and treats market, eclipsing the United States’ US$33 billion market, the potential of the China market is huge.
NEW FARMING MODELAfter a tough couple of summers, we are now planning for higher water temperatures each year. Prior to this coming summer, we began implementing measures to counter these
higher temperatures, including summer diets, adapting our breeding programme for temperature resistance, and immunisations to improve fish health.
The company is also introducing a single year class model on all farms, which means only one year class of salmon will be grown in each farm with a period of fallowing. This will further protect fish health, improve survival rates and biosecurity.
We are also introducing upwelling, a technique commonly used on salmon farms around the world. Cooler water will be pumped up to the surface of farm pens, counteracting the effects of warmer surface temperatures, including stress and mortality.
FINANCIAL UPDATE: For the 12-month period ending 30 June 2019, your Board is pleased to announce our second most successful result, recording a profit after tax of $11.3 million, down 33% on FY18. The company recorded record revenue of $172.6 million, up 8% on FY18. The Pro Forma operating EBITDA, a metric used extensively by your Board as an indication of the underlying profitability for the group, is $25.2 million, down 4% on FY18 but within the FY19 earnings range of $25 million to $28.5 million. Record price of $22.95 per kg was achieved which was a healthy 11% up on last financial year.
The results were affected by a second year of warm sea temperatures, which also impacted sales volume, which dropped 3% on FY18 to 7,520 metric tonnes.
We are pleased to advise that a final dividend of 3.0 cents per share was declared for payment on 20 September, bringing the total dividend paid for FY19 to 5.0 cents per share.
SUMMARYYour Board would like to take this opportunity to acknowledge the contribution of the entire New Zealand King Salmon team during what has been a challenging period. They have remained positive and shown passion for our product and for the future of the company.
We would also like to thank our broader New Zealand team – our shareholders, our customers, our community and our partners, for supporting us throughout the year. The prestigious awards listed opposite are testament to the contributions from all of you.
We look forward to an exciting year ahead, in the anticipation of taking salmon farming to the next level and achieving our mission to enrich the lives of all of our stakeholders.
John RyderCHAIRMAN
Grant RosewarneMANAGING DIRECTOR & CEO
Marine Farmers Association (MFA)
WINNER
Research & Development Award Omega Innovations – Simon ThomasSimon Thomas won the R&D award for the innovative work Omega Innovations does adding value to what was once considered a waste product. They have created premium, value-added products such as Omega Plus pet food, Big Catch Salmon Burley and compost.
Seafood NZ Seafood Star Awards
WINNER
Our People AwardJustin Hough from our sea water aquaculture team won the ‘Our People’ award at the Seafood NZ industry awards. Presented for his leadership of the new pen construction in the Pelorus Sound.
NZIBA – New Zealand International Business Awards
WINNER
Inspiring Preference for NZNZKS won the Inspiring Preference for New Zealand award and was also a finalist in the categories for Innovation and Inspiring Female Leader. These well-known awards pit us against companies from all industries, not just food. To win an award for excellence in telling the NZ story was incredibly rewarding for a proud New Zealand business.
Massey University NZ Food Awards
FINALIST
Finalist –Primary Sector ProductsŌra King TYEE was a finalist for the Primary Sector Products award. These long-standing awards are the ultimate celebration of innovation and excellence in New Zealand food and beverage.
Marlborough Chamber of Commerce Business Excellence Awards
WINNER
Clever Business AwardWe won the Clever Business award for our innovative Ōra King TYEE. These annual awards celebrate the local business community, highlighting organisations that contribute to the success of the Marlborough economy.
AWARDS
NEW ZEAL AND KING SALMON | ANNUAL REPORT FY1910
CHAIR & CEO REPORT
PERFORMANCE HIGHLIGHTS
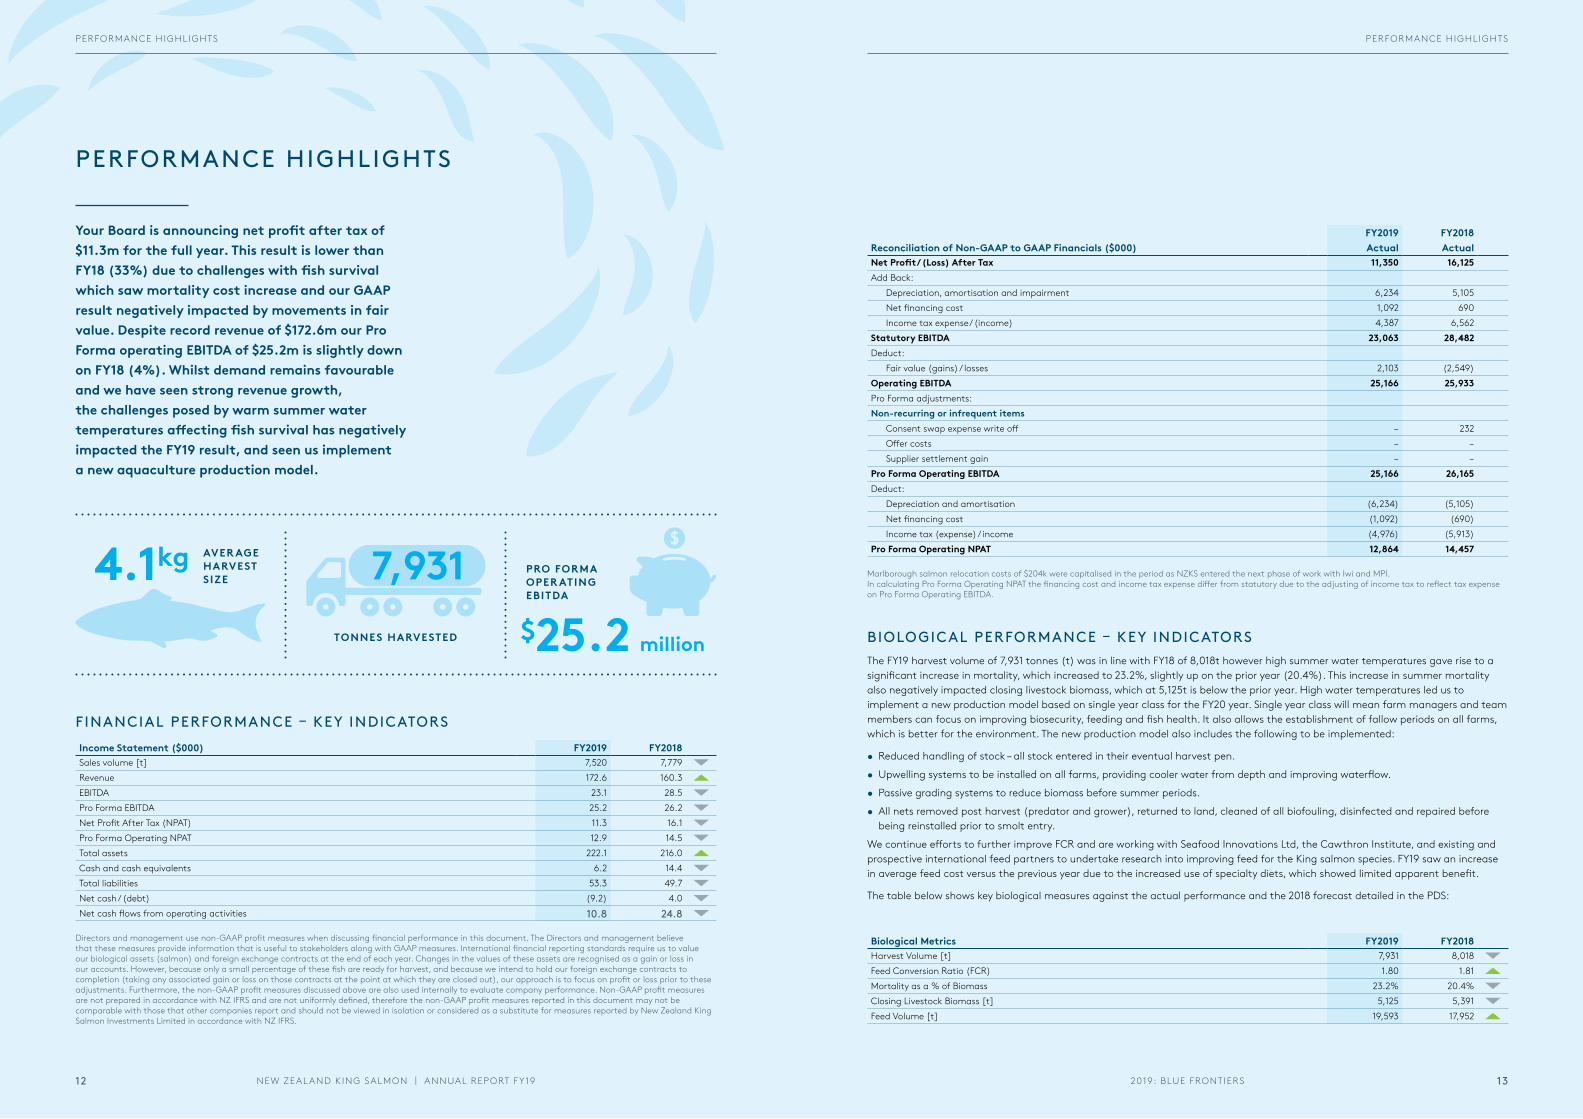
BIOLOGICAL PERFORMANCE – KEY INDICATORSThe FY19 harvest volume of 7,931 tonnes (t) was in line with FY18 of 8,018t however high summer water temperatures gave rise to a significant increase in mortality, which increased to 23.2%, slightly up on the prior year (20.4%). This increase in summer mortality also negatively impacted closing livestock biomass, which at 5,125t is below the prior year. High water temperatures led us to implement a new production model based on single year class for the FY20 year. Single year class will mean farm managers and team members can focus on improving biosecurity, feeding and fish health. It also allows the establishment of fallow periods on all farms, which is better for the environment. The new production model also includes the following to be implemented:
• Reduced handling of stock – all stock entered in their eventual harvest pen.
• Upwelling systems to be installed on all farms, providing cooler water from depth and improving waterflow.
• Passive grading systems to reduce biomass before summer periods.
• All nets removed post harvest (predator and grower), returned to land, cleaned of all biofouling, disinfected and repaired before being reinstalled prior to smolt entry.
We continue efforts to further improve FCR and are working with Seafood Innovations Ltd, the Cawthron Institute, and existing and prospective international feed partners to undertake research into improving feed for the King salmon species. FY19 saw an increase in average feed cost versus the previous year due to the increased use of specialty diets, which showed limited apparent benefit.
The table below shows key biological measures against the actual performance and the 2018 forecast detailed in the PDS:
Income Statement ($000) FY2019 FY2018Sales volume [t] 7,520 7,779Revenue 172.6 160.3 EBITDA 23.1 28.5 Pro Forma EBITDA 25.2 26.2 Net Profit After Tax (NPAT) 11.3 16.1 Pro Forma Operating NPAT 12.9 14.5 Total assets 222.1 216.0 Cash and cash equivalents 6.2 14.4 Total liabilities 53.3 49.7 Net cash / (debt) (9.2) 4.0 Net cash flows from operating activities 10.8 24.8
Biological Metrics FY2019 FY2018Harvest Volume [t] 7,931 8,018Feed Conversion Ratio (FCR) 1.80 1.81Mortality as a % of Biomass 23.2% 20.4%Closing Livestock Biomass [t] 5,125 5,391Feed Volume [t] 19,593 17,952
Your Board is announcing net profit after tax of $11.3m for the full year. This result is lower than FY18 (33%) due to challenges with fish survival which saw mortality cost increase and our GAAP result negatively impacted by movements in fair value. Despite record revenue of $172.6m our Pro Forma operating EBITDA of $25.2m is slightly down on FY18 (4%). Whilst demand remains favourable and we have seen strong revenue growth, the challenges posed by warm summer water temperatures affecting fish survival has negatively impacted the FY19 result, and seen us implement a new aquaculture production model.
Directors and management use non-GAAP profit measures when discussing financial performance in this document. The Directors and management believe that these measures provide information that is useful to stakeholders along with GAAP measures. International financial reporting standards require us to value our biological assets (salmon) and foreign exchange contracts at the end of each year. Changes in the values of these assets are recognised as a gain or loss in our accounts. However, because only a small percentage of these fish are ready for harvest, and because we intend to hold our foreign exchange contracts to completion (taking any associated gain or loss on those contracts at the point at which they are closed out), our approach is to focus on profit or loss prior to these adjustments. Furthermore, the non-GAAP profit measures discussed above are also used internally to evaluate company performance. Non-GAAP profit measures are not prepared in accordance with NZ IFRS and are not uniformly defined, therefore the non-GAAP profit measures reported in this document may not be comparable with those that other companies report and should not be viewed in isolation or considered as a substitute for measures reported by New Zealand King Salmon Investments Limited in accordance with NZ IFRS.
Marlborough salmon relocation costs of $204k were capitalised in the period as NZKS entered the next phase of work with Iwi and MPI. In calculating Pro Forma Operating NPAT the financing cost and income tax expense differ from statutory due to the adjusting of income tax to reflect tax expense on Pro Forma Operating EBITDA.
FY2019 FY2018Reconciliation of Non-GAAP to GAAP Financials ($000) Actual ActualNet Profit/ (Loss) After Tax 11,350 16,125 Add Back:
Depreciation, amortisation and impairment 6,234 5,105Net financing cost 1,092 690Income tax expense/ (income) 4,387 6,562
Statutory EBITDA 23,063 28,482 Deduct:
Fair value (gains) / losses 2,103 (2,549)Operating EBITDA 25,166 25,933Pro Forma adjustments:Non-recurring or infrequent items
Consent swap expense write off − 232 Offer costs − − Supplier settlement gain − −
Pro Forma Operating EBITDA 25,166 26,165Deduct:
Depreciation and amortisation (6,234) (5,105)Net financing cost (1,092) (690)Income tax (expense) / income (4,976) (5,913)
Pro Forma Operating NPAT 12,864 14,457
FINANCIAL PERFORMANCE – KEY INDICATORS
TONNES HARVESTED
7,9314.1kg AVER AGE HARVEST SIZE
$25.2 million
PRO FORMA OPER ATING EBITDA
2019: BLUE FRONTIERSNEW ZEAL AND KING SALMON | ANNUAL REPORT FY19 1312
PERFORMANCE HIGHLIGHTS PERFORMANCE HIGHLIGHTS
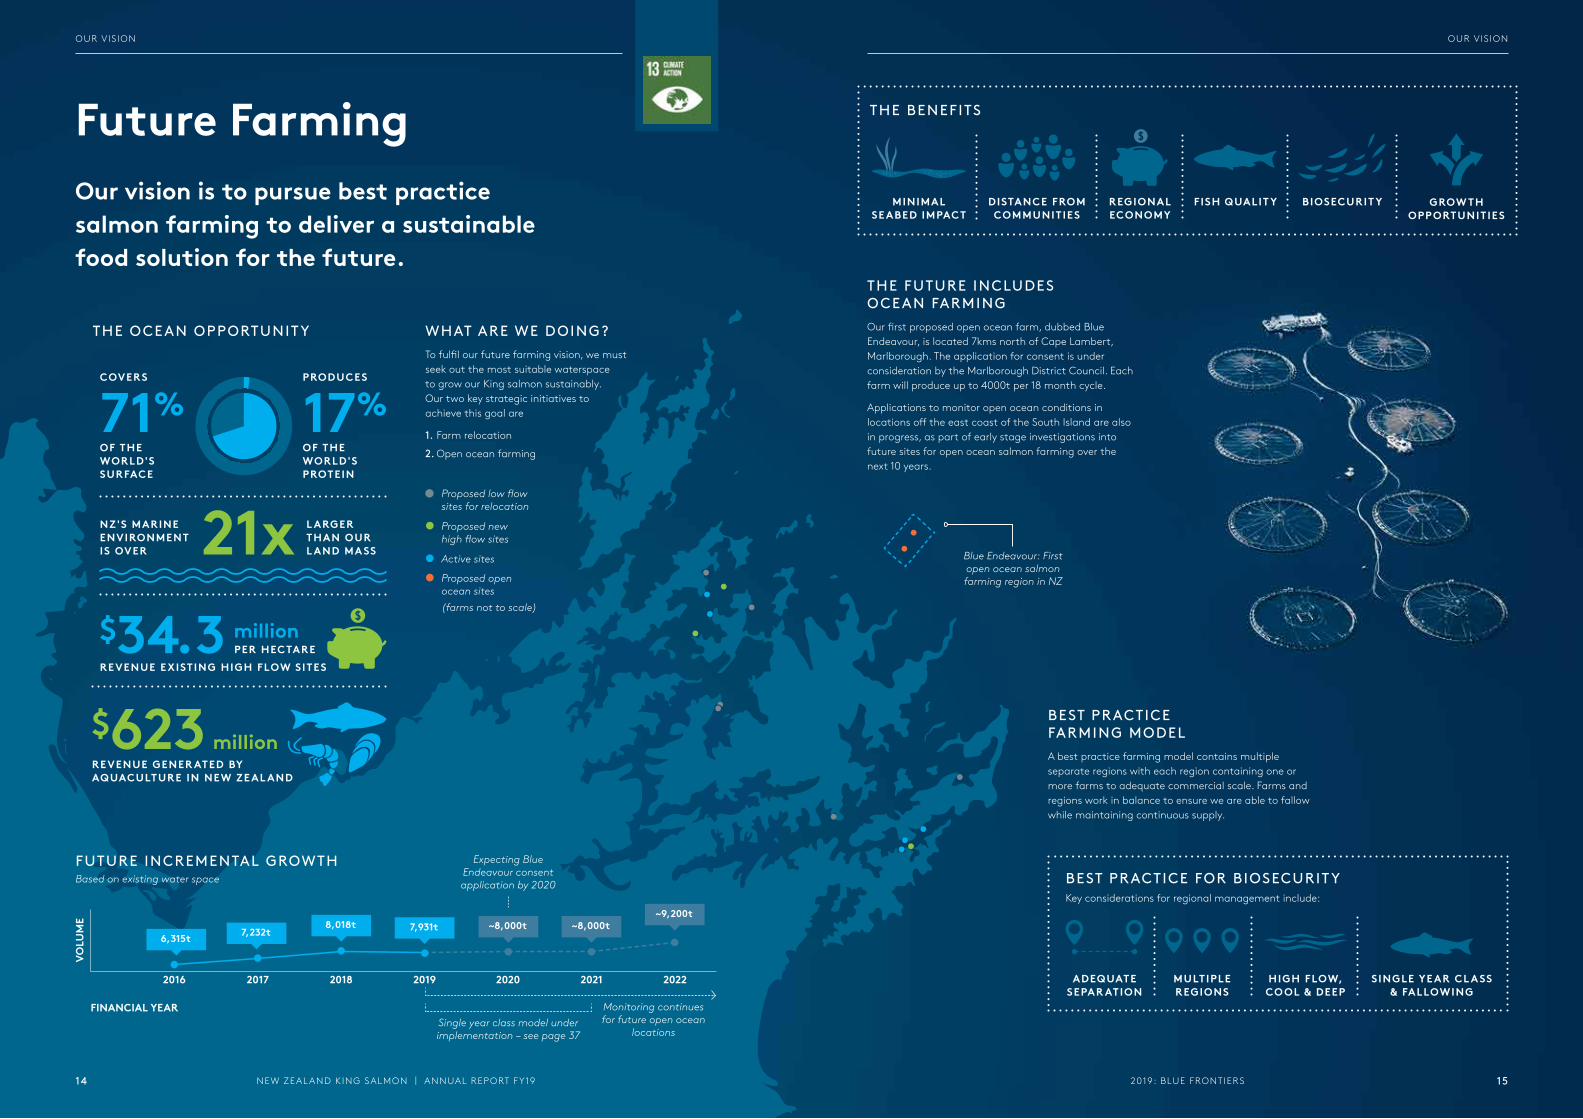
BEST PRACTICE FARMING MODELA best practice farming model contains multiple separate regions with each region containing one or more farms to adequate commercial scale. Farms and regions work in balance to ensure we are able to fallow while maintaining continuous supply.
million$34.3
NZ'S MARINE ENVIRONMENT IS OVER
OF THE WORLD'S SURFACE
OF THE WORLD'S PROTEIN
L ARGER THAN OUR L AND MA SS21x
71% 17%
Our vision is to pursue best practice salmon farming to deliver a sustainable food solution for the future.
Future Farming
WHAT ARE WE DOING?To fulfil our future farming vision, we must seek out the most suitable waterspace to grow our King salmon sustainably. Our two key strategic initiatives to achieve this goal are
1. Farm relocation
2. Open ocean farming
COVERS
$623 millionREVENUE GENER ATED BY AQUACULTURE IN NEW ZE AL AND
REVENUE EXISTING HIGH FLOW SITES
Monitoring continues for future open ocean
locationsSingle year class model under implementation – see page 37
Expecting Blue Endeavour consent application by 2020
VOLU
ME
2016 2017 2018 2019 2020 2021 2022
8,018t ~8,000t~8,000t7,931t~9,200t
7,232t6,315t
FUTURE INCREMENTAL GROWTHBased on existing water space
FINANCIAL YEAR
PER HECTARE
PRODUCES
Proposed low flow sites for relocation
Proposed new high flow sites
Active sites
Proposed open ocean sites(farms not to scale)
BEST PRACTICE FOR BIOSECURIT YKey considerations for regional management include:
ADEQUATE SEPAR ATION
HIGH FLOW, CO OL & DEEP
SINGLE YE AR CL A SS & FALLOWING
MULTIPLE REGIONS
THE FUTURE INCLUDES OCEAN FARMINGOur first proposed open ocean farm, dubbed Blue Endeavour, is located 7kms north of Cape Lambert, Marlborough. The application for consent is under consideration by the Marlborough District Council. Each farm will produce up to 4000t per 18 month cycle.
Applications to monitor open ocean conditions in locations off the east coast of the South Island are also in progress, as part of early stage investigations into future sites for open ocean salmon farming over the next 10 years.
Blue Endeavour: First open ocean salmon farming region in NZ
THE OCEAN OPPORTUNIT Y
THE BENEFITS
MINIMAL SE ABED IMPACT
DISTANCE FROM COMMUNITIES
REGIONAL ECONOMY
FISH QUALIT Y BIOSECURIT Y GROW TH OPPORTUNITIES
2019: BLUE FRONTIERS 15NEW ZEAL AND KING SALMON | ANNUAL REPORT FY1914
OUR VIS ION OUR VIS ION
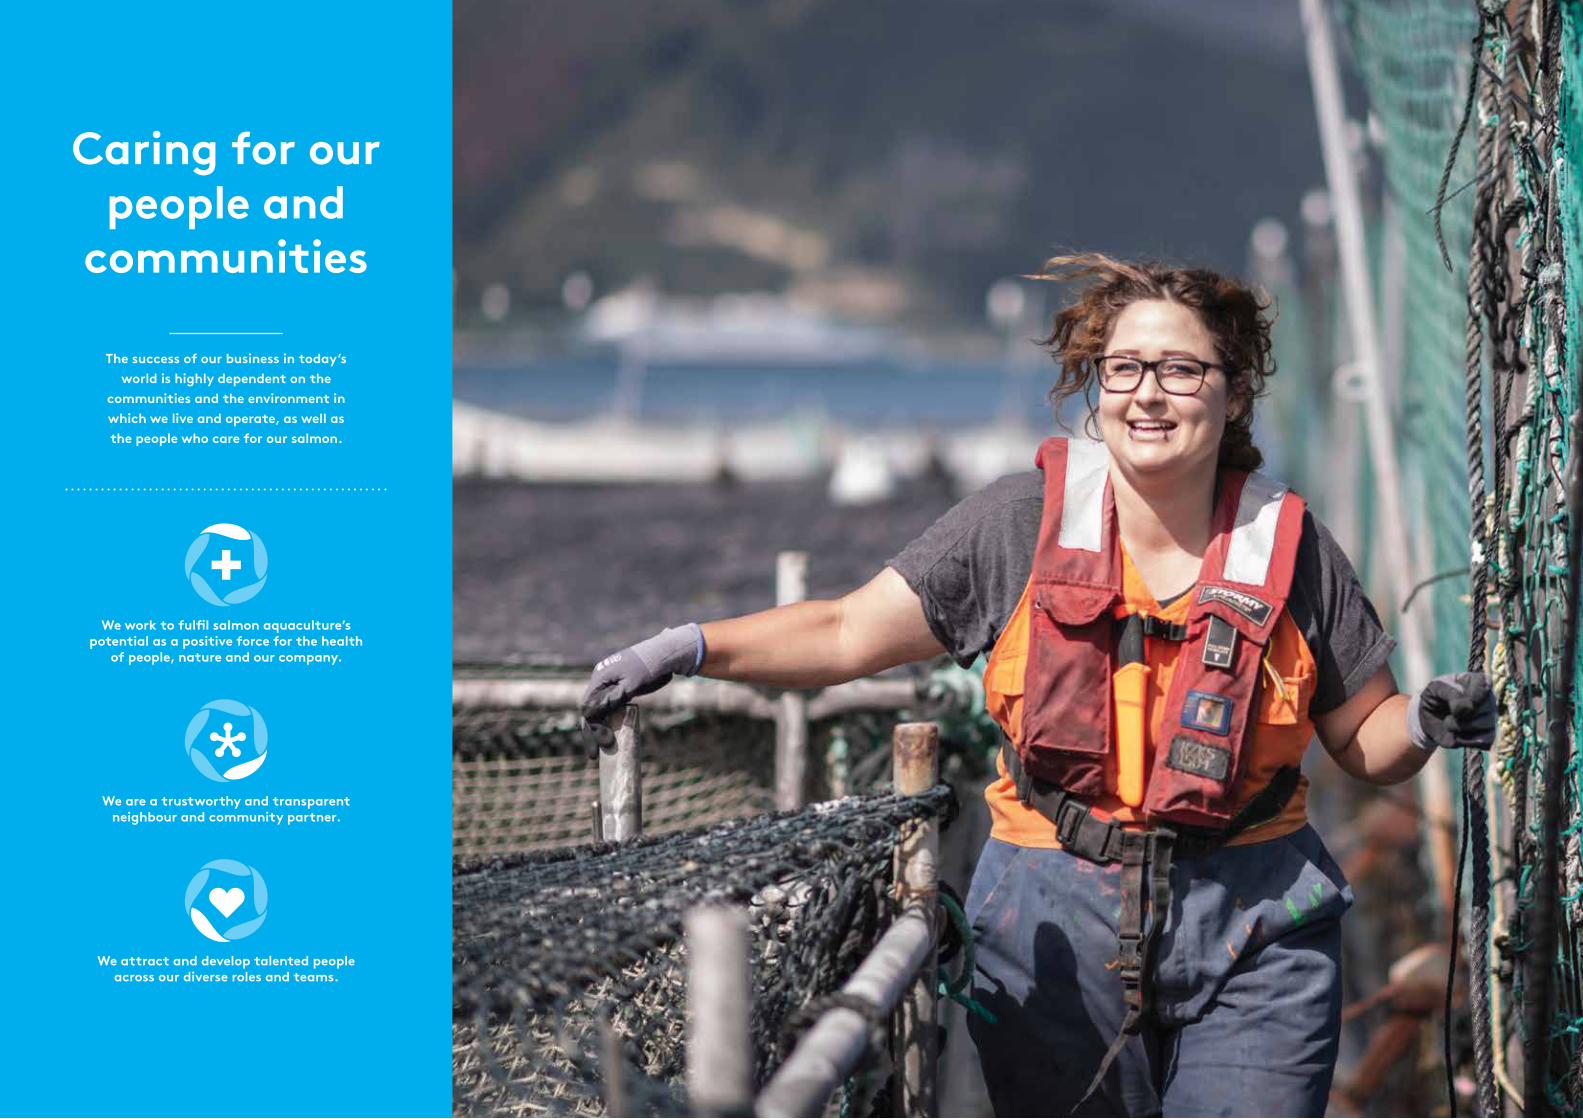
We attract and develop talented people across our diverse roles and teams.
The success of our business in today’s world is highly dependent on the
communities and the environment in which we live and operate, as well as the people who care for our salmon.
Caring for our people and
communities
We work to fulfil salmon aquaculture’s potential as a positive force for the health
of people, nature and our company.
We are a trustworthy and transparent neighbour and community partner.
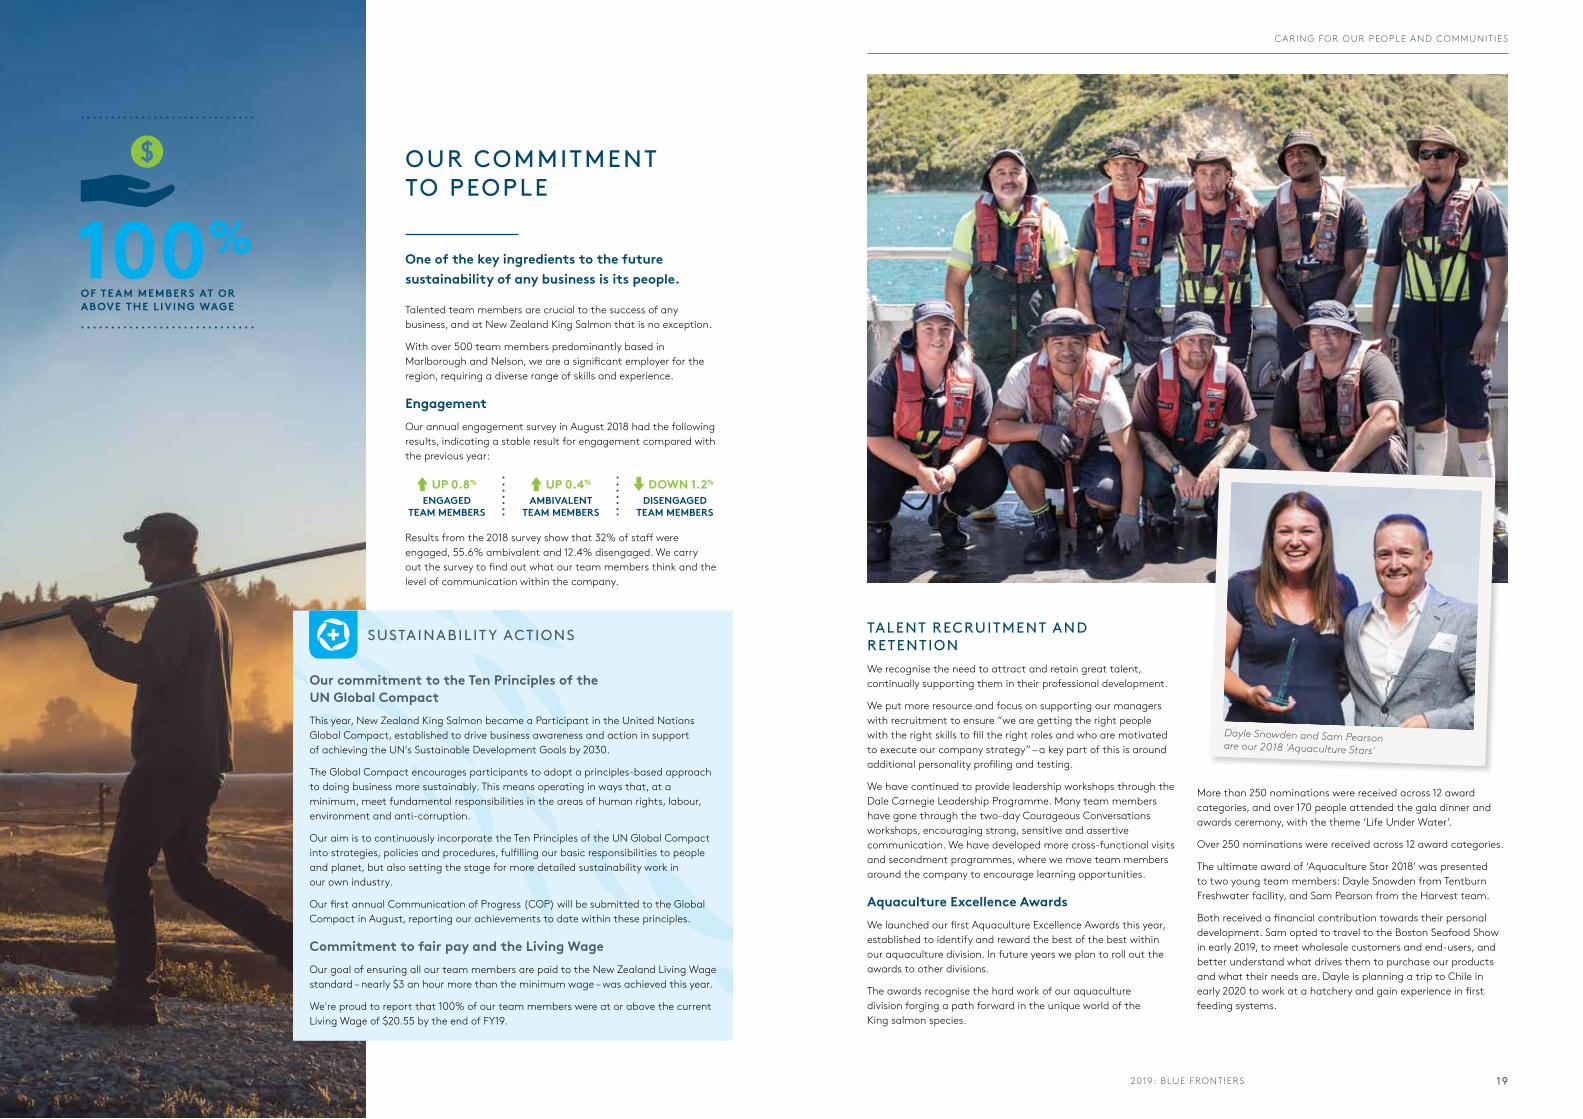
One of the key ingredients to the future sustainability of any business is its people.
Talented team members are crucial to the success of any business, and at New Zealand King Salmon that is no exception.
With over 500 team members predominantly based in Marlborough and Nelson, we are a significant employer for the region, requiring a diverse range of skills and experience.
EngagementOur annual engagement survey in August 2018 had the following results, indicating a stable result for engagement compared with the previous year:
OUR COMMITMENT TO PEOPLE
ENGAGED TEAM MEMBERS
AMBIVALENT TEAM MEMBERS
DISENGAGED TEAM MEMBERS
100%OF TE AM MEMBERS AT OR ABOVE THE LIVING WAGE
UP 0.8% UP 0.4% DOWN 1.2%
TALENT RECRUITMENT AND RETENTIONWe recognise the need to attract and retain great talent, continually supporting them in their professional development.
We put more resource and focus on supporting our managers with recruitment to ensure “we are getting the right people with the right skills to fill the right roles and who are motivated to execute our company strategy” – a key part of this is around additional personality profiling and testing.
We have continued to provide leadership workshops through the Dale Carnegie Leadership Programme. Many team members have gone through the two-day Courageous Conversations workshops, encouraging strong, sensitive and assertive communication. We have developed more cross-functional visits and secondment programmes, where we move team members around the company to encourage learning opportunities.
Aquaculture Excellence AwardsWe launched our first Aquaculture Excellence Awards this year, established to identify and reward the best of the best within our aquaculture division. In future years we plan to roll out the awards to other divisions.
The awards recognise the hard work of our aquaculture division forging a path forward in the unique world of the King salmon species.
More than 250 nominations were received across 12 award categories, and over 170 people attended the gala dinner and awards ceremony, with the theme ‘Life Under Water’.
Over 250 nominations were received across 12 award categories.
The ultimate award of ‘Aquaculture Star 2018’ was presented to two young team members: Dayle Snowden from Tentburn Freshwater facility, and Sam Pearson from the Harvest team.
Both received a financial contribution towards their personal development. Sam opted to travel to the Boston Seafood Show in early 2019, to meet wholesale customers and end-users, and better understand what drives them to purchase our products and what their needs are. Dayle is planning a trip to Chile in early 2020 to work at a hatchery and gain experience in first feeding systems.
Dayle Snowden and Sam Pearson are our 2018 'Aquaculture Stars'
Results from the 2018 survey show that 32% of staff were engaged, 55.6% ambivalent and 12.4% disengaged. We carry out the survey to find out what our team members think and the level of communication within the company.
Our commitment to the Ten Principles of the UN Global CompactThis year, New Zealand King Salmon became a Participant in the United Nations Global Compact, established to drive business awareness and action in support of achieving the UN's Sustainable Development Goals by 2030.
The Global Compact encourages participants to adopt a principles-based approach to doing business more sustainably. This means operating in ways that, at a minimum, meet fundamental responsibilities in the areas of human rights, labour, environment and anti-corruption.
Our aim is to continuously incorporate the Ten Principles of the UN Global Compact into strategies, policies and procedures, fulfilling our basic responsibilities to people and planet, but also setting the stage for more detailed sustainability work in our own industry.
Our first annual Communication of Progress (COP) will be submitted to the Global Compact in August, reporting our achievements to date within these principles.
Commitment to fair pay and the Living WageOur goal of ensuring all our team members are paid to the New Zealand Living Wage standard – nearly $3 an hour more than the minimum wage – was achieved this year.
We're proud to report that 100% of our team members were at or above the current Living Wage of $20.55 by the end of FY19.
SUSTAINABILIT Y ACTIONS
2019: BLUE FRONTIERS 19
CARING FOR OUR PEOPLE AND COMMUNITIES
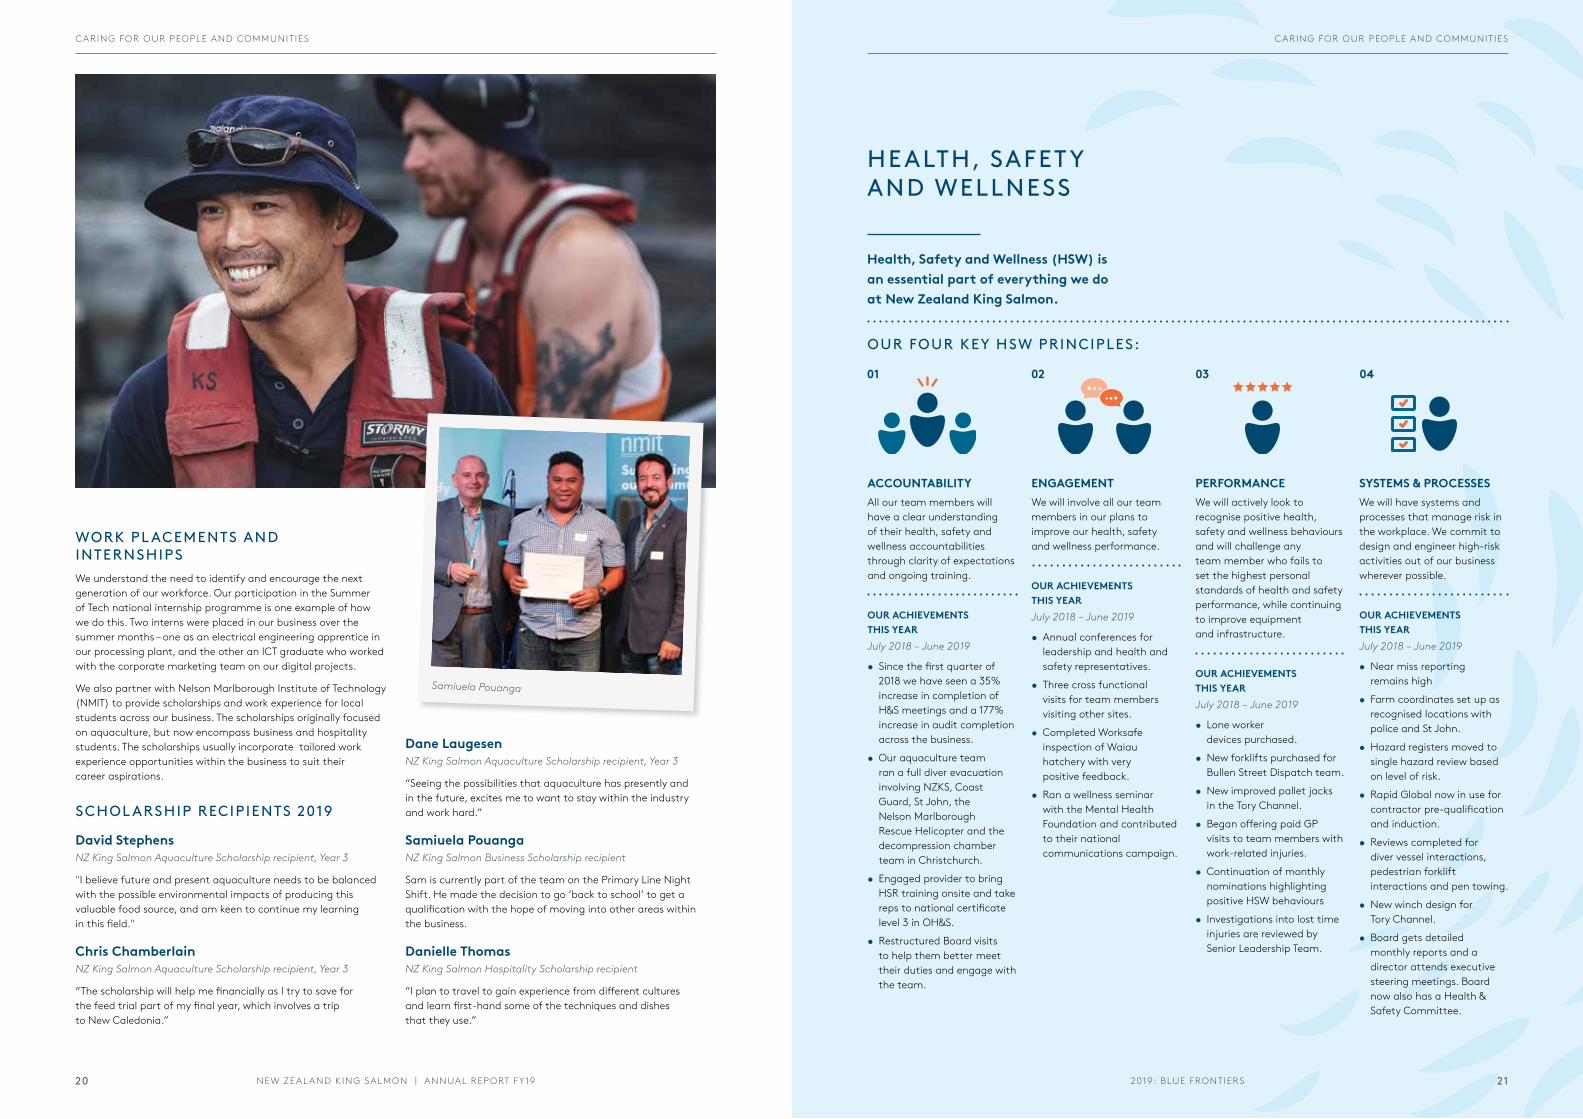
WORK PL ACEMENTS AND INTERNSHIPSWe understand the need to identify and encourage the next generation of our workforce. Our participation in the Summer of Tech national internship programme is one example of how we do this. Two interns were placed in our business over the summer months – one as an electrical engineering apprentice in our processing plant, and the other an ICT graduate who worked with the corporate marketing team on our digital projects.
We also partner with Nelson Marlborough Institute of Technology (NMIT) to provide scholarships and work experience for local students across our business. The scholarships originally focused on aquaculture, but now encompass business and hospitality students. The scholarships usually incorporate tailored work experience opportunities within the business to suit their career aspirations.
SCHOL ARSHIP RECIPIENTS 2019
David StephensNZ King Salmon Aquaculture Scholarship recipient, Year 3
"I believe future and present aquaculture needs to be balanced with the possible environmental impacts of producing this valuable food source, and am keen to continue my learning in this field."
Chris ChamberlainNZ King Salmon Aquaculture Scholarship recipient, Year 3
“The scholarship will help me financially as I try to save for the feed trial part of my final year, which involves a trip to New Caledonia.”
Dane LaugesenNZ King Salmon Aquaculture Scholarship recipient, Year 3
“Seeing the possibilities that aquaculture has presently and in the future, excites me to want to stay within the industry and work hard.”
Samiuela PouangaNZ King Salmon Business Scholarship recipient
Sam is currently part of the team on the Primary Line Night Shift. He made the decision to go ‘back to school’ to get a qualification with the hope of moving into other areas within the business.
Danielle ThomasNZ King Salmon Hospitality Scholarship recipient
“I plan to travel to gain experience from different cultures and learn first-hand some of the techniques and dishes that they use.”
Samiuela Pouanga
HEALTH, SAFET Y AND WELLNESS
Health, Safety and Wellness (HSW) is an essential part of everything we do at New Zealand King Salmon.
OUR ACHIEVEMENTS THIS YEARJuly 2018 – June 2019
OUR ACHIEVEMENTS THIS YEARJuly 2018 – June 2019
OUR FOUR KEY HSW PRINCIPLES:
ENGAGEMENT We will involve all our team members in our plans to improve our health, safety and wellness performance.
PERFORMANCEWe will actively look to recognise positive health, safety and wellness behaviours and will challenge any team member who fails to set the highest personal standards of health and safety performance, while continuing to improve equipment and infrastructure.
• Near miss reporting remains high
• Farm coordinates set up as recognised locations with police and St John.
• Hazard registers moved to single hazard review based on level of risk.
• Rapid Global now in use for contractor pre-qualification and induction.
• Reviews completed for diver vessel interactions, pedestrian forklift interactions and pen towing.
• New winch design for Tory Channel.
• Board gets detailed monthly reports and a director attends executive steering meetings. Board now also has a Health & Safety Committee.
ACCOUNTABILITYAll our team members will have a clear understanding of their health, safety and wellness accountabilities through clarity of expectations and ongoing training.
• Annual conferences for leadership and health and safety representatives.
• Three cross functional visits for team members visiting other sites.
• Completed Worksafe inspection of Waiau hatchery with very positive feedback.
• Ran a wellness seminar with the Mental Health Foundation and contributed to their national communications campaign.
• Lone worker devices purchased.
• New forklifts purchased for Bullen Street Dispatch team.
• New improved pallet jacks in the Tory Channel.
• Began offering paid GP visits to team members with work-related injuries.
• Continuation of monthly nominations highlighting positive HSW behaviours
• Investigations into lost time injuries are reviewed by Senior Leadership Team.
SYSTEMS & PROCESSES We will have systems and processes that manage risk in the workplace. We commit to design and engineer high-risk activities out of our business wherever possible.
01 02 03 04
OUR ACHIEVEMENTS THIS YEARJuly 2018 – June 2019
OUR ACHIEVEMENTS THIS YEARJuly 2018 – June 2019
• Since the first quarter of 2018 we have seen a 35% increase in completion of H&S meetings and a 177% increase in audit completion across the business.
• Our aquaculture team ran a full diver evacuation involving NZKS, Coast Guard, St John, the Nelson Marlborough Rescue Helicopter and the decompression chamber team in Christchurch.
• Engaged provider to bring HSR training onsite and take reps to national certificate level 3 in OH&S.
• Restructured Board visits to help them better meet their duties and engage with the team.
2019: BLUE FRONTIERSNEW ZEAL AND KING SALMON | ANNUAL REPORT FY19 2120
CARING FOR OUR PEOPLE AND COMMUNITIESCARING FOR OUR PEOPLE AND COMMUNITIES
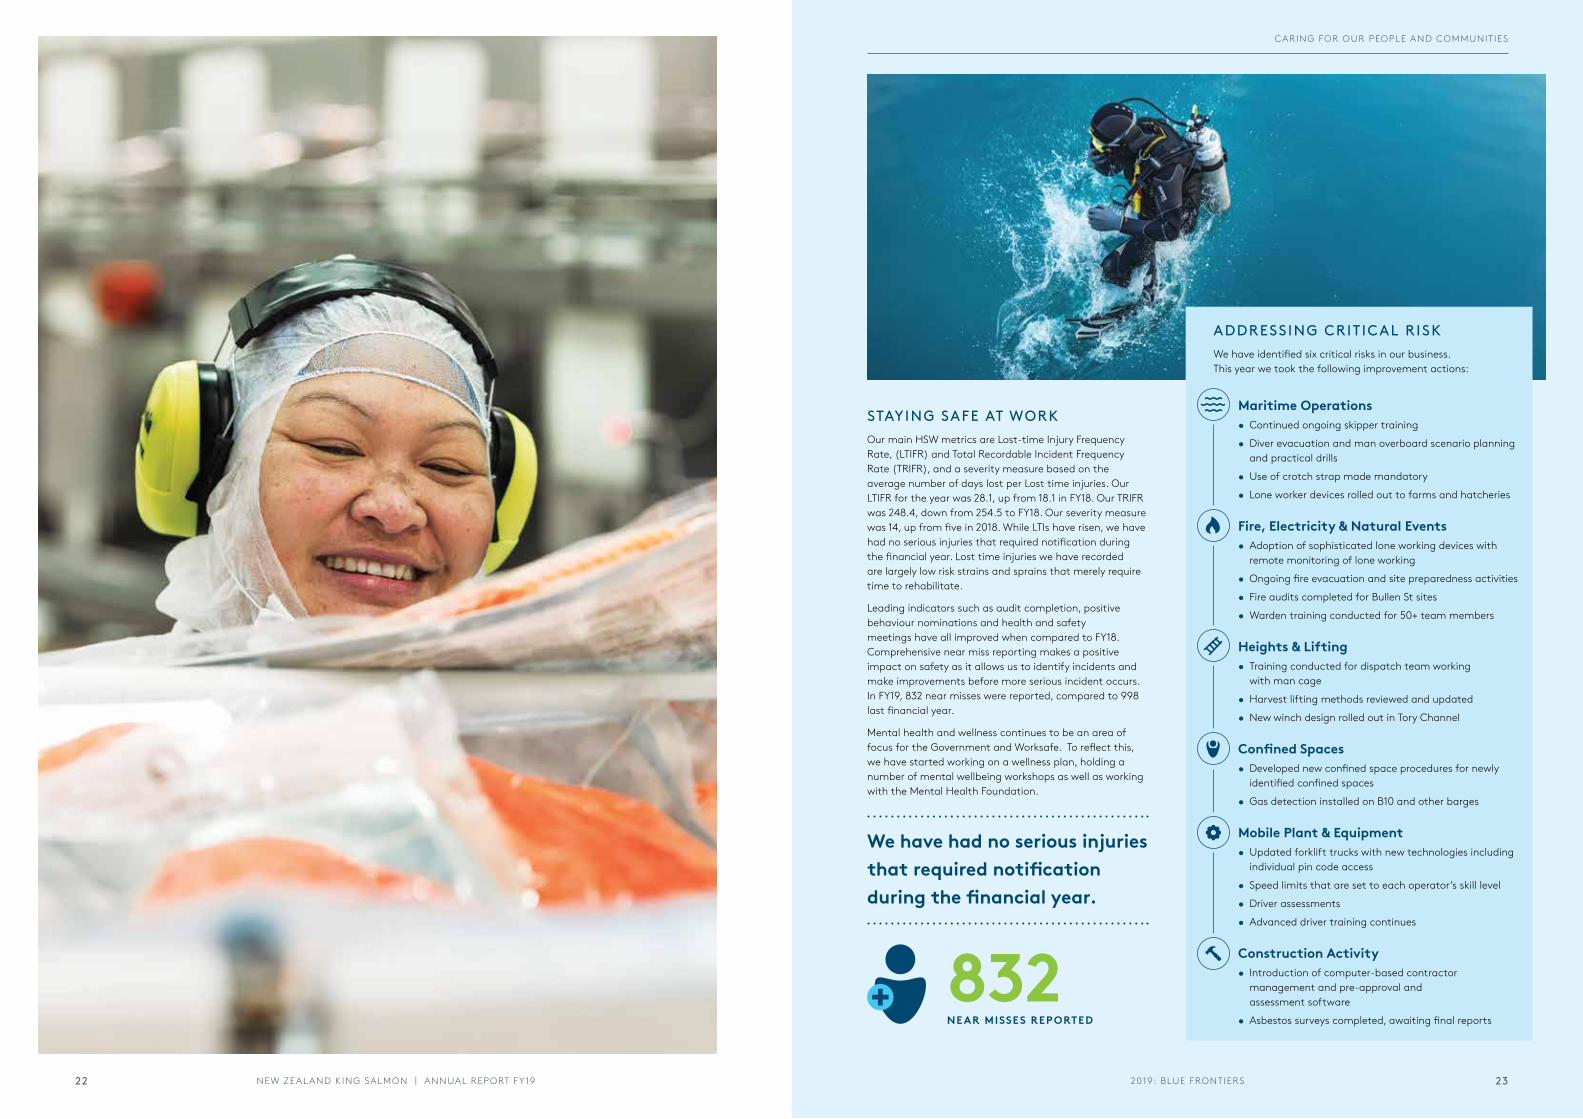
STAYING SAFE AT WORKOur main HSW metrics are Lost-time Injury Frequency Rate, (LTIFR) and Total Recordable Incident Frequency Rate (TRIFR), and a severity measure based on the average number of days lost per Lost time injuries. Our LTIFR for the year was 28.1, up from 18.1 in FY18. Our TRIFR was 248.4, down from 254.5 to FY18. Our severity measure was 14, up from five in 2018. While LTIs have risen, we have had no serious injuries that required notification during the financial year. Lost time injuries we have recorded are largely low risk strains and sprains that merely require time to rehabilitate.
Leading indicators such as audit completion, positive behaviour nominations and health and safety meetings have all improved when compared to FY18. Comprehensive near miss reporting makes a positive impact on safety as it allows us to identify incidents and make improvements before more serious incident occurs. In FY19, 832 near misses were reported, compared to 998 last financial year.
Mental health and wellness continues to be an area of focus for the Government and Worksafe. To reflect this, we have started working on a wellness plan, holding a number of mental wellbeing workshops as well as working with the Mental Health Foundation.
Maritime Operations• Continued ongoing skipper training
• Diver evacuation and man overboard scenario planning and practical drills
• Use of crotch strap made mandatory
• Lone worker devices rolled out to farms and hatcheries
Fire, Electricity & Natural Events• Adoption of sophisticated lone working devices with
remote monitoring of lone working
• Ongoing fire evacuation and site preparedness activities
• Fire audits completed for Bullen St sites
• Warden training conducted for 50+ team members
Heights & Lifting• Training conducted for dispatch team working
with man cage
• Harvest lifting methods reviewed and updated
• New winch design rolled out in Tory Channel
Confined Spaces• Developed new confined space procedures for newly
identified confined spaces
• Gas detection installed on B10 and other barges
Mobile Plant & Equipment• Updated forklift trucks with new technologies including
individual pin code access
• Speed limits that are set to each operator’s skill level
• Driver assessments
• Advanced driver training continues
Construction Activity• Introduction of computer-based contractor
management and pre-approval and assessment software
• Asbestos surveys completed, awaiting final reports
We have had no serious injuries that required notification during the financial year.
ADDRESSING CRITICAL RISKWe have identified six critical risks in our business. This year we took the following improvement actions:
832NE AR MISSES REPORTED
2019: BLUE FRONTIERS 2322 NEW ZEAL AND KING SALMON | ANNUAL REPORT FY19
CARING FOR OUR PEOPLE AND COMMUNITIES
New Zealand King Salmon is proud to call the Top of the South our home, and we’re committed to our communities wherever we have a presence. Although we’re a global business, it’s important to us that we remain local.
LOOKING AFTER LOCALSWe are proud of the role we play in the regional economy of the Top of the South. Salmon farming has an ‘economic multiplier’ effect – it creates work and income for employees, as well as a raft of local suppliers.
It also creates opportunities for the next generation, and helps secure a thriving future for aquaculture in the region.
Through our relationships with Te Tau Ihu (Top of the South) iwi, we collaborate on a variety of local partnerships and projects.
OUR COMMUNIT Y
Contribute to the economic
development of our regional community
Improve life in the community; focus on youth development,
environmental and educational
organisations
Build constructive partnerships with iwi
Be a good neighbour
Participate in flagship local food
and wine events
Produce the world’s finest salmon and make our
community proud
Our commitments:
Queen Charlotte Yacht Club Boaties are an important part of our community, and the entry to the Sounds represents the heartland of our business.
We are a platinum sponsor of Queen Charlotte Yacht Club’s rebuild, and its new main function room will be called the King Salmon Ward Room.
Head of the club's redevelopment committee, Ian Gardiner, says their partnership with NZKS is “critical” and goes beyond just financial support.
“Because NZ King Salmon is such a well-known and respected brand in the Picton and Marlborough community, and a big employer, it’s provided a catalyst for other supporters to get on board.”
Nelson Tasman HospiceThe new $11.5 million Nelson Tasman Hospice building was opened by the Prime Minister in April. The hospice provides a variety of free specialist care services for people who have a life-limiting illness – supporting them, their families/whānau and carers through illness, death and bereavement. We chose to sponsor the reception area and café as it aligns with our beliefs of giving back to our community and our association with food.
From environmental initiatives to youth development programmes, we’re involved with a variety of organisations and charities.
Available for feedbackWe consult with a wide variety of individuals and groups, one-on-one, in larger briefings or at public meetings, depending on the level of communication required.
For example, as part of our commitment to the Aquaculture Stewardship Council (ASC), we held a public meeting in Picton in June, where we provided attendees with a company update and details of our participation in the ASC certification programme. We aim to communicate more extensively than is legally required, which means we actively work with various interest groups, including central and local government, iwi, NGOs and community organisations.
Support through sponsorshipsFrom environmental initiatives to youth development programmes, we’re involved with a variety of organisations and charities throughout Marlborough, Nelson/Tasman, Golden Bay and Canterbury.
We also support a variety of programmes in local schools and nurture the next generation through our scholarships and internship programme with Nelson Marlborough Institute of Technology (NMIT) and the Summer of Tech.
In the past year, we have backed two large projects which we believe provide huge benefit to their communities. We sponsored the café and reception in the new Nelson Tasman Hospice facility, and also contributed towards the redevelopment of the Queen Charlotte Yacht Club in Picton.
SUSTAINABILIT Y ACTIONS
2019: BLUE FRONTIERSNEW ZEAL AND KING SALMON | ANNUAL REPORT FY19 2524
CARING FOR OUR PEOPLE AND COMMUNITIES CARING FOR OUR PEOPLE AND COMMUNITIES
Graeme Dingle FoundationWe are gold sponsors of the Graeme Dingle Foundation’s Kiwi Can programme in Marlborough. Kiwi Can is currently run in nine primary schools in Marlborough. The programme teaches the children values such as integrity and respect, which are important skills for life. We have also raised funds for Kiwi Can via our stands at the Picton Maritime Festival and Havelock Seafood & Mussel Festival. We are actively involved in the careers day and Career Navigator through the foundation.
Mistletoe Charitable FoundationWe are premier sponsors of the foundation, which provides financial assistance for any New Zealand school-aged youth to attend school camp at Mistletoe Bay in the Marlborough Sounds. We also held an auction which raised over $6,000 for the Mistletoe Charitable foundation at our annual shareholder dinner. Chef Mark McAllister, winner of the Best New Zealand Dish award at the 2018 Ōra King awards, was there to personally serve up his winning ‘Salmon Solstice’ dish.
Kaipupu Wildlife SanctuaryWe support the sanctuary in its goal to restore a 40-hectare ‘mainland island’ in Picton Harbour. The sanctuary offers amazing wildlife viewing, school or group visits and volunteering opportunities.
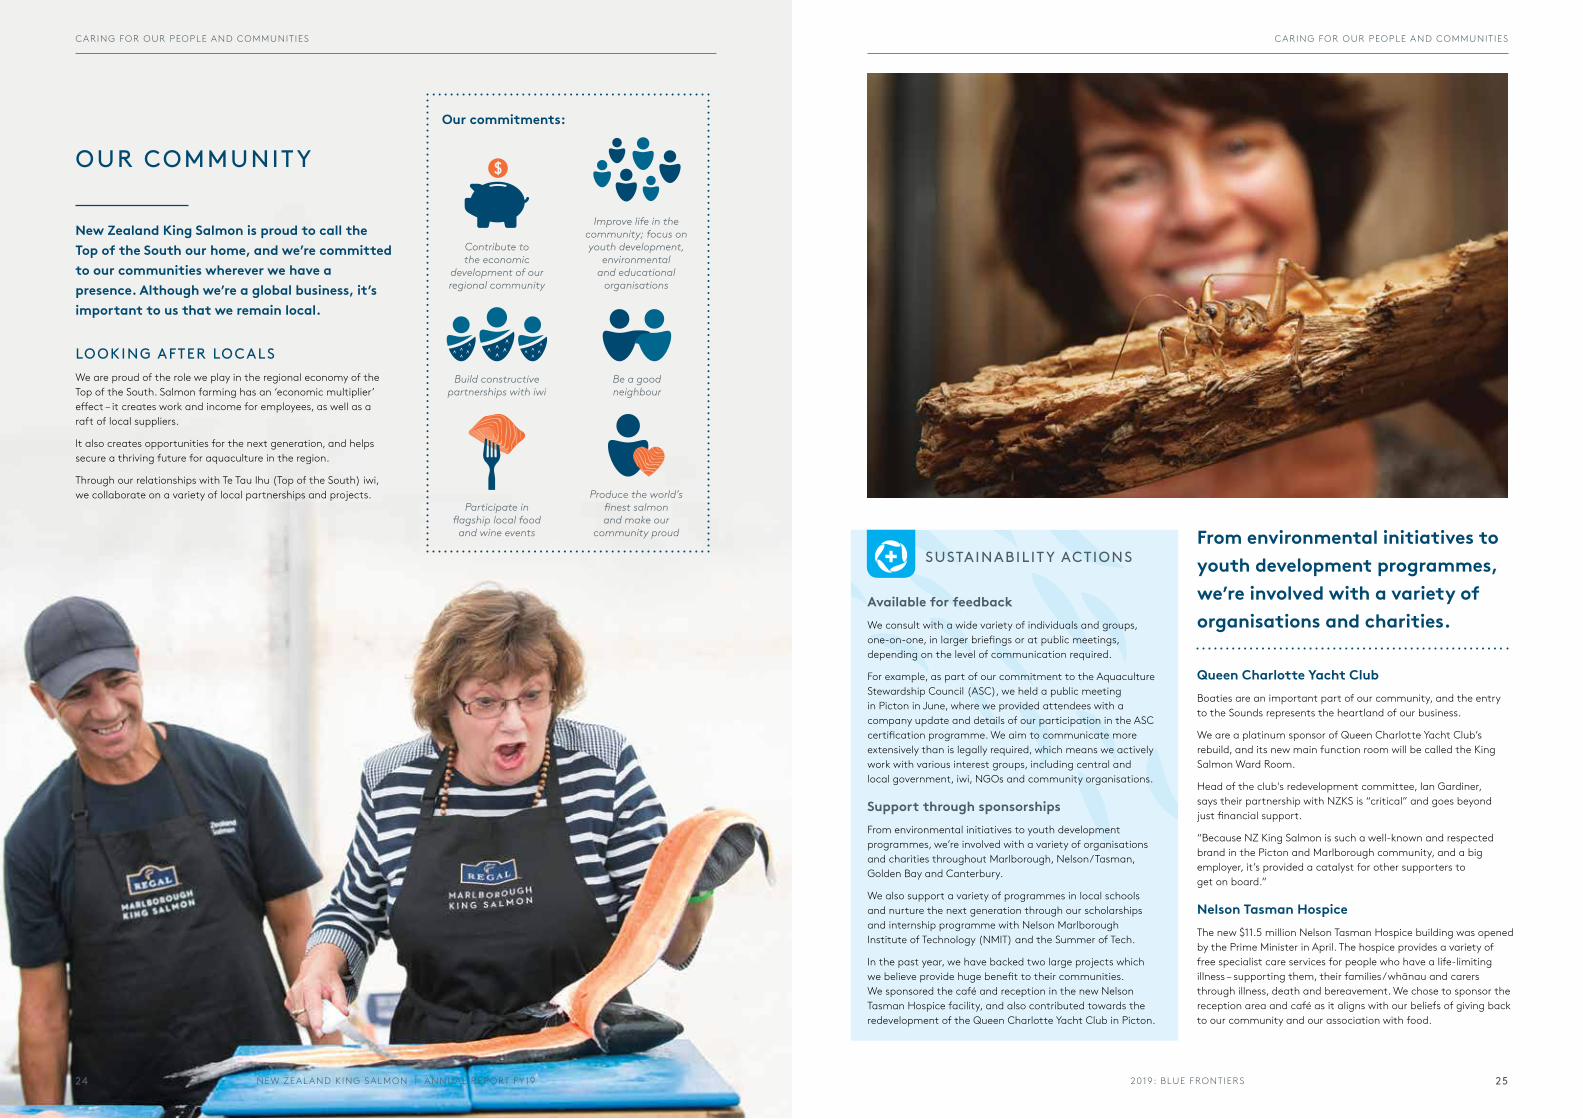
Koru Native Wildlife CentreWe have a long-term sponsorship partnership with the newly-opened Koru Native Wildlife Centre, set up by the Tui Nature Reserve Wildlife Trust. Koru focuses on a breeding programme for giant wētā and yellow-crowned kakariki, with a goal of education and engagement around conservation and restoration in the Marlborough Sounds. NZKS’s support, along with grants from Rata Foundation and the Lottery Grants Board, has made the establishment and ongoing operation of the centre possible.
Nelson Marlborough Rescue Helicopter TrustAs a silver sponsor of the Nelson Marlborough Rescue helicopter, we are supporting a service which provides treatment and the recovery of people needing urgent medical care and transportation to hospital in the Nelson Marlborough region.
Fifeshire FoundationWe have made a commitment to support disadvantaged and underprivileged groups in Nelson-Tasman through the Fifeshire Foundation.
Big Brothers Big SistersWe are a cornerstone sponsor of Big Brothers & Big Sisters (BBBS) in Nelson-Tasman, a mentoring organisation that creates lasting bonds and provides access to opportunities that every child should have. For 20 years, BBBS has helped children and youth realise their potential, build their futures, and strengthen communities.
Marlborough Girls' CollegeEqual opportunities for learning are important to us at NZKS. So, once we learned about the school’s need for extra funding around technology, we decided to provide devices for those girls whose families couldn’t afford them. We sponsored 60 Chromebooks in 2017 and 2018 as part of the BYO Device program. Each device is loaned to a student for the school year.
Our programme also covers support for the netball team, the annual prizegivings, and donations of salmon for cooking classes.
Marlborough Boys' CollegeWe have supported the schools' First XV rugby team for a number of years, helping with everything from uniforms and sports gear to contributions towards travel costs.
Queen Charlotte CollegeAs leaders in the aquaculture industry in the region, we support the Aquaculture Studies programme at Queen Charlotte College and we have done so for many years.
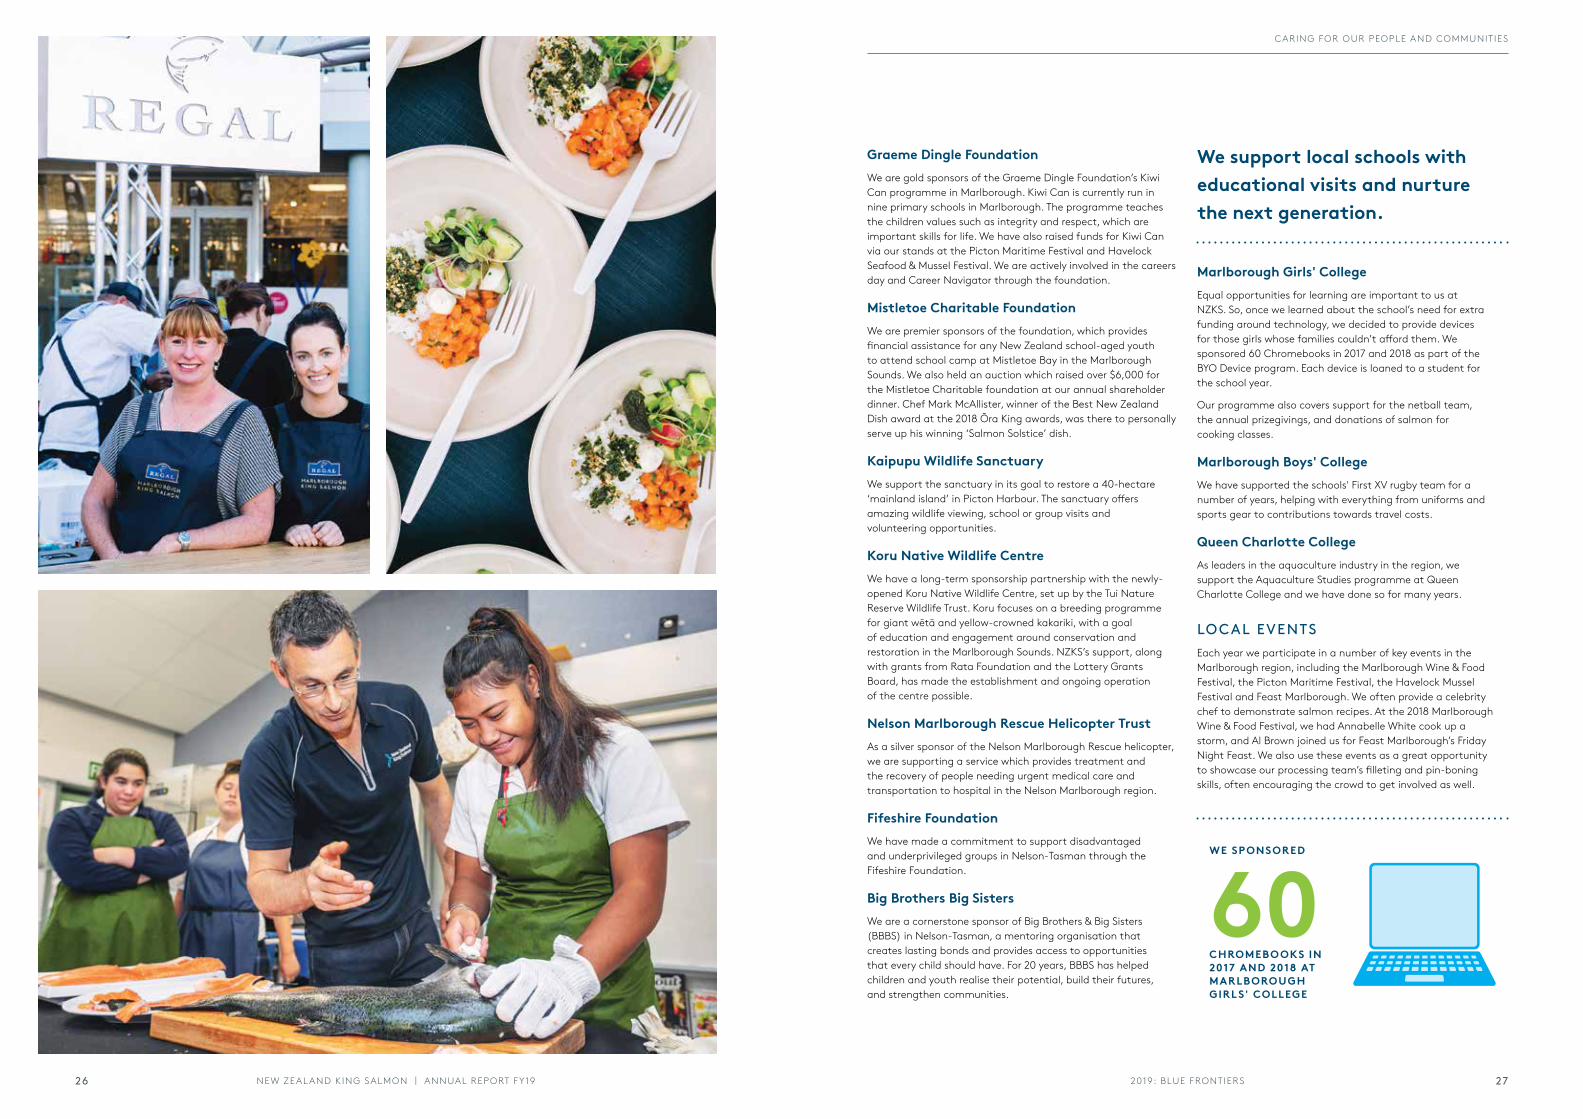
LOCAL EVENTSEach year we participate in a number of key events in the Marlborough region, including the Marlborough Wine & Food Festival, the Picton Maritime Festival, the Havelock Mussel Festival and Feast Marlborough. We often provide a celebrity chef to demonstrate salmon recipes. At the 2018 Marlborough Wine & Food Festival, we had Annabelle White cook up a storm, and Al Brown joined us for Feast Marlborough’s Friday Night Feast. We also use these events as a great opportunity to showcase our processing team’s filleting and pin-boning skills, often encouraging the crowd to get involved as well.
We support local schools with educational visits and nurture the next generation.
60CHROMEBO OKS IN 2017 AND 2018 AT MARLBOROUGH GIRL S' COLLEGE
WE SPONSORED
2019: BLUE FRONTIERS 2726 NEW ZEAL AND KING SALMON | ANNUAL REPORT FY19
CARING FOR OUR PEOPLE AND COMMUNITIES
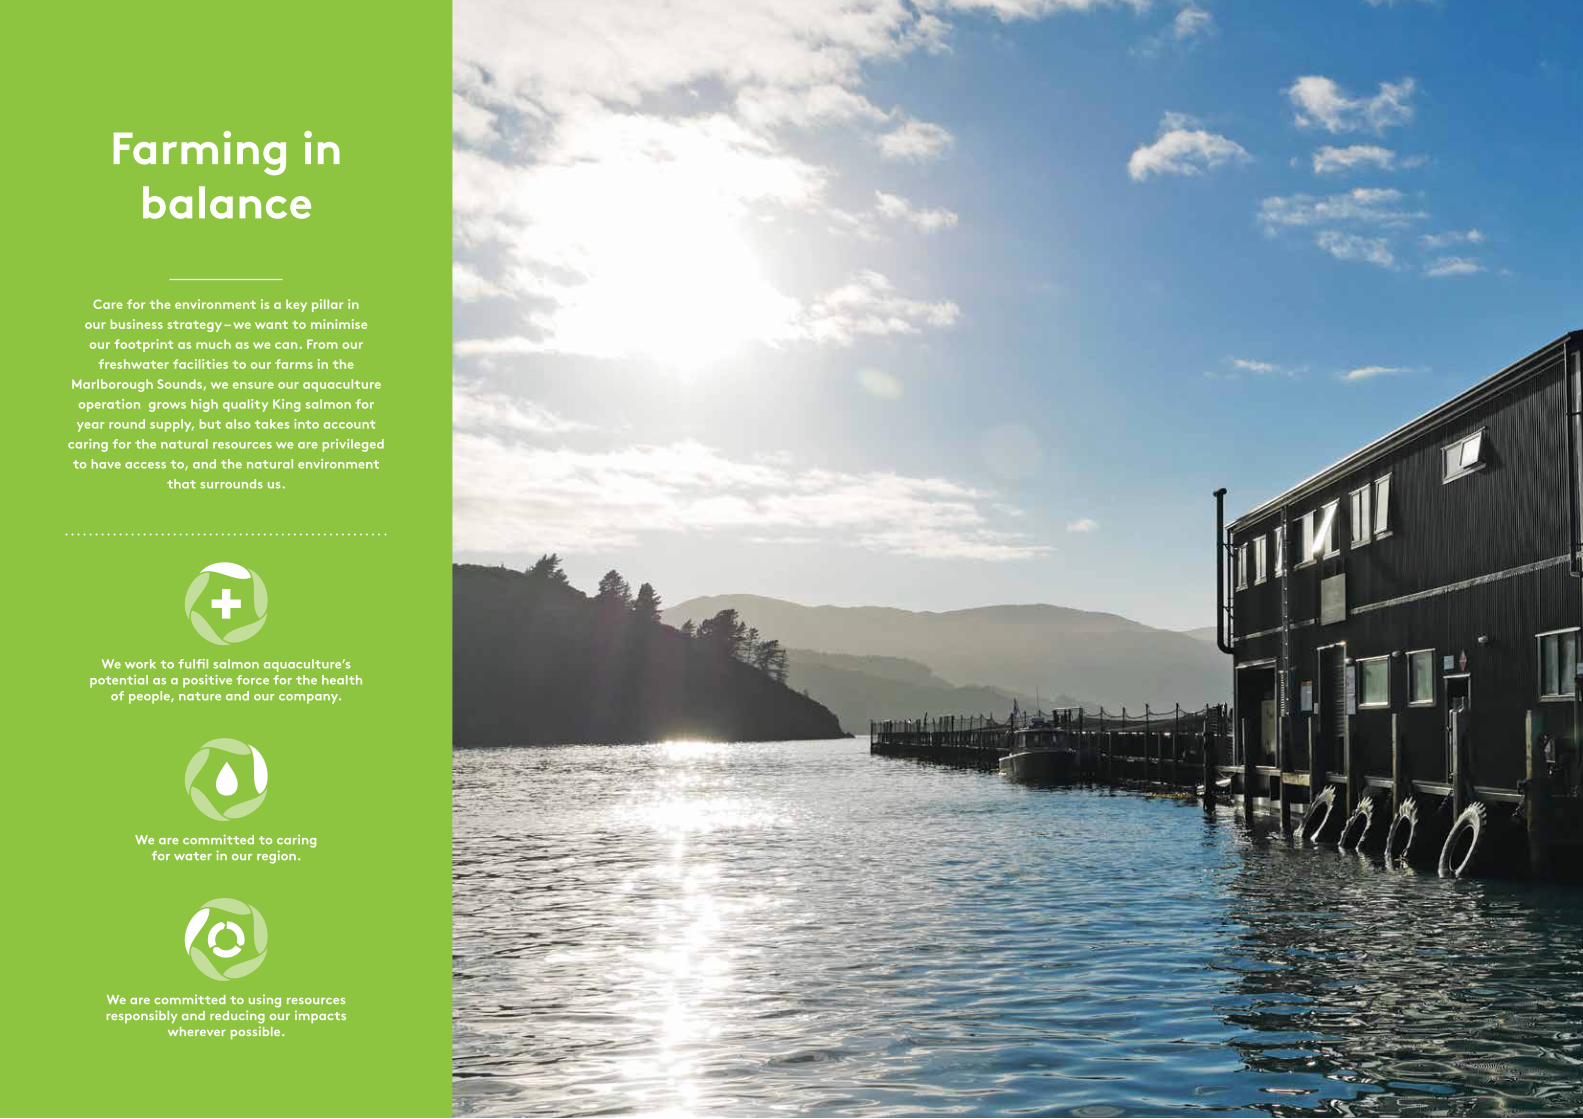
Care for the environment is a key pillar in our business strategy – we want to minimise our footprint as much as we can. From our
freshwater facilities to our farms in the Marlborough Sounds, we ensure our aquaculture operation grows high quality King salmon for year round supply, but also takes into account
caring for the natural resources we are privileged to have access to, and the natural environment
that surrounds us.
Farming in balance
We are committed to caring for water in our region.
We are committed to using resources responsibly and reducing our impacts
wherever possible.
We work to fulfil salmon aquaculture’s potential as a positive force for the health
of people, nature and our company.
Delivering high quality products requires quality farming practices with a focus on the responsible management of resources for the long term.
RECOGNISING SUSTAINABILIT YTo independently verify our sustainable practices in aquaculture and our supply chain, we are regularly audited or assessed by expert third-party organisations.
Best Aquaculture Practices We now hold a four-star rating with the Global Aquaculture Alliance’s (GAA) Best Aquaculture Practices (BAP) programme. The four-star rating is the highest designation in the programme, indicating that a product originates from a BAP-certified processing plant, farm, hatchery, and feed mill. New Zealand King Salmon was the first King salmon company to earn the distinction worldwide,
Aquaculture Stewardship Council (ASC)The Aquaculture Stewardship Council (ASC) is an independent non-profit organisation and labelling organisation that establishes protocol on farmed seafood while ensuring sustainable aquaculture.
As a member of the Global Salmon Initiative (GSI), we are committed to the collective goal of achieving ASC certification by 2020. This goal aims to maintain and grow the industry’s license to operate, through improving the reputation of both farmed salmon and salmon farming.
In April we completed a pre-audit with ASC auditors as a gap-identification exercise, prior to a full audit scheduled for September 2019.
Monterey Bay Aquarium Seafood WatchNew Zealand King Salmon is the first salmon industry to have achieved the Green/'Best Choice' rating from the globally respected Seafood Watch programme. The MBA Seafood Watch Programme helps consumers and businesses choose seafood that supports a healthy ocean.
ENVIRONMENTAL SUSTAINABILIT Y
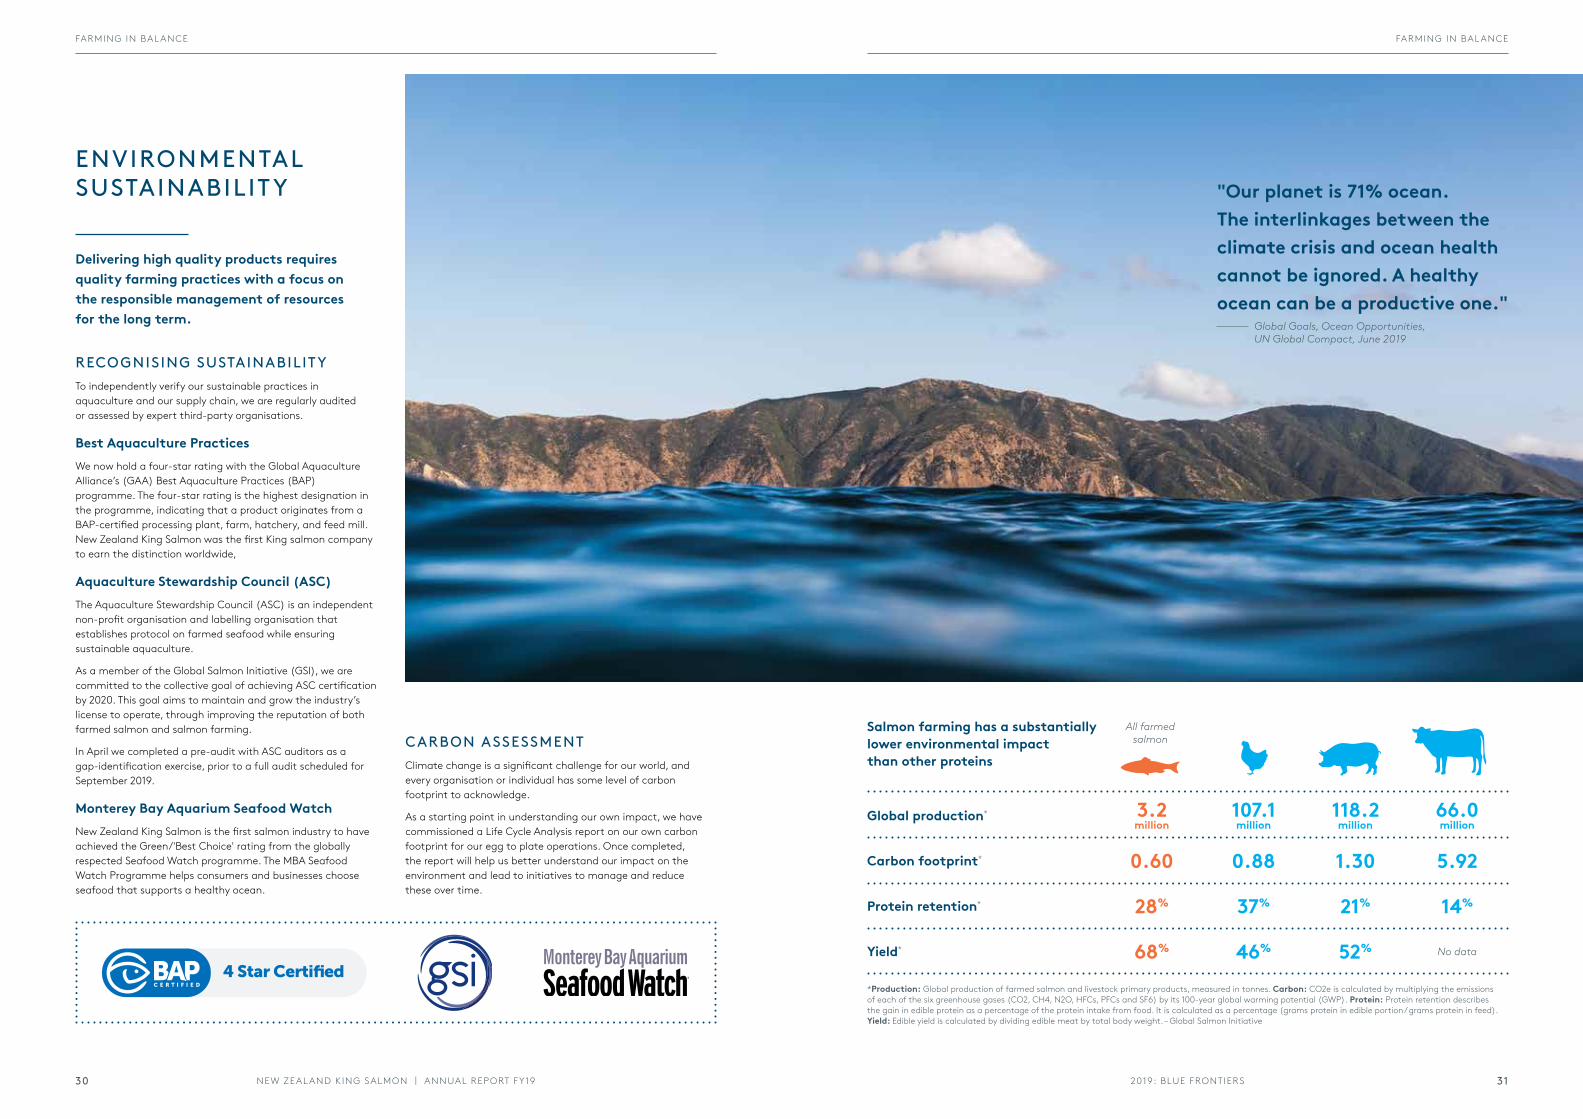
Salmon farming has a substantially lower environmental impact than other proteins
Global production* 3.2million
107.1million
118.2million
66.0million
*Production: Global production of farmed salmon and livestock primary products, measured in tonnes. Carbon: CO2e is calculated by multiplying the emissions of each of the six greenhouse gases (CO2, CH4, N2O, HFCs, PFCs and SF6) by its 100-year global warming potential (GWP). Protein: Protein retention describes the gain in edible protein as a percentage of the protein intake from food. It is calculated as a percentage (grams protein in edible portion / grams protein in feed). Yield: Edible yield is calculated by dividing edible meat by total body weight. – Global Salmon Initiative
All farmed salmon
Protein retention* 28% 37% 21% 14%
Yield* 68% 46% 52% No data
Carbon footprint* 0.60 0.88 1.30 5.92
"Our planet is 71% ocean. The interlinkages between the climate crisis and ocean health cannot be ignored. A healthy ocean can be a productive one."
Global Goals, Ocean Opportunities, UN Global Compact, June 2019
CARBON ASSESSMENTClimate change is a significant challenge for our world, and every organisation or individual has some level of carbon footprint to acknowledge.
As a starting point in understanding our own impact, we have commissioned a Life Cycle Analysis report on our own carbon footprint for our egg to plate operations. Once completed, the report will help us better understand our impact on the environment and lead to initiatives to manage and reduce these over time.
2019: BLUE FRONTIERSNEW ZEAL AND KING SALMON | ANNUAL REPORT FY19 3130
FARMING IN BAL ANCE FARMING IN BAL ANCE
FRESHWATER
This year's warmer summer weather had an effect on our freshwater operations, particularly at our Takaka broodstock facility.
Our source of quality fresh water at Takaka, Te Waikoropupū Springs, suffered during the region’s extended drought conditions, which resulted in a low water flow in our raceways. The limited water flow impacted fish performance, with lower quality results in egg production. During this period, we implemented 24-hour water monitoring as a precautionary exercise, checking parameters such as available oxygen, temperature, pH and carbon dioxide.
We also have a project underway at Takaka to increase the incubation chiller capacity, allowing greater control over year round egg production, and increased water exchange to maintain quality.
Meanwhile, at our smolt facility in Tentburn we installed a small bore pump to increase water flow to the hatchery.
As part of our fish welfare management plan, the team at Tentburn also completed our yearly vaccination programme in May, immunising approximately 2.7 million fish before transfer to sea. The immunisation programme is to enhance resilience in the fish for high temperatures and any possible diseases. There are no side effects or detection at harvest and it is absolutely safe for human consumption.
Our Takaka freshwater facility also plays an important role in growing Ōra King TYEE for our foodservice customers. This year, 100 TYEE were harvested and supplied to international customers, all weighing over 13.6kg (30 pounds liveweight), a significant increase over the previous year. The team continues to work on solutions to grow more of these remarkable salmon.
FISH IMMUNISED BEFORE TR ANSFER TO SE A
2.7million
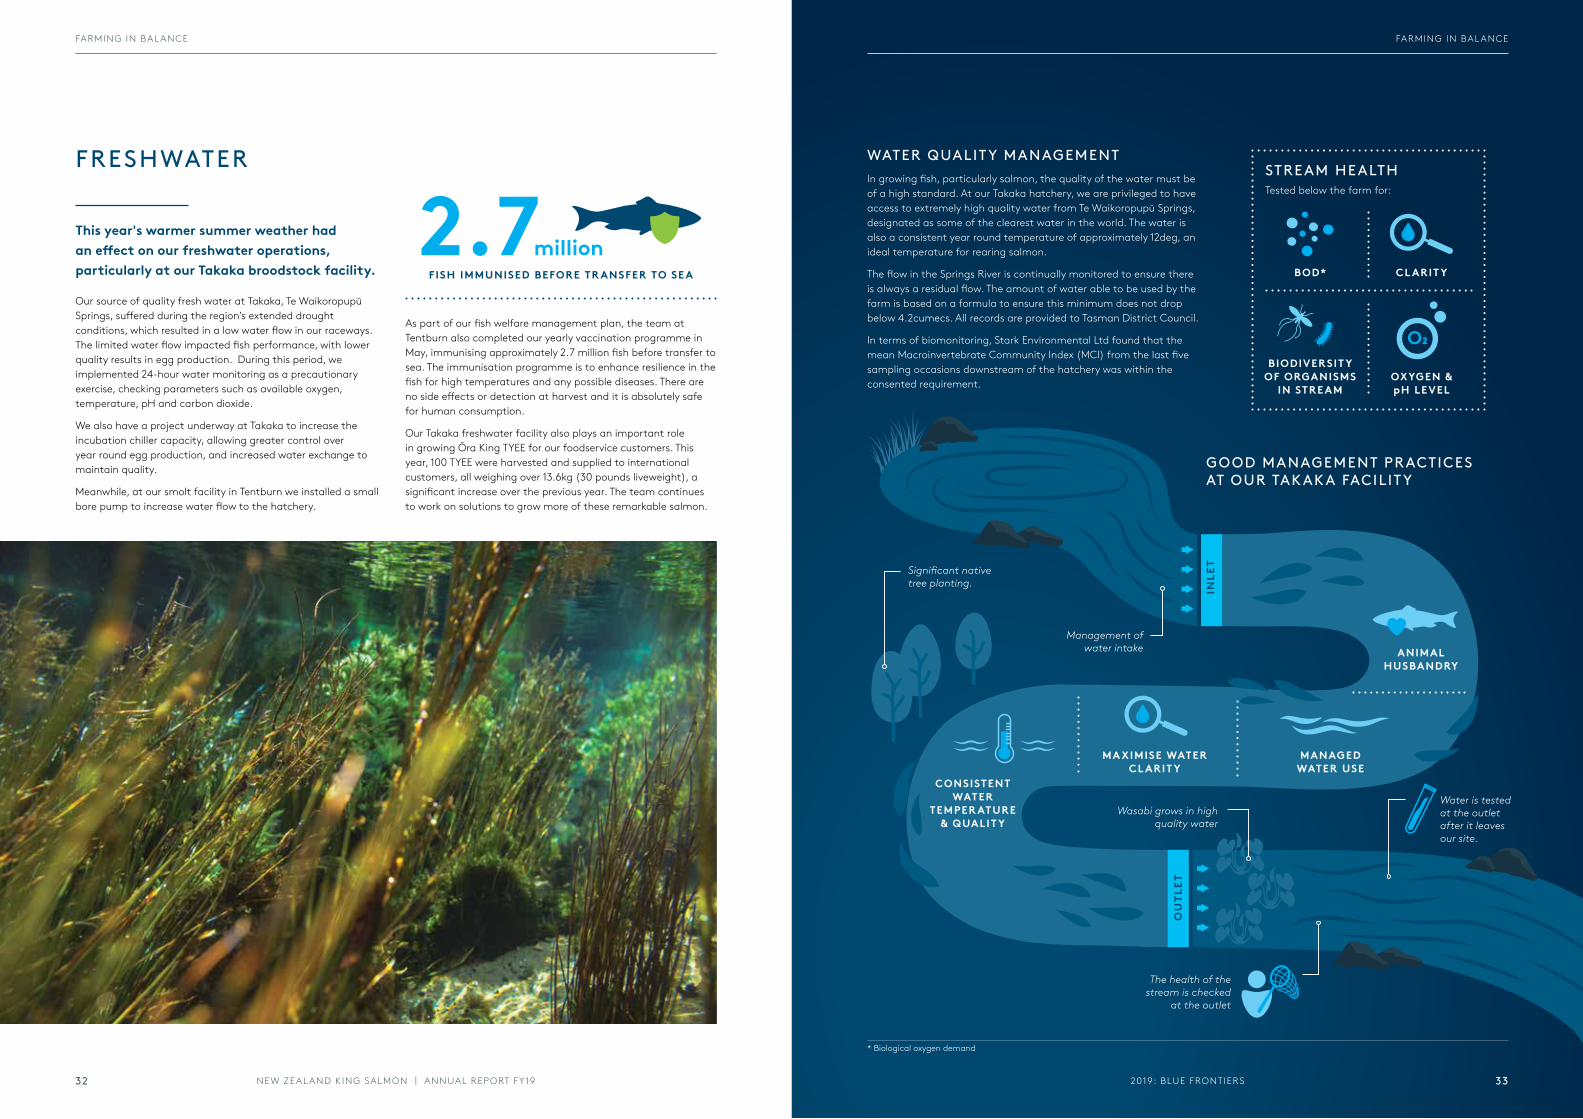
MANAGED WATER USE
ANIMAL HUSBANDRY
INLE
T
OU
TLET
CONSISTENT WATER
TEMPER ATURE & QUALIT Y
MA XIMISE WATER CL ARIT Y
GOOD MANAGEMENT PRACTICES AT OUR TAKAKA FACILIT Y
STREAM HEALTHTested below the farm for:
BOD*
OXYGEN & pH LEVEL
BIODIVERSIT Y OF ORGANISMS
IN STRE AM
Management of water intake
Significant native tree planting.
Wasabi grows in high quality water
Water is tested at the outlet after it leaves our site.
The health of the stream is checked
at the outlet
CL ARIT Y
WATER QUALIT Y MANAGEMENTIn growing fish, particularly salmon, the quality of the water must be of a high standard. At our Takaka hatchery, we are privileged to have access to extremely high quality water from Te Waikoropupū Springs, designated as some of the clearest water in the world. The water is also a consistent year round temperature of approximately 12deg, an ideal temperature for rearing salmon.
The flow in the Springs River is continually monitored to ensure there is always a residual flow. The amount of water able to be used by the farm is based on a formula to ensure this minimum does not drop below 4.2cumecs. All records are provided to Tasman District Council.
In terms of biomonitoring, Stark Environmental Ltd found that the mean Macroinvertebrate Community Index (MCI) from the last five sampling occasions downstream of the hatchery was within the consented requirement.
* Biological oxygen demand
2019: BLUE FRONTIERS 33NEW ZEAL AND KING SALMON | ANNUAL REPORT FY1932
FARMING IN BAL ANCE FARMING IN BAL ANCE
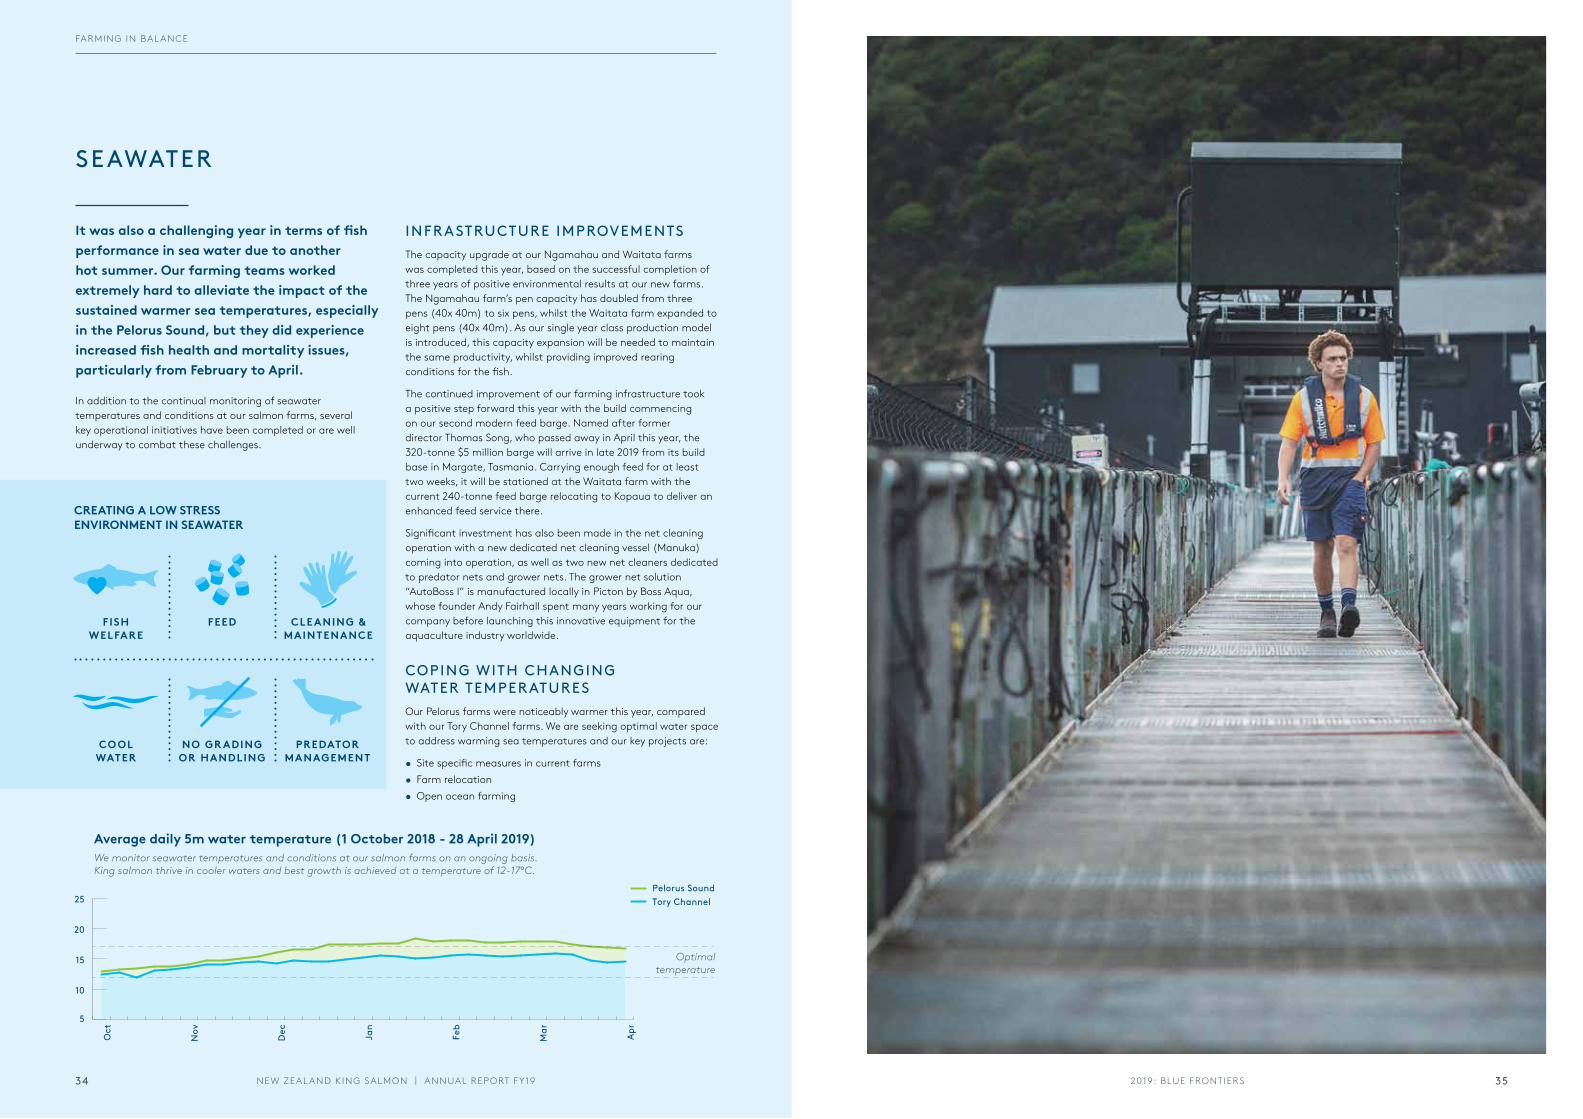
It was also a challenging year in terms of fish performance in sea water due to another hot summer. Our farming teams worked extremely hard to alleviate the impact of the sustained warmer sea temperatures, especially in the Pelorus Sound, but they did experience increased fish health and mortality issues, particularly from February to April.
In addition to the continual monitoring of seawater temperatures and conditions at our salmon farms, several key operational initiatives have been completed or are well underway to combat these challenges.
SEAWATER
CREATING A LOW STRESS ENVIRONMENT IN SEAWATER
FISH WELFARE
FEED CLE ANING & MAINTENANCE
CO OL WATER
NO GR ADING OR HANDLING
PREDATOR MANAGEMENT
5
10
15
20
25
Oct
Nov
Dec Jan
Feb
Mar Ap
r
Tory ChannelPelorus Sound
Average daily 5m water temperature (1 October 2018 - 28 April 2019)
Optimal temperature
INFRASTRUCTURE IMPROVEMENTS The capacity upgrade at our Ngamahau and Waitata farms was completed this year, based on the successful completion of three years of positive environmental results at our new farms. The Ngamahau farm’s pen capacity has doubled from three pens (40x 40m) to six pens, whilst the Waitata farm expanded to eight pens (40x 40m). As our single year class production model is introduced, this capacity expansion will be needed to maintain the same productivity, whilst providing improved rearing conditions for the fish.
The continued improvement of our farming infrastructure took a positive step forward this year with the build commencing on our second modern feed barge. Named after former director Thomas Song, who passed away in April this year, the 320-tonne $5 million barge will arrive in late 2019 from its build base in Margate, Tasmania. Carrying enough feed for at least two weeks, it will be stationed at the Waitata farm with the current 240-tonne feed barge relocating to Kopaua to deliver an enhanced feed service there.
Significant investment has also been made in the net cleaning operation with a new dedicated net cleaning vessel (Manuka) coming into operation, as well as two new net cleaners dedicated to predator nets and grower nets. The grower net solution “AutoBoss I” is manufactured locally in Picton by Boss Aqua, whose founder Andy Fairhall spent many years working for our company before launching this innovative equipment for the aquaculture industry worldwide.
COPING WITH CHANGING WATER TEMPERATURESOur Pelorus farms were noticeably warmer this year, compared with our Tory Channel farms. We are seeking optimal water space to address warming sea temperatures and our key projects are:
• Site specific measures in current farms• Farm relocation• Open ocean farming
We monitor seawater temperatures and conditions at our salmon farms on an ongoing basis. King salmon thrive in cooler waters and best growth is achieved at a temperature of 12-17°C.
352019: BLUE FRONTIERSNEW ZEAL AND KING SALMON | ANNUAL REPORT FY1934
FARMING IN BAL ANCE
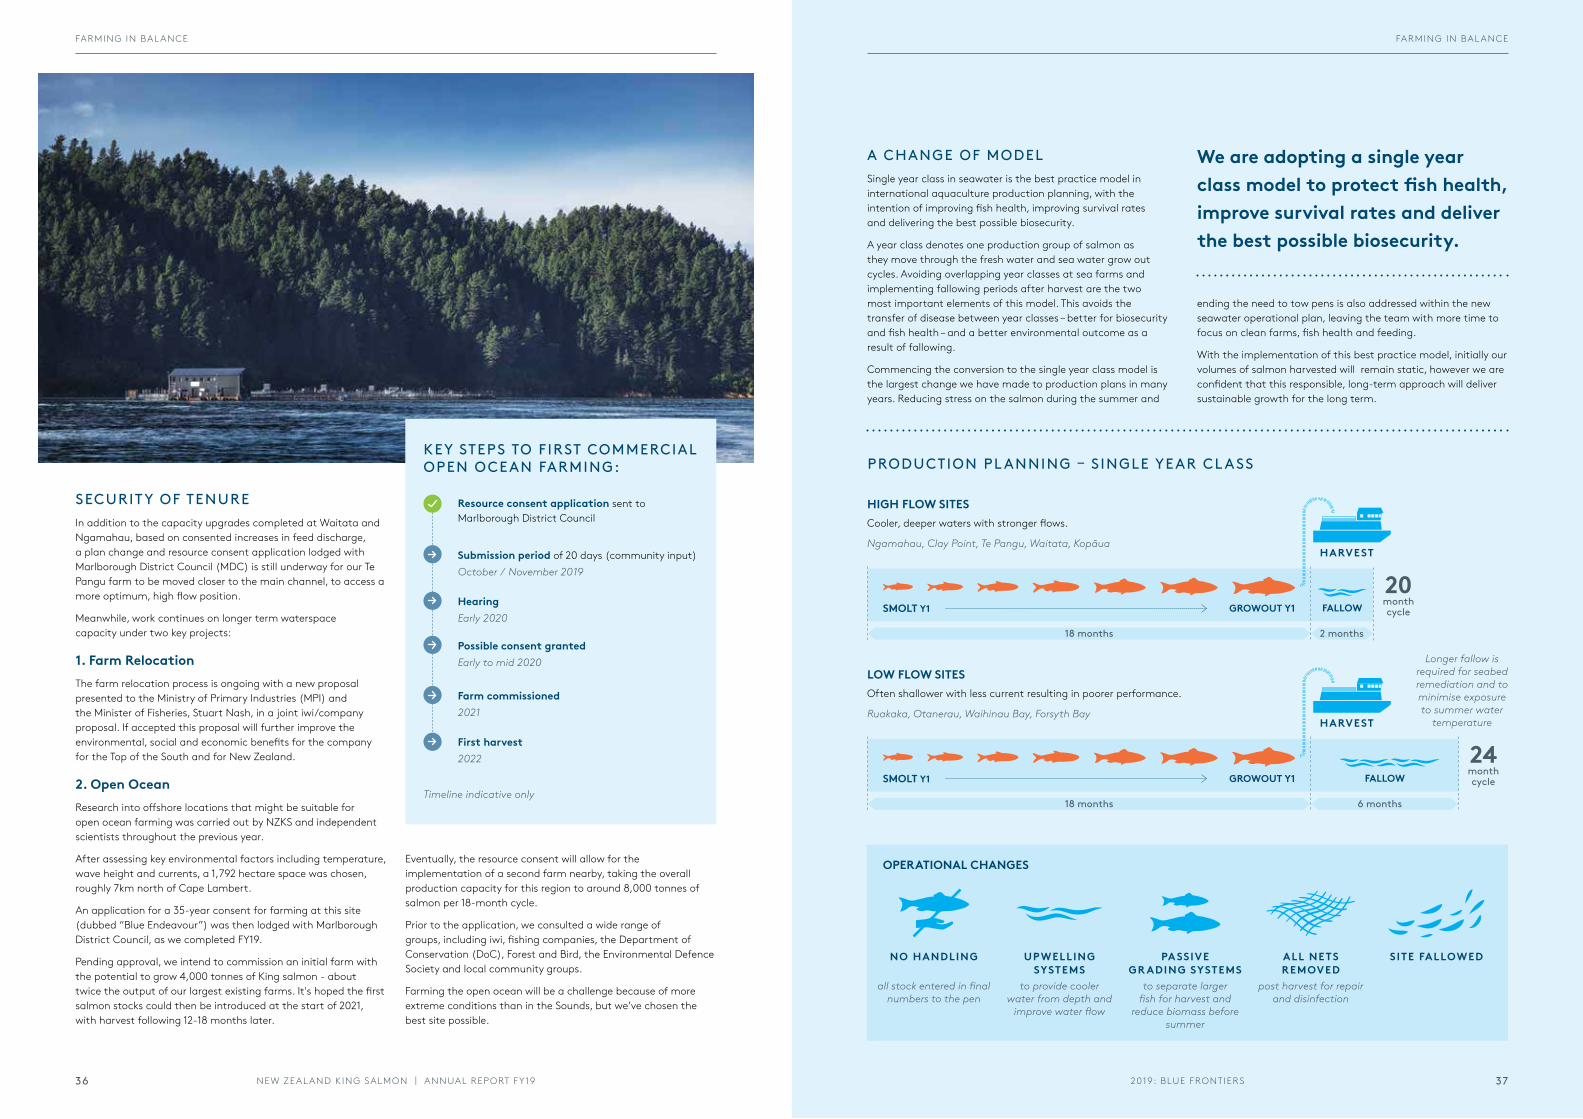
SECURIT Y OF TENUREIn addition to the capacity upgrades completed at Waitata and Ngamahau, based on consented increases in feed discharge, a plan change and resource consent application lodged with Marlborough District Council (MDC) is still underway for our Te Pangu farm to be moved closer to the main channel, to access a more optimum, high flow position.
Meanwhile, work continues on longer term waterspace capacity under two key projects:
1. Farm RelocationThe farm relocation process is ongoing with a new proposal presented to the Ministry of Primary Industries (MPI) and the Minister of Fisheries, Stuart Nash, in a joint iwi/company proposal. If accepted this proposal will further improve the environmental, social and economic benefits for the company for the Top of the South and for New Zealand.
2. Open Ocean Research into offshore locations that might be suitable for open ocean farming was carried out by NZKS and independent scientists throughout the previous year.
After assessing key environmental factors including temperature, wave height and currents, a 1,792 hectare space was chosen, roughly 7km north of Cape Lambert.
An application for a 35-year consent for farming at this site (dubbed “Blue Endeavour”) was then lodged with Marlborough District Council, as we completed FY19.
Pending approval, we intend to commission an initial farm with the potential to grow 4,000 tonnes of King salmon - about twice the output of our largest existing farms. It's hoped the first salmon stocks could then be introduced at the start of 2021, with harvest following 12-18 months later.
Resource consent application sent to Marlborough District Council
Submission period of 20 days (community input) October / November 2019
Hearing Early 2020
Possible consent grantedEarly to mid 2020
Farm commissioned2021
First harvest2022
KEY STEPS TO FIRST COMMERCIAL OPEN OCEAN FARMING:
Eventually, the resource consent will allow for the implementation of a second farm nearby, taking the overall production capacity for this region to around 8,000 tonnes of salmon per 18-month cycle.
Prior to the application, we consulted a wide range of groups, including iwi, fishing companies, the Department of Conservation (DoC), Forest and Bird, the Environmental Defence Society and local community groups.
Farming the open ocean will be a challenge because of more extreme conditions than in the Sounds, but we’ve chosen the best site possible.
Timeline indicative only
24month cycle
FALLOW
FALLOW
SMOLT Y1
SMOLT Y1
20month cycleGROWOUT Y1
GROWOUT Y1
2 months
6 months
18 months
18 months
HARVEST
HARVEST
A CHANGE OF MODELSingle year class in seawater is the best practice model in international aquaculture production planning, with the intention of improving fish health, improving survival rates and delivering the best possible biosecurity.
A year class denotes one production group of salmon as they move through the fresh water and sea water grow out cycles. Avoiding overlapping year classes at sea farms and implementing fallowing periods after harvest are the two most important elements of this model. This avoids the transfer of disease between year classes – better for biosecurity and fish health – and a better environmental outcome as a result of fallowing.
Commencing the conversion to the single year class model is the largest change we have made to production plans in many years. Reducing stress on the salmon during the summer and
HIGH FLOW SITESCooler, deeper waters with stronger flows.
Ngamahau, Clay Point, Te Pangu, Waitata, Kopāua
Longer fallow is required for seabed remediation and to minimise exposure to summer water
temperature
LOW FLOW SITESOften shallower with less current resulting in poorer performance.
Ruakaka, Otanerau, Waihinau Bay, Forsyth Bay
We are adopting a single year class model to protect fish health, improve survival rates and deliver the best possible biosecurity.
ending the need to tow pens is also addressed within the new seawater operational plan, leaving the team with more time to focus on clean farms, fish health and feeding.
With the implementation of this best practice model, initially our volumes of salmon harvested will remain static, however we are confident that this responsible, long-term approach will deliver sustainable growth for the long term.
OPERATIONAL CHANGES
PRODUCTION PL ANNING – SINGLE YEAR CL ASS
NO HANDLING UPWELLING SYSTEMS
PA SSIVE GR ADING SYSTEMS
ALL NETS REMOVED
SITE FALLOWED
all stock entered in final numbers to the pen
to provide cooler water from depth and
improve water flow
to separate larger fish for harvest and
reduce biomass before summer
post harvest for repair and disinfection
2019: BLUE FRONTIERSNEW ZEAL AND KING SALMON | ANNUAL REPORT FY19 3736
FARMING IN BAL ANCE FARMING IN BAL ANCE
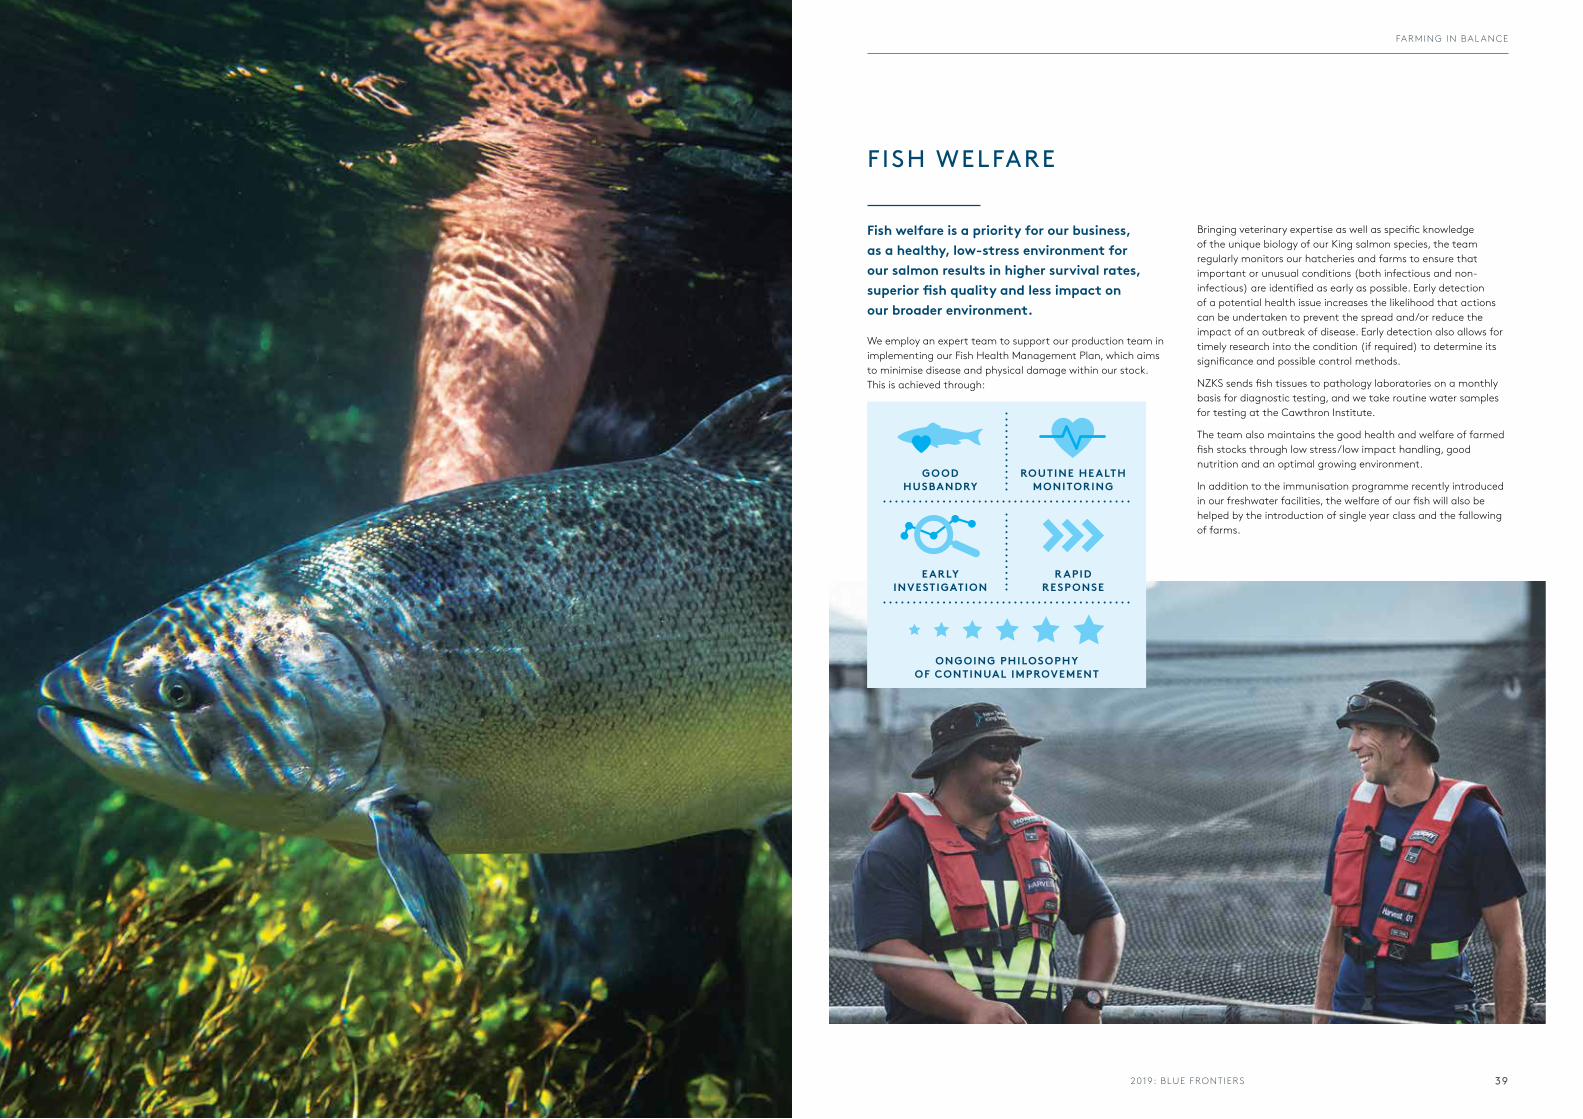
Fish welfare is a priority for our business, as a healthy, low-stress environment for our salmon results in higher survival rates, superior fish quality and less impact on our broader environment.
We employ an expert team to support our production team in implementing our Fish Health Management Plan, which aims to minimise disease and physical damage within our stock. This is achieved through:
FISH WELFARE
Bringing veterinary expertise as well as specific knowledge of the unique biology of our King salmon species, the team regularly monitors our hatcheries and farms to ensure that important or unusual conditions (both infectious and non-infectious) are identified as early as possible. Early detection of a potential health issue increases the likelihood that actions can be undertaken to prevent the spread and/or reduce the impact of an outbreak of disease. Early detection also allows for timely research into the condition (if required) to determine its significance and possible control methods.
NZKS sends fish tissues to pathology laboratories on a monthly basis for diagnostic testing, and we take routine water samples for testing at the Cawthron Institute.
The team also maintains the good health and welfare of farmed fish stocks through low stress/low impact handling, good nutrition and an optimal growing environment.
In addition to the immunisation programme recently introduced in our freshwater facilities, the welfare of our fish will also be helped by the introduction of single year class and the fallowing of farms.
GO OD HUSBANDRY
ROUTINE HE ALTH MONITORING
E ARLY INVESTIGATION
R APID RESPONSE
ONGOING PHILOSOPHY OF CONTINUAL IMPROVEMENT
2019: BLUE FRONTIERS 39
FARMING IN BAL ANCE
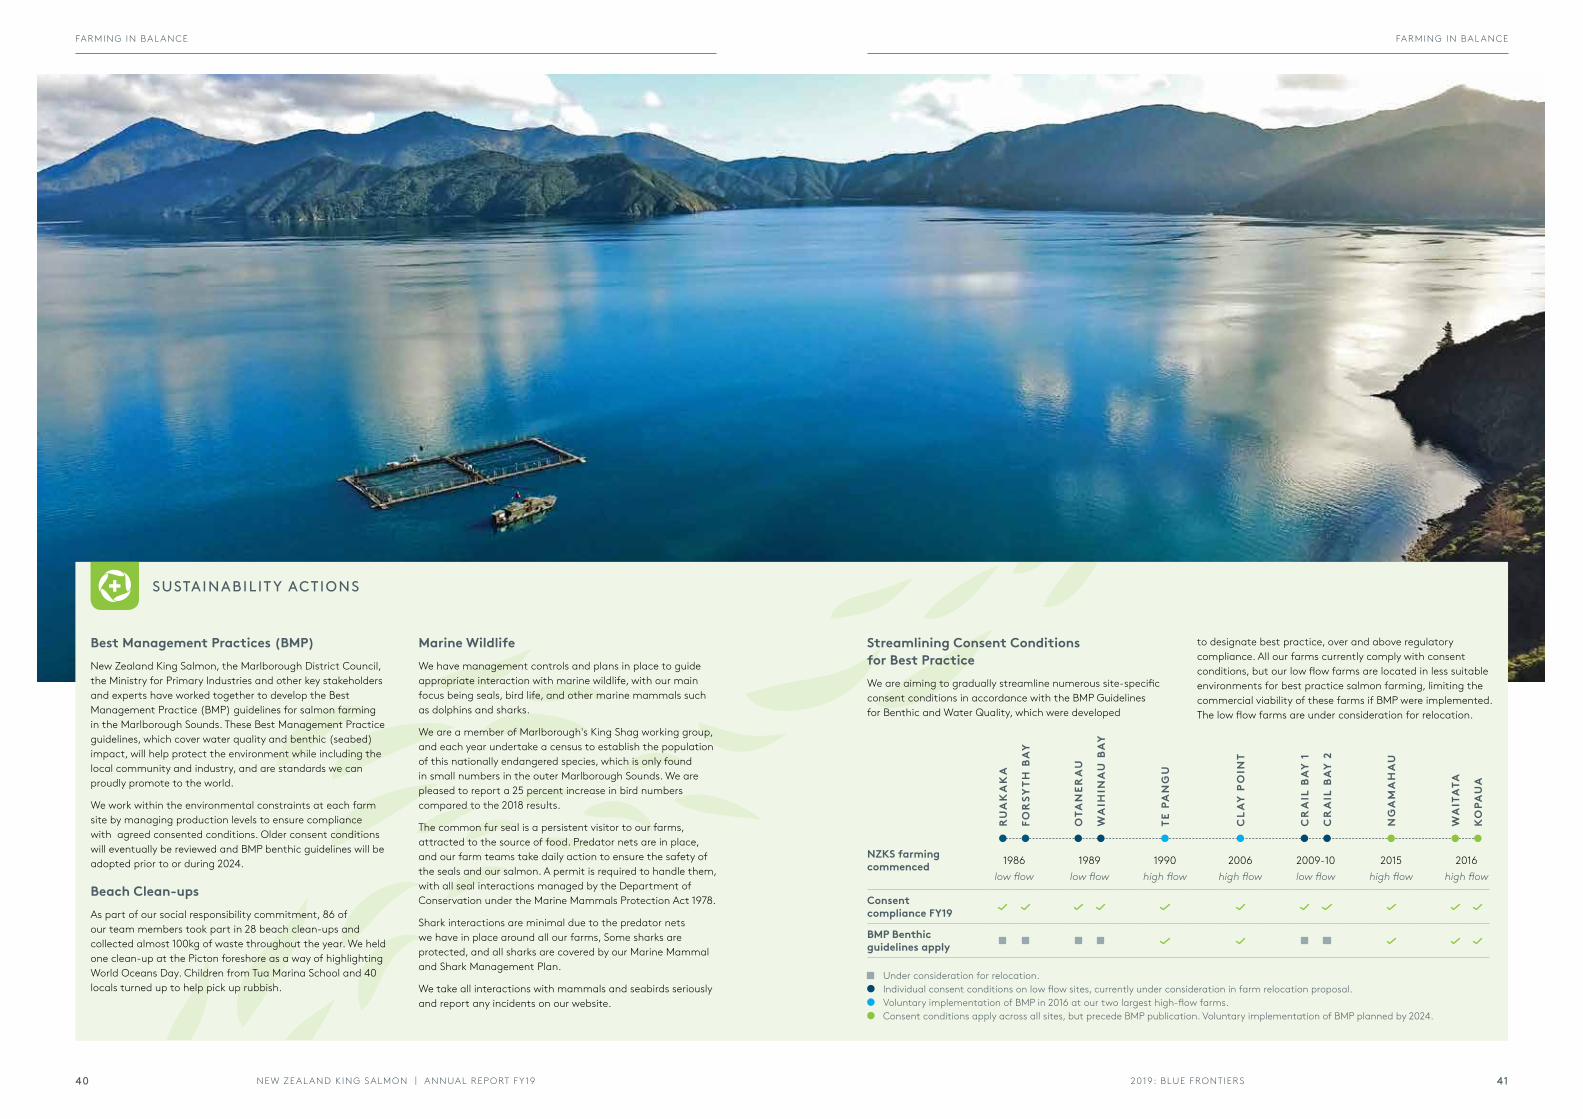
Best Management Practices (BMP)New Zealand King Salmon, the Marlborough District Council, the Ministry for Primary Industries and other key stakeholders and experts have worked together to develop the Best Management Practice (BMP) guidelines for salmon farming in the Marlborough Sounds. These Best Management Practice guidelines, which cover water quality and benthic (seabed) impact, will help protect the environment while including the local community and industry, and are standards we can proudly promote to the world.
We work within the environmental constraints at each farm site by managing production levels to ensure compliance with agreed consented conditions. Older consent conditions will eventually be reviewed and BMP benthic guidelines will be adopted prior to or during 2024.
Beach Clean-upsAs part of our social responsibility commitment, 86 of our team members took part in 28 beach clean-ups and collected almost 100kg of waste throughout the year. We held one clean-up at the Picton foreshore as a way of highlighting World Oceans Day. Children from Tua Marina School and 40 locals turned up to help pick up rubbish.
RU
AK
AK
A
FOR
SYTH
BA
Y
OTA
NER
AU
WA
IHIN
AU
BA
Y
TE P
AN
GU
CLA
Y P
OIN
T
CR
AIL
BA
Y 1
CR
AIL
BA
Y 2
NG
AM
AH
AU
WA
ITA
TA
KO
PAU
A
NZKS farming commenced 1986 1989 1990 2006 2009-10 2015 2016
low flow low flow high flow high flow low flow high flow high flow
Consent compliance FY19
BMP Benthic guidelines apply
SUSTAINABILIT Y ACTIONS
Marine WildlifeWe have management controls and plans in place to guide appropriate interaction with marine wildlife, with our main focus being seals, bird life, and other marine mammals such as dolphins and sharks.
We are a member of Marlborough's King Shag working group, and each year undertake a census to establish the population of this nationally endangered species, which is only found in small numbers in the outer Marlborough Sounds. We are pleased to report a 25 percent increase in bird numbers compared to the 2018 results.
The common fur seal is a persistent visitor to our farms, attracted to the source of food. Predator nets are in place, and our farm teams take daily action to ensure the safety of the seals and our salmon. A permit is required to handle them, with all seal interactions managed by the Department of Conservation under the Marine Mammals Protection Act 1978.
Shark interactions are minimal due to the predator nets we have in place around all our farms, Some sharks are protected, and all sharks are covered by our Marine Mammal and Shark Management Plan.
We take all interactions with mammals and seabirds seriously and report any incidents on our website.
Under consideration for relocation. Individual consent conditions on low flow sites, currently under consideration in farm relocation proposal. Voluntary implementation of BMP in 2016 at our two largest high-flow farms. Consent conditions apply across all sites, but precede BMP publication. Voluntary implementation of BMP planned by 2024.
Streamlining Consent Conditions for Best PracticeWe are aiming to gradually streamline numerous site-specific consent conditions in accordance with the BMP Guidelines for Benthic and Water Quality, which were developed
to designate best practice, over and above regulatory compliance. All our farms currently comply with consent conditions, but our low flow farms are located in less suitable environments for best practice salmon farming, limiting the commercial viability of these farms if BMP were implemented. The low flow farms are under consideration for relocation.
2019: BLUE FRONTIERSNEW ZEAL AND KING SALMON | ANNUAL REPORT FY19 4140
FARMING IN BAL ANCEFARMING IN BAL ANCE
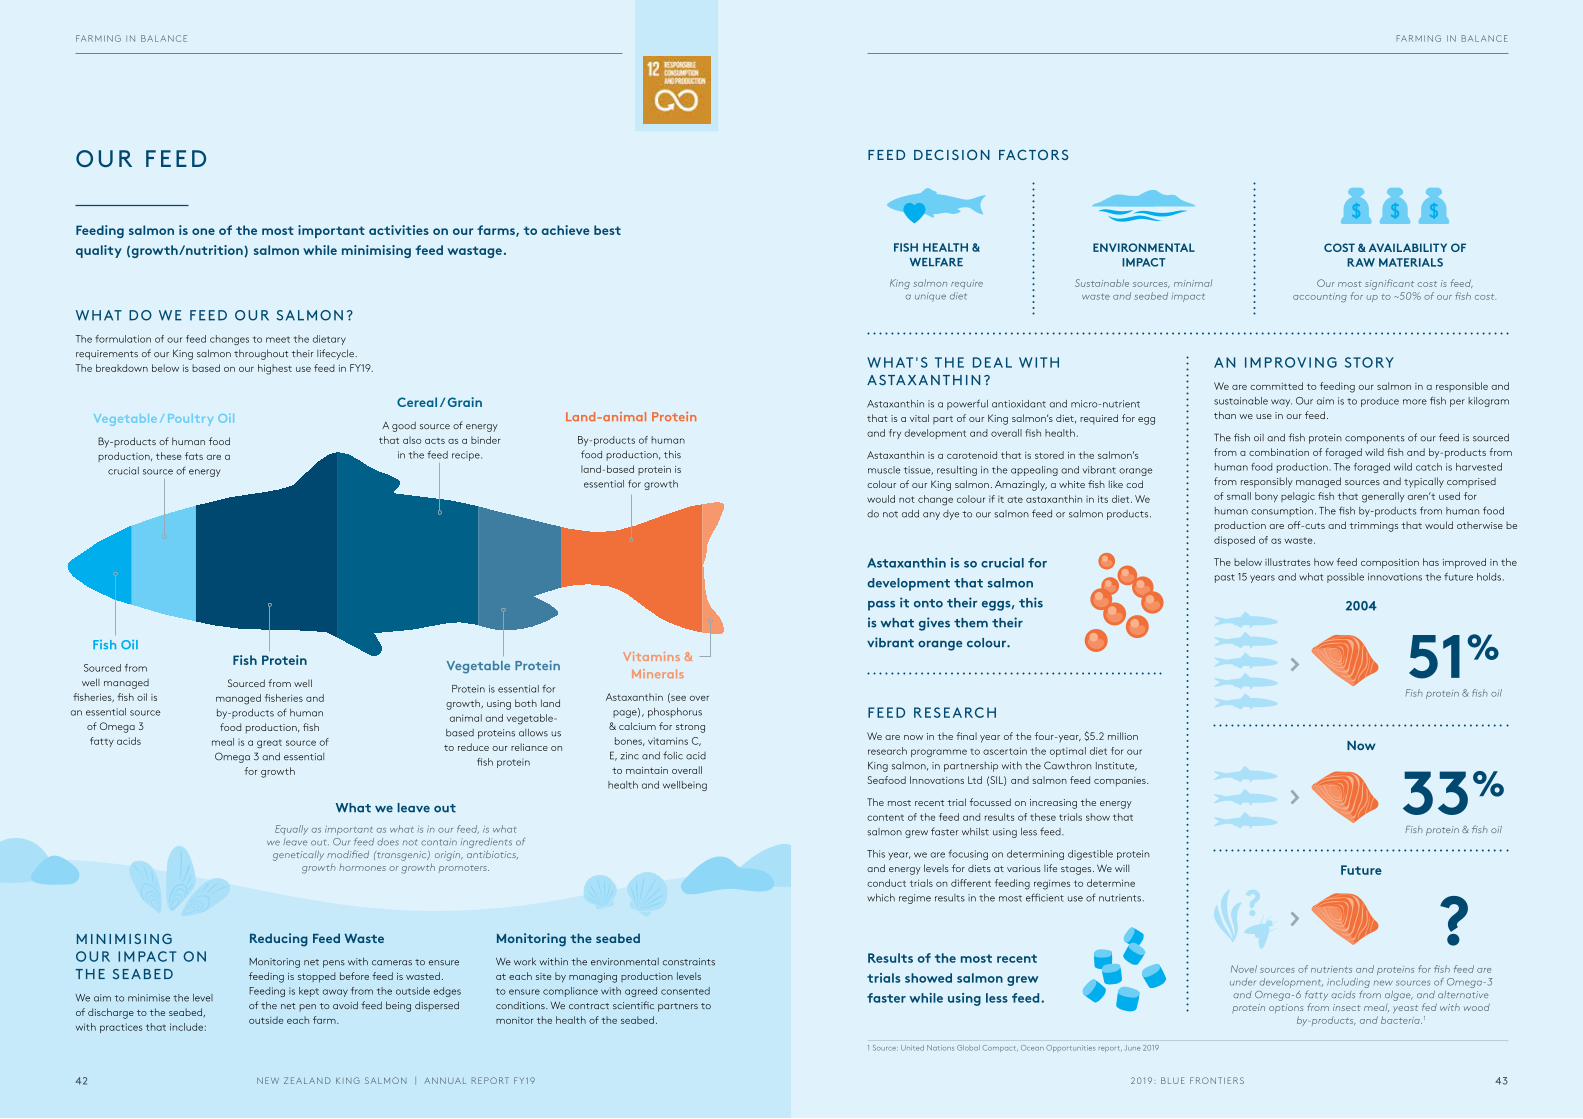
WHAT DO WE FEED OUR SALMON? The formulation of our feed changes to meet the dietary requirements of our King salmon throughout their lifecycle. The breakdown below is based on our highest use feed in FY19.
Feeding salmon is one of the most important activities on our farms, to achieve best quality (growth/nutrition) salmon while minimising feed wastage.
OUR FEED
Fish OilSourced from well managed
fisheries, fish oil is an essential source
of Omega 3 fatty acids
Vegetable / Poultry OilBy-products of human food production, these fats are a
crucial source of energy
Fish ProteinSourced from well
managed fisheries and by-products of human food production, fish
meal is a great source of Omega 3 and essential
for growth
Land-animal ProteinBy-products of human food production, this land-based protein is essential for growth
Vegetable ProteinProtein is essential for
growth, using both land animal and vegetable-
based proteins allows us to reduce our reliance on
fish protein
Cereal / GrainA good source of energy
that also acts as a binder in the feed recipe.
Vitamins & Minerals
Astaxanthin (see over page), phosphorus
& calcium for strong bones, vitamins C,
E, zinc and folic acid to maintain overall
health and wellbeing
Reducing Feed Waste Monitoring net pens with cameras to ensure feeding is stopped before feed is wasted. Feeding is kept away from the outside edges of the net pen to avoid feed being dispersed outside each farm.
MINIMISING OUR IMPACT ON THE SEABEDWe aim to minimise the level of discharge to the seabed, with practices that include:
Monitoring the seabedWe work within the environmental constraints at each site by managing production levels to ensure compliance with agreed consented conditions. We contract scientific partners to monitor the health of the seabed.
What we leave outEqually as important as what is in our feed, is what
we leave out. Our feed does not contain ingredients of genetically modified (transgenic) origin, antibiotics,
growth hormones or growth promoters.
FISH HEALTH & WELFARE
King salmon require a unique diet
ENVIRONMENTAL IMPACT
Sustainable sources, minimal waste and seabed impact
COST & AVAILABILITY OF RAW MATERIALS
Our most significant cost is feed, accounting for up to ~50% of our fish cost.
FEED RESEARCHWe are now in the final year of the four-year, $5.2 million research programme to ascertain the optimal diet for our King salmon, in partnership with the Cawthron Institute, Seafood Innovations Ltd (SIL) and salmon feed companies.
The most recent trial focussed on increasing the energy content of the feed and results of these trials show that salmon grew faster whilst using less feed.
This year, we are focusing on determining digestible protein and energy levels for diets at various life stages. We will conduct trials on different feeding regimes to determine which regime results in the most efficient use of nutrients.
FEED DECISION FACTORS
Novel sources of nutrients and proteins for fish feed are under development, including new sources of Omega-3 and Omega-6 fatty acids from algae, and alternative protein options from insect meal, yeast fed with wood
by-products, and bacteria.1
2004
Now
Future
?
33%Fish protein & fish oil
51%Fish protein & fish oil
1 Source: United Nations Global Compact, Ocean Opportunities report, June 2019
AN IMPROVING STORYWe are committed to feeding our salmon in a responsible and sustainable way. Our aim is to produce more fish per kilogram than we use in our feed.
The fish oil and fish protein components of our feed is sourced from a combination of foraged wild fish and by-products from human food production. The foraged wild catch is harvested from responsibly managed sources and typically comprised of small bony pelagic fish that generally aren’t used for human consumption. The fish by-products from human food production are off-cuts and trimmings that would otherwise be disposed of as waste.
The below illustrates how feed composition has improved in the past 15 years and what possible innovations the future holds.
WHAT'S THE DEAL WITH ASTAXANTHIN?Astaxanthin is a powerful antioxidant and micro-nutrient that is a vital part of our King salmon’s diet, required for egg and fry development and overall fish health.
Astaxanthin is a carotenoid that is stored in the salmon’s muscle tissue, resulting in the appealing and vibrant orange colour of our King salmon. Amazingly, a white fish like cod would not change colour if it ate astaxanthin in its diet. We do not add any dye to our salmon feed or salmon products.
Astaxanthin is so crucial for development that salmon pass it onto their eggs, this is what gives them their vibrant orange colour.
Results of the most recent trials showed salmon grew faster while using less feed.
NEW ZEAL AND KING SALMON | ANNUAL REPORT FY1942
FARMING IN BAL ANCE
2019: BLUE FRONTIERS 43
FARMING IN BAL ANCE
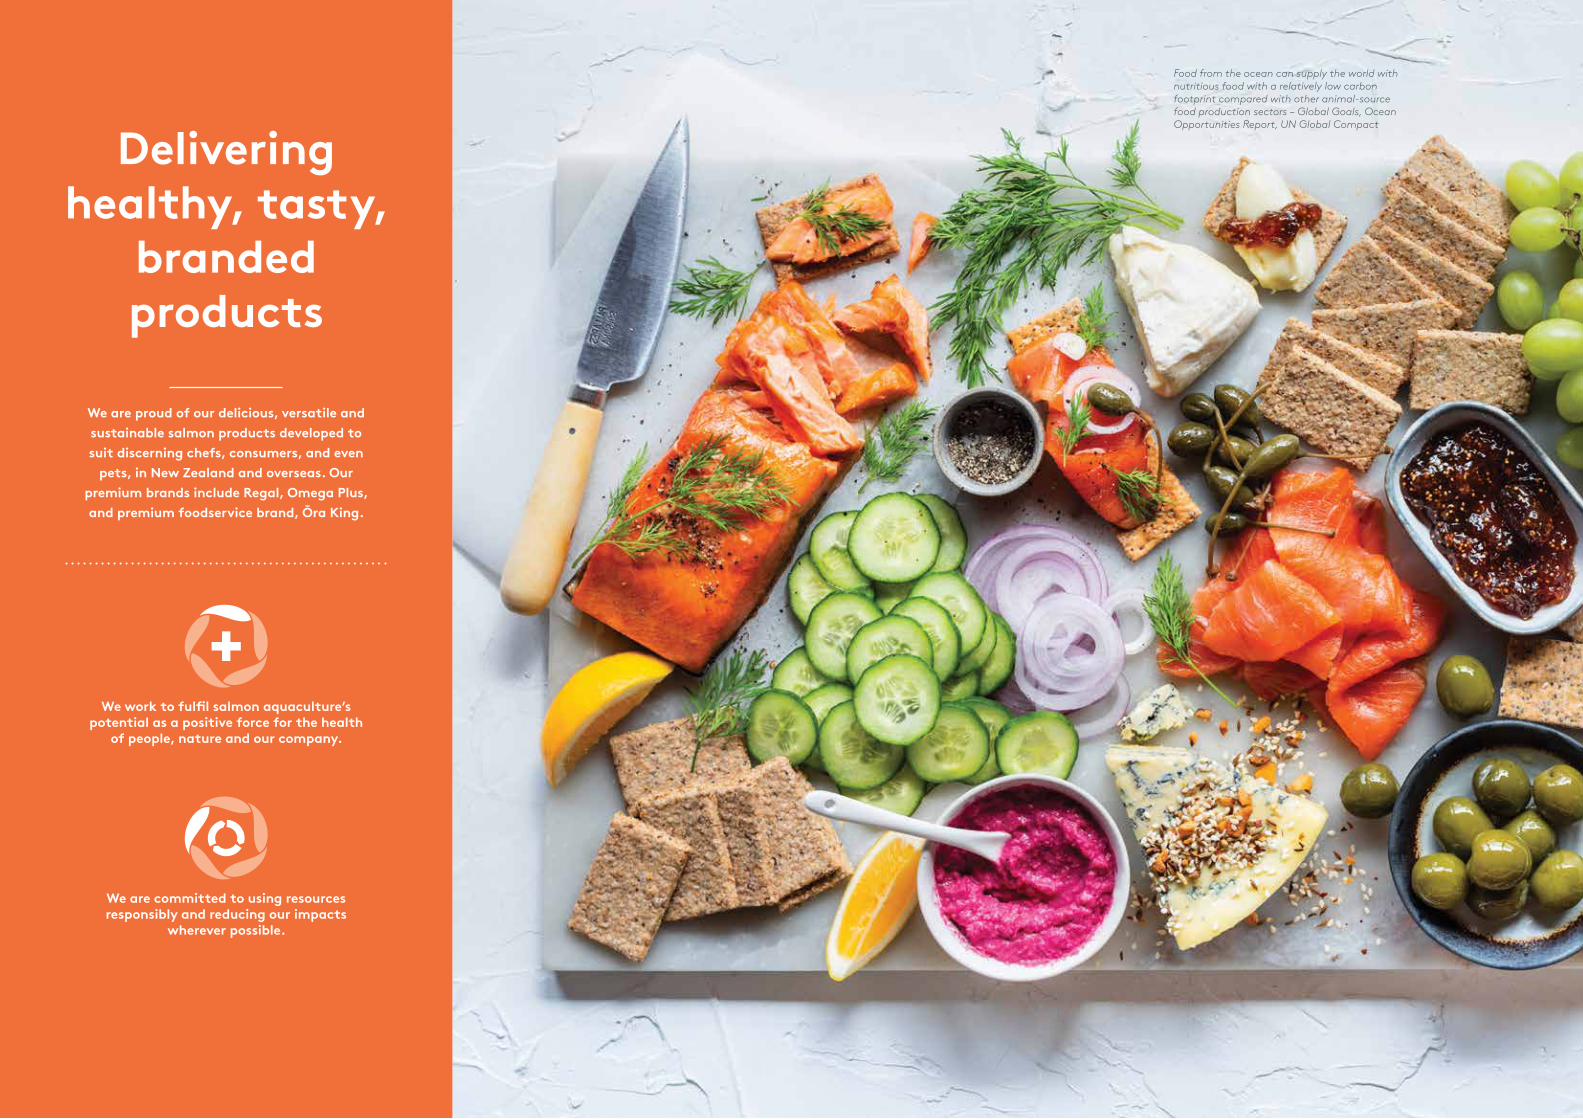
We are proud of our delicious, versatile and sustainable salmon products developed to suit discerning chefs, consumers, and even
pets, in New Zealand and overseas. Our premium brands include Regal, Omega Plus, and premium foodservice brand, Ōra King.
Delivering healthy, tasty,
branded products
We work to fulfil salmon aquaculture’s potential as a positive force for the health
of people, nature and our company.
We are committed to using resources responsibly and reducing our impacts
wherever possible.
Food from the ocean can supply the world with nutritious food with a relatively low carbon footprint compared with other animal-source food production sectors – Global Goals, Ocean Opportunities Report, UN Global Compact
PROCESSING AND FOOD SAFET Y
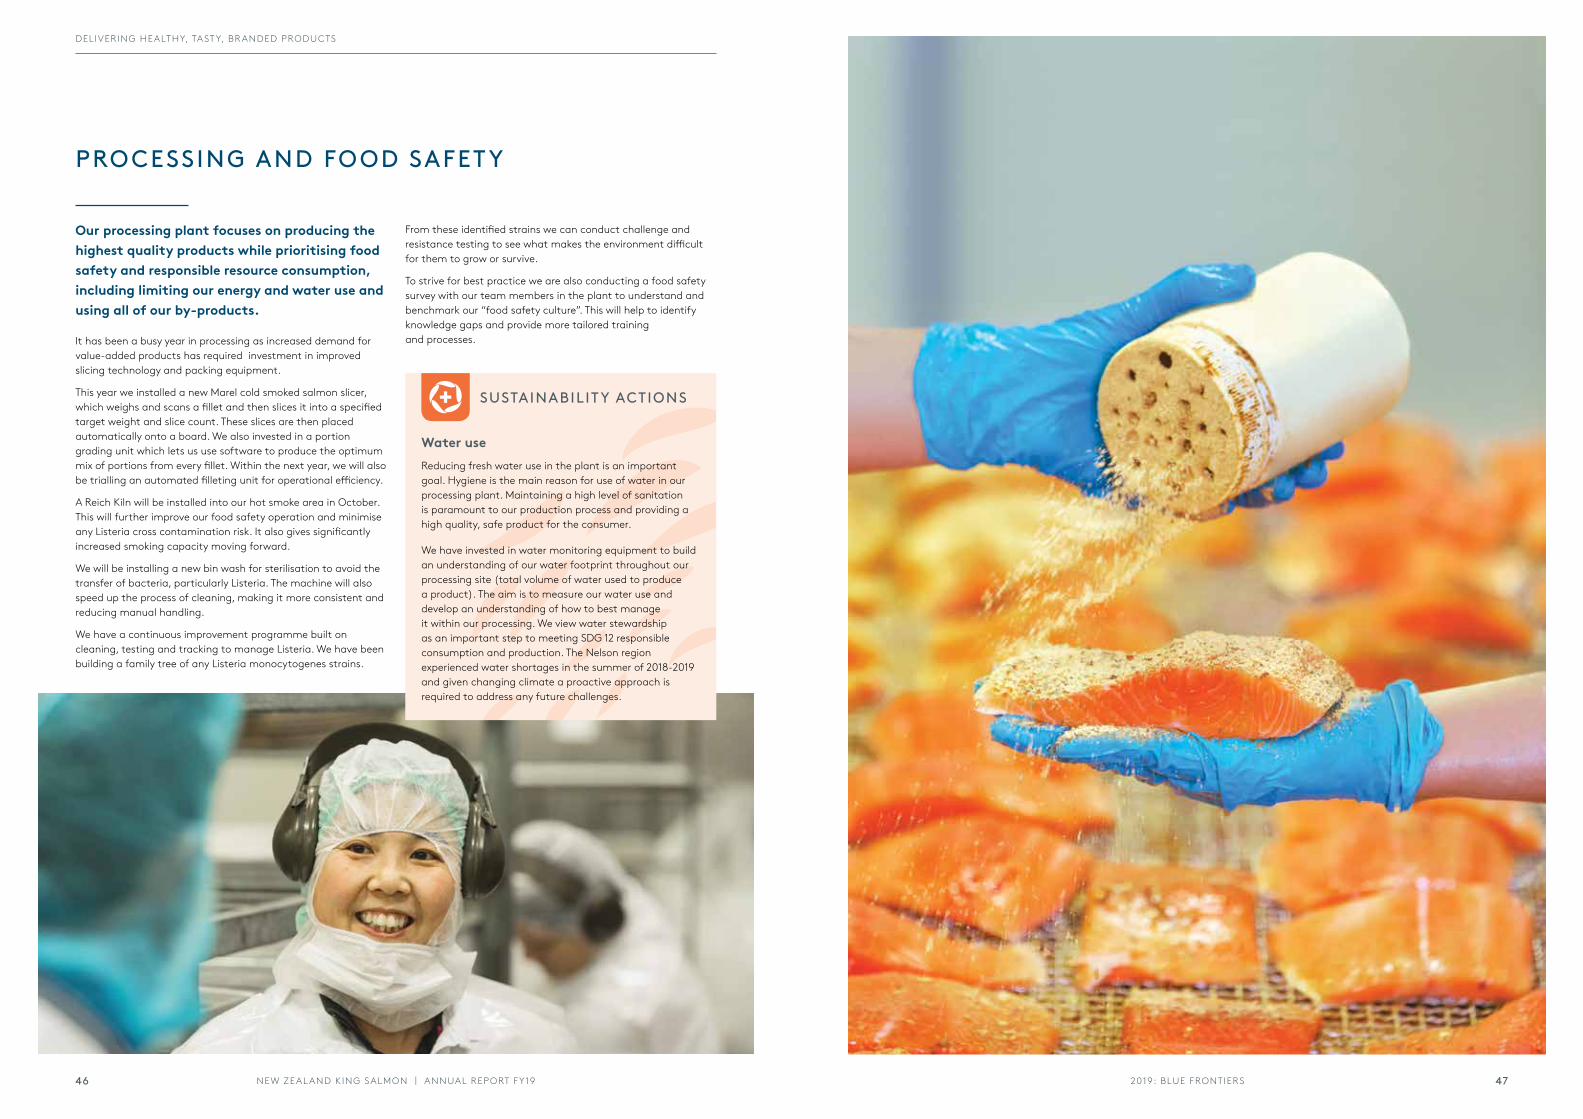
Our processing plant focuses on producing the highest quality products while prioritising food safety and responsible resource consumption, including limiting our energy and water use and using all of our by-products.
It has been a busy year in processing as increased demand for value-added products has required investment in improved slicing technology and packing equipment.
This year we installed a new Marel cold smoked salmon slicer, which weighs and scans a fillet and then slices it into a specified target weight and slice count. These slices are then placed automatically onto a board. We also invested in a portion grading unit which lets us use software to produce the optimum mix of portions from every fillet. Within the next year, we will also be trialling an automated filleting unit for operational efficiency.
A Reich Kiln will be installed into our hot smoke area in October. This will further improve our food safety operation and minimise any Listeria cross contamination risk. It also gives significantly increased smoking capacity moving forward.
We will be installing a new bin wash for sterilisation to avoid the transfer of bacteria, particularly Listeria. The machine will also speed up the process of cleaning, making it more consistent and reducing manual handling.
We have a continuous improvement programme built on cleaning, testing and tracking to manage Listeria. We have been building a family tree of any Listeria monocytogenes strains.
Water use Reducing fresh water use in the plant is an important goal. Hygiene is the main reason for use of water in our processing plant. Maintaining a high level of sanitation is paramount to our production process and providing a high quality, safe product for the consumer.
We have invested in water monitoring equipment to build an understanding of our water footprint throughout our processing site (total volume of water used to produce a product). The aim is to measure our water use and develop an understanding of how to best manage it within our processing. We view water stewardship as an important step to meeting SDG 12 responsible consumption and production. The Nelson region experienced water shortages in the summer of 2018-2019 and given changing climate a proactive approach is required to address any future challenges.
SUSTAINABILIT Y ACTIONS
From these identified strains we can conduct challenge and resistance testing to see what makes the environment difficult for them to grow or survive.
To strive for best practice we are also conducting a food safety survey with our team members in the plant to understand and benchmark our “food safety culture”. This will help to identify knowledge gaps and provide more tailored training and processes.
472019: BLUE FRONTIERSNEW ZEAL AND KING SALMON | ANNUAL REPORT FY1946
DELIVERING HEALTHY, TAST Y, BR ANDED PRODUCTS
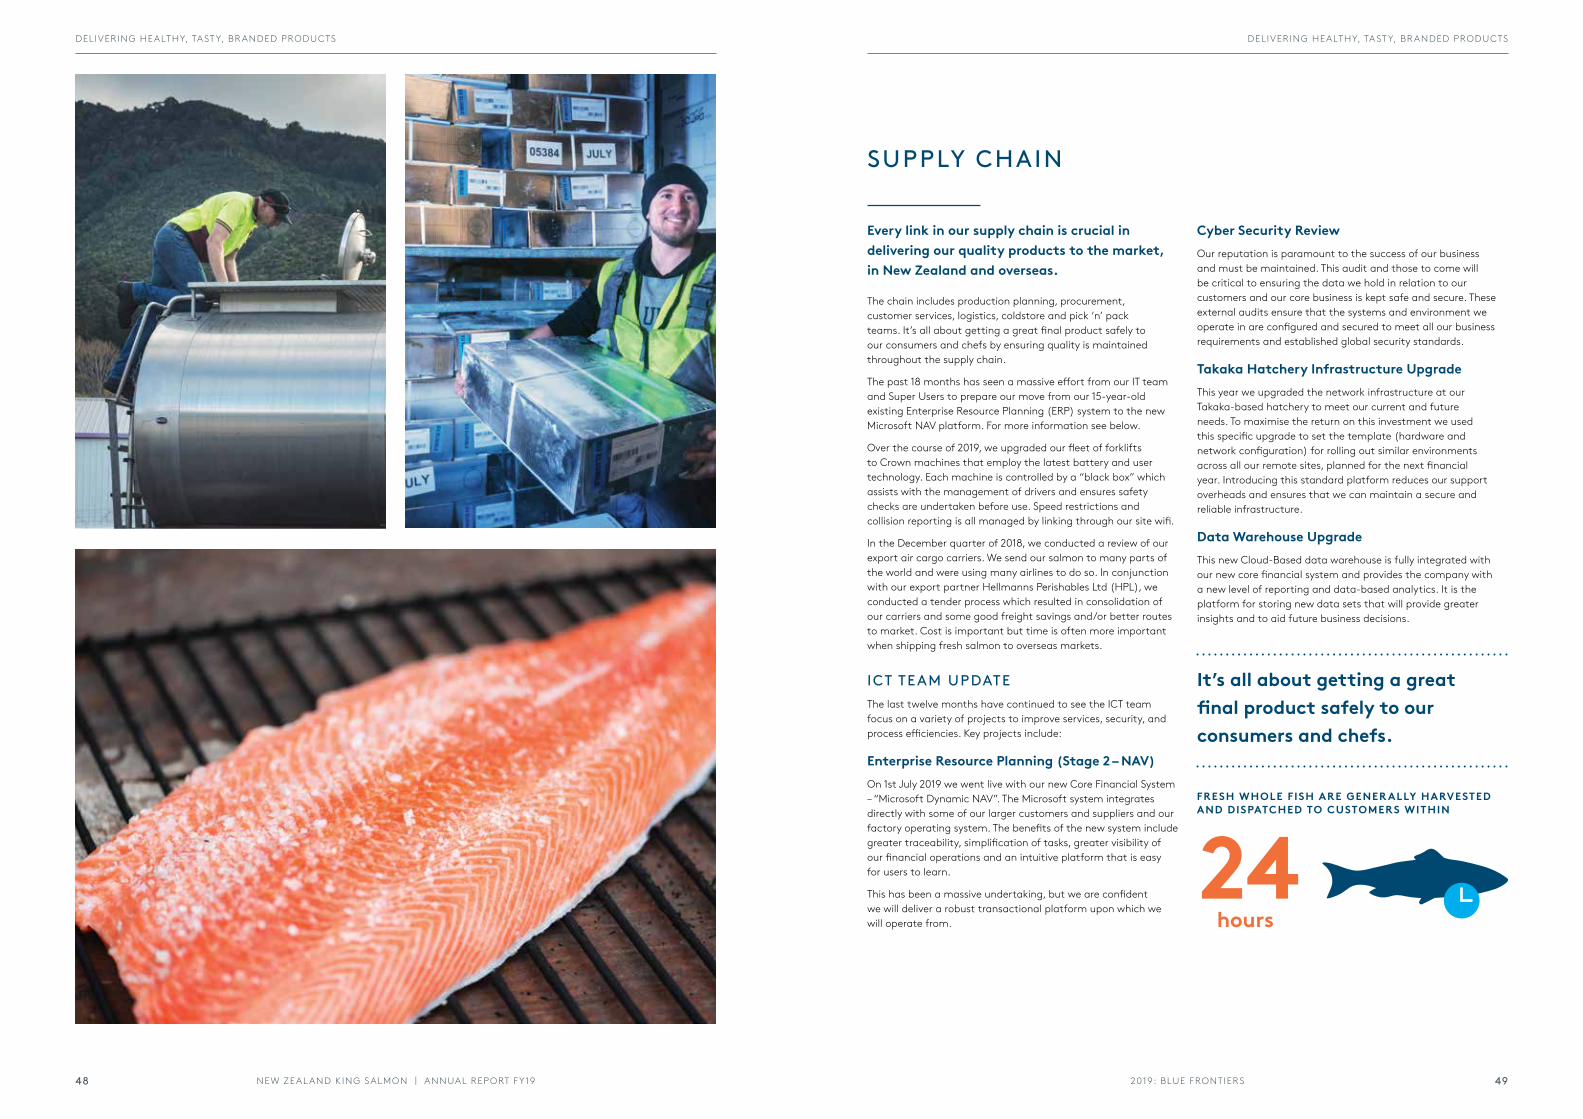
Every link in our supply chain is crucial in delivering our quality products to the market, in New Zealand and overseas.
The chain includes production planning, procurement, customer services, logistics, coldstore and pick ‘n’ pack teams. It’s all about getting a great final product safely to our consumers and chefs by ensuring quality is maintained throughout the supply chain.
The past 18 months has seen a massive effort from our IT team and Super Users to prepare our move from our 15-year-old existing Enterprise Resource Planning (ERP) system to the new Microsoft NAV platform. For more information see below.
Over the course of 2019, we upgraded our fleet of forklifts to Crown machines that employ the latest battery and user technology. Each machine is controlled by a “black box” which assists with the management of drivers and ensures safety checks are undertaken before use. Speed restrictions and collision reporting is all managed by linking through our site wifi.
In the December quarter of 2018, we conducted a review of our export air cargo carriers. We send our salmon to many parts of the world and were using many airlines to do so. In conjunction with our export partner Hellmanns Perishables Ltd (HPL), we conducted a tender process which resulted in consolidation of our carriers and some good freight savings and/or better routes to market. Cost is important but time is often more important when shipping fresh salmon to overseas markets.
ICT TEAM UPDATEThe last twelve months have continued to see the ICT team focus on a variety of projects to improve services, security, and process efficiencies. Key projects include:
Enterprise Resource Planning (Stage 2 – NAV)On 1st July 2019 we went live with our new Core Financial System – “Microsoft Dynamic NAV”. The Microsoft system integrates directly with some of our larger customers and suppliers and our factory operating system. The benefits of the new system include greater traceability, simplification of tasks, greater visibility of our financial operations and an intuitive platform that is easy for users to learn.
This has been a massive undertaking, but we are confident we will deliver a robust transactional platform upon which we will operate from.
SUPPLY CHAIN
It’s all about getting a great final product safely to our consumers and chefs.
Cyber Security ReviewOur reputation is paramount to the success of our business and must be maintained. This audit and those to come will be critical to ensuring the data we hold in relation to our customers and our core business is kept safe and secure. These external audits ensure that the systems and environment we operate in are configured and secured to meet all our business requirements and established global security standards.
Takaka Hatchery Infrastructure UpgradeThis year we upgraded the network infrastructure at our Takaka-based hatchery to meet our current and future needs. To maximise the return on this investment we used this specific upgrade to set the template (hardware and network configuration) for rolling out similar environments across all our remote sites, planned for the next financial year. Introducing this standard platform reduces our support overheads and ensures that we can maintain a secure and reliable infrastructure.
Data Warehouse UpgradeThis new Cloud-Based data warehouse is fully integrated with our new core financial system and provides the company with a new level of reporting and data-based analytics. It is the platform for storing new data sets that will provide greater insights and to aid future business decisions.
FRESH WHOLE FISH ARE GENER ALLY HARVESTED AND DISPATCHED TO CUSTOMERS WITHIN
24hours
2019: BLUE FRONTIERSNEW ZEAL AND KING SALMON | ANNUAL REPORT FY19 4948
DELIVERING HEALTHY, TAST Y, BR ANDED PRODUCTS DELIVERING HEALTHY, TAST Y, BR ANDED PRODUCTS
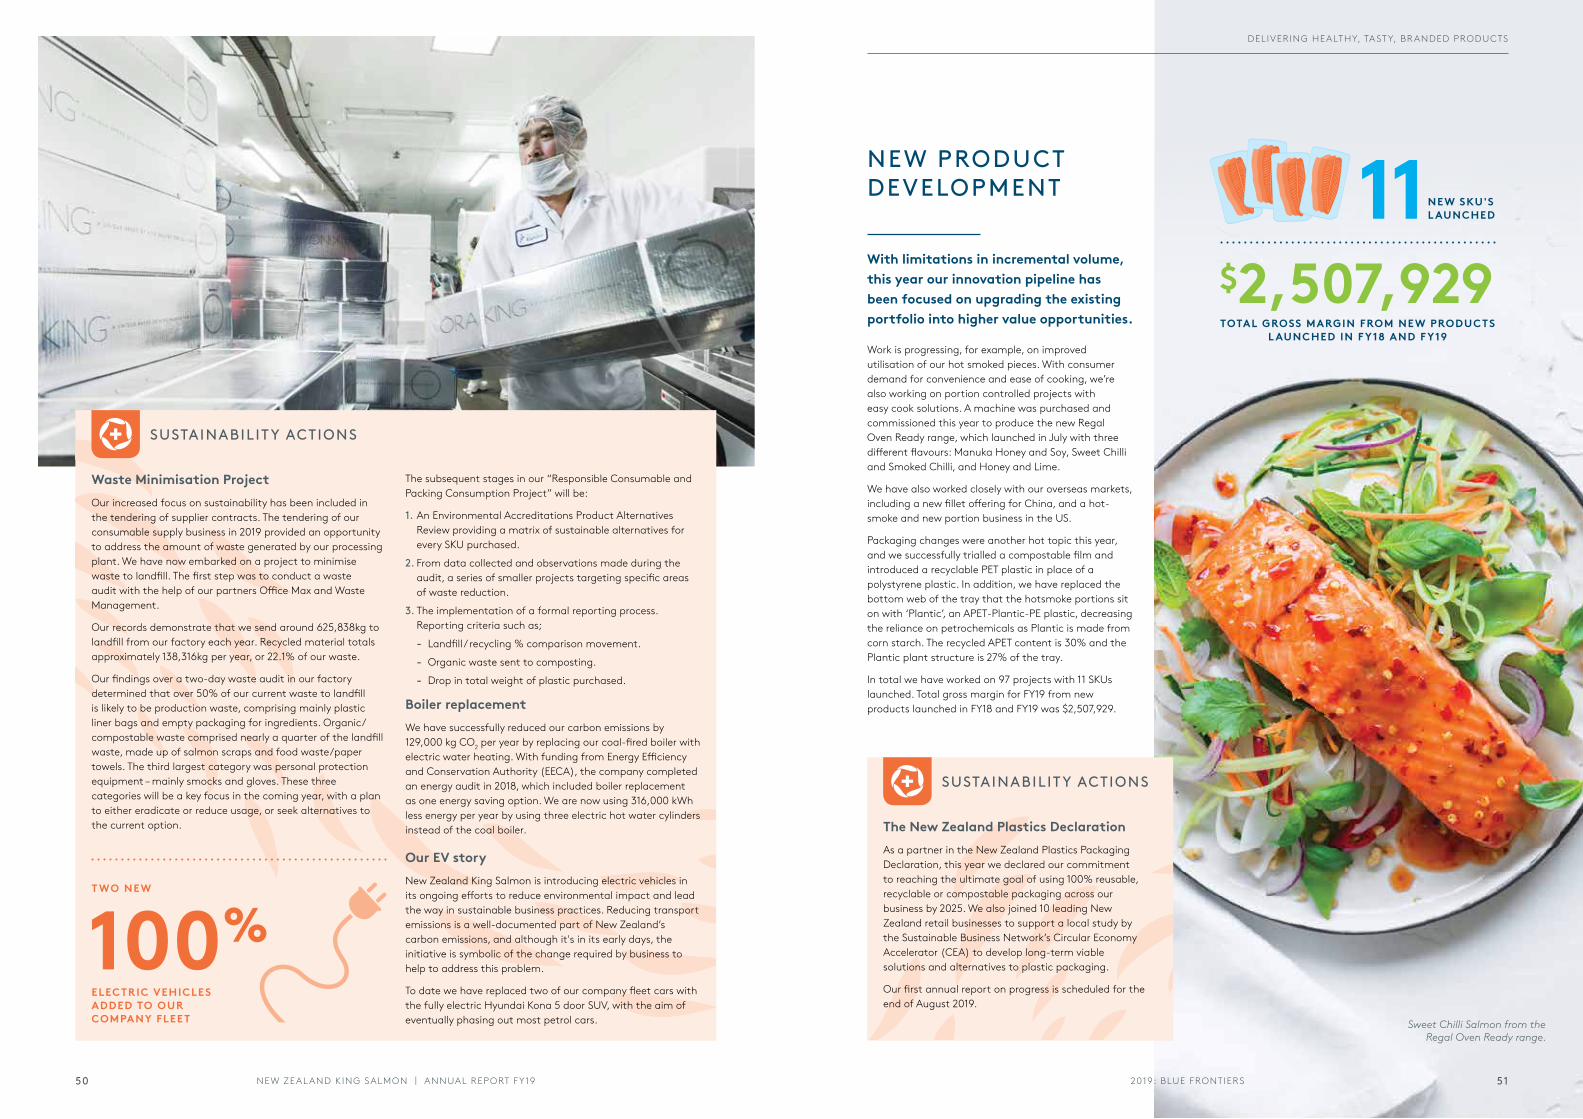
Waste Minimisation ProjectOur increased focus on sustainability has been included in the tendering of supplier contracts. The tendering of our consumable supply business in 2019 provided an opportunity to address the amount of waste generated by our processing plant. We have now embarked on a project to minimise waste to landfill. The first step was to conduct a waste audit with the help of our partners Office Max and Waste Management.
Our records demonstrate that we send around 625,838kg to landfill from our factory each year. Recycled material totals approximately 138,316kg per year, or 22.1% of our waste.
Our findings over a two-day waste audit in our factory determined that over 50% of our current waste to landfill is likely to be production waste, comprising mainly plastic liner bags and empty packaging for ingredients. Organic/compostable waste comprised nearly a quarter of the landfill waste, made up of salmon scraps and food waste/paper towels. The third largest category was personal protection equipment – mainly smocks and gloves. These three categories will be a key focus in the coming year, with a plan to either eradicate or reduce usage, or seek alternatives to the current option.
SUSTAINABILIT Y ACTIONS
The subsequent stages in our “Responsible Consumable and Packing Consumption Project” will be:
1. An Environmental Accreditations Product Alternatives Review providing a matrix of sustainable alternatives for every SKU purchased.
2. From data collected and observations made during the audit, a series of smaller projects targeting specific areas of waste reduction.
3. The implementation of a formal reporting process. Reporting criteria such as;
- Landfill / recycling % comparison movement.
- Organic waste sent to composting.
- Drop in total weight of plastic purchased.
Boiler replacementWe have successfully reduced our carbon emissions by 129,000 kg CO2 per year by replacing our coal-fired boiler with electric water heating. With funding from Energy Efficiency and Conservation Authority (EECA), the company completed an energy audit in 2018, which included boiler replacement as one energy saving option. We are now using 316,000 kWh less energy per year by using three electric hot water cylinders instead of the coal boiler.
Our EV storyNew Zealand King Salmon is introducing electric vehicles in its ongoing efforts to reduce environmental impact and lead the way in sustainable business practices. Reducing transport emissions is a well-documented part of New Zealand’s carbon emissions, and although it's in its early days, the initiative is symbolic of the change required by business to help to address this problem.
To date we have replaced two of our company fleet cars with the fully electric Hyundai Kona 5 door SUV, with the aim of eventually phasing out most petrol cars.
100%ELECTRIC VEHICLES ADDED TO OUR COMPANY FLEET
T WO NEW
Sweet Chilli Salmon from the Regal Oven Ready range.
With limitations in incremental volume, this year our innovation pipeline has been focused on upgrading the existing portfolio into higher value opportunities.
Work is progressing, for example, on improved utilisation of our hot smoked pieces. With consumer demand for convenience and ease of cooking, we’re also working on portion controlled projects with easy cook solutions. A machine was purchased and commissioned this year to produce the new Regal Oven Ready range, which launched in July with three different flavours: Manuka Honey and Soy, Sweet Chilli and Smoked Chilli, and Honey and Lime.
We have also worked closely with our overseas markets, including a new fillet offering for China, and a hot-smoke and new portion business in the US.
Packaging changes were another hot topic this year, and we successfully trialled a compostable film and introduced a recyclable PET plastic in place of a polystyrene plastic. In addition, we have replaced the bottom web of the tray that the hotsmoke portions sit on with ‘Plantic’, an APET-Plantic-PE plastic, decreasing the reliance on petrochemicals as Plantic is made from corn starch. The recycled APET content is 30% and the Plantic plant structure is 27% of the tray.
In total we have worked on 97 projects with 11 SKUs launched. Total gross margin for FY19 from new products launched in FY18 and FY19 was $2,507,929.
NEW PRODUCT DEVELOPMENT 11NEW SKU'S
L AUNCHED
$2,507,929TOTAL GROSS MARGIN FROM NEW PRODUCTS
L AUNCHED IN F Y18 AND F Y19
SUSTAINABILIT Y ACTIONS
The New Zealand Plastics Declaration As a partner in the New Zealand Plastics Packaging Declaration, this year we declared our commitment to reaching the ultimate goal of using 100% reusable, recyclable or compostable packaging across our business by 2025. We also joined 10 leading New Zealand retail businesses to support a local study by the Sustainable Business Network’s Circular Economy Accelerator (CEA) to develop long-term viable solutions and alternatives to plastic packaging.
Our first annual report on progress is scheduled for the end of August 2019.
2019: BLUE FRONTIERS 5150 NEW ZEAL AND KING SALMON | ANNUAL REPORT FY19
DELIVERING HEALTHY, TAST Y, BR ANDED PRODUCTS
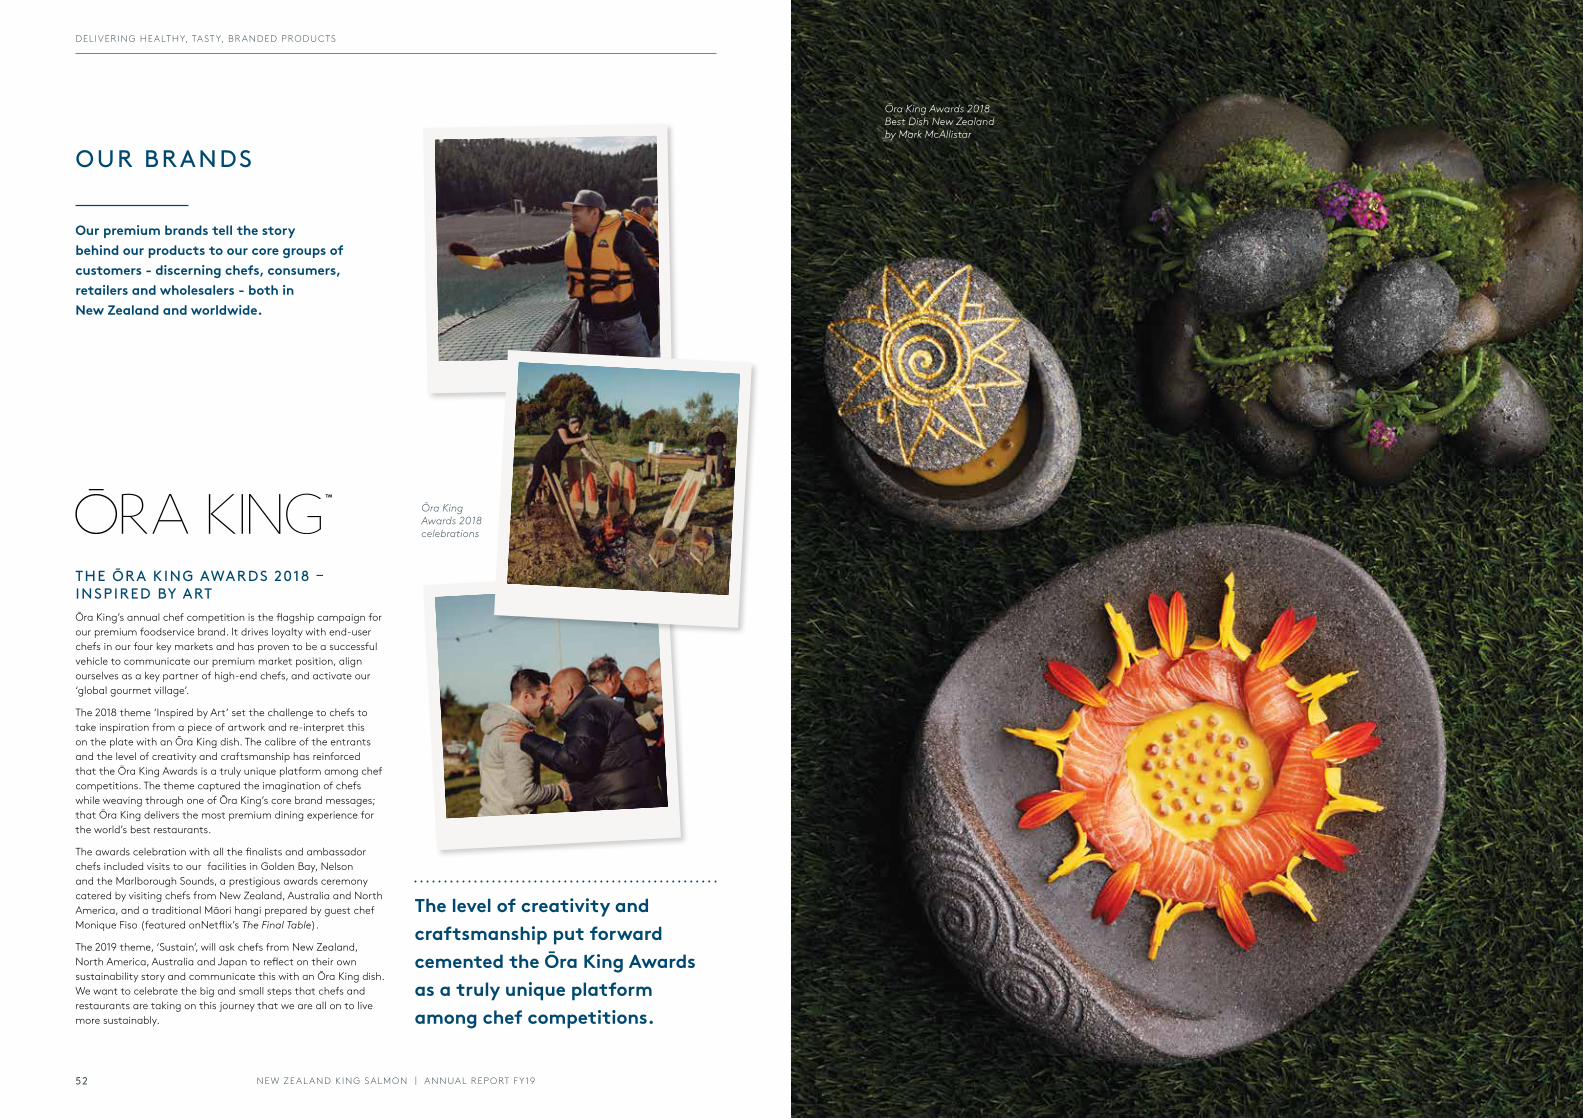
THE ŌRA KING AWARDS 2018 – INSPIRED BY ARTŌra King’s annual chef competition is the flagship campaign for our premium foodservice brand. It drives loyalty with end-user chefs in our four key markets and has proven to be a successful vehicle to communicate our premium market position, align ourselves as a key partner of high-end chefs, and activate our ‘global gourmet village’.
The 2018 theme ‘Inspired by Art’ set the challenge to chefs to take inspiration from a piece of artwork and re-interpret this on the plate with an Ōra King dish. The calibre of the entrants and the level of creativity and craftsmanship has reinforced that the Ōra King Awards is a truly unique platform among chef competitions. The theme captured the imagination of chefs while weaving through one of Ōra King’s core brand messages; that Ōra King delivers the most premium dining experience for the world’s best restaurants.
The awards celebration with all the finalists and ambassador chefs included visits to our facilities in Golden Bay, Nelson and the Marlborough Sounds, a prestigious awards ceremony catered by visiting chefs from New Zealand, Australia and North America, and a traditional Māori hangi prepared by guest chef Monique Fiso (featured onNetflix’s The Final Table).
The 2019 theme, ‘Sustain’, will ask chefs from New Zealand, North America, Australia and Japan to reflect on their own sustainability story and communicate this with an Ōra King dish. We want to celebrate the big and small steps that chefs and restaurants are taking on this journey that we are all on to live more sustainably.
Ōra King Awards 2018 celebrations
The level of creativity and craftsmanship put forward cemented the Ōra King Awards as a truly unique platform among chef competitions.
Our premium brands tell the story behind our products to our core groups of customers - discerning chefs, consumers, retailers and wholesalers - both in New Zealand and worldwide.
OUR BRANDS
Ōra King Awards 2018 Best Dish New Zealand by Mark McAllistar
NEW ZEAL AND KING SALMON | ANNUAL REPORT FY1952
DELIVERING HEALTHY, TAST Y, BR ANDED PRODUCTS
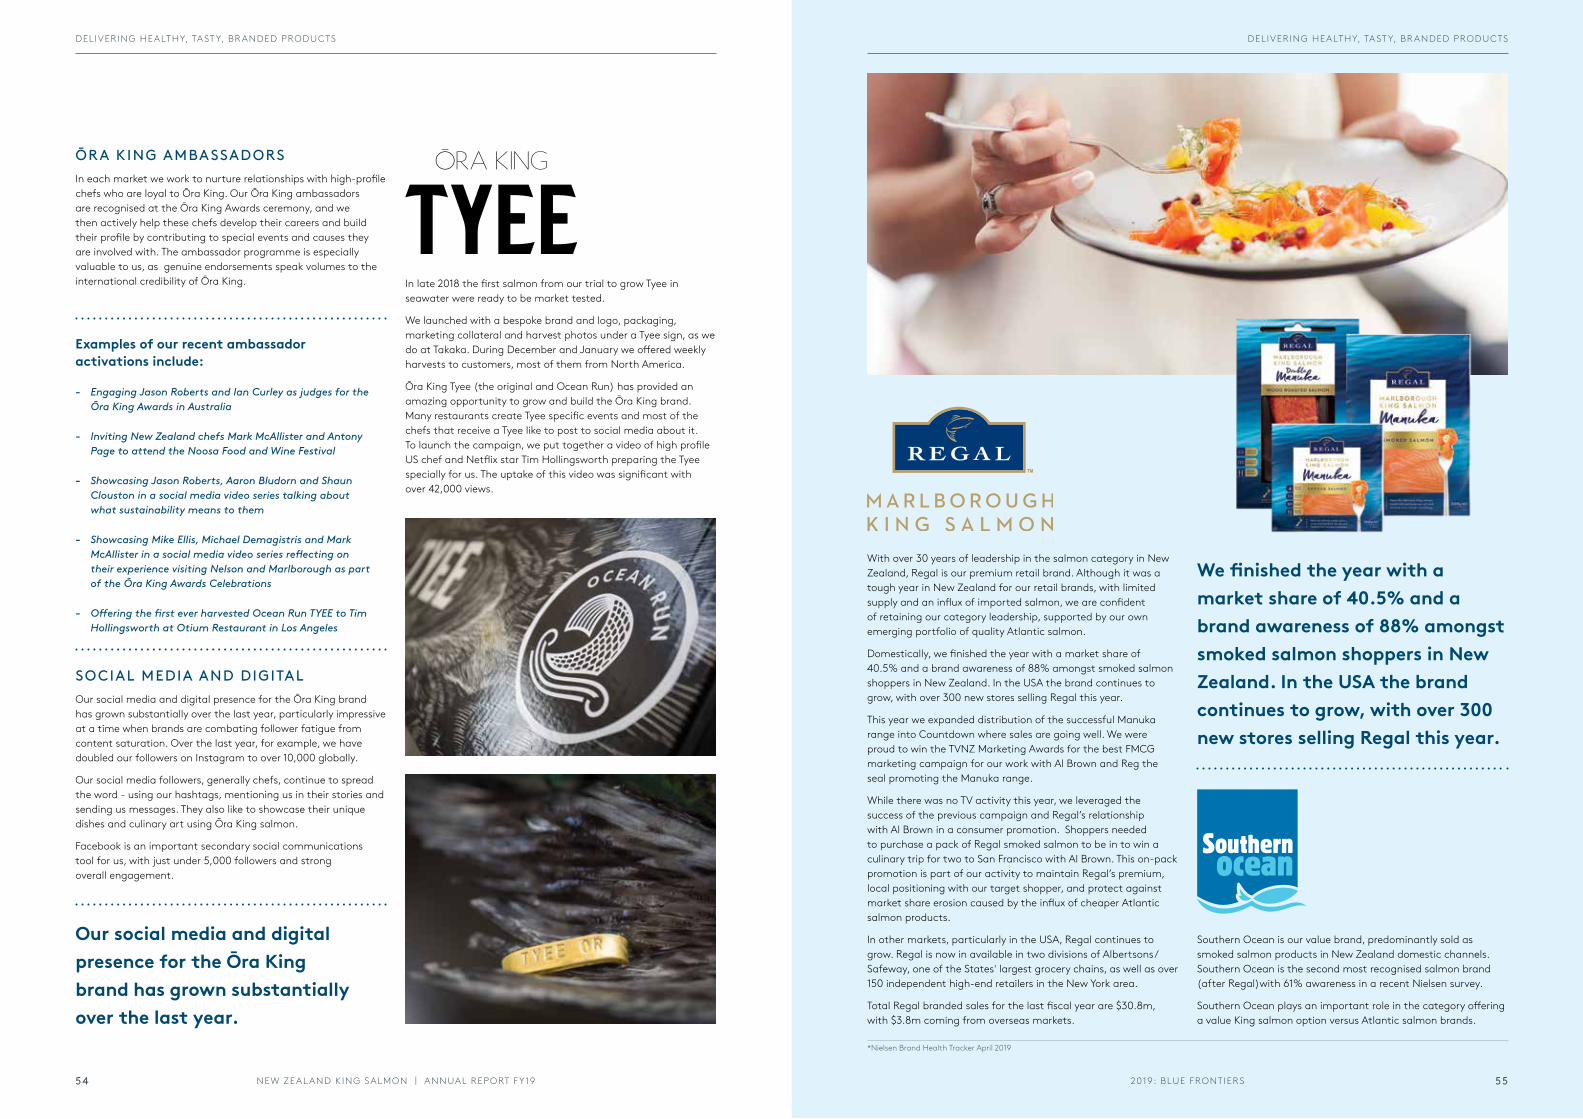
Examples of our recent ambassador activations include:
- Engaging Jason Roberts and Ian Curley as judges for the Ōra King Awards in Australia
- Inviting New Zealand chefs Mark McAllister and Antony Page to attend the Noosa Food and Wine Festival
- Showcasing Jason Roberts, Aaron Bludorn and Shaun Clouston in a social media video series talking about what sustainability means to them
- Showcasing Mike Ellis, Michael Demagistris and Mark McAllister in a social media video series reflecting on their experience visiting Nelson and Marlborough as part of the Ōra King Awards Celebrations
- Offering the first ever harvested Ocean Run TYEE to Tim Hollingsworth at Otium Restaurant in Los Angeles
ŌRA KING AMBASSADORSIn each market we work to nurture relationships with high-profile chefs who are loyal to Ōra King. Our Ōra King ambassadors are recognised at the Ōra King Awards ceremony, and we then actively help these chefs develop their careers and build their profile by contributing to special events and causes they are involved with. The ambassador programme is especially valuable to us, as genuine endorsements speak volumes to the international credibility of Ōra King.
SOCIAL MEDIA AND DIGITALOur social media and digital presence for the Ōra King brand has grown substantially over the last year, particularly impressive at a time when brands are combating follower fatigue from content saturation. Over the last year, for example, we have doubled our followers on Instagram to over 10,000 globally.
Our social media followers, generally chefs, continue to spread the word - using our hashtags, mentioning us in their stories and sending us messages. They also like to showcase their unique dishes and culinary art using Ōra King salmon.
Facebook is an important secondary social communications tool for us, with just under 5,000 followers and strong overall engagement.
In late 2018 the first salmon from our trial to grow Tyee in seawater were ready to be market tested.
We launched with a bespoke brand and logo, packaging, marketing collateral and harvest photos under a Tyee sign, as we do at Takaka. During December and January we offered weekly harvests to customers, most of them from North America.
Ōra King Tyee (the original and Ocean Run) has provided an amazing opportunity to grow and build the Ōra King brand. Many restaurants create Tyee specific events and most of the chefs that receive a Tyee like to post to social media about it. To launch the campaign, we put together a video of high profile US chef and Netflix star Tim Hollingsworth preparing the Tyee specially for us. The uptake of this video was significant with over 42,000 views.
Our social media and digital presence for the Ōra King brand has grown substantially over the last year.
With over 30 years of leadership in the salmon category in New Zealand, Regal is our premium retail brand. Although it was a tough year in New Zealand for our retail brands, with limited supply and an influx of imported salmon, we are confident of retaining our category leadership, supported by our own emerging portfolio of quality Atlantic salmon.
Domestically, we finished the year with a market share of 40.5% and a brand awareness of 88% amongst smoked salmon shoppers in New Zealand. In the USA the brand continues to grow, with over 300 new stores selling Regal this year.
This year we expanded distribution of the successful Manuka range into Countdown where sales are going well. We were proud to win the TVNZ Marketing Awards for the best FMCG marketing campaign for our work with Al Brown and Reg the seal promoting the Manuka range.
While there was no TV activity this year, we leveraged the success of the previous campaign and Regal’s relationship with Al Brown in a consumer promotion. Shoppers needed to purchase a pack of Regal smoked salmon to be in to win a culinary trip for two to San Francisco with Al Brown. This on-pack promotion is part of our activity to maintain Regal’s premium, local positioning with our target shopper, and protect against market share erosion caused by the influx of cheaper Atlantic salmon products.
In other markets, particularly in the USA, Regal continues to grow. Regal is now in available in two divisions of Albertsons/Safeway, one of the States' largest grocery chains, as well as over 150 independent high-end retailers in the New York area.
Total Regal branded sales for the last fiscal year are $30.8m, with $3.8m coming from overseas markets.
Southern Ocean is our value brand, predominantly sold as smoked salmon products in New Zealand domestic channels. Southern Ocean is the second most recognised salmon brand (after Regal)with 61% awareness in a recent Nielsen survey.
Southern Ocean plays an important role in the category offering a value King salmon option versus Atlantic salmon brands.
We finished the year with a market share of 40.5% and a brand awareness of 88% amongst smoked salmon shoppers in New Zealand. In the USA the brand continues to grow, with over 300 new stores selling Regal this year.
*Nielsen Brand Health Tracker April 2019
2019: BLUE FRONTIERSNEW ZEAL AND KING SALMON | ANNUAL REPORT FY19 5554
DELIVERING HEALTHY, TAST Y, BR ANDED PRODUCTS DELIVERING HEALTHY, TAST Y, BR ANDED PRODUCTS
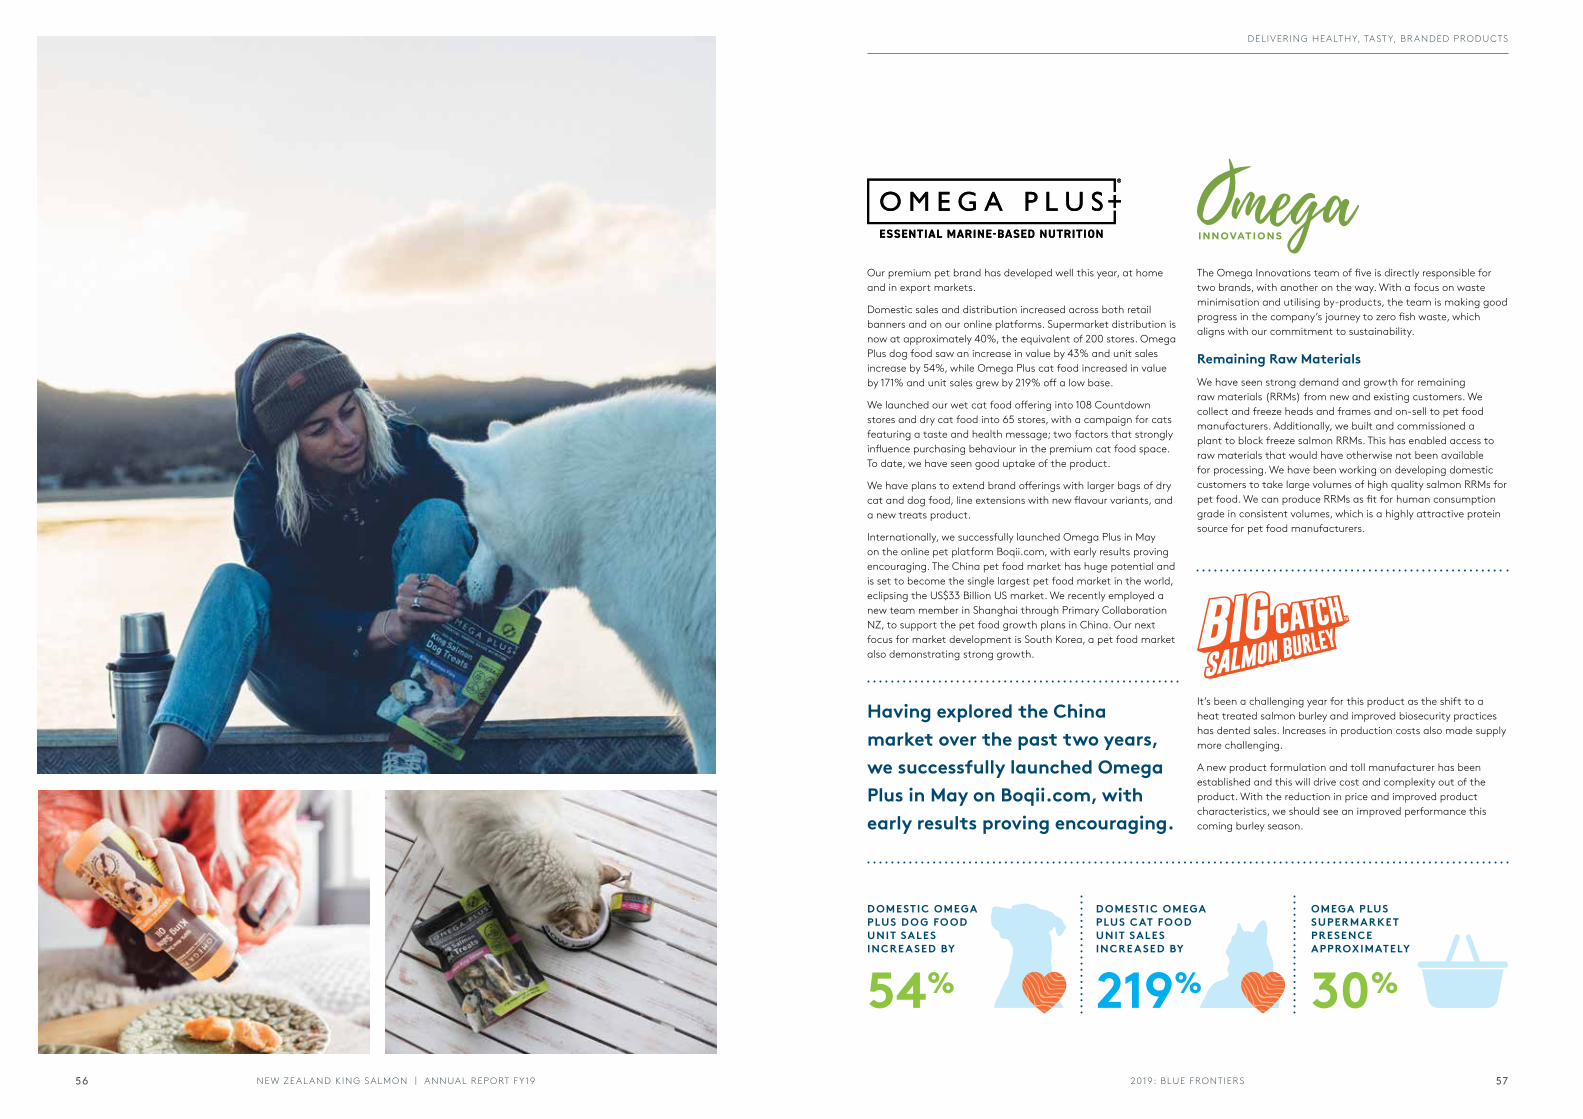
Our premium pet brand has developed well this year, at home and in export markets.
Domestic sales and distribution increased across both retail banners and on our online platforms. Supermarket distribution is now at approximately 40%, the equivalent of 200 stores. Omega Plus dog food saw an increase in value by 43% and unit sales increase by 54%, while Omega Plus cat food increased in value by 171% and unit sales grew by 219% off a low base.
We launched our wet cat food offering into 108 Countdown stores and dry cat food into 65 stores, with a campaign for cats featuring a taste and health message; two factors that strongly influence purchasing behaviour in the premium cat food space. To date, we have seen good uptake of the product.
We have plans to extend brand offerings with larger bags of dry cat and dog food, line extensions with new flavour variants, and a new treats product.
Internationally, we successfully launched Omega Plus in May on the online pet platform Boqii.com, with early results proving encouraging. The China pet food market has huge potential and is set to become the single largest pet food market in the world, eclipsing the US$33 Billion US market. We recently employed a new team member in Shanghai through Primary Collaboration NZ, to support the pet food growth plans in China. Our next focus for market development is South Korea, a pet food market also demonstrating strong growth.
The Omega Innovations team of five is directly responsible for two brands, with another on the way. With a focus on waste minimisation and utilising by-products, the team is making good progress in the company’s journey to zero fish waste, which aligns with our commitment to sustainability.
Remaining Raw MaterialsWe have seen strong demand and growth for remaining raw materials (RRMs) from new and existing customers. We collect and freeze heads and frames and on-sell to pet food manufacturers. Additionally, we built and commissioned a plant to block freeze salmon RRMs. This has enabled access to raw materials that would have otherwise not been available for processing. We have been working on developing domestic customers to take large volumes of high quality salmon RRMs for pet food. We can produce RRMs as fit for human consumption grade in consistent volumes, which is a highly attractive protein source for pet food manufacturers.
D OMESTIC OMEGA PLUS D O G FO OD UNIT SALES INCRE A SED BY
D OMESTIC OMEGA PLUS CAT FO OD UNIT SALES INCRE A SED BY
54% 219%
It’s been a challenging year for this product as the shift to a heat treated salmon burley and improved biosecurity practices has dented sales. Increases in production costs also made supply more challenging.
A new product formulation and toll manufacturer has been established and this will drive cost and complexity out of the product. With the reduction in price and improved product characteristics, we should see an improved performance this coming burley season.
Having explored the China market over the past two years, we successfully launched Omega Plus in May on Boqii.com, with early results proving encouraging.
30%
OMEGA PLUS SUPERMARKET PRESENCE APPROXIMATELY
2019: BLUE FRONTIERS 5756 NEW ZEAL AND KING SALMON | ANNUAL REPORT FY19
DELIVERING HEALTHY, TAST Y, BR ANDED PRODUCTS
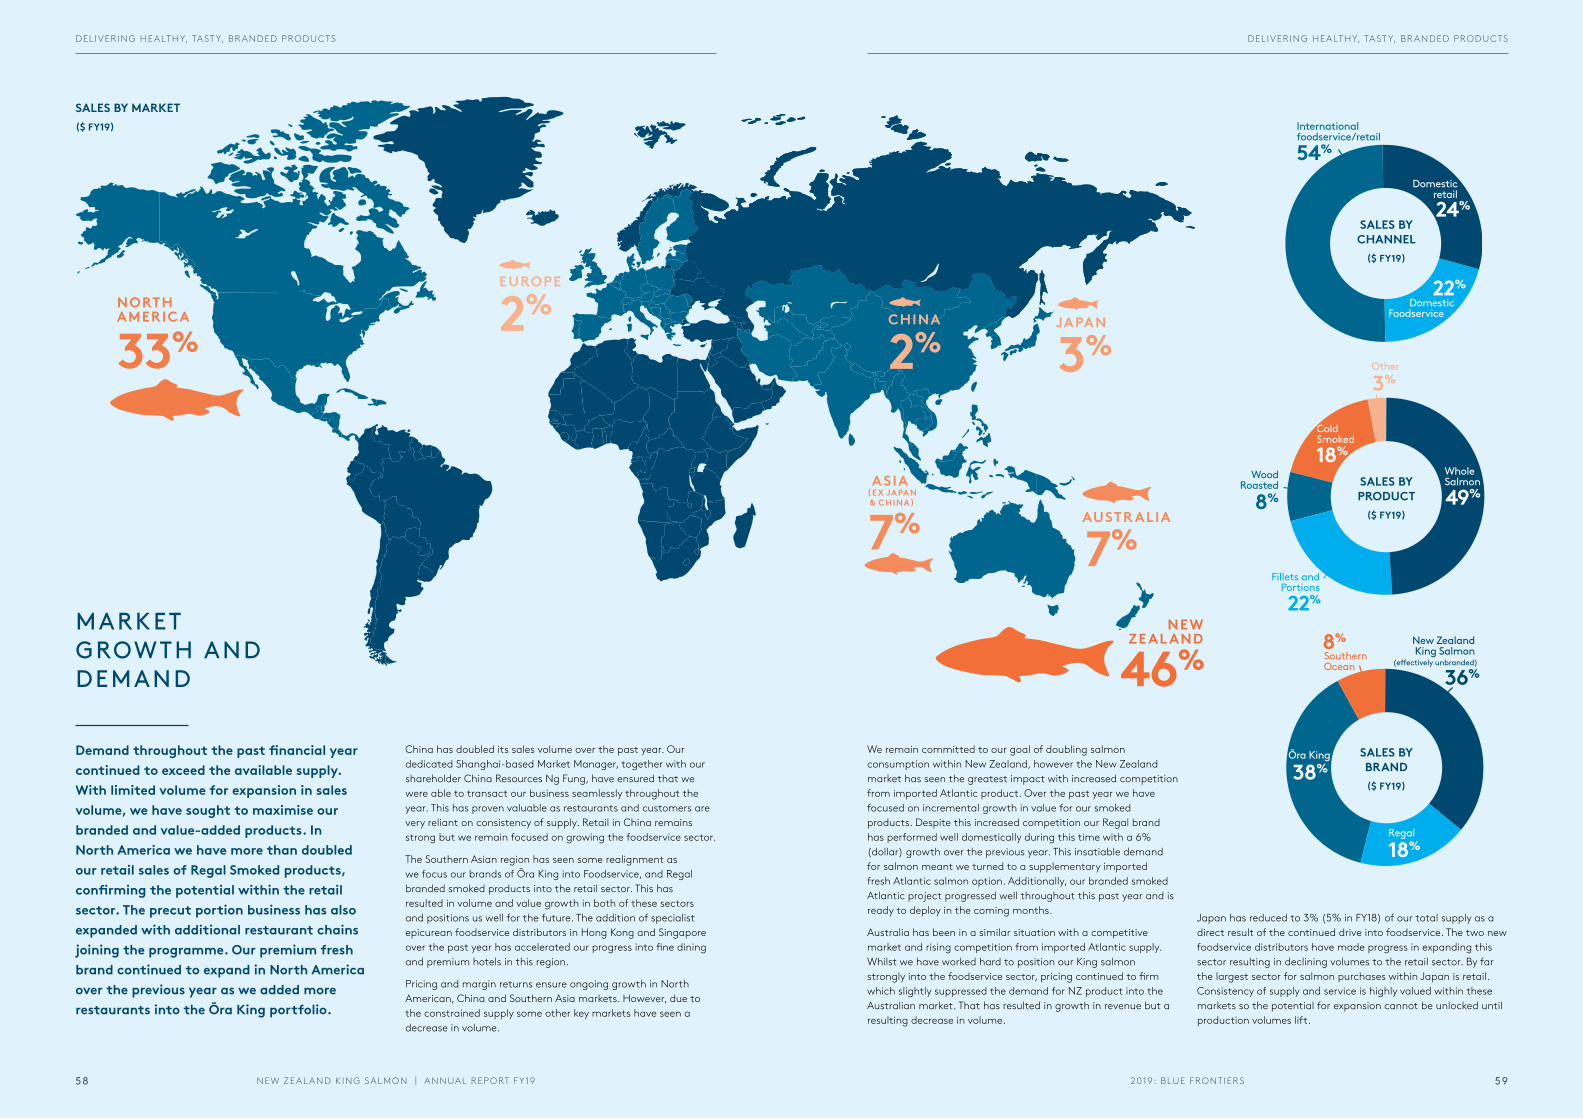
33%NORTHAMERICA
NEWZEAL AND
46%
7%AUSTR ALIA7%
ASIA (EX JAPAN& CHINA)
3%JAPAN2%
EUROPE
2%CHINA
SALES BY MARKET($ FY19)
Demand throughout the past financial year continued to exceed the available supply. With limited volume for expansion in sales volume, we have sought to maximise our branded and value-added products. In North America we have more than doubled our retail sales of Regal Smoked products, confirming the potential within the retail sector. The precut portion business has also expanded with additional restaurant chains joining the programme. Our premium fresh brand continued to expand in North America over the previous year as we added more restaurants into the Ōra King portfolio.
MARKET GROWTH AND DEMAND
China has doubled its sales volume over the past year. Our dedicated Shanghai-based Market Manager, together with our shareholder China Resources Ng Fung, have ensured that we were able to transact our business seamlessly throughout the year. This has proven valuable as restaurants and customers are very reliant on consistency of supply. Retail in China remains strong but we remain focused on growing the foodservice sector.
The Southern Asian region has seen some realignment as we focus our brands of Ōra King into Foodservice, and Regal branded smoked products into the retail sector. This has resulted in volume and value growth in both of these sectors and positions us well for the future. The addition of specialist epicurean foodservice distributors in Hong Kong and Singapore over the past year has accelerated our progress into fine dining and premium hotels in this region.
Pricing and margin returns ensure ongoing growth in North American, China and Southern Asia markets. However, due to the constrained supply some other key markets have seen a decrease in volume.
We remain committed to our goal of doubling salmon consumption within New Zealand, however the New Zealand market has seen the greatest impact with increased competition from imported Atlantic product. Over the past year we have focused on incremental growth in value for our smoked products. Despite this increased competition our Regal brand has performed well domestically during this time with a 6% (dollar) growth over the previous year. This insatiable demand for salmon meant we turned to a supplementary imported fresh Atlantic salmon option. Additionally, our branded smoked Atlantic project progressed well throughout this past year and is ready to deploy in the coming months.
Australia has been in a similar situation with a competitive market and rising competition from imported Atlantic supply. Whilst we have worked hard to position our King salmon strongly into the foodservice sector, pricing continued to firm which slightly suppressed the demand for NZ product into the Australian market. That has resulted in growth in revenue but a resulting decrease in volume.
Regal
18%
New Zealand King Salmon
(e�ectively unbranded)
36%
38%Ōra King
SouthernOcean
8%
8%
WoodRoasted
ColdSmoked
Other
3%
18%Whole Salmon
49%
22%
Fillets andPortions
SALES BY BRAND($ FY19)
SALES BY PRODUCT
($ FY19)
Domesticretail
24%
Internationalfoodservice/retail
54%
Domestic Foodservice
22%
SALES BY CHANNEL
($ FY19)
Japan has reduced to 3% (5% in FY18) of our total supply as a direct result of the continued drive into foodservice. The two new foodservice distributors have made progress in expanding this sector resulting in declining volumes to the retail sector. By far the largest sector for salmon purchases within Japan is retail. Consistency of supply and service is highly valued within these markets so the potential for expansion cannot be unlocked until production volumes lift.
2019: BLUE FRONTIERSNEW ZEAL AND KING SALMON | ANNUAL REPORT FY19 5958
DELIVERING HEALTHY, TAST Y, BR ANDED PRODUCTS DELIVERING HEALTHY, TAST Y, BR ANDED PRODUCTS
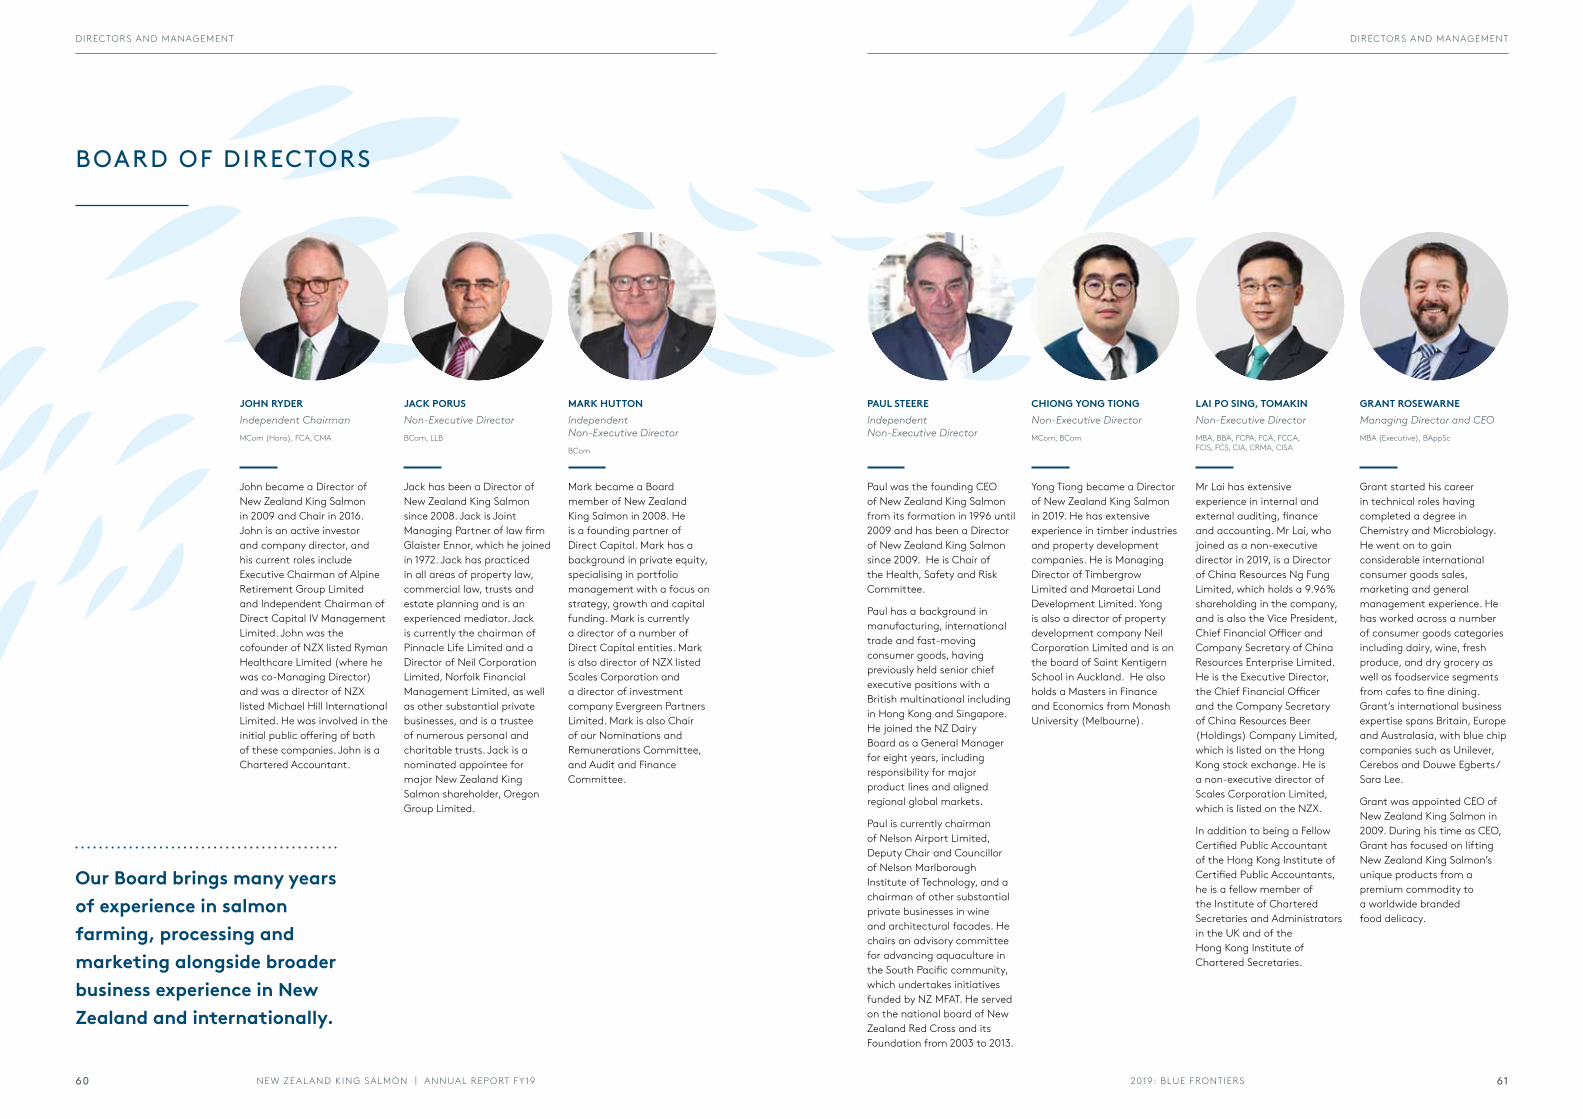
JOHN RYDERIndependent ChairmanMCom (Hons), FCA, CMA
BOARD OF DIRECTORS
JACK PORUSNon-Executive DirectorBCom, LLB
MARK HUTTONIndependent Non-Executive DirectorBCom
John became a Director of New Zealand King Salmon in 2009 and Chair in 2016. John is an active investor and company director, and his current roles include Executive Chairman of Alpine Retirement Group Limited and Independent Chairman of Direct Capital IV Management Limited. John was the cofounder of NZX listed Ryman Healthcare Limited (where he was co-Managing Director) and was a director of NZX listed Michael Hill International Limited. He was involved in the initial public offering of both of these companies. John is a Chartered Accountant.
Jack has been a Director of New Zealand King Salmon since 2008. Jack is Joint Managing Partner of law firm Glaister Ennor, which he joined in 1972. Jack has practiced in all areas of property law, commercial law, trusts and estate planning and is an experienced mediator. Jack is currently the chairman of Pinnacle Life Limited and a Director of Neil Corporation Limited, Norfolk Financial Management Limited, as well as other substantial private businesses, and is a trustee of numerous personal and charitable trusts. Jack is a nominated appointee for major New Zealand King Salmon shareholder, Oregon Group Limited.
Mark became a Board member of New Zealand King Salmon in 2008. He is a founding partner of Direct Capital. Mark has a background in private equity, specialising in portfolio management with a focus on strategy, growth and capital funding. Mark is currently a director of a number of Direct Capital entities. Mark is also director of NZX listed Scales Corporation and a director of investment company Evergreen Partners Limited. Mark is also Chair of our Nominations and Remunerations Committee, and Audit and Finance Committee.
Our Board brings many years of experience in salmon farming, processing and marketing alongside broader business experience in New Zealand and internationally.
CHIONG YONG TIONGNon-Executive DirectorMCom, BCom
PAUL STEEREIndependent Non-Executive Director
LAI PO SING, TOMAKINNon-Executive DirectorMBA, BBA, FCPA, FCA, FCCA, FCIS, FCS, CIA, CRMA, CISA
GRANT ROSEWARNEManaging Director and CEOMBA (Executive), BAppSc
Yong Tiong became a Director of New Zealand King Salmon in 2019. He has extensive experience in timber industries and property development companies. He is Managing Director of Timbergrow Limited and Maraetai Land Development Limited. Yong is also a director of property development company Neil Corporation Limited and is on the board of Saint Kentigern School in Auckland. He also holds a Masters in Finance and Economics from Monash University (Melbourne).
Paul was the founding CEO of New Zealand King Salmon from its formation in 1996 until 2009 and has been a Director of New Zealand King Salmon since 2009. He is Chair of the Health, Safety and Risk Committee.
Paul has a background in manufacturing, international trade and fast-moving consumer goods, having previously held senior chief executive positions with a British multinational including in Hong Kong and Singapore. He joined the NZ Dairy Board as a General Manager for eight years, including responsibility for major product lines and aligned regional global markets.
Paul is currently chairman of Nelson Airport Limited, Deputy Chair and Councillor of Nelson Marlborough Institute of Technology, and a chairman of other substantial private businesses in wine and architectural facades. He chairs an advisory committee for advancing aquaculture in the South Pacific community, which undertakes initiatives funded by NZ MFAT. He served on the national board of New Zealand Red Cross and its Foundation from 2003 to 2013.
Mr Lai has extensive experience in internal and external auditing, finance and accounting. Mr Lai, who joined as a non-executive director in 2019, is a Director of China Resources Ng Fung Limited, which holds a 9.96% shareholding in the company, and is also the Vice President, Chief Financial Officer and Company Secretary of China Resources Enterprise Limited. He is the Executive Director, the Chief Financial Officer and the Company Secretary of China Resources Beer (Holdings) Company Limited, which is listed on the Hong Kong stock exchange. He is a non-executive director of Scales Corporation Limited, which is listed on the NZX.
In addition to being a Fellow Certified Public Accountant of the Hong Kong Institute of Certified Public Accountants, he is a fellow member of the Institute of Chartered Secretaries and Administrators in the UK and of the Hong Kong Institute of Chartered Secretaries.
Grant started his career in technical roles having completed a degree in Chemistry and Microbiology. He went on to gain considerable international consumer goods sales, marketing and general management experience. He has worked across a number of consumer goods categories including dairy, wine, fresh produce, and dry grocery as well as foodservice segments from cafes to fine dining. Grant’s international business expertise spans Britain, Europe and Australasia, with blue chip companies such as Unilever, Cerebos and Douwe Egberts/Sara Lee.
Grant was appointed CEO of New Zealand King Salmon in 2009. During his time as CEO, Grant has focused on lifting New Zealand King Salmon’s unique products from a premium commodity to a worldwide branded food delicacy.
2019: BLUE FRONTIERSNEW ZEAL AND KING SALMON | ANNUAL REPORT FY19 6160
DIRECTORS AND MANAGEMENT DIRECTORS AND MANAGEMENT
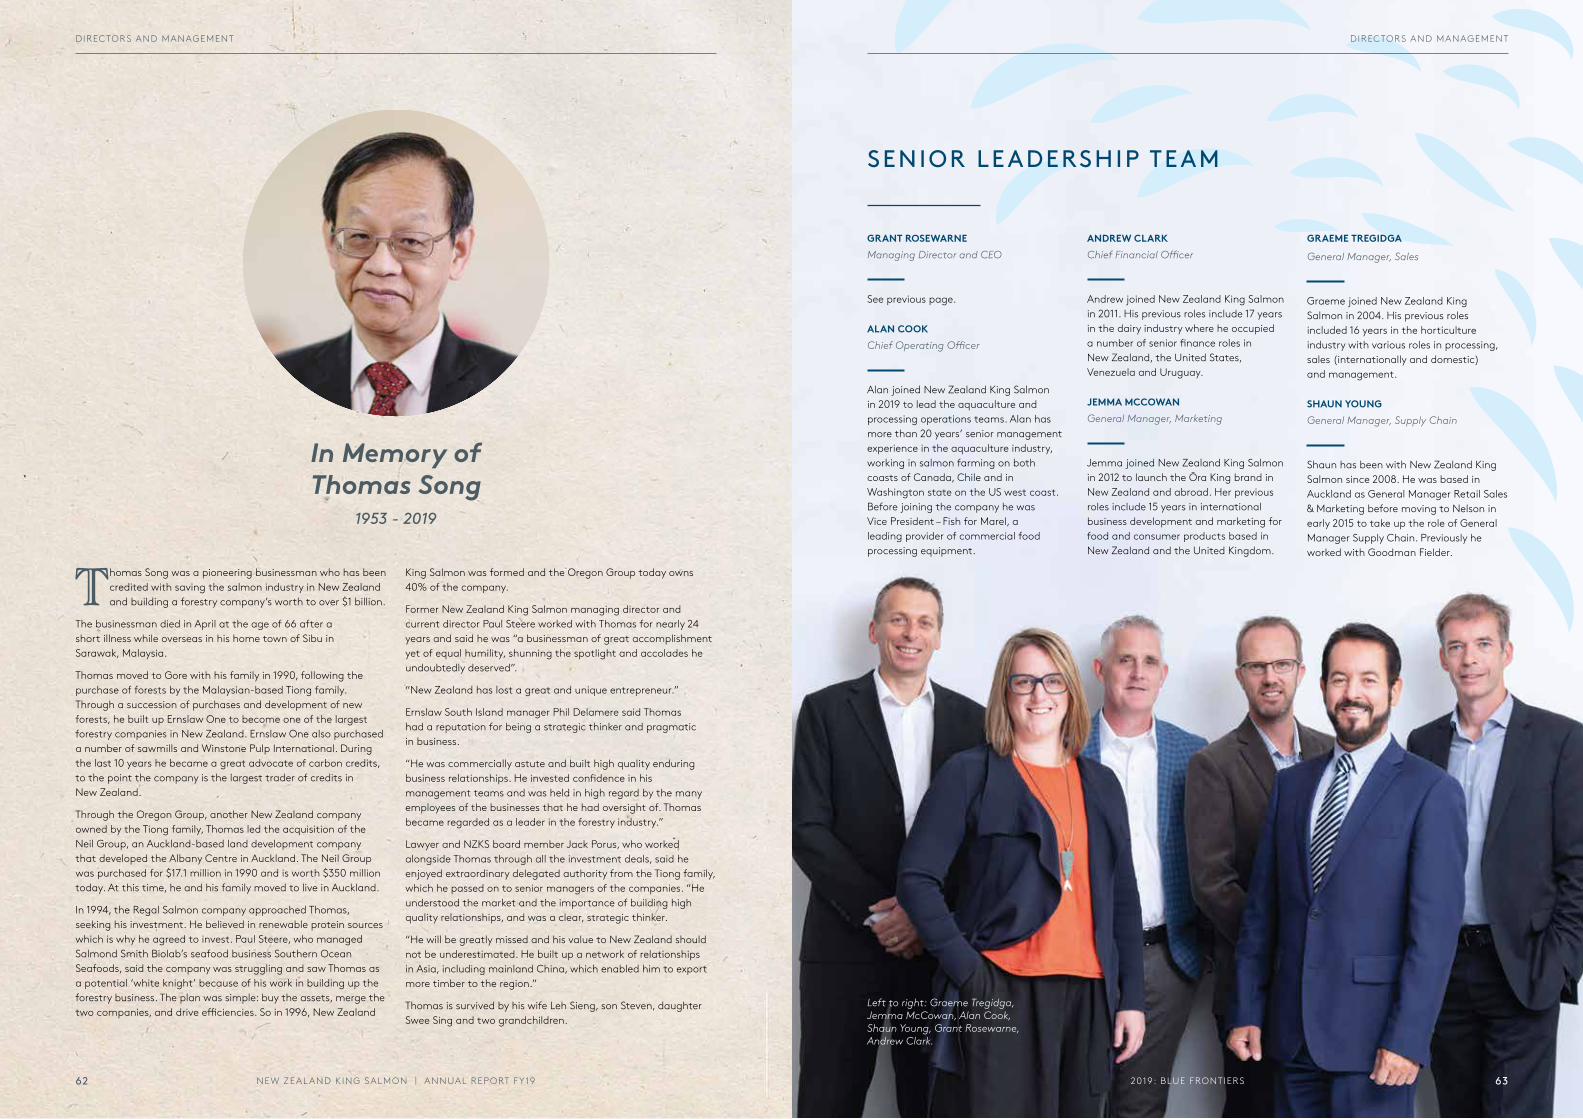
Thomas Song was a pioneering businessman who has been credited with saving the salmon industry in New Zealand and building a forestry company’s worth to over $1 billion.
The businessman died in April at the age of 66 after a short illness while overseas in his home town of Sibu in Sarawak, Malaysia.
Thomas moved to Gore with his family in 1990, following the purchase of forests by the Malaysian-based Tiong family. Through a succession of purchases and development of new forests, he built up Ernslaw One to become one of the largest forestry companies in New Zealand. Ernslaw One also purchased a number of sawmills and Winstone Pulp International. During the last 10 years he became a great advocate of carbon credits, to the point the company is the largest trader of credits in New Zealand.
Through the Oregon Group, another New Zealand company owned by the Tiong family, Thomas led the acquisition of the Neil Group, an Auckland-based land development company that developed the Albany Centre in Auckland. The Neil Group was purchased for $17.1 million in 1990 and is worth $350 million today. At this time, he and his family moved to live in Auckland.
In 1994, the Regal Salmon company approached Thomas, seeking his investment. He believed in renewable protein sources which is why he agreed to invest. Paul Steere, who managed Salmond Smith Biolab’s seafood business Southern Ocean Seafoods, said the company was struggling and saw Thomas as a potential ‘white knight’ because of his work in building up the forestry business. The plan was simple: buy the assets, merge the two companies, and drive efficiencies. So in 1996, New Zealand
King Salmon was formed and the Oregon Group today owns 40% of the company.
Former New Zealand King Salmon managing director and current director Paul Steere worked with Thomas for nearly 24 years and said he was “a businessman of great accomplishment yet of equal humility, shunning the spotlight and accolades he undoubtedly deserved”.
“New Zealand has lost a great and unique entrepreneur.”
Ernslaw South Island manager Phil Delamere said Thomas had a reputation for being a strategic thinker and pragmatic in business.
“He was commercially astute and built high quality enduring business relationships. He invested confidence in his management teams and was held in high regard by the many employees of the businesses that he had oversight of. Thomas became regarded as a leader in the forestry industry.”
Lawyer and NZKS board member Jack Porus, who worked alongside Thomas through all the investment deals, said he enjoyed extraordinary delegated authority from the Tiong family, which he passed on to senior managers of the companies. “He understood the market and the importance of building high quality relationships, and was a clear, strategic thinker.
“He will be greatly missed and his value to New Zealand should not be underestimated. He built up a network of relationships in Asia, including mainland China, which enabled him to export more timber to the region.”
Thomas is survived by his wife Leh Sieng, son Steven, daughter Swee Sing and two grandchildren.
In Memory of Thomas Song
1953 - 2019
SENIOR LEADERSHIP TEAM
GRANT ROSEWARNEManaging Director and CEO
See previous page.
ALAN COOKChief Operating Officer
Alan joined New Zealand King Salmon in 2019 to lead the aquaculture and processing operations teams. Alan has more than 20 years’ senior management experience in the aquaculture industry, working in salmon farming on both coasts of Canada, Chile and in Washington state on the US west coast. Before joining the company he was Vice President – Fish for Marel, a leading provider of commercial food processing equipment.
ANDREW CLARKChief Financial Officer
Andrew joined New Zealand King Salmon in 2011. His previous roles include 17 years in the dairy industry where he occupied a number of senior finance roles in New Zealand, the United States, Venezuela and Uruguay.
JEMMA MCCOWANGeneral Manager, Marketing
Jemma joined New Zealand King Salmon in 2012 to launch the Ōra King brand in New Zealand and abroad. Her previous roles include 15 years in international business development and marketing for food and consumer products based in New Zealand and the United Kingdom.
GRAEME TREGIDGA
General Manager, Sales
Graeme joined New Zealand King Salmon in 2004. His previous roles included 16 years in the horticulture industry with various roles in processing, sales (internationally and domestic) and management.
SHAUN YOUNGGeneral Manager, Supply Chain
Shaun has been with New Zealand King Salmon since 2008. He was based in Auckland as General Manager Retail Sales & Marketing before moving to Nelson in early 2015 to take up the role of General Manager Supply Chain. Previously he worked with Goodman Fielder.
NEW ZEAL AND KING SALMON | ANNUAL REPORT FY1962
DIRECTORS AND MANAGEMENT
2019: BLUE FRONTIERS 63
DIRECTORS AND MANAGEMENT
Left to right: Graeme Tregidga, Jemma McCowan, Alan Cook, Shaun Young, Grant Rosewarne, Andrew Clark.
Consolidated Statement of comprehensive income 66
Consolidated Statement of financial position 67
Consolidated Statement of changes in equity 68
Consolidated Statement of cash flows 69
Notes to the financial statements 70
1. Corporate information 70
2. Basis of preparation 70
3. Summary of significant accounting policies 71
4. New standards and interpretations not yet adopted 75
5. Segment information 77
6. Other income 78
7. Expenses 78
8. Financing income and costs 78
9. Income tax 79
10. Components of other comprehensive income 80
11. Earnings per share 80
12. Cash and cash equivalents 80
13. Trade and other receivables 81
14. Inventories 81
15. Biological assets 82
16. Property, plant and equipment 83
17. Intangibles 84
18. Interest bearing loans and borrowings 85
19. Trade and other payables 85
20. Employee benefits 85
21. Commitments and contingencies 86
22. Financial risk management 86
23. Fair values of financial instruments 89
24. Capital management 90
25. Capital and reserves 90
26. Events after balance date 91
27. Related party disclosures 91
28. Auditor’s remuneration 92
29. Reconciliation of net operating cash flow to profit/(loss) 93
30. Revenue from contracts with customers 93
Independent Auditor’s Report 96
Corporate Governance 100
Director Disclosures 117
Corporate Directory 121
Glossary 122
CONTENTSFinancial Statements1 July 2018 - 30 June 2019
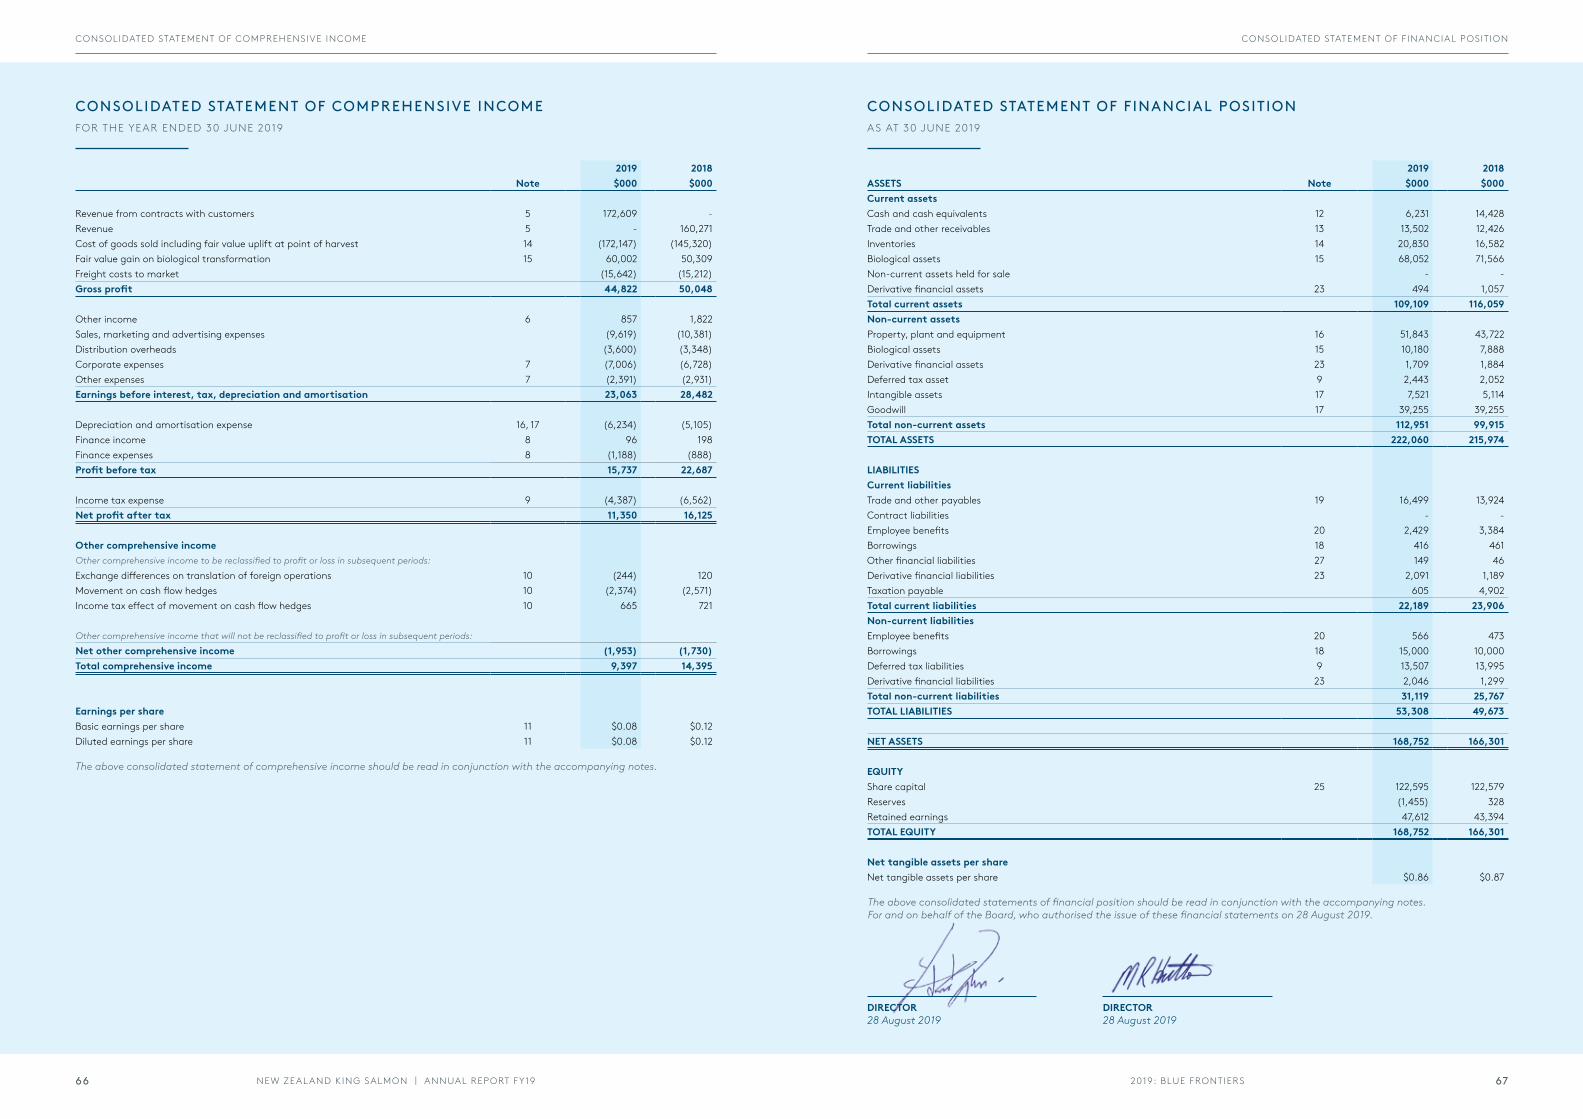
CONSOLIDATED STATEMENT OF COMPREHENSIVE INCOMEFOR THE YEAR ENDED 30 JUNE 2019
CONSOLIDATED STATEMENT OF FINANCIAL POSITIONAS AT 30 JUNE 2019
DIRECTOR 28 August 2019
DIRECTOR 28 August 2019
The above consolidated statements of financial position should be read in conjunction with the accompanying notes.For and on behalf of the Board, who authorised the issue of these financial statements on 28 August 2019.
The above consolidated statement of comprehensive income should be read in conjunction with the accompanying notes.
2019 2018Note $000 $000
Revenue from contracts with customers 5 172,609 - Revenue 5 - 160,271 Cost of goods sold including fair value uplift at point of harvest 14 (172,147) (145,320) Fair value gain on biological transformation 15 60,002 50,309 Freight costs to market (15,642) (15,212) Gross profit 44,822 50,048
Other income 6 857 1,822 Sales, marketing and advertising expenses (9,619) (10,381) Distribution overheads (3,600) (3,348) Corporate expenses 7 (7,006) (6,728) Other expenses 7 (2,391) (2,931) Earnings before interest, tax, depreciation and amortisation 23,063 28,482
Depreciation and amortisation expense 16, 17 (6,234) (5,105) Finance income 8 96 198 Finance expenses 8 (1,188) (888) Profit before tax 15,737 22,687
Income tax expense 9 (4,387) (6,562) Net profit after tax 11,350 16,125
Other comprehensive incomeOther comprehensive income to be reclassified to profit or loss in subsequent periods:Exchange differences on translation of foreign operations 10 (244) 120 Movement on cash flow hedges 10 (2,374) (2,571) Income tax effect of movement on cash flow hedges 10 665 721
Other comprehensive income that will not be reclassified to profit or loss in subsequent periods:Net other comprehensive income (1,953) (1,730) Total comprehensive income 9,397 14,395
Earnings per shareBasic earnings per share 11 $0.08 $0.12 Diluted earnings per share 11 $0.08 $0.12
2019 2018ASSETS Note $000 $000Current assetsCash and cash equivalents 12 6,231 14,428 Trade and other receivables 13 13,502 12,426 Inventories 14 20,830 16,582 Biological assets 15 68,052 71,566 Non-current assets held for sale - - Derivative financial assets 23 494 1,057 Total current assets 109,109 116,059 Non-current assetsProperty, plant and equipment 16 51,843 43,722 Biological assets 15 10,180 7,888 Derivative financial assets 23 1,709 1,884 Deferred tax asset 9 2,443 2,052 Intangible assets 17 7,521 5,114 Goodwill 17 39,255 39,255 Total non-current assets 112,951 99,915 TOTAL ASSETS 222,060 215,974
LIABILITIESCurrent liabilitiesTrade and other payables 19 16,499 13,924 Contract liabilities - - Employee benefits 20 2,429 3,384 Borrowings 18 416 461 Other financial liabilities 27 149 46 Derivative financial liabilities 23 2,091 1,189 Taxation payable 605 4,902 Total current liabilities 22,189 23,906 Non-current liabilitiesEmployee benefits 20 566 473 Borrowings 18 15,000 10,000 Deferred tax liabilities 9 13,507 13,995 Derivative financial liabilities 23 2,046 1,299 Total non-current liabilities 31,119 25,767 TOTAL LIABILITIES 53,308 49,673
NET ASSETS 168,752 166,301
EQUITYShare capital 25 122,595 122,579 Reserves (1,455) 328 Retained earnings 47,612 43,394 TOTAL EQUITY 168,752 166,301
Net tangible assets per shareNet tangible assets per share $0.86 $0.87
2019: BLUE FRONTIERSNEW ZEAL AND KING SALMON | ANNUAL REPORT FY19 6766
CONSOLIDATED STATEMENT OF COMPREHENSIVE INCOME CONSOLIDATED STATEMENT OF F INANCIAL POSIT ION
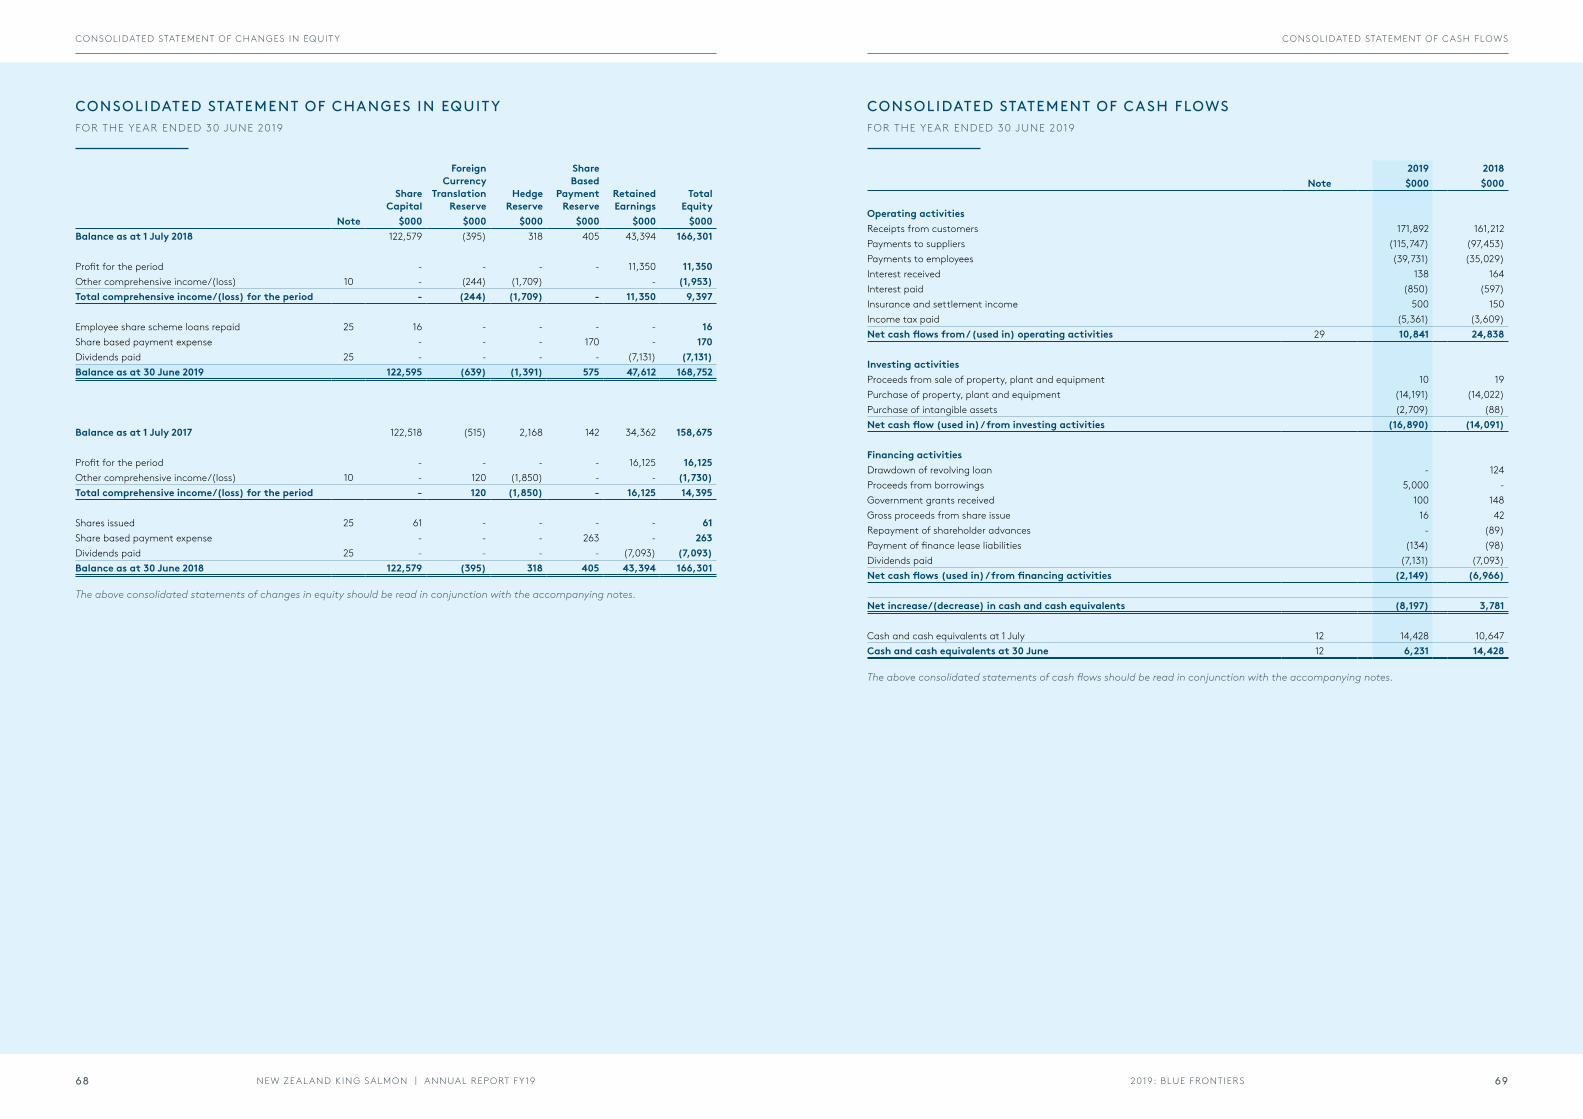
CONSOLIDATED STATEMENT OF CHANGES IN EQUIT YFOR THE YEAR ENDED 30 JUNE 2019
CONSOLIDATED STATEMENT OF CASH FLOWSFOR THE YEAR ENDED 30 JUNE 2019
Share Capital
Foreign Currency
Translation Reserve
Hedge Reserve
Share Based
Payment Reserve
Retained Earnings
Total Equity
Note $000 $000 $000 $000 $000 $000Balance as at 1 July 2018 122,579 (395) 318 405 43,394 166,301
Profit for the period - - - - 11,350 11,350 Other comprehensive income/(loss) 10 - (244) (1,709) - (1,953) Total comprehensive income/(loss) for the period - (244) (1,709) - 11,350 9,397
Employee share scheme loans repaid 25 16 - - - - 16 Share based payment expense - - - 170 - 170 Dividends paid 25 - - - - (7,131) (7,131) Balance as at 30 June 2019 122,595 (639) (1,391) 575 47,612 168,752
Balance as at 1 July 2017 122,518 (515) 2,168 142 34,362 158,675
Profit for the period - - - - 16,125 16,125 Other comprehensive income/(loss) 10 - 120 (1,850) - - (1,730) Total comprehensive income/(loss) for the period - 120 (1,850) - 16,125 14,395
Shares issued 25 61 - - - - 61 Share based payment expense - - - 263 - 263 Dividends paid 25 - - - - (7,093) (7,093) Balance as at 30 June 2018 122,579 (395) 318 405 43,394 166,301
2019 2018Note $000 $000
Operating activitiesReceipts from customers 171,892 161,212 Payments to suppliers (115,747) (97,453) Payments to employees (39,731) (35,029) Interest received 138 164 Interest paid (850) (597) Insurance and settlement income 500 150 Income tax paid (5,361) (3,609) Net cash flows from / (used in) operating activities 29 10,841 24,838
Investing activitiesProceeds from sale of property, plant and equipment 10 19 Purchase of property, plant and equipment (14,191) (14,022) Purchase of intangible assets (2,709) (88) Net cash flow (used in) / from investing activities (16,890) (14,091)
Financing activitiesDrawdown of revolving loan - 124 Proceeds from borrowings 5,000 - Government grants received 100 148 Gross proceeds from share issue 16 42 Repayment of shareholder advances - (89) Payment of finance lease liabilities (134) (98) Dividends paid (7,131) (7,093) Net cash flows (used in) / from financing activities (2,149) (6,966)
Net increase/(decrease) in cash and cash equivalents (8,197) 3,781
Cash and cash equivalents at 1 July 12 14,428 10,647 Cash and cash equivalents at 30 June 12 6,231 14,428
The above consolidated statements of changes in equity should be read in conjunction with the accompanying notes.
The above consolidated statements of cash flows should be read in conjunction with the accompanying notes.
2019: BLUE FRONTIERSNEW ZEAL AND KING SALMON | ANNUAL REPORT FY19 6968
CONSOLIDATED STATEMENT OF CHANGES IN EQUIT Y CONSOLIDATED STATEMENT OF CASH FLOWS
NOTES TO THE FINANCIAL STATEMENTSFOR THE YEAR ENDED 30 JUNE 2019
1. CORPORATE INFORMATIONThe consolidated financial statements of New Zealand King Salmon Investments Limited (the Company) and its subsidiaries (together the Group) for the year ended 30 June 2019 were authorised by the directors on 28 August 2019.
New Zealand King Salmon Investments Limited is a profit-orientated company incorporated and domiciled in New Zealand. The Company is registered under the Companies Act 1993 and listed on the NZX Main Board (“NZX”) and the Australian Securities Exchange (“ASX”). The Company is an FMC reporting entity under the Financial Markets Conduct Act 2013 and the Financial Reporting Act 2013.
The Group is principally engaged in the farming, processing and sale of premium salmon products.
2. BASIS OF PREPARATION
a. Statement of complianceThe consolidated financial statements comply with New Zealand Equivalents to International Financial Reporting Standards (IFRS) and also with New Zealand Equivalents to International Financial Reporting Standards (NZ IFRS). The financial statements are prepared under NZ GAAP and FMC Act 2013.
b. Basis of measurementThe financial statements have been prepared on a historical cost basis except for biological assets and financial instruments which have been measured at fair value. The carrying values of recognised assets and liabilities that are designated as hedged items in hedging instruments otherwise be carried at amortised cost are adjusted to recognise changes in the fair values attributable to the risks that are being hedged in effective hedge relationships.
The consolidated financial statements are presented in New Zealand dollars and all values are rounded to the nearest thousand ($000), except when otherwise indicated.
The consolidated financial statements provide comparative information in respect of the previous period.
c. Significant accounting judgements, estimates and assumptionsThe preparation of the Group’s consolidated financial statements requires management to make judgements, estimates and assumptions that affect the reported outcomes of revenues, expenses, assets, liabilities and the accompanying disclosures. The Group based its assumptions and estimates on parameters available when the consolidated financial statements were prepared. Uncertainties about these assumptions and estimates could result in an outcome that requires a material adjustment to the carrying amount of assets or liabilities in future periods.
Specific areas requiring significant estimates and judgements include:
Valuation of biological assets
The Group recognises stocks of live fish at fair value less costs to sell according to the principles of NZ IAS 41 Agriculture. The fair value is measured using a valuation model that relies on various assumptions and information available at balance date. Inputs include anticipated market prices, quality mix, current weights of livestock relative to expected harvest weight, mortality rates, growth rates and production costs. The income or loss that is ultimately recognised at time of sale may be significantly different from that implied by the fair value adjustment at the end of a reporting period. The fair value uplift from accumulated costs to date has no cash impact. Further details of the valuation and sensitivity to change in key inputs are given in note 15.
Impairment testing of intangibles
The Group reviews the carrying value of goodwill on an annual basis and assesses whether it is impaired according to the principles of NZ IAS 36 Impairment of Assets. This requires the goodwill to be allocated to cash generating units with which it would naturally be associated and the value in use of the cash generating units to be estimated. The value in use is estimated using a standard industry model that relies on various assumptions and information available at balance date. Inputs include estimations of the growth rate of the Group, future market conditions, prices, and discount rates. Further details of the value in use assessment are given in note 17.
Valuation of financial derivatives
The Group recognises financial derivatives at fair value according to the principles of NZ IFRS 13 Fair Value Measurement. The value is calculated by a third party expert using an industry standard model. Inputs to the model are obtained externally by the service provider. Further details of the valuation are included in note 24.
Useful lives of assets
The Group estimates the useful lives of property, plant and equipment and intangible assets based on historical performance and currently consented future asset uses.
Revenue from contracts with customers
The Group reviews individual transactions to determine the amount and timing of revenue from contracts with customers.
d. Foreign currency translationFunctional and presentation currency
The Group’s consolidated financial statements are presented in New Zealand dollars, which is also the parent Company’s functional currency. The Australian subsidiary’s functional currency is Australian dollars which is translated into the presentation currency in these financial statements. The USA subsidiary’s functional currency is United States dollars which is translated into the presentation currency in these financial statements.
Transactions and balances
Transactions in foreign currencies are initially recorded in the functional currency by applying the exchange rates ruling at the date of the transaction. Monetary assets and liabilities denominated in foreign currencies are retranslated at the rate of exchange at balance date.
Non-monetary items that are measured in terms of historical cost in a foreign currency are translated using the exchange rate as at the date of the initial transaction. Non-monetary items measured at fair value in a foreign currency are translated using the exchange rates at the date when the fair value was determined.
3. S IGNIFICANT ACCOUNTING POLICIES
a. Basis of consolidationThe financial statements comprise the financial statements of New Zealand King Salmon Investments Limited and its subsidiaries (per note 27) as at 30 June each year. Subsidiaries are all those entities over which the Company has control.
The financial statements of the subsidiaries are prepared for the same reporting period as the Parent company using consistent accounting policies.
In preparing the consolidated financial statements, all intercompany balances and transactions, income and expenses and profit and losses resulting from intra-group transactions have been eliminated in full.
Subsidiaries are fully consolidated from the date on which control is obtained by the Group and cease to be consolidated from the date on which control is transferred out of the Group.
b. Business combinationsBusiness combinations are accounted for using the acquisition method. The consideration transferred in a business combination is measured at fair value which is calculated as the sum of the acquisition date fair value of assets acquired by the Group and the liabilities assumed by the Group. Acquisition related costs are expensed as incurred and included in administrative expenses. Any contingent consideration to be transferred by the Group is recognised at fair value at acquisition date.
c. Financial instrumentsAll financial instruments are initially recognised at the fair value of the consideration received, less directly attributable transaction costs in the case of financial assets and liabilities not recorded at fair value through profit or loss. Subsequently the Group applies the following accounting policies for financial instruments:
Cash and cash equivalents
Cash and cash equivalents in the balance sheet comprise cash at bank and call deposits. For the purpose of the statement of cash flows, cash and cash equivalents consist of cash and short-term deposits net of outstanding bank overdrafts.
Trade and other receivables
Short term trade and other receivables are not discounted and are initially stated at cost. Gains and losses are recognised in the profit or loss when the receivables are derecognised or impaired.
Loans
Loans and amounts owing from related companies are non-derivative financial assets with fixed or determinable payments that are not quoted in an active market. After initial recognition such assets are carried at amortised cost using the effective interest method. Gains and losses are recognised in profit or loss when the loans are derecognised or impaired.
Trade and other payables
Trade and other payables are carried at cost due to their short term nature and are not discounted. They represent liabilities for goods and services provided to the Group prior to the end of the financial year that are unpaid and arise when the Group becomes obliged to make future payments in respect of the purchase of these goods and services. The amounts are unsecured and are usually paid within 30-60 days of recognition.
2019: BLUE FRONTIERSNEW ZEAL AND KING SALMON | ANNUAL REPORT FY19 7170
NOTES TO THE F INANCIAL STATEMENTS NOTES TO THE F INANCIAL STATEMENTS
Interest bearing borrowings
After initial recognition interest bearing borrowings are subsequently measured at amortised cost using the effective interest method. Fees paid on establishment of loan facilities that are yield related are included as part of the carrying amount. Borrowings are classified as current liabilities unless the Group has an unconditional right to defer settlement of the liability for at least 12 months after the balance date. Borrowing costs are generally recognised as an expense when incurred with the exception of borrowing costs associated with a qualifying asset which are capitalised as part of the cost of that asset.
Financial guarantee
Financial guarantee contracts issued by the Group are those contracts that require a payment to be made to reimburse the holder for a loss it incurs because the specified debtor fails to make a payment when due in accordance with the terms of a debt instrument. Financial Guarantee contracts are recognised initially as a liability at fair value, adjusted for transaction costs that are directly attributed to the issuance of the guarantee. Subsequently the liability is measured at the higher of the best estimate of the expenditure required to settle the present obligation at balance date and the amount recognised less cumulative amortisation.
Derivative financial instruments and hedging
The Group uses derivative financial instruments including forward currency contracts, options and interest rate swaps to hedge risks associated with interest rate and foreign currency fluctuations. Such derivative financial instruments are initially recognised at fair value on the date on which a derivative contract is entered into and are subsequently re-measured to fair value at balance date. Derivatives are carried as assets when their fair value is positive and as liabilities when their fair value is negative.
The fair values of forward currency contracts are calculated by reference to current forward exchange rates for contracts with similar maturity profiles. The fair values of interest rate swaps are determined by reference to market values for similar instruments.
The Group designates its derivative financial instruments as hedges of a particular risk associated with a recognised asset or liability or a highly probable commitment that could affect profit or loss. The effective portion of the gain or loss on the hedging instrument is recognised directly in other comprehensive income in the hedge reserve, while the ineffective portion is recognised in profit or loss as other income or expenses.
Amounts accumulated in equity are transferred to profit or loss when the hedged item affects profit or loss.
d. InventoriesInventories including raw materials, work in progress and finished goods are valued at the lower of cost or net realisable value. Costs incurred in bringing each product to its present location and condition are accounted for as follows:
Raw materials – the cost of fish is measured at fair value at harvest date. The cost of other raw materials is based on the purchase price including import duties and other taxes, transport, handling and other costs directly attributable to the acquisition of the goods and materials. Costs are determined on a weighted average basis.
Manufactured finished goods and work in progress – cost of direct materials, labour and a proportion of manufacturing overheads appropriate to the state of manufacture. Costs are assigned on the basis of weighted average costs. The cost of items transferred from biological assets is their fair value less costs to sell at the date of harvest.
Net realisable value – the estimated selling price in the ordinary course of business less estimated costs of completion and the estimated costs necessary to make the sale.
e. Biological assetsBiological assets include fish livestock measured at fair value less estimated costs to sell. The net gain or loss resulting from the fair value measurement is recognised in profit or loss.
The fair value of fish livestock is derived from the amount expected to be received from the sale of the asset in an active market. The target live weight of the harvestable fish is defined as a fish with a live weight of 4kg or greater. Many fish are harvested with a live weight above or below this weight.
For brood stock and fish where little biological transformation has taken place since initial cost was incurred, cost less impairment is used as an approximation of fair value. This value is used up to the point at which fish are transferred to sea water. Fish stock is transferred to inventory at the time of harvest. The transfer is recorded at its fair value which is deemed to be cost for the purposes of inventory valuation.
f. Property, plant and equipmentProperty, plant and equipment are stated at historical cost less accumulated depreciation and impairment. Depreciation is provided on a straight line basis over the estimated useful lives of the assets as follows:
Freehold land not depreciatedFreehold buildings twenty to fifty yearsBuilding fit out three to twenty five yearsLeasehold improvements five to ten yearsPlant, furniture and fittings three to twenty yearsMotor vehicles five yearsSea vessels ten to twenty years
The residual values, useful lives and methods of depreciation of property, plant and equipment are reviewed at each financial year end and adjusted prospectively if appropriate. An asset’s carrying value is written down immediately to its recoverable amount if its carrying value is greater than its estimated recoverable amount.
An item of property, plant and equipment is derecognised upon disposal or when no further future economic benefits are expected from its use or disposal. Any gain or loss arising on de-recognition of the asset (calculated as the difference between the net disposal proceeds and the carrying amount of the asset) is included in profit or loss in the year the asset is derecognised.
g. LeasesThe determination of whether an arrangement is or contains a lease is based on the substance of the arrangement and requires an assessment of whether the fulfilment of the arrangement is dependent on the use of a specific asset or assets and the arrangement conveys a right to use the asset.
Group as a lessee
A lease is classified at the inception date as a finance lease or an operating lease. Finance leases, which transfer to the Group substantially all the risks and benefits incidental to ownership of the leased item, are capitalised at the inception of the lease at the fair value of the leased asset or, if lower, at the present value of the minimum lease payments. Lease payments are apportioned between the finance charges and reduction of the lease liability so as to achieve a constant rate of interest on the remaining balance of the liability. Finance charges are recognised as an expense in profit or loss.
Capitalised leased assets are depreciated over the shorter of the estimated useful life of the asset and the lease term if there is no reasonable certainty that the Group will obtain ownership by the end of the lease term.
Operating lease payments are recognised as an expense in profit or loss on a straight-line basis over the lease term. Lease incentives are recognised in profit or loss as an integral part of the total lease expense.
h. IntangiblesIntangible assets acquired separately or in a business combination are initially measured at cost. The cost of an intangible asset acquired in a business combination is its fair value as at the date of acquisition. Following initial recognition intangible assets are carried at cost less any accumulated amortisation and any accumulated impairment losses. Internally generated intangible assets are not capitalised and the expenditure is recognised in profit or loss in the year in which the expenditure is incurred.
The useful lives of intangible assets are assessed to be either finite or indefinite. Intangible assets with finite lives are amortised over the useful life and tested for impairment whenever there is an indication that the intangible asset may be impaired. The amortisation period and the amortisation method for an intangible asset with a finite useful life is reviewed at least at each financial year-end. Changes in the expected useful life or the expected pattern of consumption of future economic benefits embodied in the asset are accounted for prospectively by changing the amortisation period or method, as appropriate, which is a change in accounting estimate. The amortisation expense on intangible assets with finite lives is recognised in profit or loss in the expense category consistent with the function of the intangible asset.
Intangible assets with indefinite useful lives are not amortised but are tested for impairment annually, either individually or at the cash-generating unit level. The assessment of useful life is reviewed annually to determine whether the indefinite life continues to be supportable. If not, the change in useful life from indefinite to definite is made on a prospective basis.
A summary of the policies applied to the Group’s intangible assets is as follows:
Goodwill and trade marks
Useful lives: IndefiniteInternally generated or acquired: Acquired
Intellectual property, marine farm and hatchery licences and marina berth
Useful lives: FiniteAmortisation method used: Straight line, five to thirty five yearsInternally generated or acquired: Acquired
Computer Software
Useful lives: FiniteAmortisation method used: Straight line, four to seven yearsInternally generated or acquired: Acquired
i. Research and development costsResearch costs are generally expensed as incurred. Development expenditures are capitalised as intangible assets when the Group can demonstrate:
- Costs can be reliably measured. - Completion of the project is technically feasible. - Resources are available to complete the project. - There is an intention to use the resulting asset and it will generate future economic benefits.
During the period of development the asset is tested for impairment annually.
2019: BLUE FRONTIERSNEW ZEAL AND KING SALMON | ANNUAL REPORT FY19 7372
NOTES TO THE F INANCIAL STATEMENTS NOTES TO THE F INANCIAL STATEMENTS
j. Employee benefitsWages, salaries, annual leave and sick leave
Liabilities for wages and salaries including non-monetary benefits, annual leave and accumulating sick leave expected to be settled within 12 months of the reporting date are recognised in respect of employees’ services up to the reporting date. They are measured at the amounts expected to be paid when the liabilities are settled. Liabilities for non-accumulating sick leave are recognised when the leave is taken and are measured at the rates paid or payable.
Long service leave
The liability for long service leave is recognised and measured at the present value of expected future payments to be made in respect of services provided by employees up to the reporting date using the projected unit credit method. Consideration is given to expected future wage and salary levels, experience of employee departures and periods of service.
Defined contribution plans
Contributions made to a defined contribution plan are expensed as incurred.
k. Contributed equityOrdinary shares
Ordinary shares are classified as equity. Incremental costs directly attributable to the issue of new shares or options are shown in equity as a deduction net of tax from the proceeds. Other capital raising costs are expensed as incurred.
l. Revenue RecognitionThe Group is in the business of growing, processing and selling King Salmon to New Zealand based retailers, New Zealand food service and export markets. Revenue from contracts with customers is recognised when control of the goods are transferred to the customer at the amount that reflects the consideration to which the Group expects to be entitled in exchange for those goods. The Group has generally concluded that it is the principal in its revenue arrangements because it typically controls the goods before transferring them to the customer.
NZ IFRS 15 supersedes NZ IAS 11 Construction Contracts, NZ IAS 18 Revenue and related Interpretations and it applies, with limited exceptions, to all revenue arising from contracts with customers. NZ IFRS 15 establishes a five-step model to account for revenue arising from contracts with customers and requires that revenue be recognised at an amount that reflects the consideration to which an entity expects to be entitled in exchange for transferring goods or services to a customer.
Interest income
Revenue is recognised as interest accrues using the effective interest method.
Insurance proceeds
Insurance proceeds are recognised in the financial statements when receipt is virtually certain and can be measured reliably.
m. TaxesIncome taxes
Current tax assets and liabilities for the current and prior periods are measured at the amount expected to be recovered from or paid to the taxation authorities based on the current period’s taxable income. The tax rates and tax laws used to compute the amount are those that are enacted or substantively enacted by the balance sheet date.
Deferred income tax is provided on all temporary differences at the balance sheet date between the tax bases of assets and liabilities and their carrying amounts for financial reporting purposes.
The carrying amount of deferred income tax assets is reviewed at each balance sheet date and reduced to the extent that it is no longer probable that sufficient taxable profit will be available to allow all or part of the deferred income tax asset to be utilised. Unrecognised deferred income tax assets are reassessed at each balance sheet date and are recognised to the extent that it has become probable that future taxable profit will allow the deferred tax asset to be recovered.
Deferred income tax assets and liabilities are measured at the tax rates that are expected to apply to the year when the asset is realised or the liability is settled, based on tax rates (and tax laws) that have been enacted or substantively enacted at the balance sheet date.
Income taxes relating to items recognised directly in equity are recognised in equity and not in profit or loss.
Deferred tax assets and deferred tax liabilities are offset only if a legally enforceable right exists to set off current tax assets against current tax liabilities and the deferred tax assets and liabilities relate to the same taxable entity and the same taxation authority.
Other taxes
Revenues, expenses and assets are recognised net of the amount of GST, except when:
- The GST incurred on a purchase of goods and services is not recoverable from the taxation authority, in which case the GST is recognised as part of the cost of acquisition of the asset or as part of the expense item as applicable.
- Receivables and payables, which are stated with the amount of GST included. - The net amount of GST recoverable from or payable to the taxation authority is included as part of receivables or payables in the
balance sheet. - Commitments and contingencies are disclosed net of the amount of GST recoverable from or payable to the taxation authority. - The Group recognises uncertain tax positions as a liability where it is probable that an outflow of resources will be required.
n. Share-based paymentsCertain employees of the Group receive remuneration in the form of share-based payments, whereby employees render services as consideration for equity instruments (equity-settled transactions). The cost of equity-settled transactions is determined by the fair value at the date when the grant is made using an appropriate valuation model, further details of which are given in Note 25.
That cost is recognised in employee benefits expense, together with a corresponding increase in equity (other capital reserves), over the period in which the service and, where applicable, the performance conditions are fulfilled (the vesting period). The cumulative expense recognised for equity-settled transactions at each reporting date until the vesting date reflects the extent to which the vesting period has expired and the Group’s best estimate of the number of equity instruments that will ultimately vest. The expense or credit in the statement of comprehensive income for the period represents the movement in cumulative expense recognised as at the beginning and end of that period.
Service and non-market performance conditions are not taken into account when determining the grant date fair value of awards, but the likelihood of the conditions being met is assessed as part of the Group’s best estimate of the number of equity instruments that will ultimately vest. Market performance conditions are reflected within the grant date fair value. Any other conditions attached to an award, but without an associated service requirement, are considered to be non-vesting conditions. Non-vesting conditions are reflected in the fair value of an award and lead to an immediate expensing of an award unless there are also service and/or performance conditions.
No expense is recognised for awards that do not ultimately vest because non-market performance and/or service conditions have not been met. Where awards include a market or non-vesting condition, the transactions are treated as vested irrespective of whether the market or non-vesting condition is satisfied, provided that all other performance and/or service conditions are satisfied.
When the terms of an equity-settled award are modified, the minimum expense recognised is the grant date fair value of the unmodified award, provided the original terms of the award are met. An additional expense, measured as at the date of modification, is recognised for any modification that increases the total fair value of the share-based payment transaction, or is otherwise beneficial to the employee. Where an award is cancelled by the entity or by the counterparty, any remaining element of the fair value of the award is expensed immediately through profit or loss.
4. NEW STANDARDS AND INTERPRETATIONS NOT YET ADOPTEDVarious new standards, amendments to standards and interpretations are effective for annual periods beginning on or after the current reporting period and have not been applied in preparing these consolidated financial statements. The following changes may have a significant effect on the consolidated financial statements of the group:
a. New and amended standards and interpretationsNZ IFRS 9: Financial Instruments
NZ IFRS 9 Financial Instruments replaces NZ IAS 39 Financial Instruments: Recognition and Measurement for annual periods beginning on or after 1 January 2018, bringing together all three aspects of the accounting for financial instruments: classification and measurement; impairment; and hedge accounting.
Under NZ IFRS 9 debt instruments are subsequently measured at fair value through profit or loss, amortised cost or fair value through other comprehensive income. The classification is based on two criteria: the Group’s business model for managing the assets; and whether the instruments’ contractual cash flows represent ‘solely payments of principle and interest’ on the principle amount outstanding.
The assessment of the Group’s business model was made as of the date of initial application, 1 July 2017, and then applied retrospectively to those financial assets that were recognised before 1 July 2017. The assessment of whether contractual cash flows on debt instruments are solely comprised of principle and interest was made based on the facts and the circumstances as at the initial recognition of the assets.
The classification and measurement requirements of NZ IFRS 9 did not have a significant impact on the Group. The Group continued measuring at fair value all financial assets previously held at fair value under NZ IAS 39. The Group has reclassified Trade receivables as Debt instruments at amortised cost, these were previously classified as Loans and receivables.
The adoption of NZ IFRS 9 has changed the Group’s accounting for impairment losses for financial assets by replacing NZ IAS 39’s incurred loss approach with a forward-looking expected credit loss (ECL) approach. NZ IFRS 9 requires the Group to recognise an allowance for ECLs for all debt instruments not held at fair value through profit or loss and contract assets. The assessment of the ECL was made at balance date 30 June and it was deemed that no material provision was required due to the negligible risk of credit loss.
2019: BLUE FRONTIERSNEW ZEAL AND KING SALMON | ANNUAL REPORT FY19 7574
NOTES TO THE F INANCIAL STATEMENTS NOTES TO THE F INANCIAL STATEMENTS
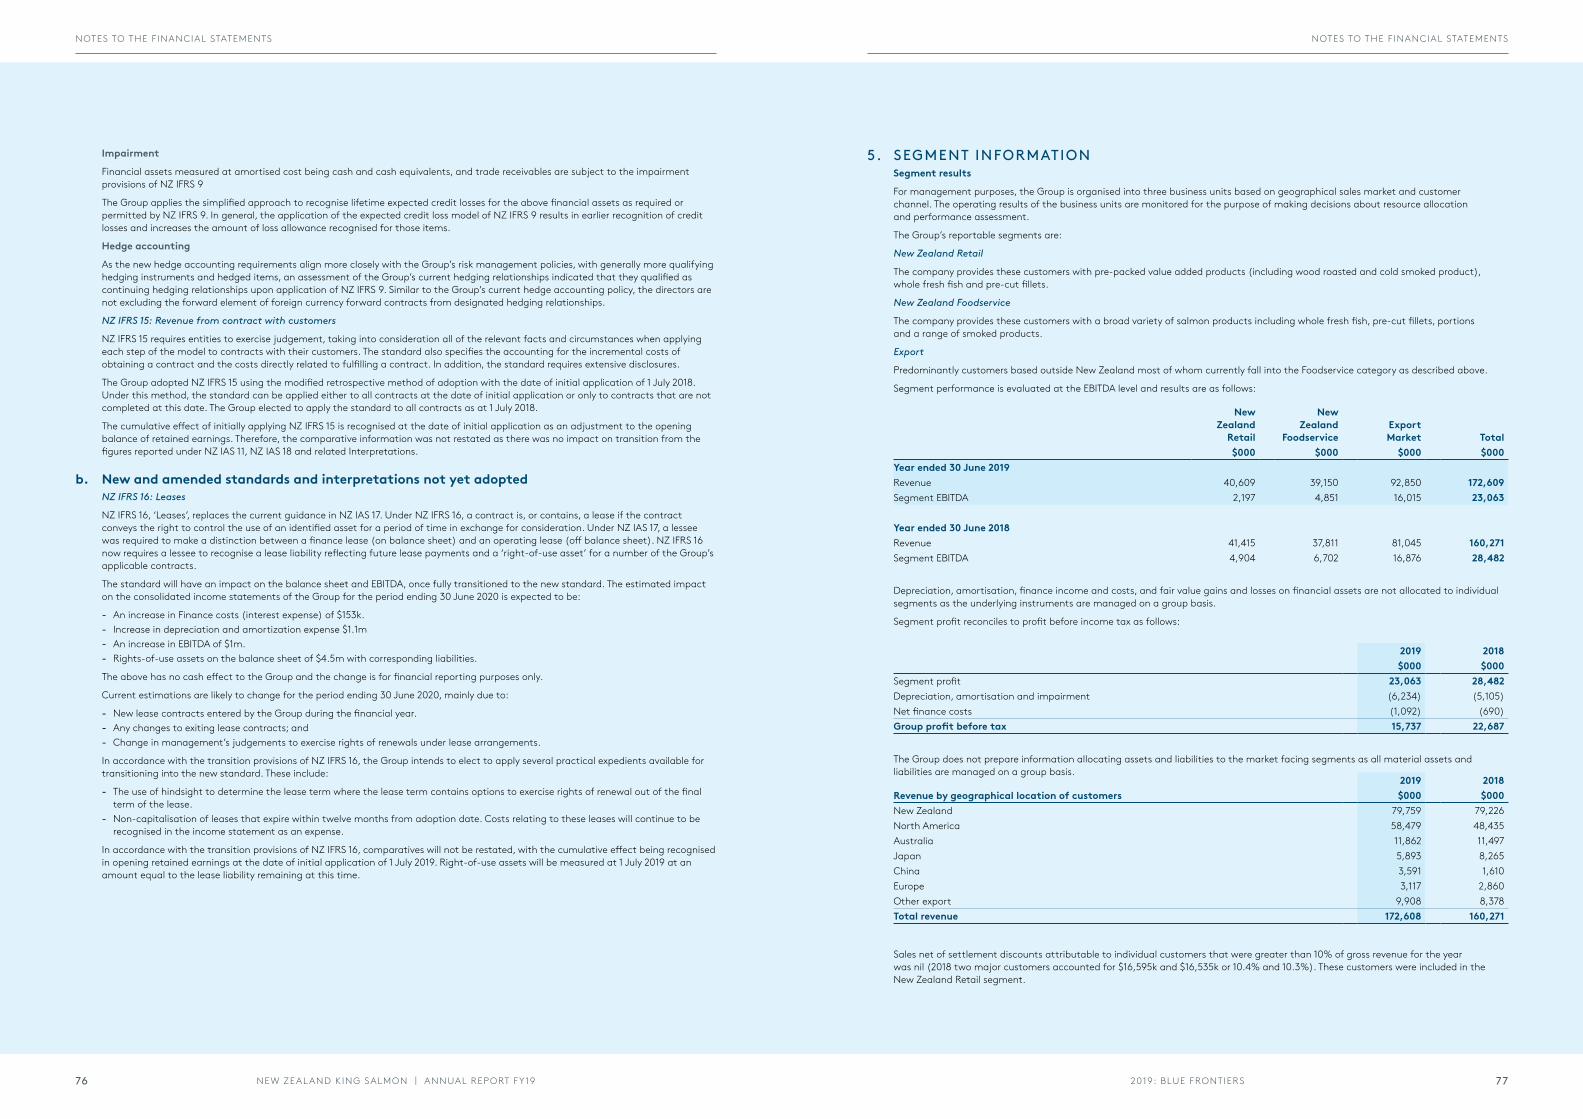
Impairment
Financial assets measured at amortised cost being cash and cash equivalents, and trade receivables are subject to the impairment provisions of NZ IFRS 9
The Group applies the simplified approach to recognise lifetime expected credit losses for the above financial assets as required or permitted by NZ IFRS 9. In general, the application of the expected credit loss model of NZ IFRS 9 results in earlier recognition of credit losses and increases the amount of loss allowance recognised for those items.
Hedge accounting
As the new hedge accounting requirements align more closely with the Group’s risk management policies, with generally more qualifying hedging instruments and hedged items, an assessment of the Group’s current hedging relationships indicated that they qualified as continuing hedging relationships upon application of NZ IFRS 9. Similar to the Group’s current hedge accounting policy, the directors are not excluding the forward element of foreign currency forward contracts from designated hedging relationships.
NZ IFRS 15: Revenue from contract with customers
NZ IFRS 15 requires entities to exercise judgement, taking into consideration all of the relevant facts and circumstances when applying each step of the model to contracts with their customers. The standard also specifies the accounting for the incremental costs of obtaining a contract and the costs directly related to fulfilling a contract. In addition, the standard requires extensive disclosures.
The Group adopted NZ IFRS 15 using the modified retrospective method of adoption with the date of initial application of 1 July 2018. Under this method, the standard can be applied either to all contracts at the date of initial application or only to contracts that are not completed at this date. The Group elected to apply the standard to all contracts as at 1 July 2018.
The cumulative effect of initially applying NZ IFRS 15 is recognised at the date of initial application as an adjustment to the opening balance of retained earnings. Therefore, the comparative information was not restated as there was no impact on transition from the figures reported under NZ IAS 11, NZ IAS 18 and related Interpretations.
b. New and amended standards and interpretations not yet adoptedNZ IFRS 16: Leases
NZ IFRS 16, ‘Leases’, replaces the current guidance in NZ IAS 17. Under NZ IFRS 16, a contract is, or contains, a lease if the contract conveys the right to control the use of an identified asset for a period of time in exchange for consideration. Under NZ IAS 17, a lessee was required to make a distinction between a finance lease (on balance sheet) and an operating lease (off balance sheet). NZ IFRS 16 now requires a lessee to recognise a lease liability reflecting future lease payments and a ‘right-of-use asset’ for a number of the Group’s applicable contracts.
The standard will have an impact on the balance sheet and EBITDA, once fully transitioned to the new standard. The estimated impact on the consolidated income statements of the Group for the period ending 30 June 2020 is expected to be:
- An increase in Finance costs (interest expense) of $153k. - Increase in depreciation and amortization expense $1.1m - An increase in EBITDA of $1m. - Rights-of-use assets on the balance sheet of $4.5m with corresponding liabilities.
The above has no cash effect to the Group and the change is for financial reporting purposes only.
Current estimations are likely to change for the period ending 30 June 2020, mainly due to:
- New lease contracts entered by the Group during the financial year. - Any changes to exiting lease contracts; and - Change in management’s judgements to exercise rights of renewals under lease arrangements.
In accordance with the transition provisions of NZ IFRS 16, the Group intends to elect to apply several practical expedients available for transitioning into the new standard. These include:
- The use of hindsight to determine the lease term where the lease term contains options to exercise rights of renewal out of the final term of the lease.
- Non-capitalisation of leases that expire within twelve months from adoption date. Costs relating to these leases will continue to be recognised in the income statement as an expense.
In accordance with the transition provisions of NZ IFRS 16, comparatives will not be restated, with the cumulative effect being recognised in opening retained earnings at the date of initial application of 1 July 2019. Right-of-use assets will be measured at 1 July 2019 at an amount equal to the lease liability remaining at this time.
5. SEGMENT INFORMATIONSegment results
For management purposes, the Group is organised into three business units based on geographical sales market and customer channel. The operating results of the business units are monitored for the purpose of making decisions about resource allocation and performance assessment.
The Group’s reportable segments are:
New Zealand Retail
The company provides these customers with pre-packed value added products (including wood roasted and cold smoked product), whole fresh fish and pre-cut fillets.
New Zealand Foodservice
The company provides these customers with a broad variety of salmon products including whole fresh fish, pre-cut fillets, portions and a range of smoked products.
Export
Predominantly customers based outside New Zealand most of whom currently fall into the Foodservice category as described above.
Segment performance is evaluated at the EBITDA level and results are as follows:
New Zealand
Retail
New Zealand
FoodserviceExport Market Total
$000 $000 $000 $000Year ended 30 June 2019Revenue 40,609 39,150 92,850 172,609 Segment EBITDA 2,197 4,851 16,015 23,063
Year ended 30 June 2018Revenue 41,415 37,811 81,045 160,271 Segment EBITDA 4,904 6,702 16,876 28,482
Depreciation, amortisation, finance income and costs, and fair value gains and losses on financial assets are not allocated to individual segments as the underlying instruments are managed on a group basis.
Segment profit reconciles to profit before income tax as follows:
2019 2018$000 $000
Segment profit 23,063 28,482 Depreciation, amortisation and impairment (6,234) (5,105) Net finance costs (1,092) (690) Group profit before tax 15,737 22,687
The Group does not prepare information allocating assets and liabilities to the market facing segments as all material assets and liabilities are managed on a group basis.
2019 2018Revenue by geographical location of customers $000 $000New Zealand 79,759 79,226 North America 58,479 48,435 Australia 11,862 11,497 Japan 5,893 8,265 China 3,591 1,610 Europe 3,117 2,860 Other export 9,908 8,378 Total revenue 172,608 160,271
Sales net of settlement discounts attributable to individual customers that were greater than 10% of gross revenue for the year was nil (2018 two major customers accounted for $16,595k and $16,535k or 10.4% and 10.3%). These customers were included in the New Zealand Retail segment.
2019: BLUE FRONTIERSNEW ZEAL AND KING SALMON | ANNUAL REPORT FY19 7776
NOTES TO THE F INANCIAL STATEMENTS NOTES TO THE F INANCIAL STATEMENTS
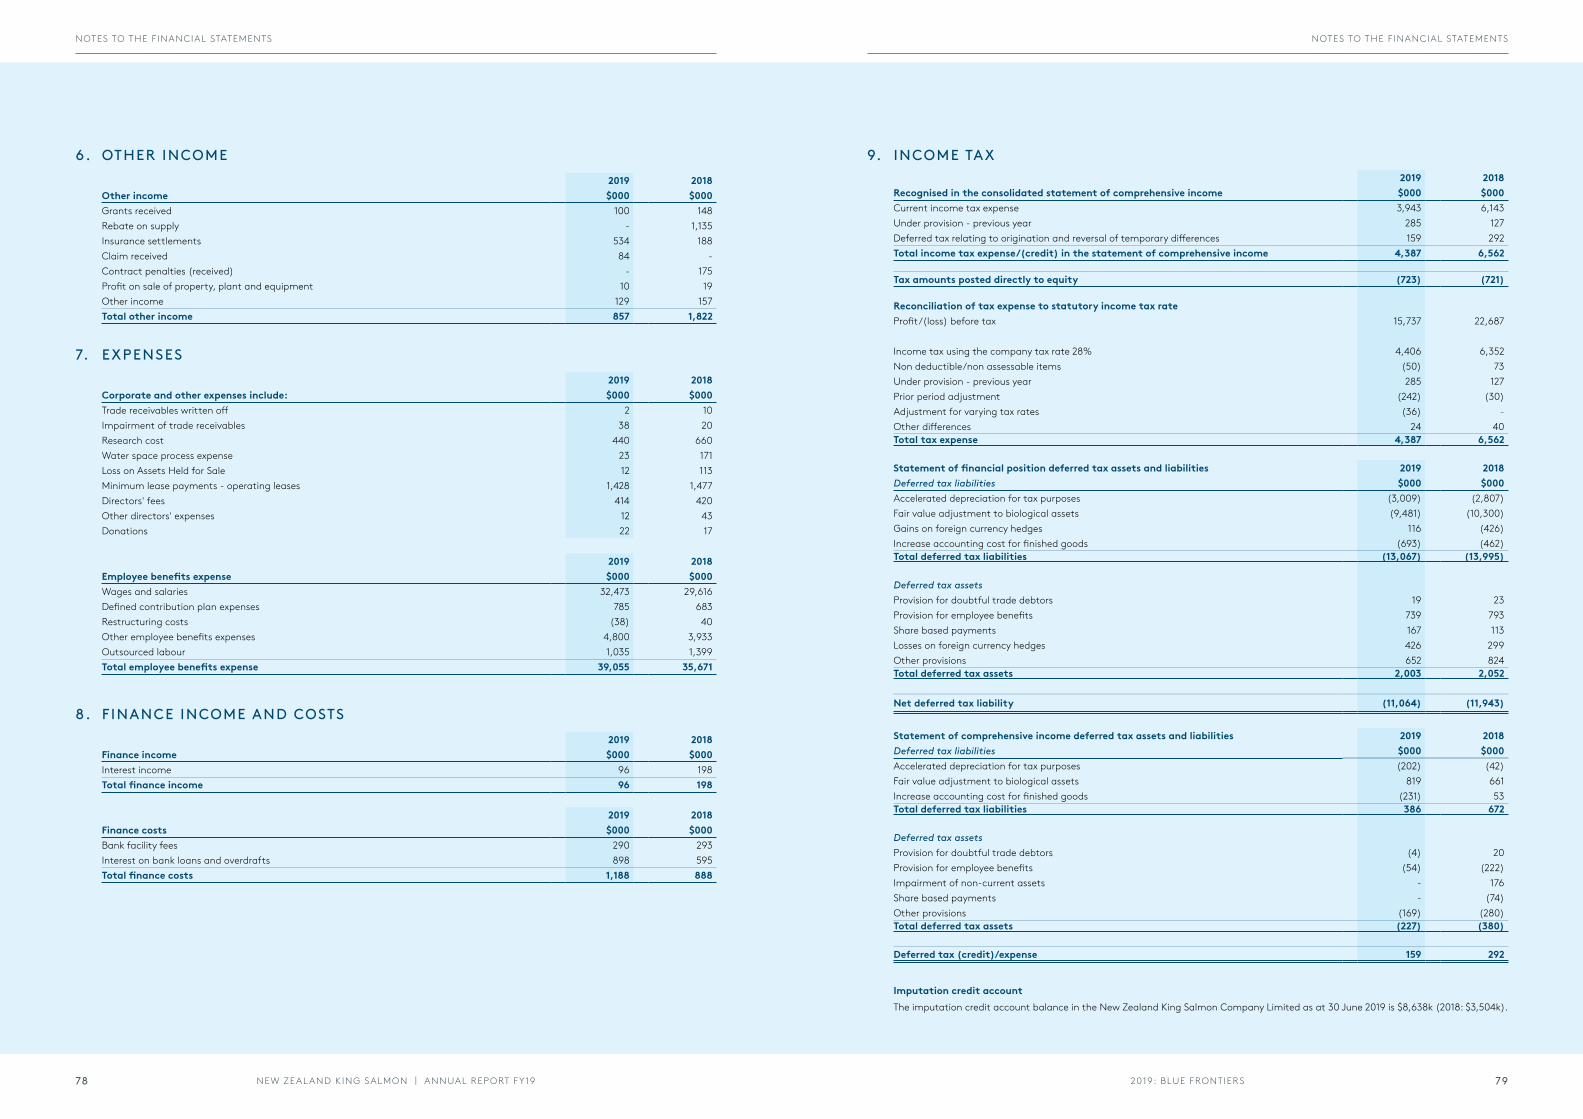
6. OTHER INCOME2019 2018
Other income $000 $000Grants received 100 148 Rebate on supply - 1,135 Insurance settlements 534 188 Claim received 84 - Contract penalties (received) - 175 Profit on sale of property, plant and equipment 10 19 Other income 129 157 Total other income 857 1,822
7. EXPENSES2019 2018
Corporate and other expenses include: $000 $000Trade receivables written off 2 10 Impairment of trade receivables 38 20 Research cost 440 660 Water space process expense 23 171 Loss on Assets Held for Sale 12 113 Minimum lease payments - operating leases 1,428 1,477 Directors' fees 414 420 Other directors' expenses 12 43 Donations 22 17
2019 2018Employee benefits expense $000 $000Wages and salaries 32,473 29,616 Defined contribution plan expenses 785 683 Restructuring costs (38) 40 Other employee benefits expenses 4,800 3,933 Outsourced labour 1,035 1,399 Total employee benefits expense 39,055 35,671
8. F INANCE INCOME AND COSTS2019 2018
Finance income $000 $000Interest income 96 198 Total finance income 96 198
2019 2018Finance costs $000 $000Bank facility fees 290 293 Interest on bank loans and overdrafts 898 595 Total finance costs 1,188 888
9. INCOME TAX2019 2018
Recognised in the consolidated statement of comprehensive income $000 $000Current income tax expense 3,943 6,143 Under provision - previous year 285 127 Deferred tax relating to origination and reversal of temporary differences 159 292 Total income tax expense/(credit) in the statement of comprehensive income 4,387 6,562
Tax amounts posted directly to equity (723) (721)
Reconciliation of tax expense to statutory income tax rateProfit/(loss) before tax 15,737 22,687
Income tax using the company tax rate 28% 4,406 6,352 Non deductible/non assessable items (50) 73 Under provision - previous year 285 127 Prior period adjustment (242) (30) Adjustment for varying tax rates (36) - Other differences 24 40 Total tax expense 4,387 6,562
Statement of financial position deferred tax assets and liabilities 2019 2018Deferred tax liabilities $000 $000Accelerated depreciation for tax purposes (3,009) (2,807) Fair value adjustment to biological assets (9,481) (10,300) Gains on foreign currency hedges 116 (426) Increase accounting cost for finished goods (693) (462) Total deferred tax liabilities (13,067) (13,995)
Deferred tax assetsProvision for doubtful trade debtors 19 23 Provision for employee benefits 739 793 Share based payments 167 113 Losses on foreign currency hedges 426 299 Other provisions 652 824 Total deferred tax assets 2,003 2,052
Net deferred tax liability (11,064) (11,943)
Statement of comprehensive income deferred tax assets and liabilities 2019 2018Deferred tax liabilities $000 $000Accelerated depreciation for tax purposes (202) (42) Fair value adjustment to biological assets 819 661 Increase accounting cost for finished goods (231) 53 Total deferred tax liabilities 386 672
Deferred tax assetsProvision for doubtful trade debtors (4) 20 Provision for employee benefits (54) (222) Impairment of non-current assets - 176 Share based payments - (74) Other provisions (169) (280) Total deferred tax assets (227) (380)
Deferred tax (credit)/expense 159 292
Imputation credit accountThe imputation credit account balance in the New Zealand King Salmon Company Limited as at 30 June 2019 is $8,638k (2018: $3,504k).
2019: BLUE FRONTIERSNEW ZEAL AND KING SALMON | ANNUAL REPORT FY19 7978
NOTES TO THE F INANCIAL STATEMENTS NOTES TO THE F INANCIAL STATEMENTS
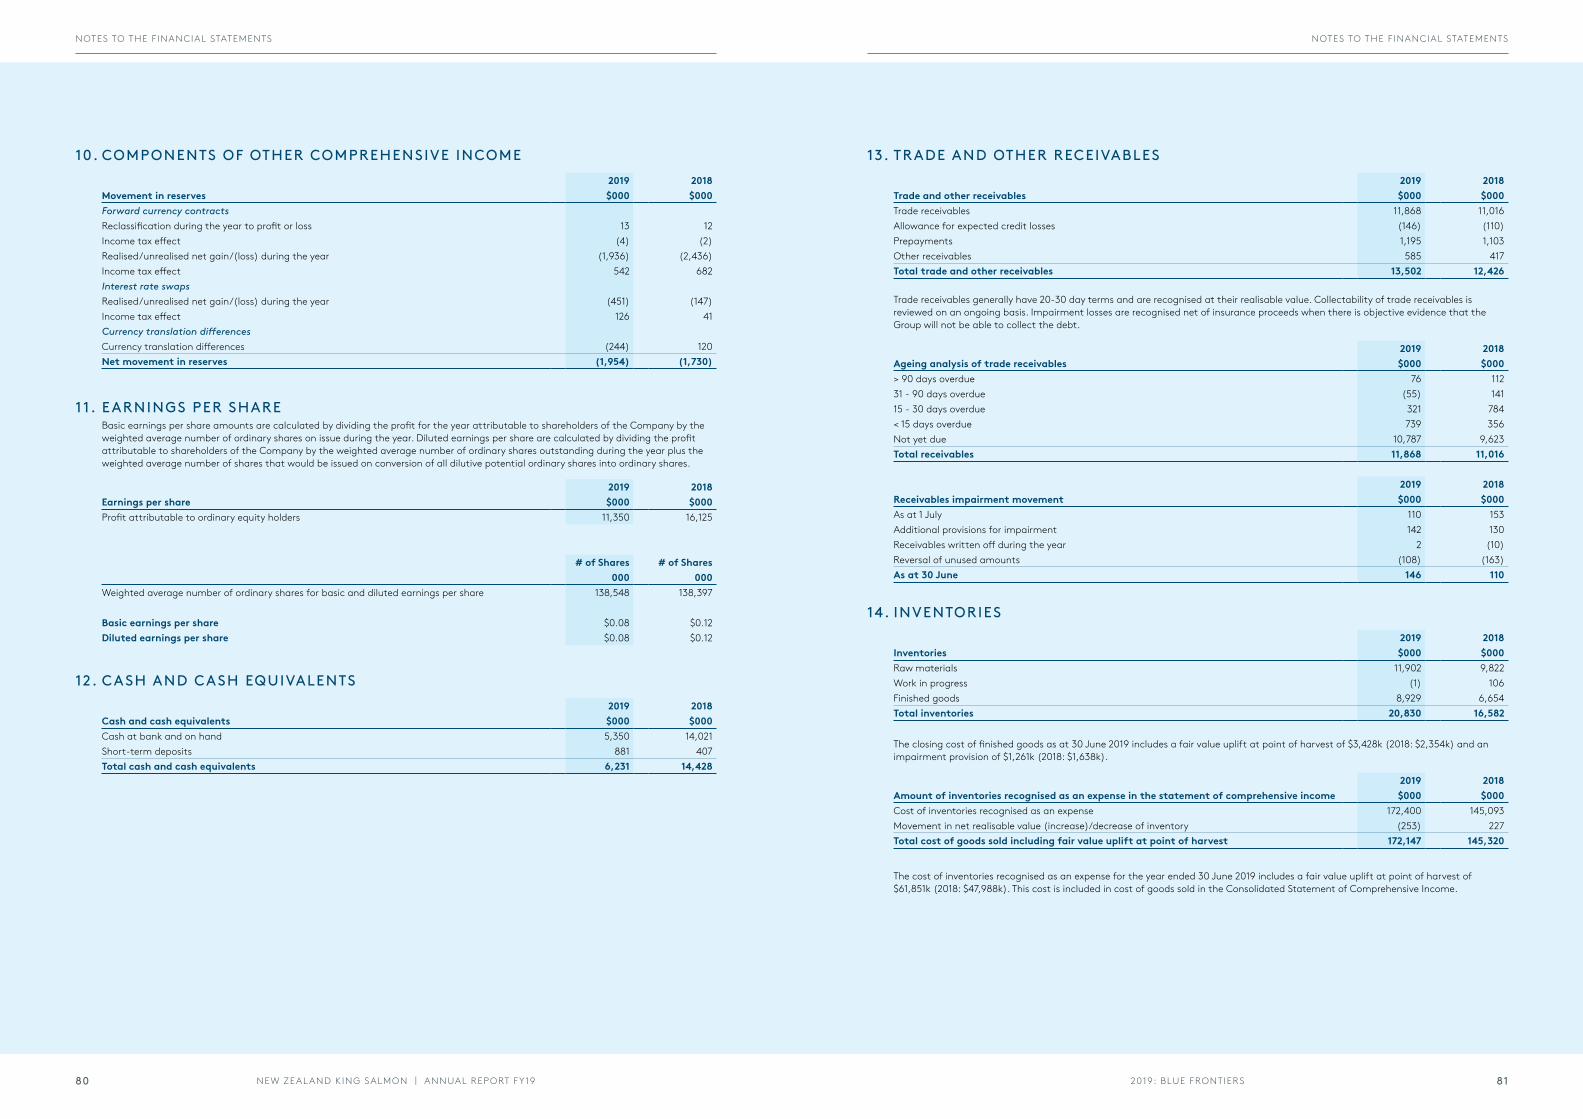
10. COMPONENTS OF OTHER COMPREHENSIVE INCOME2019 2018
Movement in reserves $000 $000Forward currency contractsReclassification during the year to profit or loss 13 12 Income tax effect (4) (2) Realised/unrealised net gain/(loss) during the year (1,936) (2,436) Income tax effect 542 682 Interest rate swapsRealised/unrealised net gain/(loss) during the year (451) (147) Income tax effect 126 41 Currency translation differencesCurrency translation differences (244) 120 Net movement in reserves (1,954) (1,730)
1 1. EARNINGS PER SHAREBasic earnings per share amounts are calculated by dividing the profit for the year attributable to shareholders of the Company by the weighted average number of ordinary shares on issue during the year. Diluted earnings per share are calculated by dividing the profit attributable to shareholders of the Company by the weighted average number of ordinary shares outstanding during the year plus the weighted average number of shares that would be issued on conversion of all dilutive potential ordinary shares into ordinary shares.
2019 2018Earnings per share $000 $000Profit attributable to ordinary equity holders 11,350 16,125
# of Shares # of Shares000 000
Weighted average number of ordinary shares for basic and diluted earnings per share 138,548 138,397
Basic earnings per share $0.08 $0.12Diluted earnings per share $0.08 $0.12
12. CASH AND CASH EQUIVALENTS2019 2018
Cash and cash equivalents $000 $000Cash at bank and on hand 5,350 14,021 Short-term deposits 881 407 Total cash and cash equivalents 6,231 14,428
13. TRADE AND OTHER RECEIVABLES2019 2018
Trade and other receivables $000 $000Trade receivables 11,868 11,016 Allowance for expected credit losses (146) (110) Prepayments 1,195 1,103 Other receivables 585 417 Total trade and other receivables 13,502 12,426
Trade receivables generally have 20-30 day terms and are recognised at their realisable value. Collectability of trade receivables is reviewed on an ongoing basis. Impairment losses are recognised net of insurance proceeds when there is objective evidence that the Group will not be able to collect the debt.
2019 2018Ageing analysis of trade receivables $000 $000> 90 days overdue 76 112 31 - 90 days overdue (55) 141 15 - 30 days overdue 321 784 < 15 days overdue 739 356 Not yet due 10,787 9,623 Total receivables 11,868 11,016
2019 2018Receivables impairment movement $000 $000As at 1 July 110 153 Additional provisions for impairment 142 130 Receivables written off during the year 2 (10) Reversal of unused amounts (108) (163) As at 30 June 146 110
14. INVENTORIES2019 2018
Inventories $000 $000Raw materials 11,902 9,822 Work in progress (1) 106 Finished goods 8,929 6,654 Total inventories 20,830 16,582
The closing cost of finished goods as at 30 June 2019 includes a fair value uplift at point of harvest of $3,428k (2018: $2,354k) and an impairment provision of $1,261k (2018: $1,638k).
2019 2018Amount of inventories recognised as an expense in the statement of comprehensive income $000 $000Cost of inventories recognised as an expense 172,400 145,093 Movement in net realisable value (increase)/decrease of inventory (253) 227 Total cost of goods sold including fair value uplift at point of harvest 172,147 145,320
The cost of inventories recognised as an expense for the year ended 30 June 2019 includes a fair value uplift at point of harvest of $61,851k (2018: $47,988k). This cost is included in cost of goods sold in the Consolidated Statement of Comprehensive Income.
2019: BLUE FRONTIERSNEW ZEAL AND KING SALMON | ANNUAL REPORT FY19 8180
NOTES TO THE F INANCIAL STATEMENTS NOTES TO THE F INANCIAL STATEMENTS
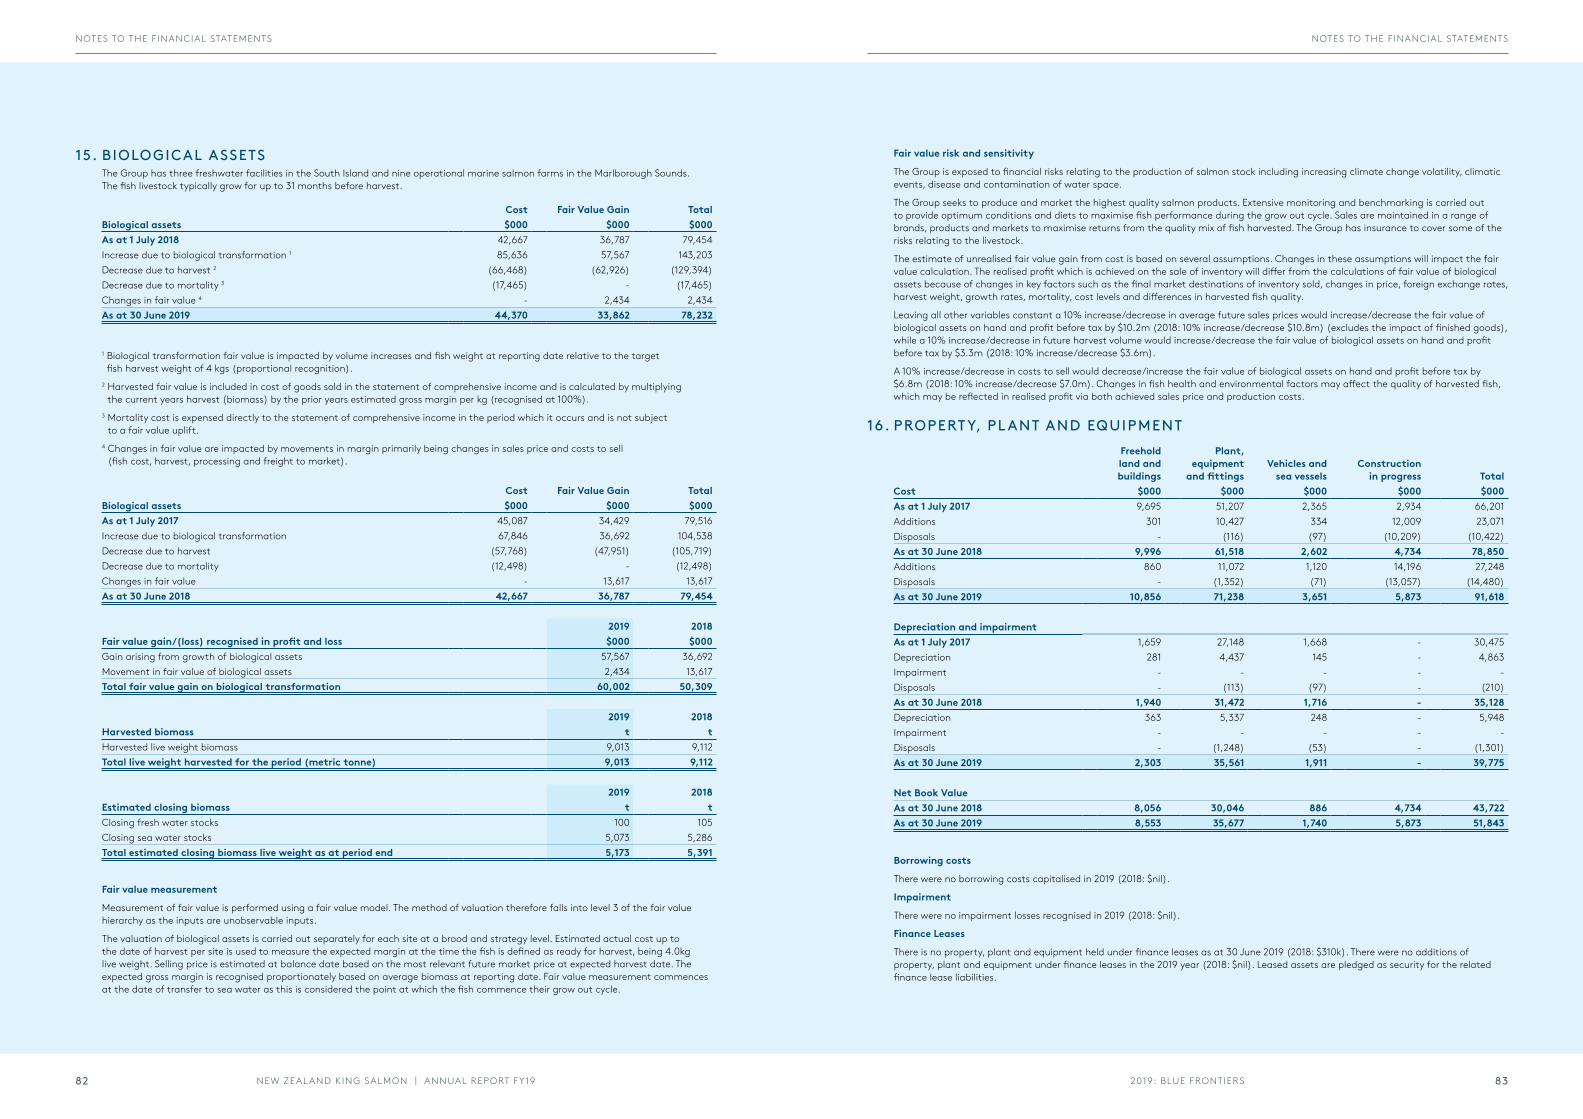
15. BIOLOGICAL ASSETSThe Group has three freshwater facilities in the South Island and nine operational marine salmon farms in the Marlborough Sounds. The fish livestock typically grow for up to 31 months before harvest.
Cost Fair Value Gain TotalBiological assets $000 $000 $000As at 1 July 2018 42,667 36,787 79,454 Increase due to biological transformation 1 85,636 57,567 143,203 Decrease due to harvest 2 (66,468) (62,926) (129,394) Decrease due to mortality 3 (17,465) - (17,465) Changes in fair value 4 - 2,434 2,434 As at 30 June 2019 44,370 33,862 78,232
1 Biological transformation fair value is impacted by volume increases and fish weight at reporting date relative to the target fish harvest weight of 4 kgs (proportional recognition).
2 Harvested fair value is included in cost of goods sold in the statement of comprehensive income and is calculated by multiplying the current years harvest (biomass) by the prior years estimated gross margin per kg (recognised at 100%).
3 Mortality cost is expensed directly to the statement of comprehensive income in the period which it occurs and is not subject to a fair value uplift.
4 Changes in fair value are impacted by movements in margin primarily being changes in sales price and costs to sell (fish cost, harvest, processing and freight to market).
Cost Fair Value Gain TotalBiological assets $000 $000 $000As at 1 July 2017 45,087 34,429 79,516 Increase due to biological transformation 67,846 36,692 104,538 Decrease due to harvest (57,768) (47,951) (105,719) Decrease due to mortality (12,498) - (12,498) Changes in fair value - 13,617 13,617 As at 30 June 2018 42,667 36,787 79,454
2019 2018Fair value gain/(loss) recognised in profit and loss $000 $000Gain arising from growth of biological assets 57,567 36,692 Movement in fair value of biological assets 2,434 13,617 Total fair value gain on biological transformation 60,002 50,309
2019 2018Harvested biomass t tHarvested live weight biomass 9,013 9,112 Total live weight harvested for the period (metric tonne) 9,013 9,112
2019 2018Estimated closing biomass t tClosing fresh water stocks 100 105 Closing sea water stocks 5,073 5,286 Total estimated closing biomass live weight as at period end 5,173 5,391
Fair value measurement
Measurement of fair value is performed using a fair value model. The method of valuation therefore falls into level 3 of the fair value hierarchy as the inputs are unobservable inputs.
The valuation of biological assets is carried out separately for each site at a brood and strategy level. Estimated actual cost up to the date of harvest per site is used to measure the expected margin at the time the fish is defined as ready for harvest, being 4.0kg live weight. Selling price is estimated at balance date based on the most relevant future market price at expected harvest date. The expected gross margin is recognised proportionately based on average biomass at reporting date. Fair value measurement commences at the date of transfer to sea water as this is considered the point at which the fish commence their grow out cycle.
Fair value risk and sensitivity
The Group is exposed to financial risks relating to the production of salmon stock including increasing climate change volatility, climatic events, disease and contamination of water space.
The Group seeks to produce and market the highest quality salmon products. Extensive monitoring and benchmarking is carried out to provide optimum conditions and diets to maximise fish performance during the grow out cycle. Sales are maintained in a range of brands, products and markets to maximise returns from the quality mix of fish harvested. The Group has insurance to cover some of the risks relating to the livestock.
The estimate of unrealised fair value gain from cost is based on several assumptions. Changes in these assumptions will impact the fair value calculation. The realised profit which is achieved on the sale of inventory will differ from the calculations of fair value of biological assets because of changes in key factors such as the final market destinations of inventory sold, changes in price, foreign exchange rates, harvest weight, growth rates, mortality, cost levels and differences in harvested fish quality.
Leaving all other variables constant a 10% increase/decrease in average future sales prices would increase/decrease the fair value of biological assets on hand and profit before tax by $10.2m (2018: 10% increase/decrease $10.8m) (excludes the impact of finished goods), while a 10% increase/decrease in future harvest volume would increase/decrease the fair value of biological assets on hand and profit before tax by $3.3m (2018: 10% increase/decrease $3.6m).
A 10% increase/decrease in costs to sell would decrease/increase the fair value of biological assets on hand and profit before tax by $6.8m (2018: 10% increase/decrease $7.0m). Changes in fish health and environmental factors may affect the quality of harvested fish, which may be reflected in realised profit via both achieved sales price and production costs.
16. PROPERT Y, PL ANT AND EQUIPMENTFreehold land and buildings
Plant, equipment
and fittingsVehicles and
sea vesselsConstruction
in progress TotalCost $000 $000 $000 $000 $000As at 1 July 2017 9,695 51,207 2,365 2,934 66,201 Additions 301 10,427 334 12,009 23,071 Disposals - (116) (97) (10,209) (10,422) As at 30 June 2018 9,996 61,518 2,602 4,734 78,850 Additions 860 11,072 1,120 14,196 27,248 Disposals - (1,352) (71) (13,057) (14,480) As at 30 June 2019 10,856 71,238 3,651 5,873 91,618
Depreciation and impairmentAs at 1 July 2017 1,659 27,148 1,668 - 30,475 Depreciation 281 4,437 145 - 4,863 Impairment - - - - - Disposals - (113) (97) - (210) As at 30 June 2018 1,940 31,472 1,716 - 35,128 Depreciation 363 5,337 248 - 5,948 Impairment - - - - - Disposals - (1,248) (53) - (1,301) As at 30 June 2019 2,303 35,561 1,911 - 39,775
Net Book ValueAs at 30 June 2018 8,056 30,046 886 4,734 43,722 As at 30 June 2019 8,553 35,677 1,740 5,873 51,843
Borrowing costs
There were no borrowing costs capitalised in 2019 (2018: $nil).
Impairment
There were no impairment losses recognised in 2019 (2018: $nil).
Finance Leases
There is no property, plant and equipment held under finance leases as at 30 June 2019 (2018: $310k). There were no additions of property, plant and equipment under finance leases in the 2019 year (2018: $nil). Leased assets are pledged as security for the related finance lease liabilities.
2019: BLUE FRONTIERSNEW ZEAL AND KING SALMON | ANNUAL REPORT FY19 8382
NOTES TO THE F INANCIAL STATEMENTS NOTES TO THE F INANCIAL STATEMENTS
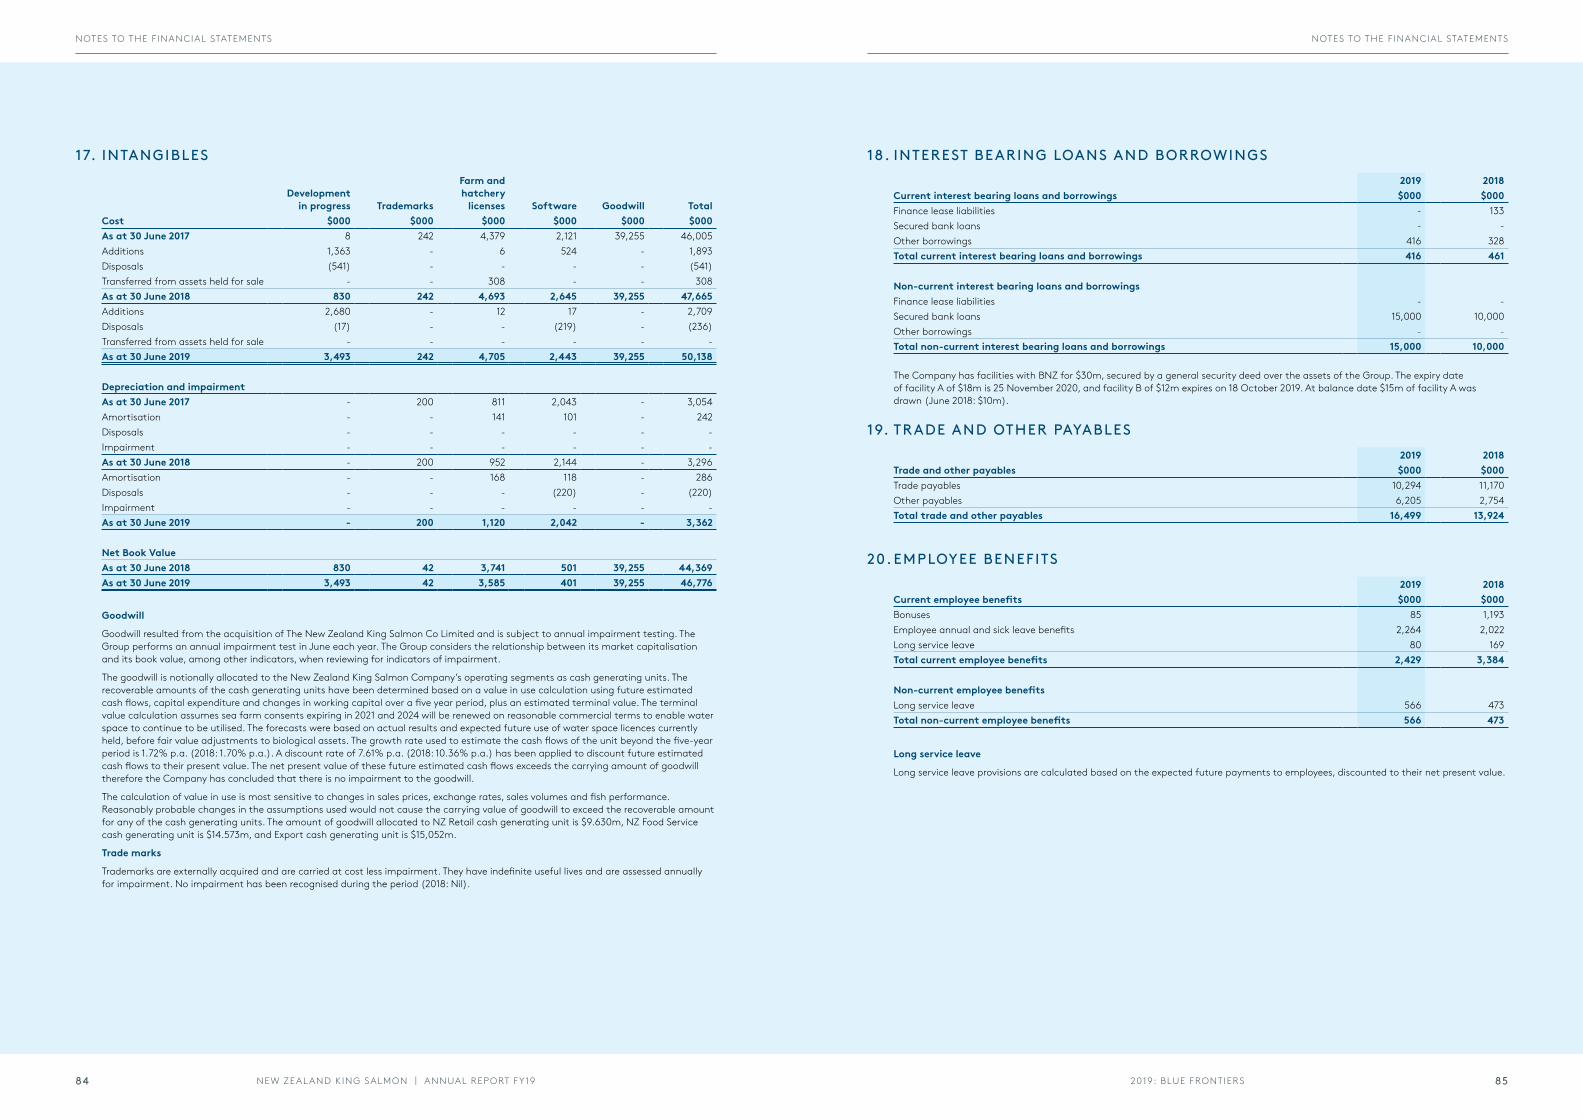
17. INTANGIBLES
Development in progress Trademarks
Farm and hatchery
licenses Software Goodwill TotalCost $000 $000 $000 $000 $000 $000As at 30 June 2017 8 242 4,379 2,121 39,255 46,005 Additions 1,363 - 6 524 - 1,893 Disposals (541) - - - - (541) Transferred from assets held for sale - - 308 - - 308 As at 30 June 2018 830 242 4,693 2,645 39,255 47,665 Additions 2,680 - 12 17 - 2,709 Disposals (17) - - (219) - (236) Transferred from assets held for sale - - - - - - As at 30 June 2019 3,493 242 4,705 2,443 39,255 50,138
Depreciation and impairmentAs at 30 June 2017 - 200 811 2,043 - 3,054 Amortisation - - 141 101 - 242 Disposals - - - - - - Impairment - - - - - - As at 30 June 2018 - 200 952 2,144 - 3,296 Amortisation - - 168 118 - 286 Disposals - - - (220) - (220) Impairment - - - - - - As at 30 June 2019 - 200 1,120 2,042 - 3,362
Net Book ValueAs at 30 June 2018 830 42 3,741 501 39,255 44,369 As at 30 June 2019 3,493 42 3,585 401 39,255 46,776
Goodwill
Goodwill resulted from the acquisition of The New Zealand King Salmon Co Limited and is subject to annual impairment testing. The Group performs an annual impairment test in June each year. The Group considers the relationship between its market capitalisation and its book value, among other indicators, when reviewing for indicators of impairment.
The goodwill is notionally allocated to the New Zealand King Salmon Company’s operating segments as cash generating units. The recoverable amounts of the cash generating units have been determined based on a value in use calculation using future estimated cash flows, capital expenditure and changes in working capital over a five year period, plus an estimated terminal value. The terminal value calculation assumes sea farm consents expiring in 2021 and 2024 will be renewed on reasonable commercial terms to enable water space to continue to be utilised. The forecasts were based on actual results and expected future use of water space licences currently held, before fair value adjustments to biological assets. The growth rate used to estimate the cash flows of the unit beyond the five-year period is 1.72% p.a. (2018: 1.70% p.a.). A discount rate of 7.61% p.a. (2018: 10.36% p.a.) has been applied to discount future estimated cash flows to their present value. The net present value of these future estimated cash flows exceeds the carrying amount of goodwill therefore the Company has concluded that there is no impairment to the goodwill.
The calculation of value in use is most sensitive to changes in sales prices, exchange rates, sales volumes and fish performance. Reasonably probable changes in the assumptions used would not cause the carrying value of goodwill to exceed the recoverable amount for any of the cash generating units. The amount of goodwill allocated to NZ Retail cash generating unit is $9.630m, NZ Food Service cash generating unit is $14.573m, and Export cash generating unit is $15,052m.
Trade marks
Trademarks are externally acquired and are carried at cost less impairment. They have indefinite useful lives and are assessed annually for impairment. No impairment has been recognised during the period (2018: Nil).
18. INTEREST BEARING LOANS AND BORROWINGS2019 2018
Current interest bearing loans and borrowings $000 $000Finance lease liabilities - 133 Secured bank loans - - Other borrowings 416 328 Total current interest bearing loans and borrowings 416 461
Non-current interest bearing loans and borrowingsFinance lease liabilities - - Secured bank loans 15,000 10,000 Other borrowings - - Total non-current interest bearing loans and borrowings 15,000 10,000
The Company has facilities with BNZ for $30m, secured by a general security deed over the assets of the Group. The expiry date of facility A of $18m is 25 November 2020, and facility B of $12m expires on 18 October 2019. At balance date $15m of facility A was drawn (June 2018: $10m).
19. TRADE AND OTHER PAYABLES2019 2018
Trade and other payables $000 $000Trade payables 10,294 11,170 Other payables 6,205 2,754 Total trade and other payables 16,499 13,924
20. EMPLOYEE BENEFITS2019 2018
Current employee benefits $000 $000Bonuses 85 1,193 Employee annual and sick leave benefits 2,264 2,022 Long service leave 80 169 Total current employee benefits 2,429 3,384
Non-current employee benefitsLong service leave 566 473 Total non-current employee benefits 566 473
Long service leave
Long service leave provisions are calculated based on the expected future payments to employees, discounted to their net present value.
2019: BLUE FRONTIERSNEW ZEAL AND KING SALMON | ANNUAL REPORT FY19 8584
NOTES TO THE F INANCIAL STATEMENTS NOTES TO THE F INANCIAL STATEMENTS
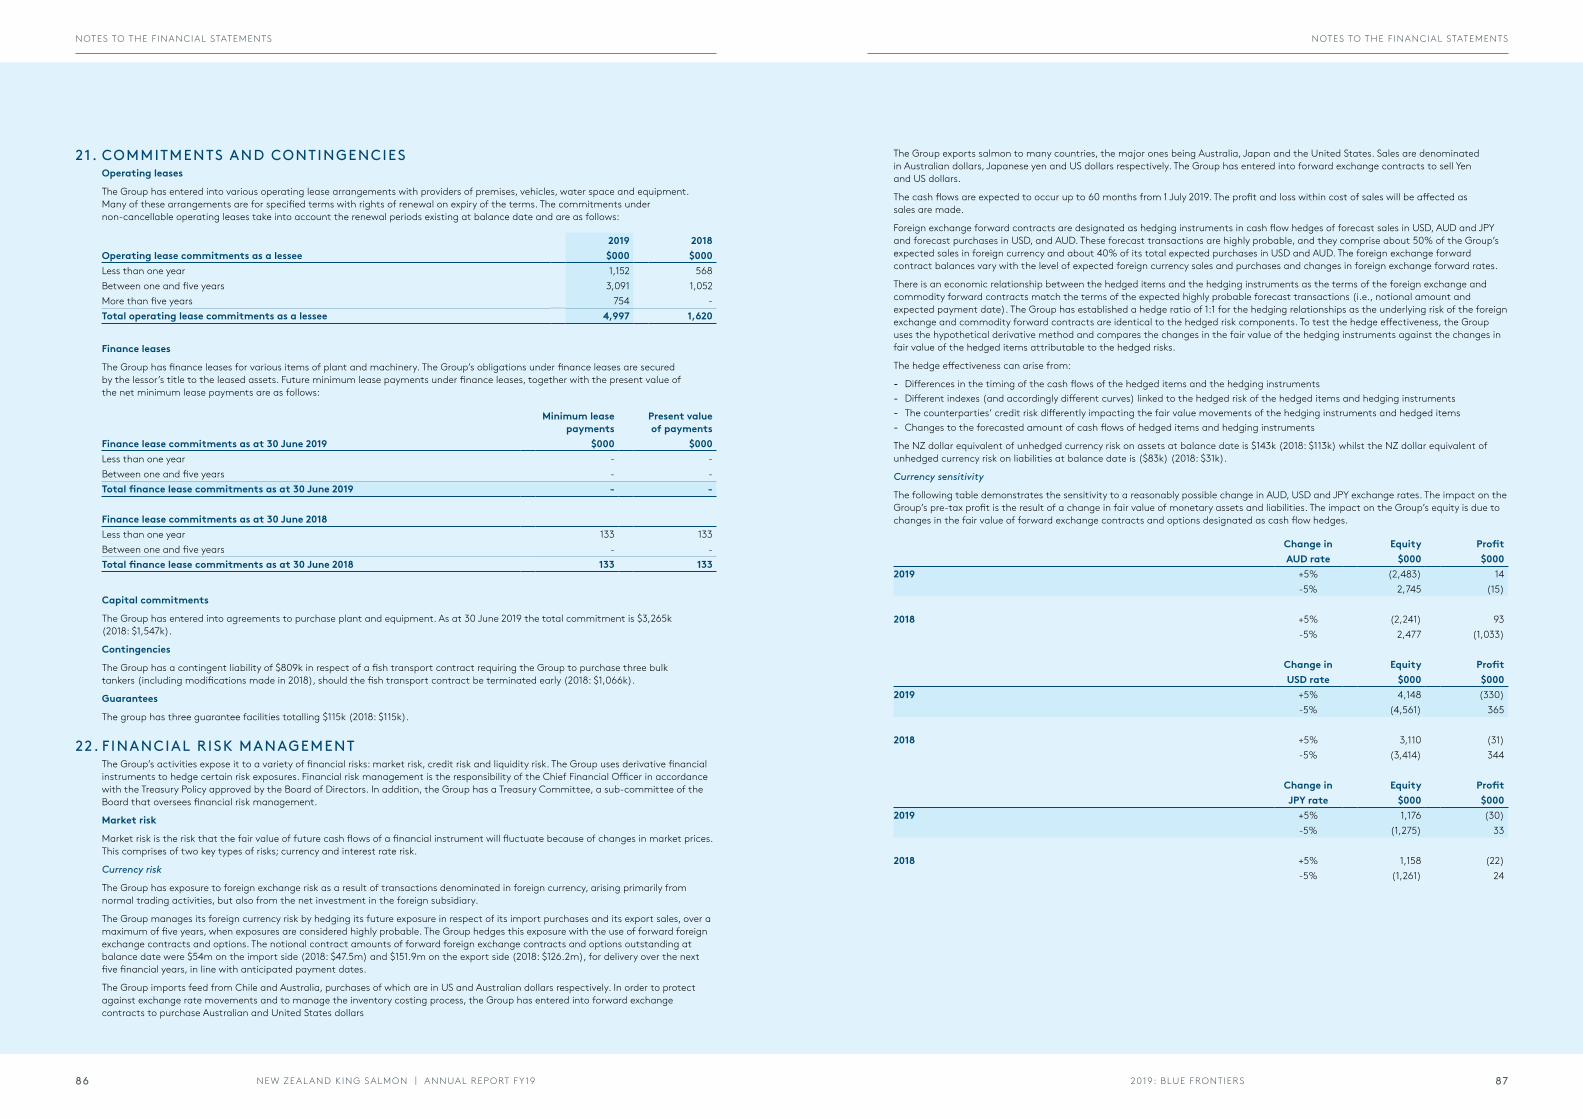
21. COMMITMENTS AND CONTINGENCIESOperating leases
The Group has entered into various operating lease arrangements with providers of premises, vehicles, water space and equipment. Many of these arrangements are for specified terms with rights of renewal on expiry of the terms. The commitments under non-cancellable operating leases take into account the renewal periods existing at balance date and are as follows:
2019 2018Operating lease commitments as a lessee $000 $000Less than one year 1,152 568 Between one and five years 3,091 1,052 More than five years 754 - Total operating lease commitments as a lessee 4,997 1,620
Finance leases
The Group has finance leases for various items of plant and machinery. The Group’s obligations under finance leases are secured by the lessor’s title to the leased assets. Future minimum lease payments under finance leases, together with the present value of the net minimum lease payments are as follows:
Minimum lease payments
Present value of payments
Finance lease commitments as at 30 June 2019 $000 $000Less than one year - - Between one and five years - - Total finance lease commitments as at 30 June 2019 - -
Finance lease commitments as at 30 June 2018Less than one year 133 133 Between one and five years - - Total finance lease commitments as at 30 June 2018 133 133
Capital commitments
The Group has entered into agreements to purchase plant and equipment. As at 30 June 2019 the total commitment is $3,265k (2018: $1,547k).
Contingencies
The Group has a contingent liability of $809k in respect of a fish transport contract requiring the Group to purchase three bulk tankers (including modifications made in 2018), should the fish transport contract be terminated early (2018: $1,066k).
Guarantees
The group has three guarantee facilities totalling $115k (2018: $115k).
22. F INANCIAL RISK MANAGEMENTThe Group’s activities expose it to a variety of financial risks: market risk, credit risk and liquidity risk. The Group uses derivative financial instruments to hedge certain risk exposures. Financial risk management is the responsibility of the Chief Financial Officer in accordance with the Treasury Policy approved by the Board of Directors. In addition, the Group has a Treasury Committee, a sub-committee of the Board that oversees financial risk management.
Market risk
Market risk is the risk that the fair value of future cash flows of a financial instrument will fluctuate because of changes in market prices. This comprises of two key types of risks; currency and interest rate risk.
Currency risk
The Group has exposure to foreign exchange risk as a result of transactions denominated in foreign currency, arising primarily from normal trading activities, but also from the net investment in the foreign subsidiary.
The Group manages its foreign currency risk by hedging its future exposure in respect of its import purchases and its export sales, over a maximum of five years, when exposures are considered highly probable. The Group hedges this exposure with the use of forward foreign exchange contracts and options. The notional contract amounts of forward foreign exchange contracts and options outstanding at balance date were $54m on the import side (2018: $47.5m) and $151.9m on the export side (2018: $126.2m), for delivery over the next five financial years, in line with anticipated payment dates.
The Group imports feed from Chile and Australia, purchases of which are in US and Australian dollars respectively. In order to protect against exchange rate movements and to manage the inventory costing process, the Group has entered into forward exchange contracts to purchase Australian and United States dollars
The Group exports salmon to many countries, the major ones being Australia, Japan and the United States. Sales are denominated in Australian dollars, Japanese yen and US dollars respectively. The Group has entered into forward exchange contracts to sell Yen and US dollars.
The cash flows are expected to occur up to 60 months from 1 July 2019. The profit and loss within cost of sales will be affected as sales are made.
Foreign exchange forward contracts are designated as hedging instruments in cash flow hedges of forecast sales in USD, AUD and JPY and forecast purchases in USD, and AUD. These forecast transactions are highly probable, and they comprise about 50% of the Group’s expected sales in foreign currency and about 40% of its total expected purchases in USD and AUD. The foreign exchange forward contract balances vary with the level of expected foreign currency sales and purchases and changes in foreign exchange forward rates.
There is an economic relationship between the hedged items and the hedging instruments as the terms of the foreign exchange and commodity forward contracts match the terms of the expected highly probable forecast transactions (i.e., notional amount and expected payment date). The Group has established a hedge ratio of 1:1 for the hedging relationships as the underlying risk of the foreign exchange and commodity forward contracts are identical to the hedged risk components. To test the hedge effectiveness, the Group uses the hypothetical derivative method and compares the changes in the fair value of the hedging instruments against the changes in fair value of the hedged items attributable to the hedged risks.
The hedge effectiveness can arise from:
- Differences in the timing of the cash flows of the hedged items and the hedging instruments - Different indexes (and accordingly different curves) linked to the hedged risk of the hedged items and hedging instruments - The counterparties’ credit risk differently impacting the fair value movements of the hedging instruments and hedged items - Changes to the forecasted amount of cash flows of hedged items and hedging instruments
The NZ dollar equivalent of unhedged currency risk on assets at balance date is $143k (2018: $113k) whilst the NZ dollar equivalent of unhedged currency risk on liabilities at balance date is ($83k) (2018: $31k).
Currency sensitivity
The following table demonstrates the sensitivity to a reasonably possible change in AUD, USD and JPY exchange rates. The impact on the Group’s pre-tax profit is the result of a change in fair value of monetary assets and liabilities. The impact on the Group’s equity is due to changes in the fair value of forward exchange contracts and options designated as cash flow hedges.
Change in Equity ProfitAUD rate $000 $000
2019 +5% (2,483) 14 -5% 2,745 (15)
2018 +5% (2,241) 93 -5% 2,477 (1,033)
Change in Equity ProfitUSD rate $000 $000
2019 +5% 4,148 (330) -5% (4,561) 365
2018 +5% 3,110 (31) -5% (3,414) 344
Change in Equity ProfitJPY rate $000 $000
2019 +5% 1,176 (30) -5% (1,275) 33
2018 +5% 1,158 (22) -5% (1,261) 24
2019: BLUE FRONTIERSNEW ZEAL AND KING SALMON | ANNUAL REPORT FY19 8786
NOTES TO THE F INANCIAL STATEMENTS NOTES TO THE F INANCIAL STATEMENTS
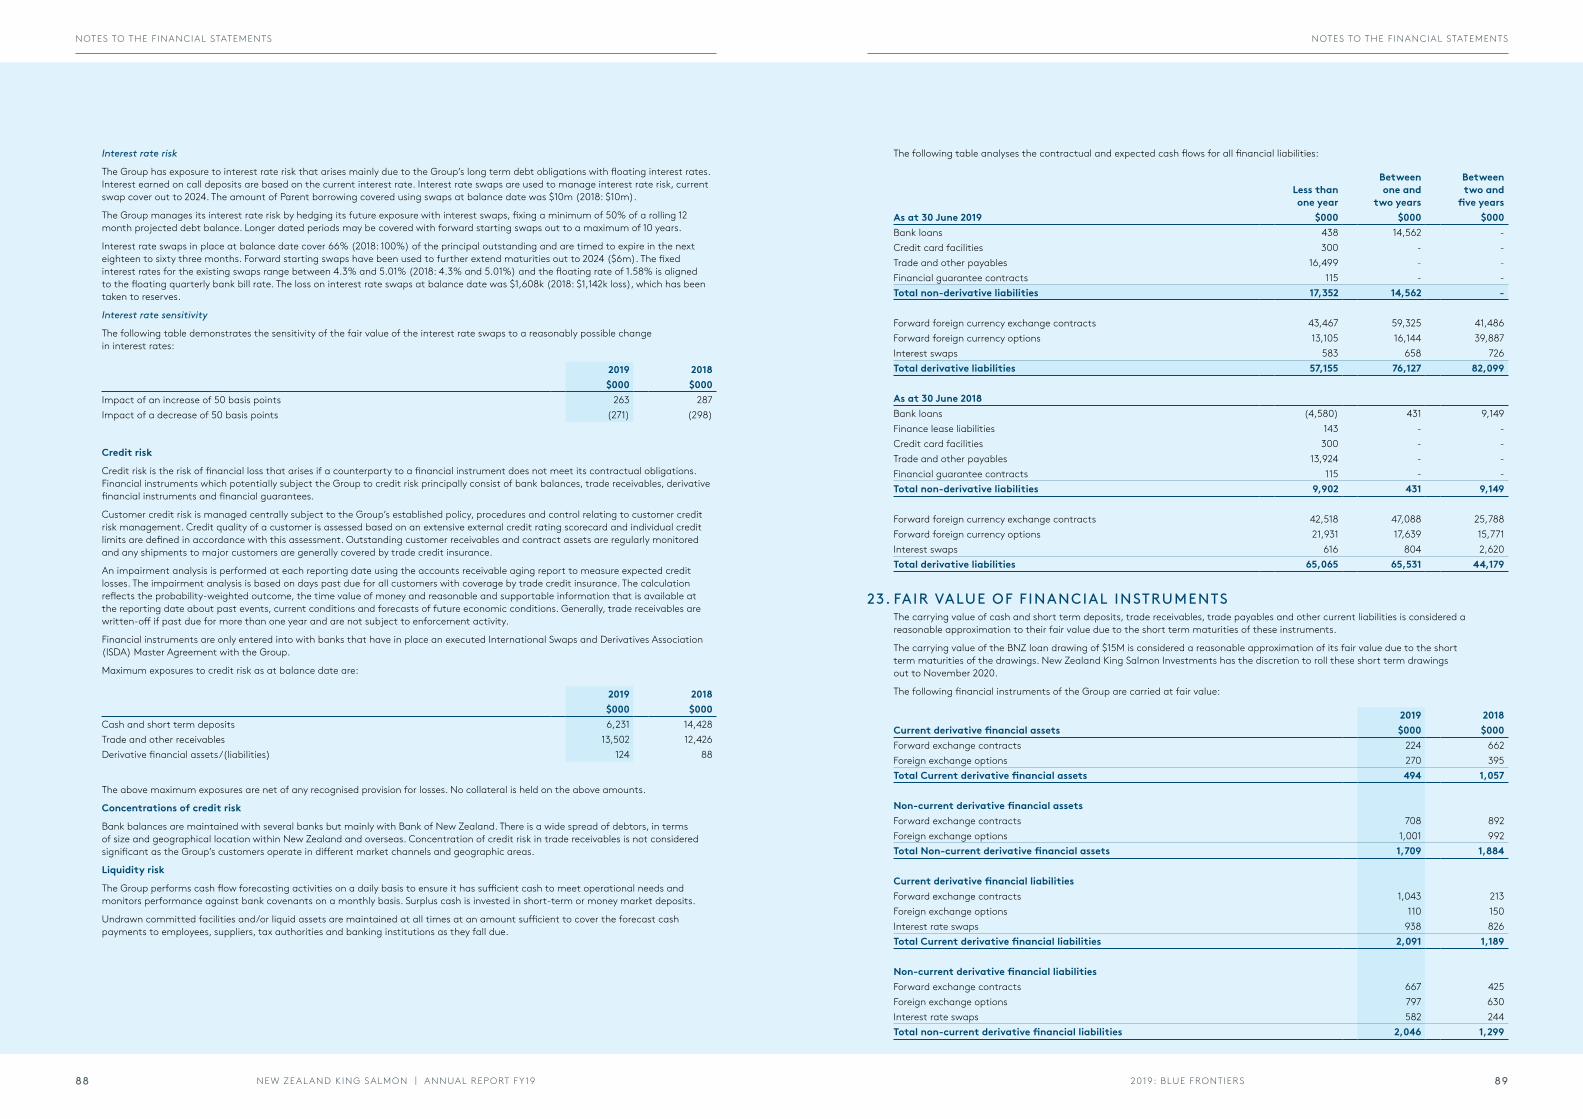
Interest rate risk
The Group has exposure to interest rate risk that arises mainly due to the Group’s long term debt obligations with floating interest rates. Interest earned on call deposits are based on the current interest rate. Interest rate swaps are used to manage interest rate risk, current swap cover out to 2024. The amount of Parent borrowing covered using swaps at balance date was $10m (2018: $10m).
The Group manages its interest rate risk by hedging its future exposure with interest swaps, fixing a minimum of 50% of a rolling 12 month projected debt balance. Longer dated periods may be covered with forward starting swaps out to a maximum of 10 years.
Interest rate swaps in place at balance date cover 66% (2018: 100%) of the principal outstanding and are timed to expire in the next eighteen to sixty three months. Forward starting swaps have been used to further extend maturities out to 2024 ($6m). The fixed interest rates for the existing swaps range between 4.3% and 5.01% (2018: 4.3% and 5.01%) and the floating rate of 1.58% is aligned to the floating quarterly bank bill rate. The loss on interest rate swaps at balance date was $1,608k (2018: $1,142k loss), which has been taken to reserves.
Interest rate sensitivity
The following table demonstrates the sensitivity of the fair value of the interest rate swaps to a reasonably possible change in interest rates:
2019 2018$000 $000
Impact of an increase of 50 basis points 263 287 Impact of a decrease of 50 basis points (271) (298)
Credit risk
Credit risk is the risk of financial loss that arises if a counterparty to a financial instrument does not meet its contractual obligations. Financial instruments which potentially subject the Group to credit risk principally consist of bank balances, trade receivables, derivative financial instruments and financial guarantees.
Customer credit risk is managed centrally subject to the Group’s established policy, procedures and control relating to customer credit risk management. Credit quality of a customer is assessed based on an extensive external credit rating scorecard and individual credit limits are defined in accordance with this assessment. Outstanding customer receivables and contract assets are regularly monitored and any shipments to major customers are generally covered by trade credit insurance.
An impairment analysis is performed at each reporting date using the accounts receivable aging report to measure expected credit losses. The impairment analysis is based on days past due for all customers with coverage by trade credit insurance. The calculation reflects the probability-weighted outcome, the time value of money and reasonable and supportable information that is available at the reporting date about past events, current conditions and forecasts of future economic conditions. Generally, trade receivables are written-off if past due for more than one year and are not subject to enforcement activity.
Financial instruments are only entered into with banks that have in place an executed International Swaps and Derivatives Association (ISDA) Master Agreement with the Group.
Maximum exposures to credit risk as at balance date are:
2019 2018$000 $000
Cash and short term deposits 6,231 14,428 Trade and other receivables 13,502 12,426 Derivative financial assets/(liabilities) 124 88
The above maximum exposures are net of any recognised provision for losses. No collateral is held on the above amounts.
Concentrations of credit risk
Bank balances are maintained with several banks but mainly with Bank of New Zealand. There is a wide spread of debtors, in terms of size and geographical location within New Zealand and overseas. Concentration of credit risk in trade receivables is not considered significant as the Group’s customers operate in different market channels and geographic areas.
Liquidity risk
The Group performs cash flow forecasting activities on a daily basis to ensure it has sufficient cash to meet operational needs and monitors performance against bank covenants on a monthly basis. Surplus cash is invested in short-term or money market deposits.
Undrawn committed facilities and/or liquid assets are maintained at all times at an amount sufficient to cover the forecast cash payments to employees, suppliers, tax authorities and banking institutions as they fall due.
The following table analyses the contractual and expected cash flows for all financial liabilities:
Less than one year
Between one and
two years
Between two and
five yearsAs at 30 June 2019 $000 $000 $000Bank loans 438 14,562 - Credit card facilities 300 - - Trade and other payables 16,499 - - Financial guarantee contracts 115 - - Total non-derivative liabilities 17,352 14,562 -
Forward foreign currency exchange contracts 43,467 59,325 41,486 Forward foreign currency options 13,105 16,144 39,887 Interest swaps 583 658 726 Total derivative liabilities 57,155 76,127 82,099
As at 30 June 2018Bank loans (4,580) 431 9,149 Finance lease liabilities 143 - - Credit card facilities 300 - - Trade and other payables 13,924 - - Financial guarantee contracts 115 - - Total non-derivative liabilities 9,902 431 9,149
Forward foreign currency exchange contracts 42,518 47,088 25,788 Forward foreign currency options 21,931 17,639 15,771 Interest swaps 616 804 2,620 Total derivative liabilities 65,065 65,531 44,179
23. FAIR VALUE OF FINANCIAL INSTRUMENTSThe carrying value of cash and short term deposits, trade receivables, trade payables and other current liabilities is considered a reasonable approximation to their fair value due to the short term maturities of these instruments.
The carrying value of the BNZ loan drawing of $15M is considered a reasonable approximation of its fair value due to the short term maturities of the drawings. New Zealand King Salmon Investments has the discretion to roll these short term drawings out to November 2020.
The following financial instruments of the Group are carried at fair value:
2019 2018Current derivative financial assets $000 $000Forward exchange contracts 224 662 Foreign exchange options 270 395 Total Current derivative financial assets 494 1,057
Non-current derivative financial assetsForward exchange contracts 708 892 Foreign exchange options 1,001 992 Total Non-current derivative financial assets 1,709 1,884
Current derivative financial liabilitiesForward exchange contracts 1,043 213 Foreign exchange options 110 150 Interest rate swaps 938 826 Total Current derivative financial liabilities 2,091 1,189
Non-current derivative financial liabilitiesForward exchange contracts 667 425 Foreign exchange options 797 630 Interest rate swaps 582 244 Total non-current derivative financial liabilities 2,046 1,299
2019: BLUE FRONTIERSNEW ZEAL AND KING SALMON | ANNUAL REPORT FY19 8988
NOTES TO THE F INANCIAL STATEMENTS NOTES TO THE F INANCIAL STATEMENTS
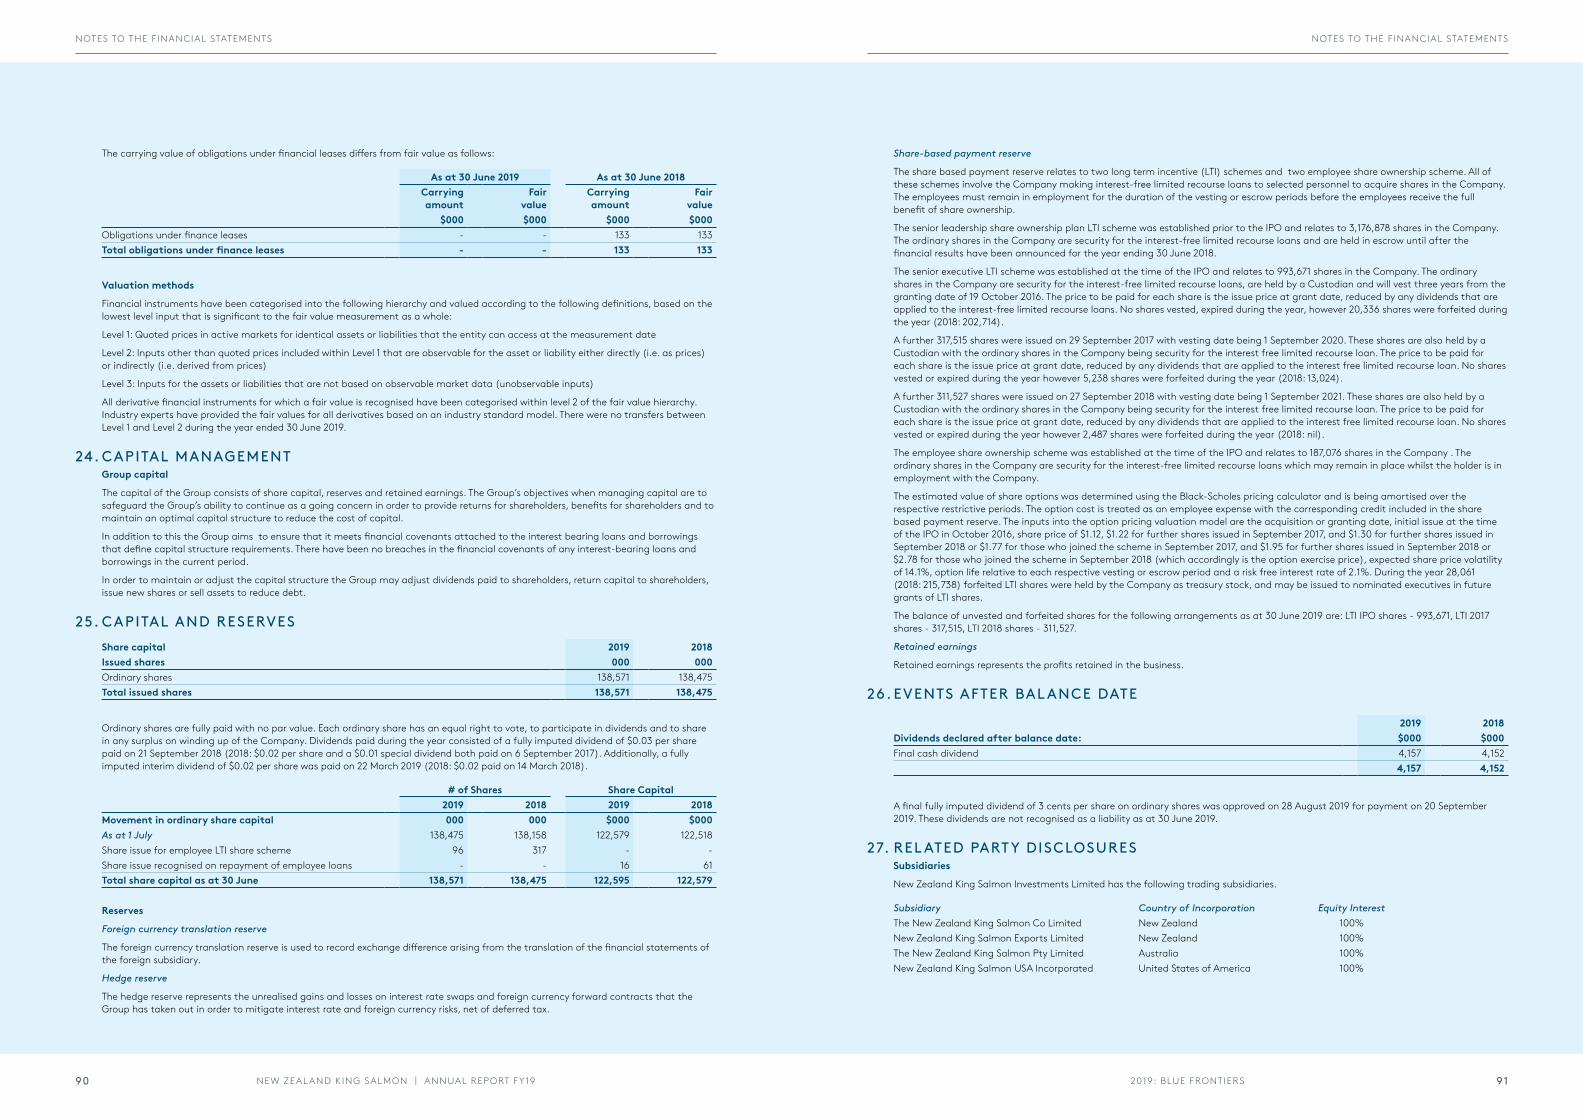
The carrying value of obligations under financial leases differs from fair value as follows:
As at 30 June 2019 As at 30 June 2018Carrying amount
Fair value
Carrying amount
Fair value
$000 $000 $000 $000Obligations under finance leases - - 133 133 Total obligations under finance leases - - 133 133
Valuation methods
Financial instruments have been categorised into the following hierarchy and valued according to the following definitions, based on the lowest level input that is significant to the fair value measurement as a whole:
Level 1: Quoted prices in active markets for identical assets or liabilities that the entity can access at the measurement date
Level 2: Inputs other than quoted prices included within Level 1 that are observable for the asset or liability either directly (i.e. as prices) or indirectly (i.e. derived from prices)
Level 3: Inputs for the assets or liabilities that are not based on observable market data (unobservable inputs)
All derivative financial instruments for which a fair value is recognised have been categorised within level 2 of the fair value hierarchy. Industry experts have provided the fair values for all derivatives based on an industry standard model. There were no transfers between Level 1 and Level 2 during the year ended 30 June 2019.
24. CAPITAL MANAGEMENTGroup capital
The capital of the Group consists of share capital, reserves and retained earnings. The Group’s objectives when managing capital are to safeguard the Group’s ability to continue as a going concern in order to provide returns for shareholders, benefits for shareholders and to maintain an optimal capital structure to reduce the cost of capital.
In addition to this the Group aims to ensure that it meets financial covenants attached to the interest bearing loans and borrowings that define capital structure requirements. There have been no breaches in the financial covenants of any interest-bearing loans and borrowings in the current period.
In order to maintain or adjust the capital structure the Group may adjust dividends paid to shareholders, return capital to shareholders, issue new shares or sell assets to reduce debt.
25. CAPITAL AND RESERVESShare capital 2019 2018Issued shares 000 000Ordinary shares 138,571 138,475 Total issued shares 138,571 138,475
Ordinary shares are fully paid with no par value. Each ordinary share has an equal right to vote, to participate in dividends and to share in any surplus on winding up of the Company. Dividends paid during the year consisted of a fully imputed dividend of $0.03 per share paid on 21 September 2018 (2018: $0.02 per share and a $0.01 special dividend both paid on 6 September 2017). Additionally, a fully imputed interim dividend of $0.02 per share was paid on 22 March 2019 (2018: $0.02 paid on 14 March 2018).
# of Shares Share Capital2019 2018 2019 2018
Movement in ordinary share capital 000 000 $000 $000As at 1 July 138,475 138,158 122,579 122,518 Share issue for employee LTI share scheme 96 317 - - Share issue recognised on repayment of employee loans - - 16 61 Total share capital as at 30 June 138,571 138,475 122,595 122,579
Reserves
Foreign currency translation reserve
The foreign currency translation reserve is used to record exchange difference arising from the translation of the financial statements of the foreign subsidiary.
Hedge reserve
The hedge reserve represents the unrealised gains and losses on interest rate swaps and foreign currency forward contracts that the Group has taken out in order to mitigate interest rate and foreign currency risks, net of deferred tax.
Share-based payment reserve
The share based payment reserve relates to two long term incentive (LTI) schemes and two employee share ownership scheme. All of these schemes involve the Company making interest-free limited recourse loans to selected personnel to acquire shares in the Company. The employees must remain in employment for the duration of the vesting or escrow periods before the employees receive the full benefit of share ownership.
The senior leadership share ownership plan LTI scheme was established prior to the IPO and relates to 3,176,878 shares in the Company. The ordinary shares in the Company are security for the interest-free limited recourse loans and are held in escrow until after the financial results have been announced for the year ending 30 June 2018.
The senior executive LTI scheme was established at the time of the IPO and relates to 993,671 shares in the Company. The ordinary shares in the Company are security for the interest-free limited recourse loans, are held by a Custodian and will vest three years from the granting date of 19 October 2016. The price to be paid for each share is the issue price at grant date, reduced by any dividends that are applied to the interest-free limited recourse loans. No shares vested, expired during the year, however 20,336 shares were forfeited during the year (2018: 202,714).
A further 317,515 shares were issued on 29 September 2017 with vesting date being 1 September 2020. These shares are also held by a Custodian with the ordinary shares in the Company being security for the interest free limited recourse loan. The price to be paid for each share is the issue price at grant date, reduced by any dividends that are applied to the interest free limited recourse loan. No shares vested or expired during the year however 5,238 shares were forfeited during the year (2018: 13,024).
A further 311,527 shares were issued on 27 September 2018 with vesting date being 1 September 2021. These shares are also held by a Custodian with the ordinary shares in the Company being security for the interest free limited recourse loan. The price to be paid for each share is the issue price at grant date, reduced by any dividends that are applied to the interest free limited recourse loan. No shares vested or expired during the year however 2,487 shares were forfeited during the year (2018: nil).
The employee share ownership scheme was established at the time of the IPO and relates to 187,076 shares in the Company . The ordinary shares in the Company are security for the interest-free limited recourse loans which may remain in place whilst the holder is in employment with the Company.
The estimated value of share options was determined using the Black-Scholes pricing calculator and is being amortised over the respective restrictive periods. The option cost is treated as an employee expense with the corresponding credit included in the share based payment reserve. The inputs into the option pricing valuation model are the acquisition or granting date, initial issue at the time of the IPO in October 2016, share price of $1.12, $1.22 for further shares issued in September 2017, and $1.30 for further shares issued in September 2018 or $1.77 for those who joined the scheme in September 2017, and $1.95 for further shares issued in September 2018 or $2.78 for those who joined the scheme in September 2018 (which accordingly is the option exercise price), expected share price volatility of 14.1%, option life relative to each respective vesting or escrow period and a risk free interest rate of 2.1%. During the year 28,061 (2018: 215,738) forfeited LTI shares were held by the Company as treasury stock, and may be issued to nominated executives in future grants of LTI shares.
The balance of unvested and forfeited shares for the following arrangements as at 30 June 2019 are: LTI IPO shares - 993,671, LTI 2017 shares - 317,515, LTI 2018 shares - 311,527.
Retained earnings
Retained earnings represents the profits retained in the business.
26. EVENTS AFTER BAL ANCE DATE
2019 2018Dividends declared after balance date: $000 $000Final cash dividend 4,157 4,152
4,157 4,152
A final fully imputed dividend of 3 cents per share on ordinary shares was approved on 28 August 2019 for payment on 20 September 2019. These dividends are not recognised as a liability as at 30 June 2019.
27. REL ATED PART Y DISCLOSURESSubsidiaries
New Zealand King Salmon Investments Limited has the following trading subsidiaries.
Subsidiary Country of Incorporation Equity Interest The New Zealand King Salmon Co Limited New Zealand 100%New Zealand King Salmon Exports Limited New Zealand 100%The New Zealand King Salmon Pty Limited Australia 100%New Zealand King Salmon USA Incorporated United States of America 100%
2019: BLUE FRONTIERSNEW ZEAL AND KING SALMON | ANNUAL REPORT FY19 9190
NOTES TO THE F INANCIAL STATEMENTS NOTES TO THE F INANCIAL STATEMENTS
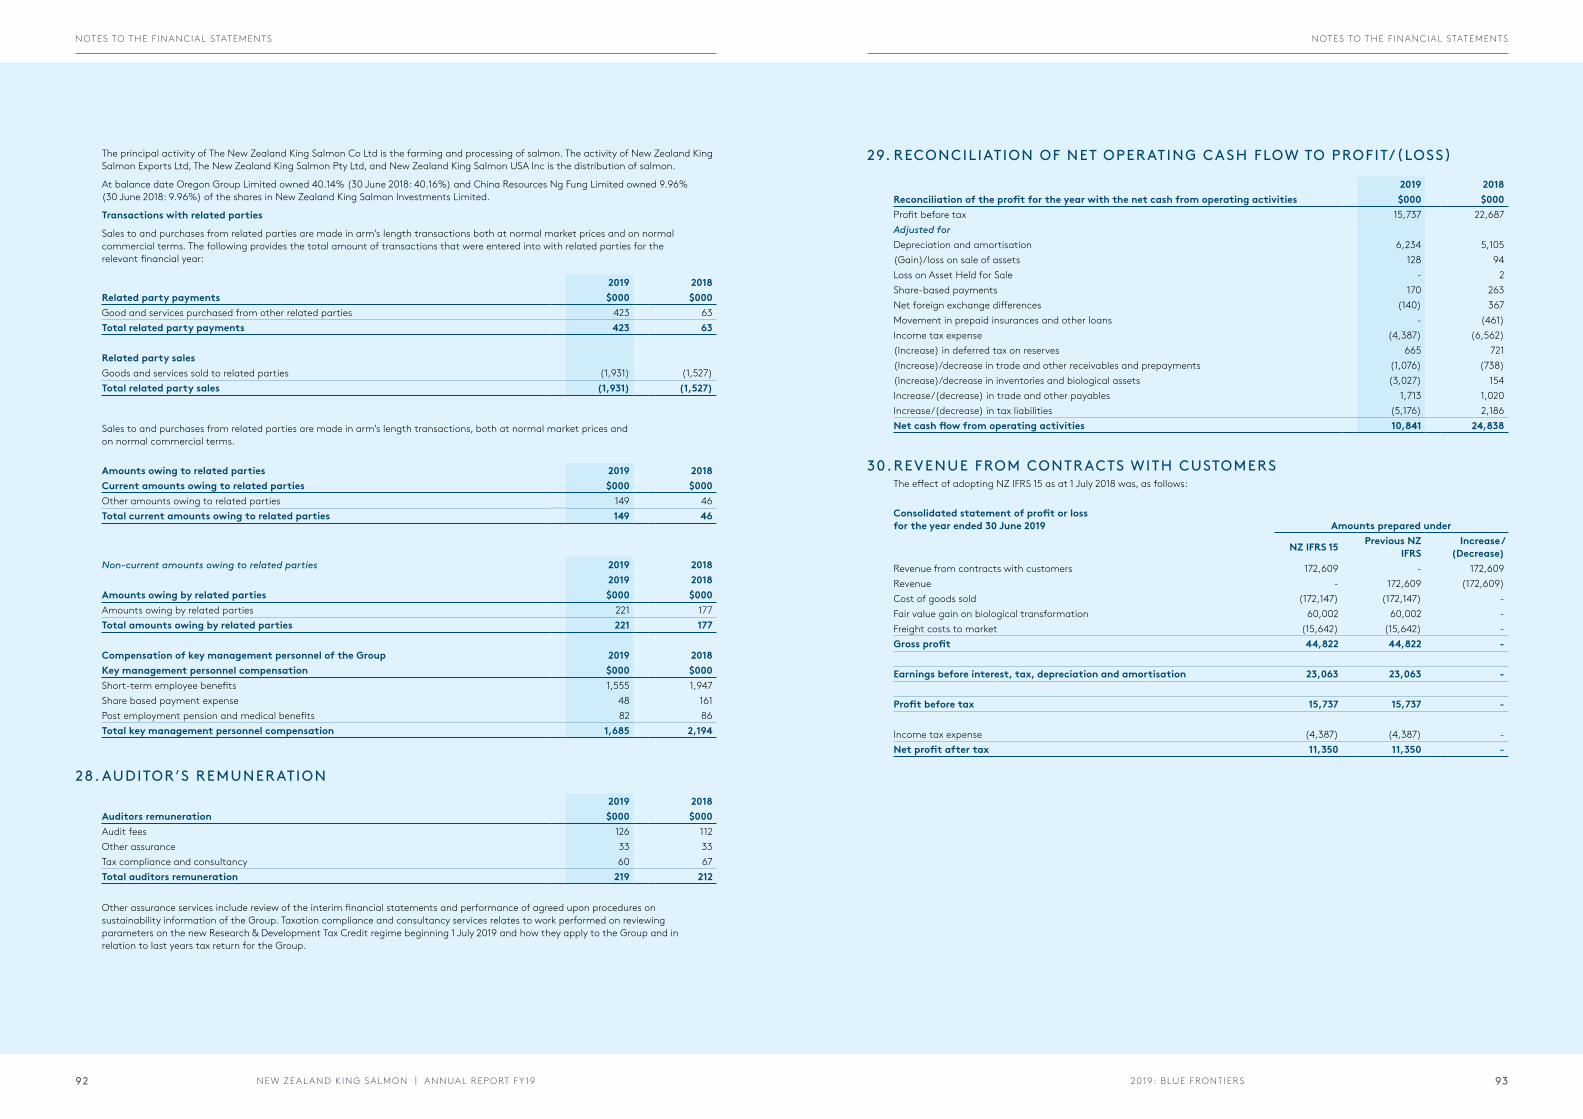
The principal activity of The New Zealand King Salmon Co Ltd is the farming and processing of salmon. The activity of New Zealand King Salmon Exports Ltd, The New Zealand King Salmon Pty Ltd, and New Zealand King Salmon USA Inc is the distribution of salmon.
At balance date Oregon Group Limited owned 40.14% (30 June 2018: 40.16%) and China Resources Ng Fung Limited owned 9.96% (30 June 2018: 9.96%) of the shares in New Zealand King Salmon Investments Limited.
Transactions with related parties
Sales to and purchases from related parties are made in arm’s length transactions both at normal market prices and on normal commercial terms. The following provides the total amount of transactions that were entered into with related parties for the relevant financial year:
2019 2018Related party payments $000 $000Good and services purchased from other related parties 423 63 Total related party payments 423 63
Related party salesGoods and services sold to related parties (1,931) (1,527) Total related party sales (1,931) (1,527)
Sales to and purchases from related parties are made in arm’s length transactions, both at normal market prices and on normal commercial terms.
Amounts owing to related parties 2019 2018Current amounts owing to related parties $000 $000Other amounts owing to related parties 149 46 Total current amounts owing to related parties 149 46
Non-current amounts owing to related parties 2019 20182019 2018
Amounts owing by related parties $000 $000Amounts owing by related parties 221 177 Total amounts owing by related parties 221 177
Compensation of key management personnel of the Group 2019 2018Key management personnel compensation $000 $000Short-term employee benefits 1,555 1,947 Share based payment expense 48 161 Post employment pension and medical benefits 82 86 Total key management personnel compensation 1,685 2,194
28. AUDITOR’S REMUNERATION2019 2018
Auditors remuneration $000 $000Audit fees 126 112 Other assurance 33 33 Tax compliance and consultancy 60 67 Total auditors remuneration 219 212
Other assurance services include review of the interim financial statements and performance of agreed upon procedures on sustainability information of the Group. Taxation compliance and consultancy services relates to work performed on reviewing parameters on the new Research & Development Tax Credit regime beginning 1 July 2019 and how they apply to the Group and in relation to last years tax return for the Group.
29. RECONCILIATION OF NET OPERATING CASH FLOW TO PROFIT/(LOSS)
2019 2018Reconciliation of the profit for the year with the net cash from operating activities $000 $000Profit before tax 15,737 22,687 Adjusted forDepreciation and amortisation 6,234 5,105 (Gain)/loss on sale of assets 128 94 Loss on Asset Held for Sale - 2 Share-based payments 170 263 Net foreign exchange differences (140) 367 Movement in prepaid insurances and other loans - (461) Income tax expense (4,387) (6,562) (Increase) in deferred tax on reserves 665 721 (Increase)/decrease in trade and other receivables and prepayments (1,076) (738) (Increase)/decrease in inventories and biological assets (3,027) 154 Increase/(decrease) in trade and other payables 1,713 1,020 Increase/(decrease) in tax liabilities (5,176) 2,186 Net cash flow from operating activities 10,841 24,838
30. REVENUE FROM CONTRACTS WITH CUSTOMERSThe effect of adopting NZ IFRS 15 as at 1 July 2018 was, as follows:
Consolidated statement of profit or loss for the year ended 30 June 2019 Amounts prepared under
NZ IFRS 15 Previous NZ IFRS
Increase / (Decrease)
Revenue from contracts with customers 172,609 - 172,609 Revenue - 172,609 (172,609) Cost of goods sold (172,147) (172,147) - Fair value gain on biological transformation 60,002 60,002 - Freight costs to market (15,642) (15,642) - Gross profit 44,822 44,822 -
Earnings before interest, tax, depreciation and amortisation 23,063 23,063 -
Profit before tax 15,737 15,737 -
Income tax expense (4,387) (4,387) - Net profit after tax 11,350 11,350 -
2019: BLUE FRONTIERSNEW ZEAL AND KING SALMON | ANNUAL REPORT FY19 9392
NOTES TO THE F INANCIAL STATEMENTS NOTES TO THE F INANCIAL STATEMENTS
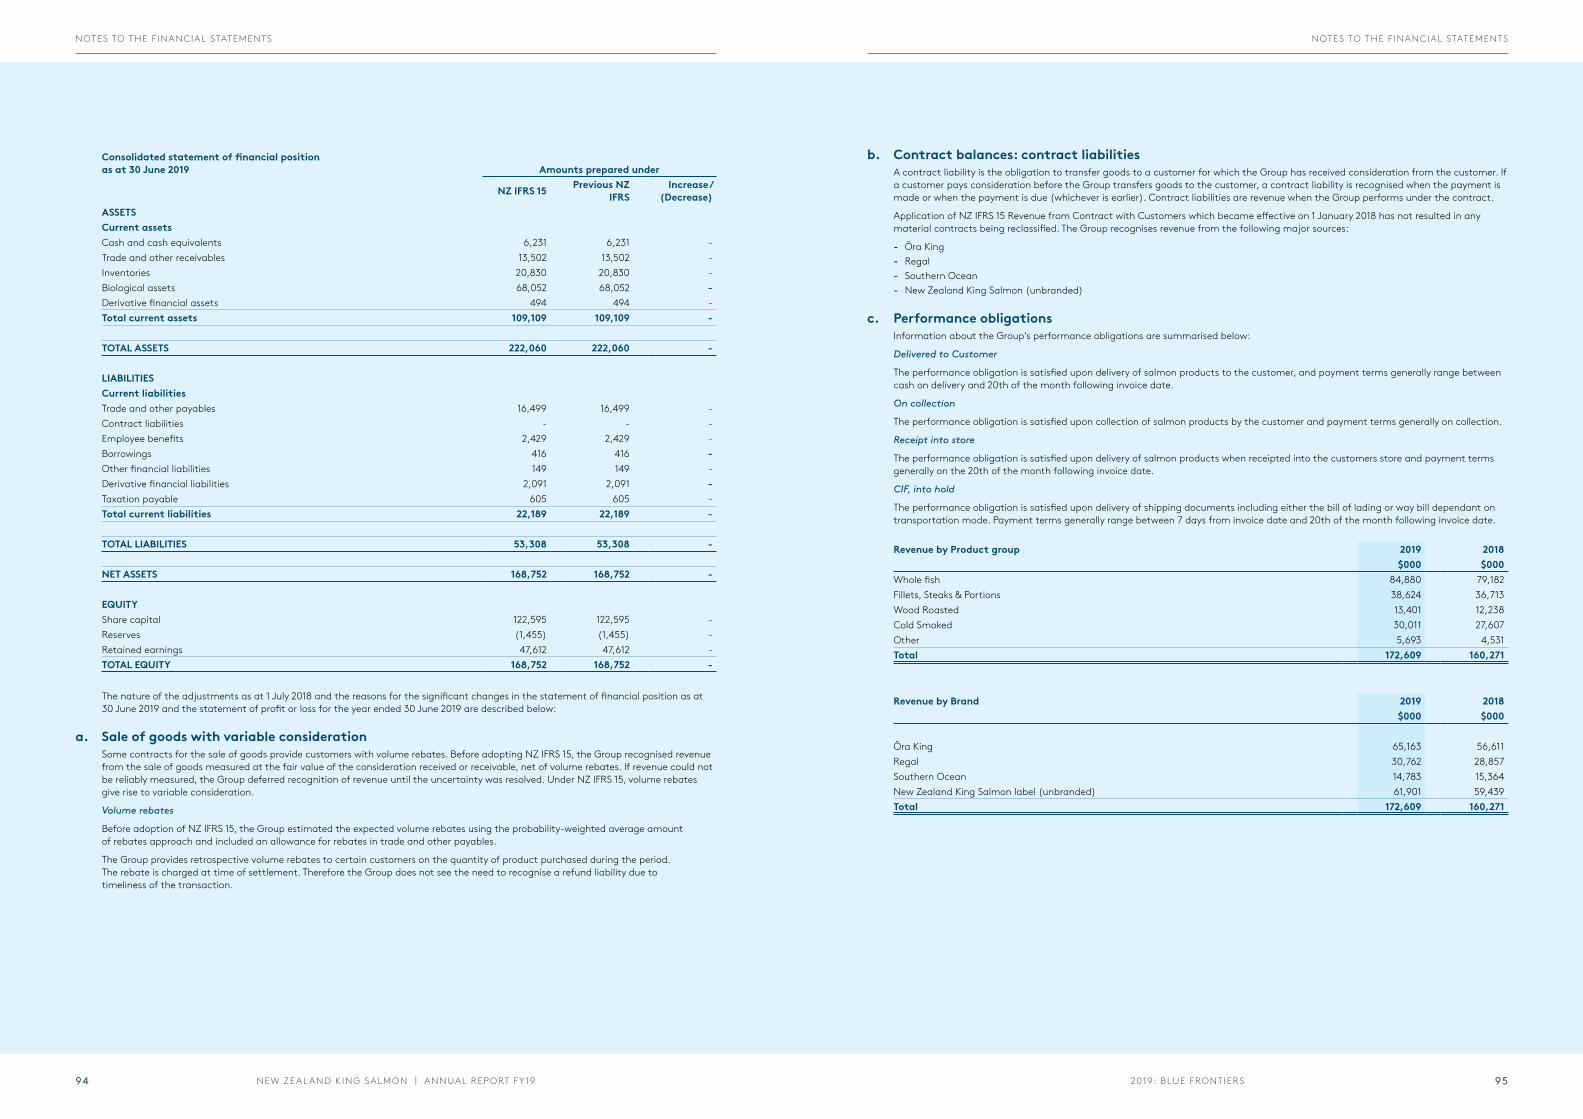
Consolidated statement of financial position as at 30 June 2019 Amounts prepared under
NZ IFRS 15 Previous NZ IFRS
Increase / (Decrease)
ASSETSCurrent assetsCash and cash equivalents 6,231 6,231 - Trade and other receivables 13,502 13,502 - Inventories 20,830 20,830 - Biological assets 68,052 68,052 - Derivative financial assets 494 494 - Total current assets 109,109 109,109 -
TOTAL ASSETS 222,060 222,060 -
LIABILITIESCurrent liabilitiesTrade and other payables 16,499 16,499 - Contract liabilities - - - Employee benefits 2,429 2,429 - Borrowings 416 416 - Other financial liabilities 149 149 - Derivative financial liabilities 2,091 2,091 - Taxation payable 605 605 - Total current liabilities 22,189 22,189 -
TOTAL LIABILITIES 53,308 53,308 -
NET ASSETS 168,752 168,752 -
EQUITYShare capital 122,595 122,595 - Reserves (1,455) (1,455) - Retained earnings 47,612 47,612 - TOTAL EQUITY 168,752 168,752 -
The nature of the adjustments as at 1 July 2018 and the reasons for the significant changes in the statement of financial position as at 30 June 2019 and the statement of profit or loss for the year ended 30 June 2019 are described below:
a. Sale of goods with variable considerationSome contracts for the sale of goods provide customers with volume rebates. Before adopting NZ IFRS 15, the Group recognised revenue from the sale of goods measured at the fair value of the consideration received or receivable, net of volume rebates. If revenue could not be reliably measured, the Group deferred recognition of revenue until the uncertainty was resolved. Under NZ IFRS 15, volume rebates give rise to variable consideration.
Volume rebates
Before adoption of NZ IFRS 15, the Group estimated the expected volume rebates using the probability-weighted average amount of rebates approach and included an allowance for rebates in trade and other payables.
The Group provides retrospective volume rebates to certain customers on the quantity of product purchased during the period. The rebate is charged at time of settlement. Therefore the Group does not see the need to recognise a refund liability due to timeliness of the transaction.
b. Contract balances: contract liabilitiesA contract liability is the obligation to transfer goods to a customer for which the Group has received consideration from the customer. If a customer pays consideration before the Group transfers goods to the customer, a contract liability is recognised when the payment is made or when the payment is due (whichever is earlier). Contract liabilities are revenue when the Group performs under the contract.
Application of NZ IFRS 15 Revenue from Contract with Customers which became effective on 1 January 2018 has not resulted in any material contracts being reclassified. The Group recognises revenue from the following major sources:
- Ōra King - Regal - Southern Ocean - New Zealand King Salmon (unbranded)
c. Performance obligationsInformation about the Group’s performance obligations are summarised below:
Delivered to Customer
The performance obligation is satisfied upon delivery of salmon products to the customer, and payment terms generally range between cash on delivery and 20th of the month following invoice date.
On collection
The performance obligation is satisfied upon collection of salmon products by the customer and payment terms generally on collection.
Receipt into store
The performance obligation is satisfied upon delivery of salmon products when receipted into the customers store and payment terms generally on the 20th of the month following invoice date.
CIF, into hold
The performance obligation is satisfied upon delivery of shipping documents including either the bill of lading or way bill dependant on transportation mode. Payment terms generally range between 7 days from invoice date and 20th of the month following invoice date.
Revenue by Product group 2019 2018$000 $000
Whole fish 84,880 79,182 Fillets, Steaks & Portions 38,624 36,713 Wood Roasted 13,401 12,238 Cold Smoked 30,011 27,607 Other 5,693 4,531 Total 172,609 160,271
Revenue by Brand 2019 2018$000 $000
Ōra King 65,163 56,611 Regal 30,762 28,857 Southern Ocean 14,783 15,364 New Zealand King Salmon label (unbranded) 61,901 59,439 Total 172,609 160,271
2019: BLUE FRONTIERSNEW ZEAL AND KING SALMON | ANNUAL REPORT FY19 9594
NOTES TO THE F INANCIAL STATEMENTS NOTES TO THE F INANCIAL STATEMENTS
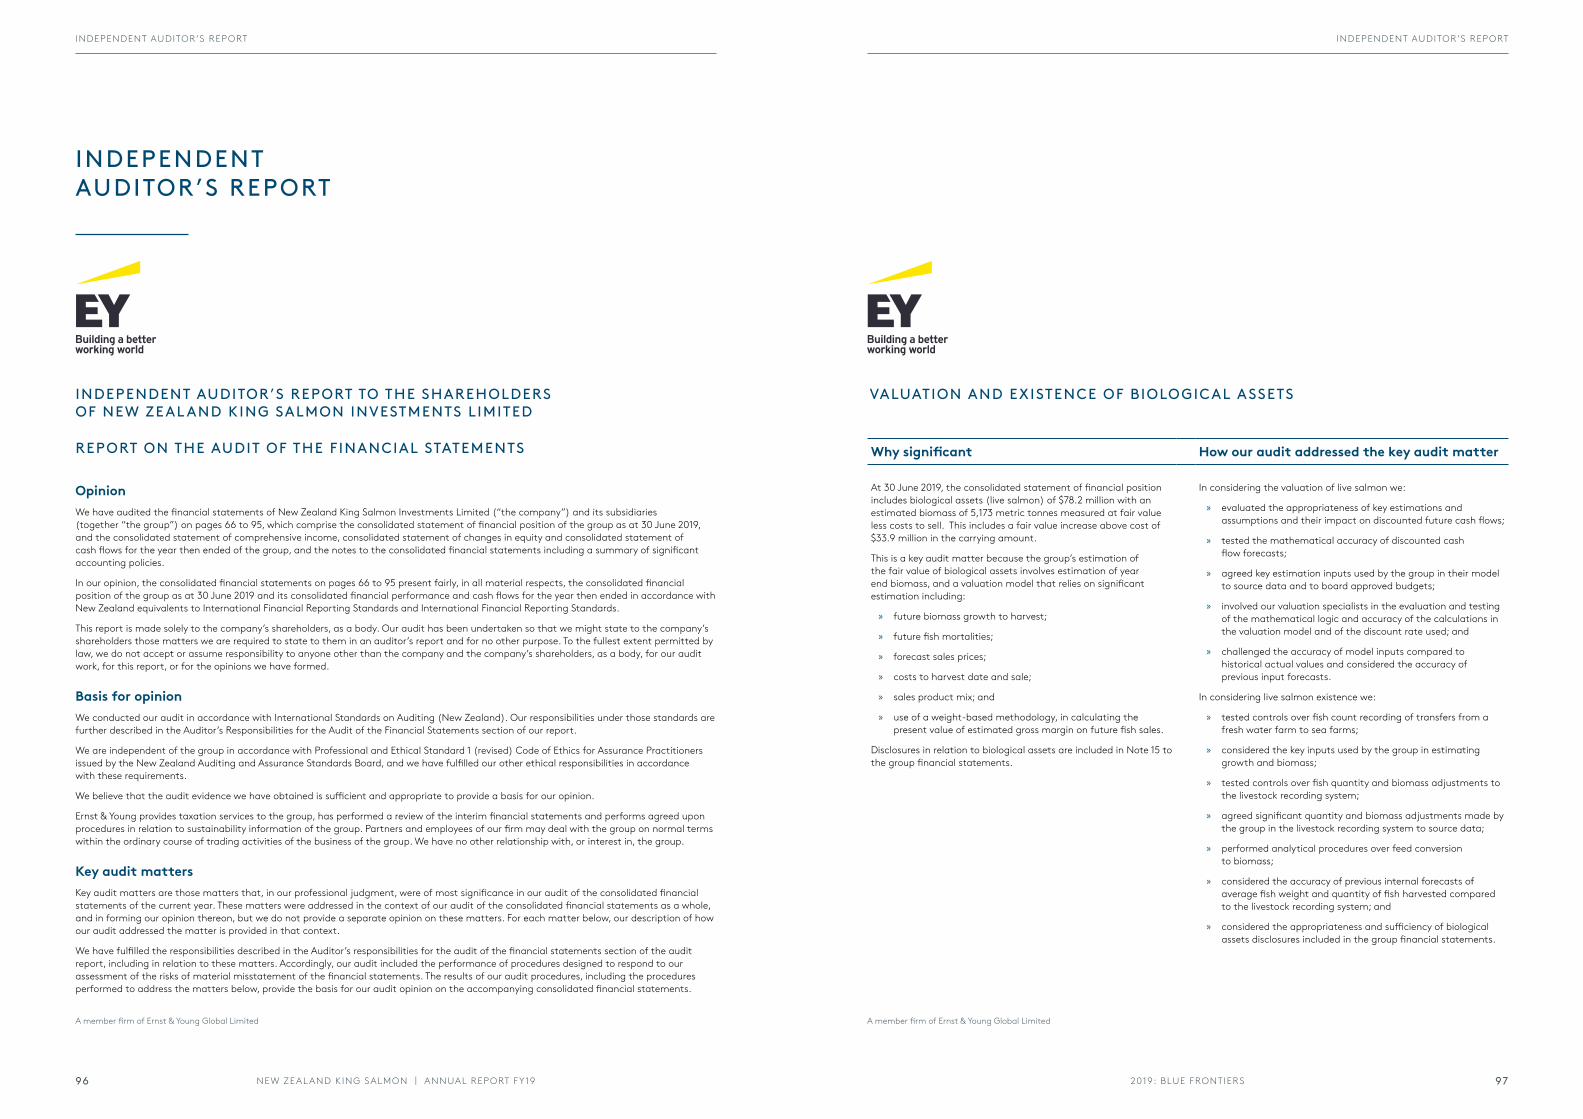
INDEPENDENT AUDITOR’S REPORT
OpinionWe have audited the financial statements of New Zealand King Salmon Investments Limited (“the company”) and its subsidiaries (together “the group”) on pages 66 to 95, which comprise the consolidated statement of financial position of the group as at 30 June 2019, and the consolidated statement of comprehensive income, consolidated statement of changes in equity and consolidated statement of cash flows for the year then ended of the group, and the notes to the consolidated financial statements including a summary of significant accounting policies.
In our opinion, the consolidated financial statements on pages 66 to 95 present fairly, in all material respects, the consolidated financial position of the group as at 30 June 2019 and its consolidated financial performance and cash flows for the year then ended in accordance with New Zealand equivalents to International Financial Reporting Standards and International Financial Reporting Standards.
This report is made solely to the company’s shareholders, as a body. Our audit has been undertaken so that we might state to the company’s shareholders those matters we are required to state to them in an auditor’s report and for no other purpose. To the fullest extent permitted by law, we do not accept or assume responsibility to anyone other than the company and the company’s shareholders, as a body, for our audit work, for this report, or for the opinions we have formed.
Basis for opinionWe conducted our audit in accordance with International Standards on Auditing (New Zealand). Our responsibilities under those standards are further described in the Auditor’s Responsibilities for the Audit of the Financial Statements section of our report.
We are independent of the group in accordance with Professional and Ethical Standard 1 (revised) Code of Ethics for Assurance Practitioners issued by the New Zealand Auditing and Assurance Standards Board, and we have fulfilled our other ethical responsibilities in accordance with these requirements.
We believe that the audit evidence we have obtained is sufficient and appropriate to provide a basis for our opinion.
Ernst & Young provides taxation services to the group, has performed a review of the interim financial statements and performs agreed upon procedures in relation to sustainability information of the group. Partners and employees of our firm may deal with the group on normal terms within the ordinary course of trading activities of the business of the group. We have no other relationship with, or interest in, the group.
Key audit mattersKey audit matters are those matters that, in our professional judgment, were of most significance in our audit of the consolidated financial statements of the current year. These matters were addressed in the context of our audit of the consolidated financial statements as a whole, and in forming our opinion thereon, but we do not provide a separate opinion on these matters. For each matter below, our description of how our audit addressed the matter is provided in that context.
We have fulfilled the responsibilities described in the Auditor’s responsibilities for the audit of the financial statements section of the audit report, including in relation to these matters. Accordingly, our audit included the performance of procedures designed to respond to our assessment of the risks of material misstatement of the financial statements. The results of our audit procedures, including the procedures performed to address the matters below, provide the basis for our audit opinion on the accompanying consolidated financial statements.
A member firm of Ernst & Young Global Limited
INDEPENDENT AUDITOR’S REPORT TO THE SHAREHOLDERS OF NEW ZEAL AND KING SALMON INVESTMENTS LIMITED
REPORT ON THE AUDIT OF THE FINANCIAL STATEMENTS
A member firm of Ernst & Young Global Limited
VALUATION AND EXISTENCE OF BIOLOGICAL ASSETS
Why significant How our audit addressed the key audit matter
At 30 June 2019, the consolidated statement of financial position includes biological assets (live salmon) of $78.2 million with an estimated biomass of 5,173 metric tonnes measured at fair value less costs to sell. This includes a fair value increase above cost of $33.9 million in the carrying amount.
This is a key audit matter because the group’s estimation of the fair value of biological assets involves estimation of year end biomass, and a valuation model that relies on significant estimation including:
» future biomass growth to harvest;
» future fish mortalities;
» forecast sales prices;
» costs to harvest date and sale;
» sales product mix; and
» use of a weight-based methodology, in calculating the present value of estimated gross margin on future fish sales.
Disclosures in relation to biological assets are included in Note 15 to the group financial statements.
In considering the valuation of live salmon we:
» evaluated the appropriateness of key estimations and assumptions and their impact on discounted future cash flows;
» tested the mathematical accuracy of discounted cash flow forecasts;
» agreed key estimation inputs used by the group in their model to source data and to board approved budgets;
» involved our valuation specialists in the evaluation and testing of the mathematical logic and accuracy of the calculations in the valuation model and of the discount rate used; and
» challenged the accuracy of model inputs compared to historical actual values and considered the accuracy of previous input forecasts.
In considering live salmon existence we:
» tested controls over fish count recording of transfers from a fresh water farm to sea farms;
» considered the key inputs used by the group in estimating growth and biomass;
» tested controls over fish quantity and biomass adjustments to the livestock recording system;
» agreed significant quantity and biomass adjustments made by the group in the livestock recording system to source data;
» performed analytical procedures over feed conversion to biomass;
» considered the accuracy of previous internal forecasts of average fish weight and quantity of fish harvested compared to the livestock recording system; and
» considered the appropriateness and sufficiency of biological assets disclosures included in the group financial statements.
2019: BLUE FRONTIERSNEW ZEAL AND KING SALMON | ANNUAL REPORT FY19 9796
INDEPENDENT AUDITOR’S REPORT INDEPENDENT AUDITOR’S REPORT
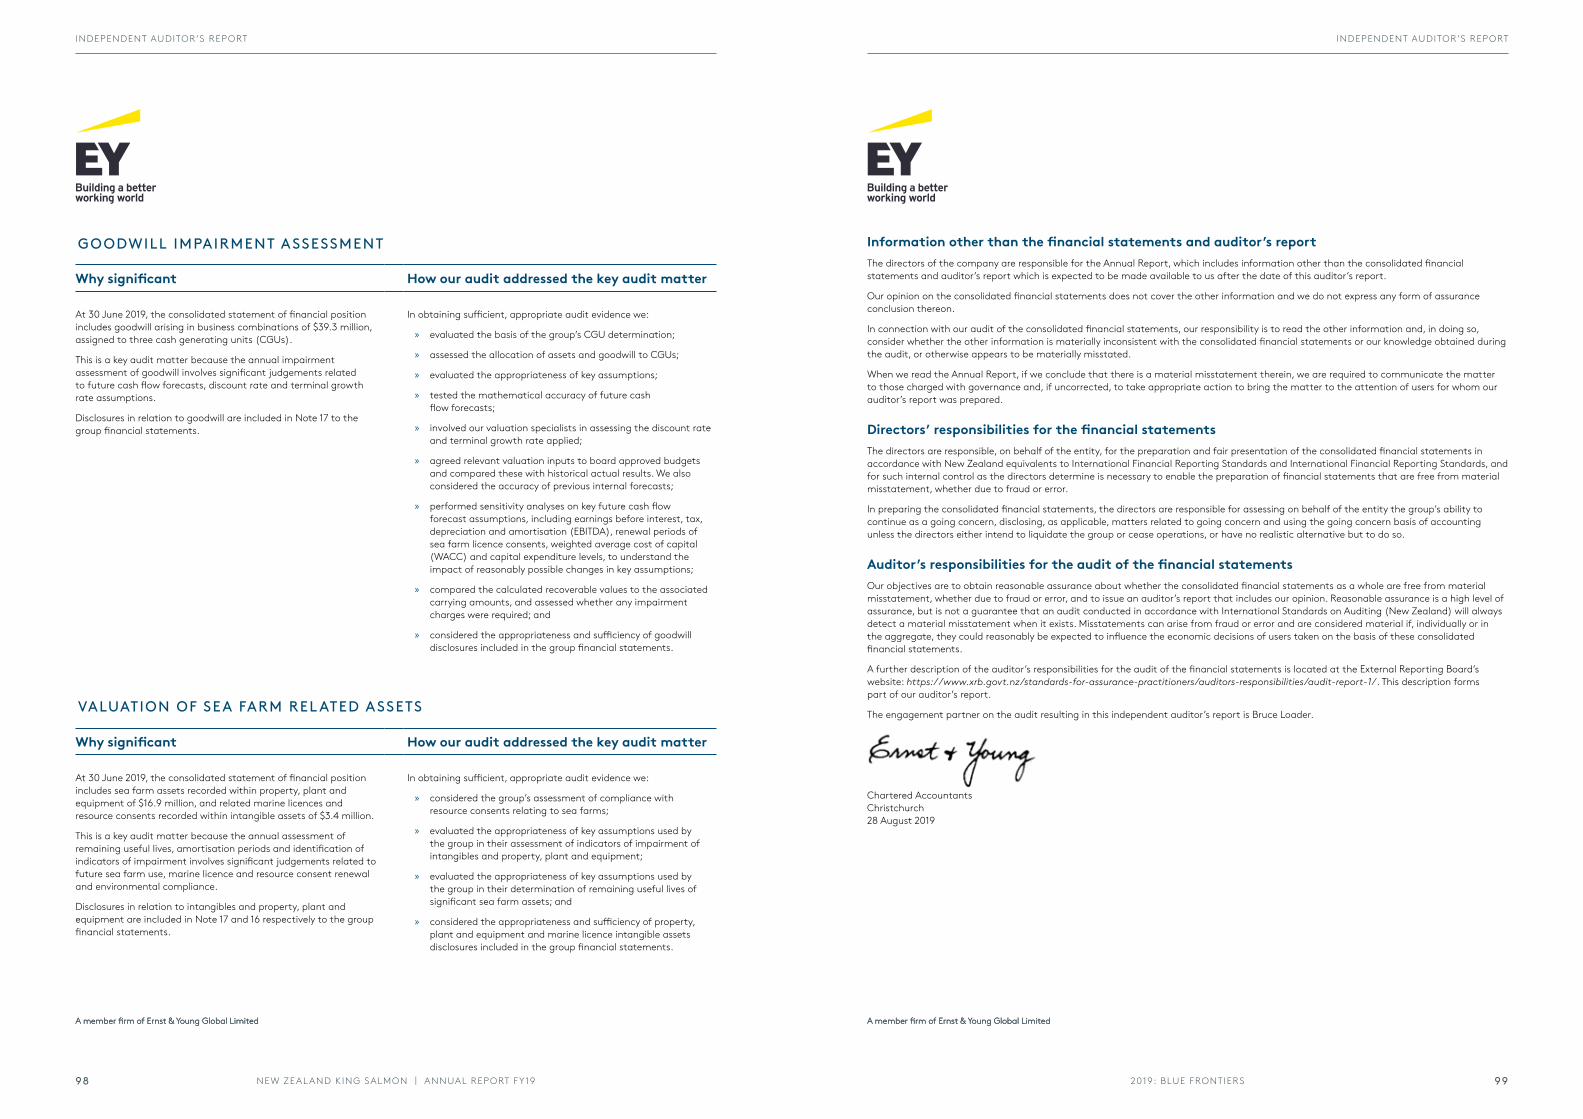
A member firm of Ernst & Young Global LimitedA member firm of Ernst & Young Global Limited
GOODWILL IMPAIRMENT ASSESSMENT
Why significant How our audit addressed the key audit matter
At 30 June 2019, the consolidated statement of financial position includes goodwill arising in business combinations of $39.3 million, assigned to three cash generating units (CGUs).
This is a key audit matter because the annual impairment assessment of goodwill involves significant judgements related to future cash flow forecasts, discount rate and terminal growth rate assumptions.
Disclosures in relation to goodwill are included in Note 17 to the group financial statements.
In obtaining sufficient, appropriate audit evidence we:
» evaluated the basis of the group’s CGU determination;
» assessed the allocation of assets and goodwill to CGUs;
» evaluated the appropriateness of key assumptions;
» tested the mathematical accuracy of future cash flow forecasts;
» involved our valuation specialists in assessing the discount rate and terminal growth rate applied;
» agreed relevant valuation inputs to board approved budgets and compared these with historical actual results. We also considered the accuracy of previous internal forecasts;
» performed sensitivity analyses on key future cash flow forecast assumptions, including earnings before interest, tax, depreciation and amortisation (EBITDA), renewal periods of sea farm licence consents, weighted average cost of capital (WACC) and capital expenditure levels, to understand the impact of reasonably possible changes in key assumptions;
» compared the calculated recoverable values to the associated carrying amounts, and assessed whether any impairment charges were required; and
» considered the appropriateness and sufficiency of goodwill disclosures included in the group financial statements.
VALUATION OF SEA FARM REL ATED ASSETS
Why significant How our audit addressed the key audit matter
At 30 June 2019, the consolidated statement of financial position includes sea farm assets recorded within property, plant and equipment of $16.9 million, and related marine licences and resource consents recorded within intangible assets of $3.4 million.
This is a key audit matter because the annual assessment of remaining useful lives, amortisation periods and identification of indicators of impairment involves significant judgements related to future sea farm use, marine licence and resource consent renewal and environmental compliance.
Disclosures in relation to intangibles and property, plant and equipment are included in Note 17 and 16 respectively to the group financial statements.
In obtaining sufficient, appropriate audit evidence we:
» considered the group’s assessment of compliance with resource consents relating to sea farms;
» evaluated the appropriateness of key assumptions used by the group in their assessment of indicators of impairment of intangibles and property, plant and equipment;
» evaluated the appropriateness of key assumptions used by the group in their determination of remaining useful lives of significant sea farm assets; and
» considered the appropriateness and sufficiency of property, plant and equipment and marine licence intangible assets disclosures included in the group financial statements.
A member firm of Ernst & Young Global Limited A member firm of Ernst & Young Global LimitedA member firm of Ernst & Young Global Limited
Information other than the financial statements and auditor’s reportThe directors of the company are responsible for the Annual Report, which includes information other than the consolidated financial statements and auditor’s report which is expected to be made available to us after the date of this auditor’s report.
Our opinion on the consolidated financial statements does not cover the other information and we do not express any form of assurance conclusion thereon.
In connection with our audit of the consolidated financial statements, our responsibility is to read the other information and, in doing so, consider whether the other information is materially inconsistent with the consolidated financial statements or our knowledge obtained during the audit, or otherwise appears to be materially misstated.
When we read the Annual Report, if we conclude that there is a material misstatement therein, we are required to communicate the matter to those charged with governance and, if uncorrected, to take appropriate action to bring the matter to the attention of users for whom our auditor’s report was prepared.
Directors’ responsibilities for the financial statementsThe directors are responsible, on behalf of the entity, for the preparation and fair presentation of the consolidated financial statements in accordance with New Zealand equivalents to International Financial Reporting Standards and International Financial Reporting Standards, and for such internal control as the directors determine is necessary to enable the preparation of financial statements that are free from material misstatement, whether due to fraud or error.
In preparing the consolidated financial statements, the directors are responsible for assessing on behalf of the entity the group’s ability to continue as a going concern, disclosing, as applicable, matters related to going concern and using the going concern basis of accounting unless the directors either intend to liquidate the group or cease operations, or have no realistic alternative but to do so.
Auditor’s responsibilities for the audit of the financial statementsOur objectives are to obtain reasonable assurance about whether the consolidated financial statements as a whole are free from material misstatement, whether due to fraud or error, and to issue an auditor’s report that includes our opinion. Reasonable assurance is a high level of assurance, but is not a guarantee that an audit conducted in accordance with International Standards on Auditing (New Zealand) will always detect a material misstatement when it exists. Misstatements can arise from fraud or error and are considered material if, individually or in the aggregate, they could reasonably be expected to influence the economic decisions of users taken on the basis of these consolidated financial statements.
A further description of the auditor’s responsibilities for the audit of the financial statements is located at the External Reporting Board’s website: https://www.xrb.govt.nz/standards-for-assurance-practitioners/auditors-responsibilities/audit-report-1/. This description forms part of our auditor’s report.
The engagement partner on the audit resulting in this independent auditor’s report is Bruce Loader.
Chartered Accountants Christchurch 28 August 2019
A member firm of Ernst & Young Global Limited
2019: BLUE FRONTIERSNEW ZEAL AND KING SALMON | ANNUAL REPORT FY19 9998
INDEPENDENT AUDITOR’S REPORT INDEPENDENT AUDITOR’S REPORT
CORPORATE GOVERNANCE
The Board of New Zealand King Salmon Investments Limited (the Company) is committed to ensuring that the Company meets best practice governance principles and maintains the highest ethical standards. This Corporate Governance Statement provides an overview of the Company’s governance framework. It is structured to follow the NZX Corporate Governance Code (NZX Code) and disclose practises relating to the NZX Code’s recommendations.
The Board’s view is that the Company complies with the corporate governance principles and recommendations set out in the NZX Code apart from specific areas noted in this report. The Board believes our governance structures and in particular our remuneration approach meet our strategic objectives. In forming our conclusions, we have sought external feedback from shareholders and advisors to challenge our thinking and validate our findings, which we have appreciated.The corporate governance principles and standards of the Company comply with the:
» Financial Markets Authority’s Corporate Governance in New Zealand Principles and Guidelines. » ASX Corporate Governance Principles and Recommendations. » NZX and ASX Listing Rules (corporate governance requirements).
The Company’s key corporate governance documents referred to in this statement, including charters and policies, can be found on the Company’s website, www.kingsalmon.co.nz.
The Company’s Corporate Governance Code was reviewed and updated during June 2019 as part of its annual review. During the latest review, the Company maintained its commitment to best practise corporate governance and as a result has chosen to adopt and report against the recommendations of the NZX Corporate Governance Code 2017 with effect from 22 March 2019, in advance of the date required by the NZX Main Board listing Rules (Listing Rules). The extent to which the Company has followed recommendations in the NZX Code 2017 for the financial year ended 30 June 2019 is detailed in this Corporate Governance Statement. The Company’s Corporate Governance Code was approved by the Board on 19 June 2019.
PRINCIPLE 1 – CODE OF ETHICAL BEHAVIOURDirectors should set high standards of ethical behaviour, model this behaviour and hold management accountable for these standards being followed throughout the organisation.
RECOMMENDATION 1.1The Board should document minimum standards of ethical behaviour to which the issuer’s Directors and employees are expected to adhere (a Code of Ethics).
Code of EthicsThe Board sets a framework of ethical standards for the Company via its Code of Ethics, which is contained in the Company’s Corporate Governance Code. These standards are expected of all Directors and employees of the Company.
The Code of Ethics covers a wide range of areas including the following:
» Standards of behaviour. » Conflicts of interest. » Proper use of Company information and assets. » Accepting gifts. » Delegated authorities. » Compliance with laws and policies.
No incidents were reported of breaches in the Code of Ethics policy during the year to 30 June 2019.
Every new Director, employee and contractor is provided with a copy of the Code of Ethics and must confirm that they have read and understand the Code of Ethics. The Code of Ethics is available on the Company’s website.
The Code of Ethics is subject to annual review by the Board.
The Company maintains an interest register, on which Directors and executives disclose any interests such as other directorships, shareholdings or ownership, which may potentially lead to conflicts or perceived conflicts of interest.
RECOMMENDATION 1.2An issuer should have a financial product dealing policy which applies to employees and Directors.
Share trading by Company Directors and EmployeesThe Board of the Company has implemented a formal procedure to handle trading in the Company’s quoted financial products. All Directors, officers, employees, contractors and advisers of the Company and its subsidiaries (together, the Group) must comply with the procedures set out in the Financial Products Trading Policy and Guidelines as detailed in the Company’s Corporate Governance Code.
All trading by Directors and senior managers (as defined by the Financial Markets Conduct Act 2013) is required to be reported to NZX and recorded in the Company’s securities trading register. A blackout period is imposed for all Directors and employees between the end of the half year and full year and the release to NZX of the result for that period. The policy provides that shares may not be traded at any time by any individual holding material information. The full procedures are outlined in the Securities Trading Policy and Guidelines, which is contained in the Company’s Corporate Governance Code.
In addition to the restrictions outlined above, Directors and the senior managers who held or acquired shares in the Company at the time of listing had entered into escrow arrangements with the Company. Under these arrangements, each escrowed shareholder agreed not to sell or otherwise dispose of any of the escrowed shares until the first business day after the Company’s preliminary announcement has been released to NZX and ASX in respect of its financial results for the year ending 30 June 2018. That escrow was lifted on 30 August 2018, and since then all Directors and senior managers whose shares were subject to escrow have continued to hold their shares at this time.
PRINCIPLE 2 – BOARD COMPOSITION & PERFORMANCETo ensure an effective Board, there is a balance of independence, skills, knowledge, experience and perspectives.
Director IndependenceThe factors the Company considers when assessing the independence of its Directors are set out in the NZX Listing Rules and ASX Corporate Governance Principles and Recommendations.
A Director is considered to be independent if a Director is not an executive of New Zealand King Salmon, nor has been within the last five years, and if the Director has no direct or indirect interest or relationship that could reasonably influence the Director’s decisions in relation to the Company.
As a result of the formal BetterBoards evaluation undertaken in 2018, the Board confirms the designation of John Ryder, Paul Steere and Mark Hutton as independent directors, noting Paul Steere resigned as CEO of the Company in 2009.
The Board has also determined that the Chair will be an independent director. It is also intended, in the medium term, to have an equal number of independent directors. The board will continue to assess the appropriate options and opportunities to achieving this goal.
The Board will review any determination it makes on a Director’s independence on becoming aware of any new information that may affect that Director’s independence. For this purpose, Directors are required to ensure they immediately advise the Board of any new or changed relationship that may affect their independence or result in a conflict of interest.
2019: BLUE FRONTIERSNEW ZEAL AND KING SALMON | ANNUAL REPORT FY19 101100
CORPOR ATE GOVERNANCE CORPOR ATE GOVERNANCE
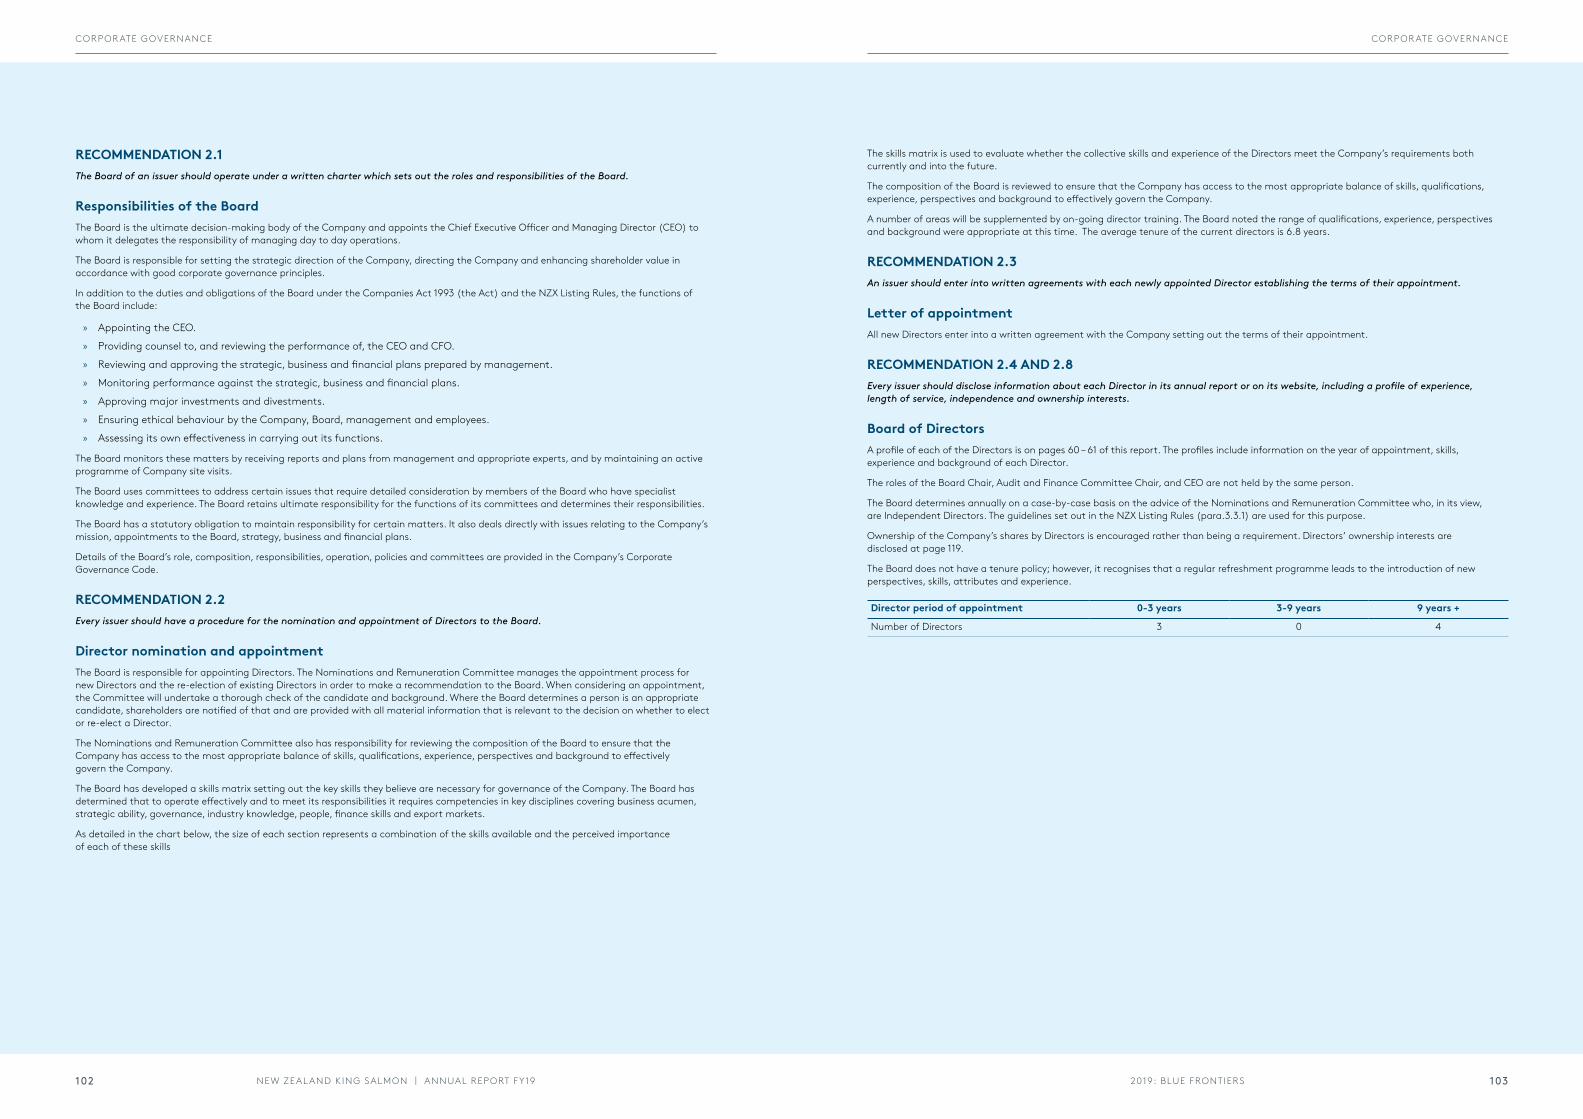
RECOMMENDATION 2.1The Board of an issuer should operate under a written charter which sets out the roles and responsibilities of the Board.
Responsibilities of the BoardThe Board is the ultimate decision-making body of the Company and appoints the Chief Executive Officer and Managing Director (CEO) to whom it delegates the responsibility of managing day to day operations.
The Board is responsible for setting the strategic direction of the Company, directing the Company and enhancing shareholder value in accordance with good corporate governance principles.
In addition to the duties and obligations of the Board under the Companies Act 1993 (the Act) and the NZX Listing Rules, the functions of the Board include:
» Appointing the CEO.
» Providing counsel to, and reviewing the performance of, the CEO and CFO.
» Reviewing and approving the strategic, business and financial plans prepared by management.
» Monitoring performance against the strategic, business and financial plans.
» Approving major investments and divestments.
» Ensuring ethical behaviour by the Company, Board, management and employees.
» Assessing its own effectiveness in carrying out its functions.
The Board monitors these matters by receiving reports and plans from management and appropriate experts, and by maintaining an active programme of Company site visits.
The Board uses committees to address certain issues that require detailed consideration by members of the Board who have specialist knowledge and experience. The Board retains ultimate responsibility for the functions of its committees and determines their responsibilities.
The Board has a statutory obligation to maintain responsibility for certain matters. It also deals directly with issues relating to the Company’s mission, appointments to the Board, strategy, business and financial plans.
Details of the Board’s role, composition, responsibilities, operation, policies and committees are provided in the Company’s Corporate Governance Code.
RECOMMENDATION 2.2Every issuer should have a procedure for the nomination and appointment of Directors to the Board.
Director nomination and appointmentThe Board is responsible for appointing Directors. The Nominations and Remuneration Committee manages the appointment process for new Directors and the re-election of existing Directors in order to make a recommendation to the Board. When considering an appointment, the Committee will undertake a thorough check of the candidate and background. Where the Board determines a person is an appropriate candidate, shareholders are notified of that and are provided with all material information that is relevant to the decision on whether to elect or re-elect a Director.
The Nominations and Remuneration Committee also has responsibility for reviewing the composition of the Board to ensure that the Company has access to the most appropriate balance of skills, qualifications, experience, perspectives and background to effectively govern the Company.
The Board has developed a skills matrix setting out the key skills they believe are necessary for governance of the Company. The Board has determined that to operate effectively and to meet its responsibilities it requires competencies in key disciplines covering business acumen, strategic ability, governance, industry knowledge, people, finance skills and export markets.
As detailed in the chart below, the size of each section represents a combination of the skills available and the perceived importance of each of these skills
The skills matrix is used to evaluate whether the collective skills and experience of the Directors meet the Company’s requirements both currently and into the future.
The composition of the Board is reviewed to ensure that the Company has access to the most appropriate balance of skills, qualifications, experience, perspectives and background to effectively govern the Company.
A number of areas will be supplemented by on-going director training. The Board noted the range of qualifications, experience, perspectives and background were appropriate at this time. The average tenure of the current directors is 6.8 years.
RECOMMENDATION 2.3An issuer should enter into written agreements with each newly appointed Director establishing the terms of their appointment.
Letter of appointmentAll new Directors enter into a written agreement with the Company setting out the terms of their appointment.
RECOMMENDATION 2.4 AND 2.8Every issuer should disclose information about each Director in its annual report or on its website, including a profile of experience, length of service, independence and ownership interests.
Board of DirectorsA profile of each of the Directors is on pages 60 – 61 of this report. The profiles include information on the year of appointment, skills, experience and background of each Director.
The roles of the Board Chair, Audit and Finance Committee Chair, and CEO are not held by the same person.
The Board determines annually on a case-by-case basis on the advice of the Nominations and Remuneration Committee who, in its view, are Independent Directors. The guidelines set out in the NZX Listing Rules (para.3.3.1) are used for this purpose.
Ownership of the Company’s shares by Directors is encouraged rather than being a requirement. Directors’ ownership interests are disclosed at page 119.
The Board does not have a tenure policy; however, it recognises that a regular refreshment programme leads to the introduction of new perspectives, skills, attributes and experience.
Director period of appointment 0-3 years 3-9 years 9 years +
Number of Directors 3 0 4
2019: BLUE FRONTIERSNEW ZEAL AND KING SALMON | ANNUAL REPORT FY19 103102
CORPOR ATE GOVERNANCE CORPOR ATE GOVERNANCE
RECOMMENDATION 2.5An issuer should have a written diversity policy which includes requirements for the Board or a relevant Committee of the Board to set measurable objectives for achieving diversity (which, at a minimum, should address gender diversity) and to assess annually both the objectives and the entity’s progress in achieving them.
The Company recognises the value in diversity and seeks to ensure that the Board and workforce of the Company are as diverse as the community in which we operate. A formal diversity policy was adopted by the Board on 29 June 2018 and can be found in the Company’s Corporate Governance Code at https://www.kingsalmon.co.nz/investors/corporate-governance/
The Company does recruit, promote and compensate on the basis of merit, regardless of gender, ethnicity, religion, age, nationality or union membership. The Company does require that people in the workplace are treated with respect in accordance with the Company’s Human Resource Policy and Way We Work document.
The Board is committed to increasing the level of diversity at Board and executive level wherever possible, however no measurable objectives were set for the year ended 30 June 2019. The board is currently reviewing the most appropriate measurable objectives for the year ending 30 June 2020 and will report against its progress in meeting any specific diversity objectives in its 2020 Annual Report.
Responsibility for workplace diversity and the setting of measurable objectives is held by the Nominations and Remuneration Committee.
The gender composition of the Company’s Board and senior leadership team (SLT) is as follows:
As at 30 June 2019 As at 30 June 2018Position Female Male Female Male
Board* 0 7 (100%) 1 (13%) 6 (87%)
Senior Leadership Team 1 (17%) 5 (83%) 1 (17%) 5 (83%)
On 2 April 2019 Xin Wang resigned from the Board of Directors, and on 1 May Lai Po Sing was appointed as Director.
[The company has a long term target of equal male and female representation at board and SLT level however this target has not yet been achieved.]
Interests RegisterThe Board maintains an Interests Register. Any Director with an interest in a transaction with the Company must immediately disclose to the Board the nature, monetary value and extent of the interest. A Director who is interested in a transaction may attend and participate at a Board meeting at which the transaction is discussed but may not be counted in the quorum for that meeting or vote in respect of the transaction, unless it is one in respect of which Directors are expressly required by the Companies Act 1993 to sign a certificate.
Particulars of entries made in the Interests Register for the year ended 30 June 2019 are included in the Director Disclosures section on pages 117-119.
RECOMMENDATION 2.6Directors should undertake appropriate training to remain current on how to best perform their duties as Directors of an issuer.
Director TrainingThe Board does ensure that there is appropriate training available to all Directors to enable them to remain current on how best to discharge their responsibilities and keep up to date on changes and trends in areas relevant to their work. Directors are provided with industry information and receive copies of appropriate company documents to enable them to perform their role. The Board has allocated funding of $1,000 per annum for each Director to provide resources to help develop and maintain skills and knowledge.
Directors are expected to maintain their knowledge of latest governance and business practices in order to perform their duties.
The Board also ensures that new Directors are appropriately introduced to Management and the businesses.
RECOMMENDATION 2.7The Board should have a procedure to regularly assess Director, Board and Committee performance.
Board Performance EvaluationThe Board annually assesses its effectiveness in carrying out its functions and responsibilities. The Chair of the Board leads the review and evaluation of the Board as a whole, and of the Board Committees, against their charters. The Chair of the Board also engages with individual Directors to evaluate and discuss performance and professional development
In 2018 the Board undertook the Institute of Directors’ BetterBoard evaluation. This provided the opportunity for a formal review of Board operations to ensure best practice was being followed. Several of the conclusions of the BetterBoard evaluation are noted in this report and have been implemented, particularly in relation to the structure of Board committees and nominated participates.
PRINCIPLE 3 – BOARD COMMITTEESThe Board should use Committees where this will enhance its effectiveness in key areas, while still retaining Board responsibility.
Board CommitteesThe Board formally constituted three committees in June 2018: the existing Nominations and Remuneration Committee, the reformed Audit and Finance Committee and the new Health, Safety and Risk Committee. Each committee focuses on specific areas of governance and together they strengthen the Board’s oversight of the Company. Committee membership is reviewed annually.
Each Committee has a written charter that is approved by the Board and sets out its mandate. The charters are reviewed annually with any proposed changes recommended to the Board for approval. The charters can be found within the Company’s Corporate Governance Code.
Annually each Committee agrees a programme of matters to be addressed over the following twelve-month period. The Committees each annually review their performance against the Committee charter and objectives for the year and report their findings to the Board.
Attendance at MeetingsThe table below sets out Director attendance at Board and Committee meetings during the year ended 30 June 2019.
Director BoardAudit & Finance
Committee
Nominations and Remuneration
Committee
Health, Safety and Risk
CommitteeJohn Ryder (Chair) 9/9 3 / 3 - 1/2
Mark Hutton (Chair Nominations & Remuneration Committee and Audit & Finance Committee)
9 /9 3 / 3 2/2 2/2
Jack Porus 8/9 - 2/2 -
Thomas Song (Passed away 14 April 2019) 7/7 2/2 - 1/1
Paul Steere (Chair Health, Safety & Risk Committee) 8/9 3 / 3 2/2 2/2
Xin Wang (Resigned 1 April 2019) 3/9 - - -
Nelson Liu (Resigned December 2018) 2/5 - - -
Lai Po Sing (Appointed 1 May 2019) 2/2 - - -
Chiong Yong Tiong (Appointed 19 June 2019) 1/1 - - 1/1
Grant Rosewarne (Executive Director) 9/9 - - -
RECOMMENDATION 3.1An issuer’s Audit and Finance Committee should operate under a written charter. Membership on the Audit and Finance Committee should be a majority of independent Directors and comprise solely of non-executive Directors of the issuer. The Chair of the Audit and Finance Committee should not also be the Chair of the Board.
Audit and Finance CommitteeThe primary function of the Audit and Finance Committee is to assist the Board in fulfilling its oversight responsibilities relating to the Company:
» To oversee the financial reporting and continuous disclosure processes to ensure that the interests of shareholders are properly protected in relation to financial reporting and internal control and disclosure maintains integrity, transparency and adequacy.
» To provide the Board with an independent assessment of the Company’s financial position and accounting affairs. » To oversee the Company’s capital and treasury management.
The members of the Committee are all independent non-executive directors, all with accounting and financial background. The members are Mark Hutton (Chair), Paul Steere and John Ryder. The Chair of the Audit and Finance Committee and the Board Chair are different people.
The Audit and Finance Committee held three meetings during the period ended 30 June 2019 the members are Mark Hutton (Chair), Paul Steere, John Ryder. The agenda items for each meeting generally relate to financial governance, external financial reporting, external audit, internal controls and processes, and compliance.
2019: BLUE FRONTIERSNEW ZEAL AND KING SALMON | ANNUAL REPORT FY19 105104
CORPOR ATE GOVERNANCE CORPOR ATE GOVERNANCE
RECOMMENDATION 3.2Employees should only attend Audit Committee meetings at the invitation of the Audit Committee.
Meeting AttendanceThe CEO and Chief Financial Officer (CFO) are regularly invited to attend Audit and Finance Committee meetings. The committee also regularly holds private sessions of the committee and external auditors with management excluded.
RECOMMENDATION 3.3 AND 3.4An issuer should have a Remuneration Committee which operates under a written charter.
Nominations and Remuneration CommitteeThe Nominations and Remuneration Committee’s role is to assist the Board by:
» Establishment of a clear framework for oversight and management of the Company’s remuneration structure, policies, procedures and practices to ensure the Company remuneration is fair and reasonable.
» Defining the roles and responsibilities of the Board and senior management. » Reviewing and making recommendations on Board composition and succession.
In particular, the Nominations and Remuneration Committee’s role is to ensure that the Board is balanced in terms of skills and knowledge and to ensure that the method of nomination and appointment of Directors is transparent.
Under the Nominations and Remuneration Committee Charter, the Committee shall comprise of, wherever possible, a majority of independent Directors.
The current members of the Committee are Mark Hutton (Chair), Paul Steere (both of whom are independent non-executive Directors) and Jack Porus (nominated as a Director by Oregon Group Limited and thus not independent).
The Committee held two meetings during the year ended 30 June 2019.
RECOMMENDATION 3.5An issuer should consider whether it is appropriate to have any other Board Committees as standing Board Committees. All Committees should operate under written charters.
Health, Safety and Risk CommitteeThe Company has since 2015 operated a management Health & Safety Steering Group, generally meeting quarterly and with attendance by a Board Director.
The Board’s commitment to ensuring a safe and healthy workplace for team members, contractors and visitors led to it establishing a Health, Safety and Risk Committee in June 2018.
The primary functions of the Health, Safety and Risk Committee are:
» To assist the Board to provide leadership and policy for health and safety. » To assist the Board to fulfil its responsibilities and to ensure compliance with all legislative and regulatory requirements in relation to the
health and safety practices of the Company as those activities affect employees and contractors. » To support the ongoing improvement of health and safety in the workplace. » Ensure and overview the identification of risk to the Company’s operations, both financial and non-financial, the mitigation measures in
place and such further measures to be enacted so risk is managed to as satisfactory a level as practical.
The nominated members of Committee are Paul Steere (Independent Chair) and Chiong Yong Tiong who replaces Thomas Song (nominated as a Director by Oregon Group Limited and thus not independent).
RECOMMENDATION 3.6The Board should establish appropriate protocols that set out the procedure to be followed if there is a takeover offer for the issuer.
Takeover ProtocolsThe Board has documented and adopted a series of protocols to be followed in the event of a takeover offer being made, including communication between insiders and any bidder.
It is proposed that the Audit and Finance Committee will oversee the protocols and act as the takeover committee, assuming there are no related parties. The Committee would have responsibility for managing the takeover in accordance with the Board protocols and the New Zealand Takeovers Code.
PRINCIPLE 4 – REPORTING AND DISCLOSUREThe Board should demand integrity in financial and non-financial reporting, and in the timeliness and balance of corporate disclosure.
RECOMMENDATION 4.1An issuer’s board should have a written continuous disclosure policy.
Shareholder Communications and Market DisclosureThe Company’s Board is committed to the principle that high standards of reporting and disclosure are essential for proper accountability between the Company and its investors, employees and stakeholders.
The Company achieves these commitments, and the promotion of investor confidence, by ensuring that trading in its shares takes place in an efficient, competitive and informed market. The Company has in place a written Shareholder Communications and Market Disclosure Policy designed to ensure this occurs. The policy includes procedures intended to ensure that disclosure is made in a timely and balanced manner and in compliance with the NZX Listing Rules, such that:
» All investors have equal and timely access to material information concerning the Company, including its financial situation, performance, ownership and governance.
» Company announcements are factual and presented in a clear and balanced way.
The Company is committed to the promotion of investor confidence by ensuring that the trading of Company shares takes place in an efficient, competitive and informed market. The CFO is responsible for the Company’s compliance with NZX and ASX continuous disclosure requirements and the Board is advised of, and considers, continuous disclosure issues at each Board meeting or whenever else required.
Significant market announcements, including the preliminary announcement of the half year and full year results, the financial statements for those periods, and any advice of a change in earnings forecast are approved by the Board.
Directors consider at each Board meeting whether there is any material information which should be disclosed to the market.
RECOMMENDATION 4.2An issuer should make its Code of Ethics, Board and Committee charters and the policies recommended in the NZX Code, together with any other key governance documents, available on its website.
Governance Policies and ChartersThe Company’s key corporate governance documents, including charters and policies, can be found at https://www.kingsalmon.co.nz/investors/corporate-governance.
RECOMMENDATION 4.3Financial reporting should be balanced, clear and objective. An issuer should provide non-financial disclosure at least annually, including considering material exposure to environmental, economic and social sustainability risks and other key risks.
Financial and Non-Financial ReportingThe Board is responsible for ensuring the integrity and timeliness of its financial reporting. As noted above under ‘Board Committees’, the Audit and Finance Committee monitors financial reporting risks in relation to the preparation of the financial statements.
The Audit and Finance Committee, with the assistance of management, works to ensure that the financial statements are founded on a sound system of risk management and internal control and that the system is operating effectively in all material respects in relation to financial reporting risks.
The Audit and Finance Committee oversees the quality and integrity of external financial reporting including the accuracy, completeness, balance and timeliness of financial statements. It reviews half-year and annual financial statements and makes recommendations to the Board concerning accounting policies, areas of judgement, compliance with financial reporting standards, stock exchange and legal requirements, and the results of the external audit. All matters required to be addressed and for which the Committee has responsibility were addressed during the period under review.
All interim and full-year financial statements are prepared in accordance with relevant financial standards.
Both financial and non-financial disclosures are made at least annually, including reporting of material exposure to environmental, economic and social sustainability risks and other key risks. The Company has a strategic target to develop best-in-class sustainability reporting and to measure and report on key sustainability aspects affecting its businesses.
The Company’s Sustainability Report for 2019 is included in this report at pages 4 – 59 and provides details of the Company’s initiatives in this area. The Company-wide report draws on five of the United Nations Sustainable Development Goals focusing on the food sector and aquaculture industry both nationally and globally. The five Goals being focused on are: decent work and economic growth, climate action, good health and well-being, responsible consumption and production, and life below water.
2019: BLUE FRONTIERSNEW ZEAL AND KING SALMON | ANNUAL REPORT FY19 107106
CORPOR ATE GOVERNANCE CORPOR ATE GOVERNANCE
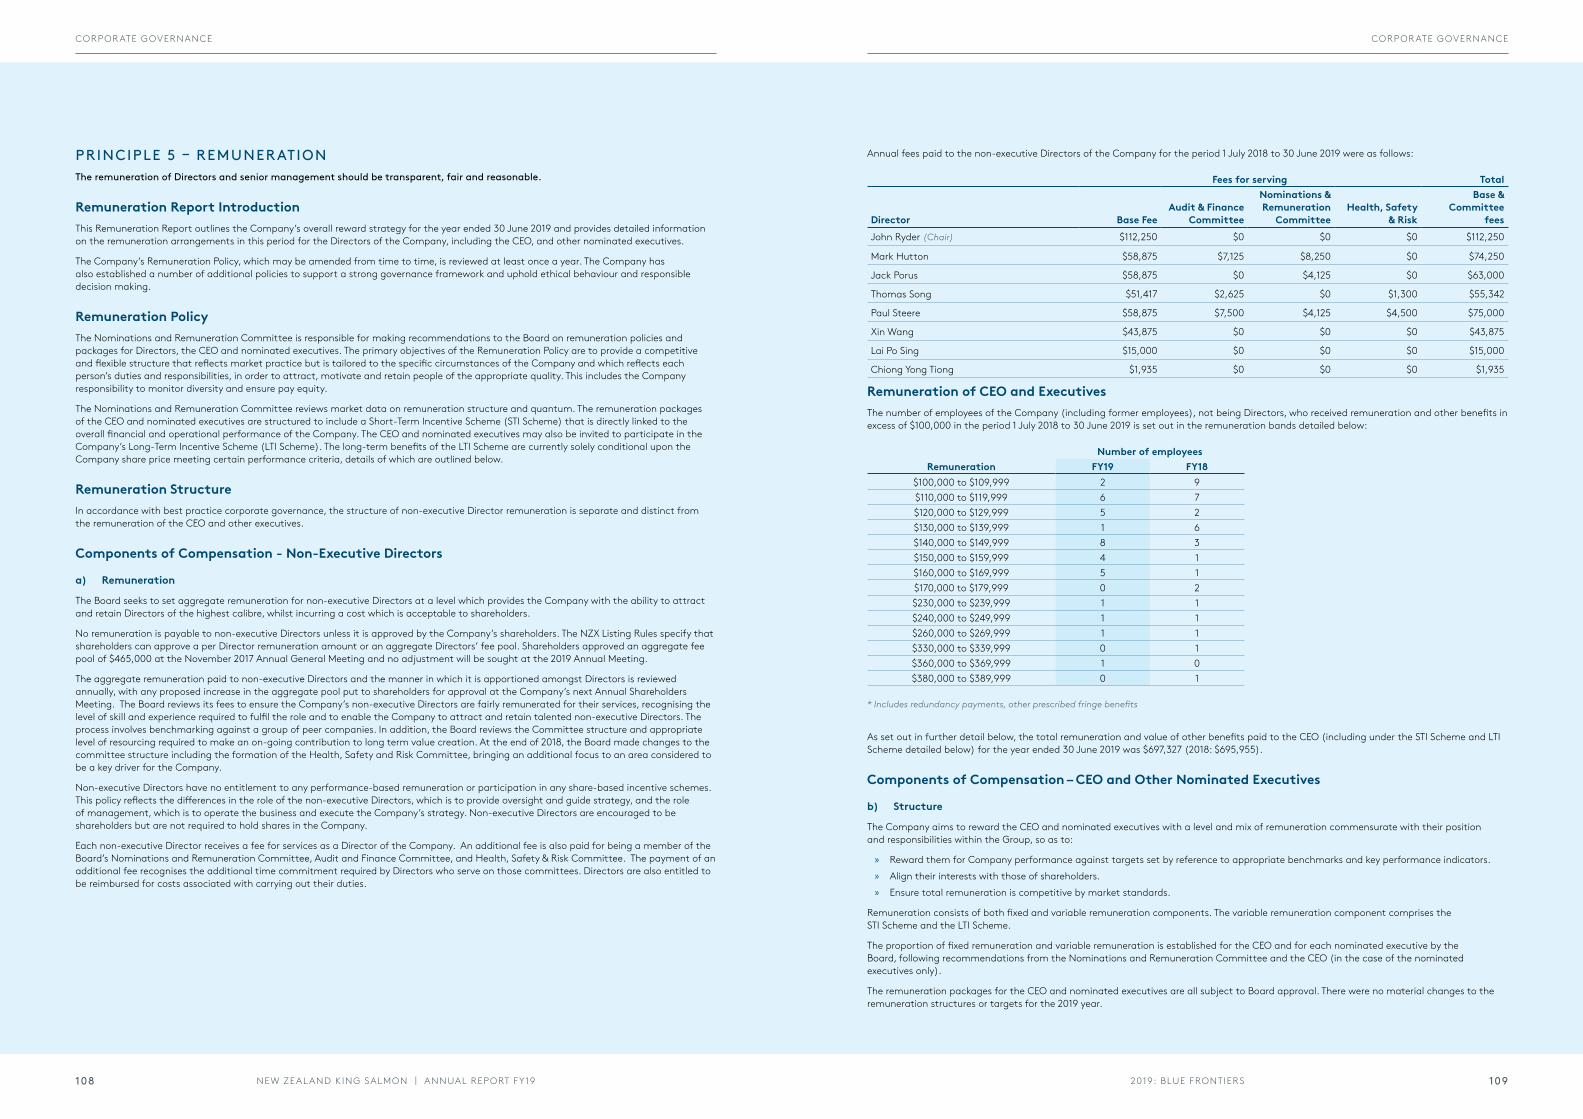
PRINCIPLE 5 – REMUNERATIONThe remuneration of Directors and senior management should be transparent, fair and reasonable.
Remuneration Report IntroductionThis Remuneration Report outlines the Company’s overall reward strategy for the year ended 30 June 2019 and provides detailed information on the remuneration arrangements in this period for the Directors of the Company, including the CEO, and other nominated executives.
The Company’s Remuneration Policy, which may be amended from time to time, is reviewed at least once a year. The Company has also established a number of additional policies to support a strong governance framework and uphold ethical behaviour and responsible decision making.
Remuneration PolicyThe Nominations and Remuneration Committee is responsible for making recommendations to the Board on remuneration policies and packages for Directors, the CEO and nominated executives. The primary objectives of the Remuneration Policy are to provide a competitive and flexible structure that reflects market practice but is tailored to the specific circumstances of the Company and which reflects each person’s duties and responsibilities, in order to attract, motivate and retain people of the appropriate quality. This includes the Company responsibility to monitor diversity and ensure pay equity.
The Nominations and Remuneration Committee reviews market data on remuneration structure and quantum. The remuneration packages of the CEO and nominated executives are structured to include a Short-Term Incentive Scheme (STI Scheme) that is directly linked to the overall financial and operational performance of the Company. The CEO and nominated executives may also be invited to participate in the Company’s Long-Term Incentive Scheme (LTI Scheme). The long-term benefits of the LTI Scheme are currently solely conditional upon the Company share price meeting certain performance criteria, details of which are outlined below.
Remuneration StructureIn accordance with best practice corporate governance, the structure of non-executive Director remuneration is separate and distinct from the remuneration of the CEO and other executives.
Components of Compensation - Non-Executive Directors
a) Remuneration
The Board seeks to set aggregate remuneration for non-executive Directors at a level which provides the Company with the ability to attract and retain Directors of the highest calibre, whilst incurring a cost which is acceptable to shareholders.
No remuneration is payable to non-executive Directors unless it is approved by the Company’s shareholders. The NZX Listing Rules specify that shareholders can approve a per Director remuneration amount or an aggregate Directors’ fee pool. Shareholders approved an aggregate fee pool of $465,000 at the November 2017 Annual General Meeting and no adjustment will be sought at the 2019 Annual Meeting.
The aggregate remuneration paid to non-executive Directors and the manner in which it is apportioned amongst Directors is reviewed annually, with any proposed increase in the aggregate pool put to shareholders for approval at the Company’s next Annual Shareholders Meeting. The Board reviews its fees to ensure the Company’s non-executive Directors are fairly remunerated for their services, recognising the level of skill and experience required to fulfil the role and to enable the Company to attract and retain talented non-executive Directors. The process involves benchmarking against a group of peer companies. In addition, the Board reviews the Committee structure and appropriate level of resourcing required to make an on-going contribution to long term value creation. At the end of 2018, the Board made changes to the committee structure including the formation of the Health, Safety and Risk Committee, bringing an additional focus to an area considered to be a key driver for the Company.
Non-executive Directors have no entitlement to any performance-based remuneration or participation in any share-based incentive schemes. This policy reflects the differences in the role of the non-executive Directors, which is to provide oversight and guide strategy, and the role of management, which is to operate the business and execute the Company’s strategy. Non-executive Directors are encouraged to be shareholders but are not required to hold shares in the Company.
Each non-executive Director receives a fee for services as a Director of the Company. An additional fee is also paid for being a member of the Board’s Nominations and Remuneration Committee, Audit and Finance Committee, and Health, Safety & Risk Committee. The payment of an additional fee recognises the additional time commitment required by Directors who serve on those committees. Directors are also entitled to be reimbursed for costs associated with carrying out their duties.
Annual fees paid to the non-executive Directors of the Company for the period 1 July 2018 to 30 June 2019 were as follows:
Fees for serving Total
Director Base FeeAudit & Finance
Committee
Nominations & Remuneration
CommitteeHealth, Safety
& Risk
Base & Committee
feesJohn Ryder (Chair) $112,250 $0 $0 $0 $112,250
Mark Hutton $58,875 $7,125 $8,250 $0 $74,250
Jack Porus $58,875 $0 $4,125 $0 $63,000
Thomas Song $51,417 $2,625 $0 $1,300 $55,342
Paul Steere $58,875 $7,500 $4,125 $4,500 $75,000
Xin Wang $43,875 $0 $0 $0 $43,875
Lai Po Sing $15,000 $0 $0 $0 $15,000
Chiong Yong Tiong $1,935 $0 $0 $0 $1,935
Remuneration of CEO and ExecutivesThe number of employees of the Company (including former employees), not being Directors, who received remuneration and other benefits in excess of $100,000 in the period 1 July 2018 to 30 June 2019 is set out in the remuneration bands detailed below:
Number of employeesRemuneration FY19 FY18
$100,000 to $109,999 2 9$110,000 to $119,999 6 7$120,000 to $129,999 5 2$130,000 to $139,999 1 6$140,000 to $149,999 8 3$150,000 to $159,999 4 1$160,000 to $169,999 5 1$170,000 to $179,999 0 2$230,000 to $239,999 1 1$240,000 to $249,999 1 1$260,000 to $269,999 1 1$330,000 to $339,999 0 1$360,000 to $369,999 1 0$380,000 to $389,999 0 1
* Includes redundancy payments, other prescribed fringe benefits
As set out in further detail below, the total remuneration and value of other benefits paid to the CEO (including under the STI Scheme and LTI Scheme detailed below) for the year ended 30 June 2019 was $697,327 (2018: $695,955).
Components of Compensation – CEO and Other Nominated Executives
b) Structure
The Company aims to reward the CEO and nominated executives with a level and mix of remuneration commensurate with their position and responsibilities within the Group, so as to:
» Reward them for Company performance against targets set by reference to appropriate benchmarks and key performance indicators. » Align their interests with those of shareholders. » Ensure total remuneration is competitive by market standards.
Remuneration consists of both fixed and variable remuneration components. The variable remuneration component comprises the STI Scheme and the LTI Scheme.
The proportion of fixed remuneration and variable remuneration is established for the CEO and for each nominated executive by the Board, following recommendations from the Nominations and Remuneration Committee and the CEO (in the case of the nominated executives only).
The remuneration packages for the CEO and nominated executives are all subject to Board approval. There were no material changes to the remuneration structures or targets for the 2019 year.
2019: BLUE FRONTIERSNEW ZEAL AND KING SALMON | ANNUAL REPORT FY19 109108
CORPOR ATE GOVERNANCE CORPOR ATE GOVERNANCE
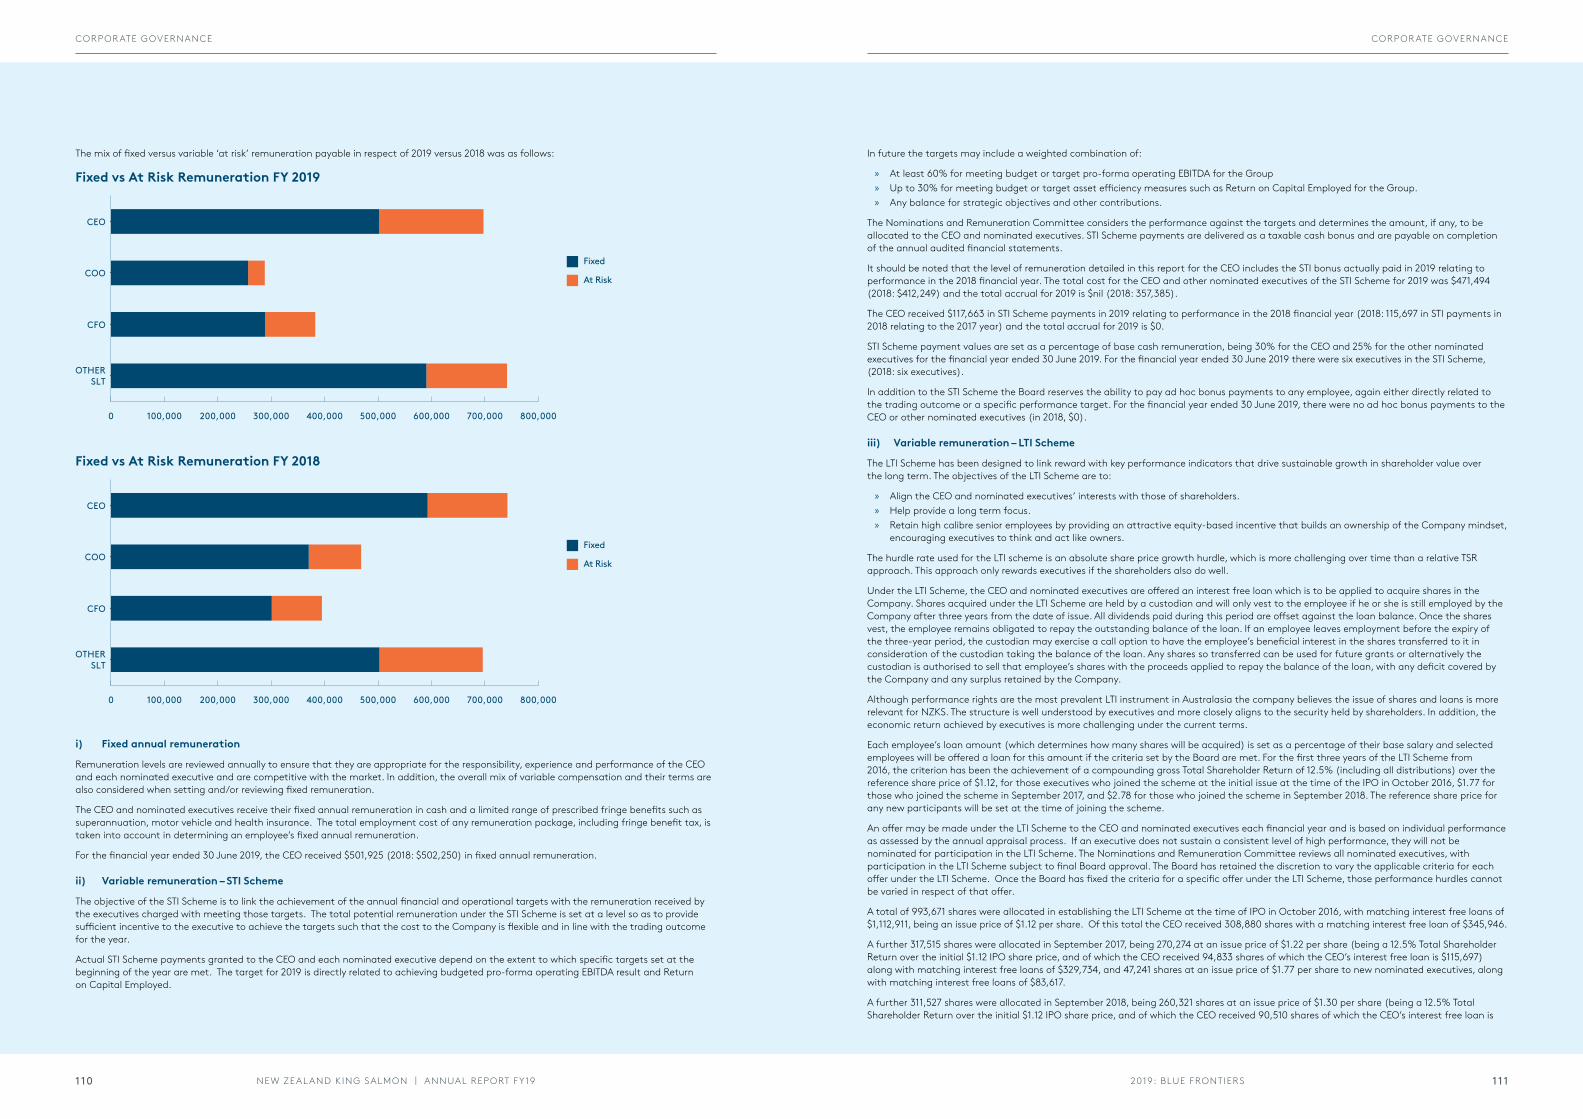
The mix of fixed versus variable ‘at risk’ remuneration payable in respect of 2019 versus 2018 was as follows:
i) Fixed annual remuneration
Remuneration levels are reviewed annually to ensure that they are appropriate for the responsibility, experience and performance of the CEO and each nominated executive and are competitive with the market. In addition, the overall mix of variable compensation and their terms are also considered when setting and/or reviewing fixed remuneration.
The CEO and nominated executives receive their fixed annual remuneration in cash and a limited range of prescribed fringe benefits such as superannuation, motor vehicle and health insurance. The total employment cost of any remuneration package, including fringe benefit tax, is taken into account in determining an employee’s fixed annual remuneration.
For the financial year ended 30 June 2019, the CEO received $501,925 (2018: $502,250) in fixed annual remuneration.
ii) Variable remuneration – STI Scheme
The objective of the STI Scheme is to link the achievement of the annual financial and operational targets with the remuneration received by the executives charged with meeting those targets. The total potential remuneration under the STI Scheme is set at a level so as to provide sufficient incentive to the executive to achieve the targets such that the cost to the Company is flexible and in line with the trading outcome for the year.
Actual STI Scheme payments granted to the CEO and each nominated executive depend on the extent to which specific targets set at the beginning of the year are met. The target for 2019 is directly related to achieving budgeted pro-forma operating EBITDA result and Return on Capital Employed.
OTHER SLT
CEO
COO
CFO
0 100,000 200,000 300,000 400,000 500,000 600,000 700,000 800,000
Fixed
At Risk
Fixed vs At Risk Remuneration FY 2019
OTHER SLT
CEO
COO
CFO
0 100,000 200,000 300,000 400,000 500,000 600,000 700,000 800,000
Fixed
At Risk
Fixed vs At Risk Remuneration FY 2018
In future the targets may include a weighted combination of:
» At least 60% for meeting budget or target pro-forma operating EBITDA for the Group » Up to 30% for meeting budget or target asset efficiency measures such as Return on Capital Employed for the Group. » Any balance for strategic objectives and other contributions.
The Nominations and Remuneration Committee considers the performance against the targets and determines the amount, if any, to be allocated to the CEO and nominated executives. STI Scheme payments are delivered as a taxable cash bonus and are payable on completion of the annual audited financial statements.
It should be noted that the level of remuneration detailed in this report for the CEO includes the STI bonus actually paid in 2019 relating to performance in the 2018 financial year. The total cost for the CEO and other nominated executives of the STI Scheme for 2019 was $471,494 (2018: $412,249) and the total accrual for 2019 is $nil (2018: 357,385).
The CEO received $117,663 in STI Scheme payments in 2019 relating to performance in the 2018 financial year (2018: 115,697 in STI payments in 2018 relating to the 2017 year) and the total accrual for 2019 is $0.
STI Scheme payment values are set as a percentage of base cash remuneration, being 30% for the CEO and 25% for the other nominated executives for the financial year ended 30 June 2019. For the financial year ended 30 June 2019 there were six executives in the STI Scheme, (2018: six executives).
In addition to the STI Scheme the Board reserves the ability to pay ad hoc bonus payments to any employee, again either directly related to the trading outcome or a specific performance target. For the financial year ended 30 June 2019, there were no ad hoc bonus payments to the CEO or other nominated executives (in 2018, $0).
iii) Variable remuneration – LTI Scheme
The LTI Scheme has been designed to link reward with key performance indicators that drive sustainable growth in shareholder value over the long term. The objectives of the LTI Scheme are to:
» Align the CEO and nominated executives’ interests with those of shareholders. » Help provide a long term focus. » Retain high calibre senior employees by providing an attractive equity-based incentive that builds an ownership of the Company mindset,
encouraging executives to think and act like owners.
The hurdle rate used for the LTI scheme is an absolute share price growth hurdle, which is more challenging over time than a relative TSR approach. This approach only rewards executives if the shareholders also do well.
Under the LTI Scheme, the CEO and nominated executives are offered an interest free loan which is to be applied to acquire shares in the Company. Shares acquired under the LTI Scheme are held by a custodian and will only vest to the employee if he or she is still employed by the Company after three years from the date of issue. All dividends paid during this period are offset against the loan balance. Once the shares vest, the employee remains obligated to repay the outstanding balance of the loan. If an employee leaves employment before the expiry of the three-year period, the custodian may exercise a call option to have the employee’s beneficial interest in the shares transferred to it in consideration of the custodian taking the balance of the loan. Any shares so transferred can be used for future grants or alternatively the custodian is authorised to sell that employee’s shares with the proceeds applied to repay the balance of the loan, with any deficit covered by the Company and any surplus retained by the Company.
Although performance rights are the most prevalent LTI instrument in Australasia the company believes the issue of shares and loans is more relevant for NZKS. The structure is well understood by executives and more closely aligns to the security held by shareholders. In addition, the economic return achieved by executives is more challenging under the current terms.
Each employee’s loan amount (which determines how many shares will be acquired) is set as a percentage of their base salary and selected employees will be offered a loan for this amount if the criteria set by the Board are met. For the first three years of the LTI Scheme from 2016, the criterion has been the achievement of a compounding gross Total Shareholder Return of 12.5% (including all distributions) over the reference share price of $1.12, for those executives who joined the scheme at the initial issue at the time of the IPO in October 2016, $1.77 for those who joined the scheme in September 2017, and $2.78 for those who joined the scheme in September 2018. The reference share price for any new participants will be set at the time of joining the scheme.
An offer may be made under the LTI Scheme to the CEO and nominated executives each financial year and is based on individual performance as assessed by the annual appraisal process. If an executive does not sustain a consistent level of high performance, they will not be nominated for participation in the LTI Scheme. The Nominations and Remuneration Committee reviews all nominated executives, with participation in the LTI Scheme subject to final Board approval. The Board has retained the discretion to vary the applicable criteria for each offer under the LTI Scheme. Once the Board has fixed the criteria for a specific offer under the LTI Scheme, those performance hurdles cannot be varied in respect of that offer.
A total of 993,671 shares were allocated in establishing the LTI Scheme at the time of IPO in October 2016, with matching interest free loans of $1,112,911, being an issue price of $1.12 per share. Of this total the CEO received 308,880 shares with a matching interest free loan of $345,946.
A further 317,515 shares were allocated in September 2017, being 270,274 at an issue price of $1.22 per share (being a 12.5% Total Shareholder Return over the initial $1.12 IPO share price, and of which the CEO received 94,833 shares of which the CEO’s interest free loan is $115,697) along with matching interest free loans of $329,734, and 47,241 shares at an issue price of $1.77 per share to new nominated executives, along with matching interest free loans of $83,617.
A further 311,527 shares were allocated in September 2018, being 260,321 shares at an issue price of $1.30 per share (being a 12.5% Total Shareholder Return over the initial $1.12 IPO share price, and of which the CEO received 90,510 shares of which the CEO’s interest free loan is
2019: BLUE FRONTIERSNEW ZEAL AND KING SALMON | ANNUAL REPORT FY19 1 1 11 10
CORPOR ATE GOVERNANCE CORPOR ATE GOVERNANCE
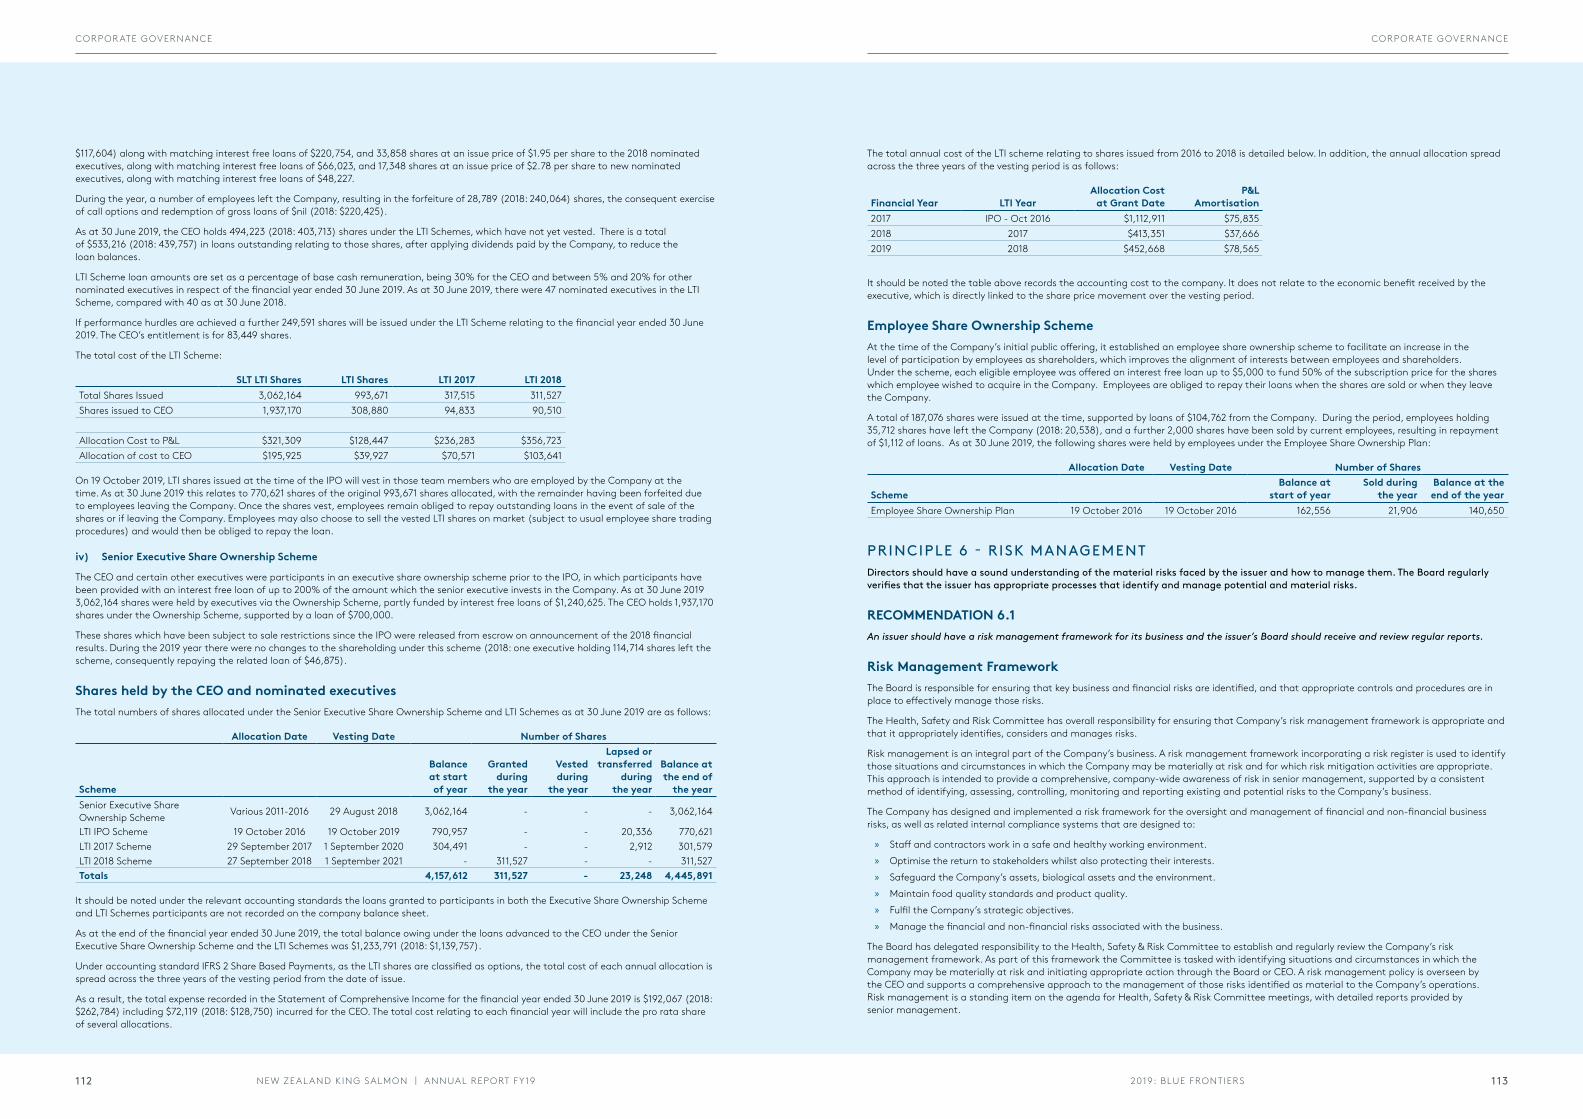
$117,604) along with matching interest free loans of $220,754, and 33,858 shares at an issue price of $1.95 per share to the 2018 nominated executives, along with matching interest free loans of $66,023, and 17,348 shares at an issue price of $2.78 per share to new nominated executives, along with matching interest free loans of $48,227.
During the year, a number of employees left the Company, resulting in the forfeiture of 28,789 (2018: 240,064) shares, the consequent exercise of call options and redemption of gross loans of $nil (2018: $220,425).
As at 30 June 2019, the CEO holds 494,223 (2018: 403,713) shares under the LTI Schemes, which have not yet vested. There is a total of $533,216 (2018: 439,757) in loans outstanding relating to those shares, after applying dividends paid by the Company, to reduce the loan balances.
LTI Scheme loan amounts are set as a percentage of base cash remuneration, being 30% for the CEO and between 5% and 20% for other nominated executives in respect of the financial year ended 30 June 2019. As at 30 June 2019, there were 47 nominated executives in the LTI Scheme, compared with 40 as at 30 June 2018.
If performance hurdles are achieved a further 249,591 shares will be issued under the LTI Scheme relating to the financial year ended 30 June 2019. The CEO’s entitlement is for 83,449 shares.
The total cost of the LTI Scheme:
Allocation Date Vesting Date Number of Shares
Scheme
Balance at start of year
Granted during
the year
Vested during
the year
Lapsed or transferred
during the year
Balance at the end of
the yearSenior Executive Share Ownership Scheme Various 2011-2016 29 August 2018 3,062,164 - - - 3,062,164
LTI IPO Scheme 19 October 2016 19 October 2019 790,957 - - 20,336 770,621LTI 2017 Scheme 29 September 2017 1 September 2020 304,491 - - 2,912 301,579LTI 2018 Scheme 27 September 2018 1 September 2021 - 311,527 - - 311,527Totals 4,157,612 311,527 - 23,248 4,445,891
Financial Year LTI YearAllocation Cost
at Grant DateP&L
Amortisation2017 IPO - Oct 2016 $1,112,911 $75,8352018 2017 $413,351 $37,6662019 2018 $452,668 $78,565
It should be noted under the relevant accounting standards the loans granted to participants in both the Executive Share Ownership Scheme and LTI Schemes participants are not recorded on the company balance sheet.
As at the end of the financial year ended 30 June 2019, the total balance owing under the loans advanced to the CEO under the Senior Executive Share Ownership Scheme and the LTI Schemes was $1,233,791 (2018: $1,139,757).
Under accounting standard IFRS 2 Share Based Payments, as the LTI shares are classified as options, the total cost of each annual allocation is spread across the three years of the vesting period from the date of issue.
As a result, the total expense recorded in the Statement of Comprehensive Income for the financial year ended 30 June 2019 is $192,067 (2018: $262,784) including $72,119 (2018: $128,750) incurred for the CEO. The total cost relating to each financial year will include the pro rata share of several allocations.
The total annual cost of the LTI scheme relating to shares issued from 2016 to 2018 is detailed below. In addition, the annual allocation spread across the three years of the vesting period is as follows:
It should be noted the table above records the accounting cost to the company. It does not relate to the economic benefit received by the executive, which is directly linked to the share price movement over the vesting period.
Employee Share Ownership SchemeAt the time of the Company’s initial public offering, it established an employee share ownership scheme to facilitate an increase in the level of participation by employees as shareholders, which improves the alignment of interests between employees and shareholders. Under the scheme, each eligible employee was offered an interest free loan up to $5,000 to fund 50% of the subscription price for the shares which employee wished to acquire in the Company. Employees are obliged to repay their loans when the shares are sold or when they leave the Company.
A total of 187,076 shares were issued at the time, supported by loans of $104,762 from the Company. During the period, employees holding 35,712 shares have left the Company (2018: 20,538), and a further 2,000 shares have been sold by current employees, resulting in repayment of $1,112 of loans. As at 30 June 2019, the following shares were held by employees under the Employee Share Ownership Plan:
Allocation Date Vesting Date Number of Shares
SchemeBalance at
start of yearSold during
the yearBalance at the end of the year
Employee Share Ownership Plan 19 October 2016 19 October 2016 162,556 21,906 140,650
PRINCIPLE 6 - RISK MANAGEMENTDirectors should have a sound understanding of the material risks faced by the issuer and how to manage them. The Board regularly verifies that the issuer has appropriate processes that identify and manage potential and material risks.
RECOMMENDATION 6.1An issuer should have a risk management framework for its business and the issuer’s Board should receive and review regular reports.
Risk Management FrameworkThe Board is responsible for ensuring that key business and financial risks are identified, and that appropriate controls and procedures are in place to effectively manage those risks.
The Health, Safety and Risk Committee has overall responsibility for ensuring that Company’s risk management framework is appropriate and that it appropriately identifies, considers and manages risks.
Risk management is an integral part of the Company’s business. A risk management framework incorporating a risk register is used to identify those situations and circumstances in which the Company may be materially at risk and for which risk mitigation activities are appropriate. This approach is intended to provide a comprehensive, company-wide awareness of risk in senior management, supported by a consistent method of identifying, assessing, controlling, monitoring and reporting existing and potential risks to the Company’s business.
The Company has designed and implemented a risk framework for the oversight and management of financial and non-financial business risks, as well as related internal compliance systems that are designed to:
» Staff and contractors work in a safe and healthy working environment. » Optimise the return to stakeholders whilst also protecting their interests. » Safeguard the Company’s assets, biological assets and the environment. » Maintain food quality standards and product quality. » Fulfil the Company’s strategic objectives. » Manage the financial and non-financial risks associated with the business.
The Board has delegated responsibility to the Health, Safety & Risk Committee to establish and regularly review the Company’s risk management framework. As part of this framework the Committee is tasked with identifying situations and circumstances in which the Company may be materially at risk and initiating appropriate action through the Board or CEO. A risk management policy is overseen by the CEO and supports a comprehensive approach to the management of those risks identified as material to the Company’s operations. Risk management is a standing item on the agenda for Health, Safety & Risk Committee meetings, with detailed reports provided by senior management.
SLT LTI Shares LTI Shares LTI 2017 LTI 2018Total Shares Issued 3,062,164 993,671 317,515 311,527Shares issued to CEO 1,937,170 308,880 94,833 90,510
Allocation Cost to P&L $321,309 $128,447 $236,283 $356,723Allocation of cost to CEO $195,925 $39,927 $70,571 $103,641
On 19 October 2019, LTI shares issued at the time of the IPO will vest in those team members who are employed by the Company at the time. As at 30 June 2019 this relates to 770,621 shares of the original 993,671 shares allocated, with the remainder having been forfeited due to employees leaving the Company. Once the shares vest, employees remain obliged to repay outstanding loans in the event of sale of the shares or if leaving the Company. Employees may also choose to sell the vested LTI shares on market (subject to usual employee share trading procedures) and would then be obliged to repay the loan.
iv) Senior Executive Share Ownership Scheme
The CEO and certain other executives were participants in an executive share ownership scheme prior to the IPO, in which participants have been provided with an interest free loan of up to 200% of the amount which the senior executive invests in the Company. As at 30 June 2019 3,062,164 shares were held by executives via the Ownership Scheme, partly funded by interest free loans of $1,240,625. The CEO holds 1,937,170 shares under the Ownership Scheme, supported by a loan of $700,000.
These shares which have been subject to sale restrictions since the IPO were released from escrow on announcement of the 2018 financial results. During the 2019 year there were no changes to the shareholding under this scheme (2018: one executive holding 114,714 shares left the scheme, consequently repaying the related loan of $46,875).
Shares held by the CEO and nominated executivesThe total numbers of shares allocated under the Senior Executive Share Ownership Scheme and LTI Schemes as at 30 June 2019 are as follows:
2019: BLUE FRONTIERSNEW ZEAL AND KING SALMON | ANNUAL REPORT FY19 1 13112
CORPOR ATE GOVERNANCE CORPOR ATE GOVERNANCE
The CEO and CFO have provided the Board, through the Audit and Finance Committee, with assurances that in their opinion financial records have been properly maintained, that the financial statements comply with those accounting standards under which the Company must report and that the statements give a true and fair view of the Company’s financial position and performance. These representations are given on the basis that a sound system of internal controls and risk management is operating effectively in all material respects in relation to financial reporting.
In managing the Company’s business risks, the Board approves and monitors policy and procedures in areas such as treasury management, financial performance, taxation and delegated authorities.
InsuranceThe Company has insurance policies in place covering most areas where risk to its assets and business can be insured at a reasonable cost.
RECOMMENDATION 6.2An issuer should disclose how it manages its health and safety risks and should report on their health and safety risks, performance and management.
Health and SafetyThe Board and management are committed to promoting a safe and healthy working environment for everyone working in, or interacting with, the Company. The Company strives for continuous improvement that takes us beyond compliance in health, safety and wellness. This includes the reviewing of our health and safety policy statement as well as the systems and processes that support our safety objectives.
The Company’s Health, Safety & Risk Committee Charter creates a shared responsibility for all our team members and contractors to so far as reasonably practicable take all steps in providing a working environment that promotes health and wellbeing. Effective controls based on industry knowledge and best practice guidelines inform and support our risk management across in all areas of the business.
The Company uses a risk-based approach, having identified a number of critical risk areas, being:
» Maritime operations » Fire, electricity and natural events » Heights and lifting » Confined spaces » Mobile plant and equipment » Construction activity
Each of these critical risk areas has initiatives designed to eliminate, isolate or minimise risk.
The Company uses a combination of leading and lagging performance measures in health and safety.
Further information is included at pages 21–23.
PRINCIPLE 7 – AUDITORSThe Board should ensure the quality and independence of the external audit process.
RECOMMENDATION 7.1 AND 7.2The Board should establish framework for the issuer’s relationship with its external auditors.
The external auditor does attend the issuer’s Annual Shareholders Meeting to answer questions from shareholders in relation to the audit.
External AuditorThe Company’s Audit and Finance Committee is responsible for oversight of the Company’s external audit arrangements to safeguard the integrity of financial reporting. The Company maintains an External Auditor Independence Policy to ensure that audit independence is maintained, both in fact and appearance.
The policy covers the following areas:
» Appointment of the external auditor. » Provision of other assurance services by the external auditor. » Pre-approval process for the provision of other assurance services. » External auditor lead and engagement partner rotation. » Hiring of staff from the external auditor. » Relationships between the external auditor and the Company. » Reporting on fees and non-audit work.
The role of the external auditor is to audit the financial statements of the Company in accordance with applicable auditing standards in New Zealand and to report on its findings to the Board and shareholders of the Company.
The External Auditor Independence Policy is available in the Corporate Governance Code which is available on the Company’s website at https://www.kingsalmon.co.nz/investors/corporate-governance/.
Ernst & Young is the Company’s current external auditor. Bruce Loader is the current audit engagement partner, in his third year following a partner rotation after the 2016 audit. Fees paid to Ernst & Young are included in note 28 of the notes to the financial statements.
Both the Company’s Audit and Finance Committee Charter and the External Auditor Independence Policy require the external auditor to be independent, recognising the importance of facilitating frank dialogue between the Audit and Finance Committee, the auditor and management. The External Auditor Independence Policy requires that the audit partner is rotated after a maximum of five years.
The Audit and Finance Committee Charter requires the Committee to facilitate the continuing independence of the external auditor by assessing the external auditor’s independence, qualifications, overseeing and monitoring their performance. This involves monitoring all aspects of the external audit, including the appointment of the auditor, the nature and scope of its audit and reviewing the auditor’s service delivery plan.
The auditor has been invited to attend the Annual Shareholders’ Meeting and will be available to answer questions about the audit process and the independence of the auditor.
RECOMMENDATION 7.3Internal audit functions should be disclosed.
Internal AuditThe Company does not have an internal audit function. However, the Company does have a quality and compliance team dedicated to food hygiene in relation to the processing of harvested fish through to finished goods that are dispatched to the end customer. The objective of the quality and compliance team is to enhance and protect the organisational value of the Company by providing risk-based and objective assurance. The management Health and Safety Steering Group has overseen internal safety audits throughout the farming and manufacturing process. The Health, Safety and Risk Committee now oversees this function.
Where necessary, external expertise is obtained for specific audit activities.
Independent Professional AdviceDirectors are entitled to seek independent professional advice on any issue related to the fulfilment of his or her duties, at the Company’s expense.
PRINCIPLE 8 – SHAREHOLDER REL ATIONSThe Board should respect the rights of shareholders and foster constructive relationship with shareholders that encourage them to engage with the issuer.
RECOMMENDATION 8.1An issuer should have a website where investors and interested stakeholders can access financial and operational information and key corporate governance information about the issuer.
Shareholder RelationsThe Company is committed to maintaining a full and open dialogue with its shareholders and other stakeholders. Annual reports, NZX releases, governance policies and charters and a variety of corporate information are posted onto the Company’s website.
The Company’s preference is for electronic communications in the interests of sustainability and efficiency; however, each shareholder is entitled to receive a paper copy of each annual report.
The Company has an Annual Meeting page in the Investors section on its website. Documents relating to meetings are available.
Shareholder meetings will be held at a time and location to encourage participation in person by shareholders. Annual meetings are currently held in the Nelson / Marlborough region, reflecting the head office and production locations for the Company.
The Company’s website includes a range of information relevant to shareholders and others concerning the operation of the Company, including information about the sites we operate, Aquaculture Best Management Practices (BMP), certifications, our brands and the corporate governance policies of the Company.
2019: BLUE FRONTIERSNEW ZEAL AND KING SALMON | ANNUAL REPORT FY19 1 15114
CORPOR ATE GOVERNANCE CORPOR ATE GOVERNANCE
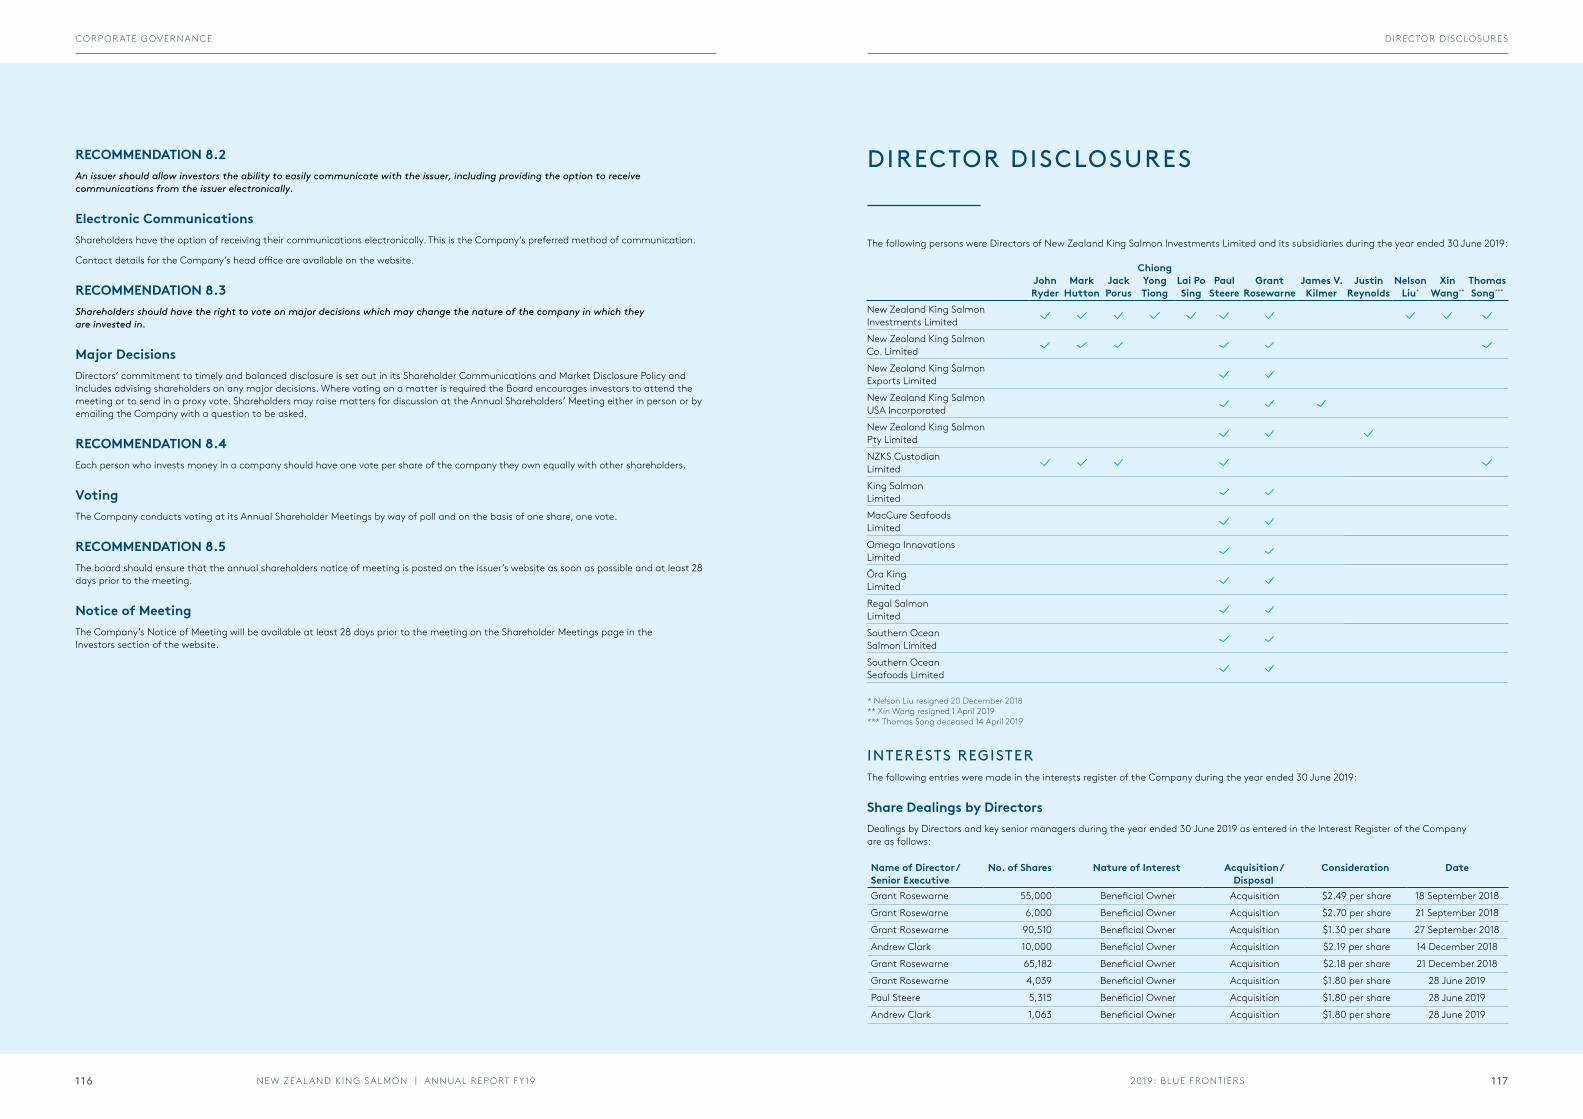
RECOMMENDATION 8.2An issuer should allow investors the ability to easily communicate with the issuer, including providing the option to receive communications from the issuer electronically.
Electronic CommunicationsShareholders have the option of receiving their communications electronically. This is the Company’s preferred method of communication.
Contact details for the Company’s head office are available on the website.
RECOMMENDATION 8.3Shareholders should have the right to vote on major decisions which may change the nature of the company in which they are invested in.
Major DecisionsDirectors’ commitment to timely and balanced disclosure is set out in its Shareholder Communications and Market Disclosure Policy and includes advising shareholders on any major decisions. Where voting on a matter is required the Board encourages investors to attend the meeting or to send in a proxy vote. Shareholders may raise matters for discussion at the Annual Shareholders’ Meeting either in person or by emailing the Company with a question to be asked.
RECOMMENDATION 8.4Each person who invests money in a company should have one vote per share of the company they own equally with other shareholders.
VotingThe Company conducts voting at its Annual Shareholder Meetings by way of poll and on the basis of one share, one vote.
RECOMMENDATION 8.5The board should ensure that the annual shareholders notice of meeting is posted on the issuer’s website as soon as possible and at least 28 days prior to the meeting.
Notice of MeetingThe Company’s Notice of Meeting will be available at least 28 days prior to the meeting on the Shareholder Meetings page in the Investors section of the website.
DIRECTOR DISCLOSURES
John Ryder
Mark Hutton
Jack Porus
Chiong Yong Tiong
Lai Po Sing
Paul Steere
Grant Rosewarne
James V. Kilmer
Justin Reynolds
Nelson Liu*
Xin Wang**
Thomas Song***
New Zealand King Salmon Investments Limited
New Zealand King Salmon Co. Limited
New Zealand King Salmon Exports Limited
New Zealand King Salmon USA Incorporated
New Zealand King Salmon Pty Limited
NZKS Custodian Limited
King Salmon Limited
MacCure Seafoods Limited
Omega Innovations Limited
Ōra King Limited
Regal Salmon Limited
Southern Ocean Salmon Limited
Southern Ocean Seafoods Limited
The following persons were Directors of New Zealand King Salmon Investments Limited and its subsidiaries during the year ended 30 June 2019:
Name of Director / Senior Executive
No. of Shares Nature of Interest Acquisition / Disposal
Consideration Date
Grant Rosewarne 55,000 Beneficial Owner Acquisition $2.49 per share 18 September 2018
Grant Rosewarne 6,000 Beneficial Owner Acquisition $2.70 per share 21 September 2018
Grant Rosewarne 90,510 Beneficial Owner Acquisition $1.30 per share 27 September 2018
Andrew Clark 10,000 Beneficial Owner Acquisition $2.19 per share 14 December 2018
Grant Rosewarne 65,182 Beneficial Owner Acquisition $2.18 per share 21 December 2018
Grant Rosewarne 4,039 Beneficial Owner Acquisition $1.80 per share 28 June 2019
Paul Steere 5,315 Beneficial Owner Acquisition $1.80 per share 28 June 2019
Andrew Clark 1,063 Beneficial Owner Acquisition $1.80 per share 28 June 2019
INTERESTS REGISTERThe following entries were made in the interests register of the Company during the year ended 30 June 2019:
Share Dealings by DirectorsDealings by Directors and key senior managers during the year ended 30 June 2019 as entered in the Interest Register of the Company are as follows:
* Nelson Liu resigned 20 December 2018** Xin Wang resigned 1 April 2019*** Thomas Song deceased 14 April 2019
2019: BLUE FRONTIERSNEW ZEAL AND KING SALMON | ANNUAL REPORT FY19 1 17116
CORPOR ATE GOVERNANCE DIRECTOR DISCLOSURES
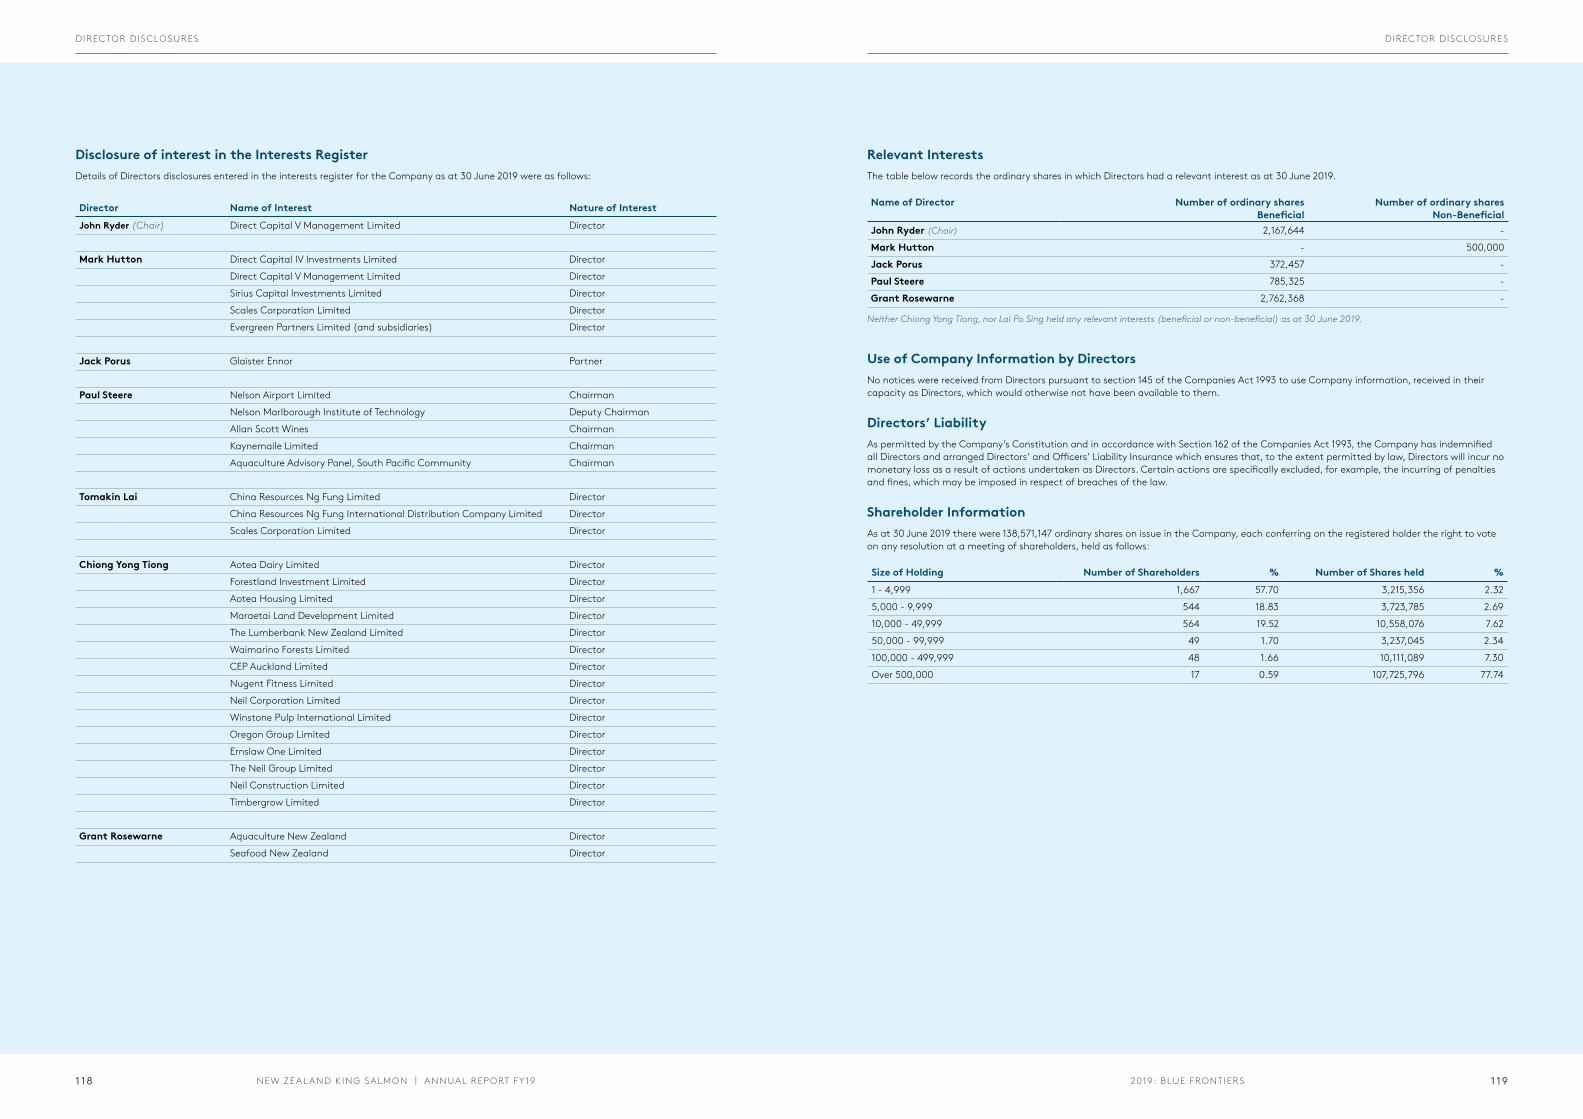
Disclosure of interest in the Interests RegisterDetails of Directors disclosures entered in the interests register for the Company as at 30 June 2019 were as follows:
Director Name of Interest Nature of Interest
John Ryder (Chair) Direct Capital V Management Limited Director
Mark Hutton Direct Capital IV Investments Limited Director
Direct Capital V Management Limited Director
Sirius Capital Investments Limited Director
Scales Corporation Limited Director
Evergreen Partners Limited (and subsidiaries) Director
Jack Porus Glaister Ennor Partner
Paul Steere Nelson Airport Limited Chairman
Nelson Marlborough Institute of Technology Deputy Chairman
Allan Scott Wines Chairman
Kaynemaile Limited Chairman
Aquaculture Advisory Panel, South Pacific Community Chairman
Tomakin Lai China Resources Ng Fung Limited Director
China Resources Ng Fung International Distribution Company Limited Director
Scales Corporation Limited Director
Chiong Yong Tiong Aotea Dairy Limited Director
Forestland Investment Limited Director
Aotea Housing Limited Director
Maraetai Land Development Limited Director
The Lumberbank New Zealand Limited Director
Waimarino Forests Limited Director
CEP Auckland Limited Director
Nugent Fitness Limited Director
Neil Corporation Limited Director
Winstone Pulp International Limited Director
Oregon Group Limited Director
Ernslaw One Limited Director
The Neil Group Limited Director
Neil Construction Limited Director
Timbergrow Limited Director
Grant Rosewarne Aquaculture New Zealand Director
Seafood New Zealand Director
Name of Director Number of ordinary shares Beneficial
Number of ordinary shares Non-Beneficial
John Ryder (Chair) 2,167,644 -
Mark Hutton - 500,000
Jack Porus 372,457 -
Paul Steere 785,325 -
Grant Rosewarne 2,762,368 -
Relevant InterestsThe table below records the ordinary shares in which Directors had a relevant interest as at 30 June 2019.
Neither Chiong Yong Tiong, nor Lai Po Sing held any relevant interests (beneficial or non-beneficial) as at 30 June 2019.
Use of Company Information by DirectorsNo notices were received from Directors pursuant to section 145 of the Companies Act 1993 to use Company information, received in their capacity as Directors, which would otherwise not have been available to them.
Directors’ LiabilityAs permitted by the Company’s Constitution and in accordance with Section 162 of the Companies Act 1993, the Company has indemnified all Directors and arranged Directors’ and Officers’ Liability Insurance which ensures that, to the extent permitted by law, Directors will incur no monetary loss as a result of actions undertaken as Directors. Certain actions are specifically excluded, for example, the incurring of penalties and fines, which may be imposed in respect of breaches of the law.
Shareholder InformationAs at 30 June 2019 there were 138,571,147 ordinary shares on issue in the Company, each conferring on the registered holder the right to vote on any resolution at a meeting of shareholders, held as follows:
Size of Holding Number of Shareholders % Number of Shares held %
1 - 4,999 1,667 57.70 3,215,356 2.32
5,000 - 9,999 544 18.83 3,723,785 2.69
10,000 - 49,999 564 19.52 10,558,076 7.62
50,000 - 99,999 49 1.70 3,237,045 2.34
100,000 - 499,999 48 1.66 10,111,089 7.30
Over 500,000 17 0.59 107,725,796 77.74
2019: BLUE FRONTIERSNEW ZEAL AND KING SALMON | ANNUAL REPORT FY19 1 19118
DIRECTOR DISCLOSURES DIRECTOR DISCLOSURES
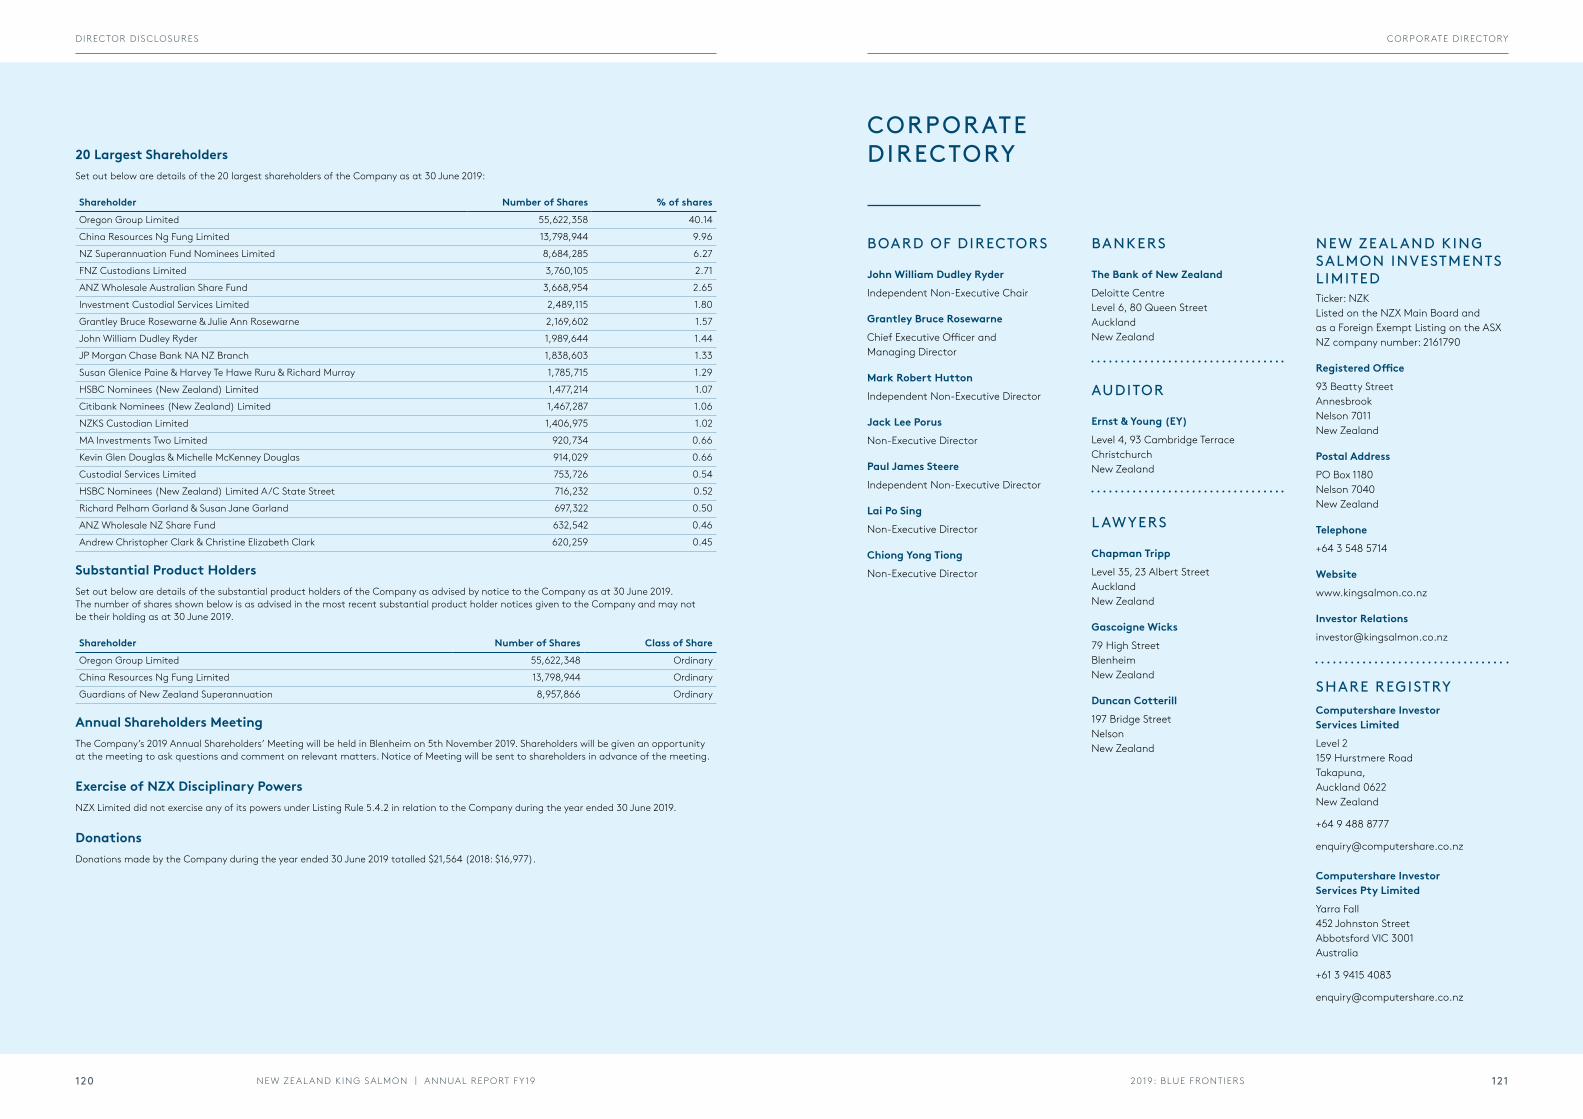
Shareholder Number of Shares % of shares
Oregon Group Limited 55,622,358 40.14
China Resources Ng Fung Limited 13,798,944 9.96
NZ Superannuation Fund Nominees Limited 8,684,285 6.27
FNZ Custodians Limited 3,760,105 2.71
ANZ Wholesale Australian Share Fund 3,668,954 2.65
Investment Custodial Services Limited 2,489,115 1.80
Grantley Bruce Rosewarne & Julie Ann Rosewarne 2,169,602 1.57
John William Dudley Ryder 1,989,644 1.44
JP Morgan Chase Bank NA NZ Branch 1,838,603 1.33
Susan Glenice Paine & Harvey Te Hawe Ruru & Richard Murray 1,785,715 1.29
HSBC Nominees (New Zealand) Limited 1,477,214 1.07
Citibank Nominees (New Zealand) Limited 1,467,287 1.06
NZKS Custodian Limited 1,406,975 1.02
MA Investments Two Limited 920,734 0.66
Kevin Glen Douglas & Michelle McKenney Douglas 914,029 0.66
Custodial Services Limited 753,726 0.54
HSBC Nominees (New Zealand) Limited A/C State Street 716,232 0.52
Richard Pelham Garland & Susan Jane Garland 697,322 0.50
ANZ Wholesale NZ Share Fund 632,542 0.46
Andrew Christopher Clark & Christine Elizabeth Clark 620,259 0.45
20 Largest ShareholdersSet out below are details of the 20 largest shareholders of the Company as at 30 June 2019:
Shareholder Number of Shares Class of ShareOregon Group Limited 55,622,348 Ordinary
China Resources Ng Fung Limited 13,798,944 Ordinary
Guardians of New Zealand Superannuation 8,957,866 Ordinary
Substantial Product HoldersSet out below are details of the substantial product holders of the Company as advised by notice to the Company as at 30 June 2019. The number of shares shown below is as advised in the most recent substantial product holder notices given to the Company and may not be their holding as at 30 June 2019.
Annual Shareholders MeetingThe Company’s 2019 Annual Shareholders’ Meeting will be held in Blenheim on 5th November 2019. Shareholders will be given an opportunity at the meeting to ask questions and comment on relevant matters. Notice of Meeting will be sent to shareholders in advance of the meeting.
Exercise of NZX Disciplinary PowersNZX Limited did not exercise any of its powers under Listing Rule 5.4.2 in relation to the Company during the year ended 30 June 2019.
DonationsDonations made by the Company during the year ended 30 June 2019 totalled $21,564 (2018: $16,977).
CORPORATE DIRECTORY
BOARD OF DIRECTORS
John William Dudley RyderIndependent Non-Executive Chair
Grantley Bruce RosewarneChief Executive Officer and Managing Director
Mark Robert HuttonIndependent Non-Executive Director
Jack Lee PorusNon-Executive Director
Paul James SteereIndependent Non-Executive Director
Lai Po SingNon-Executive Director
Chiong Yong TiongNon-Executive Director
BANKERS
The Bank of New ZealandDeloitte Centre Level 6, 80 Queen Street Auckland New Zealand
AUDITOR
Ernst & Young (EY)Level 4, 93 Cambridge Terrace Christchurch New Zealand
L AWYERS
Chapman TrippLevel 35, 23 Albert Street Auckland New Zealand
Gascoigne Wicks79 High Street Blenheim New Zealand
Duncan Cotterill197 Bridge Street Nelson New Zealand
NEW ZEAL AND KING SALMON INVESTMENTS LIMITEDTicker: NZK Listed on the NZX Main Board and as a Foreign Exempt Listing on the ASX NZ company number: 2161790
Registered Office 93 Beatty Street Annesbrook Nelson 7011 New Zealand
Postal AddressPO Box 1180 Nelson 7040 New Zealand
Telephone+64 3 548 5714
Websitewww.kingsalmon.co.nz
Investor [email protected]
SHARE REGISTRYComputershare Investor Services LimitedLevel 2 159 Hurstmere Road Takapuna, Auckland 0622 New Zealand
+64 9 488 8777
Computershare Investor Services Pty LimitedYarra Fall 452 Johnston Street Abbotsford VIC 3001 Australia
+61 3 9415 4083
2019: BLUE FRONTIERSNEW ZEAL AND KING SALMON | ANNUAL REPORT FY19 121120
DIRECTOR DISCLOSURES CORPOR ATE DIRECTORY
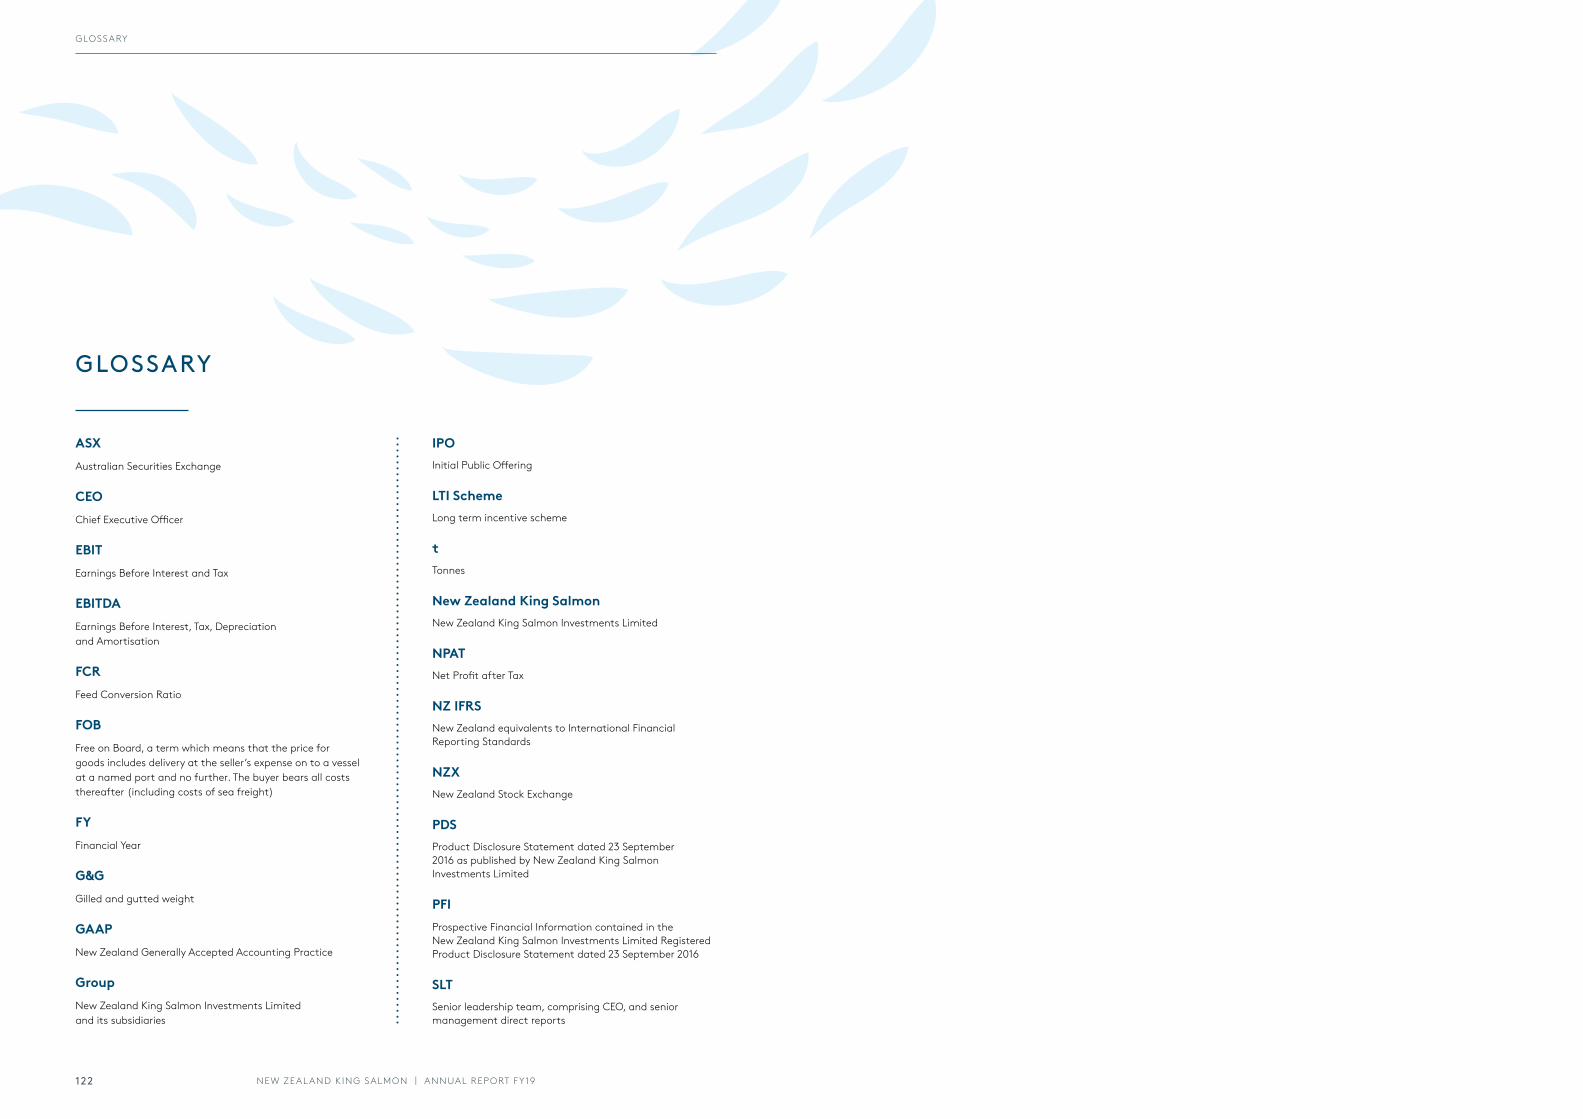
GLOSSARY
ASXAustralian Securities Exchange
CEOChief Executive Officer
EBITEarnings Before Interest and Tax
EBITDAEarnings Before Interest, Tax, Depreciation and Amortisation
FCRFeed Conversion Ratio
FOBFree on Board, a term which means that the price for goods includes delivery at the seller’s expense on to a vessel at a named port and no further. The buyer bears all costs thereafter (including costs of sea freight)
FYFinancial Year
G&GGilled and gutted weight
GAAPNew Zealand Generally Accepted Accounting Practice
Group New Zealand King Salmon Investments Limited and its subsidiaries
IPOInitial Public Offering
LTI SchemeLong term incentive scheme
tTonnes
New Zealand King SalmonNew Zealand King Salmon Investments Limited
NPATNet Profit after Tax
NZ IFRSNew Zealand equivalents to International Financial Reporting Standards
NZXNew Zealand Stock Exchange
PDSProduct Disclosure Statement dated 23 September 2016 as published by New Zealand King Salmon Investments Limited
PFIProspective Financial Information contained in the New Zealand King Salmon Investments Limited Registered Product Disclosure Statement dated 23 September 2016
SLTSenior leadership team, comprising CEO, and senior management direct reports
NEW ZEAL AND KING SALMON | ANNUAL REPORT FY19122
GLOSSARY

NEW ZEAL AND KING SALMON INVESTMENTS LIMITED
93 Beatty Street, Annesbrook, Nelson 7011 www.kingsalmon.co.nz