Seafood Processing - Oregon State University
86
Seafood Processing Byproducts in the Pacific Northwest by Liz Brown Research Report Submitted To Marine Resource Management Program College of Oceanic & Atmospheric Sciences Oregon State University Corvallis, Oregon 97331-5503 1995 in partial fulfillment of the requirements for the degree of Master of Science Commencement June 1995 This report supported by grant number NA36RG0451 (Project number R/SF-3) from the National Oceanic and Atmospheric Administration to the Oregon State University Sea Grant College Program and by appropriations made by the Oregon State Legislature. The views expressed herein are those of the author and do not necessarily reflect the views of NOAA or any of its subagencies.
Transcript of Seafood Processing - Oregon State University
Seafood Processing Byproductsin the Pacific Northwest
by
Liz Brown
Research Report
Submitted To
Marine Resource Management ProgramCollege of Oceanic & Atmospheric Sciences
Oregon State UniversityCorvallis, Oregon 97331-5503
1995
in partial fulfillment ofthe requirements for the
degree of
Master of ScienceCommencement June 1995
This report supported by grant number NA36RG0451(Project number R/SF-3) from the National Oceanic and
Atmospheric Administration to theOregon State University Sea Grant College Program and byappropriations made by the Oregon State Legislature.
The views expressed herein are those of the authorand do not necessarily reflect the views of NOAA
or any of its subagencies.
I would like to acknowledge the efforts of thefollowing people:
Dr. Michael Morrissey for his support, remarkably hightolerance levels, and sense of humor;
Dr. Dan Selivonchick & Dr. Court Smith for theirwisdom, friendship and time;
Tim McFetridge of the DEQ for his continuous help;
Ken Hilderbrand of Sea Grant and Hans Radtke of OCZMAfor their helpful comments;
The seafood processors who supplied information andinsights;
My MRM Family, especially Donna Obert for hercontinuous warmth;
My Seafood Lab Family, especially Edda Magnusdottir forgood fun;
My many virago friends;
and, for their absurdly unwavering faith in me,Lisa Heigh, Jane Work and Bob Sheldon.
Seafood Processing Byproducts in The Pacific Northwest
Table of Contents
PageI. Introduction .......................................... 1
A. The Fishing Industry in Oregon ..................... 3
1. Groundfish ..................................... 52. Shrimp .......................................113. Crab .................. ......................134. Tuna ......................................... 165. Salmon ....................................... 17
6. Other Species ................................ 19B. Legislation ....................................... 22
1. Federal Water Quality Legislation ............ 22
a. Clean Water Act ......................... 23b. Marine Protection Research and Sanctuaries
Act ..................... ............ 262. State of Oregon Legislation .................. 27
a. Oregon Coastal Management Program ....... 27b. Department of Environmental Quality ..... 28
3. California, Washington & Alaska Legislation.34C. Options for uses of Processing Byproducts ......... 36
1. Solid Byproducts ............................. 362. Wastewater ................................... 43
II. Methodology .......................................... 46III. Survey Results ....................................... 48
A. Water ............................................. 48
1. Use .......................................... 48
2. Cost ........................................ 51
B. Wastewater ...................................... .541. Sewer Use .................................... 54
2. Sewer Cost ................................... 55
C. Solid Byproducts .................................. 57
IV. Summary .............................................. 62
References ........................................... 66
Appendices ...........................................74
i
Table of Charts
FiguresPage1. Oregon Commercial Fishery Landings 1970-1994 ........... 42. Monthly Waste Ratios for Oregon Landings 1981 .......... 53. Oregon Commercial Groundfish Landings 1970-1994 ........ 64. Pacific Whiting Contribution to Groundfish Landings .... 75. Oregon Commercial Shrimp Landings 1970-1994 ........... 116. Oregon Commercial Crab Landings 1970-1994 ............. 147. Oregon Commercial Tuna Landings 1970-1994 ............. 168. Oregon Commercial Salmon Landings 1970-1994 ........... 189. Contribution of Scallops and Urchins to "Other" Species
Category Landings ................................... 2010. Monthly Water Use by Seven Seafood Processing Plants..48
Tables1. Mass Balance Steps in Surimi Processing ................ 92. Proximate Analysis of Select Groundfish Waste ......... 103. Analysis of Air Dried Shrimp Meal ..................... 124. Water Use in Shrimp Production........................ 135. Proximate Analysis of Albacore Tuna ................... 176. Proximate Analysis of Various Salmon Parts ............ 197. Proximate Analysis of Urchin Byproducts ............... 218. Oregon Limitations for BOD, TSS & Oil and Grease ...... 299. Oregon DEQ Monitoring and Reporting Requirements ...... 30
10. Reported Wastewater Characteristics ...................3211. Specific DEQ Standards for Effluent Discharge ......... 3312. Loading Limitations in Oregon and California .......... 3513. Wastewater Discharge Permit Fees for Washington Seafood
Processing Industry Based on Effluent Amounts ....... 3614. Steps in Extracting Chitin ..........15. Best Technology for Disposal of Solid Byproducts Based
on Amounts Produced................................. 4316. Replies to Original Mailed Survey, June 1994 .......... 4617. Responses to Telephone Interviews, October 1994 ....... 4718. Water Use by Gallon per Ton ........................... 4919. Processor Responses on Water Use per Tonnage .......... 5120. Computed water rates for three plants in 19 cities .... 5321. Loading Charges for Two Northwest Cities .............. 5622. Sewer Costs in Nine Northwest Cities Based on a
Monthly Base With Additional Unit Cost .............. 5623. Methods of Disposal of Solid Byproducts for 20 Northwest
Processors .......................................... 59
AppendicesA. Byproducts Generated by Seafood Processors 1970-94....74B. Seafood Processing Plants in Oregon, Southern
Washington and Northern California .................. 76C. Survey of Seafood Processors in the Pacific Northwest.77D. Detail of Water & Sewer Rates of 19 Northwest Cities..79E. Acronyms .............................................. 82
ii
39
Seafood Processing Byproducts in The Pacific Northwest
4
1. INTRODUCTION
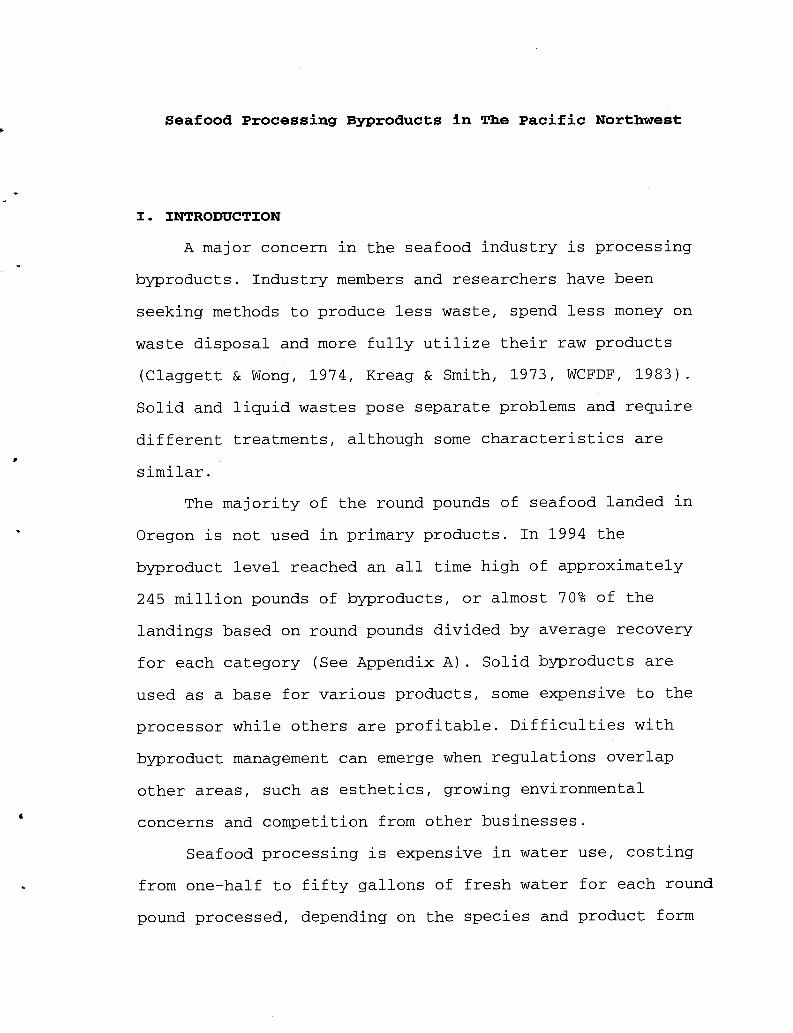
A major concern in the seafood industry is processing
byproducts. Industry members and researchers have been
seeking methods to produce less waste, spend less money on
waste disposal and more fully utilize their raw products
(Claggett & Wong, 1974, Kreag & Smith, 1973, WCFDF, 1983).
Solid and liquid wastes pose separate problems and require
different treatments, although some characteristics are
similar.
The majority of the round pounds of seafood landed in
Oregon is not used in primary products. In 1994 the
byproduct level reached an all time high of approximately
245 million pounds of byproducts, or almost 70% of the
landings based on round pounds divided by average recovery
for each category (See Appendix A). Solid byproducts are
used as a base for various products, some expensive to the
processor while others are profitable. Difficulties with
byproduct management can emerge when regulations overlap
other areas, such as esthetics, growing environmental
concerns and competition from other businesses.
Seafood processing is expensive in water use, costing
from one-half to fifty gallons of fresh water for each round
pound processed, depending on the species and product form
2
(Claggett & Wong, 1974) and using up to 3,600,000 gallons
daily (Sheldon, 1991). A problem in Oregon is the
availability of water, which is increasingly scarce and
expensive. In 1992 the Pacific Northwest faced a major
drought, which had been building for seven drier-than-normal
winters, the last four of which were related to El Nino
(Tomlinson, 1994). Coastal areas have no reserve snow pack
and are especially impacted by dry winters. Rainfall in 1993
was well above average, allowing carry over in reservoirs
for 1994, which was again drier-than-normal. However,
recovery from a drought takes several years, even if
rainfall and snowpack are normal in subsequent years
(Norris, 1994). The majority of Northwest fishing occurs in
summer, which is the season of lowest rainfall, encouraging
seafood processors to pursue methods of cutting costs by
reducing water use.
An additional problem processors face is the
increasingly complex responsibilities for the disposal of
wastewater. There are state and federal regulations
regarding amount and type of discharge, prescribed
monitoring methods, and required amounts of tidal action in
the area receiving the wastewater. The resulting effluent
can contain from two to thirty pounds of organic solids for
each thousand pounds of raw fish (Claggett & Wong, 1974).
The seafood industry uses water in many ways: ice in
the holds of the fishing boats; holding tanks; thawing
3
frozen product; transportation in flumes; washing away
debris; cooking water and steam; cooling water and clean up
procedures. In some processing the cleanup requires more
than 75% of the plant's total water use (Goldhor &
Koppernaes, 1993). Some of this water use is unnecessary;
careful instructions to employees can reduce water use by
25-50% alone (Freeman, 1992).
In order to investigate the extent of these problems,
the Coastal Oregon Marine Experiment Station Seafood
Laboratory initiated a survey of water use, byproduct
recovery avenues and waste disposal methods of seafood
processors. The purpose of this document is to summarize the
findings of this survey, review the fishing industry in
Oregon, list applicable legislation, and make
recommendations to industry.
A. The Fishing Industry In OregonSeafood processing is a dynamic industry with plants
frequently changing management and ownership. There are
currently thirty two seafood related businesses in Oregon,
with another five near the Oregon borders in California and
Washington, Appendix B, ranging from small brokers to plants
with sales of more than twenty million dollars in annual
sales (Radtke, 1992). Most of these plants are situated
along the coast.
According to records provided by the Oregon Department
i
Oregon Commercial Landings 1970-1994
Caper
G ourdls h
El T urxi
S hrirrp
au/® 5drmri
q tO N M V u, t0 r m 0 O N M Y UD LO r !O 0, O N P,r n r r r r n r r n m W m m m m m m m m Ol OJ 6l 0m m m m m m m m s m m m os m m m rn m w m m
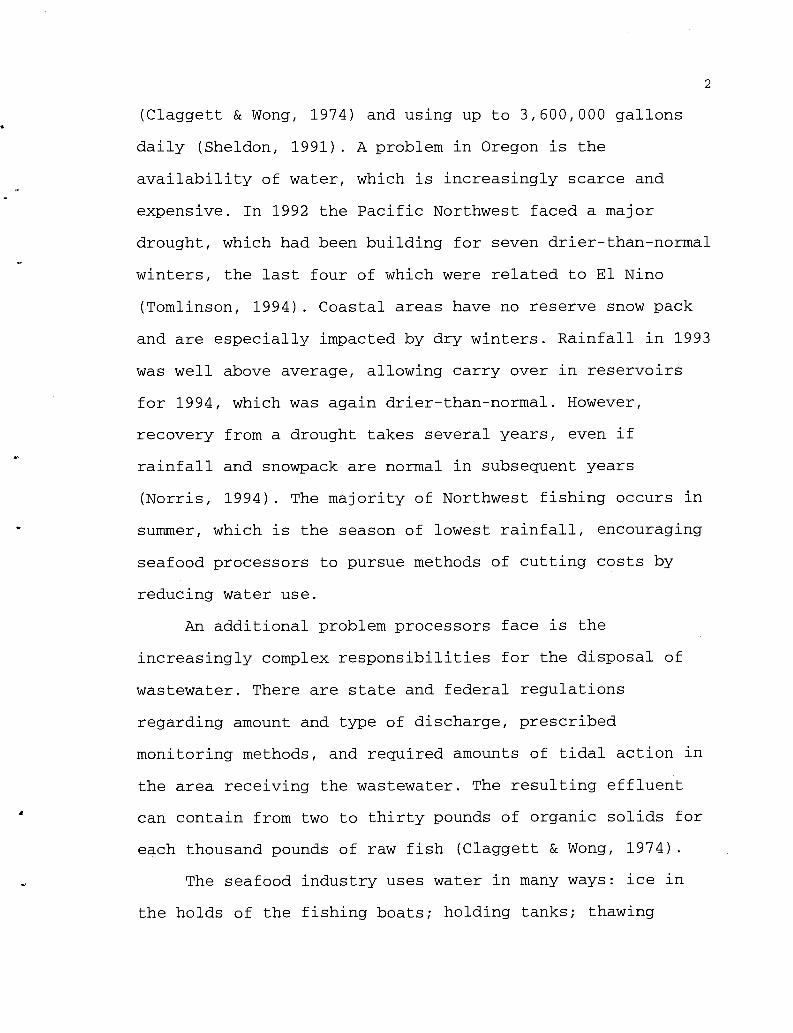
Figure 1 Oregon Commercial Fishery Landings. Source: ODF&W, 1995[a].
OT Fish and Wildlife (ODF&W, 1995[a]) Oregon's most
important seafood products over the past twenty five years
are groundfish, shrimp, crab, salmon and tuna. The
fluctuations of the annual harvest of the major species over
the past 24 years is shown in Fig. 1, which illustrates the
dramatic rise in groundfish landings due to the Pacific
whiting industry.
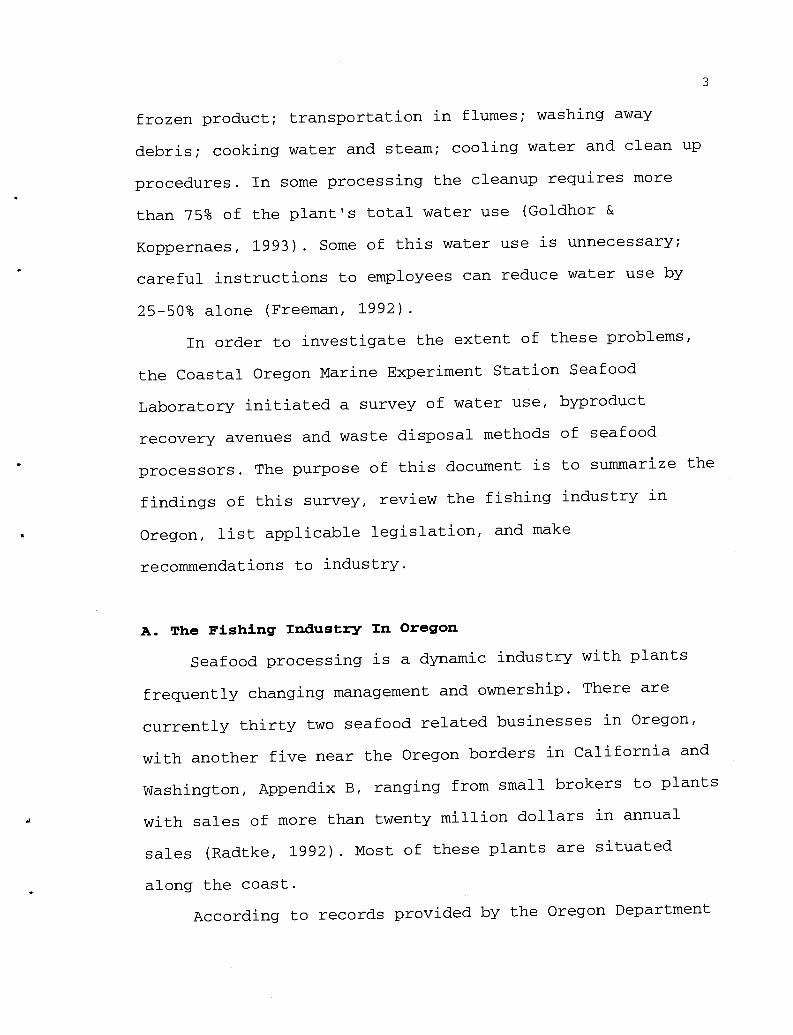
The amount and type of byproduct varies between product
form and species and therefore will change from month to
month as the catch varies. A 1981 compilation of waste
estimates shown in Fig. 2 displays monthly wastes, with an
average of 58% of the catch considered byproducts to the
primary product form, as shown in the darker bottom portion
of the chart (WCFDF, 1983). This high percentage of
4
f
Monthly Waste Ratios for Oregon Commercial Landings - 1981vim mlaloted percentages of via to to totd Imcings
1
25
0
UsWe Portion
ProcessingWaste,
73%
62%
.65%
64%
66% 39%
49%.
49%.
49%
60%
I
2
J P X114 4,. M J. =i ., 17
Figure 2 Monthly Seafood Processing Waste Ratio in 1981. Source: WCFDF, 1983.
byproduct was due to crab and shrimp shells, which were a
much larger portion of the Oregon catch in the early
eighties than in the nineties. As the groundfish fishery
expands, the majority of the byproducts from seafood
processing is changing to groundfish carcasses, and recovery
and disposal methods must change to accommodate the new
composition.
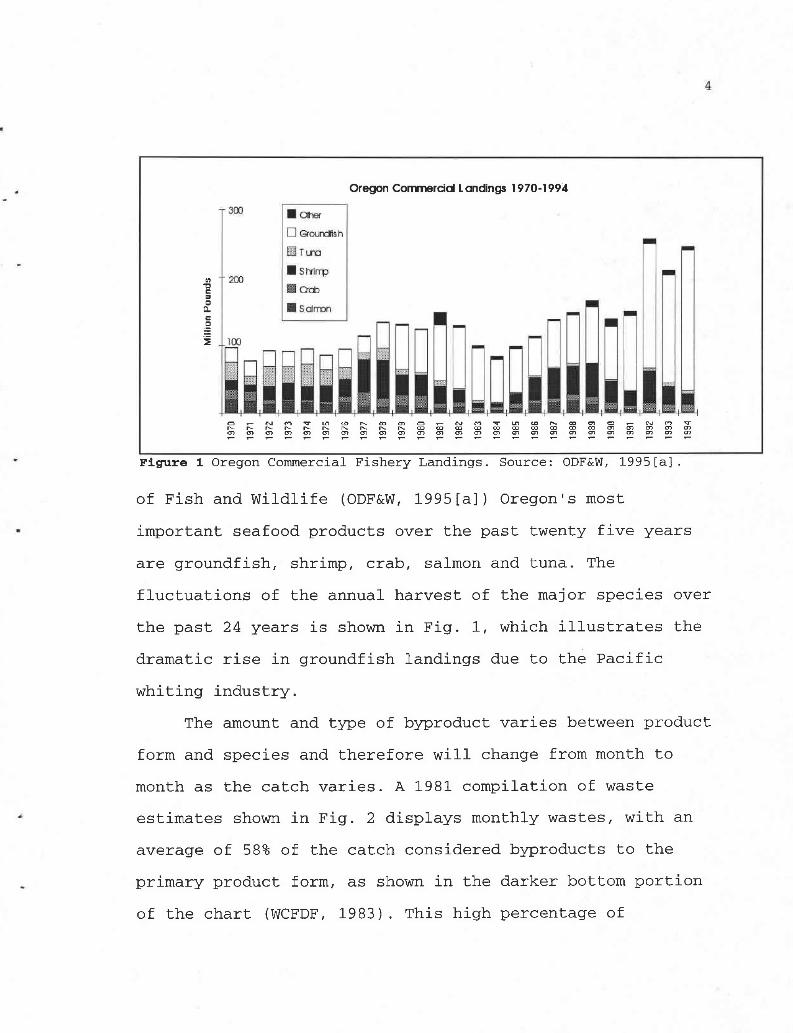
1. Groundfish
Oregon's harvest has continued to grow with the
increasing demand for seafood products, although landings of
many major fisheries are either in a decline or constant
state. Groundfish is an exception to these declines, Fig. 3.
0 !
5
693
0
6
250
200
50
Oregon Comnerad Groundfish Landings 1970-1994
Ro1r
T VdUe
1
:uj
25
020
75 .5
10
-0
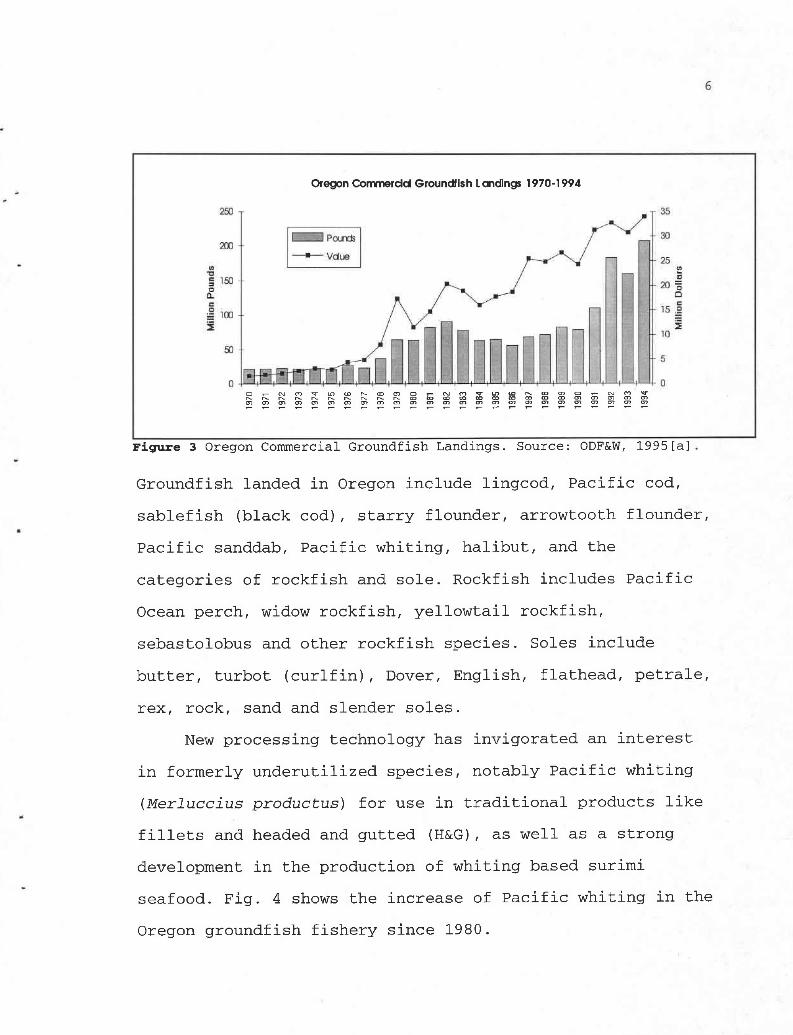
Figure 3 Oregon Commercial Groundfish Landings. Source: ODF&W, 1995[a].
Groundfish landed in Oregon include lingcod, Pacific cod,
sablefish (black cod), starry flounder, arrowtooth flounder,
Pacific sanddab, Pacific whiting, halibut, and the
categories of rockfish and sole. Rockfish includes Pacific
Ocean perch, widow rockfish, yellowtail rockfish,
sebastolobus and other rockfish species. Soles include
butter, turbot (curlfin), Dover, English, flathead, petrale,
rex, rock, sand and slender soles.
New processing technology has invigorated an interest
in formerly underutilized species, notably Pacific whiting
(Merluccius productus) for use in traditional products like
fillets and headed and gutted (H&G), as well as a strong
development in the production of whiting based surimi
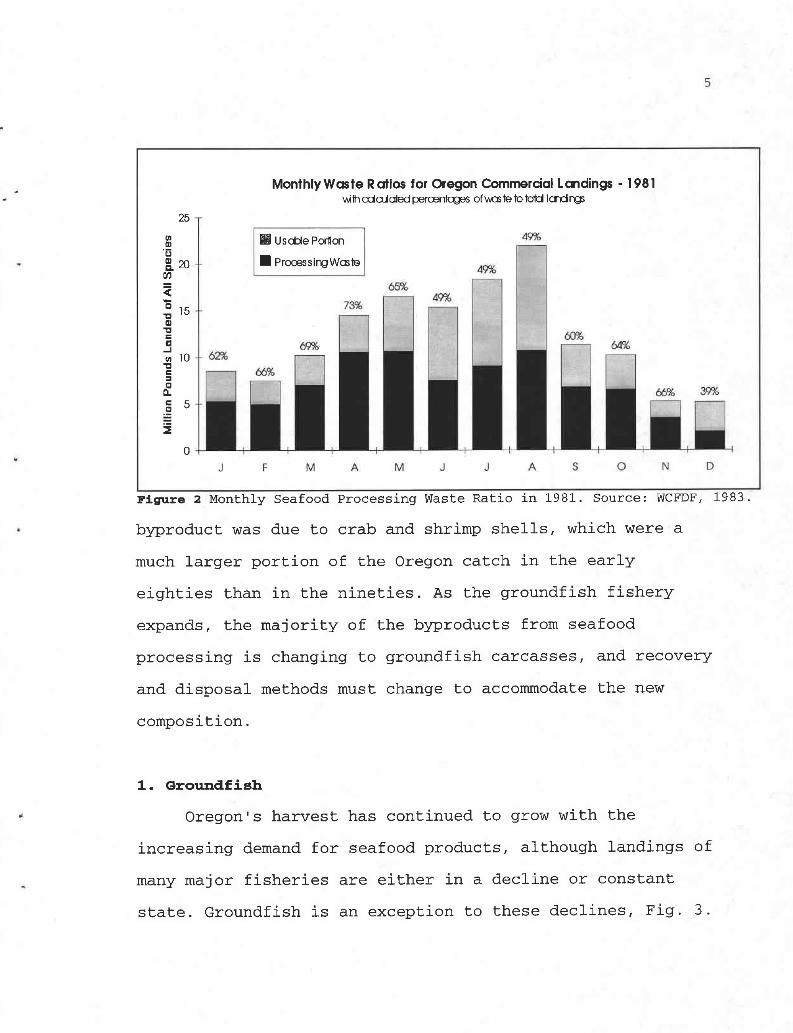
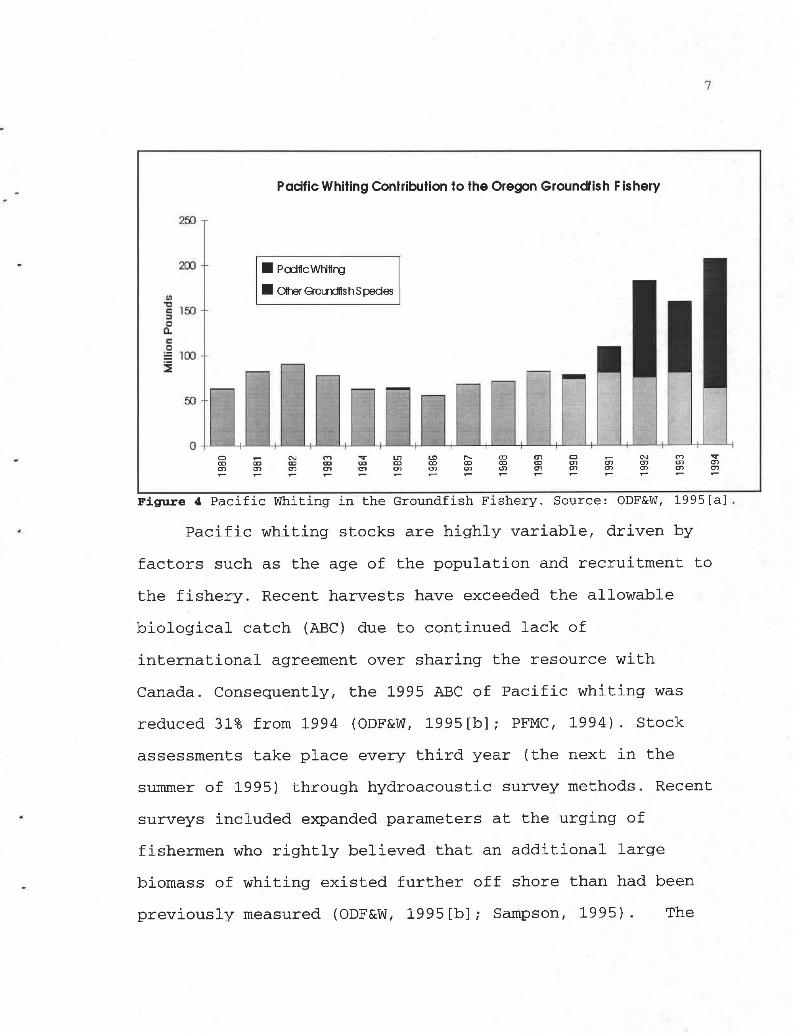
seafood. Fig. 4 shows the increase of Pacific whiting in the
Oregon groundfish fishery since 1980.
-
°A'
Pacific Whiting Contribution to the Oregon Groundfish Fishery
I
42
250 f
200
CC
CC
i50 T
PodflcWhiiing
N OlherGroridrishSpedes
O N M 4 Cmm 00 00 00 a0 mm m m 0-1 rn mco r.m 00m rn
ma)
01
m
11
mma] a1 alm rn m
f
Figure 4 Pacific Whiting in the Groundfish Fishery. Source: ODF&W, 1995[a]:
Pacific whiting stocks are highly variable, driven by
factors such as the age of the population and recruitment to
the fishery. Recent harvests have exceeded the allowable
biological catch (ABC) due to continued lack of
international agreement over sharing the resource with
Canada. Consequently, the 1995 ABC of Pacific whiting was
reduced 31% from 1994 (ODF&W, 1995[b]; PFMC, 1994). Stock
assessments take place every third year (the next in the
summer of 1995) through hydroacoustic survey methods. Recent
surveys included expanded parameters at the urging of
fishermen who rightly believed that an additional large
biomass of whiting existed further off shore than had been
previously measured (ODF&W, 1995[b]; Sampson, 1995). The
7
0 !.f

8
initial step of surimi processing is removal of the head,
guts and bones then mincing the remaining flesh, followed by
repeated washings then dehydration (Table 1), which results
in a loss of 30-40% of the protein into the wash water
(Pedersen, 1990), wasting usable proteins and causing
problems in the effluent. When large amounts of organic
matter is flushed into the receiving water it will take up
the oxygen normally used by the local fauna. The amount of
oxygen necessary for decomposition is biological oxygen
demand (BOD) and is one of the standards used to calculate
water quality levels.
Recovering proteins has been the target of research
using filtration methods, precipitating proteins by shifting
the acidity of the water, centrifugation, and by using by an
ion exchange binder. The goals of these studies are to
lessen the impact of the wastewater on the environment,
reduce the required amount of water, and use more of the
available proteins (Lin et al., 1995).
Approximately 70% of groundfish landings marketed as
fillets and up to 85% of those processed into surimi is
solid byproducts that can be reduced to fish meal (Crapo et
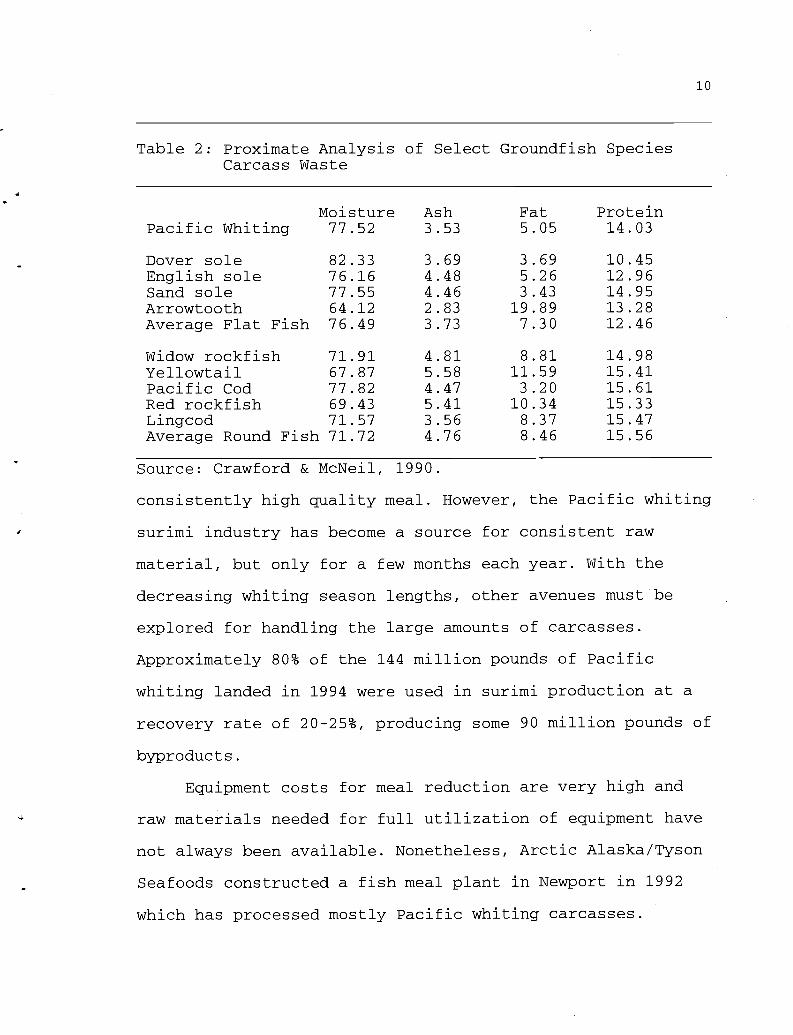
al., 1988). However, the low protein and higher ash content
(Table 2) makes byproduct meal a separate product than
commercial whole fish meals (Crawford & McNeil, 1990). The
variable composition of the groundfish byproducts has made
it difficult to maintain processing guidelines that yield a
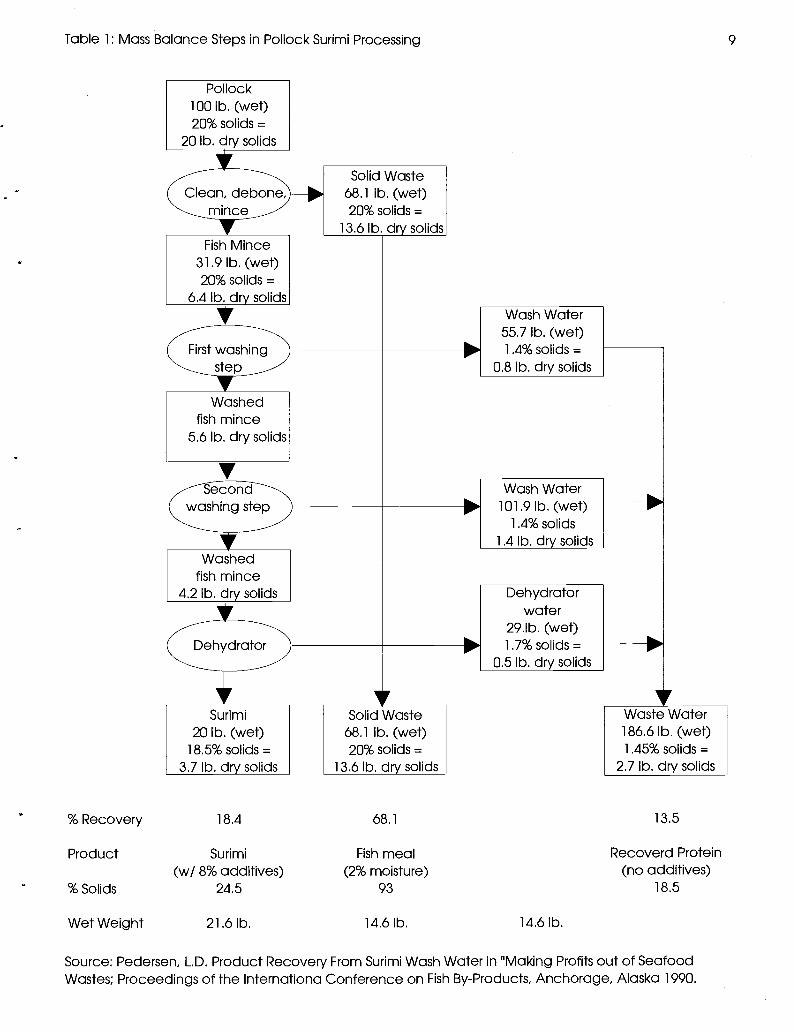
Table 1: Mass Balance Steps in Pollock Surimi Processing 9
Pollock100 lb. (wet)20% solids =
20 lb. dry solids
Solid Waste68.1 lb. (wet)20% solids =
13.6 lb. dry solidsFish Mince
31.9 lb. (wet)20% solids =
6.4 lb. dry solids
First washingstep
Washedfish mince
5.6 lb. dry solids
washing stepSecond
Washedfish mince
4.2 lb. dry solids
Dehydrator
Dehydratorwater
29.Ib. (wet)1.7% solids =
0.5 lb. dry solids
Surimi20 lb. (wet)
18.5% solids =3.7 lb. dry solids
Solid Waste68.1 lb. (wet)20% solids =
13.6 lb. dry solids
Waste Water186.6 lb. (wet)1.45% solids =
2.7 lb. dry solids
% Recovery 18.4 68.1 13.5
Product Surimi Fish meal Recoverd Protein(w/ 8% additives) (2% moisture) (no additives)
% Solids 24.5 93 18.5
Wet Weight 21.6 Ib. 14.6 lb. 14.6 Ib.
Wash Water55.7 lb. (wet)1.4% solids =
0.8 lb. dry solids
Wash Water101.9 lb. (wet)
1.4% solids1.4 lb. dry solids
Source: Pedersen, L.D. Product Recovery From Surimi Wash Water in "Making Profits out of SeafoodWastes; Proceedings of the Internationa Conference on Fish By-Products, Anchorage, Alaska 1990.
10
Table 2: Proximate Analysis of Select Groundfish SpeciesCarcass Waste
Moisture Ash Fat ProteinPacific Whiting 77.52 3.53 5.05 14.03
Dover sole 82.33 3.69 3.69 10.45English sole 76.16 4.48 5.26 12.96Sand sole 77.55 4.46 3.43 14.95Arrowtooth 64.12 2.83 19.89 13.28Average Flat Fish 76.49 3.73 7.30 12.46
Widow rockfish 71.91 4.81 8.81 14.98Yellowtail 67.87 5.58 11.59 15.41Pacific Cod 77.82 4.47 3.20 15.61Red rockfish 69.43 5.41 10.34 15.33Lingcod 71.57 3.56 8.37 15.47Average Round Fish 71.72 4.76 8.46 15.56
Source: Crawford & McNeil, 1990.
consistently high quality meal. However, the Pacific whiting
surimi industry has become a source for consistent raw
material, but only for a few months each year. With the
decreasing whiting season lengths, other avenues must be
explored for handling the large amounts of carcasses.
Approximately 80% of the 144 million pounds of Pacific
whiting landed in 1994 were used in surimi production at a
recovery rate of 20-25%, producing some 90 million pounds of
byproducts.
Equipment costs for meal reduction are very high and
raw materials needed for full utilization of equipment have
not always been available. Nonetheless, Arctic Alaska/Tyson
Seafoods constructed a fish meal plant in Newport in 1992
which has processed mostly Pacific whiting carcasses.
11
Oregon Commercial Shrimp Landings 1970-1994Indudes or y pl r1< s ilrrp.
O N M 4 U) LO r- OO O) O N M V IC) (0 00 N M 4M1 n 1- n r- n f- N- r- CO m CO CD 07 0)
O') O'1 0) 6] 61 0) 61 O'1 O] 0) Ot 61 0)00
Ul 6) 6] 0)
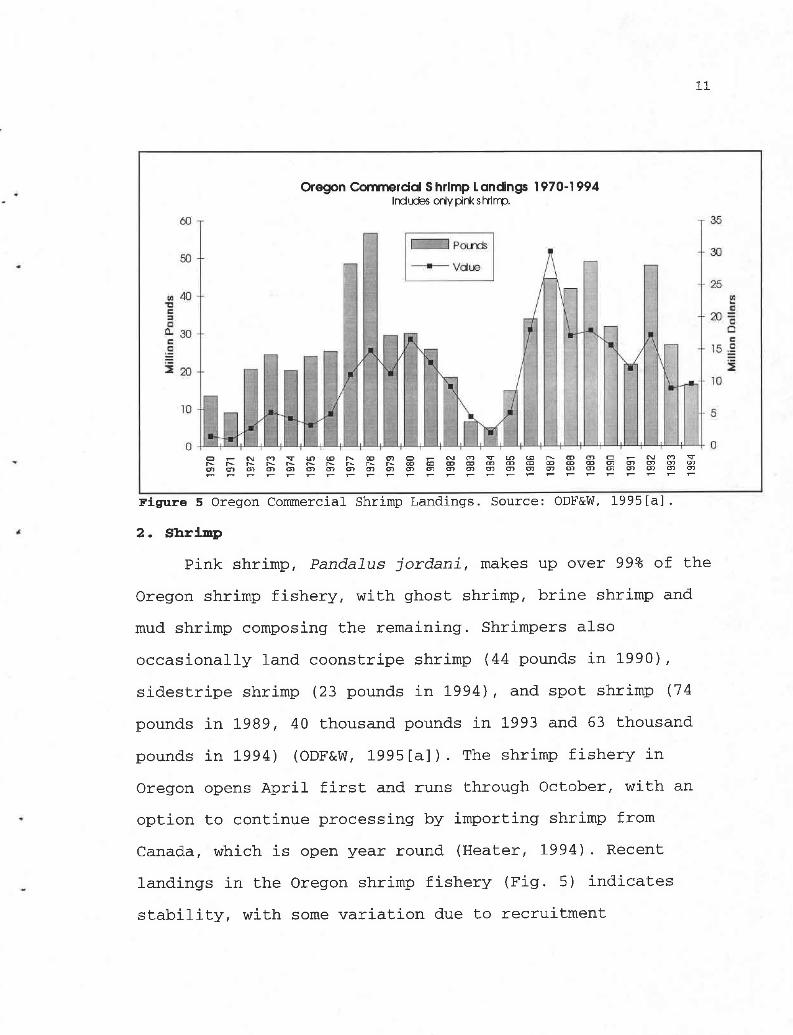
Figure 5 Oregon Commercial Shrimp Landings. Source: ODF&W, 1995[a].
2. Shrimp
Pink shrimp, Pandalus jordani, makes up over 99% of the
Oregon shrimp fishery, with ghost shrimp, brine shrimp and
mud shrimp composing the remaining. Shrimpers also
occasionally land coonstripe shrimp (44 pounds in 1990),
sidestripe shrimp (23 pounds in 1994), and spot shrimp (74
pounds in 1989, 40 thousand pounds in 1993 and 63 thousand
pounds in 1994) (ODF&W, 1995[a]). The shrimp fishery in
Oregon opens April first and runs through October, with an
option to continue processing by importing shrimp from
Canada, which is open year round (Heater, 1994). Recent
landings in the Oregon shrimp fishery (Fig. 5) indicates
stability, with some variation due to recruitment
Pounds
10
-I.
5
- .- r .-- r
12
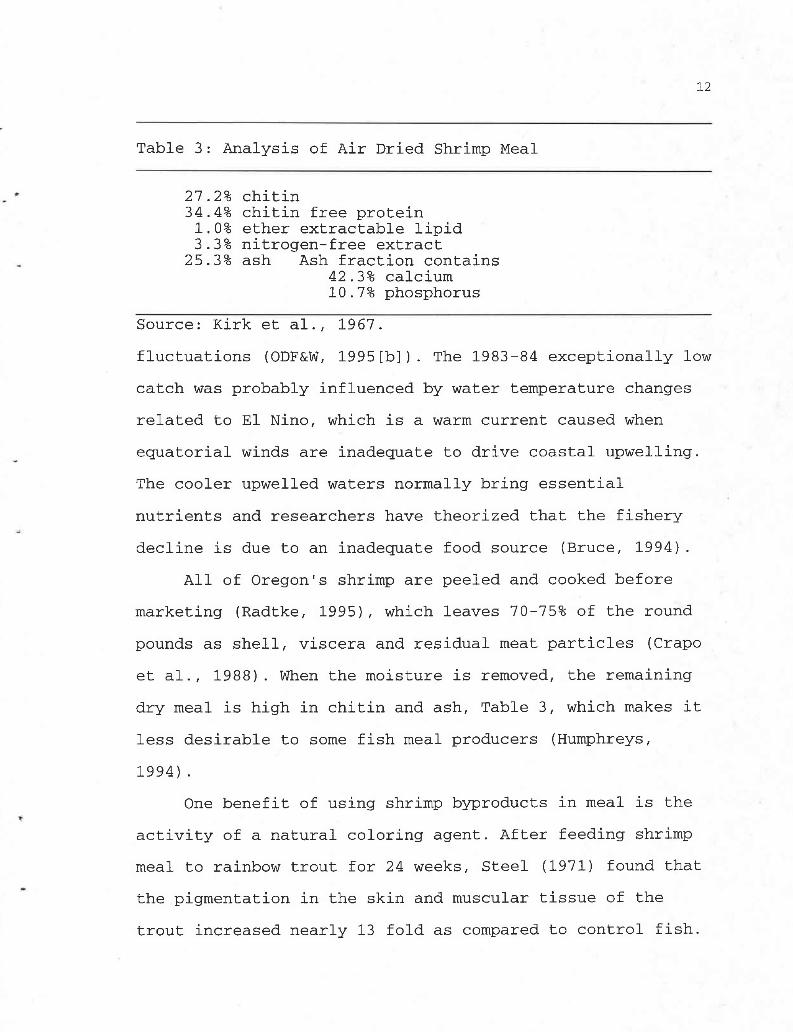
Table 3: Analysis of Air Dried Shrimp Meal
27.2% chitin34.4% chitin free protein1.0% ether extractable lipid3.3% nitrogen-free extract
25.3% ash Ash fraction contains42.3% calcium10.7% phosphorus
Source: Kirk et al., 1967.
fluctuations (ODF&W, 1995[b]). The 1983-84 exceptionally low
catch was probably influenced by water temperature changes
related to El Nino, which is a warm current caused when
equatorial winds are inadequate to drive coastal upwelling.
The cooler upwelled waters normally bring essential
nutrients and researchers have theorized that the fishery
decline is due to an inadequate food source (Bruce, 1994).
All of Oregon's shrimp are peeled and cooked before
marketing (Radtke, 1995), which leaves 70-75% of the round
pounds as shell, viscera and residual meat particles (Crapo
et al., 1988). When the moisture is removed, the remaining
dry meal is high in chitin and ash, Table 3, which makes it
less desirable to some fish meal producers (Humphreys,
1994).
One benefit of using shrimp byproducts in meal is the
activity of a natural coloring agent. After feeding shrimp
meal to rainbow trout for 24 weeks, Steel (1971) found that
the pigmentation in the skin and muscular tissue of the
trout increased nearly 13 fold as compared to control fish.
13
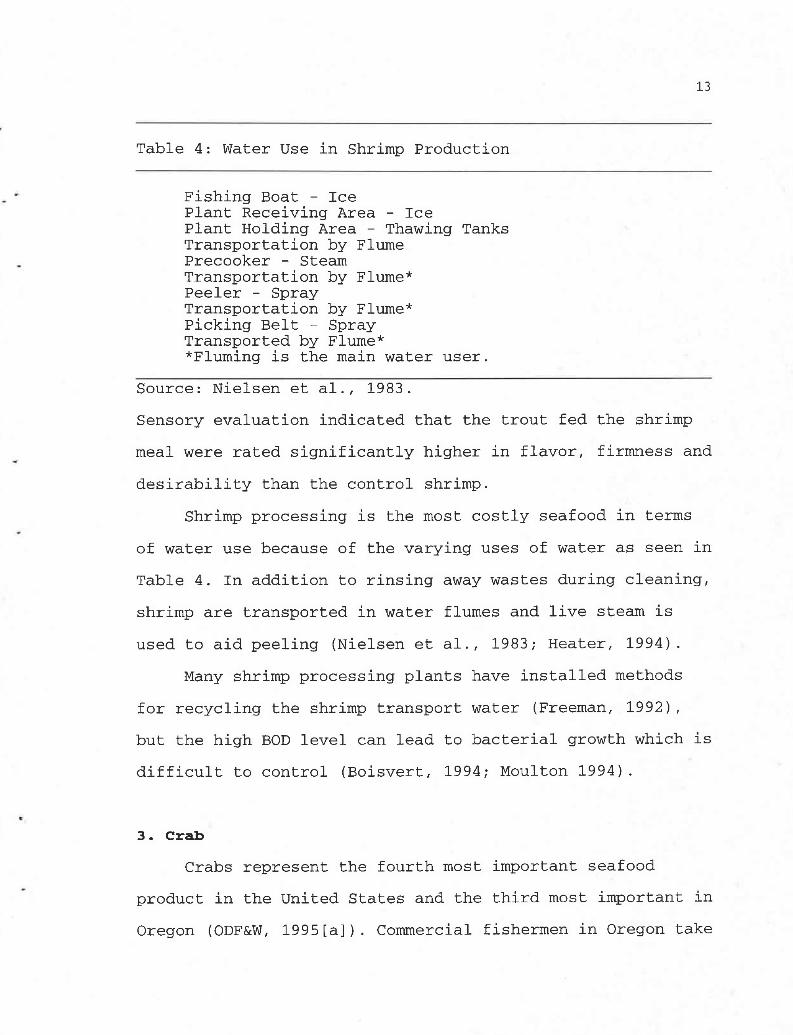
Table 4: Water Use in Shrimp Production
Fishing Boat - IcePlant Receiving Area - IcePlant Holding Area - Thawing TanksTransportation by FlumePrecooker - SteamTransportation by Flume*Peeler - SprayTransportation by Flume*Picking Belt - SprayTransported by Flume**Fluming is the main water user.
Source: Nielsen et al., 1983.
Sensory evaluation indicated that the trout fed the shrimp
meal were rated significantly higher in flavor, firmness and
desirability than the control shrimp.
Shrimp processing is the most costly seafood in terms
of water use because of the varying uses of water as seen in
Table 4. In addition to rinsing away wastes during cleaning,
shrimp are transported in water flumes and live steam is
used to aid peeling (Nielsen et al., 1983; Heater, 1994).
Many shrimp processing plants have installed methods
for recycling the shrimp transport water (Freeman, 1992),
but the high BOD level can lead to bacterial growth which is
difficult to control (Boisvert, 1994; Moulton 1994).
3. Crab
Crabs represent the fourth most important seafood
product in the United States and the third most important in
Oregon (ODF&W, 1995[a]). Commercial fishermen in Oregon take
Y
Y
I
14
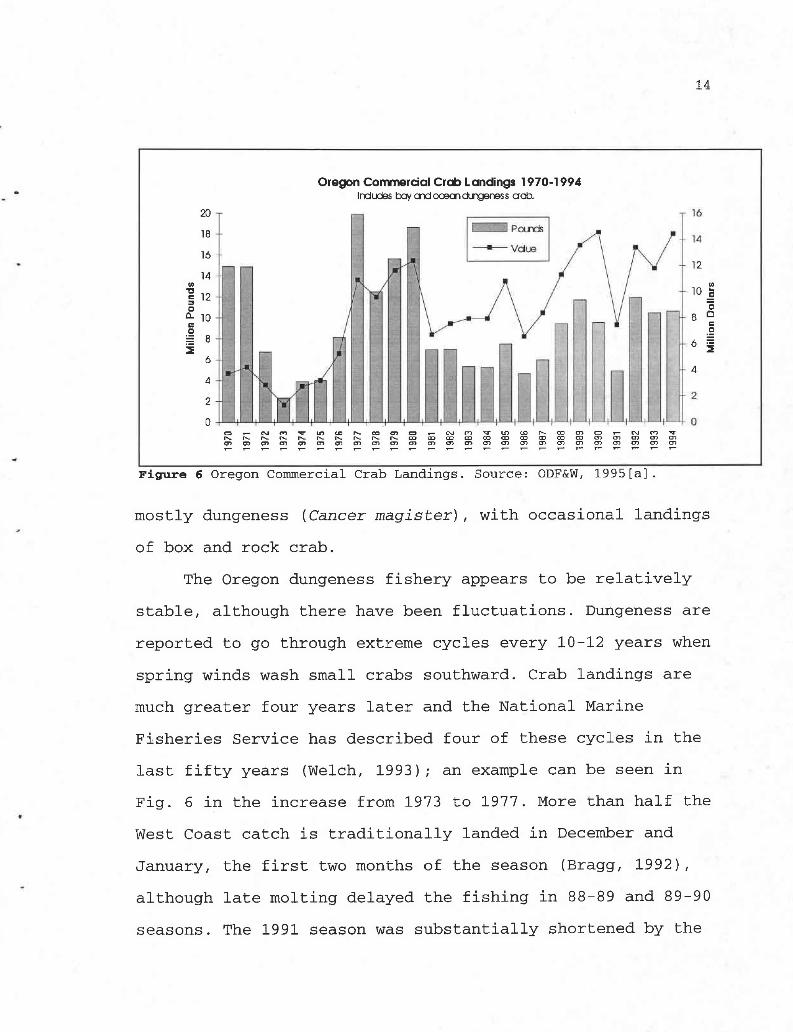
Oregon Commercial Crab Landings 1970-1994I nd udes boy and oOBal ckirgenes s aab.
I
14 4
6}I
2
PoLinds
Vdue
I. M
41!4 IiII 111 111 Id!I
Iii Y!.[I
10AIIO ni C9 4 Lfl CO f CO T O r N f'1 V Ili co M1 m 61f- M1 f- n f- n f- f+ f- M1 OJ OJ fD OJ W W O] O] W RJm rn m m fn m m m m m or m m m m m fn m s m
II
r
{ 'I "ITO m N C7m m m
Figure 6 Oregon Commercial Crab Landings. Source: ODF&W, 1995[a].
16°
4
2
mostly dungeness (Cancer magister), with occasional landings
of box and rock crab.
The Oregon dungeness fishery appears to be relatively
stable, although there have been fluctuations. Dungeness are
reported to go through extreme cycles every 10-12 years when
spring winds wash small crabs southward. Crab landings are
much greater four years later and the National Marine
Fisheries Service has described four of these cycles in the
last fifty years (Welch, 1993); an example can be seen in
Fig. 6 in the increase from 1973 to 1977. More than half the
West Coast catch is traditionally landed in December and
January, the first two months of the season (Bragg, 1992),
although late molting delayed the fishing in 88-89 and 89-90
seasons. The 1991 season was substantially shortened by the
20
18
16
12
10
4
0
o-,
12
15
discovery of the presence of domoic acid, a naturally
occurring marine toxin, in the viscera of dungeness crabs
(Welch, 1993).
A new problem was recently reported, in the form of a
parasite which kills crab before they reach legal size
(Childers, 1994; Gentle, 1993; Olson, 1994). This parasite
was found in levels well below one per cent in the open
ocean, where most commercial crabbing occurs. However,
samples in estuaries ranged as high as 42% infected rate in
Tillamook Bay with lower levels in other Oregon estuaries.
Dungeness are traditionally sold as whole cooks with
occasional picked meat sales. When peeled for the meat,
approximately 76% of the dungeness crab remains (Crapo et
al., 1988), and it's relatively high moisture content
(average 60%) presents a challenge to the byproduct
processing. Once the moisture is removed, however, the
remainder is 32% protein (Jaswal, 1990). In the past, the
major outlet was the production of crab meal; however the
economic feasibility of this method is questionable under
current energy prices (Abazinge et al., 1993). Like shrimp
shells, the chitin present in crab shells prevents them from
being the preferred raw material for fish meal (Humphreys,
1994) but crab shells can be successfully composted
(Hilderbrand, 1995) or used in chitosan production (Sargent,
1994).
16
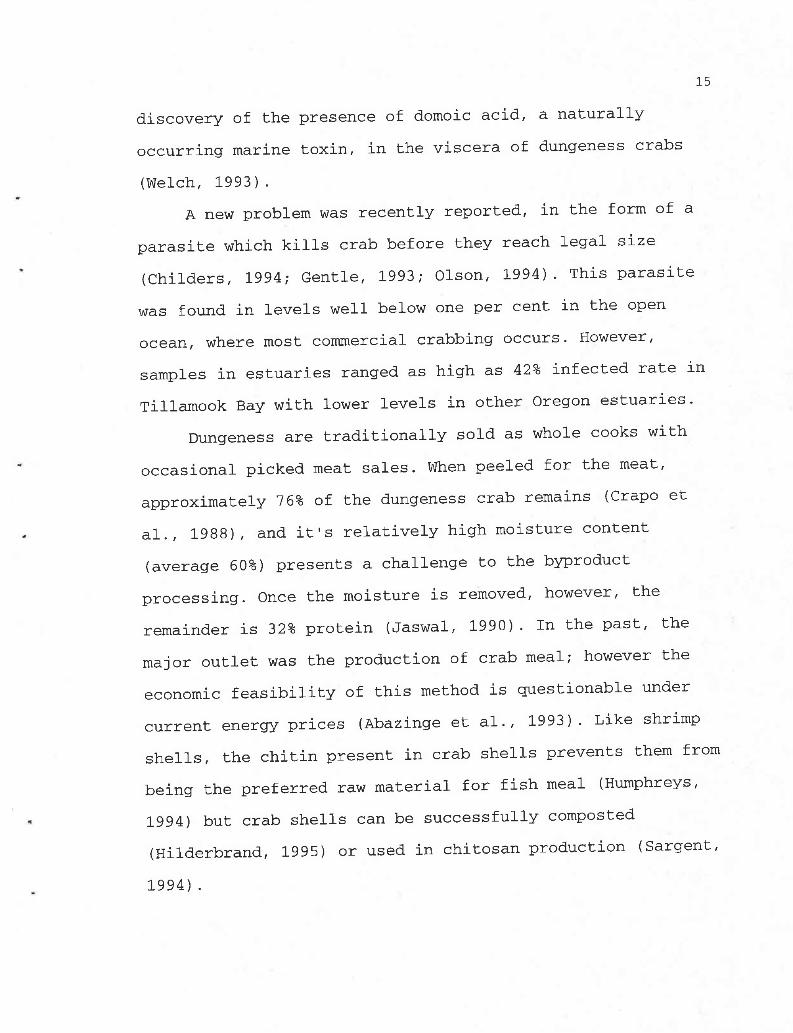
Oregon Commercial Tuna Landings 1970-1994Ir d odes dbacore, yelloWv1 n cr d s kipjock.
O N P] 4 lit lD R CO M O N M 4 t9 R 1 ClR R IM n R R R R R R OO O] OD CD O] CO 00 W CO CO alrn m m rn rn m m o-, 0) m m m m T T rn m
Figure 7 Oregon Commercial Tuna Landings. Source: ODF&W, 1995[a).
T 14
4. Tuna
After large catches throughout previous decades, tuna
landings in the 1980s are smaller but steady, as shown in
Fig. 7. Abundance of tuna in Oregon waters has been linked
to oceanographic conditions, with warmer off shore waters
attracting the highly migratory fish (ODF&W, 1995[b]).
Although the ODF&W records include albacore (Thunnus
alalunga), yellowfin (Thunnus albacares), and skipjack
(Euthynnus pelamis), only albacore has been commercially
landed in Oregon since 1988 (ODF&W, 1995[a]).
Recovery of tuna ranges from 35% for a skinless fillet
to 90% for a dressed/head-on fish (Crapo et al., 1988). The
muscle tissue of albacore tuna was divided by Perez & Pozo
l2;
17
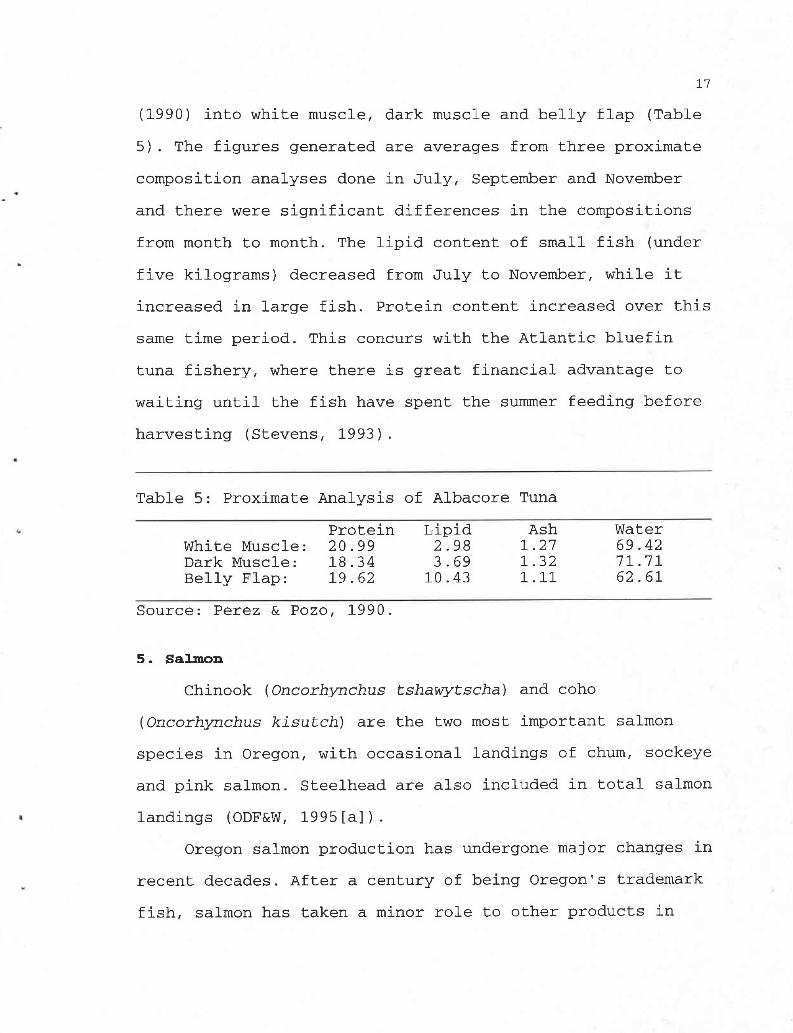
(1990) into white muscle, dark muscle and belly flap (Table
5). The figures generated are averages from three proximate
composition analyses done in July, September and November
and there were significant differences in the compositions
from month to month. The lipid content of small fish (under
five kilograms) decreased from July to November, while it
increased in large fish. Protein content increased over this
same time period. This concurs with the Atlantic bluefin
tuna fishery, where there is great financial advantage to
waiting until the fish have spent the summer feeding before
harvesting (Stevens, 1993).
Table 5: Proximate Analysis of Albacore Tuna
Protein Lipid Ash WaterWhite Muscle: 20.99 2.98 1.27 69.42Dark Muscle: 18.34 3.69 1.32 71.71Belly Flap: 19.62 10.43 1.11 62.61
Source: Perez & Pozo, 1990.
5. Salmon
Chinook (Oncorhynchus tshawytscha) and coho
(Oncorhynchus kisutch) are the two most important salmon
species in Oregon, with occasional landings of chum, sockeye
and pink salmon. Steelhead are also included in total salmon
landings (ODF&W, 1995[a]).
Oregon salmon production has undergone major changes in
recent decades. After a century of being Oregon's trademark
fish, salmon has taken a minor role to other products in
18
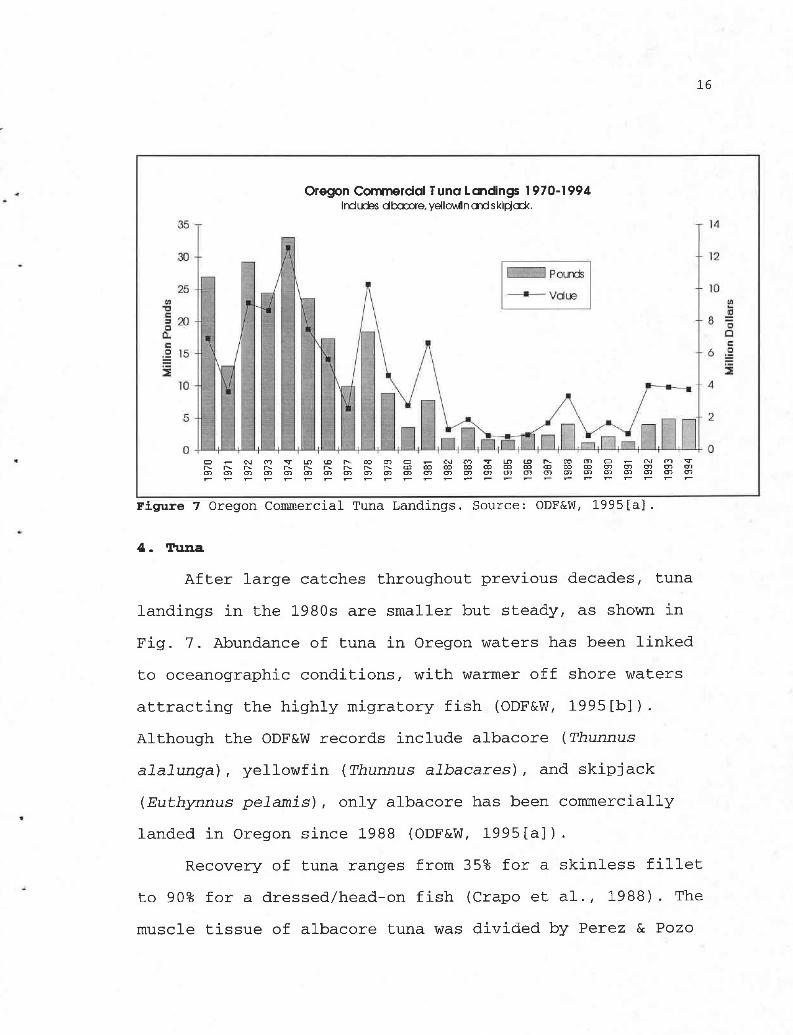
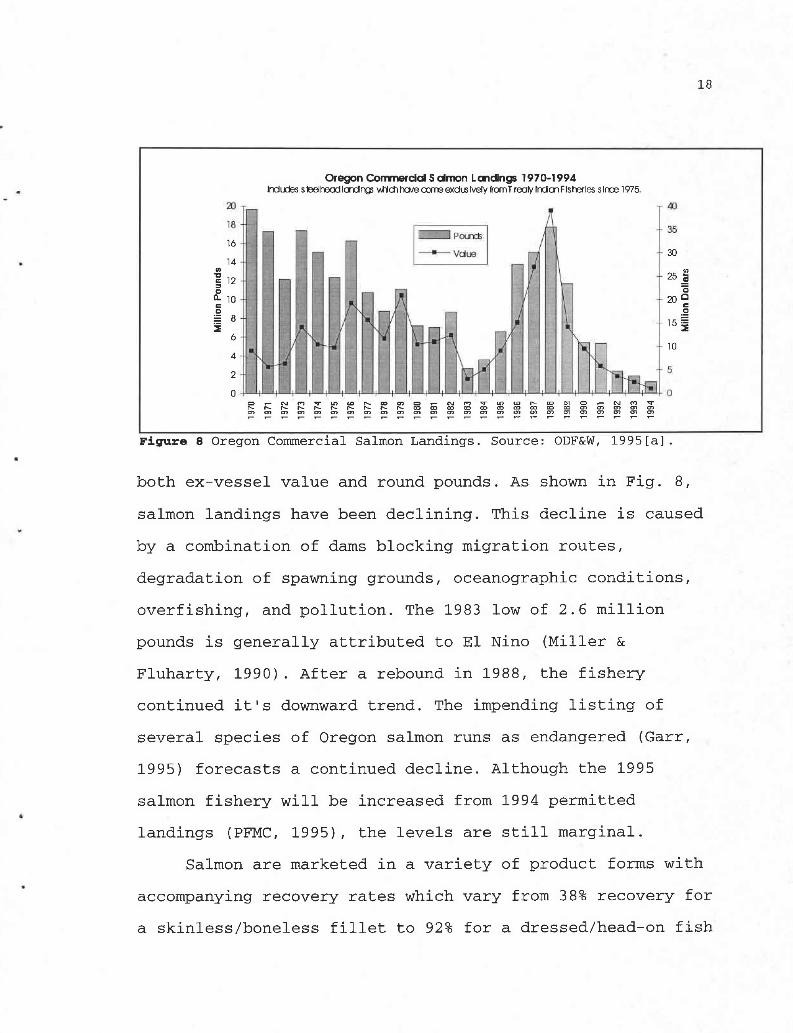
Oregon Commerad S dmon Lcmdings 1970-1994Indus sieelhead Iardrgs ' llidl bare corm exdla Ively from T realy Irdai Flsherles shoe 1975.
8
16
14
12
10
8
6
4
2
O N M V N CO A 0 O'1 O N f"J V CD CO A 00 O'1 O r m l'] VA ! A A A A A A A A O] 0 0 CO - 03 0 0] W 61 m fT 61- - - - - - - - - - - - - - - - - - - - - - - - -Figure 8 Oregon Commercial Salmon Landings. Source: ODF&W, 1995[a].
both ex-vessel value and round pounds. As shown in Fig. 8,
salmon landings have been declining. This decline is caused
by a combination of dams blocking migration routes,
degradation of spawning grounds, oceanographic conditions,
overfishing, and pollution. The 1983 low of 2.6 million
pounds is generally attributed to El Nino (Miller &
Fluharty, 1990). After a rebound in 1988, the fishery
continued its downward trend. The impending listing of
several species of Oregon salmon runs as endangered (Garr,
1995) forecasts a continued decline. Although the 1995
salmon fishery will be increased from 1994 permitted
landings (PFMC, 1995), the levels are still marginal.
Salmon are marketed in a variety of product forms with
accompanying recovery rates which vary from 38% recovery for
a skinless/boneless fillet to 92% for a dressed/head-on fish
I
I
I
20 40
30
25
10
0
19
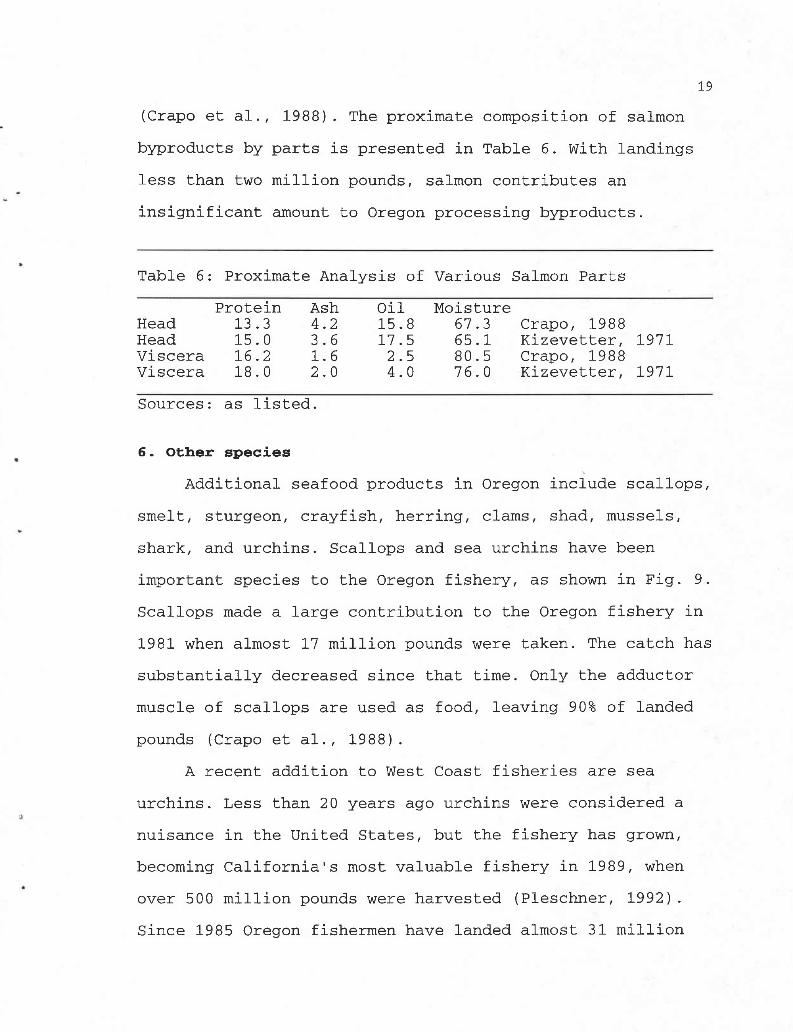
(Crapo et al., 1988). The proximate composition of salmon
byproducts by parts is presented in Table 6. With landings
less than two million pounds, salmon contributes an
insignificant amount to Oregon processing byproducts.
Table 6: Proximate Analysis of Various Salmon Parts
Protein Ash Oil MoistureHead 13.3 4.2 15.8 67.3 Crapo, 1988Head 15.0 3.6 17.5 65.1 Kizevetter, 1971Viscera 16.2 1.6 2.5 80.5 Crapo, 1988Viscera 18.0 2.0 4.0 76.0 Kizevetter, 1971
Sources: as listed.
6. Other species
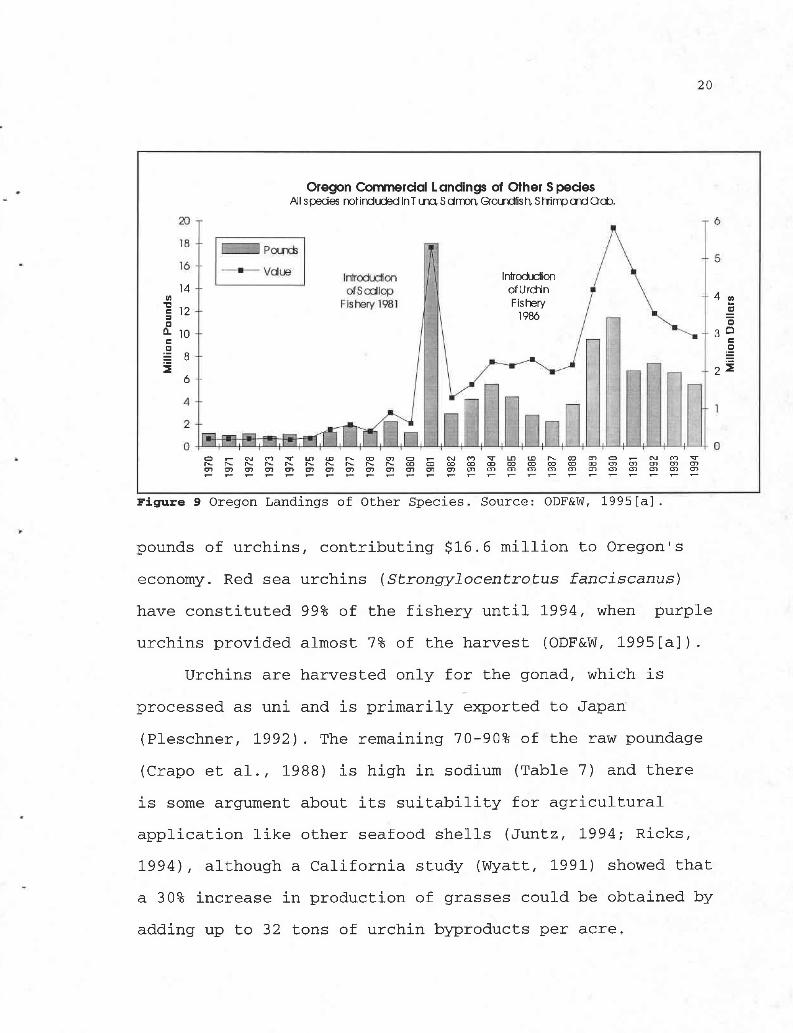
Additional seafood products in Oregon include scallops,
smelt, sturgeon, crayfish, herring, clams, shad, mussels,
shark, and urchins. Scallops and sea urchins have been
important species to the Oregon fishery, as shown in Fig. 9.
Scallops made a large contribution to the Oregon fishery in
1981 when almost 17 million pounds were taken. The catch has
substantially decreased since that time. Only the adductor
muscle of scallops are used as food, leaving 90% of landed
pounds (Crapo et al., 1988).
A recent addition to West Coast fisheries are sea
urchins. Less than 20 years ago urchins were considered a
nuisance in the United States, but the fishery has grown,
becoming California's most valuable fishery in 1989, when
over 500 million pounds were harvested (Pleschner, 1992).
Since 1985 Oregon fishermen have landed almost 31 million
i
Y-
20
Oregon Commercial Landings of Other S peciesAl s pedes not inducted In T via, S dmon, Qorndfis Iti S Crimp and Crcm.
I
6
Pourx
--F Vdug InhodudloiofSodlop
Fishery 198:1
4 I
O N Ci 4 u ID 1- OD 6) O t M 4 In lO N- CC 0, O .- N M Q1- N- N- A R n C- 1- N- N- W CO W CO 0J OJ O] OP W O] O5 6] U] 6l 6)O'1 Q1 61 CO 61 2 CO CO CO 61 O] 6J 0) 67 6l 6] 62 CIl 6] O'1 01 al CO 6l 6lr r r r r r r r r r r r .- r r r r r r r r r r r r
Figure 9 Oregon Landings of Other Species. Source: ODF&W, 19D5[a].
pounds of urchins, contributing $16.6 million to Oregon's
economy. Red sea urchins (Strongylocentrotus fanciscanus)
have constituted 99% of the fishery until 1994, when purple
urchins provided almost 7% of the harvest (ODF&W, 1995[a]).
Urchins are harvested only for the gonad, which is
processed as uni and is primarily exported to Japan
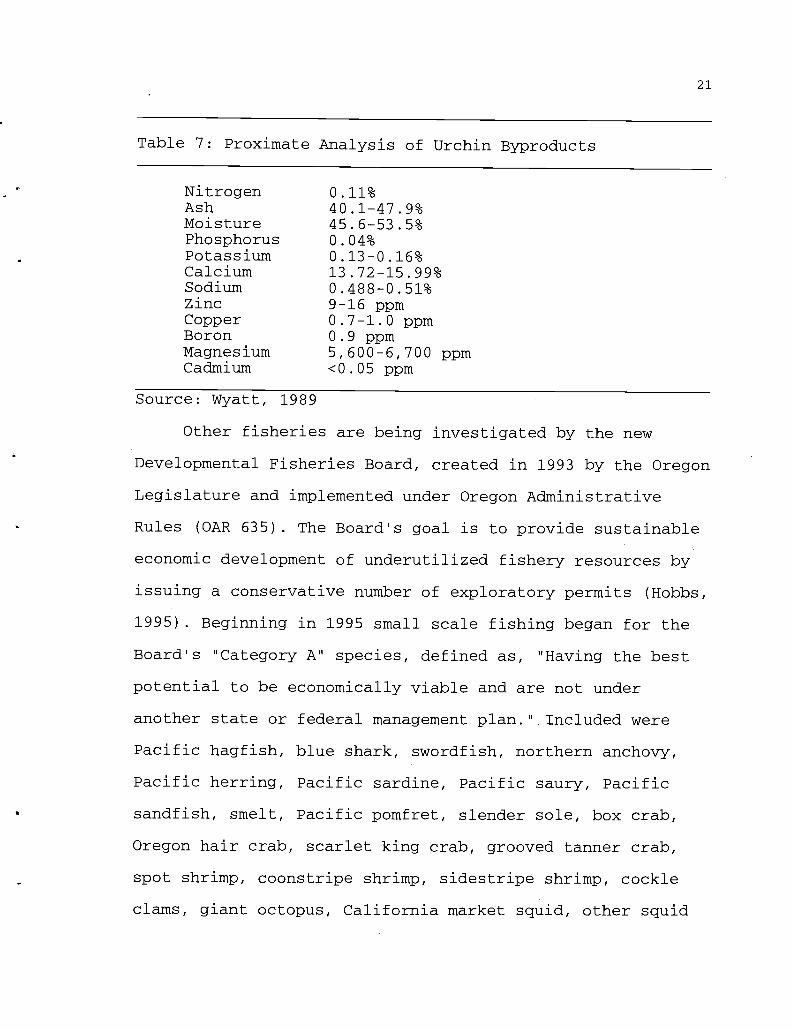
(Pleschner, 1992). The remaining 70-90% of the raw poundage
(Crapo et al., 1988) is high in sodium (Table 7) and there
is some argument about its suitability for agricultural
application like other seafood shells (Juntz, 1994; Ricks,
1994), although a California study (Wyatt, 1991) showed that
a 30% increase in production of grasses could be obtained by
adding up to 32 tons of urchin byproducts per acre,
Introductionof U rct nFishery1986
H- 1
0
6
21
Table 7: Proximate Analysis of Urchin Byproducts
Nitrogen 0.11%Ash 40.1-47.9%Moisture 45.6-53.5%Phosphorus 0.04%Potassium 0.13-0.16%Calcium 13.72-15.99%Sodium 0.488-0.51%Zinc 9-16 ppmCopper 0.7-1.0 ppmBoron 0.9 ppmMagnesium 5,600-6,700 ppmCadmium <0.05 ppm
Source: Wyatt, 1989
Other fisheries are being investigated by the new
Developmental Fisheries Board, created in 1993 by the Oregon
Legislature and implemented under Oregon Administrative
Rules (OAR 635). The Board's goal is to provide sustainable
economic development of underutilized fishery resources by
issuing a conservative number of exploratory permits (Hobbs,
1995). Beginning in 1995 small scale fishing began for the
Board's "Category A" species, defined as, "Having the best
potential to be economically viable and are not under
another state or federal management plan." Included were
Pacific hagfish, blue shark, swordfish, northern anchovy,
Pacific herring, Pacific sardine, Pacific saury, Pacific
sandfish, smelt, Pacific pomfret, slender sole, box crab,
Oregon hair crab, scarlet king crab, grooved tanner crab,
spot shrimp, coonstripe shrimp, sidestripe shrimp, cockle
clams, giant octopus, California market squid, other squid
22
species, fragile urchin, sea cucumber and marine snails
(ODF&W, 1994). Next the Board will assess the results of the
fishery for further exploitation.
B. Legislation
Seafood processors must adhere to a variety of
legislation. The Code of Federal Regulations (CFR) addresses
seafood in three separate areas: processing and sanitation
requirements are found in Title 21, Food and Drugs; water
quality issues are found in Title 40, Protection of the
Environment; and fishery resources fall under Title 50,
Wildlife and Fisheries. The statutory origin of the
regulations are found in United States Code (USC) Title 21,
Food and Drugs; Title 16, Conservation; and Title 33,
Navigation and Navigable Waters.
1. Federal Water Quality Legislation
The major federal laws for protection of water are the
Federal Water Pollution Control Act of 1972 (FWPCA), the
1977 amendments to the FWPCA (known as the Clean Water Act:
CWA) the 1987 amendments to the FWPCA (known as the Water
Quality Act), and the Marine Protection, Research and
Sanctuaries Act of 1972 (MPRSA) as amended by the Ocean
Dumping Ban Act of 1988. The MPRSA covers discharge into the
ocean past the three mile territorial sea boundary. The CWA
governs discharges into nearshore waters, rivers and
23
estuaries, and therefore currently covers any seafood
processing effluent discharged directly into these
waterways.
a. Clean Water Act
(33 U.S.C. 1251 et seq.)
In 1972 the amendments to the FWPCA instated four
national policies: No one has the right to pollute the
navigable waters through unauthorized discharge; Permits
shall limit the composition of a discharge and the
concentrations of the pollutants in it; Some permit
conditions require the best controls technology can produce,
regardless of the receiving water's ability to purify itself
naturally; and any limits or control higher than the minimum
federal requirements must be based on receiving water
quality.
The 1972 amendments also established the National
Pollutant Discharge Elimination System (NPDES) permitting
program and allowed the federal government to assume the
major role in water pollution programs. The two goals of
permitting program are written in Section 101(a): Eliminate
the discharge of pollutants into navigable waters by 1985
(this goal was unrealistic, but did help implementation of
strict regulation); and achieve an interim water quality
level that would protect life forms while providing for
recreation in and on the water wherever attainable. The
24
NPDES permit program sets limitations on effluent and
defines monitoring and reporting requirements. The NPDES
program is the responsibility of U.S. Environmental
Protection Agency's (EPA) Office of Water Enforcement and
Permits, which shares responsibility with another EPA
agency, the Office of Water Regulations and Standards (OWRS)
for implementing the CWA section 301(h) and 403 programs
relating to the control of point source discharges to marine
waters (OTA, 1987).
Section 101(b) made it a policy to preserve the states'
primary responsibility to meet these goals, section 401
covers rules for state certification and section 402(b)
describes mechanisms for states to obtain administration of
the permitting system. Seafood processors may be issued
individual or general permits for discharge. The EPA, or
authorized state agencies, will categorically authorize a
general permit when a number of point source discharges-
- involve similar types of operations;- discharge the same types of wastes;- are located within a geographic area- require the same effluent limitations;- require the same operating conditions;- require similar monitoring requirements; and- in the opinion of EPA are more appropriately controlledunder a general permit than under individual permits
(40 CFR ss 122.28).
The goals of the 1977 amendments (CWA), as administered
by EPA, are restoration and maintenance of the integrity of
the Nation's waters. Section 403 requires that all NPDES
permitted discharges from point sources must cause no
25
"unreasonable degradation," which is based on:
- the effects of the discharge on human health and welfare;- marine life;- aesthetic, recreational and commercial values;- the persistence and permanence of these effects;- the effects of varying disposal rates;- the alternative disposal or recycling options available;- and the effect on alternate uses of the oceans.
The 403 program is a decision-making process that
allows pollution controls in addition to other provisions of
the CWA, it permits more stringent control of pollutants
known to be persistent and harmful to the marine environment
and public health. It is not restricted by engineering
attainability, and has no rigorous cost or economic
restrictions. It also includes consideration of sediment as
well as water column effects, and is intended not only to
protect most aquatic species but places special emphasis on
unique, sensitive, or ecologically critical species (Tetra
Tech, 1991).
In 1987 the Water Quality Act reauthorized and amended
the Clean Water Act with the following provisions:
- Construction Grants Program/State Revolving Loan Funds- Ocean Dumping- National Estuary Program- Chesapeake Bay- Boston Harbor- Control of Toxic Pollutants- Sewage Sludge- Nonpoint Source Pollution- Penalties- Compliance Deadlines- Anti-backsliding
The FWPCA resulted in EPA effluent guidelines strict
enough to initiate an interest in alternatives to waste
26
disposal methods such as fish meal production and other
recovery methods. These guidelines mandated that fish
processing byproducts in non-remote sites be discharged to
or disposed of in tidal flow areas to prevent buildup of
seafood processing wastes. In addition to these guidelines,
there was an increased world demand for high-quality
protein, drastic reductions in South American fish meal
production, and effects of the Magnuson Fisheries and
Conservation Management Act of 1976. One purpose of the
Magnuson Act was to exercise the right to exploit fishery
resources in the 200 mile exclusive economic zone
established by Presidential Proclamation 5030 (3/10/83). For
American processors, the potential for high tonnages
provided positive economic conditions for developing
alternatives to wasteful disposal methods. In contrast to
the past, the current era was initiated by regulation, but
the degree of development was limited by economics (Meehan
et al., 1990).
b. Marine Protection Research and Sanctuaries Act
(33 U.S.C. 1401 et seq.)
The MPRSA regulates the ocean dumping of all types of
materials and defines responsibility: The EPA and Army Corps
of Engineers (COE) are responsible for administering the
permit program; the U.S. Department of Commerce through the
National Oceanic and Atmospheric Administration (NOAA) is
27
responsible for monitoring the program and the U.S. Coast
Guard is responsible for surveillance.
There are nine factors to be considered in developing
the permit review criteria:
- the effect of the dumping on human health and welfare;- its effect on fisheries resources and beaches;- its effects on marine ecosystems;- the permanence of the effect of dumping;- the effect of volumes and concentrations;- the appropriate locations and methods of disposal;- the effect on alternate uses of the oceans and- The need for proposed dumping;- the location of the site beyond the continental shelf
Many of the Pacific Northwest seafood processors
dispose of their wastewater through a pipe into a river or
estuary, which places them in the jurisdiction of the CWA.
One alternative for disposal of solid processing wastes is
dumping at sea, in which case the MPRSA must be adhered to.
Because of the potential effect on the marine nutrition
cycle, the state fish and wildlife agency may be involved by
supplying authority for dumping seafood byproducts in a
specified area.
2. State of Oregon Legislation
a. Oregon Coastal Management Program
The Oregon Coastal Management Program (OCMP) was
developed in the early seventies, approved under federal
Coastal Zone Management Act of 1977, and is administered by
the Oregon Department of Land Conservation and Development
(DLCD). The 1990 DLCD assessment of issues and potential for
28
improvement named "cumulative effects of development" one of
the most important areas to Oregonians. This topic was
divided into population growth, infrastructure needs,
threats to natural resources, planning for and managing
cumulative impacts and water quality. These last two
concerns caused the seafood waste management issue to be a
DLCD concern (OCMP, 1992).
The purpose of the OCMP is to achieve 19 statewide
goals. The directly applicable goals to the issue of seafood
waste management are Goal 16: Estuarine Resources, which
protects the long-term environmental, economic and social
values, diversity and benefits of Oregon's estuaries, and
Goal 19: Ocean Resources, which "conserves long-term values,
benefits, and natural resources of nearshore ocean and
continental shelf" (DLCD, 1993).
b. Department of Environmental Quality
In Oregon, the EPA has delegated administrative
authority to the DEQ. Seafood processing waste discharge
must comply with the DEQ water quality regulations, which
are similar to and at least as stringent as EPA best
processing technology guidelines. The DEQ administers air,
water, land and noise pollution control programs, regulates
sewage treatment and disposal system and solid waste
disposal sites; manages solid waste control programs,
including control of environmentally hazardous wastes; and
29
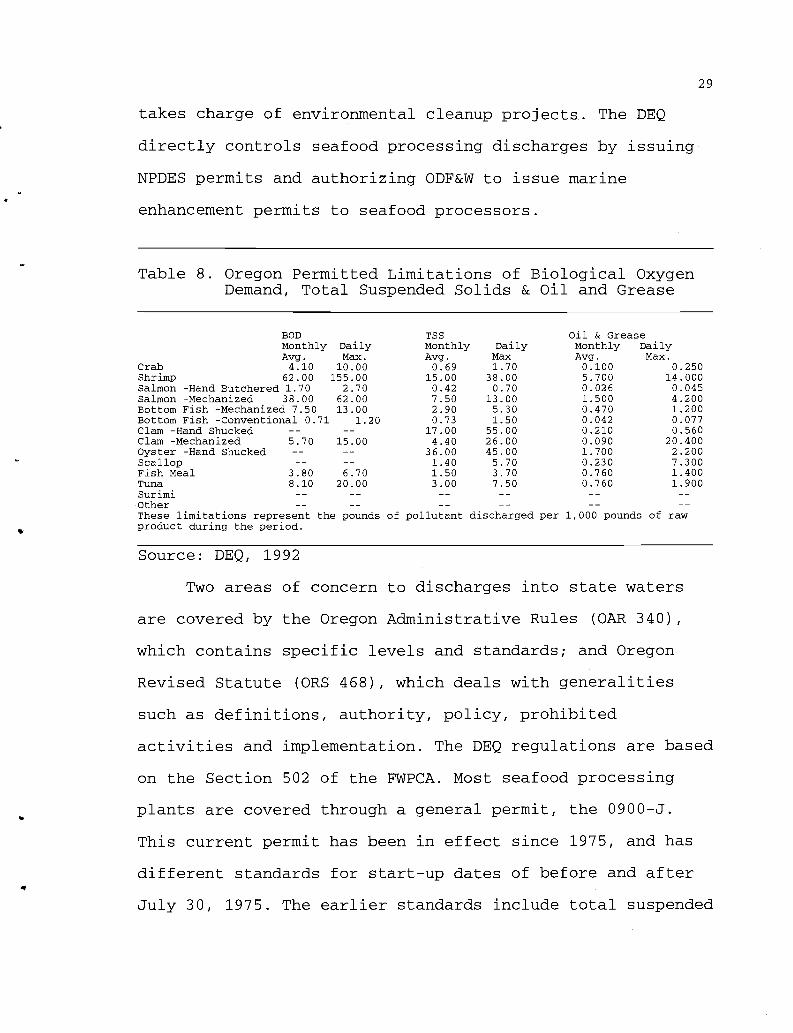
takes charge of environmental cleanup projects. The DEQ
directly controls seafood processing discharges by issuing
NPDES permits and authorizing ODF&W to issue marine
enhancement permits to seafood processors.
Table 8. Oregon Permitted Limitations of Biological OxygenDemand, Total Suspended Solids & Oil and Grease
BOD TSS Oil & GreaseMonthlyAvg.
DailyMax.
MonthlyAvg.
DailyMax
MonthlyAvg.
DailyMax.
Crab 4.10 10.00 0.69 1.70 0.100 0.250Shrimp 62.00 155.00 15.00 38.00 5.700 14.000Salmon -Hand Butchered 1.70 2.70 0.42 0.70 0.026 0.045Salmon -Mechanized 38.00 62.00 7.50 13.00 1.500 4.200Bottom Fish -Mechanized 7.50 13.00 2.90 5.30 0.470 1.200Bottom Fish -Conventional 0.71 1.20 0.73 1.50 0.042 0.077Clam -Hand Shucked -- -- 17.00 55.00 0.210 0.560Clam -Mechanized 5.70 15.00 4.40 26.00 0.090 20.400Oyster -Hand Shucked -- -- 36.00 45.00 1.700 2.200Scallop 1.40 5.70 0.230 7.300Fish Meal 3.80 6.70 1.50 3.70 0.760 1.400Tuna 8.10 20.00 3.00 7.50 0.760 1.900SurimiOtherThese limitations represent the pounds of pollutant discharged per 1,000 pounds of rawproduct during the period.
Source: DEQ, 1992
Two areas of concern to discharges into state waters
are covered by the Oregon Administrative Rules (OAR 340)
which contains specific levels and standards; and Oregon
Revised Statute (ORS 468), which deals with generalities
such as definitions, authority, policy, prohibited
activities and implementation. The DEQ regulations are based
on the Section 502 of the FWPCA. Most seafood processing
plants are covered through a general permit, the 0900-J.
This current permit has been in effect since 1975, and has
different standards for start-up dates of before and after
July 30, 1975. The earlier standards include total suspended
30
solids (TSS) monthly averages and daily maximums along with
oil and grease (OG) monthly averages and daily maximums and
covered crab, shrimp, salmon, bottom fish, clams, oysters
and scallops. In 1975, BOD was added to the standards and
categories were created for fish meal, tuna, surimi and
miscellaneous processing. As new information is available,
the DEQ reviews the fitness of the general permit for
individual plants. All wastewater must be screened to at
least 40 mesh and BOD, TSS & OG must not exceed the set
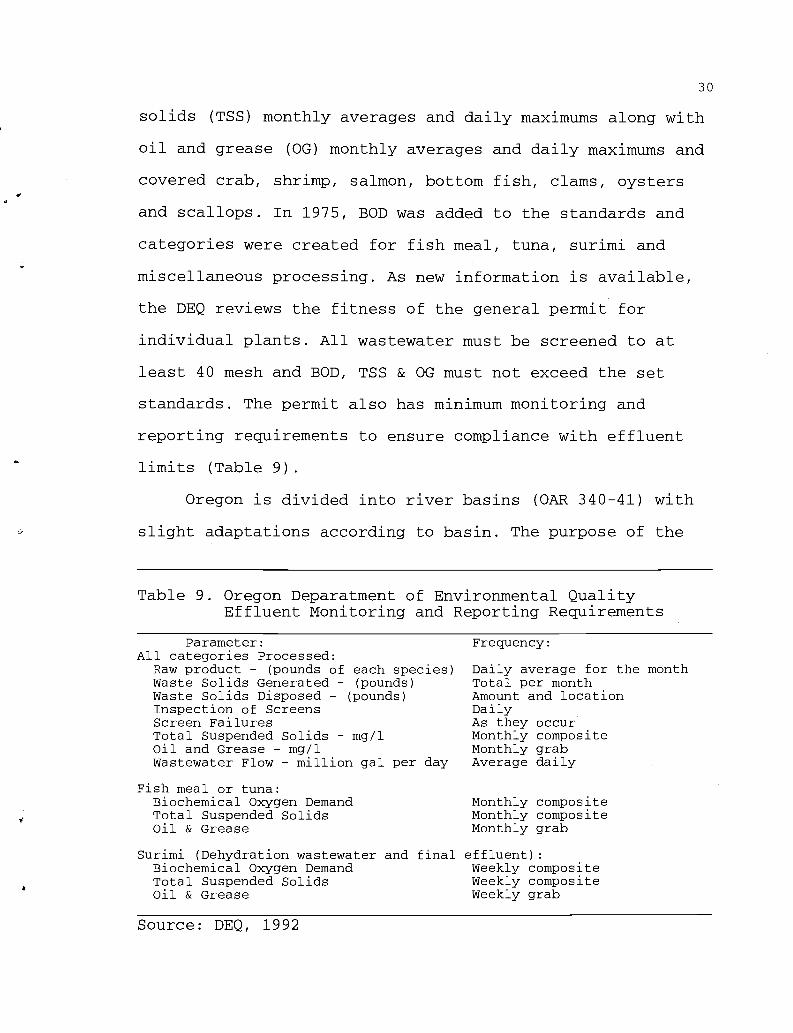
standards. The permit also has minimum monitoring and
reporting requirements to ensure compliance with effluent
limits (Table 9).
Oregon is divided into river basins (OAR 340-41) with
slight adaptations according to basin. The purpose of the
Table 9. Oregon Deparatment of Environmental QualityEffluent Monitoring and Reporting Requirements
Parameter:All categories Processed:
Raw product - (pounds of each species)Waste Solids Generated - (pounds)Waste Solids Disposed - (pounds)Inspection of ScreensScreen FailuresTotal Suspended Solids - mg/lOil and Grease - mg/lWastewater Flow - million gal per day
Frequency:
Daily average for the monthTotal per monthAmount and locationDailyAs they occurMonthly compositeMonthly grabAverage daily
Fish meal or tuna:Biochemical Oxygen DemandTotal Suspended SolidsOil & Grease
Monthly compositeMonthly compositeMonthly grab
Surimi (Dehydration wastewater and final effluent):Biochemical Oxygen Demand Weekly compositeTotal Suspended Solids Weekly compositeOil & Grease Weekly grab
Source: DEQ, 1992
31
rules are to "maintain dissolved oxygen and overall water
quality at the highest possible levels and water
temperature, coliform bacteria concentrations, dissolved
chemical substances, toxic materials, radioactivity,
turbidities, color, odor, and other deleterious factors at
the lowest possible levels" [OAR 340-41-245(1)].
There are separate standards for fresh, estuarine and
marine waters for levels of temperature, oxygen, turbidity,
acidity, and bacteria specified in OAR 340-41-242(2)(a)
through OAR 340-41-245-(2)(e), which are listed in Table 10.
General prohibitions include:
(f) conditions deleterious to waters used for domesticpurposes
(g) gas releases which might be deleterious or cause odor,(h) development of deleterious fungi or other growths(i) creating tastes, odors, toxic or other deleterious
conditions(j) appreciable bottom sludge deposits(k) oil films, discoloration and scum(1) offensive aesthetic conditions(m) radioisotope concentrations exceeding maximum
permissible concentrations(n) high concentrations of total dissolved gas(o) toxic substances - there are specific values available
The above conditions may be suspended by the DEQ inside
"mixing zones" as defined by both general and individual
wastewater permits, OAR 340-41-245(c). Common mixing zone
standards are:
- must be as small as feasible;- should not overlap with other mixing zones;- should cause minimal adverse effects on local aquatic
life;- should not threaten public health; and- should minimize the effects on uses outside the mixing
zone.
32
Mixing zones must be free of acutely toxic materials
(those with significant differences in lethal concentration
between a control and 100% effluent with the exception of
ammonia and chlorine which will be determined on a case by
case basis), objectionable deposits, floating debris, oil,
scum or other nuisance conditions, and substances that
produce deleterious bacterial growth. Section OAR 340-41-
245(B) requires waters outside the mixing zone to contain no
materials that cause chronic (sublethal) toxicity and meet
standards under normal annual low flow conditions.
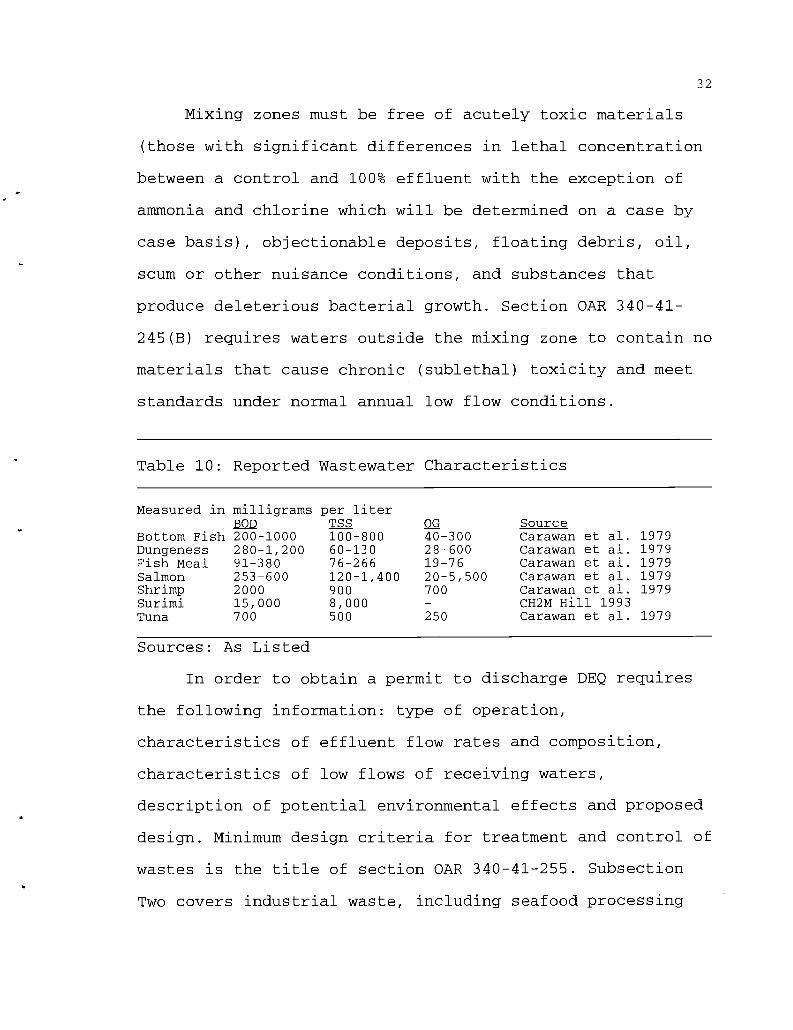
Table 10: Reported Wastewater Characteristics
Measured in milligrams per literBOD TSS
Bottom Fish 200-1000 100-800Dungeness 280-1,200 60-130Fish Meal 91-380 76-266Salmon 253-600 120-1,400Shrimp 2000 900Surimi 15,000 8,000Tuna 700 500
OG Source40-300 Carawan et al. 197928-600 Carawan et al. 197919-76 Carawan et al. 197920-5,500 Carawan et al. 1979700 Carawan et al. 1979- CH2M Hill 1993250 Carawan et al. 1979
Sources: As Listed
In order to obtain a permit to discharge DEQ requires
the following information: type of operation,
characteristics of effluent flow rates and composition,
characteristics of low flows of receiving waters,
description of potential environmental effects and proposed
design. Minimum design criteria for treatment and control of
wastes is the title of section OAR 340-41-255. Subsection
Two covers industrial waste, including seafood processing
33
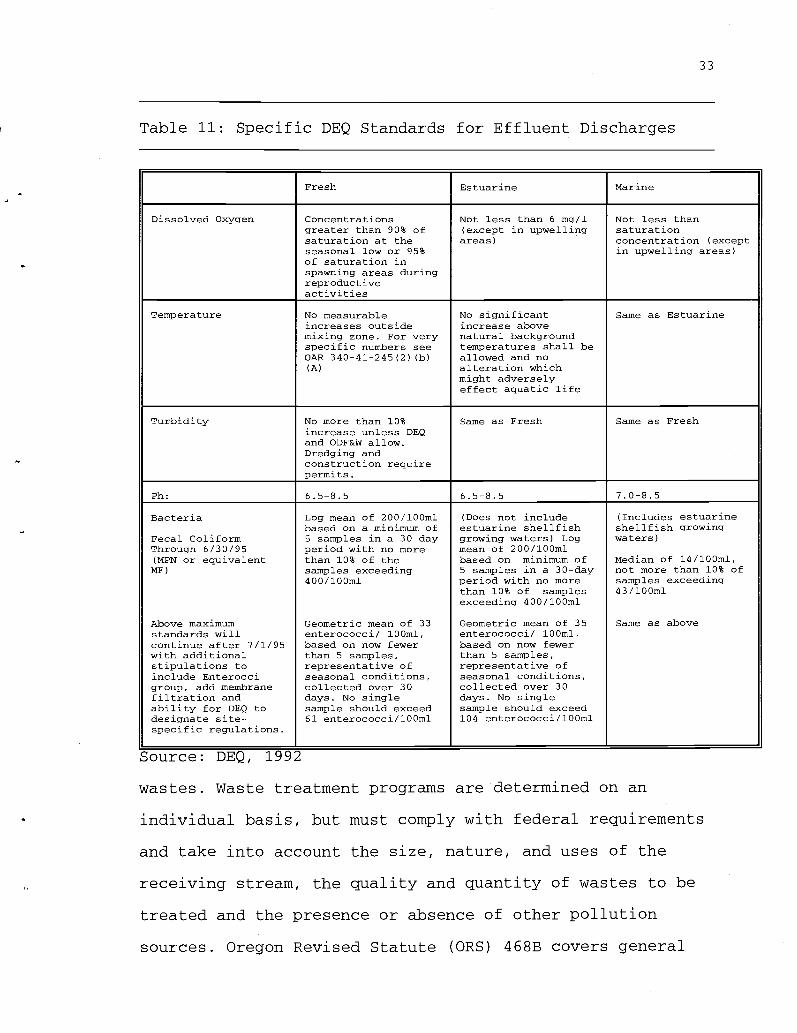
Table 11: Specific DEQ Standards for Effluent Discharges
Fresh Estuarine Marine
Dissolved Oxygen Concentrations Not less than 6 mg/l Not less thangreater than 90% of (except in upwelling saturationsaturation at the areas) concentration (exceptseasonal low or 95% in upwelling areas)of saturation inspawning areas duringreproductiveactivities
Temperature No measurable No significant Same as Estuarineincreases outside increase abovemixing zone. For very natural backgroundspecific numbers see temperatures shall beOAR 340-41-245(2)(b) allowed and no(A) alteration which
might adverselyeffect aquatic life
Turbidity No more than 10% Same as Fresh Same as Freshincrease unless DEQand ODF&W allow.Dredging andconstruction requirepermits.
Ph- 6.5-8.5 6.5-8.5 7.0-8.5
Bacteria Log mean of 200/100ml (Does not include (Includes estuarinebased on a minimum of estuarine shellfish shellfish growing
Fecal Coliform 5 samples in a 30-day growing waters) Log waters)Through 6/30/95 period with no more mean of 200/100ml(MPN or equivalent than 10% of the based on minimum of Median of 14/100ml,MF) samples exceeding 5 samples in a 30-day not more than 10% of
400/100ml period with no more samples exceedingthan 10% of samples 43/100mlexceeding 400/100ml
Above maximum Geometric mean of 33 Geometric mean of 35 Same as abovestandards will enterococci/ 100ml, enterococci/ 100ml,continue after 7/1/95 based on now fewer based on now fewerwith additional than 5 samples, than 5 samples,stipulations to representative of representative ofinclude Enterocci seasonal conditions, seasonal conditions,group, add membrane collected over 30 collected over 30filtration and days. No single days. No singleability for DEQ to sample should exceed sample should exceeddesignate site- 61 enterococci/100ml 104 enterococci/100mlspecific regulations.
Source: DEQ, 1992
wastes. Waste treatment programs are determined on an
individual basis, but must comply with federal requirements
and take into account the size, nature, and uses of the
receiving stream, the quality and quantity of wastes to be
treated and the presence or absence of other pollution
sources. Oregon Revised Statute (ORS) 468B covers general
34
water pollution control including responsibilities,
definitions, and references to statutes governing water
uses. The policy (0RS468B.015) lists five goals:
- conserve state waters;- protect, maintain and improve water quality for a varietyof uses including both aquatic life and industrial;
- ensure treatment of wastes before entering state waters;- prevent or control water pollution;- cooperate on a state, interstate and federal level.
The activities prohibited by the DEQ (ORS 468B.025) are
very strict. With the exception of permit holders, it is
forbidden to cause water pollution (directly or indirectly),
or discharge any wastes into the waters of the state if the
discharge reduces water quality according to standards set
out in OAR Chapter 340-41. OAR 340-41-255 describes the
standards for effluent discharge, which are specific for
sewage but determines industrial waste treatment
requirements on an individual basis.
3. California, Washington & Alaska Legislation
The EPA delegates different levels of authority to each
of the western states. In California nine regional water
quality control offices are responsible for the water
issues. The state has enacted a water quality control plan
for enclosed bays and estuaries which discourages seafood
processors from discharging into waterways. The northern
California coast lies in Region 1 and there is no
inexpensive general permit available for estuarine
discharge. Seafood processors must discharge to a municipal
sewer system or, as in two areas, obtain an individual
35
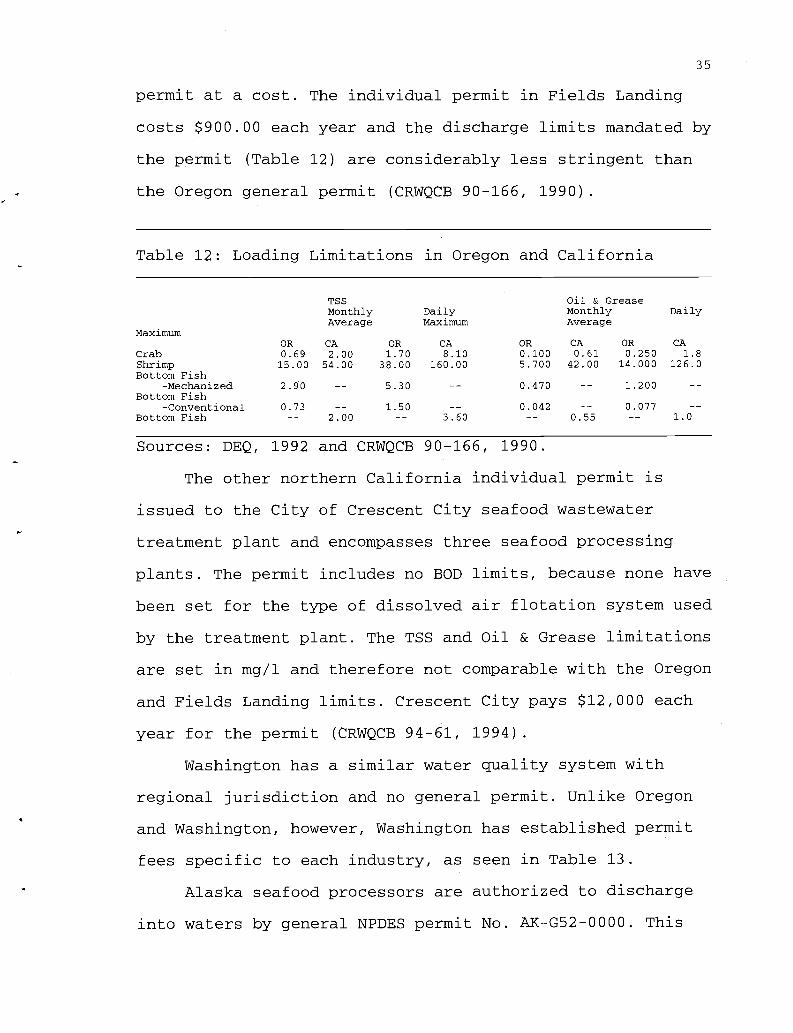
permit at a cost. The individual permit in Fields Landing
costs $900.00 each year and the discharge limits mandated by
the permit (Table 12) are considerably less stringent than
the Oregon general permit (CRWQCB 90-166, 1990).
Table 12: Loading Limitations in Oregon and California
TSS Oil & GreaseMonthly Daily Monthly DailyAverage Maximum Average
Maximum
CrabOR0.69
CA2.00
OR1.70
CA8.10
OR0.100
CA0.61
OR0.250
CA1.8
Shrimp 15.00 54.00 38.00 160.00 5.700 42.00 14.000 126.0Bottom Fish
-Mechanized 2.90 -- 5.30 -- 0.470 -- 1.200 --Bottom Fish
-Conventional 0.73 -- 1.50 -- 0.042 -- 0.077 --Bottom Fish -- 2.00 -- 3.60 -- 0.55 -- 1.0
Sources: DEQ, 1992 and CRWQCB 90-166, 1990.
The other northern California individual permit is
issued to the City of Crescent City seafood wastewater
treatment plant and encompasses three seafood processing
plants. The permit includes no BOD limits, because none have
been set for the type of dissolved air flotation system used
by the treatment plant. The TSS and Oil & Grease limitations
are set in mg/l and therefore not comparable with the Oregon
and Fields Landing limits. Crescent City pays $12,000 each
year for the permit (CRWQCB 94-61, 1994).
Washington has a similar water quality system with
regional jurisdiction and no general permit. Unlike Oregon
and Washington, however, Washington has established permit
fees specific to each industry, as seen in Table 13.
Alaska seafood processors are authorized to discharge
into waters by general NPDES permit No. AK-G52-0000. This

36
permit was reissued effective November 1, 1994. and is based
on "best available technology" which allows Alaskan seafood
processors to discharge solid materials after grinding to
half inch sized particles. The sea floor and receiving
waters of the discharge area must be monitored. Areas
excluded by the general permit are environmentally sensitive
(near rookeries, sanctuaries, etc.), degraded water bodies,
or designated fish processing centers. Each of these areas
has a total maximum daily load (TMDL) individually
Table 13: Wastewater Discharge Permit Fees for WashingtonState Seafood Processing Based on Effluent Amounts
Discharge in Gallons/Day Annual Feea. < 1,000 gpd 996.00b. 1,000 - <10,000 gpd 2,540.00c. 10,000 - <50,000 gpd 4,532.00d. 50,000 - <100,000 gpd 7,121.00e. > 100,000 gpd 9,960.00
Source: WAC Chapter 173-224.
determined by the EPA (Hill, 1995).
Waivers are available for these exclusions after
consultation between EPA, the Alaska Department of
Environmental Conservation (DEC) and other appropriate
government offices (EPA Region 10, 1994).
C. Options for uses of processing by-products
1. Solid Byproducts
The alternatives for managing seafood processing
byproducts can be categorized as disposal or recovery.
Disposal can be incineration, dumping in the ocean, or
37
dumping in a landfill and is more simple than recovery
because of the elimination of the need for further
processing. Permits are required for all of these activities
(Hilderbrand, 1995).
Disadvantages to disposal include waste of usable
products, harm to the environment and increasingly limited
space in landfills. "Emphasis should be placed on less rigid
approaches by government and industry towards conservation,
recycling, by-product recovery, and pollution regulations"
(Gates, 1991).
"The disposal of billions of pounds of protein in
accordance with the federal and state regulations requires a
well designed waste handling system. This translates into a
significant commitment of time and money by the seafood
processor. It follows that if money can be made by further
utilizing the resource, then that is the preferable course
of action to simply dumping the unprocessed byproducts back
into the water or landfill. Hence there has been an
increased interest in fish meal plants recently, especially
since the white fleshed fish, such as cod and pollock, make
a high-value meal" (Haney, 1990).
Recovery is the alternative to disposal, and there are
many methods for using fish process byproducts which not
only avoid disposal problems, but can be profitable. Windsor
& Barlow (1981), provide a useful overview of several
methods which is summarized here with supplementary
information from Keller (1990).
38
Processing fish meal consists of separating out the
solids, oil and water. The final product should be 10%
water, 15% oil and 75% solids. This raw material is heated
to the point of coagulating the protein (about 100°C) and
rupturing cell walls which detaches any bound oil and water.
The liquids are drained off, then the drained solids are
strained and pressed, resulting in a press cake of 55%
moisture and 3-4% oil. The liquids are composed of 6% solids
and 16% oil and can be filtered, centrifuged and
concentrated, then added back to the finished product. The
press cake is dried to about 10% moisture content where the
product is stable and not liable to bacterial or enzymic
deterioration. Most fish meal is used as a base for
livestock and aquaculture feed (Gates, 1991).
Consistency of raw materials is important to
maintaining a desired quality level. The Oregon Pacific
whiting surimi industry produces a high volume of byproducts
with even consistency. The relatively low ash content of the
whiting makes the carcasses a desirable raw product for fish
meal production (Kerm, 1994).
Processing crab and shrimp shells into meal is feasible
(Grulich & DuPaul, 1984) but the relatively high levels of
chitin in crab and shrimp shells discourages their use.
Recent investigations have shown that shrimp shells may be
successfully used as a base for a high protein silage, but
currently in Oregon, the cost of transporting the raw
materials is prohibitive (Evers, 1995; Evers & Carroll,
39
1995). However, the chitin can be extracted and used to form
chitosan, which has many uses including cosmetics, paper
production, flocculating agents for wastewater treatment
systems and in the medical industry as a wound healing agent
and cholesterol reducing agent (Skaugrud & Sargent, 1990).
Chitosan is used in Japan as a food supplement and, although
the United States health food industry has expressed
interest in the product, regulatory hurdles have yet to be
overcome. Pronova, Incorporated, in Raymond Washington is
the only chitosan extraction plant in North America.
Currently Pronova is petitioning the Food and Drug
Administration for "generally regarded as safe" (GRAS)
status for chitosan and chitosan based products (Sargent,
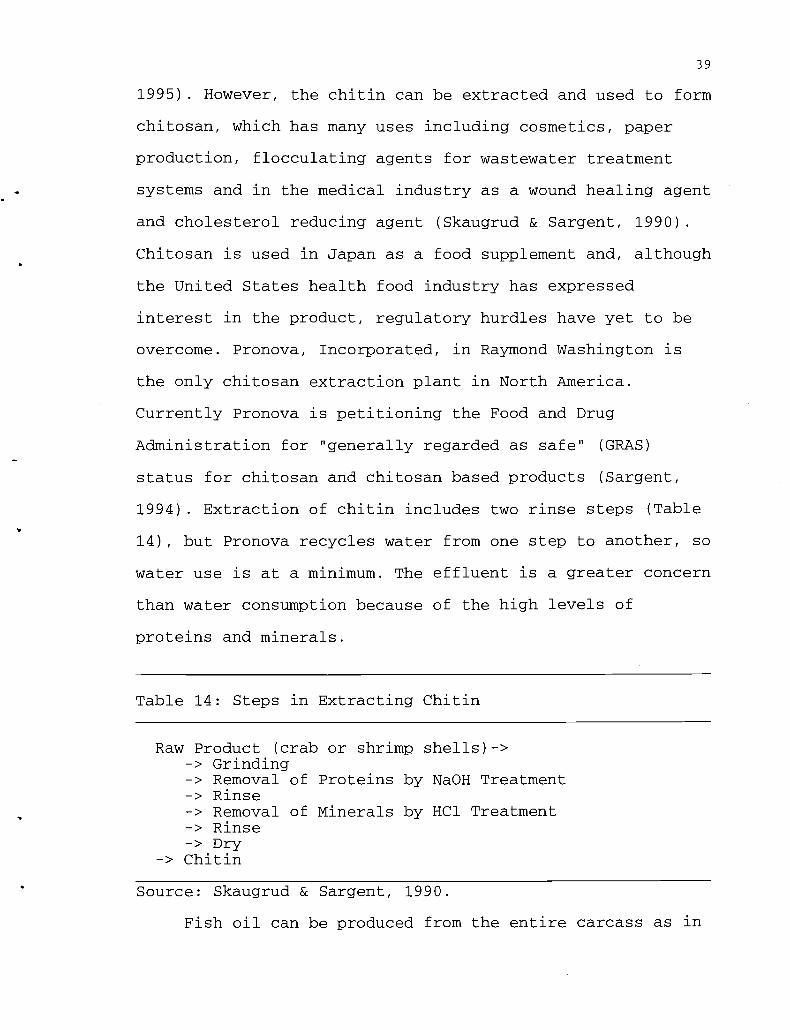
1994). Extraction of chitin includes two rinse steps (Table
14), but Pronova recycles water from one step to another, so
water use is at a minimum. The effluent is a greater concern
than water consumption because of the high levels of
proteins and minerals.
Table 14: Steps in Extracting Chitin
Raw Product (crab or shrimp shells)->-> Grinding-> Removal of Proteins by NaOH Treatment-> Rinse-> Removal of Minerals by HC1 Treatment-> Rinse-> Dry
-> Chitin
Source: Skaugrud & Sargent, 1990.
Fish oil can be produced from the entire carcass as in
40
fish meal processing. After separation the oil must be
refined, bleached, hydrogenated, and deodorized. The purpose
is to reduce the free fatty acid level because these acids
act as catalyst poisons and reduce the speed of
hydrogenation. The important components affecting fish oil
quality are the free fatty acids (<3%), unsaponifiable
matter (<3.5%) and moisture (<0.3%). Hardened fish oil is
used in margarine and shortening but rarely used on American
tables as it adds an undesirable flavor (Windsor & Barlow,
1981).
Fish oil can also be made from the livers for medicinal
or veterinary purposes. The important components are
vitamins A and D. Fish liver oil is also pharmaceutically
used in the West to treat cholesterol problems. The lower
grade fish liver oils have industrial uses (Windsor &
Barlow, 1981).
Fish silage and some liquified fish proteins are simple
to produce, requiring a relatively small capital investment
in equipment to mince the carcasses, a storage facility, and
acids which encourage enzymatic liquefaction. The best fish
to use for these products have low oil and cartilage
content. Fish silage is useful as livestock feed, with a
protein content of 16%, as compared to the fish meal protein
content of up to 70%. However, fish silage production does
not generate the odor problem inherent to fish meal
production (Windsor & Barlow, 1981). The length of
hydrolysis time can control the types of proteins in the
41
product. Successful uses for fish silage with short peptides
are as feed for other fish, fur bearing mammals, chickens
and pigs. Silage with less broken down proteins is used for
ruminants (Arason et al., 1990).
Hydrolyzed fish products have potential in livestock
feeds, especially as a replacement for milk for young
mammals (Goldhor et al., 1990), but fish proteins are
slightly less digestible compared with milk protein. There
is little interest for hydrolysates as human food because
the product has a slight fishy smell, bitter flavor and
brown color (Windsor & Barlow, 1981). In 1994 a fish
hydrolysis plant opened in Hammond and is still in the early
stages of production.
Fish Protein Concentrate (FPC) was presented in the
sixties as a reasonable answer to exploitation of
underutilized species and world hunger at the same time. In
the United States Food and Drug Administration, however,
does not permit the marketing of FPC as a human food
supplement because the of the presence of fish parts
(entrails) considered "unfit for food" (CFR 21 Sec. 402.3).
FPC production consists of mincing, solvent induced protein
extraction, centrifugation, heating, solvent removal then
grinding and packing. In very low oil content products there
is essentially no odor and very little flavor. The result of
the FPC experiment into world hunger abatement failed
because it addressed a lack of protein, which is only a part
of the real problem of not enough calories (Latham, 1984).
42
lubricants, leather, caulking compounds, greases and water
repellents. These are mostly unsatisfactory uses for large
quantities of fish processing byproducts.
Composting can accommodate any amount of material and
is the best alternative for by-products which have begun to
decompose. Technically, composting is the oxidative
metabolism of carbohydrate by microorganisms, emphasizing
the correct ratio of carbon and nitrogen for optimalmicroorganism growth (Brinton, 1990). An attractive featureof composting is that little capital is required. Similar to
composting is applying materials to fields and tilling themunder to degrade with no added attention. This method does
not take advantage of the sterilization and complete
decomposition true composting produces. As the whiting
seasons decrease, high-capital investment waste recovery
systems will decrease in viability. Low technology-low
capital processes such as composting will necessarily
dominate (Hilderbrand, 1995). Composting has a further
advantage in Oregon: sawdust and bark from timber production
are excellent and plentiful sources of carbon.
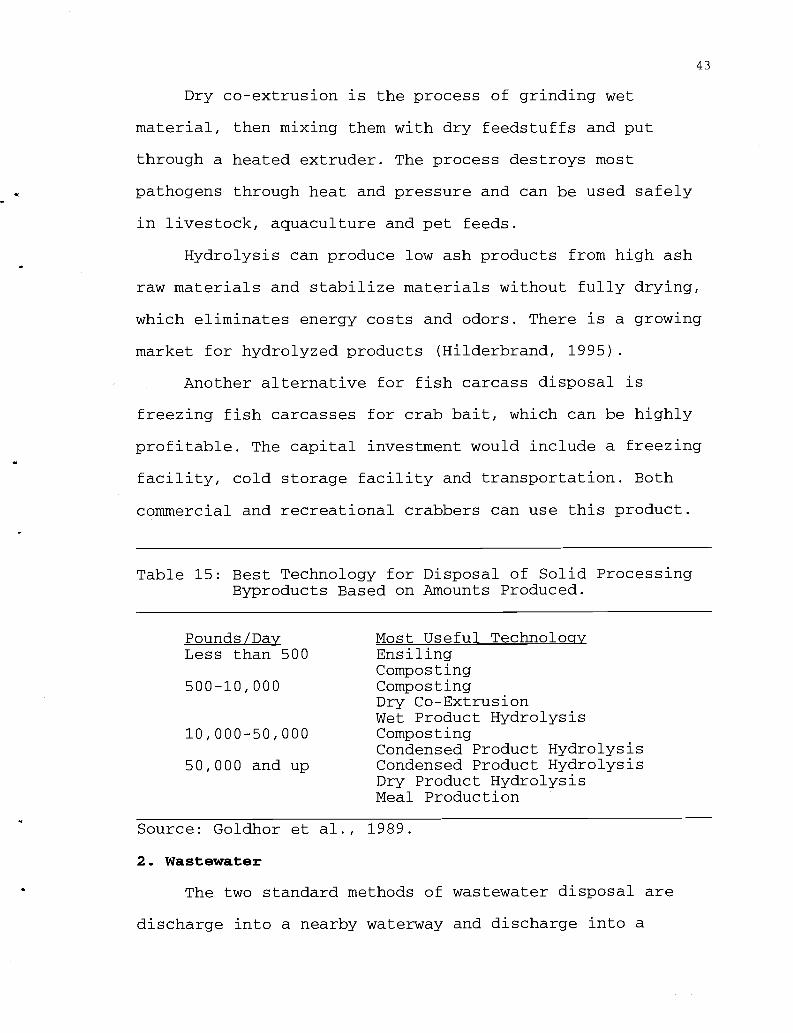
Generally, the most effective method of recovery is
based on quantity of raw material as summarized by Goldhor
et al. (1989) in Table 15. Sea Grant extension services have
recently researched composting in Oregon and discovered a
substantial demand for compost products, with profits almosttwice as high as those resulting from the same raw products
used as fish meal (Hilderbrand, 1995).
43
Dry co-extrusion is the process of grinding wet
material, then mixing them with dry feedstuffs and put
through a heated extruder. The process destroys most
pathogens through heat and pressure and can be used safely
in livestock, aquaculture and pet feeds.
Hydrolysis can produce low ash products from high ash
raw materials and stabilize materials without fully drying,
which eliminates energy costs and odors. There is a growing
market for hydrolyzed products (Hilderbrand, 1995).
Another alternative for fish carcass disposal is
freezing fish carcasses for crab bait, which can be highly
profitable. The capital investment would include a freezing
facility, cold storage facility and transportation. Both
commercial and recreational crabbers can use this product.
Table 15: Best Technology for Disposal of Solid ProcessingByproducts Based on Amounts Produced.
Pounds/Day Most Useful TechnologvLess than 500 Ensiling
Composting500-10,000 Composting
Dry Co-ExtrusionWet Product Hydrolysis
10,000-50,000 CompostingCondensed Product Hydrolysis
50,000 and up Condensed Product HydrolysisDry Product HydrolysisMeal Production
Source: Goldhor et al., 1989.
2. Wastewater
The two standard methods of wastewater disposal are
discharge into a nearby waterway and discharge into a
44
treatment system. A third alternative is to store the
wastewater for use in watering and fertilizing agricultural
fields. Seafood processing wastewater is composed of
naturally occurring substances which makes discharge into
the river or ocean a logical solution, however, some
processors are restricted from this type of discharge by
regulatory agencies or lack a suitable waterway and must use
the local sewage treatment plants. Processors forced to use
local sewer systems are at a financial disadvantage because
of the large quantity of water used in processing. Waste
treatment plants are also disadvantaged because they are
generally built to treat high strength low volume flows and
seafood processing produces low strength high volume flows.
Methods of treatment of wastewater can be categorized
as physical separation such as screening, biological
treatment commonly used in sewage treatment plants, and
physical-chemical separation such as precipitation of
proteins, destablizing colloids, breaking emulsions and
promoting flocculation. The mixture of oil and protein in
fish byproducts makes sedimentation an ineffective
flocculation method, leaving air flotation as the method of
choice (Claggett & Wong, 1974).
One disposal method for solid material is to grind them
and discharge them with wastewater. Seafood processing
byproducts have high protein concentrations which can
provide excellent nutrients, but in excessive amounts, can
create excessive oxygen demand and overwhelm the
45
environment. In small amounts, processing wastes flushed
back into the water body increase the nutrient levels and
encourage growth of the local fauna.
Perkins & Harper (1988) reduced BOD in shrimp effluent
by 54% through acid precipitation and centrifugation
processes. Claggett & Wong (1974) achieved reductions of up
to 40% of BOD and TSS by fine screening and an additional
75% of BOD and 95% TSS removed through chemical and
dissolved air flotation (DAF) treatment. Lin et al. (1995)
increased surimi production yield 1.7% through protein
recovery using ultrafiltration methods. However, none of
these research projects have been financially accessible to
the seafood industry.
The best method of reducing wastewater is by reducing
water use to begin with. Freeman, (1992) lists suggestions
for reducing water use:
- Replace high-volume/low-pressure hoses with low-volume/high-pressure units. Use of quick-shut-offvalves will also maintain your cleaning power whilecutting water use.
- Plug leaks promptly; they can account for half of excessflows.
- Use foam or gel detergents. Because they adhere tosurfaces, they do a better job of cleaning.
- Consider ease of clean-up when purchasing new equipment.- Use dry clean-up whenever possible; sweep and wet mop
before hosing down.- Use in-place cleaning systems when possible.- Keep clean-up in mind during plant design; build walls
and floors from easy to clean materials that don'tcollect dirt.
- Reuse water when possible.- Install flow meters to track your conservation progress.- Consider installing foot-pressure plates or timers on
hose valves.- Segregate discharge flows to keep recyclable water free
from contaminants.
46
Additional suggestions are found in a CH2M Hill report(1992) and a report from the British Columbian Ministry ofAgriculture, Fisheries and Food (Ismond, 1994[a]):
- Use air instead of water for thawing and cooling.- Educate plant personnel in water conservation measures.- Maintain machine settings and blade sharpness.- Install flow meters.- Design equipment to be easily cleaned.- Replace low flow nozzles with high pressure nozzles.
II. METHODOLOGY
The water use and waste disposal survey was conducted
by mailing a questionnaire to a list of seafood processing
plants compiled from a combination of a list published by
the Western United States Seafood Promotion Program (WUSSPP,
1993), a personal data base belonging to Oregon Sea Grant
extension agent, Ken Hilderbrand and Who's Who of the
Fishing Industry (Urner Barry, 1993). This list was designed
to reach all seafood processors in Oregon and near Oregon on
the southern Washington Coast and the northern California
Coast along with a sampling of processors on the East and
Gulf Coasts, in southern California and Alaska. Processors
on the East Coast were telephoned to receive permission
before surveys were sent.
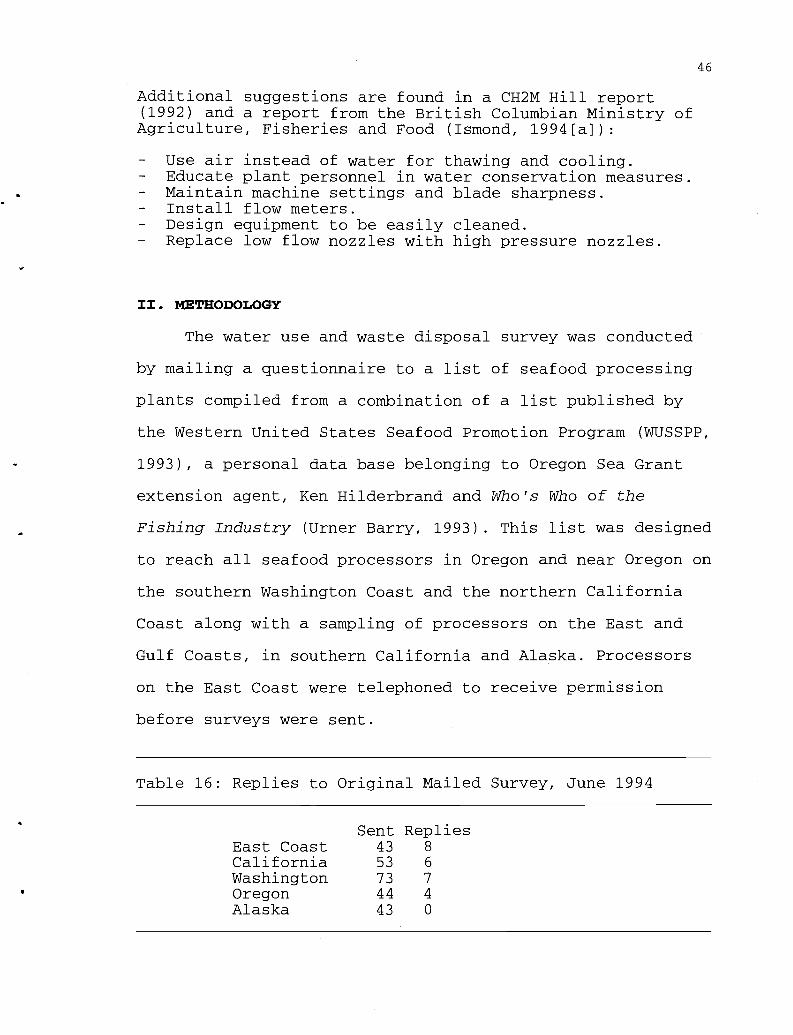
Table 16: Replies to Original Mailed Survey, June 1994
Sent RepliesEast Coast 43 8
California 53 6
Washington 73 7
Oregon 44 4
Alaska 43 0
47
The survey (Appendix C) was based on a 1991 survey of
water use in the California food industry (Mannapperuma et
al., 1992), with adaptations to the Oregon seafood industry.
A total of 256 surveys were sent May 10, 1994, with a
request for reply by June 10. At the deadline, a total of 25
responses had been received, less than half of which
contained usable information (Table 16).
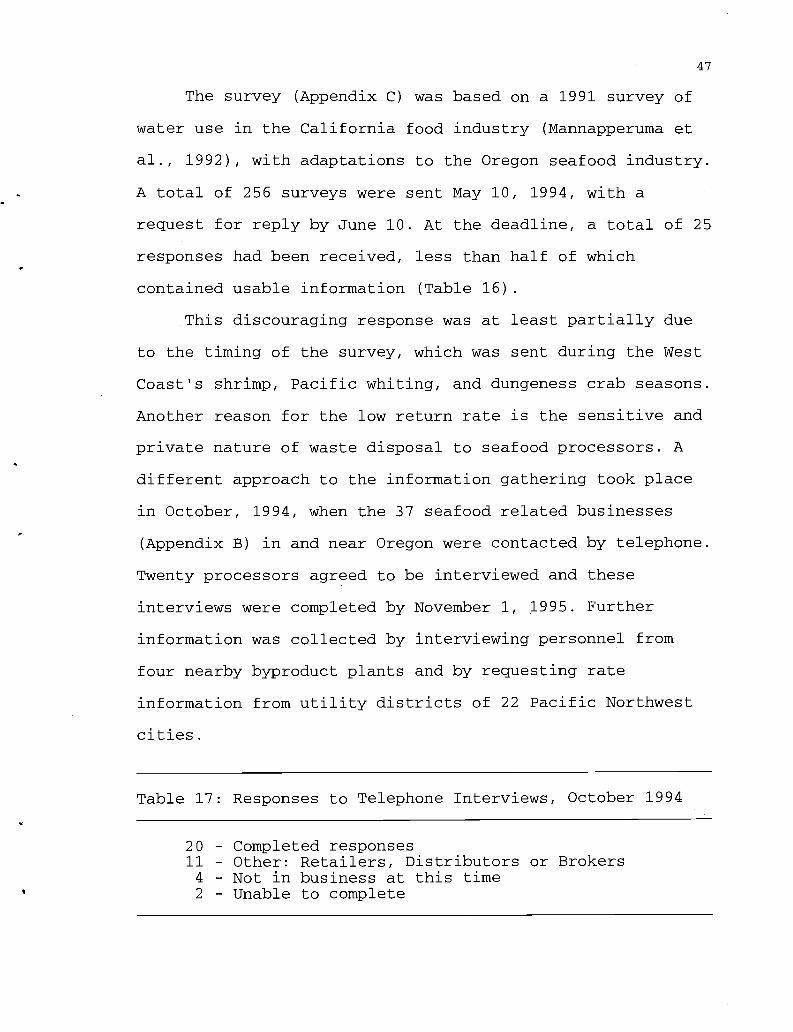
This discouraging response was at least partially due
to the timing of the survey, which was sent during the West
Coast's shrimp, Pacific whiting, and dungeness crab seasons.
Another reason for the low return rate is the sensitive and
private nature of waste disposal to seafood processors. A
different approach to the information gathering took place
in October, 1994, when the 37 seafood related businesses
(Appendix B) in and near Oregon were contacted by telephone.
Twenty processors agreed to be interviewed and these
interviews were completed by November 1, 1995. Further
information was collected by interviewing personnel from
four nearby byproduct plants and by requesting rate
information from utility districts of 22 Pacific Northwest
cities.
Table 17: Responses to Telephone Interviews, October 1994
20 - Completed responses11 - Other: Retailers, Distributors or Brokers4 - Not in business at this time2 - Unable to complete
48
Combined Water Use by 13 Processors in 1993
hAonth'
d
I
Figure 10 Monthly Water Use by. 13 Oregon Seafood Processors.
III. SURVEY RESULTS
A. Water
1. Water Use
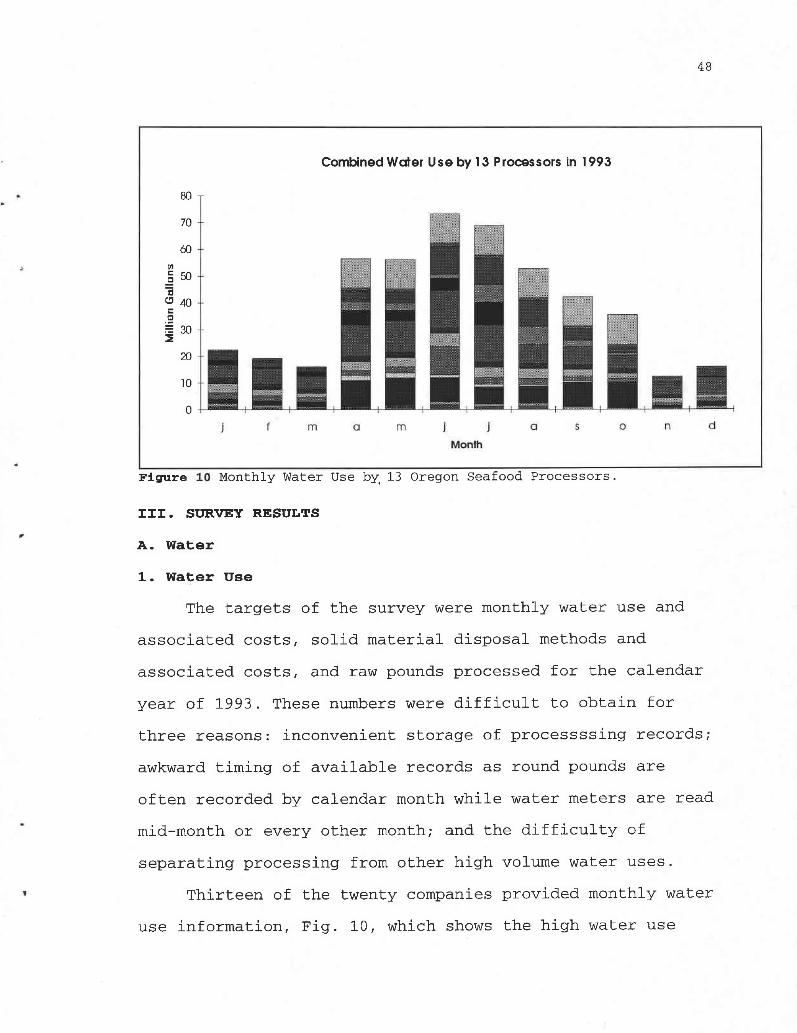
The targets of the survey were monthly water use and
associated costs, solid material disposal methods and
associated costs, and raw pounds processed for the calendar
year of 1993. These numbers were difficult to obtain for
three reasons: inconvenient storage of processssing records;
awkward timing of available records as round pounds are
often recorded by calendar month while water meters are read
mid-month or every other month; and the difficulty of
separating processing from other high volume water uses.
Thirteen of the twenty companies provided monthly water
use information, Fig. 10, which shows the high water use
49
during the surimi and shrimp seasons of April through
October. The highest monthly use by a single company was
over fourteen million gallons for the month of June for a
company which was processing bottomfish and shrimp during
the month. Seven companies reported usage over one million
gallons for each month of May through August, and four used
over one million gallons monthly year round.
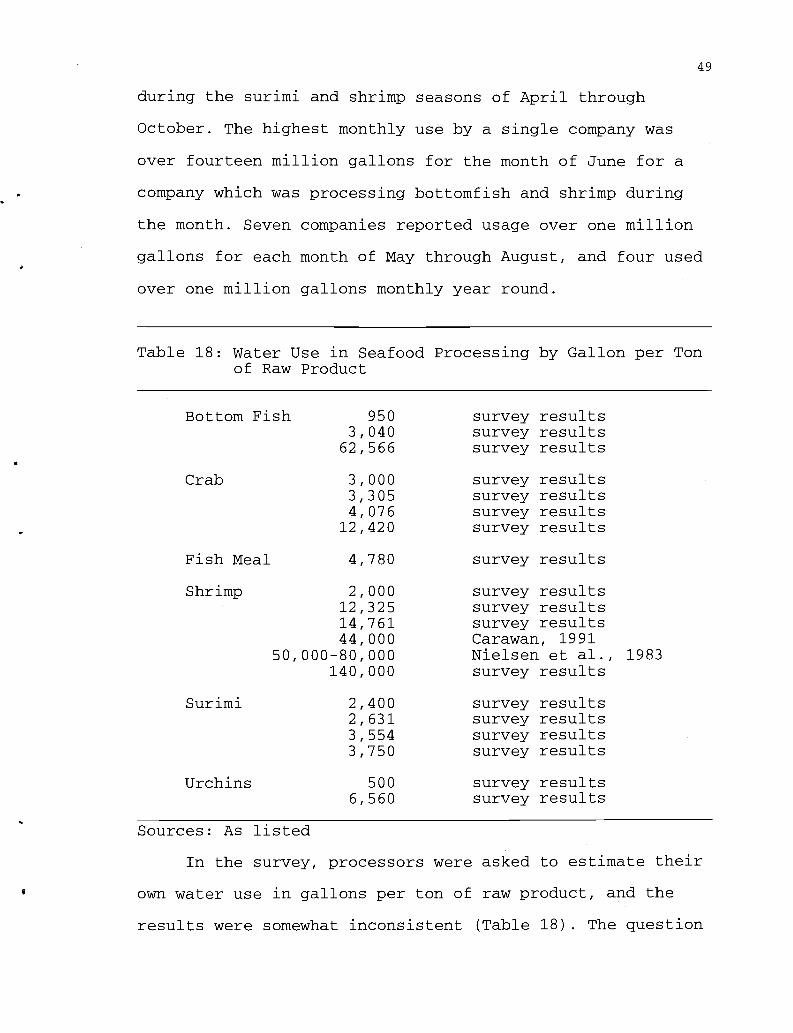
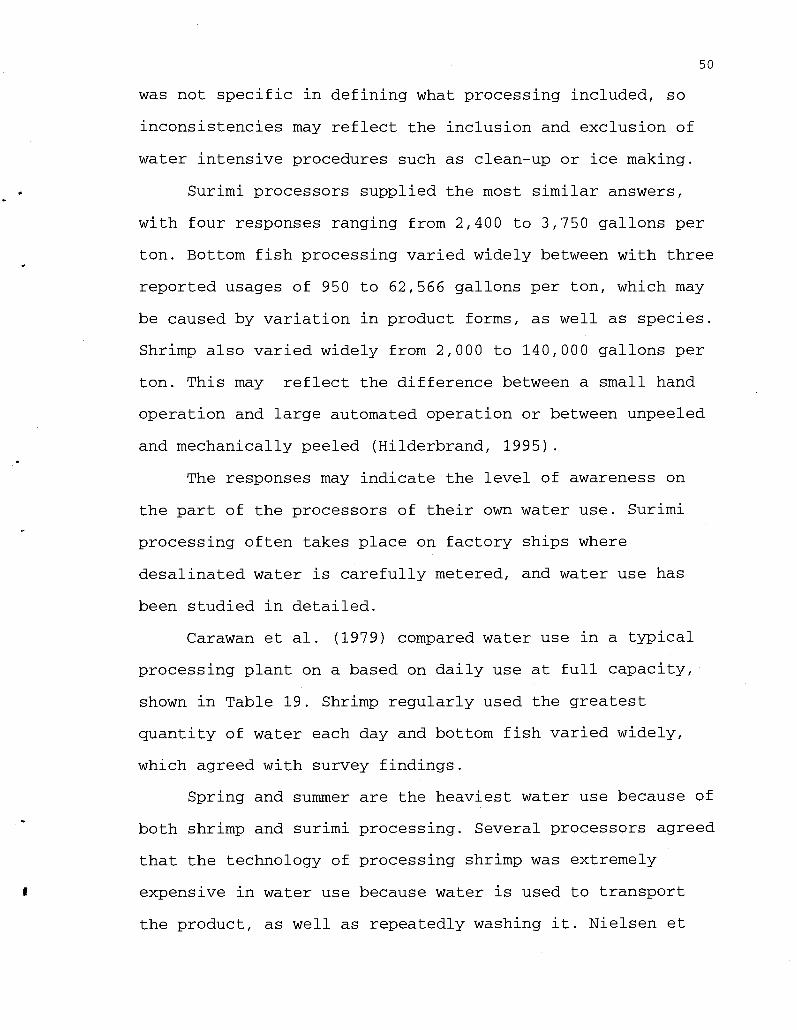
Table 18: Water Use in Seafood Processing by Gallon per Tonof Raw Product
Bottom Fish 950 survey results3,040 survey results62,566 survey results
Fish Meal 4,780 survey results
Crab 3,000 survey results3,305 survey results4,076 survey results
12,420 survey results
survey resultssurvey resultssurvey resultsCarawan, 1991Nielsen et al., 1983survey results
Shrimp
Surimi
2,00012,32514,76144,000
50,000-80,000140,000
2,4002,6313,5543,750
Urchins 500 survey results
Y
6,560
survey resultssurvey resultssurvey resultssurvey results
survey results
Sources: As listed
In the survey, processors were asked to estimate their
own water use in gallons per ton of raw product, and the
results were somewhat inconsistent (Table 18). The question
50
A
was not specific in defining what processing included, so
inconsistencies may reflect the inclusion and exclusion of
water intensive procedures such as clean-up or ice making.
Surimi processors supplied the most similar answers,
with four responses ranging from 2,400 to 3,750 gallons per
ton. Bottom fish processing varied widely between with three
reported usages of 950 to 62,566 gallons per ton, which may
be caused by variation in product forms, as well as species.
Shrimp also varied widely from 2,000 to 140,000 gallons per
ton. This may reflect the difference between a small hand
operation and large automated operation or between unpeeled
and mechanically peeled (Hilderbrand, 1995).
The responses may indicate the level of awareness on
the part of the processors of their own water use. Surimi
processing often takes place on factory ships where
desalinated water is carefully metered, and water use has
been studied in detailed.
Carawan et al. (1979) compared water use in a typical
processing plant on a based on daily use at full capacity,
shown in Table 19. Shrimp regularly used the greatest
quantity of water each day and bottom fish varied widely,
which agreed with survey findings.
Spring and summer are the heaviest water use because of
both shrimp and surimi processing. Several processors agreed
that the technology of processing shrimp was extremely
expensive in water use because water is used to transport
the product, as well as repeatedly washing it. Nielsen et
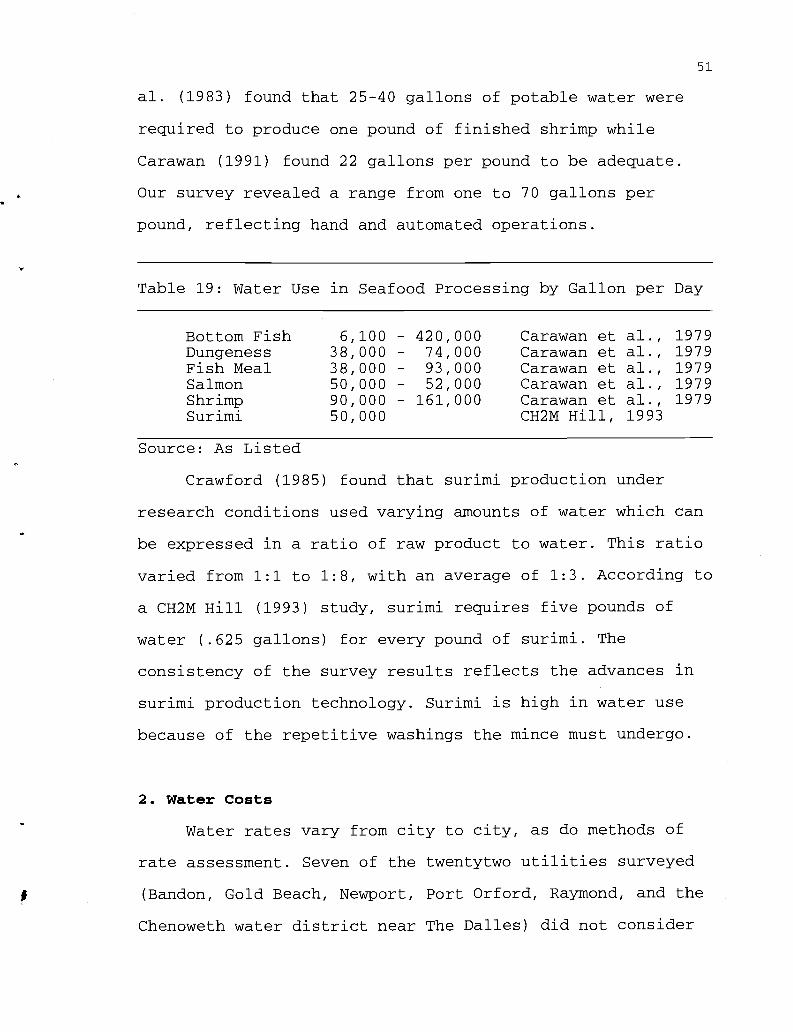
51
al. (1983) found that 25-40 gallons of potable water were
required to produce one pound of finished shrimp while
Carawan (1991) found 22 gallons per pound to be adequate.
Our survey revealed a range from one to 70 gallons per
pound, reflecting hand and automated operations.
Table 19: Water Use in Seafood Processing by Gallon per Day
Bottom Fish 6,100 - 420,000 Carawan et al., 1979Dungeness 38,000 - 74,000 Carawan et al., 1979Fish Meal 38,000 - 93,000 Carawan et al., 1979Salmon 50,000 - 52,000 Carawan et al., 1979Shrimp 90,000 - 161,000 Carawan et al., 1979Surimi 50,000 CH2M Hill, 1993
Source: As Listed
Crawford (1985) found that surimi production under
research conditions used varying amounts of water which can
be expressed in a ratio of raw product to water. This ratio
varied from 1:1 to 1:8, with an average of 1:3. According to
a CH2M Hill (1993) study, surimi requires five pounds of
water (.625 gallons) for every pound of surimi. The
consistency of the survey results reflects the advances in
surimi production technology. Surimi is high in water use
because of the repetitive washings the mince must undergo.
2. Water Costs
Water rates vary from city to city, as do methods of
rate assessment. Seven of the twentytwo utilities surveyed
(Bandon, Gold Beach, Newport, Port Orford, Raymond, and the
Chenoweth water district near The Dalles) did not consider
q
52
the size of the pipes leading into the plant, (water meter).
Charging by meter size is a method for charging for the
demand created by a heavy water user. Appendix D lists
details of rate structures of each of the utility companies
surveyed. The thirteen cities which charged according to
meter size varied in the cost, amount of water included in
the base rate, and the charge for water additional to that
included in the base. The range for a 2" meter was
$13.50/month in Clackamas, Oregon, to $111.93/month in
Ilwaco, Washington. The amount of water included in the
monthly base rate ranged from zero in Clackamas, Eureka,
Portland and Warrenton to 24,000 gallons per month in
Garibaldi. Charges for additional water beyond what is
included in the base charge range from $0.91 to $1.68 per
1000 gallons. All three numbers must be considered to create
a meaningful comparison from city to city.
Three hypothetical plants were created for comparison
purposes in Table 20: a plant with a 2" water meter using
500,000 gallons each month, a plant with a 3" meter using
1,000,000 gallons each month and a plant with a 4" meter
using 5,000,000 gallons per month. Water costs were
calculated for all twentytwo cities. Several cities have
separate rates for inside and outside city limits.
Water costs among cities ranged from $283.20 inside
Hammond city limits to $1507.50 in Netarts for a plant with
a two inch water meter using 500,000 gallons per month. The
plant with the three inch water meter using a million
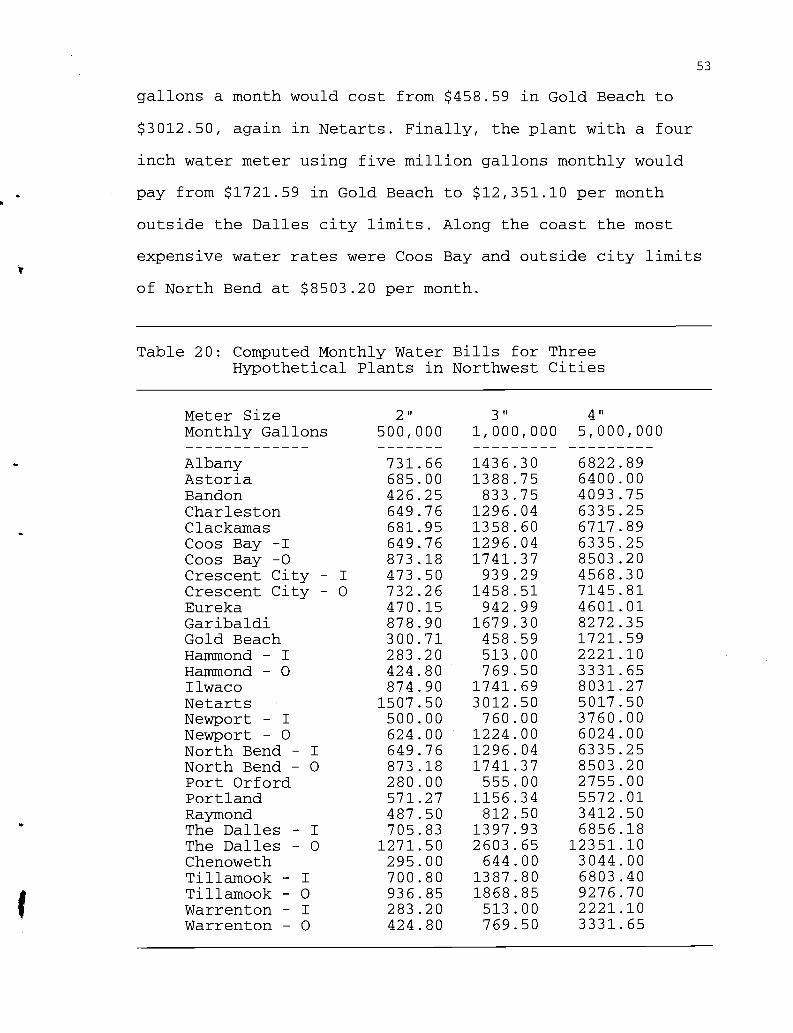
53
gallons a month would cost from $458.59 in Gold Beach to
$3012.50, again in Netarts. Finally, the plant with a four
inch water meter using five million gallons monthly would
pay from $1721.59 in Gold Beach
outside the Dalles city limits.
expensive water rates were Coos
to $12,351.10 per month
Along the coast the most
Bay and outside city limits
of North Bend at $8503.20 per month.
Table 20: Computed Monthly Water Bills for ThreeHypothetical Plants in Northwest Cities
Meter SizeMonthly Gallons
211
500,0003 11
1,000,000411
5,000,000
Albany 731.66 1436.30 6822.89Astoria 685.00 1388.75 6400.00Bandon 426.25 833.75 4093.75Charleston 649.76 1296.04 6335.25Clackamas 681.95 1358.60 6717.89Coos Bay -I 649.76 1296.04 6335.25Coos Bay -0 873.18 1741.37 8503.20Crescent City I 473.50 939.29 4568.30Crescent City 0 732.26 1458.51 7145.81Eureka 470.15 942.99 4601.01Garibaldi 878.90 1679.30 8272.35Gold Beach 300.71 458.59 1721.59Hammond - I 283.20 513.00 2221.10Hammond - 0 424.80 769.50 3331.65Ilwaco 874.90 1741.69 8031.27Netarts 1507.50 3012.50 5017.50Newport - I 500.00 760.00 3760.00Newport - 0 624.00 1224.00 6024.00North Bend - I 649.76 1296.04 6335.25North Bend - 0 873.18 1741.37 8503.20Port Orford 280.00 555.00 2755.00Portland 571.27 1156.34 5572.01Raymond 487.50 812.50 3412.50The Dalles - I 705.83 1397.93 6856.18The Dalles - 0 1271.50 2603.65 12351.10Chenoweth 295.00 644.00 3044.00Tillamook - I 700.80 1387.80 6803.40Tillamook - 0 936.85 1868.85 9276.70Warrenton - I 283.20 513.00 2221.10Warrenton - 0 424.80 769.50 3331.65
-
-
54
The rate differences do not reflect the substantial
discounts often available to new businesses. In Astoria, new
businesses are eligible for the "enterprize zone" discount
of a flat 30% subtracted from the business license and
utility bills for the first three years of business. The
purpose of this discount is to attract new business. Astoria
also has a "commercial credit" program for any business with
a bimonthly consumption of greater than 150,000 gallons.
This program will reduce the metered water amount by 10,000
gallons for every employee listed on the business license,
encouraging local employment.
B. Wastewater
1. Sewer Use
Of the twenty respondents, eleven discharged wastewater
directly into the bay, river or estuary, four discharged
into a municipal sewer system and five did not provide this
information. It is a financial advantage to avoid discharge
into sewers, but some processors have no choice. In the
Northwest, coastal processors may discharge into a river or
estuary as long as the water movement adequately dissipates
the contents of the wastewater, but the definition of
"adequate" varies among states, counties and cities.
The extremely high BOD rate of surimi wash water
creates a special challenge to pollock and Pacific whiting
processors. One Oregon surimi plant installed an elaborate
and expensive dissolved air flotation (DAF) treatment
55
facility to reduce BOD levels before discharging the
wastewater. A second surimi producer holds the wash water in
tanks for use in agricultural applications. Researchers are
looking at recovery of the useful proteins before disposing
of the water. Pedersen (1990) describes protein recovery of
80% of the solids in pollock processing using membrane
filtration methods. Whole pollock proteins are 89% of the
solids and unfiltered process water is 66% of the solids.
2. Sewer Costs
A survey of 22 Pacific Northwest municipal sanitary
districts reveals widely varying rates. Crescent City and
Albany have special rates for seafood processors which
include BOD and TSS levels in the effluent (Table 21) along
with daily usage rates, with Albany rates considerably
higher. The City of Newport also charges plants with high
BOD levels at a rate of 21 cents per thousand gallons.
Clackamas, Gold Beach and The Dalles charge on equivalency
systems, with base rates of $14.75, $12.50 and $16.25/month
for a basic unit. These units are roughly defined as single
family dwelling, and are computed for other customers
according to the number of employees or beds or seating. The
Gold Beach Water District defines a unit as approximately
7000 gallons per month of effluent. Ilwaco has a similar
scheme by charging $18.00/month for a 3/4" meter (the size
in a normal residence), with larger meters costing
proportional amounts.
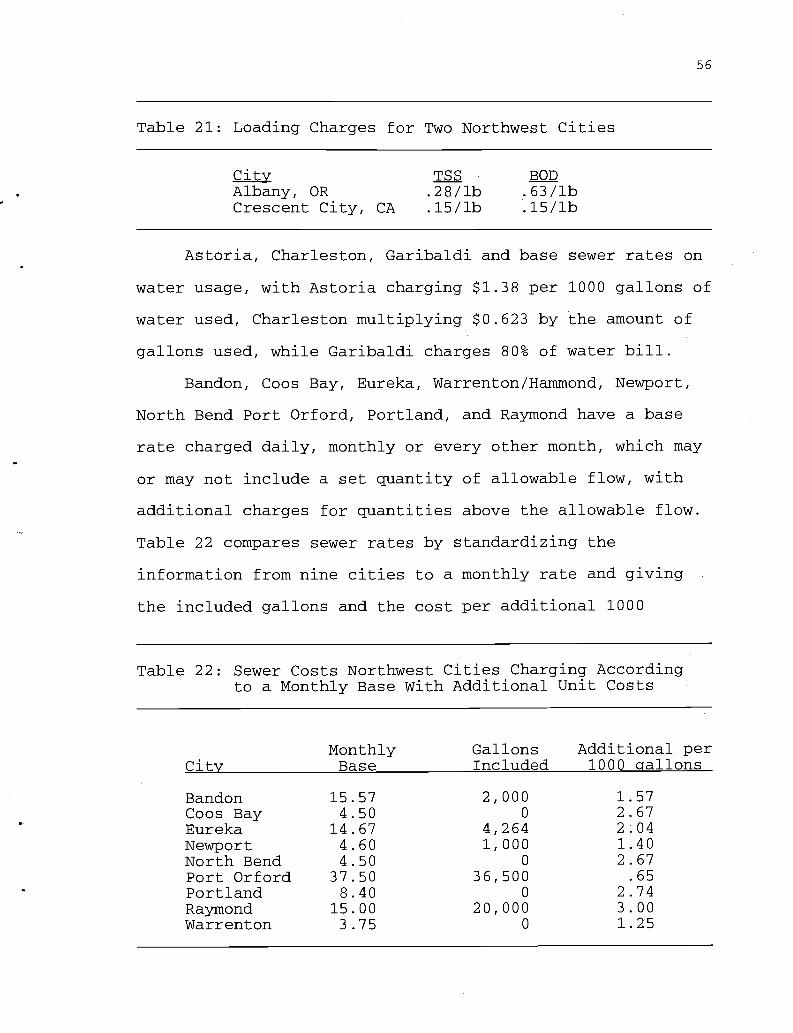
56
Table 21: Loading Charges for Two Northwest Cities
City TSS BODAlbany, OR .28/lb .63/lbCrescent City, CA .15/lb .15/lb
Astoria, Charleston, Garibaldi and base sewer rates on
water usage, with Astoria charging $1.38 per 1000 gallons of
water used, Charleston multiplying $0.623 by the amount of
gallons used, while Garibaldi charges 80% of water bill.
Bandon, Coos Bay, Eureka, Warrenton/Hammond, Newport,
North Bend Port Orford, Portland, and Raymond have a base
rate charged daily, monthly or every other month, which may
or may not include a set quantity of allowable flow, with
additional charges for quantities above the allowable flow.
Table 22 compares sewer rates by standardizing the
information from nine cities to a monthly rate and giving
the included gallons and the cost per additional 1000
Table 22: Sewer Costs Northwest Cities Charging Accordingto a Monthly Base With Additional Unit Costs
CityMonthly
BaseGallonsIncluded
Additional per1000 gallons
Bandon 15.57 2,000 1.57Coos Bay 4.50 0 2.67Eureka 14.67 4,264 2.04Newport 4.60 1,000 1.40North Bend 4.50 0 2.67Port Orford 37.50 36,500 .65Portland 8.40 0 2.74Raymond 15.00 20,000 3.00Warrenton 3.75 0 1.25

57
gallons. There is a costly disadvantage of being unable to
discharge processing water wastes directly into a waterway.
C. Solid Byproducts
Seafood processors have learned to be efficient with
their solid byproducts. Of the twenty processors who
supplied information (Table 23) on disposal of carcasses and
shells, only two hauled any byproducts to the land fill, one
taking only 5% of their solid materials. The two most
popular methods of disposal were recovery either in fish
meal production or agricultural use (both direct field
application and composting).
Four recovery plants were contacted: Pronova,
Incorporated in Raymond, Washington; The Arctic Alaska fish
meal plant, in Newport; Bioproducts in Warrenton; and
Protein Recovery in Hammond. Pronova manufactures chitosan
out of chitin extracted from shrimp and crab shells. The
company processes five to ten million pounds of shells each
year and will pick up raw materials within a sixty mile
radius of their Raymond, Washington plant. While the
processing uses approximately 50,000 gallons of fresh water
each day, the water is recycled in several of the
operations. The processing wastewater from the chitin
extraction contains high levels of protein and calcium and
is treated in a biological treatment plant. Shrimp shells
are preferred over crab shells because of the lower BOD
levels. Pronova spends nearly $1000.00 each month to monitor
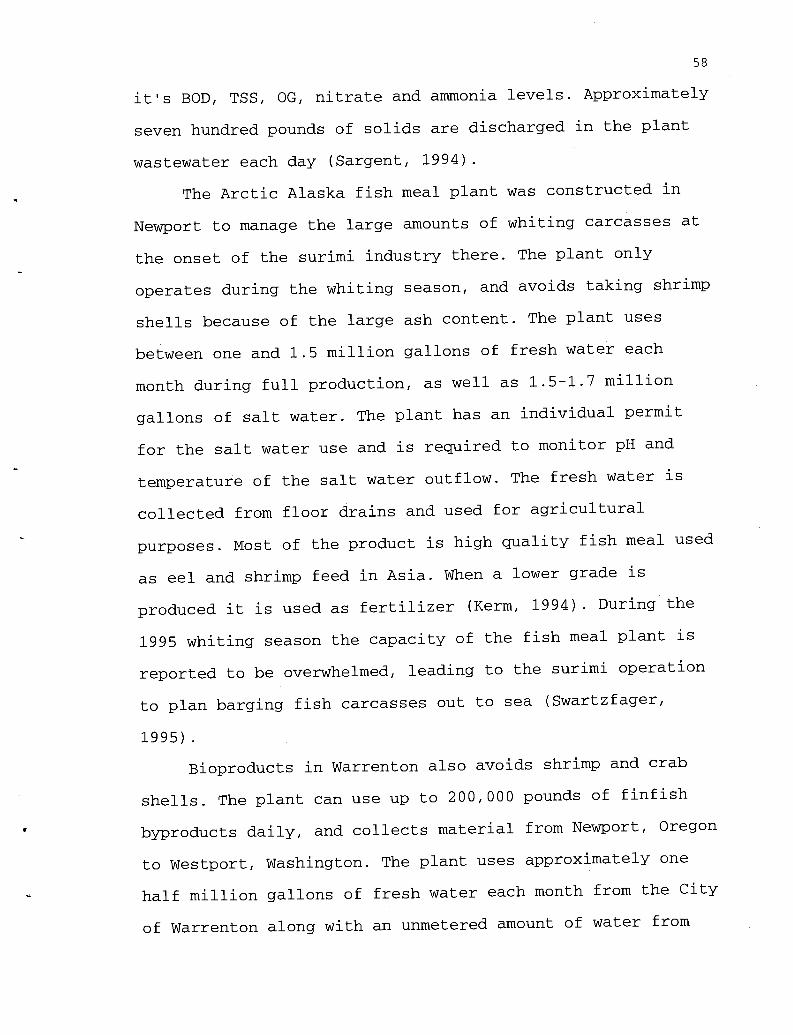
58
it's BOD, TSS, OG, nitrate and ammonia levels. Approximately
seven hundred pounds of solids are discharged in the plant
wastewater each day (Sargent, 1994).
The Arctic Alaska fish meal plant was constructed in
Newport to manage the large amounts of whiting carcasses at
the onset of the surimi industry there. The plant only
operates during the whiting season, and avoids taking shrimp
shells because of the large ash content. The plant uses
between one and 1.5 million gallons of fresh water each
month during full production, as well as 1.5-1.7 million
gallons of salt water. The plant has an individual permit
for the salt water use and is required to monitor pH and
temperature of the salt water outflow. The fresh water is
collected from floor drains and used for agricultural
purposes. Most of the product is high quality fish meal used
as eel and shrimp feed in Asia. When a lower grade is
produced it is used as fertilizer (Kerm, 1994). During the
1995 whiting season the capacity of the fish meal plant is
reported to be overwhelmed, leading to the surimi operation
to plan barging fish carcasses out to sea (Swartzfager,
1995).
Bioproducts in Warrenton also avoids shrimp and crab
shells. The plant can use up to 200,000 pounds of finfish
byproducts daily, and collects material from Newport, Oregon
to Westport, Washington. The plant uses approximately one
half million gallons of fresh water each month from the City
of Warrenton along with an unmetered amount of water from
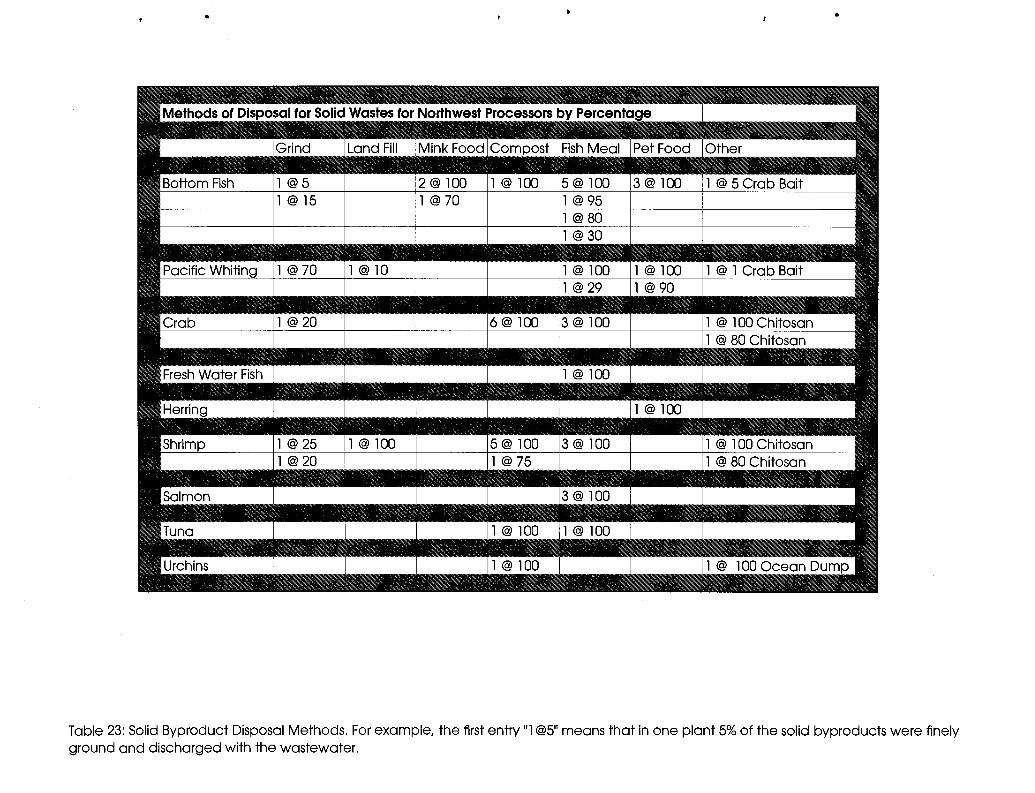
I Methods of Disposal for Solid Wastes for Northwest Processors by Percentage
Grind Land Fill Mink Food, Compost Fish Meal Pet Food
Bottom Fish 1 @ 5 2@ 100 1 @ 100 5 @ 100 3 @ 100 "1 @ 5 Crab Bait1@15 1@70 1@95
1 @801 @30
[Pacific Whiting 1@70 1 1@10 1 1 @ 100 1 @ 1 Crab Bait1@29 I 1@90
Crab 1 @ 20 6@ 100 3 @ 100 1 @ 100 Chitosan1 @ 80 Chitosan
Fresh Water Fish 1@100
Lerrina 1 @ 100
- -Shrimp 1 @ 25 1 @ 100 5@ 100 77100 1 @100 Chitosan1 @ 20 1 @ 75 1 @ 80 Chitosan
Salmon 3 @ 100
L'Tuna 1@100 1@100
Urchins I 1 @ 1,00 1 11 @ 100 Ocean Dump
Table 23: Solid Byproduct Disposal Methods. For example, the first entry "1 @5" means that in one plant 5% of the solid byproducts were finelyground and discharged with the wastewater.
Other
60
the Columbia River. Bioproducts produces a condensed fish
protein used as a base for fish meal (Humphreys, 1994).
A new plant in Hammond, Oregon is Protein Recovery,
Incorporated, a fish protein hydrolysis plant. This plant
uses 100-200 tons of byproducts daily, which is treated with
a naturally occurring enzyme to convert fish flesh to a
liquid emulsion. This emulsion is either dried and used in
agricultural and aquacultural applications or acidified and
sold as organic fertilizer. The plant currently uses finfish
byproducts because of the ease of transport of the liquid
gurry, but is investigating the potential for using shrimp
and crab shells (Ludlow, 1995).
Most of the shells from shrimp, crab and urchins are
composted, which encompasses both the careful biological
breakdown through a process of oxygenating and heating or
simply applying the byproducts to a field to decompose
without the benefit of aeration (Hilderbrand, 1995). Of the
twelve shrimp processors, five disposed of the shells only
by composting, three took all their shells to a fish meal
plant, and one took all the shells to the chitosan plant and
another took all the shells to the landfill. The other two
reported combinations: one plant composts 75% of the shells
and grinds the rest into their wastewater while the other
grinds up 80% of the shells with the remaining going to the
chitosan plant.
Of the eleven crab processors, six composted all the
crab shells, three hauled the shells to a fish meal plant,
61
one processor sent all the crab shells to the chitosan plant
and one sent 80% to the chitosan plant and ground the other
20% into wastewater. Of the two urchin processors, one
composted all byproducts while the other hauled the shells
to dump at sea.
The cost of disposal of shrimp, crab and urchin shells
varies between processors; some farmers and reducing plants
will pick up the byproducts, while other processors need to
deliver their materials to a receiving facility. Shell
disposal is generally a barter arrangement where the
processor is able to dispose of the material and farmers are
able to fertilize their fields at minimal cost to either
party.
The preferred use for fish carcasses is pet and mink
feed, because these are the most profitable. Two respondents
use all their bottom fish carcasses for mink feed while a
third uses 70% for mink feed and 30% goes to fish meal. The
mink feed alternative is decreasing with the decline of the
mink industry. Some fish (including hake and pollock) are
unacceptable as mink food because they have a high level of
thiaminase which can result in loss of hair (Spencer, 1994).
Cooking the carcasses will deactivate thiaminase, but adds
cost to the processor and ignores the mink preference for
raw fish (Gnaedinger & Krzeczkowski, 1966; Greig &
Gnaedinger, 1971).
Of the twenty five responses for all finfish
processing, eleven plants used 100% of their finfish
-6 2
carcasses to produce fish meal, while another four took some
portion to the fish meal plant. Five plants used 100% of
their finfish byproducts for pet food, while another used
90% for pet food and took the rest to the land fill. Two
respondents used a small portion of finfish carcasses for
crab bait.
IV. SUMMARY
We can make several assumptions about water consumption
and waste discharge in the seafood processing industry.
First, water will increase in cost, and as weather patterns
change, availability of water may be a limiting factor to
seafood processors. Second, regulation of effluent discharge
into water bodies will grow more restrictive. Growing
populations will compete with industry for use and impact on
rivers and estuaries. Increasing ecological awareness will
continue to limit impacts of human activities on water
bodies. Third, wastewater treatment rates will continue to
increase and become less available as growing populations
require more of the treatment capabilities. Fourth, the
seafood industry is extremely dependent on water for various
phases of processing. Finally, dwindling resources will
increase the value of the entire catch increasing byproduct
profitability. The areas seafood processors control in the
above is their water consumption, waste production, and
disposal methods, therefore it is vital to the continued
existence of each processor to reconsider all three.
63
The goal of this survey was to collect information
about seafood processing plants concerning their water use,
waste disposal methods and associated costs. While no direct
correlation could be drawn between product form, water use
and waste amounts, some general trends are evident.
Shrimp production uses the greatest amount of water
among North Pacific seafood, and there is potential for
recycle and reuse of water. East Coast shrimp processors
have successfully installed recycling equipment and
substantially reduced the required amount of processing
water. Northwest shrimp processors have met difficulties in
their attempts to recycle shrimp water but should reconsider
the usefulness of recycling and make further attempts.
Shrimp and crab processing waste has potential for further
processing as fish meal, fertilizer, chitosan and animal
feeds.
Surimi production is second highest water consumption
and is highest in wastewater strength, both of which have
potential for reduction. Recovery of proteins in the wash
water, either by membrane filtration or chemical methods can
add to the quality of the final product while reducing
wastewater loading. As wastewater treatment plants increase
charges and regulatory agencies permit less loading in
effluent discharges, protein recovery will grow in value.
Solid finfish wastes can be used for crab bait, fertilizer
and high quality fish meal. All processing areas have
potential for cutting costs through careful water use.
64
Processors in California, Oregon and Washington are
concentrating on transforming processing "wastes" into
profitable products. Research into recovering byproducts
continues to reflect the great value of the components.
Disposal is not a logical option for solid waste disposal,
and with some effort all seafood processing wastes can be
put to further use. Creative options for waste disposal
exist, but further research is needed to make these options
cost efficient on an industry scale. Further study of the
composition of seafood wastes should show the existence of
an impressive resource and agencies such as the
Developmental Fisheries Board should consider not only new
species for exploitation, but full utilization of each
currently exploited species.
Utility costs varied widely between communities and
seafood processors will need to carefully consider these
costs when planning future investments. Further
investigation into the reasons for these variations may
reveal useful information.
Another area worth investigating before investing
in a seafood processing plant are the regulatory agencies
involved in wastewater discharge. The Alaska regulations
favor new industry with the most lenient discharge
requirements combined with the availability of a general
permit at a low price. Oregon also has a general permit
available and the DEQ has demonstrated it's willingness to
work closely with the seafood industry. Washington and
65
California have firmer restrictions than Alaska and Oregon,
and seafood processors in both states have expressed
frustration with the lack of responsiveness from agencies in
those states.
This survey was met with enthusiasm from industry
members, and participants were interested in results and
suggestions for cost cutting methods of water use and waste
disposal. Useful information could be gleaned from
comparisons of surveys such as this over a period of years
on a regular basis.
Whether the future of the seafood industry will be
decline, steady-state, or growth, wastes will increase in
importance as fish stocks dwindle and waste disposal becomes
more prohibitive. The traditional processing focus has been
mainstream products, and profit has been directly
proportional to the amounts processed. Researchers have
produced creative solutions to waste recovery problems and
should now focus on making these techniques cost-efficient
and thereby useful to industry. Processors should reconsider
their raw materials; technology is available to transform
waste products into profitable secondary products.
66
References:
Abazinge, M.D.; Fontenot, J.P.; Allen, V.G.; & Flick, G.J.1993. Ensiling Characteristics of Crab Waste and WheatStraw Treated With Different Additives. Journal ofAgricultural and Food Chemistry, 41:4
Arason, S.; Thoroddsson, G.; & Valdimarsson, G. 1990. TheProduction of Silage from Waste and Industrial Fish:The Icelandic Experience. in Making Profits fromSeafood Waste; Proceedings of the InternationalConference on Fish By-Products, Keller, S., editor,Anchorage
Boisvert, J. Sales Manager, Pacific Coast Seafood Company,1994 Warrenton, OR. Personal Communication.
Bragg, J. 1992. Crabbers Unite as Limited Entry Looms.Pacific Fishing, 13:1.
Brinton, W.F. 1990. Composting Seafood Processing By-Products: Solutions for The 90s. in Making Profits fromSeafood Waste; Proceedings of the InternationalConference on Fish By-Products, Keller, S., editor,Anchorage.
Bruce, B. 1994. Are Climate Changes Affecting Fisheries? TheOregon Scientist, 7:2.
Carawan, R.E., Chambers, J.V., Zal, R.R. & Wilkowske, R.H.1979. Seafood Water and Wastewater Management. NorthCarolina State University Extension Special Report No.AM-18F.
Carawan, R.E. 1991. Processing Plant Waste ManagementGuidelines for Aquatic Fishery Products in Proceedingsof the National Fisheries Institute National Conferenceon Seafood Waste Issues.
Carroll, D. 1995. Department of Animal Sciences, OregonState University. Personal Communication.
Claggett, F.G. & Wong, J. 1974. Treatment of Fish ProcessingPlant Wastewater. Bulletin 189 of the FisheriesResearch Board of Canada. Ottawa.
CH2M Hill, 1992. Environmental Management Issues Affectingthe Seafood Processing Industry, report prepared forPacific Power and Light Company.
CH2M Hill, 1993. Review of Environmental Management Optionsat Inland Quick Freeze, Albany, Oregon, report preparedfor Pacific Power and Light Company.
67
Childers, R.K. 1994. Prevalence, Geographic Distribution andBiology of a Dungeness Crab, Cancer maaister,Microsporidian Parasite. Master's Thesis, Department ofFisheries and Wildlife, College of Agriculture, OregonState University.
Crawford, D.L. 1985. Engineering and Technological ProblemsFacing New Products. in Underutilized Species andSeafood By-Products, Yuska & Ridlington, editors.
Crawford, D.L. & McNeil, W.J. 1990. Processing GroundfishCarcass Waste into Fish Feed OSU Seafood Lab Report,Astoria, OR.
Crapo, C. 1988. Final Report on the Characterization ofAlaska Seafood Wastes. University of Alaska, FisheryIndustrial Technology Center, Anchorage.
Crapo, C.; Paust, B.; & Babbitt, J. 1988. Recoveries andYields from Pacific Fish and Shellfish. Alaska SeaGrant Marine Advisory Bulletin No. 37.
CRWQCB 90-166, 1990. California Regional Water QualityControl Board North Coast Region Order No. 90-166 NPDESPermit No. CA0023761. Humboldt County.
CRWQCB 94-61, 1994. California Regional Water QualityControl Board North Coast Region Order No. 94-61 NPDESPermit No. CA0022756 Del Norte County.
DEQ, 1992. Oregon Department of Environmental Quality. NPDESPermit No. 0900-J.
DLCD, 1993. Oregon Department of Land Conservation andDevelopment. Oregon's Statewide Planning Goals, 1993Edition.
EPA Region 10, 1994. U.S. Environmental Protection Agency.Draft NPDES Permit No. AK-G52-0000; Authorization toDischarge Under the National Pollutant DischargeElimination System for Seafood Processors in Alaska.
Evers, D.J. 1995 Transforming Shrimp and Crab Waste IntoDairy Heifer Feed. Master's Thesis, Department ofAnimal Science, College of Agriculture, Oregon StateUniversity.
Evers, D.J. & Carroll, D.J. 1995. Preservation of Crab orShrimp Waste as Silage for Cattle. Submitted to AnimalFeed Science and Technology.
Freeman, K. 1992. Wastewater Woes: Processors Are Having ToClean Up Their Act. Seafood Supplier. 11:7.
68
Garr, E. 1995. The Elusive Balance; Application of theEndangered Species Act. Lecture in Oregon StateUniversity Fisheries and Wildlife Symposium.
Gates, K.W. 1991. Waste Reduction, Water Conservation, andRecovery of Seafood By-Products. Marine TechnologicalSociety Journal, 25:1.
Gentle, T. 1993. A Bad Taste; Scientists at OSU's CoastalExperiment Station Have Discovered a Threat to the BayCrabs Oregonians Love to Catch. Oregon's AgriculturalProgress, 40:1/2.
Goldhor, S.H. & Koppernaes, J.D. 1993. A Seafood Processor'sGuide to Water Management. New England FisheriesDevelopment Association, Boston, MA.
Goldhor, S.H.; Curren, R.A. & Regenstein, J.M. 1989. CurrentSeafood Processing Waste Utilization Options as aFunction of Scale Raw Material Production. AtlanticFisheries Technological Conference and SeafoodBiotechnology Workshop St. John's, Newfoundland.
Goldhor, S.H.; Curren, R.A.; Solstad, 0.; Levin, R.E.; &Nichols, D. 1990. Hydrolysis and Fermentation ofFishery By-Products: Costs and Benefits of SomeProcessing Variables. in Making Profits from SeafoodWaste; Proceedings of the International Conference onFish By-Products, Keller, S., editor, Anchorage.
Gnaedinger, R.H. & Krzeczkowski, R.A. 1966. HeatInactivation of Thiaminase in Whole Fish. CommercialFisheries Review. 28:8.
Greig, R.A. & Gnaedinger, R.H. 1971. Occurrence ofThiaminase in Some Common Aquatic Animals in the UnitedStates and Canada. National Marine Fisheries ServiceSpecial Scientific Report - Fisheries No. 631, Seattle.
Grulich, P.R. & DuPaul, W.D. 1984. Feasibility of Crab MealProcessing in the Chesapeake Bay Region: An IntegratedEconomic Analysis for Hampton/Newport News, Virginia.Special Report on Applied Marine Science and OceanEngineering No. 273, Virginia Institute of MarineScience.
Haney, V.J. 1990. What Do I Need To Know About Getting APermit To Discharge Seafood Processing Wastes inAlaska? in Making Profits from Seafood Waste;Proceedings of the International Conference on Fish By-Products, Keller, S., editor, Anchorage.
Heater, D. 1994. Operations Manager Bornstein Seafoods,Astoria, OR, Personal Communications.
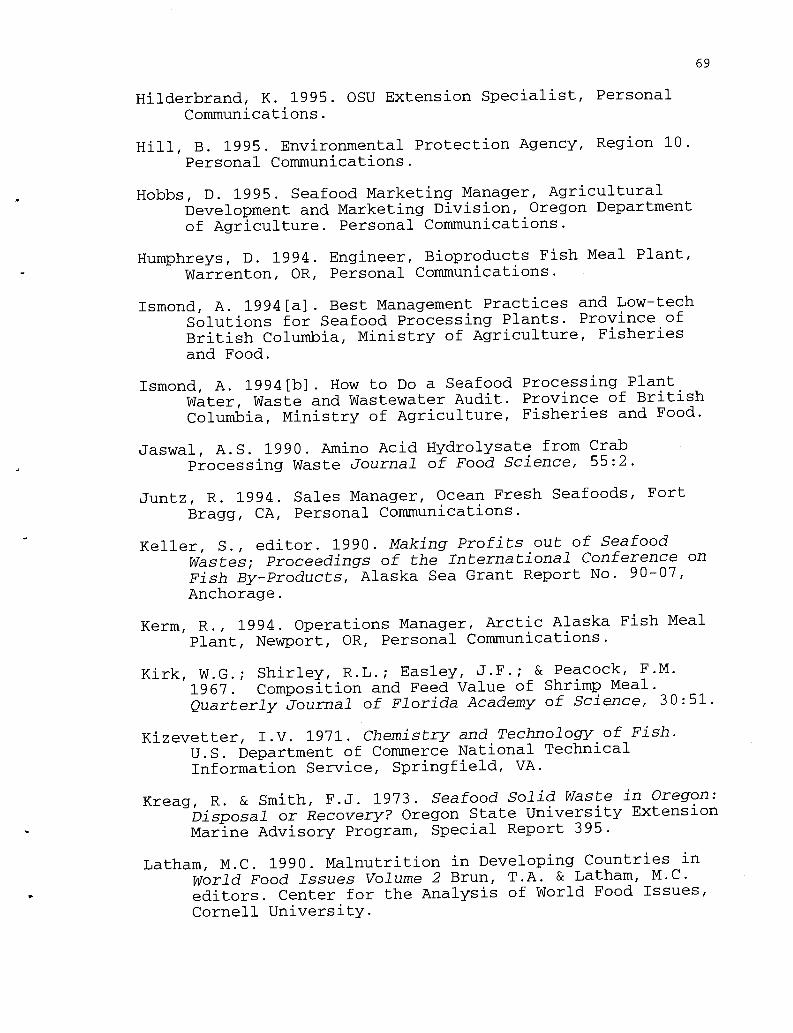
69
Hilderbrand, K. 1995. OSU Extension Specialist, PersonalCommunications.
Hill, B. 1995. Environmental Protection Agency, Region 10.Personal Communications.
Hobbs, D. 1995. Seafood Marketing Manager, AgriculturalDevelopment and Marketing Division, Oregon Departmentof Agriculture. Personal Communications.
Humphreys, D. 1994. Engineer, Bioproducts Fish Meal Plant,Warrenton, OR, Personal Communications.
Ismond, A. 1994[a]. Best Management Practices and Low-techSolutions for Seafood Processing Plants. Province ofBritish Columbia, Ministry of Agriculture, Fisheriesand Food.
Ismond, A. 1994[b]. How to Do a Seafood Processing PlantWater, Waste and Wastewater Audit. Province of BritishColumbia, Ministry of Agriculture, Fisheries and Food.
Jaswal, A.S. 1990. Amino Acid Hydrolysate from CrabProcessing Waste Journal of Food Science, 55:2.
Juntz, R. 1994. Sales Manager, Ocean Fresh Seafoods, FortBragg, CA, Personal Communications.
Keller, S., editor. 1990. Making Profits out of SeafoodWastes; Proceedings of the International Conference onFish By-Products, Alaska Sea Grant Report No. 90-07,Anchorage.
Kerm, R., 1994. Operations Manager, Arctic Alaska Fish MealPlant, Newport, OR, Personal Communications.
Kirk, W.G.; Shirley, R.L.; Easley, J.F.; & Peacock, F.M.
1967. Composition and Feed Value of Shrimp Meal.Quarterly Journal of Florida Academy of Science, 30:51.
Kizevetter, I.V. 1971. Chemistry and Technology of Fish.U.S. Department of Commerce National TechnicalInformation Service, Springfield, VA.
Kreag, R. & Smith, F.J. 1973. Seafood Solid Waste in Oregon:Disposal or Recovery? Oregon State University ExtensionMarine Advisory Program, Special Report 395.
Latham, M.C. 1990. Malnutrition in Developing Countries inWorld Food Issues Volume 2 Brun, T.A. & Latham, M.C.editors. Center for the Analysis of World Food Issues,Cornell University.
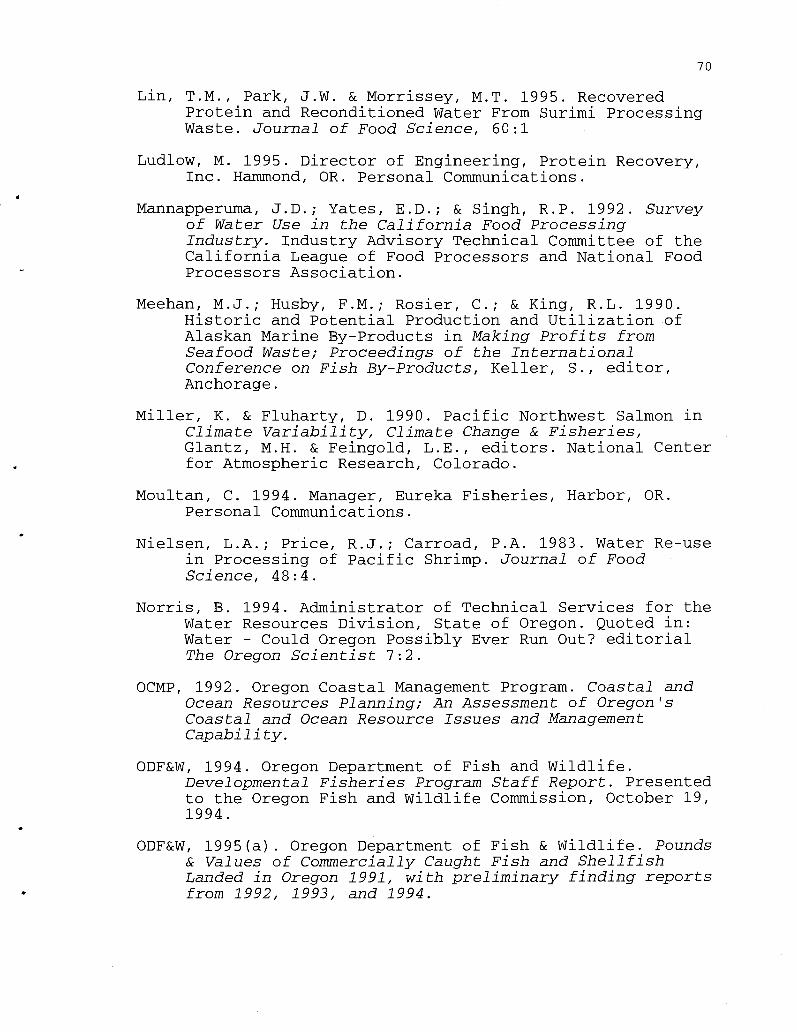
70
Lin, T.M., Park, J.W. & Morrissey, M.T. 1995. RecoveredProtein and Reconditioned Water From Surimi ProcessingWaste. Journal of Food Science, 60:1
Ludlow, M. 1995. Director of Engineering, Protein Recovery,Inc. Hammond, OR. Personal Communications.
Mannapperuma, J.D.; Yates, E.D.; & Singh, R.P. 1992. Surveyof Water Use in the California Food ProcessingIndustry. Industry Advisory Technical Committee of theCalifornia League of Food Processors and National FoodProcessors Association.
Meehan, M.J.; Husby, F.M.; Rosier, C.; & King, R.L. 1990.Historic and Potential Production and Utilization ofAlaskan Marine By-Products in Making Profits fromSeafood Waste; Proceedings of the InternationalConference on Fish By-Products, Keller, S., editor,Anchorage.
Miller, K. & Fluharty, D. 1990. Pacific Northwest Salmon inClimate Variability, Climate Change & Fisheries,Glantz, M.H. & Feingold, L.E., editors. National Centerfor Atmospheric Research, Colorado.
Moultan, C. 1994. Manager, Eureka Fisheries, Harbor, OR.Personal Communications.
Nielsen, L.A.; Price, R.J.; Carroad, P.A. 1983. Water Re-usein Processing of Pacific Shrimp. Journal of FoodScience, 48:4.
Norris, B. 1994. Administrator of Technical Services for theWater Resources Division, State of Oregon. Quoted in:Water - Could Oregon Possibly Ever Run Out? editorialThe Oregon Scientist 7:2.
OCMP, 1992. Oregon Coastal Management Program. Coastal andOcean Resources Planning; An Assessment of Oregon'sCoastal and Ocean Resource Issues and ManagementCapability.
ODF&W, 1994. Oregon Department of Fish and Wildlife.Developmental Fisheries Program Staff Report. Presentedto the Oregon Fish and Wildlife Commission, October 19,1994.
ODF&W, 1995(a). Oregon Department of Fish & Wildlife. Pounds& Values of Commercially Caught Fish and ShellfishLanded in Oregon 1991, with preliminary finding reportsfrom 1992, 1993, and 1994.
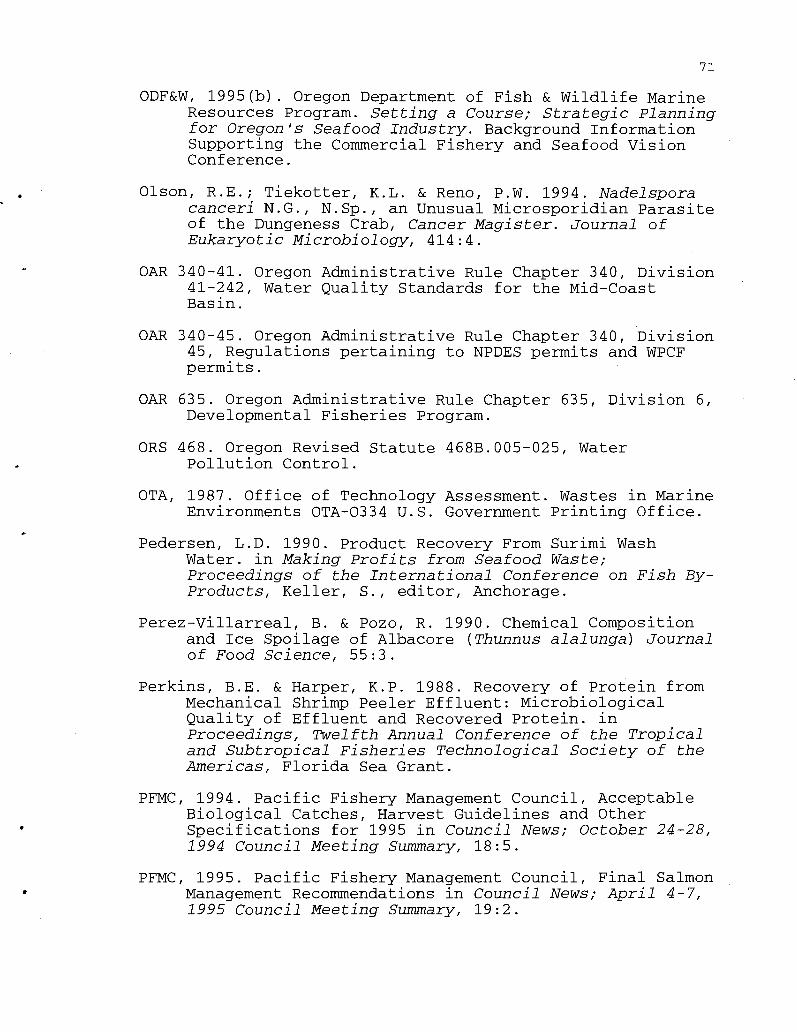
71
ODF&W, 1995(b). Oregon Department of Fish & Wildlife MarineResources Program. Setting a Course; Strategic Planningfor Oregon's Seafood Industry. Background InformationSupporting the Commercial Fishery and Seafood VisionConference.
Olson, R.E.; Tiekotter, K.L. & Reno, P.W. 1994. Nadelsporacanceri N.G., N.Sp., an Unusual Microsporidian Parasiteof the Dungeness Crab, Cancer Magister. Journal ofEukaryotic Microbiology, 414:4.
OAR 340-41. Oregon Administrative Rule Chapter 340, Division41-242, Water Quality Standards for the Mid-CoastBasin.
OAR 340-45. Oregon Administrative Rule Chapter 340, Division45, Regulations pertaining to NPDES permits and WPCFpermits.
OAR 635. Oregon Administrative Rule Chapter 635, Division 6,Developmental Fisheries Program.
ORS 468. Oregon Revised Statute 468B.005-025, WaterPollution Control.
OTA, 1987. Office of Technology Assessment. Wastes in MarineEnvironments OTA-0334 U.S. Government Printing Office.
Pedersen, L.D. 1990. Product Recovery From Surimi WashWater. in Making Profits from Seafood Waste;Proceedings of the International Conference on Fish By-Products, Keller, S., editor, Anchorage.
Perez-Villarreal, B. & Pozo, R. 1990. Chemical Compositionand Ice Spoilage of Albacore (Thunnus alalunga) Journalof Food Science, 55:3.
Perkins, B.E. & Harper, K.P. 1988. Recovery of Protein fromMechanical Shrimp Peeler Effluent: MicrobiologicalQuality of Effluent and Recovered Protein. inProceedings, Twelfth Annual Conference of the Tropicaland Subtropical Fisheries Technological Society of theAmericas, Florida Sea Grant.
PFMC, 1994. Pacific Fishery Management Council, AcceptableBiological Catches, Harvest Guidelines and OtherSpecifications for 1995 in Council News; October 24-28,1994 Council Meeting Summary, 18:5.
PFMC, 1995. Pacific Fishery Management Council, Final SalmonManagement Recommendations in Council News; April 4-7,1995 Council Meeting Summary, 19:2.
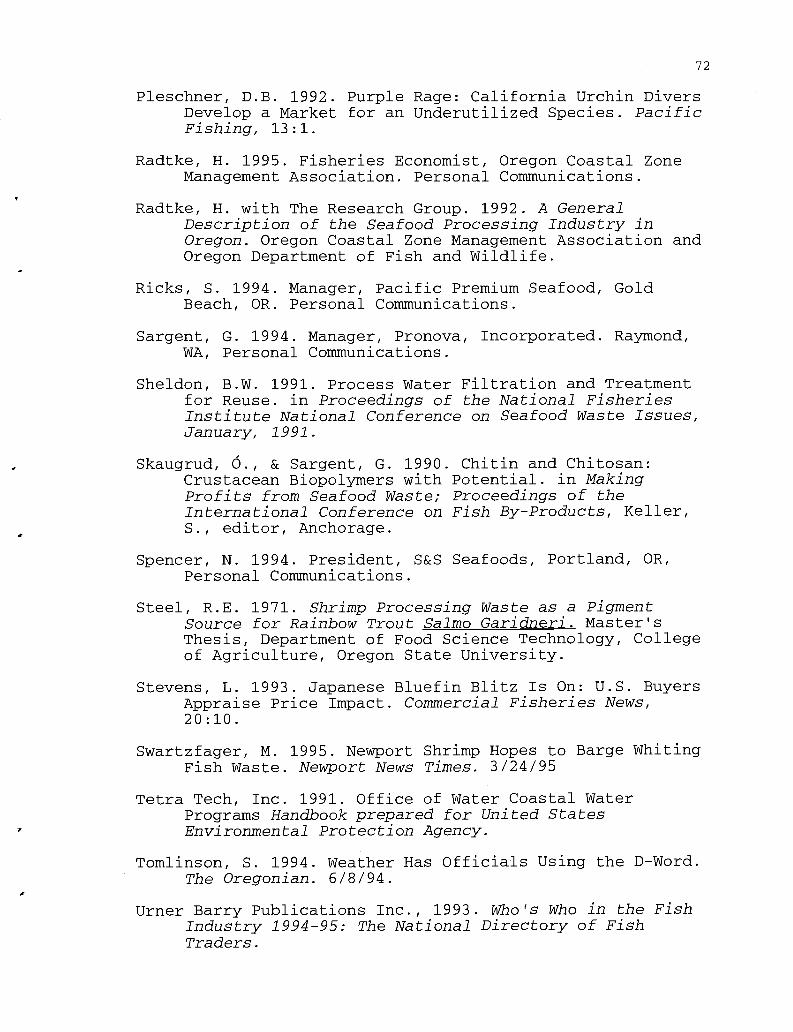
72
Pleschner, D.B. 1992. Purple Rage: California Urchin DiversDevelop a Market for an Underutilized Species. PacificFishing, 13:1.
Radtke, H. 1995. Fisheries Economist, Oregon Coastal ZoneManagement Association. Personal Communications.
Radtke, H. with The Research Group. 1992. A GeneralDescription of the Seafood Processing Industry inOregon. Oregon Coastal Zone Management Association andOregon Department of Fish and Wildlife.
Ricks, S. 1994. Manager, Pacific Premium Seafood, GoldBeach, OR. Personal Communications.
Sargent, G. 1994. Manager, Pronova, Incorporated. Raymond,WA, Personal Communications.
Sheldon, B.W. 1991. Process Water Filtration and Treatmentfor Reuse. in Proceedings of the National FisheriesInstitute National Conference on Seafood Waste Issues,January, 1991.
Skaugrud, 6., & Sargent, G. 1990. Chitin and Chitosan:Crustacean Biopolymers with Potential. in MakingProfits from Seafood Waste; Proceedings of theInternational Conference on Fish By-Products, Keller,S., editor, Anchorage.
Spencer, N. 1994. President, S&S Seafoods, Portland, OR,Personal Communications.
Steel, R.E. 1971. Shrimp Processing Waste as a PigmentSource for Rainbow Trout Salmo Garidneri. Master'sThesis, Department of Food Science Technology, Collegeof Agriculture, Oregon State University.
Stevens, L. 1993. Japanese Bluefin Blitz Is On: U.S. BuyersAppraise Price Impact. Commercial Fisheries News,20:10.
Swartzfager, M. 1995. Newport Shrimp Hopes to Barge WhitingFish Waste. Newport News Times. 3/24/95
Tetra Tech, Inc. 1991. Office of Water Coastal WaterPrograms Handbook prepared for United StatesEnvironmental Protection Agency.
Tomlinson, S. 1994. Weather Has Officials Using the D-Word.The Oregonian. 6/8/94.
Urner Barry Publications Inc., 1993. Who's Who in the FishIndustry 1994-95: The National Directory of FishTraders.
73
WAC Chapter 173-224. Washington Administrative Code.
WCFDF, 1983. West Coast Fisheries Development Foundation.Seafood Wastes: Levels and Disposal Methods for WestCoast Fishing Ports.
Welch, L. 1993. On Again, Off Again: Dungeness. PacificFishing, 14:9.
Wheaton, F.W. & Lawson, T.B. 1985. Processing Aquatic FoodProducts. John Wiley & Sons, New York
Windsor, M. & Barlow, S. 1981. Introduction to Fishery By-Products. England: Fishing News Books, Ltd.
WUSSPP, 1993. Western United States Seafood PromotionProgram. 1992 Western United States Seafood ProcessorsPortland.
Wyatt, B. 1989. Sea Urchin Laboratory Analysis. SonomaCounty Waste Utilization Series No. 1. University ofCalifornia Cooperative Extension, Santa Rosa, CA.
Wyatt, B. 1991. Agricultural Uses of Sea Urchin Shell andViscera. Fish and Kelp News; Research in Progress onSeafood Composting Sonoma County Waste UtilizationSeries No. 2 University of California CooperativeExtension, Santa Rosa CA.
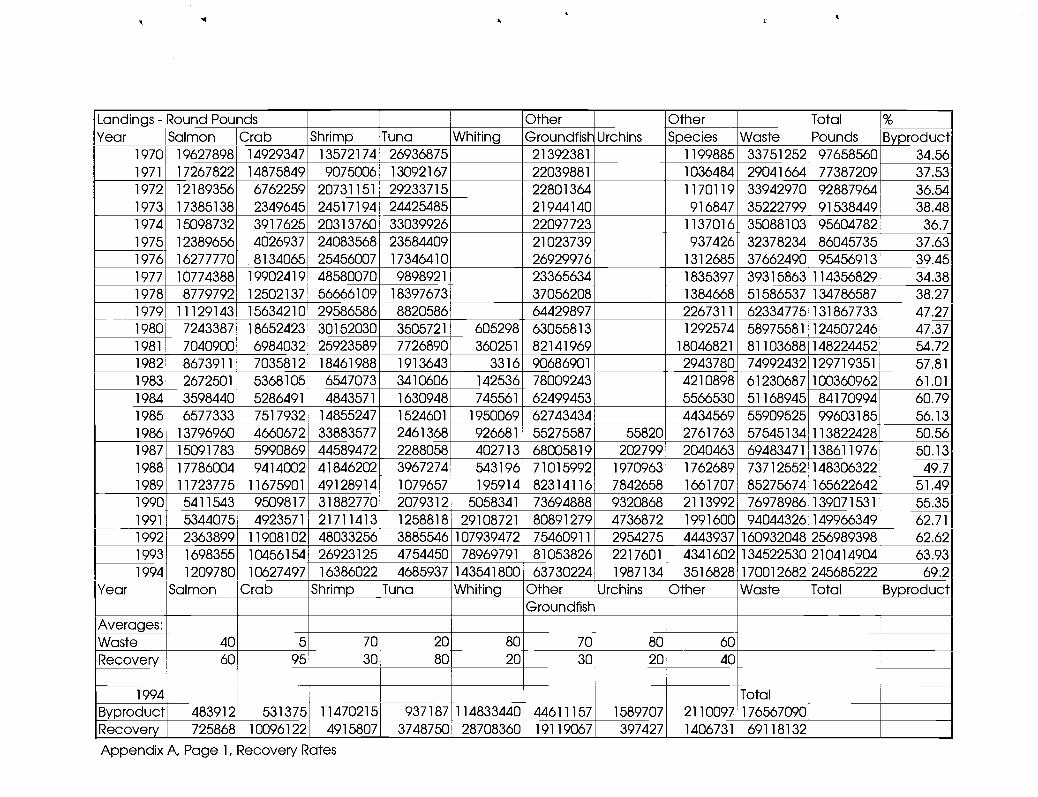
Landings - Round Pounds Other Other Total %
Year Salmon Crab Shrimp Tuna Whiting Groundfis Urchins Species Waste Pounds Byproduct1970 19627898 14929347 13572174 26936875 21392381 1199885 33751252 97658560 34.56
1971 17267822 14875849 9075006 13092167 22039881 1036484 29041664 77387209 37.53
1972 12189356 6762259 20731151 29233715 22801364 1170119 33942970 92887964 36.54
1973 17385138 2349645 24517194 24425485 21944140 916847 35222799 91538449 38.48
1974 15098732 3917625 20313760 33039926 22097723 1137016 35088103 95604782 36.7
1975 12389656 4026937 24083568 23584409 21023739 937426 32378234 86045735 37.63
1976 16277770 8134065 25456007 17346410 26929976 1312685 37662490 95456913 39.45
1977 10774388 19902419 48580070 9898921 23365634 1835397 39315863 114356829 34.38
1978 8779792 12502137 56666109 18397673 37056208 1384668 51586537 134786587 38.27
1979 11/29/43 15634210 29586586 8820586 64429897 2267311 62334775 131867733 47.27
1980 7243387 18652423 30152030 3505721 605298 63055813 1292574 58975581 124507246 47.37
1981 7040900 6984032 25923589 7726890 360251 82141969 18046821 81103688 148224452 54.72
1982 8673911 7035812 18461988 1913643 3316 90686901 2943780 74992432 129719351 57.81
1983 2672501 5368105 6547073 3410606 142536 78009243 4210898 61230687 100360962 61.01
1984 3598440 5286491 4843571 1630948 745561 62499453 5566530 51168945 84170994 60.79
1985 6577333 7517932 14855247 1524601 1950069 62743434 4434569 55909525 99603185 56.13
1986 13796960 4660672 33883577 2461368 926681 55275587 55820 2761763 57545134 113822428 50.56
1987 15091783 5990869 44589472 2288058 402713 68005819 202799 2040463 69483471 138611976 50.13
1988 17786004 9414002 41846202 3967274 543196 71015992 1970963 1762689 73712552 148306322 49.7
1989 11723775 11675901 49128914 1079657 195914 82314116 7842658 1661707 85275674 165622642 51.49
1990 5411543 9509817 31882770 2079312 5058341 73694888 9320868 2113992 76978986 139071531 55.35
1991 5344075 4923571 21711413 1258818 29108721 80891279 4736872 1991600 94044326 149966349 62.71
1992 2363899 11908102 48033256 3885546 107939472 75460911 2954275 4443937 160932048 256989398 62.62
1993 1698355 10456154 26923125 4754450 78969791 81053826 2217601 4341602 134522530 210414904 63.93
1994 1209780 10627497 16386022 4685937 143541800 63730224 1987134 3516828 170012682 245685222 69.2
Year Salmon Crab Shrimp Tuna Whiting Other Urchins Other Waste Total ByproductGroundfish
Averages:Waste 40 5 70 20 80 70 80 60Recovery 60 95 30 80 20 30 20 40
1994 Total
Byproduct 483912 531375 11470215 937187 114833440 44611157 1589707 2110097 176567090
Recovery 725868 10096122 , 4915807 , 3748750 28708360 19119067 , 397427 1406731 69118132
Appendix A, Page 1, Recovery Rates
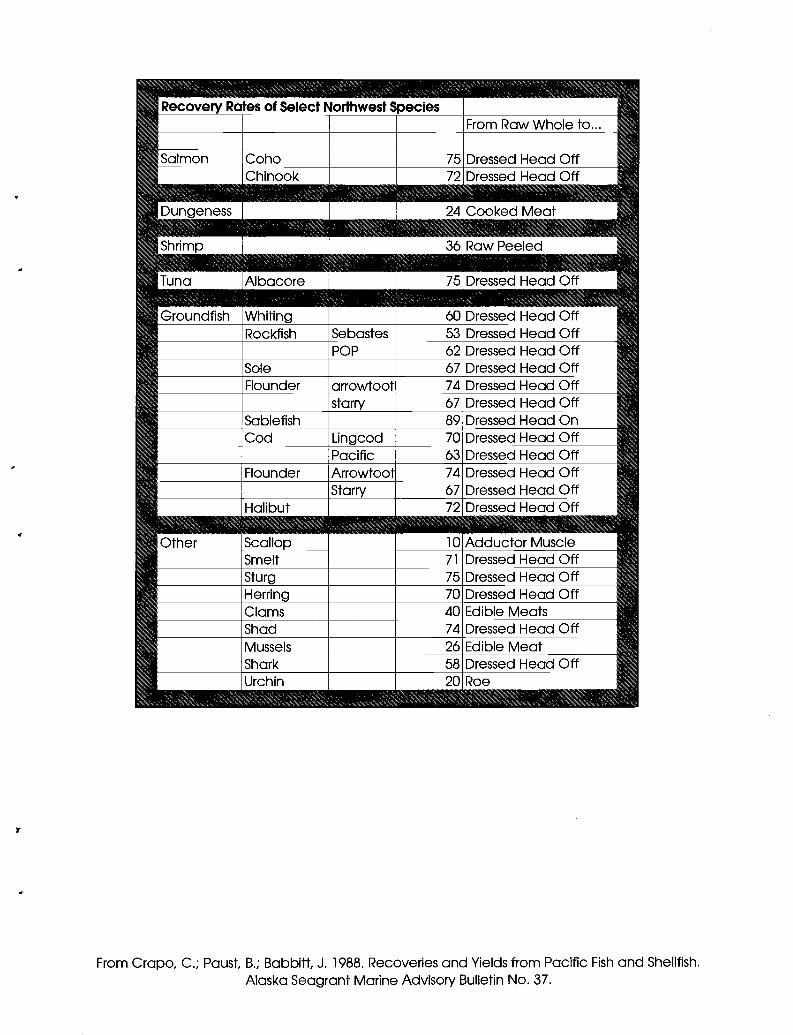
Recovery Rates of Select Northwest SpeciesFrom Raw Whole to... ;
Salmon Coho 75 Dressed Head OffChinook 72 Dressed Head Off
Dungeness 24 Cooked Meat
Shrimp 36 Raw Peeled :;.
Tuna Albacore 1 75 Dressed Head Off
:t -`s Groundfish Whiting 60 Dressed Head OffRockfish Sebastes 53 Dressed Head Off
POP 62 Dressed Head OffSole 67 Dressed Head OffFlounder arrowtoot 74 Dressed Head Off
starry 67 Dressed Head OffSablefish 89 Dressed Head OnCod Lingcod 70 Dressed Head Off
Pacific 63 Dressed Head OffFlounder Arrowtoot 74 Dressed Head Off
HalibutStarry 67
72Dressed Head OffDressed Head Off
pus.' , s.' .,Scallop 10 Adductor MuscleSmelt 71 Dressed Head OffSturg 75 Dressed Head OffHerring 70 Dressed Head OffClams 40 Edible MeatsShad 74, Dressed Head OffMussels 26 Edible MeatShark 58 Dressed Head OffUrchin 20 Roe
From Crapo, C.; Paust, B.; Babbitt, J. 1988. Recoveries and Yields from Pacific Fish and Shellfish.Alaska Seagrant Marine Advisory Bulletin No. 37.
Other
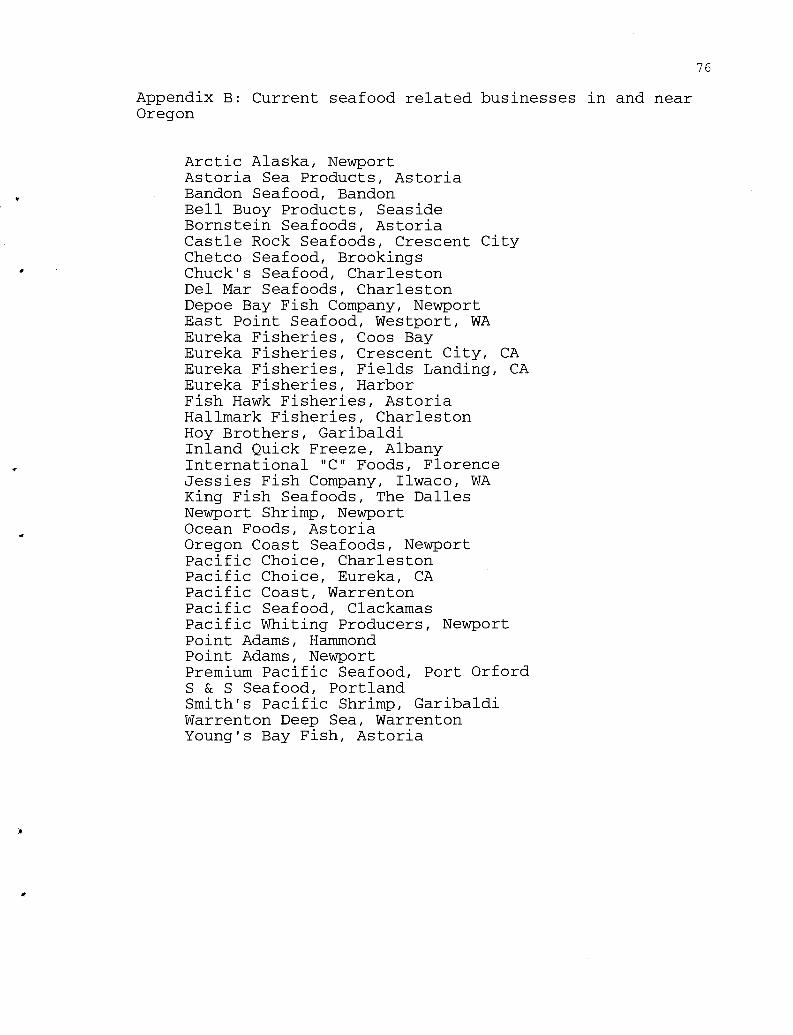
76
Appendix B: Current seafood related businesses in and nearOregon
Arctic Alaska, NewportAstoria Sea Products, AstoriaBandon Seafood, BandonBell Buoy Products, SeasideBornstein Seafoods, AstoriaCastle Rock Seafoods, Crescent CityChetco Seafood, BrookingsChuck's Seafood, CharlestonDel Mar Seafoods, CharlestonDepoe Bay Fish Company, NewportEast Point Seafood, Westport, WAEureka Fisheries, Coos BayEureka Fisheries, Crescent City, CAEureka Fisheries, Fields Landing, CAEureka Fisheries, HarborFish Hawk Fisheries, AstoriaHallmark Fisheries, CharlestonHoy Brothers, GaribaldiInland Quick Freeze, AlbanyInternational "C" Foods, FlorenceJessies Fish Company, Ilwaco, WAKing Fish Seafoods, The DallesNewport Shrimp, NewportOcean Foods, AstoriaOregon Coast Seafoods, NewportPacific Choice, CharlestonPacific Choice, Eureka, CAPacific Coast, WarrentonPacific Seafood, ClackamasPacific Whiting Producers, NewportPoint Adams, HammondPoint Adams, NewportPremium Pacific Seafood, Port OrfordS & S Seafood, PortlandSmith's Pacific Shrimp, GaribaldiWarrenton Deep Sea, WarrentonYoung's Bay Fish, Astoria
77
Survey of Processing Wastes in the Pacific Northwest Seafood Industry
r
Plant Name:Location:
Contact Name:
1. Major Processing Activities (Please list products processed)
2. Process Water SupplyThe plant may have its own water supply or it may purchase water from outside sources suchas state or municipal water agencies. Some plants may use both kinds of sources. Pleasecomplete section A or B or both, depending on your source(s).A. Private Water Supply:
DescriptionQuantity Drawn (gal/yr)Cost ($/year)
B. Outside Water AgencyAgency NameQuantity purchased (gal/yr)Cost ($/year)
3. Seasonal Water Use Pattern:Water use by seafood processing plants exhibit strong seasonal trends. Please list total wateruse in gallons from all sources, for processing activities on a monthly basis for the year 1993.Where possible, please answer in gallons of water per ton of raw product.
Use(gal) Product(s) Use(gal) Product(s)Jan Jul
Feb Aug
Mar Sep
Apr Oct
May Nov
Jun Dec
4. Commodity Specific Water Use Data and WastewaterInformation on different products is extremely important in establishing industry standards.Please provide information on specific commodities available in separate columns. If you havedata on more than three different commodities use a separate sheet. If you do not have anycommodity specific data, then provide the composite data in the first column. (BOD = BiologicalOxygen Demand, TSS = Total Suspended Solids, tons = tons of raw product.)
Commodity name
Water use (gal/ton)
BOD (lb/ton)
TSS (lb/ton)
78
5. Wastewater DisposalWhat method do you use for disposal of waste water?
Private Discharge to river/estuary/oceanPublicly Owned Treatment Work (POTW)Combination of Private and POTW
6. POTW RatesPOTW charges are based on capacity and loading. If you use a POTW, please provide theappropriate rates. Capacity charges are a fixed agreement of water use; some POTWs may notuse capacity charges. MG = million gallons.
Loading Charges: Capacity Charges (if applicable):
Flow ($/MG) Flow ($/MG)
BOD ($/Ibs) BOD ($/Ibs per day)
TSS ($/Ibs) TSS ($/Ibs per day)
Other Other
7. Record KeepingWhat records are required for your wastewater disposal? Which agency requires these?
8. Solid Waste DisposalHow do you dispose of the carcasses, shells and entrails of the species you process? If youuse more than one method, please rate through percentages. Please provide the yearly costsof each method, including necessary permits.
Grind into wastewater effluentHaul to Land FillFreeze as Crab BaitCompostHaul to Fish Meal PlantDump at seaOther
Annual Cost
9. Record KeepingWhat records are required for your solid waste disposal? Which agency requires these?
10. Additional information and commentsPlease provide information on extent of water reuse, recycling efforts, and pretreatmentsystems. Any additional information will be appreciated. Use additional pages if necessary.
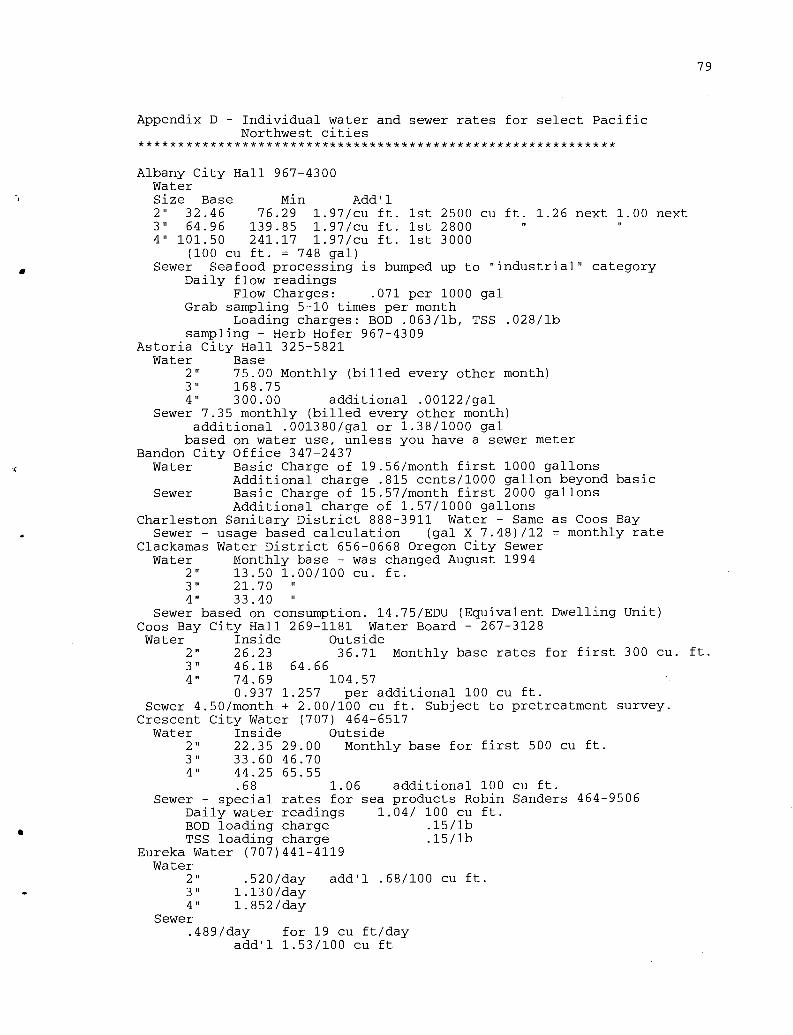
79
a
Appendix D - Individual water and sewer rates for select PacificNorthwest cities
Albany City Hall 967-4300WaterSize Base Min Add'l211 32.46 76.29 1.97/cu ft. 1st 2500 cu ft. 1.26 next 1.00 next3" 64.96 139.85 1.97/cu ft. 1st 28004" 101.50 241.17 1.97/cu ft. 1st 3000
(100 cu ft. = 748 gal)Sewer Seafood processing is bumped up to "industrial" category
Daily flow readingsFlow Charges: .071 per 1000 gal
Grab sampling 5-10 times per monthLoading charges: BOD .063/lb, TSS .028/lb
sampling - Herb Hofer 967-4309Astoria City Hall 325-5821
Water Base2" 75.00 Monthly (billed every other month)3" 168.754" 300.00 additional .00122/gal
Sewer 7.35 monthly (billed every other month)additional .001380/gal or 1.38/1000 gal
based on water use, unless you have a sewer meterBandon City office 347-2437
Water Basic Charge of 19.56/month first 1000 gallonsAdditional charge .815 cents/1000 gallon beyond basic
Sewer Basic Charge of 15.57/month first 2000 gallonsAdditional charge of 1.57/1000 gallons
Charleston Sanitary District 888-3911 Water - Same as Coos BaySewer - usage based calculation (gal X 7.48)/12 = monthly rate
Clackamas Water District 656-0668 Oregon City SewerWater Monthly base - was changed August 1994
2" 13.50 1.00/100 cu. ft.3" 21.70 "
4" 33.40 "
Sewer based on consumption. 14.75/EDU (Equivalent Dwelling Unit)Coos Bay City Hall 269-1181 Water Board - 267-3128Water Inside Outside
2" 26.23 36.71 Monthly base rates for first 300 cu. ft.3" 46.18 64.664" 74.69 104.57
0.937 1.257 per additional 100 cu ft.Sewer 4.50/month + 2.00/100 cu ft. Subject to pretreatment survey.
Crescent City Water (707) 464-6517Water Inside outside
2" 22.35 29.00 Monthly base for first 500 cu ft.3" 33.60 46.704" 44.25 65.55
.68 1.06 additional 100 cu ft.Sewer - special rates for sea products Robin Sanders 464-9506
Daily water readings 1.04/ 100 cu ft.BOD loading charge .15/lbTSS loading charge .15/lb
Eureka Water (707)441-4119Water
2" .520/day add'l .68/100 cu ft.3" 1.130/day4" 1.852/day
Sewer489/day for 19 cu ft/day
add'l 1.53/100 cu ft
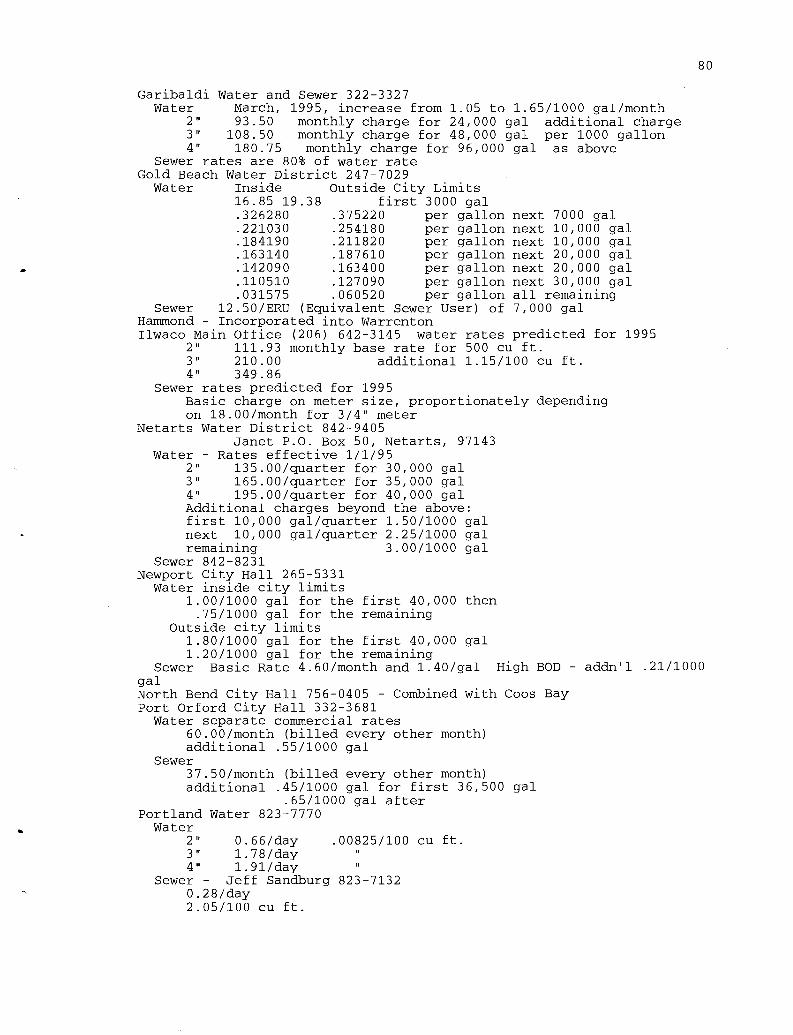
80
Garibaldi Water and Sewer 322-3327Water March, 1995, increase from 1.05 to 1.65/1000 gal/month
2" 93.50 monthly charge for 24,000 gal additional charge3" 108.50 monthly charge for 48,000 gal per 1000 gallon4" 180.75 monthly charge for 96,000 gal as above
Sewer rates are 80% of water rateGold Beach Water District 247-7029
Water Inside Outside City Limits16.85 19.38 first 3000 gal.326280 .375220 per gallon next 7000 gal.221030 .254180 per gallon next 10,000 gal.184190 .211820 per gallon next 10,000 gal.163140 .187610 per gallon next 20,000 gal.142090 .163400 per gallon next 20,000 gal.110510 .127090 per gallon next 30,000 gal.031575 .060520 per gallon all remaining
Sewer 12.50/ERU (Equivalent Sewer User) of 7,000 galHammond - Incorporated into WarrentonIlwaco Main Office (206) 642-3145 water rates predicted for 1995
2" 111.93 monthly base rate for 500 cu ft.3" 210.00 additional 1.15/100 cu ft.4" 349.86
Sewer rates predicted for 1995Basic charge on meter size, proportionately dependingon 18.00/month for 3/4" meter
Netarts Water District 842-9405Janet P.O. Box 50, Netarts, 97143
Water - Rates effective 1/1/952" 135.00/quarter for 30,000 gal3" 165.00/quarter for 35,000 gal4" 195.00/quarter for 40,000 galAdditional charges beyond the above:first 10,000 gal/quarter 1.50/1000 galnext 10,000 gal/quarter 2.25/1000 galremaining 3.00/1000 gal
Sewer 842-8231Newport City Hall 265-5331Water inside city limits
1.00/1000 gal for the first 40,000 then.75/1000 gal for the remaining
Outside city limits1.80/1000 gal for the first 40,000 gal1.20/1000 gal for the remaining
Sewer Basic Rate 4.60/month and 1.40/gal High BOD - addn'l .21/1000galNorth Bend City Hall 756-0405 - Combined with Coos BayPort Orford City Hall 332-3681Water separate commercial rates
60.00/month (billed every other month)additional .55/1000 gal
Sewer37.50/month (billed every other month)additional .45/1000 gal for first 36,500 gal
.65/1000 gal afterPortland Water 823-7770
Water2" 0.66/day .00825/100 cu ft.3" 1.78/day4" 1.91/day
Sewer - Jeff Sandburg 823-71320.28/day2.05/100 cu ft.
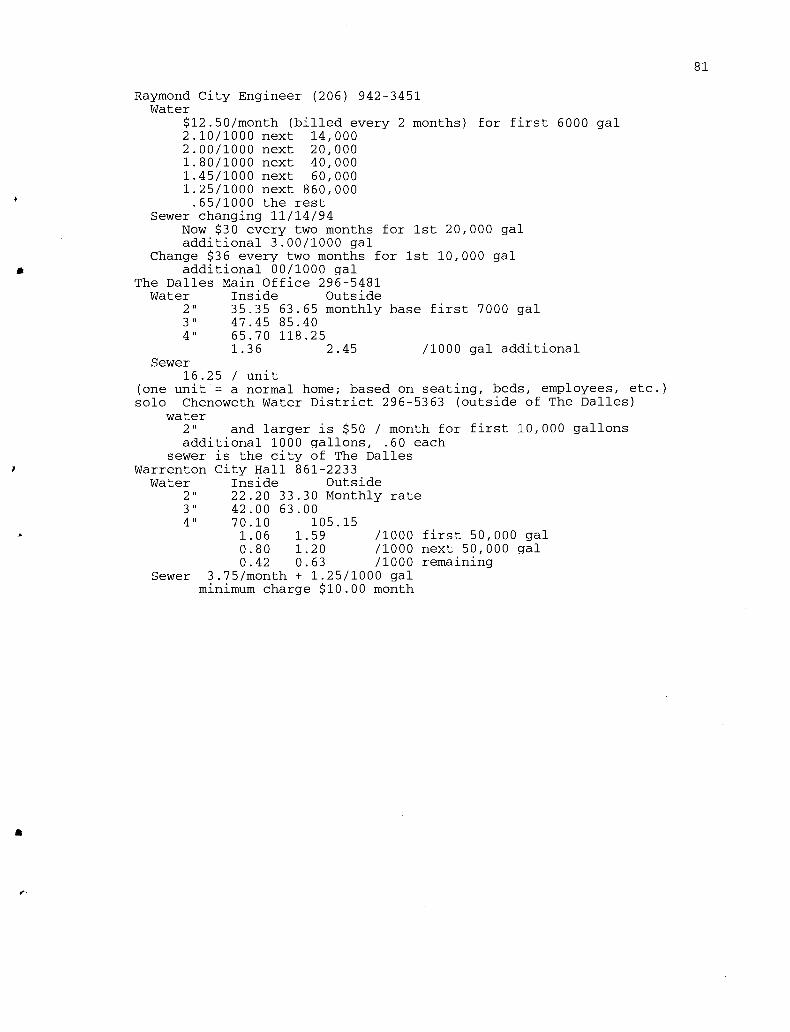
81
Raymond City Engineer (206) 942-3451Water
$12.50/month (billed every 2 months) for first 6000 gal2.10/1000 next 14,0002.00/1000 next 20,0001.80/1000 next 40,0001.45/1000 next 60,0001.25/1000 next 860,000.65/1000 the rest
Sewer changing 11/14/94Now $30 every two months for 1st 20,000 galadditional 3.00/1000 gal
Change $36 every two months for 1st 10,000 galadditional 00/1000 gal
The Dalles Main Office 296-5481Water Inside outside
2" 35.35 63.65 monthly base first 7000 gal3" 47.45 85.404" 65.70 118.25
1.36 2.45 /1000 gal additionalSewer
16.25 / unit(one unit = a normal home; based on seating, beds, employees, etc.)solo Chenoweth Water District 296-5363 (outside of The Dalles)
water2" and larger is $50 / month for first 10,000 gallonsadditional 1000 gallons, .60 each
sewer is the city of The DallesWarrenton City Hall 861-2233
Water Inside Outside2" 22.20 33.30 Monthly rate3" 42.00 63.004" 70.10 105.15
1.06 1.59 /1000 first 50,000 gal0.80 1.20 /1000 next 50,000 gal0.42 0.63 /1000 remaining
Sewer 3.75/month + 1.25/1000 galminimum charge $10.00 month
a
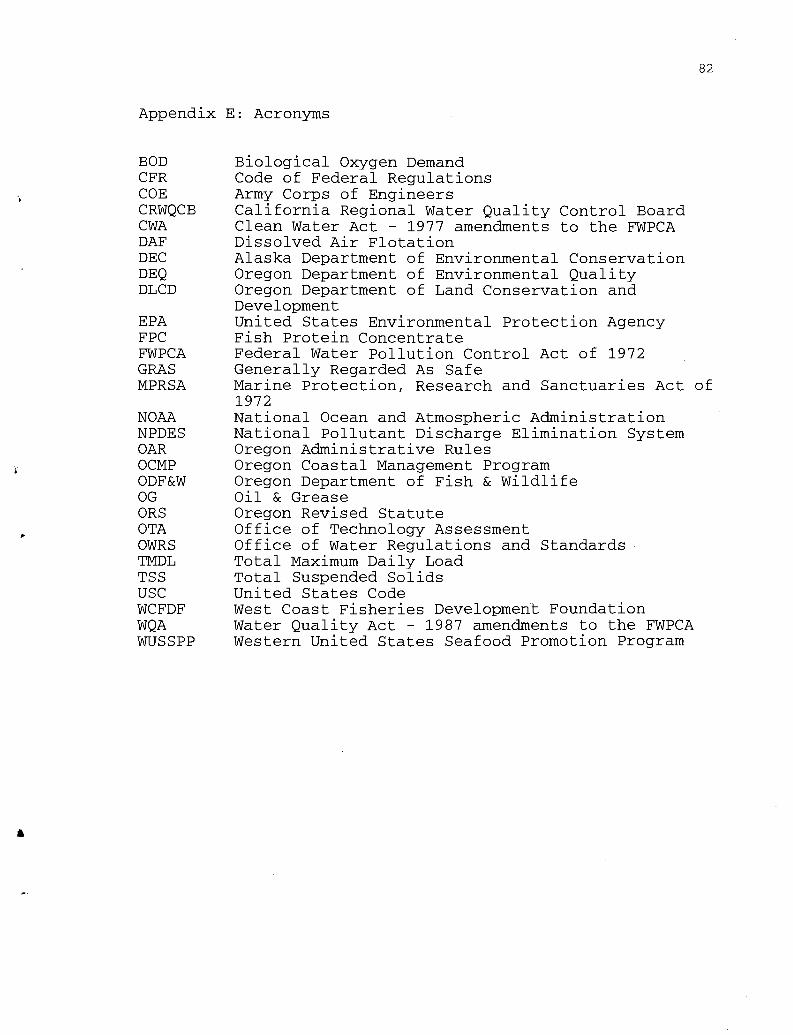
82
Appendix E: Acronyms
BOD Biological Oxygen DemandCFR Code of Federal RegulationsCOE Army Corps of EngineersCRWQCB California Regional Water Quality Control BoardCWA Clean Water Act - 1977 amendments to the FWPCADAF Dissolved Air FlotationDEC Alaska Department of Environmental ConservationDEQ Oregon Department of Environmental QualityDLCD Oregon Department of Land Conservation and
DevelopmentEPA United States Environmental Protection AgencyFPC Fish Protein ConcentrateFWPCA Federal Water Pollution Control Act of 1972GRAS Generally Regarded As SafeMPRSA Marine Protection, Research and Sanctuaries Act of
1972NOAA National Ocean and Atmospheric AdministrationNPDES National Pollutant Discharge Elimination SystemOAR Oregon Administrative RulesOCMP Oregon Coastal Management ProgramODF&W Oregon Department of Fish & WildlifeOG Oil & GreaseORS Oregon Revised StatuteOTA Office of Technology AssessmentOWRS Office of Water Regulations and StandardsTMDL Total Maximum Daily LoadTSS Total Suspended SolidsUSC United States CodeWCFDF West Coast Fisheries Development FoundationWQA Water Quality Act - 1987 amendments to the FWPCAWUSSPP Western United States Seafood Promotion Program
s