Seabird responses to fluctuating prey availability in the ...
12
MARINE ECOLOGY - PROGRESS SERIES Mar. Ecol. Prog. Ser. l Published August 14 Seabird responses to fluctuating prey availability in the eastern Bering Sea* Alan M. springer', David G. Roseneau2,Denby S. ~loyd'.", C. Peter MCRO~' & Edward C. ~ur~hy~ Institute of Marine Science. University of Alaska. Fairbanks. Alaska 99775-1080. USA FALCO, 2621 Lingonberry Lane, Fairbanks, Alaska 99709, USA Institute of Arctic Biology and Department of Biology. Fisheries and Wildlife, University of Alaska. Fairbanks, Alaska 99775-0990. USA ABSTRACT: Walleye pollock Theragra chalcogramma are important prey of piscivorous seablrds at offshore breeding colonies in the southeastern Bering Sea. The reproductive success of kittiwakes Rissa spp. is related to the abundance of juvenile pollock. It is proposed that poor pollock recruitment in recent years, as determ~ned by fisheries surveys, led to persistent kittiwake breeding failures in 1981-84. Declines in numbers of k~ttiwakes and other piscivorous seabirds at 2 colonies also may be related to the decline in pollock abundance. In contrast, planktivorous seabirds, which possibly compete with juvenile pollock for zooplankton, particularly copepods, might benefit from a low abundance of pollock. A conceptual model of food limitation and trophic interactions at several levels in the offshore pelagic food web of the eastern Bering Sea can be developed by relating relations between seabirds and their prey to (l) the high grazing efficiency of the herbivorous zooplankton community, which is dominated by large calanoid copepods, (2) estimates of a high annual loss of copepods, presumably to vertebrates, and (3) regional carbon budgets. The possibility that populations of several species respond to changes in pollock abundance should be considered in management decisions for the commercial pollock fishery INTRODUCTION The consequences of multispecies interactions in the management of commercial fisheries is a persistent and important problem with the increasing human use of key species in marine food webs (May et al. 1979, Furness 1984, Payne 1984). An important theme of the multispecies concept is that populations of marine organisms are often limited by food availability, and that changes in the numbers of one or more members of a food web can produce cascading effects at the same and other trophc levels (Payne 1984).In the Antarctic, the depletion of stocks of the large baleen whales during the early part of this century is thought to have led to a number of demographic and biological changes in populations of other whales, seals, birds Contribution No. 614. Institute of Marine Science, Univer- sity of Alaska " Current address: Alaska Department of Fish and Game, 333 Raspberry Road. Anchorage. Alaska 99518-1599, USA O Inter-Research/Printed in F. R. Germany and fish, by creating a surplus of the shared resource krill Euphausia superba (see reviews by Gambell 1985, Laws 1985). Similar examples of interactions in zoo- plankton-based food webs involving whales, fish and seals in the Arctic (Frost & Lowry 1984) and fishes and squid in the subarctic (Vesin et al. 1981) have been suggested. Energy availability to vertebrates in the pelagic food web of the eastern Benng Sea is mediated primarily by walleye pollock Theragra chalcogramma and calanoid copepods (Iverson et al. 1979, Cooney 1981, Springer & Roseneau 1985, Walsh & McRoy 1986). Pollock com- prises about 60 % of the estimated biomass of 13 taxa of commercially important groundfish in the eastern Bering Sea and is presently the target of the largest single-species fishery in the north Pacific Ocean, with a current annual harvest of about 1 million tonnes (Bakkala et al. unpubl.). Juvenile pollock feed on zoo- plankton, particularly large copepods such as Neocalanus plumchrus, N. cnktatus, and Calanus mar- shallae (Clarke 1978, Lee 1985, Springer et al. unpubl.
Transcript of Seabird responses to fluctuating prey availability in the ...
MARINE ECOLOGY - PROGRESS SERIES Mar. Ecol. Prog. Ser. l Published August 14
Seabird responses to fluctuating prey availability in the eastern Bering Sea*
Alan M. springer', David G. Roseneau2, Denby S. ~loyd'.", C. Peter M C R O ~ ' & Edward C. ~ u r ~ h y ~
Institute of Marine Science. University of Alaska. Fairbanks. Alaska 99775-1080. USA FALCO, 2621 Lingonberry Lane, Fairbanks, Alaska 99709, USA
Institute of Arctic Biology and Department of Biology. Fisheries and Wildlife, University of Alaska. Fairbanks, Alaska 99775-0990. USA
ABSTRACT: Walleye pollock Theragra chalcogramma are important prey of piscivorous seablrds at offshore breeding colonies in the southeastern Bering Sea. The reproductive success of kittiwakes Rissa spp. is related to the abundance of juvenile pollock. It is proposed that poor pollock recruitment in recent years, as determ~ned by fisheries surveys, led to persistent kittiwake breeding failures in 1981-84. Declines in numbers of k~ttiwakes and other piscivorous seabirds at 2 colonies also may be related to the decline in pollock abundance. In contrast, planktivorous seabirds, which possibly compete with juvenile pollock for zooplankton, particularly copepods, might benefit from a low abundance of pollock. A conceptual model of food limitation and trophic interactions at several levels in the offshore pelagic food web of the eastern Bering Sea can be developed by relating relations between seabirds and their prey to ( l ) the high grazing efficiency of the herbivorous zooplankton community, which is dominated by large calanoid copepods, (2) estimates of a high annual loss of copepods, presumably to vertebrates, and (3) regional carbon budgets. The possibility that populations of several species respond to changes in pollock abundance should be considered in management decisions for the commercial pollock fishery
INTRODUCTION
The consequences of multispecies interactions in the management of commercial fisheries is a persistent and important problem with the increasing human use of key species in marine food webs (May et al. 1979, Furness 1984, Payne 1984). An important theme of the multispecies concept is that populations of marine organisms are often limited by food availability, and that changes in the numbers of one or more members of a food web can produce cascading effects at the same and other trophc levels (Payne 1984). In the Antarctic, the depletion of stocks of the large baleen whales during the early part of this century is thought to have led to a number of demographic and biological changes in populations of other whales, seals, birds
Contribution No. 614. Institute of Marine Science, Univer- sity of Alaska " Current address: Alaska Department of Fish and Game, 333 Raspberry Road. Anchorage. Alaska 99518-1599, USA
O Inter-Research/Printed in F. R. Germany
and fish, by creating a surplus of the shared resource krill Euphausia superba (see reviews by Gambell 1985, Laws 1985). Similar examples of interactions in zoo- plankton-based food webs involving whales, fish and seals in the Arctic (Frost & Lowry 1984) and fishes and squid in the subarctic (Vesin et al. 1981) have been suggested.
Energy availability to vertebrates in the pelagic food web of the eastern Benng Sea is mediated primarily by walleye pollock Theragra chalcogramma and calanoid copepods (Iverson et al. 1979, Cooney 1981, Springer & Roseneau 1985, Walsh & McRoy 1986). Pollock com- prises about 60 % of the estimated biomass of 13 taxa of commercially important groundfish in the eastern Bering Sea and is presently the target of the largest single-species fishery in the north Pacific Ocean, with a current annual harvest of about 1 million tonnes (Bakkala e t al. unpubl.). Juvenile pollock feed on zoo- plankton, particularly large copepods such as Neocalanus plumchrus, N. cnktatus, and Calanus mar- shallae (Clarke 1978, Lee 1985, Springer et al. unpubl.

2 Mar. Ecol. Prog. Ser. 32: 1-12, 1986
METHODS
data), as do a variety of other fishes, birds and mam- previously (see below), together suggest that energy mals (Nemoto 1957, 1959, Adams 1979, Lee 1985, transfer through this pelagic food web is highly effl- Springer & Roseneau 1985). Because of the large cient, and that populations of avian planktivores and number of pollock, and hence their importance as p~scivores are Limited by the avdability of prey. The secondary consumers (Walsh & McRoy 1986), it is con- data have implications on management decisions of ceivable that their food share might be sufficiently the pollock fishery, and point to interesting areas for large to Limit the availability of zooplankton to other future research. planktivores. Such an effect might be most apparent during peaks in the abundance of pollock, which occur at intervals of a few years.
Among the consumers of pollock, in addition to man, Our studies were undertaken on the Pribilof Islands are piscivorous marine birds including murres Uria in 1980-81 and on St. Matthew Island and Hall Island spp. and kittiwakes Rissa spp., which depend on pol- in 1982-83 (Fig. 1). The work on the Pribilof Is. lock to supply the dominant fraction of their energy extended that from 1975 to 1979 by Hunt et al. (1981b). requirements during the breeding season (Hunt et al. Subsequent investigators worked there in 1982 (Craig- 1981a, this study). At the next lower level in the food head & Oppenheim 1985) and 1984 (Johnson unpubl.). web are planktivorous auklets, principally least We have incorporated their data on kittiwake produc- auklets Aethia pusilla, which, like young pollock, feed tivity into this report, as well as unpublished 1983 predominantly on large calanoid copepods (see obsenrations on kittiwake productivity by A. Mer- Springer & Roseneau 1985). If pollock are important to culieff, a knowledgeable resident of St. George Island piscivorous populations as prey and to planktivorous on the Pribilof Is. The only year in which seabird populations as competitors, changes in their numbers studies were made on St. Matthew I. and Hall I. prior to should be expressed in opposite ways in the 2 trophic 1982 was 1977 (DeGange & Sowls 1978). A. Sowls and levels. Short and long-term changes in the breeding S. Morrell (unpubl. data) obtained information on kit- biology and food habits of murres, kittiwakes and tiwake productivity there in 1982 which we have also auklets in the eastern Bering Sea, which we describe included. here, do correspond to interannual changes in the We determined kittiwake reproductive success in all estimates of pollock recruitment and abundance. years by visiting mapped nests at intervals during the These relations, and others that have been reported breeding season and counting the numbers of active
Fig. 1. The study area in the southeastern Bering Sea
Springer et al.: Seabird responses to prey availability
nests, eggs and chicks. We weighed kittiwake and murre chicks on the Pribilof Is. and least auklet chicks on St. Matthew I. at intervals of several days and calculated growth rates during the linear portion of the growth period.
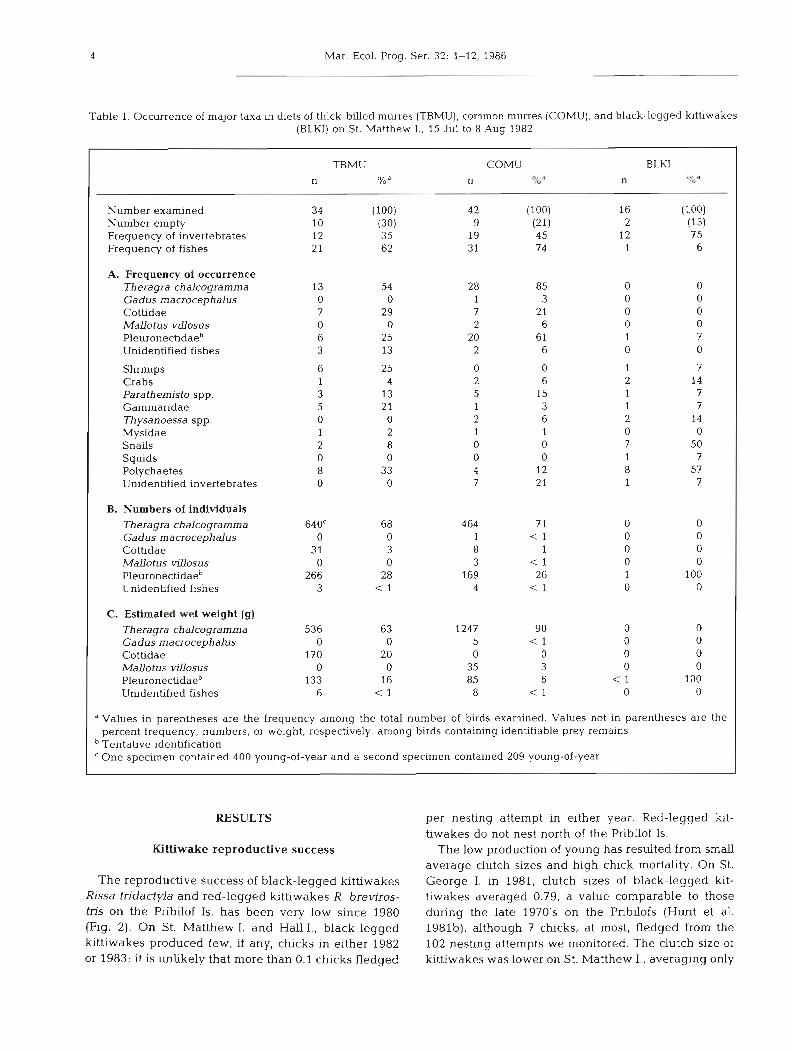
Kittiwakes and murres were collected on St. Matthew I. as they returned to the colonies from feed- ing. The stomach contents were preserved in 70 % ethanol within 2 h of collection. Fish prey were counted and identified on the basis of otoliths. Inverte- brates were identified from whole specimens or from hard parts, such as jaws, rostra and uropods; because invertebrates were usually fragmented and partially digested, it was generally not possible to accurately count the number of individuals. The biomass of fish prey was approximated by using regression equations relating otolith lengths to fish lengths and fish lengths to fish wet weights, or by assigning average weights for different length or age categories (see Springer et al. 1984). The equations we used for estimating the wet weights of fish taxa are:
Pollock: Y = (3.175 X) - 9.770 for otoliths > 10.0 mm Y = (2.246 X) - 0.510 for otoliths 5 10.0 mm
where Y = fish length in cm; X = otolith length in mm, from Frost & Lowry (1981);
W = 0.0075 L2.977 where W = fish weight in g ; L = fish length in cm, from Pereyra et al. (1976);
Cottidae: fish length (cm) = 4.009 X otolith length (mm) -
4.364, from K. Frost & L. Lowry (unpubl. data);
log weight (g) = -6.016 + 3.46 log length (mm), from Craig & Haldorson (1981);
Capelin Mallotus villosus: fish length (mm) = 3.42 X otolith length (units) + 29.22; 12.5 units mm-', from Springer et al. (1984);
fish length < 80 mm: weight estimate = 5 g 80 mm < fish length < 115 mm: weight estimate = 10 g
fish length > 115 mm: weight estimate = 20 g , from K. Pahlke, University of Alaska, Juneau (unpubl. data).
Pollock with otoliths less than 2.25 mm were assigned a weight of 0.5 g, the approximate mid-point of weights for this size class as determined by T. Nishi- yama (University of Alaska, unpubl. data). The otoliths of the Pleuronectidae were all less than 2 mm and the majority were less than 1 mm in length, and the fish were assigned a weight of 0.5 g as suggested by S. Lee (University of Alaska, unpubl, data). Herring Clupea harengus were only partially digested and we esti- mated their weight at 30 g each. Limitations of this
method of analysis, particularly as it applies to the determination of quantitative dietary information, are discussed in Springer et al. (1984). Briefly, the method probably underestimates the consumed biomass of all fish, particularly that of Age 0 fishes, which have very small otoliths that are often difficult to find among prey remains and are lost from the stomachs more rapidly than the larger otoliths.
The methods of data collecbon and principal results of the food habits studies of least auklets on St. Mat- thew I. have been described elsewhere (Springer & Roseneau 1985). Here we use these published data and report additional information on interannual differ- ences in numbers of prey recovered from least auklets during the chick-feeding period of the nesting cycle. The prey fed to the chicks are carried by the adults in sublingual pouches where very little digestion takes place, thus providing quantitative as well as qualita- tive samples.
Because pollock are known to be important prey of piscivorous marine birds in the southeastern Bering Sea (Hunt et al. 1981a, this study), we include recent information on pollock stock size and recruitment reported by the National Marine Fisheries S e ~ c e (Bakkala et al. unpubl. data). Commercial fishery and research vessel survey data were used in the assess- ment of the condition of the population.
R L K I
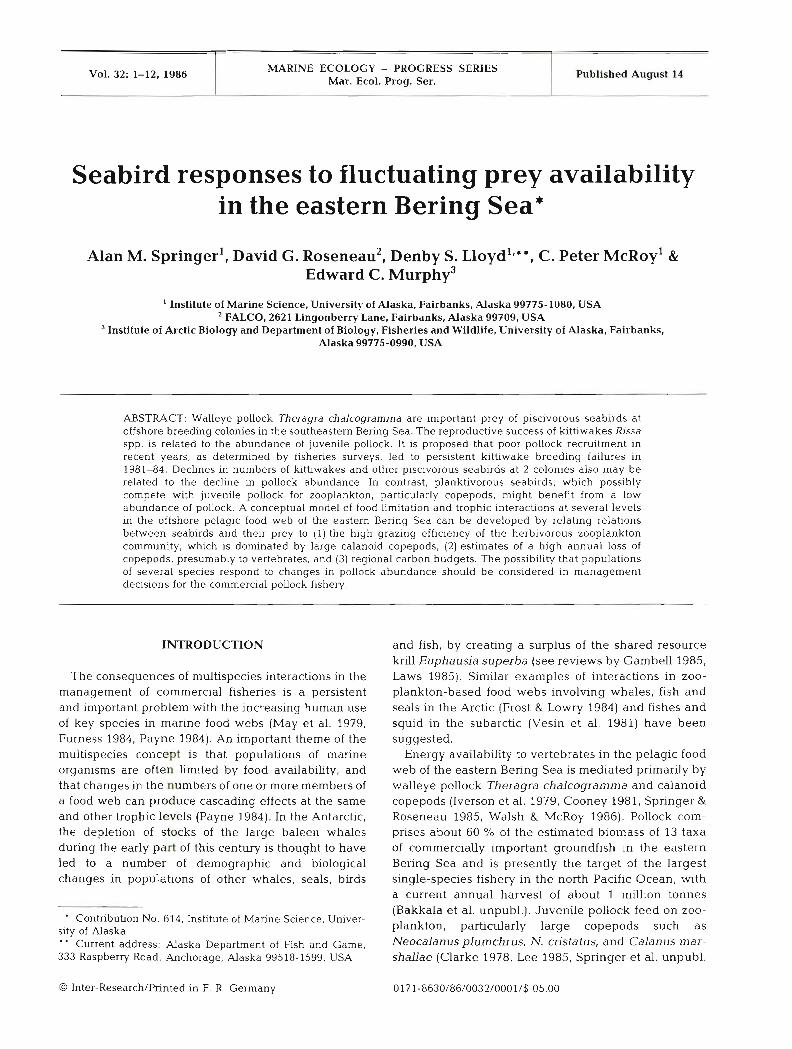
Fig. 2. Rissa brev i ro~ t~s and R. tridactyla. Productivity of red- legged kittiwakes (RLKI) and black-legged k~thwakes (BLKI) on St. Paul I. (SP) and St. George I. (SG). Productivity mea- sured as the number of young per nest. Data for 1975-79 are from Hunt et al. (1981b); 1982: Craighead & Oppenheim (1985); 1983: A. Mercul~eff (pers. comm.); 1984: Johnson
(unpubl.)
Mar. Ecol. Prog. Ser. 3 2 : 1-12, 1986
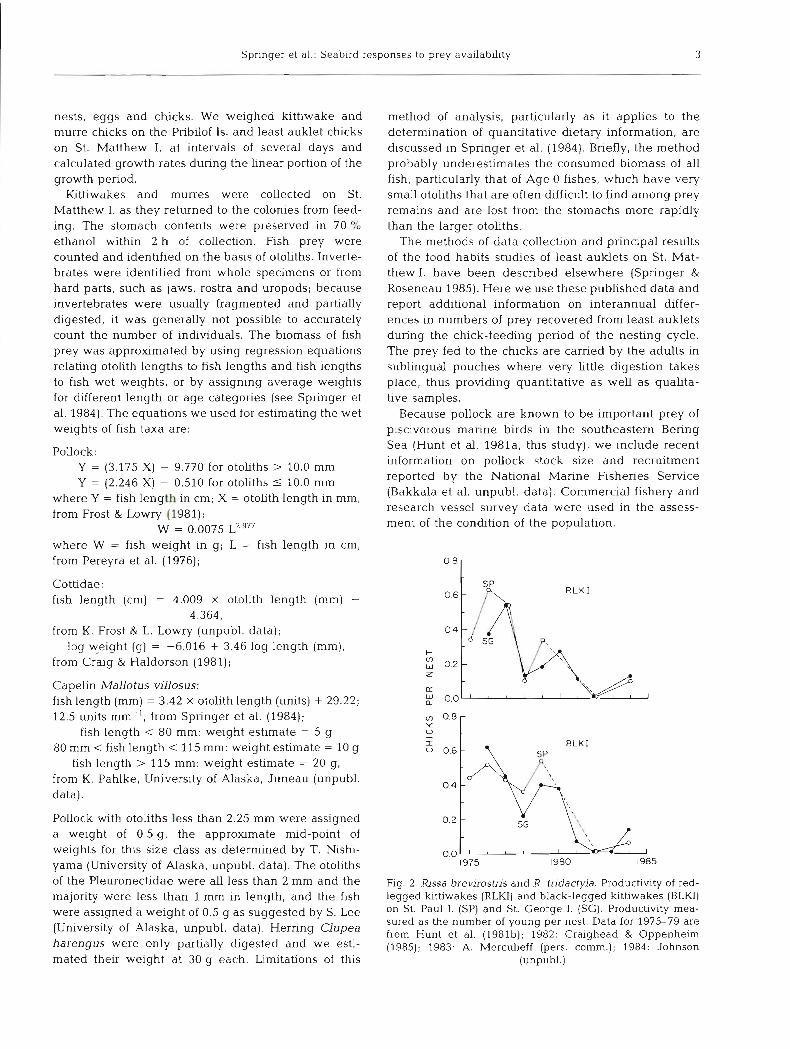
Table 1. Occurrence of major taxa in diets of thick-billed murres (TBMU), common murres (COMU), and black-legged kittiwak (BLKI) on St. Matthew I. , 15 Jul to 8 Aug 1982
TBMU COMU BLKI n n n TO " 0,' "
Number examined Number empty Frequency of invertebrates Frequency of fishes
A. Frequency of occurrence Theragra chalcograrnrna Gadus macrocephalus Cottidae Mallotus v~Uosus Pleuronecbdaeb Unidentified fishes
Shrimps Crabs Parathem~sto spp. Gammaridae Thysanoessa spp. Mysidae Snails Squids Polychaetes Unidentified invertebrates
B. Numbers of individuals Theragra chalcogramma Gadus macrocephalus Cottidae Mallotus vrllosus Pleuronectidaeb Unidenhfied fishes
C. Estimated wet weight (g)
Theragra chalcogramma Gadus macrocephalus Cottidae Mallotus vrllosus Pleuronectidaeb Unidentified fishes
" Values in parentheses are the frequency among the total number of birds examined. Values not in parentheses are the percent frequency, numbers, or weight, respectively, among birds containing identdiable prey remains Tentative identification ' One specimen contained 400 young-of-year and a second specimen contained 209 young-of-year
RESULTS per nesting attempt in either year. Red-legged kit- tiwakes do not nest north of the Pribilof Is.
The low production of young has resulted from small average clutch sizes and high chick mortahty. O n St. George I . in 1981, clutch sizes of black-legged lut- tiwakes averaged 0.79, a value comparable to those during the late 1970's on the Pribilofs (Hunt et al. 1981b), although 7 chicks, at most, fledged from the 102 nesting attempts we monitored. The clutch size of luttiwakes was lower on St. Matthew I . , averaging only
Kittiwake reproductive success
The reproductive success of black-legged luttiwakes fissa tridactyla and red-legged kittiwakes R. breviros- tris on the Pribilof Is. has been very low since 1980 (Fig. 2). On St. Matthew I , and Hall I . , black-legged luttiwakes produced few, if any, chicks in either 1982 or 1983; it is unlikely that more than 0.1 chicks fledged
Springer et al.: Seabird responses to prey availability 5
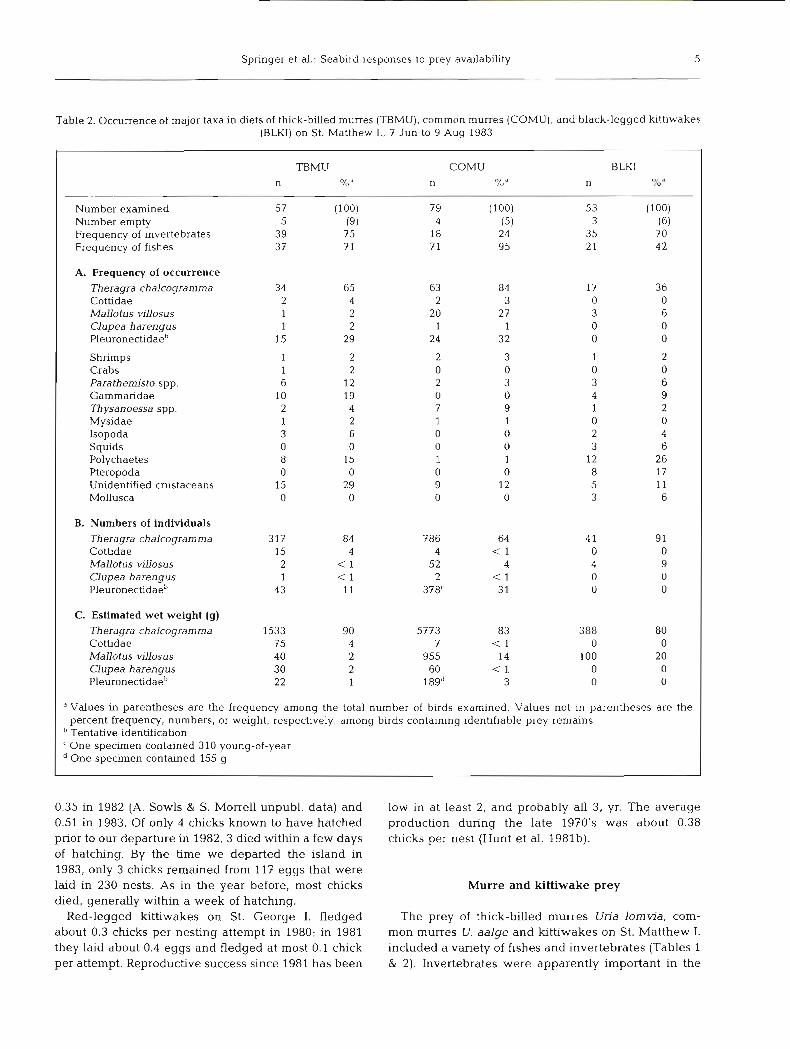
Table 2. Occurrence of major taxa in diets of thick-billed murres (TBMU), common murres (COMU), and black-legged kittiwakes (BLKI) on St. Matthew I., 7 Jun to 9 Aug 1983
TBMU COMU BLKI n %" n /O n 7'" * 0 d
Number examined 57 (100) 79 (100) 53 (100) Number empty 5 (9) 4 (5) 3 (6) Frequency of invertebrates 3 9 7 5 18 24 35 7 0 Frequency of fishes 3 7 " 1 7 1 95 2 1 42
A. Frequency of occurrence Theragra chalcoyramma 34 05 63 84 17 3 6 Cottidae 2 4 2 3 0 0 Mallotus vdosus 1 2 20 27 3 6 Clupea harengus 1 2 1 1 0 0 Pleuronectidaeb 15 29 24 32 0 0
Shrimps 1 2 2 3 1 2 Crabs 1 2 0 0 0 0 Parathemisto spp. 6 12 2 3 3 6 Gammaridae 10 19 0 0 4 9 Thysanoessa spp. 2 4 7 9 1 2 Mysidae 1 2 1 1 0 0 Isopoda 3 6 0 0 2 4 Squids 0 0 0 0 3 6 Polychaetes 8 15 1 1 12 26 Pteropoda 0 0 0 0 8 17 Unidentified crustaceans 15 29 9 12 5 11 Mollusca 0 0 0 0 3 6
B. Numbers of individuals Theragra chalcogramma 317 84 786 64 4 1 91 Cottidae 15 4 4 < 1 0 0 Mallotus villosus 2 < 1 52 4 4 9 Clupea harengus 1 < 1 2 < 1 0 0 Pleuronectidaeb 43 11 378' 3 1 0 0
C. Estimated wet weight (g) Theragra chalcogramma 1533 90 5773 83 388 80 Cottidae 75 4 7 < 1 0 0 Mallotus villosus 40 2 955 14 100 20 Clupea harengus 30 2 60 < 1 0 0 Pleuronectidaeb 22 1 189" 3 0 0
" Values in parentheses are the frequency among the total number of birds examined. Values not in parentheses are the percent frequency, numbers, or weight, respectively, among birds containing identifiable prey remains
"entative identification 'One specimen contained 310 young-of-year
One specimen contained 155 g
0.35 in 1982 (A. Sowls & S. Morrell unpubl. data) and low in at least 2, and probably all 3, yr. The average 0.51 in 1983. Of only 4 chicks known to have hatched production during the late 1970's was about 0.38 prior to our departure in 1982, 3 died within a few days chicks per nest (Hunt et al. 1981b). of hatching. By the time we departed the island in 1983, only 3 chicks remained from 117 eggs that were laid in 230 nests. As in the year before, most chicks Murre and kittiwake prey died, generally within a week of hatching.
Red-legged kittiwakes on St. George I . fledged The prey of thick-billed murres Un'a lornvia, corn- about 0.3 chicks per nesting attempt in 1980; in 1981 mon murres U. adge and kittiwakes on St. Matthew I. they laid about 0.4 eggs and fledged at most 0.1 chick included a variety of fishes and invertebrates (Tables 1 per attempt. Reproductive success since 1981 has been & 2). Invertebrates were apparently important in the

6 Mar Ecol. Prog. Ser 32: 1-12, 1986
a ''1 E 40
20
0 JUN 1-20JUL 21 JUL-
I0 AUG
Fig. 3. Uria lomvia and U. aalge. Estimated biomass (geomet- ric mean wet weight) of fishes in diets of thick-billed murres
(TBMU) and common murres (COMU) at St. Matthew I.
Table 3. Importance of Age 0 pollock (as a proportion of all pollock) to murres and kittiwakes on St. Matthew I
TBMU COMU BLKI 1982 1983 1982 1983 1982 1983
Frequency 69 37 82 45 0 0 Number 99 68 88 21 0 0 Biomass 59 8 16 1 0 0
diets, judging from their frequency of occurrence in the samples, particularly so for luttiwakes in 1982 when only 1 fish was found in 16 samples. Among the fish, pollock contributed the most biomass to murres and kittiwakes in both summers. The diets of murres and black-legged kittiwakes on the Pribilof Is. (Hunt et al. 1981a) are similar to those on St. Matthew I., in that pollock is the single most important prey species. Red- legged kittiwakes on the Pribilof Is. feed on a signifi- cant amount of fishes in the family Myctophidae in addition to pollock (Hunt et al. 1981a).
The biomass of fish, primarily pollock, in murre diets
on St. Matthew I. increased by about an order of mag- nitude between 1982 and 1983 (Fig. 3). Age 0 pollock were much less important in 1983 than in 1982 (Table 3), and the only other age class that contributed to the diets was the Age 1 cohort. The increase in pollock biomass in murre diets probably reflected an increase in the availability of Age 1 pollock in 1983, a conclu- sion supported by data on pollock recruitment discuss- ed below.
Murre and kittiwake growth
The growth rates of red-legged kittiwake chicks in 1980 and of black-legged kittiwake chicks and murre chicks on St. George I. in 1981 were all lower than growth rates during earlier years (Table 4) when the reproductive success of kittiwakes was higher. Positive correlations have been found between growth rates of kittiwake and murre chicks and their survival to the time they leave the nests (Hunt et al. 1981a, Springer et al. 1985a).
Auklets
The diet of least auklets on St. Matthew I. during the chick period, mid-July to mid-August, consisted of 80 to 90 % Calanus marshallae (Springer & Roseneau 1985). C. marshalhe is the dominant large copepod of the middle shelf domain of the southeastern Bering Sea (Cooney 1981, Smith & Vidal 1984).
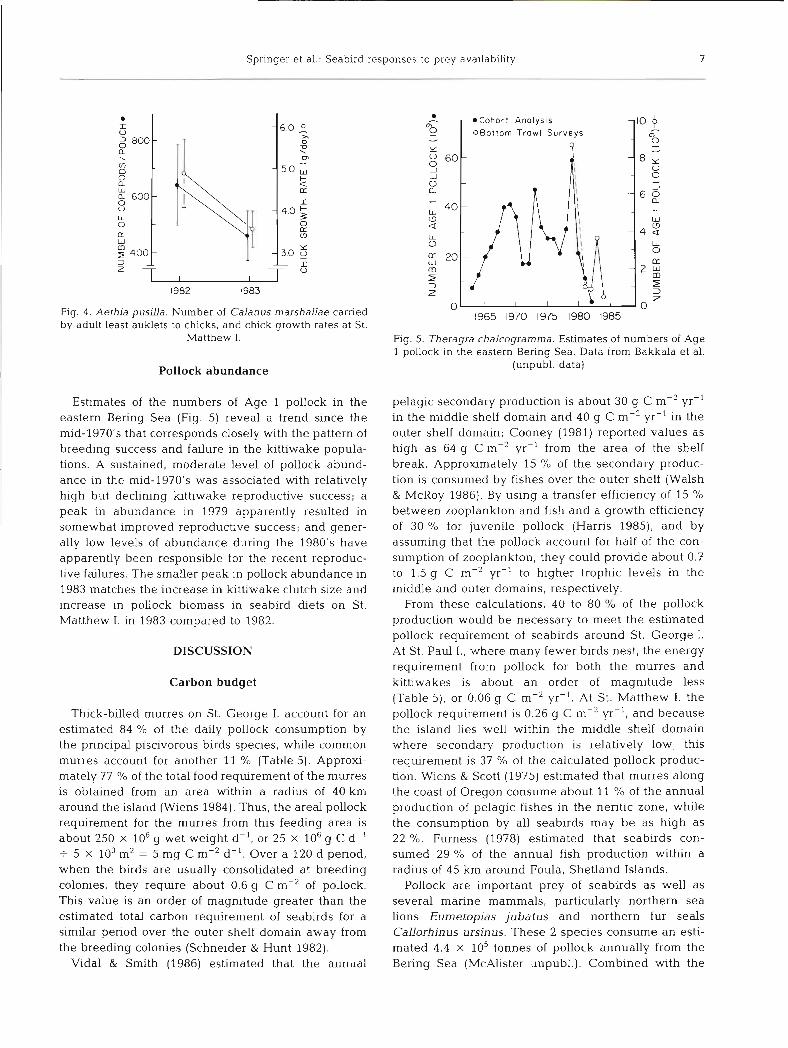
Adult auklets carry prey from feeding areas to chicks in sublingual pouches. The average number of copepods per adult pouch load declined between 1982 and 1983 (Mann-Whitney P<0.001), a change that is correlated with a similar decline (Mann-Whitney P<0.025) in chick growth rates (Fig. 4). Both changes indicate that copepod abundance declined between the 2 yr.
Table 4. Growth rates of kittiwake and murre chicks on St. George I. Arithmetic mean, g d-l 2 standard deviation (sample size). Data for 1976-1978 are from Hunt et al. (1981b)
Bird species
Black-legged httiwake 11.5 * 2.6 (24)
Red-legged luttiwake 10.5 2 2.1 (12)
Common murre 7.0 + 2.9 (4)
Th~ck-billed rnurre 6.0 + 3.0 (23)
nd: no data
Springer et al . : Seabird responses to prey availability 7
Fig. 4 . Aethia pusllla. Number of Calanus marshallae carried by adult least auklets to chicks, and chick growth rates at St.
Matthew I.
Pollock abundance
Estimates of the numbers of Age 1 pollock in the eastern Bering Sea (Fig. 5) reveal a trend since the mid-1970's that corresponds closely with the pattern of breeding success and failure in the kittiwake popula- tions. A sustained, moderate level of pollock abund- ance in the mid-1970's was associated with relatively high but declining kittiwake reproductive success; a peak in abundance in 1979 apparently resulted in somewhat improved reproductive success; and gener- ally low levels of abundance during the 1980's have apparently been responsible for the recent reproduc- tive failures. The smaller peak in pollock abundance in 1983 matches the increase in kittiwake clutch size and increase in pollock biomass in seabird diets on St. Matthew I , in 1983 compared to 1982.
DISCUSSION
Carbon budget
Thick-billed murres on St. George I. account for an estimated 84 % of the daily pollock consumption by the principal piscivorous birds species, while common murres account for another 11 % (Table 5). Approxi- mately 77 % of the total food requirement of the murres is obtained from an area within a radius of 40 km around the island (Wiens 1984). Thus, the area1 pollock requirement for the murres from this feeding area is about 250 X 106 g wet weight d-l, or 25 X 106 g C d-' + 5 X 10³ m2 = 5 mg C m-2 d-l. Over a 120 d period, when the birds are usually consolidated at breeding colonies, they require about 0.6 g C m-2 of pollock. This value is an order of magnitude greater than the estimated total carbon requirement of seabirds for a similar period over the outer shelf domain away from the breeding colonies (Schneider & Hunt 1982).
Vidal & Smith (1986) estimated that the annual
- m *Cohort Anolysis 9 08ottorn T r o w l S u r v e y s U
m
Y 9 - 9
U
- 8 , S U
g J
40 W
a L - 4 z 0 L - 0
20- (L
m Z 3 z 3
0 I 1 I I 0 1965 1970 1975 1980 1985
Flg. 5. Theragra chalcogramma. Estimates of numbers of Age 1 pollock in the eastern Bering Sea . Data from Bakkala et al.
(unpubl. data)
pelagic secondary production is about 30 g C m-' yr-' in the middle shelf domain and 40 g C m-2 yr-' in the outer shelf domain; Cooney (1981) reported values as high as 64 g C m-2 yr-' from the area of the shelf break. Approximately 15 % of the secondary produc- tion is consumed by fishes over the outer shelf (Walsh & McRoy 1986). By using a transfer efficiency of 15 % between zooplankton and fish and a growth efficiency of 30 % for juvenile pollock (Harris 1985), and by assuming that the pollock account for half of the con- sumption of zooplankton, they could provide about 0.7 to 1.5 g C m-2 yr-' to higher trophic levels in the middle and outer domains, respectively.
From these calculations, 40 to 80 % of the pollock production would be necessary to meet the estimated pollock requirement of seabirds around St. George I . At St. Paul I., where many fewer birds nest, the energy requirement from pollock for both the murres and kittiwakes is about an order of magnitude less (Table 5), or 0.06 g C m-' ~ r - ' . At St. Matthew I. the pollock requirement is 0.26 g C m-' ~ r - ' , and because the island lies well within the middle shelf domain where secondary production is relatively low, this requirement is 37 % of the calculated pollock produc- tion. Wiens & Scott (1975) estimated that murres along the coast of Oregon consume about 11 % of the annual production of pelagic fishes in the neritic zone, while the consumption by all seabirds may be as high as 22 %. Furness (1978) estimated that seabirds con- sumed 29 % of the annual fish production within a radius of 45 km around Foula, Shetland Islands.
Pollock are important prey of seabirds as well as several marine mammals, particularly northern sea lions Eurnetopias jubatus and northern fur seals Callorhlnus ursinus. These 2 species consume an esti- mated 4.4 X 10' tonnes of pollock annually from the Bering Sea (McAlister unpubl.). Combined with the

8 Mar Ecol. Prog. Ser. 32: 1-12, 1986
Table 5. Estimates of pollock consumption by murres and kittiwakes breeding on the Pribilof Is. and St. Matthew I
Weight St. George I St. Paul I. St. Matthew & Hall Is. (g)" Numberb % Con- Numberh % Con- Number' % Con-
Bird species Pollock' sump.d Pollockc sump." Pollock' sump.'
Black-legged luttiwake 450 72 000 58 6 31 000 58 2 70000 80 8 Red-legged Iuttiwake 375 220000 28 7 2200 28 < 1 Common murre 980 190000 71 40 39000 71 8 300000 87 7 6 Thick-billed murre 1080 1500000 60 290 110000 60 - 21 300000 77 75 -
343 3 1 159
" From Hunt et al. 1981b From Hickey & Craighead 1977 ' Percent pollock volume of diet total volume; from Hunt et al. 1981b
Grams wet weight ( X 104) d-', calculated as weight of bird X number X % pollock X food requirement (% body wt. d-'). The food requirement of all species was set at 0.3, a conservative estimate (see Wiens & Scott 1975, Schneider & Hunt 1982)
" From Sowls et al. 1978 I This study
Table 6. Estimates of the size of the pollock population in the eastern Bering Sea. From Smith (1981) and Bakkala et al. (unpubl.)
Region and time period Method Estimated population
( X 10-= tonnes)
A. Based upon research survey data Eastern Bering Sea shelf, Unimak Pass to 61" N (Aug to Oct 1975) 1 2.426 Eastern Bering Sea shelf. Unimak Pass to 59" N (Apr to Jun 1976) 1 0.679
B. Based upon commercial fisheries data Eastern Bering Sea shelf, INPFC Areas 1 and 2 (1969-1970) 2.3 -2.6 Eastern Bering Sea shelf, INPFC Areas 1 and 2 (1970) 2.3 -2.4 Eastern Bering Sea, primarily (INPFC Areas 1 and 2 (1964-1971) 3.4.55.83
C. Based upon model estimates Eastern Bering Sea shelf (1983) 2 8.8 Eastern Bering Sea shelf (1983) 3 9.0 Eastern Bering Sea shelf (1983) 4 7.9
Estimation methods; 1, area swept; 2, cohort analysis; 3, fishable biomass virtual population analysis; 4, catch-age analysis International North Pacific Fisheries Commission
estimated annual consumption of pollock by all sea- birds on the eastern Bering Sea shelf, about 1 .4 X 105 tonnes (Hunt et al. 1981a), the total is about 50 % of the present commercial catch. The harvest of pollock by marine birds and mammals and by the commercial fishery, therefore, comes to about 1.5 X 10⁶ tonnes annually.
Estimates of the population size of pollock in the eastern Benng Sea during the 1970's and 1980's are variable (Table 6). The annual removal by the 3 groups of consumers equals only about 20 % of the highest biomass estimate of the population based on models (Table 6C), but is a much higher percentage of the estimates made from survey and fisheries data (Table
6A,B). Based on a carbon budget for the southeast Benng Sea, Walsh & McRoy (1986) concluded that a harvest level of 1.7 X 10⁶ tonnes removed all of the annual pollock production. Their model used a produc- tion to biomass ratio of 1 for pollock, which implies a smaller standing stock than most of the estimates based on survey and fisheries data, and considerably smaller than that based on model estimates.
The value of Walsh & McRoy (1986) was calculated on the basis of production over the outer shelf domain. However, because juvenile pollock, particularly Age 1 fish, tend during summer to migrate higher onto the shelf, into the middle domain (Smith 1981), the pollock production calculated by Walsh & McRoy probably
Springer et al.. Seabird res iponses to prey availability 9
underestimates the actual value. Still, the combined harvest of pollock by all consumers appears to be a significant fraction of the annual production, and could lead to food limitation in this food web.
Trophic interactions
The herbivorous zooplankton community, chiefly calanoid copepods, of the outer shelf domain consumes an estimated 42 % of the annual phytoplankton pro- duction (Walsh & McRoy 1986). This value is mislead- ing, however, because about half of the fixed carbon each season derives from the production of Phaeocystis pouchetti, a non-silicous haptophyte not generally grazed by the zooplankton: the zooplankton commun- ity controls the population of diatoms such as Thalas- siosira spp. and Chaetoceros spp. by consuming nearly the entire production (Kocur 1982). Because of this, annual differences in diatom production, which can vary at least 30 '10 between years, might account for observed variations in zooplankton production over the southeastern shelf (Sambrotto & Goering 1983).
Close coupling between diatoms and zooplankton can serve as the basis for a conceptual model of highly efficient energy transfer throughout the pelagic food web. Thus, the suggestion by Smith & Vidal (1984, 1986) that numbers of Neocalanus pluinchrus and N. cristatus decline rapidly in early summer because of predation by fishes and other vertebrates can be placed in the context of such a model. Although losses from the upper water column occur seasonally as the Stage 5 copepodites begin their ontogenetic migra- tions to deep water off the continental shelf, the sampl- ing by Smith & Vidal extended essentially to the bot- tom, which, in their opinion, provided evidence of predatory rather than migratory losses. The authors supported their conclusion by citing evidence of sub- stantial mortality of late copepodite stages of other large-bodied copepods, which has been attributed to fish predation (see Mullin & Brooks 1970, Steele 1974).
The relations between the biology of seabirds and the abundance of pollock also fit with this model by indicating that food limits populations of avian plank- tivores and piscivores, and by suggesting the following trophic interactions among these taxa, the copepods and the pollock.
(1) Over the longer term, i.e. decade, the pattern of reproductive success of both kittiwake species on the Pribilof Is, matches very closely the pattern of recruit- ment of Age 1 pollock. Uniformly lower growth rates of kittiwake and murre chicks in the early 1980's com- pared to those in 1976-78 reinforces the impression that a lack of sufficient food has been responsible for the kittiwake breeding failures.
(2) Over the shorter term, i.e. between years, kit-
tiwakes and murres on St. Matthew I. consunled a much greater biomass of Age 1 pollock in 1983 than in 1982. According to the available data on pollock stocks, the recruitment of Age 1 pollock was about 3- fold greater in 1983 than in 1982. The concomitant decrease in the importance of Age 0 pollock in murre diets between the 2 yr could have been related to the relative survival of the 1981-1983 year classes. Greater food availability for the piscivorous species in 1983 could account for the increase in clutch sizes of kit- tiwakes that year, even though the overall reproduc- tive success of kittiwakes remained very low. It could also account for laylng dates of murres that were about 2 wk earlier in 1983 than in 1982 (Springer e t al. 1985b); earlier laying by murres is also often associ- ated with higher levels of reproductive success (Birk- head & Nettleship 1981, Murphy et al. 1986). At other colonies in northern Alaska, we have seen similarly close relations between murre and kittiwake food habits, breeding phenology and reproductive success during continuous studies over the past decade (Springer e t al. 1984, 1985a,b, unpubl. data, Murphy et al. 1986).
(3) In contrast to the improvement for the piscivo- rous species on St. Matthew I. between 1982-1983, conditions declined for the planktivores, apparently because of a change in the availability of copepods. The number of copepods brought to least auklet chicks, which w e use as a measure of copepod abund- ance, and the subsequent chick growth rates were both significantly lower in 1983 than In 1982. Opposite trends in populations of planktivores and piscivores would be expected if pollock are sufficiently numerous to affect copepod biomass. With all other factors remaining equal, the estimated 3-fold increase in num- bers of Age 1 pollock between 1982-1983, and the consequent increase in their total food share, might account for the decline in copepod abundance; pollock brought by adult murres to chicks on St. Matthew I. had been feeding on Calanus rnarshallae, as well as on other zooplankton, fishes and amphipods.
(4) Earlier studies of the diets of seabirds on the Pribilof Is. indicated that myctophid fishes were perhaps the most important prey of red-legged kit- tiwakes, although they fed on pollock also (Hunt et al. 1981a). This proposed dependence on myctophids has been cited as evidence of a trophic distinction between red-legged kittiwakes and black-legged kittiwakes, which take a much greater proportion of pollock (Iver- son e t al. 1979, Hunt et al. 1981a). The parallel decline in the reproductive success of the 2 kittiwake species suggests either that pollock are much more important in the diet of red-legged kittiwakes than was previ- ously thought, or that stocks of myctophids have under- gone changes in abundance similar to those of pollock.
10 Mar Ecol. Prog. Ser. 32: 1-12, 1986
CONCLUSIONS
Notwithstandlng the higher productivity of both kit- hwake species on the Pribilof Is. in 1979-80, there has been a prolonged, downward trend in productivity since 1975-76. Also, in spite of peaks in 1979 and 1983, apparently there has been a decline in pollock recruit- ment during the same time. Evidence of declining numbers of breeding piscivorous seabirds on the Pribilof Is. since 1976 (Craighead & Oppenheim 1985, Johnson unpubl.) could be related to this trend. The strong relation between seabird biology, on a local scale, and estimates of pollock recruitment, on a re- gional scale, suggests that such comparisons are valid.
The carbon budget calculations indicate that breed- ing seabirds on the Pribilof Is. and St. Matthew I. consume a large fraction of the pollock production. The demand on St. George I., i.e. at least 40 to 80 '10, seems excessive, yet it is consistent with the suggestion that food Limitation depresses reproductive performance of seabirds on St. George I. compared to St. Paul I. (Hunt et al. 1981b). Factors that would change the estimate of the potential pollock production operate in 2 direc- tions. For example, the seasonal declines in zooplank- ton abundance reported by Smith & Vidal (1984, 1986) might indicate that more than 15 O/O of the annual secondary production is eaten, which could lead to a greater production of pollock. On the other hand, pol- lock might not consume as much as half of the zoo- plankton, which would lower the estimate of pollock production.
There is no accepted explanation of the conditions that determine year class strength in pollock (Wooster 1983, Ito 1984). Pollock broadcast large numbers of pelagic eggs (Smith 1981), and occasional years of exceptional recruitment can be important in maintain- ing the population. Peaks in the abundance of Age 1 fish, as occurred in 1979 and 1983, might in turn be important in maintaining seabird populations. This possibility is suggested by the substantial improve- ment in kittiwake reproductive success on the Pribilof Is. in 1979, and by the sharp rise in pollock biomass in murre and kittiwake diets between 1982-83 on St. Matthew I, with the associated earlier laying by murres and increase in kittiwake clutch sizes in 1983. The concomitant decrease in the number of copepods brought to auklet chicks by adults and in the chick growth rates on St. Matthew I. from 1982 to 1983 suggests trophic interactions among the members of this pelagc food web.
The commercial pollock fishery began in the mid- 1960's, reached a peak in total catch in 1972, and then declined through 1976 due in part to the enactment of catch quotas and the establishment of the 200 mile Fishery Conservation Zone (Bakkala et al. unpubl.). By
1974, 2 indices of relative stock abundance, catch per unit effort (CPUE), United States method, and CPUE, International North Pacific Fisheries Commission method, had fallen 70 and 40 O h , respectively, a trend that might have started as early as 1969. These declines in the CPUE are evidence of a decline in the pollock population (Bakkala et al. unpubl.). Three methods used to model pollock stocks - cohort analy- sis, fishable biomass virtual population analysis and catch-age analysis - all indicate a decline in pollock biomass between 1971-79 similar in magnitude to the declines evident in the CPUE data (Bakkala et al. unpubl.). The model estimates further indicate a recov- ery during the early 1980's, resulting in large part from the growth of the exceptionally strong 1978 year class. However, repeated years of poor recruitment, con- tinued fisheries pressure and the uncertainty of environmental conditions are now growing causes for concern as the aging breeding stock passes through the population.
Acknowledgements We thank B. Cooper, S. Cooper, R. Day, E. Hoberg, M. Hoberg, B. Lawhead and P. Martin for assist- ance in the field, A. Sowls for allowing us to use his unpub- lished data from St. Matthew I. , and T. Parsons and 2 anonym- ous reviewers for their constructive criticisms of an earlier draft of this manuscript. This study was funded in part by the Minerals Management Service, Department of the Interior, through an Interagency Agreement with the National Oceanic and Atmospheric Administration, Department of Commerce, as part of the Alaska Outer Continental Shelf Environmental Assessment Program. Additional funding was provided by the National Science Foundation, grants DPP- 7623340 and DPP-8405286.
LITERATURE CITED
Adams, A. E. (1979). The food habits of three midwater fishes (Stenobrachius leucopsarus, Stenobrachius nannochir, and Leuroglossus schmidti) from the southeastern Bering Sea. M. Sc. thesis, University of Alaska, Fairbanks
Birkhead. T. R., Nettleship, D. N. (1981). The adaptive signifi- cance of egg size and laying date in Thick-bded Murres Uria lomvia. Ecology 63: 30&306
Clarke, M. E. (1978). Some aspects of the feeding of larval walleye pollock (Theragra chalcogramma, Pallas) in the southeast Bering Sea. M. Sc. thesis, University of Alaska, Fairbanks
Cooney, R. T. (1981). Bering Sea zooplankton and micronec- ton communities with emphasis on annual production. In: Hood. D. W., Calder. J. A. (ed.) The eastern Bering Sea shelf: oceanography and resources, Vol. 2. Office of Marine Pollution Assessment, NOAA, Juneau, Alaska, p. 947-974
Craig, P. C , Haldorson, L. (1981). Part 4. Fish. In: Johnson, S. R. , kchardson, J . W. (ed.) Beaufort sea barrier island - lagoon ecological process studies: final report, Simpson Lagoon U.S. Dep Commer., NOAA, OCSEAP Final Rep. 7: 384-678
Craighead, F. L., Oppenheim, J . (1985). Population estimates and temporal trends of Pribilof Island seabirds. U.S. Dep. Comrner., NOAA, OCSEAP, Final Rep. 30: 307-355

Springer et al.: Seabird responses to prey availability 11
DeGange. A. R., Sowls. A. L. (1978). A fauna1 reconnaissance of the Bering Sea National Wildlife Refuge. Field Rep. No. 77-039. U.S. Fish and Wildlife Service, Anchorage. Alaska
Frost, K. J., Lowry, L. F. (1981). Trophic importance of some manne gadids in northern Alaska and their body-otolith size relationships. Flsh. Bull. U.S. 79: 187-192
Frost, K. J., Lowry, L. F. (1984). Trophic relationships of vertebrate consumers in the Alaskan Beaufort Sea. In: Barnes, P. W., Schell. D. M., Reimnitz. E. (ed.) The Alas- kan Beaufort Sea. Academic Press, Orlando, Florida, p. 381401
Furness, R. W. (1978). Energy requirements of seabird com- munities: a bioenergetics model. J. Aninl. Ecol. 47: 3 S 5 3
Furness, R. W. (1984). Modelling relationships among fisheries, seabirds and marine mammals. In: Nettleship. D. N.. Sanger, G. A., Springer, P. F. (ed.) Marine birds: their feeding ecology and commercial fisheries relation- ships. Canadian Wildlife Service, Ottawa, p. 117-126
Gambell, R. (1985). Birds and mammals - Antarctic whales. In: Bonner, W N., Walton, D. W. H. (ed.) Key environ- ments - Antarctica. Pergamon Press, Oxford, p. 223-241
Harris, R. K. (1985). Body composition (carbon, nitrogen and calories) and energetics of immature walleye pollock, Theragra chalcogramma (Pallas), in the southeastern Ber- ing Sea. M. Sc. thesis, University of Alaska, Fairbanks
Hickey, J. J.. Craighead, F. L. (1977). A census of seabirds on the Pribilof Islands. U.S. Dep. Commer., NOAA. OCSEAP. Final Rep. 2: 96-195
Hunt, G. L., Jr . , Burgeson, B., Sanger, G. A. (1981a). Feeding ecology of seabirds of the eastern Bering Sea. In: Hood, D. W., Calder, J. A. (ed.) The eastern Bering Sea shelf. oceanography and resources, Vol. 2. Office of Marine Pol- lution Assessment, Juneau. Alaska, p. 62%648
Hunt, G. L.. Jr., Eppley, Z.. Burgeson, B., Squibb, R. (1981b). Reproductive ecology, food and foraging areas of seabirds nesting on the Pribilof Islands, 1975-1979. U.S. Dep. Com- mer., NOAA, OCSEAP, Final Rep. 12: 1-257
Ito, D. H. (ed.) (1984). Proceedings of the workshop on walleye pollock and its ecosystem in the eastern Bering Sea. NOAA Tech. Memo. NMFS F/NWC-62. National Marine Fisheries Service, Seattle, Washington
Iverson, R. L., Coachman, L. K., Cooney, R. T., English, T. S., Coering, J . J., Hunt, G. L., Jr., Macauley, M. C., McRoy, C. P., Reeburg, W. S., Whitledge, T E. (1979). Ecological significance of fronts in the southeastern Bering Sea. In: Livingston. R. J. (ed.) Ecological processes in coastal and marine systems. Plenum Press, New York, p. 437-466
Kocur, C. (1982). Phytoplankton distribution in southeastern Bering Sea shelf waters during spnng. M. Sc. thesis, Florida State University, Tallahassee, Florida
Laws, R. M. (1985). The ecology of the Southern Ocean. Am. Scient. 73: 26-40
Lee, S. S. (1985). A comparison of the feeding habits of juvenile Pacific cod and walleye pollock in the southeast- ern Bering Sea. M. Sc. thesis, University of Alaska, Fair- banks
May, R. M., Beddington, J. R., Clark, C. W.. Holt. S. J., Laws, R. M. (1979). Management of multispecies fisheries. Sci- ence, N.Y. 205: 267-277
Mullin, M. M., Brooks, E. R. (1970). Production of the plank- tonic copepod, Calanus helgolandjcus. In: Strickland, J D. H. (ed.) The ecology of the plankton off La Jolla, Cahfomia, in the period Apnl through September, 1967. B d . Scripps Inst. Oceanogr. 17: 8%103
Murphy, E. C., Springer, A. M,, Roseneau, D. G. (1986). Population status of Uria aalge at a colony in western Alaska: results and sirnulations. Ibis (in press)
Nemoto, T (1957). Foods of baleen whales in the northern Pacific. Sci. Rep. Whales Res. Inst. 12: 33-89
Nemoto, T (1959). Food of baleen whales with reference to whale movements. Sci. Rep. Whales Res. Inst. 14: 14%290
Payne, R. T (1984). Some approaches to modeling multi- species systems. In- May, R . M. (ed.) Exploitation of marine communities. Dahlem Konferenzen, Springer-Ver- lag. Berlin, p. 191-207
Pereyra, W. T., Reeves, J. E., Bakkala. R. G. (1976). Demersal fish and shellfish resources of the eastern Bering Sea in the baseline year 1975. Processed report, National Marine Fisheries Service, Seattle, Washington
Sambrotto, R. N., Goering, .l. J . (1983). lnterannual variability of phytoplankton and zooplankton production on the southeastern Bering Sea shelf. In: Wooster, W. S. (ed.) From year to year. University of Washington, Seattle, Washington
Schneider, D., Hunt, G. L. (1982). Carbon flux to seabirds in waters with different mixing regimes in the southeastern Bering Sea. Mar Biol. 67: 337-344
Smith. G. B. (1981). The biology of walleye pollock. In: Hood, D. W.. Calder, J. A. (ed.) The eastern Bering Sea shelf: oceanography and resources, Vol. 2. Office of Marine Pol- lution Assessment, NOAA, Juneau, Alaska, p. 527-574
Smith, S. L., Vidal, J . (1984). Spatial and temporal effects of salinity, temperature and chlorophyll on the communities of zooplankton in the southeastern Bering Sea. J. mar. Res. 42: 221-257
Smith, S. L , Vidal, J . (1986). Variations in the distribution, abundance, and development of copepods in the south- eastern Bering Sea in 1980 and 1981. Cont. Shelf Res. 5: 215-239
Sowls, A. L., Hatch, S. A., Lensink, C. J. (1978). Catalog of Alaskan seabird colonies. Biol. Serv. Prog., U.S. Fish and Wildlife Serv., Anchorage, Alaska
Springer, A. M,, Roseneau, D. G . , Murphy, E. C., Springer, M. I . (1984). Environmental controls of marine food webs: food habits of seabirds in the eastern Chukchi Sea. Can. J . Fish. Aquat. Sci. 41: 1202-1215
Springer, A. M,, Roseneau, D. G. (1985). Copepod-based food webs: auklets and oceanography in thc Bering Sea. Mar Ecol. Prog. Ser 21: 229-237
Springer, A. M, , Murphy, E C . , Roseneau, D. G., Springer, M. I . (1985a). Population status, reproductive ecology and trophic relationships of seabirds in northwestern Alaska. U.S. Dep. Commer., NOAA, OCSEAP. Final Rep. 30: 127-242
Springer, A. M., Roseneau, D. G. , Cooper, B. A., Cooper, S., Martin, P., McGuire, A. D., Murphy, E. C., van m e t , G. (198513). Population and trophics studies of seabirds in the northern Bering and eastern Chukchi seas, 1983. U.S. Dep. Commer.. NOAA, OCSEAP. Final Rep. 30: 243-305
Steele, J. H. (1974). The structure of marine ecosystems. Harvard Univ. Press, Cambridge
Vesin, J P , Leggett, W C., Able, K. W. (1981). Feeding ecology of capelin (MaUotus vjllosus) in the estuary and western Gulf of St. Lawrence and its multlspecies implica- tions. Can. J. Fish. Aquat. Sci. 38: 257-267
Vidal, J., Smith, S. L. (1986). Biomass, growth and develop- ment of populations of herbivorous zooplankton in the southeastern Bering Sea during spnng. Deep Sea Res. (in press)
Walsh, J. J., McRoy, C. P (1986). Ecosystem analysis in the southeastern Bering Sea. Cont. Shelf Res. 5: 241-257
Wiens, J. A. (1984). Modelling the energy requirements of seabird populations. In: Whittow. G. C., Rahn, H. (ed.) Seablrd energetics. Plenum, New York, p. 255-284

12 Mar. Ecol. Prog. Ser. 32: 1-12. 1986
Wiens, J. A., Scott, J. M. (1975). Model estimation of energy Wooster, W. S. (ed.) (1983). From year to year. Washington flow in Oregon coastal seabird populations. Condor 77: State Sea Grant, University of Washington. Seattle. 4 3 W 5 2 Washington
Thls article was presented by Professor T R. Parsons; it was accepted for printing on May 19, 1986