Sea Lions of the World - University of Rhode...
32
Characteristics of Vocalizations in Steller Sea Lions Tae-Geon Park, Kohji Iida, and Tohru Mukai Hokkaido University, Graduate School of Fisheries Sciences, Hakodate, Hokkaido, Japan Abstract We investigated the acoustics of Steller sea lion (Eumetopias jubatus) calls in wild individuals hauled out on shore reefs off the west coast of Hokkaido, northern Japan, and in captive sea lions at an aquarium us- ing video camera observations. Steller sea lion calls were classified as “communication,” “threat,” “wheedling,” and “acknowledge” according to associated behaviors. Classified calls were analyzed by means of sono- grams for formant frequency (F 1 ), sound duration (T ), and pitch pattern. All sounds emitted by males were lower in formant frequency than those of females, while sounds made by wild animals were lower than those of captive animals. Sounds by males were also longer in duration than those by females, while those made by wild animals were shorter than those by captive ones. Pitch of “communication” calls was a long flat pattern type, “threat” was a short descending type, and “wheedling” was a short ascend- ing type for wild animals and a short wave-like type for the captives. The characteristics of pitch patterns of wild and captive animals suggest that the calls of Steller sea lions are for communication. Introduction Steller sea lions are distributed along the North Pacific coast and into the Okhotsk and Bering seas. Between 300 and 500 Steller sea lions migrate annually from the Kamchatka Peninsula and Kuril Islands to the western coast of Hokkaido in northern Japan from November to April (Davies 1958, Scheffer 1958, Peterson and Bartholomew 1967, Schusterman 1981, King 1983, Loughlin et al. 1984). In the long distance migration from the Okhotsk Sea to Hokkaido, roaring sounds of sea lions may have an important role in navigation and communicating with each other. The damage caused by Steller sea lions to the fishing industry of Hokkaido Sea Lions of the World 549 Alaska Sea Grant College Program • AK-SG-06-01, 2006
Transcript of Sea Lions of the World - University of Rhode...

Characteristics of Vocalizations in Steller Sea LionsTae-Geon Park, Kohji Iida, and Tohru MukaiHokkaido University, Graduate School of Fisheries Sciences, Hakodate, Hokkaido, Japan
AbstractWe investigated the acoustics of Steller sea lion (Eumetopias jubatus) calls in wild individuals hauled out on shore reefs off the west coast of Hokkaido, northern Japan, and in captive sea lions at an aquarium us-ing video camera observations. Steller sea lion calls were classified as “communication,” “threat,” “wheedling,” and “acknowledge” according to associated behaviors. Classified calls were analyzed by means of sono-grams for formant frequency (F1), sound duration (T ), and pitch pattern. All sounds emitted by males were lower in formant frequency than those of females, while sounds made by wild animals were lower than those of captive animals. Sounds by males were also longer in duration than those by females, while those made by wild animals were shorter than those by captive ones. Pitch of “communication” calls was a long flat pattern type, “threat” was a short descending type, and “wheedling” was a short ascend-ing type for wild animals and a short wave-like type for the captives. The characteristics of pitch patterns of wild and captive animals suggest that the calls of Steller sea lions are for communication.
IntroductionSteller sea lions are distributed along the North Pacific coast and into the Okhotsk and Bering seas. Between 300 and 500 Steller sea lions migrate annually from the Kamchatka Peninsula and Kuril Islands to the western coast of Hokkaido in northern Japan from November to April (Davies 1958, Scheffer 1958, Peterson and Bartholomew 1967, Schusterman 1981, King 1983, Loughlin et al. 1984). In the long distance migration from the Okhotsk Sea to Hokkaido, roaring sounds of sea lions may have an important role in navigation and communicating with each other. The damage caused by Steller sea lions to the fishing industry of Hokkaido
Sea Lions of the World 549Alaska Sea Grant College Program • AK-SG-06-01, 2006

has resulted in studies of migration and breeding areas. However, a study on vocal communication and the acoustic characteristics of calls has not been previously done.
Materials and methodsData acquisitionThe experiments were carried out with Steller sea lions at the Muroran Municipal Aquarium, and with wild sea lions at a winter haul-out on reefs near Cape Ofuyu along the western coast of Hokkaido, northern Japan.
Three captive Steller sea lions (a 3- and a 23-year-old male, and an 18-year-old female) were recorded day and night with video cameras (TC-D5M, Sony, Japan) set atop a fence surrounding a swimming pool at the aquarium (November 1-30, 2001). The entire pool area was recorded from approximately 20 m, which did not affect the sea lions’ behaviors. Roaring sounds were recorded simultaneously using a microphone built into the video camera.
Calls and behaviors of 42-66 wild sea lions that migrated to the haul-out near Cape Ofuyu were recorded for five days (April 12-16, 2003). The video camera and a microphone recorded behaviors and vocalizations of the sea lions from sunrise to sunset.
The calls of captive and wild Steller sea lions were analyzed using an oscilloscope, FFT analyzer, and digital sonograph (Kay model DSP Sona-Graph 5500), and were compared with their behaviors recorded on videotape.
We catalogued 185 calls from three captive sea lions in 2001, and 303 calls from wild sea lions in 2003.
Classification of callsAccording to activities observed in captive Steller sea lions, each indi-vidual had specific calls that corresponded to specific behaviors. These included “communication” calls emitted to communicate with other sea lions, “threat” calls emitted to fight for or defend territory, “wheedling” calls emitted during socialization or when eating prey, and “acknowl-edge” calls emitted in response to other sea lions (Fig. 1). These specific calls were also used to distinguish vocalizations of wild sea lions. Un-fortunately, it was difficult to accurately classify the activities of wild individuals due to various environmental factors. In particular, the large numbers of sea lions at the haul-out made it almost impossible to identify individuals, as was done for captive sea lions. The characteristics of calls were classified based on the above four call types related to behaviors of captive sea lions. Three types of calls were classified (communication, threat, and wheedling) and examined in relation to the behaviors of the wild sea lions.
550 Park et al.—Vocalizations in Steller Sea Lions
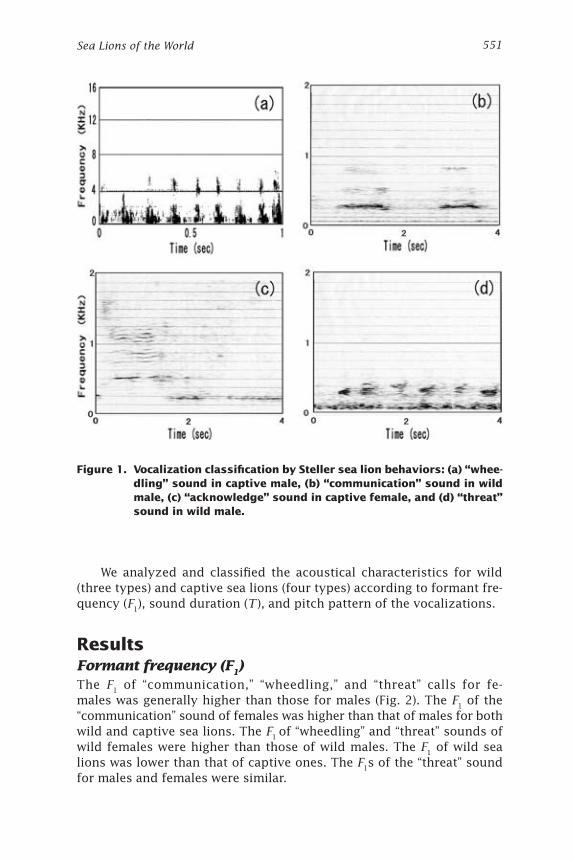
We analyzed and classified the acoustical characteristics for wild (three types) and captive sea lions (four types) according to formant fre-quency (F1), sound duration (T ), and pitch pattern of the vocalizations.
ResultsFormant frequency (F1)The F1 of “communication,” “wheedling,” and “threat” calls for fe-males was generally higher than those for males (Fig. 2). The F1 of the “communication” sound of females was higher than that of males for both wild and captive sea lions. The F1 of “wheedling” and “threat” sounds of wild females were higher than those of wild males. The F1 of wild sea lions was lower than that of captive ones. The F1s of the “threat” sound for males and females were similar.
Figure 1. Vocalization classification by Steller sea lion behaviors: (a) “whee-dling” sound in captive male, (b) “communication” sound in wild male, (c) “acknowledge” sound in captive female, and (d) “threat” sound in wild male.
551Sea Lions of the World

Figure 2. Comparison of formant frequency between males and females for wild and captive Steller sea lions.
552 Park et al.—Vocalizations in Steller Sea Lions

Figure 3. Comparison of sound duration between males and females for wild and captive Steller sea lions.
553Sea Lions of the World

Figure 4. Pitch pattern distributions of (a) “communication” sound, (b) “wheedling” sound, and (c) “threat” sound, for Steller sea lions.
554 Park et al.—Vocalizations in Steller Sea Lions
Sound duration (T)Figure 3 shows the sound durations of classified call types of wild and captive Steller sea lions. The histograms for the wild individuals show sound durations of both males and females were shorter for threat sounds than for wheedling sounds, which were shorter in turn than com-munication sounds. Additionally, sound duration of the calls of captive lions was longer than those of the wild ones.
Common feature of pitch patternsFigure 4a shows pitch pattern of “communication” for captive sea lions and wild ones. The frequency distribution of pitch patterns of “whee-dling” and “threat” sounds for captive sea lions and wild ones were similar (Figs. 4b and 4c).
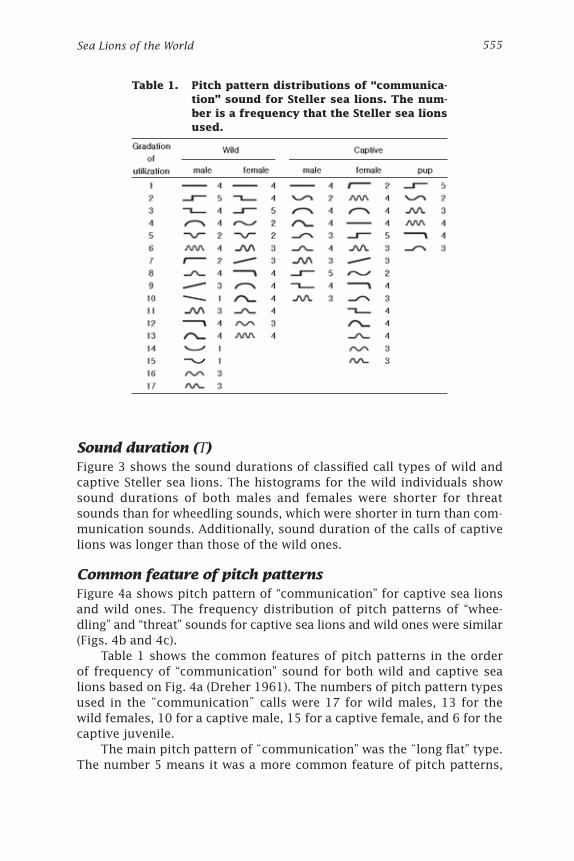
Table 1 shows the common features of pitch patterns in the order of frequency of “communication” sound for both wild and captive sea lions based on Fig. 4a (Dreher 1961). The numbers of pitch pattern types used in the “communication” calls were 17 for wild males, 13 for the wild females, 10 for a captive male, 15 for a captive female, and 6 for the captive juvenile.
The main pitch pattern of “communication” was the “long flat” type. The number 5 means it was a more common feature of pitch patterns,
Table 1. Pitch pattern distributions of “communica-tion” sound for Steller sea lions. The num-ber is a frequency that the Steller sea lions used.
555Sea Lions of the World

and the number 1 means it was a less common feature. Common features are indicative of animals that share the same environment; few common features of males and females implies they use different environments.
In the common feature of pitch pattern for the captive juvenile, 3 out of 6 types showed features in common. It can be considered as the result of learning “communication” sound from their parents in the same group. The reason that there were only a few pitch patterns was likely because juveniles are in the middle of learning.
Table 2 shows 12 pitch patterns of “wheedling” for captive male Steller sea lions and wild male and female sea lions. The primary pattern of “wheedling” was short and ascending for the wild sea lions and a short waveform for the captive male. The captive male and wild Steller sea lions had a relatively high degree of common features for “wheedling.”
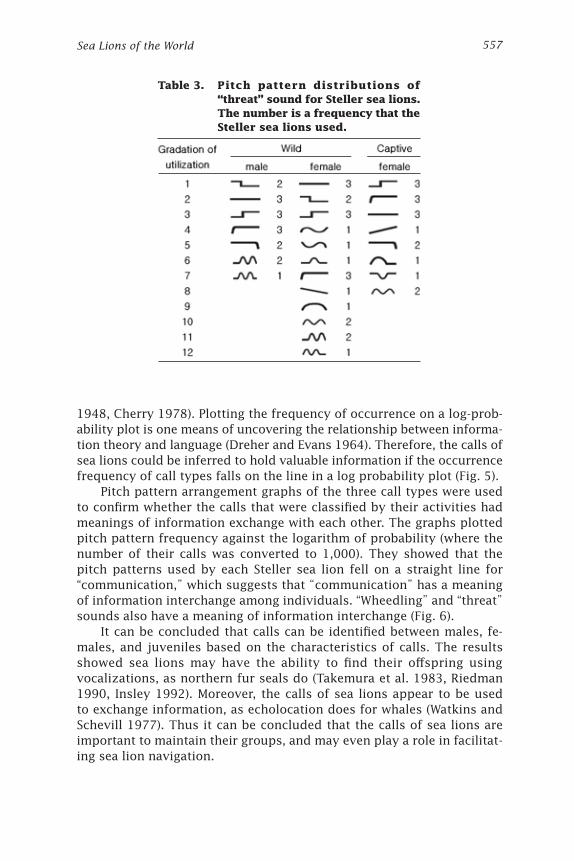
For pitch patterns used in the “threat” sound of Steller sea lions, the wild males showed 7 types, the wild females 12 types, and captive female 8 types (Table 3). The main pattern was short and descending for the wild animals. The common characteristic was low for “threat” and high for “wheedling.”
DiscussionThe English language has 26 letters of which some are repeatedly used more than other letters (Shannon 1948, Witten 1990). Information coding can be studied by analyzing the frequency of use of letters (Shannon
Table 2. Pitch pattern distributions of “wheedling” sound for Steller sea lions. The number is a frequency that the Steller sea lions used.
556 Park et al.—Vocalizations in Steller Sea Lions
1948, Cherry 1978). Plotting the frequency of occurrence on a log-prob-ability plot is one means of uncovering the relationship between informa-tion theory and language (Dreher and Evans 1964). Therefore, the calls of sea lions could be inferred to hold valuable information if the occurrence frequency of call types falls on the line in a log probability plot (Fig. 5).
Pitch pattern arrangement graphs of the three call types were used to confirm whether the calls that were classified by their activities had meanings of information exchange with each other. The graphs plotted pitch pattern frequency against the logarithm of probability (where the number of their calls was converted to 1,000). They showed that the pitch patterns used by each Steller sea lion fell on a straight line for “communication,” which suggests that “communication” has a meaning of information interchange among individuals. “Wheedling” and “threat” sounds also have a meaning of information interchange (Fig. 6).
It can be concluded that calls can be identified between males, fe-males, and juveniles based on the characteristics of calls. The results showed sea lions may have the ability to find their offspring using vocalizations, as northern fur seals do (Takemura et al. 1983, Riedman 1990, Insley 1992). Moreover, the calls of sea lions appear to be used to exchange information, as echolocation does for whales (Watkins and Schevill 1977). Thus it can be concluded that the calls of sea lions are important to maintain their groups, and may even play a role in facilitat-ing sea lion navigation.
Table 3. Pitch pattern distributions of “threat” sound for Steller sea lions. The number is a frequency that the Steller sea lions used.
557Sea Lions of the World

AcknowledgmentsThe authors thank Emeritus Professor Haruo Ogi of Hokkaido University, who motivated us to begin this research. We also thank Dr. Donhyug Kang, Dr. Myounghee Kang, Dr. Kyounghoon Lee, Mr. Takuma Takayama, and Mr. Shoji Kotani for their assistance with the experiments and in collecting material. We wish to thank the Muroran Municipal Aquarium for providing captive Steller sea lions.
Figure 5. Pitch pattern frequency relative to pattern types of “communication” sound for Steller sea lions.
558 Park et al.—Vocalizations in Steller Sea Lions

ReferencesCherry, C. 1978. On human communication. 3rd edn. MIT Press.
Davies, J.L. 1958. The Pinnipedia: An essay in zoogeography. Geogr. Rev. 48:1817-1832.
Dreher, J.J. 1961. Linguistic considerations of porpoise sounds. J. Acoust. Soc. Amer. 33:1799-1800.
Dreher, J.J., and W.E. Evans 1964. Cetacean communication. Marine Bio Acoustics, Academic Press, pp. 373-393.
Insley, S.J. 1992. Mother-offspring separation and acoustic stereotypy: A comparison of call morphology in two species of pinnipeds. Behaviour 120:103-121.
King, J.E. 1983. Seals of the world. Oxford University Press, Oxford. 240 pp.
Loughlin, T.R., D.J. Rugh, and C.H. Fiscus. 1984. Northern sea lion distribution and abundance: 1956-80. J. Wildl. Manag. 48:719-740.
Figure 6. Pitch pattern frequency relative to pattern types of “wheedling” sound and “threat” sound for Steller sea lions.
559Sea Lions of the World
Peterson, R.S., and G.A. Bartholomew 1967. The natural history and behavior of the California sea lion. Amer. Soc. Mamm. Special Publ. No. 1.
Riedman, M. 1990. The pinnipeds: Seals and sea lions. University of California, Berkeley.
Scheffer, V.B. 1958. Seals, sea lions, and walruses: A review of the Pinnipedia. Stanford University Press, Palo Alto, California. 179 pp.
Schusterman, R.J. 1981. Steller sea lion, Eumetopias jubatus (Schreber 1776). In: S.H. Ridgway and R.J. Harrison (eds.), Handbook of marine mammals. Vol. 1. Walrus, sea lions, fur seals and sea otters. Academic Press, New York, pp. 119-141.
Shannon, C.E. 1948. A mathematical theory of communication. Bell Syst. Tech. J. 27:379-423, 623-656.
Takemura, A., K. Yoshida, and N. Baba. 1983. Distinction of individual northern fur seal pups, Callorhinus ursinus, through their call. Bull. Fac. Fish. Nagasaki Univ. 54:29-34.
Watkins, W.A., and W.E. Schevill. 1977. Sperm whale codas. J. Acoust. Soc. Amer. 62(6):1485-1490.
Witten, H. 1990. Source models for natural language text. Int. J. Man-Machine Studies 32:545-579.
560 Park et al.—Vocalizations in Steller Sea Lions

Organochlorines in Walleye Pollock from the Bering Sea and Southeastern AlaskaRon HeintzNOAA Fisheries, Alaska Fisheries Science Center, Auke Bay Laboratory, Juneau, Alaska
Margaret M. Krahn and G.M. YlitaloNOAA Fisheries, Northwest Fisheries Science Center, Environmental Conservation Division, Seattle, Washington
Frank MoradoNOAA Fisheries, Alaska Fisheries Science Center, Resource Assessment and Conservation Engineering Division, Seattle, Washington
AbstractThe ubiquitous distribution and toxicity of organochlorines in high latitude food webs has been suggested as one factor in preventing the recovery of the western Steller sea lion stock. However, there are few data describing the bio-availability of these contaminants in the sub-arctic Bering Sea and Gulf of Alaska. We measured concentrations of dioxin-like and other selected polychlorinated biphenyls (PCBs), DDTs, and hexachlorobenzene (HCB) in a prey species of Steller sea lions (walleye pollock) that is distributed throughout the range of these marine mam-mals, to test the hypothesis that contaminant loads in western stock food webs would be higher than those of the eastern stock. More than 110 fish were collected from six regions: western Bering Sea, western Aleutians, eastern Aleutians, Pribilof Islands, northern Bering Sea, and southeastern Alaska. Organochlorine levels were found to correlate with fish age and size (r2 > 0.390), but were uncorrelated with lipid content. Pollock from southeastern Alaska were significantly more contaminated than Bering Sea pollock (P < 0.01) with length-corrected concentrations of 5.00 ng per g wet weight, 4.93 ng per g, and 1.15 ng per g for total PCBs (∑PCBs), total DDTs (∑DDTs), and HCB, respectively. Aerial transport and
Sea Lions of the World 561Alaska Sea Grant College Program • AK-SG-06-01, 2006

precipitation likely account for the relatively high levels of contamina-tion in southeastern Alaska. Eastern stock sea lion populations have been increasing while apparently consuming prey with higher organochlorine loads. Consequently, presence of organochlorines in high latitude food webs does not appear to be a major factor inhibiting the recovery of the western sea lion stock.
IntroductionThe toxic effects of organochlorines have been proposed as one of the causes for the decline of the western stock of Steller sea lions and its failure to recover. Steller sea lions populations from Cape Yakutaga west-ward through the Aleutian Islands (Western stock) have been declining rapidly since the 1980s. In contrast, Steller sea lion populations in British Columbia and southeastern Alaska have been slowly increasing during the same period. Included among the organochlorines are the polychlo-rinated biphenyls (PCBs), hexachlorobenzene (HCB), and many pesticides including the dichlorodiphenytrichloroethanes (DDTs). The high volatility of these compounds allows them to be carried into the upper atmosphere at low latitudes and transported to colder northern latitudes where they condense and precipitate back to the earth’s surface (AMAP 1998). Or-ganochlorines are lipophilic and are therefore readily entrained in food webs, where they can be concentrated in the lipid-rich tissues of apex predators such as Steller sea lions. Although there are programs in place for monitoring organochlorine levels and trends in Arctic regions, much less effort has been directed at the subarctic Bering Sea and northern Gulf of Alaska, an area where populations of Steller sea lions and other apex predators have been declining over the last 20 years (Springer et al. 2003). Few Steller sea lion samples are available for contaminant analysis, because of the logistical difficulty associated with the capture and biopsy of individuals in this extremely remote region. In addition, captive ani-mals are few which precludes controlled exposure studies.
Steller sea lions primarily acquire organochlorines through inges-tion, so one way to understand the risk imparted by organochlorines to Steller sea lions is to evaluate their potential exposure by examining their prey in different parts of the sea lion range. Such an analysis depends on sampling a prey item that is ubiquitously distributed throughout the sea lion range; thus the confounding effects of trophic level, ecology, and lipid content can be minimized. Fortunately, walleye pollock (Theragra chalcogramma) are a frequently encountered prey item (Merrick and Calkins 1996, Calkins 1998, Womble and Sigler 2006). Estimates of the frequency of pollock in juvenile Steller sea lion scats range from 75% in the western Aleutians to 85% in southeastern Alaska.
Previous reports have measured organochlorines in walleye pollock, but these data shed little light on the relationship of organochlorine ex-
562 Heintz et al.—Organochlorines in Walleye Pollock

posure to declining populations of pollock predators, such as Steller sea lions. The first observation (Kawano et al. 1986) measured DDT, PCB, HCB, and chlordane levels in the whole bodies of three pollock collected from the mid-shelf of the Bering sea in 1982 (Fig. 1). In 1992, de Brito et al. (1992) estimated concentrations of these same compounds in the livers of 29 pollock collected from three locations in the Bering Sea and three in the Gulf of Alaska (Fig. 1). All of these samples were collected from the region in which apex predator populations are declining, but there are no comparable data from areas where predator populations are stable. Furthermore, time trends in organochlorine levels cannot be determined from these limited data sets because different tissues were used. Beckmen (2001) describes a third set of pollock analyzed for these compounds, but the specific sampling locations are not described.
The objective of this report is to understand spatial variation of organochlorines in a prey species of Steller sea lions. We present data describing the concentrations of 15 PCB congeners, five DDTs, and HCB in the tissues of walleye pollock collected from the Bering sea and south-eastern Alaska, collected opportunistically in 2002 and 2003. In particu-lar, we tested the hypothesis that the availability of organochlorines to apex predators from the Bering Sea is the same as that in southeastern Alaska by using the levels of these organochlorines in pollock as an in-dex to their availability in local food webs. In addition we examine the
Figure 1. Sampling locations for pollock used in this study and those sampled by Kawano et al. (1986) and de Brito et al. (2002).
Russia
AlaskaCanada
Chukchi Sea
Bering Sea
Gulf of Alaska
Olyutorsky B
NavarinNBS
Attu
Kawano1986
de Brito2002
de Brito2002
de Brito2002
de Brito2002
Pribs
Akun
Lynn C
Frederick S
0 500 1,000 km
N
S
W E
563Sea Lions of the World
relative concentrations of individual PCB congeners in pollock samples to determine if the PCB composition in the food webs varies among dif-ferent geographic regions.
MethodsSample collection and preparationWalleye pollock samples were collected in the Bering Sea and southeast-ern Alaska in 2002 and 2003. In some cases, samples from locations rela-tively near each other were pooled to make collections representative of a region. Locations sampled during the summer and fall of 2002 included Frederick Sound in southeastern Alaska, Attu Island in the western Aleu-tian Islands, and Akun Island in the eastern Aleutians, a series of points along a transect between St. Lawrence and St. Matthew islands in the northern Bering Sea, Cape Navarin, and Olyutorsky Bay on the western shore of the Bering Sea. In February 2003 pollock were collected during the commercial fishery near the Priblilof Islands. Additional samples were collected from Lynn Canal in southeastern Alaska during April 2003 and added to the Frederick Sound samples to represent southeastern Alaska. Each of these sites is located on Fig. 1. Sampling dates, specific locations, and fish sizes are listed in Table 1. Samples chosen for processing were representative of the size range available at those sites during collection, with the exception of the Russian sites where size of the fish was limited by the logistics of transport back to the United States.
After collection, samples were immediately frozen and shipped as soon as possible to the NOAA Auke Bay Laboratory for preparation. Otoliths were removed and whole fish were cut in small pieces and homogenized in a commercial meat grinder. The resulting paste was spread over a 25 by 45 cm cutting board and two 5 gram samples were composited from randomly selected aliquots. One of the samples was kept for lipid extraction and the other was shipped frozen to the NOAA Montlake Laboratory in Seattle for organochlorine analysis. Samples for organochlorine analysis were stored in certified jars with Teflon lined lids. All homogenized samples were topped with nitrogen and stored at –80ºC prior to analysis. Temperature of the homogenates never exceeded 0ºC during processing. All grinding and sampling equipment was washed with hot soapy water between samples and rinsed with hexane between sets of samples from different locations. Ages of fish were determined from the otoliths at NOAA’s ageing laboratory in Seattle, Washington, by two independent readers. Their age estimates agreed 90% of the time.
Organochlorine analysis by HPLC/PDAWhole body homogenate samples of pollock were analyzed for selected organochlorines, including dioxin-like polychlorinated biphenyls (PCBs)
564 Heintz et al.—Organochlorines in Walleye Pollock

Tab
le 1
. Locati
on
nam
es a
nd
sam
ple
in
form
ati
on
for
wall
eye p
oll
ock
coll
ecte
d f
or
org
an
och
lori
ne a
naly
sis
.
Reg
ion
Loca
tion
Lati
tud
eLo
ngit
ud
eC
oll
ecti
on
d
ate
Sam
ple
si
ze
Aver
age
len
gth
(m
m)
Aver
age
wei
gh
t (g
)A
ver
age
age
(yea
rs)
SEA
KLy
nn
Can
al58º3
0'N
134º4
8'W
08-A
pr-
03
10
306.0
(73.4
)300.0
(323.4
)3.2
(1
.8)
SEA
KFr
eder
ick S
ou
nd
58º2
1'N
134º0
8'W
03-A
pr-
02
10
489.0
(92.7
)1159.2
(744.1
)7.5
(1
.0)
WA
IA
ttu
Is.
52º4
8'N
172º2
4'E
21-J
un
-02
12
456.7
(28.8
)627.1
(185.2
)4.6
(1
.5)
EAI
Aku
n I
s.54º2
4'N
165º3
0'W
19-M
ay-0
215
475.3
(28.8
)752.6
(132.6
)6.4
(1
.1)
PRIB
SPr
ibil
of
Is.
56º4
4'N
170º2
1'W
26-F
eb-0
315
443.3
(47.6
)583.3
(162.3
)6.1
(1.2
)
NBS
Nort
her
n B
erin
g S
ea60º5
7'N
171º3
1'W
28-S
ep-0
227
353.
(154.9
)537.2
(448.1
)5.1
(4
.0)
WBS
Cap
e N
avar
in61º3
5'N
178º3
6'E
1-O
ct-0
215
124.8
(79.5
)37.6
(6
1.7
)0.6
(1
.1)
WBS
Oly
uto
rsky B
ay59º3
0'N
167º0
3'E
22-S
ep-0
27
227.6
(20.4
)122.4
(2
9.5
)1.8
(0
.4)
EAI
= e
aste
rn A
leu
tian
Isl
and
s, N
BS
= n
ort
her
n B
erin
g S
ea, PR
IBS
= P
rib
ilof
Isla
nd
s, S
EAK
= s
ou
thea
ster
n A
lask
a, W
AI
= w
este
rn A
leu
tian
Isl
and
s, W
BS
= w
este
rn B
erin
g S
ea.
Nu
mb
ers
in p
aren
thes
es r
epre
sen
t 1 s
tan
dar
d d
evia
tion
.
565Sea Lions of the World

and DDTs, by a high-performance liquid chromatography photodiode array (HPLC/PDA) method (Krahn et al. 1994). Briefly, whole fish homog-enate (1.7-3.0 g), hexane/pentane (1:1 v/v), sodium sulfate (5 g), and a surrogate standard were homogenized and separated from interfering compounds (e.g., lipids, aromatic compounds) on a gravity flow cleanup column that contained neutral, basic, and acidic silica gels eluted with hexane/methylene chloride (1:1 v/v). Eight dioxin-like congeners (PCBs 77, 105, 118, 126, 156, 157, 169, 189) were resolved from other selected PCBs (PCBs 99/101/149, 110, 128, 138, 153, 170/194, and 180) and six additional organochlorines [o,p ′-DDD, p,p ′-DDD, p,p ′-DDE, o,p′-DDT, p,p ′-DDT, hexachlorobenzene (HCB)] by HPLC on two Cosmosil PYE analytical columns, connected in series and cooled to 16ºC. The congeners were measured by an ultraviolet (UV) photodiode array detector and were identified by comparing their UV spectra (200-310 nm) and retention times to those of reference standards in a library. The analyte purity was confirmed by comparing spectra within a peak to the apex spectrum.
Summed PCB (∑PCB) concentrations were calculated using the follow-ing formula: ∑PCBs = ∑concentrations of 15 PCBs listed above (based on individual response factor) + ∑concentrations of other PCB congeners (calculated by summing areas of peaks identified as PCBs and using an average PCB response factor). Summed DDT (∑DDTs) concentrations were calculated by summing the concentrations of five DDTs (o,p ′-DDD, p,p′-DDD, p,p ′-DDE, o,p ′-DDT, p,p ′-DDT).
Lipid extractionLipid was extracted using a modification of Folch’s method (1957) out-lined by Christie (1989) using a Dionex Accelerated Solvent Extractor (ASE) 200. Approximately 1 g of wet homogenate was mixed with a drying agent (Hydromatrix) and masticating agent (sand) and loaded into ASE cells. Samples were extracted using a 2:1 (v:v) chloroform:methanol solvent at 1,200 psi and 120ºC. Following extraction, the filtrate was washed to re-move the coextractables with a 0.88% KCl solution followed by a solution of 1:1 (v:v) methanol:deionized water, both in a volume equal to 25% of the extract volume. Excess solvent was evaporated to reduce the sample volume to 1 ml. Percent lipid was calculated gravimetrically.
Quality assuranceDuring lipid extraction, quality assurance samples were extracted with each batch of 17 samples and these included (1) a blank, (2) a replicate sample consisting of a second aliquot of homogenate of one of the samples in the batch, and (3) a reference sample of herring homogenate, which had been previously characterized for lipid content. Accuracy of the estimate for the reference sample, repeatability, and method cleanliness were required to meet laboratory criteria or the batch was re-extracted.
566 Heintz et al.—Organochlorines in Walleye Pollock

To monitor the accuracy of our HPLC/PDA method, a National In-stitute of Standards and Technology (NIST) Standard Reference Material (blue mussel SRM1974b or fish homogenate SRM1946) was analyzed with each sample set and results met laboratory criteria (Wise et al. 1993). Ap-proximately 10% of fish homogenate samples were analyzed in duplicate to measure precision of the method, and the laboratory quality assur-ance criteria were met for all analytes detected in these samples. Method blanks also met laboratory criteria.
Statistical analysis Sample collections varied in average fish size and age (Table 1), suggest-ing the presence of important covariates with location in the analysis of the sample collections. Consequently, statistical analysis began by understanding how age, size, and lipid content related to the observed organochlorine concentrations. The observed concentrations of ∑PCBs, ∑DDTs, and HCB were plotted against length, age, and lipid content (percent wet weight) for the entire data set and the resulting relationship evaluated by linear regression. Observations below detection limit were set to zero. In addition, the relationships between the covariates were also examined by linear regression.
Spatial variation in organochlorine content was examined by ordinal logistic regression with region as a factor and age as a covariate. Logistic regression was used because organochlorine concentrations in different regions were not normally distributed and had heterogeneous variances. Ordinal logistic regression requires categorical response variables, so the organochlorine contents of all specimens were sorted and assigned to deciles. Consequently, the regression examined the frequency distribu-tion of deciles within each region, while accounting for differences in age. When assigning deciles to observations of ∑DDTs, 32 of the 111 samples were found to have undetectable DDT levels; these were removed from the analysis. Finally, ANCOVA was used to calculate least square mean or-ganochlorine contents for fish from each region using age as a covariate. These values were not tested, but are used here to report representative age-normalized values for contaminant load in different regions. In the event that an interaction between age and region was found to influence organochlorine levels, the slopes of the age and organochlorine relation-ships between regions were compared using Student’s t test.
Compositional differences in the organochlorines found in fish from different geographical regions were examined by a combination of ANCOVA and multivariate analysis of covariance (MANCOVA). The ob-served concentrations of PCB congeners found to be above the detection limit in at least two fish from each region were examined individually by ANCOVA with region as the main factor and age as the covariate. Prior to analysis, the concentrations were transformed by dividing each congener’s concentration by the observed ∑PCBs to generate relative con-
567Sea Lions of the World

centrations. In addition, the entire group of congeners was subsequently examined together by MANCOVA to test the hypothesis that the relative concentrations of the congeners varied among regions.
ResultsRelationships between covariates and organochlorine concentrationsThere were strong relationships between the organochlorine content of pollock and their lengths. Average values (±1 s.d.) for ∑PCBs ranged from 1.40±0.55 to 5.79±4.00 ng per g wet weight in samples from western Bering Sea and southeastern Alaska, respectively (Table 2). Coincidently, these two collections represent those with the smallest and largest pol-lock, respectively (Table 1). The linear regression between the ∑PCBs and length for all of the fish sampled was significant (P < 0.0005, r2 = 0.252). However, a scatter plot of the relationship indicated an exponential curve was better at describing this relationship (Fig. 2). This was confirmed by
RegionEAINBSPRIBSSEAKWAIWBS
Ln ( PCBs ng/g ww)
3
2
1
0
-1
-2
0 100 200 300 400 500 600 700
Length
Figure 2. Relationship between natural log of ∑ PCBs (ng per g wet weight) and length (mm) for pollock in the Bering Sea and southeastern Alaska. The line depicts the regressed fit for all samples. Abbre-viations: EAI = eastern Aleutian Islands, NBS = northern Bering Sea, PRIBS = Pribilof Islands, SEAK = southeastern Alaska, WAI = western Aleutian Islands, WBS = western Bering Sea.
568 Heintz et al.—Organochlorines in Walleye Pollock

Tab
le 2
. O
bse
rved
avera
ge lip
id c
on
ten
t an
d o
rgan
och
lori
ne c
on
cen
trati
on
s in
wall
eye p
oll
ock
fro
m d
iffere
nt
locati
on
s.
On
ly t
hose c
on
gen
ers
are
sh
ow
n f
or
wh
ich
con
cen
trati
on
s w
ere
ab
ove d
ete
cti
on
lim
its.
Reg
ion
Loca
tion
% L
ipid
PCB c
on
gen
er n
g p
er g
∑PC
B
ng p
er g
∑D
DT
n
g/g
HC
B
ng/g
101
110
118
138
153
SEA
KLy
nn
Can
al2.1
8(0
.68)
1.7
8
(0.7
7)
0.0
5(0
.11)
0.3
82
(0.3
4)
0.2
4(0
.33)
0.8
2(0
.64)
4.2
8(2
.65)
3.8
0(3
.34)
0.8
9
(0.2
8)
SEA
KFr
eder
ick S
ou
nd
4.0
2(1
.71)
1.5
3
(0.9
1)
0.2
4
(0.1
8)
0.8
0
(0.5
1)
0.4
4(0
.62)
1.5
4(0
.84)
7.3
0
(4.6
1)
8.3
6
(6.8
1)
1.6
2
(0.5
4)
WA
IA
ttu
Is.
2.4
8(1
.33)
0.6
5
(0.2
8)
0.0
3
(0.0
9)
0.0
5
(0.1
2)
0.3
7(0
.16)
0.8
2(0
.27)
1.7
0
(0.7
4)
1.3
3
(0.6
3)
0.3
0
(0.4
1)
EAI
Aku
n I
s.3.5
5(1
.03)
1.1
7
(0.4
0)
0.0
7
(0.1
9)
0.3
5
(0.3
8)
0.3
1(0
.19)
0.9
0(0
.26)
2.8
8
(0.9
8)
1.6
5
(0.5
8)
1.3
7
(0.4
0)
PRIB
SPr
ibil
of
Is.
3.7
2(1
.65)
1.1
8
(0.2
8)
0.0
6
(0.1
1)
0.1
0
(0.1
1)
0.0
8(0
.11)
0.6
1(0
.11)
2.1
7
(0.3
8)
0.8
9
(0.2
2)
1.4
7
(0.4
1)
NBS
Nort
her
n B
erin
g
Sea
4.1
6(2
.29)
1.1
8
(1.3
0)
0.1
2
(0.1
5)
0.1
1
(0.1
5)
0.1
3(0
.22)
0.3
8(0
.35)
2.5
4
(1.8
5)
0.8
1
(0.9
8)
1.0
9
(0.4
6)
WBS
Cap
e N
avar
in5.5
6(1
.34)
1.1
2
(0.5
6)
0.0
6(0
.11)
nd
nd
0.0
7(0
.15)
1.3
5
(0.5
3)
nd
0.9
2
(0.1
8)
WBS
Oly
uto
rsky B
ay5.2
5(1
.68)
1.2
6
(0.7
6)
n.d
nd
nd
0.1
5(0
.16)
1.5
0
(0.6
3)
nd
0.7
6
(0.2
1)
EAI
= e
aste
rn A
leu
tian
Isl
and
s, N
BS
= n
ort
her
n B
erin
g S
ea, PR
IBS
= P
rib
ilof
Isla
nd
s, S
EAK
= s
ou
thea
ster
n A
lask
a, W
AI
= w
este
rn A
leu
tian
Isl
and
s, W
BS
= w
este
rn B
erin
g S
ea.
All
con
cen
trat
ion
s ar
e ex
pre
ssed
as
ng c
om
pou
nd
per
g w
et w
eigh
t. N
um
ber
s in
par
enth
eses
rep
rese
nt
1 s
tan
dar
d d
evia
tion
.n
d =
an
alyte
s w
ere
not
det
ecte
d.
569Sea Lions of the World

regressing the natural logarithm of ∑PCBs against length (P < 0.005, r2 = 0.398). Similarly, the concentrations of ∑DDTs varied with fish size, rang-ing from non-detectable to 6.08±5.72 ng per g wet weight for fish from the western Bering Sea and southeastern Alaska, respectively. While the regressed relationships between fish length and the natural logarithms of ∑DDTs and HCB were also significant (P < 0.0005), they were weakly correlated (r2 < 0.140).
Age was directly related to contaminant load (Fig. 3). There was a linear relationship between age and ∑PCBs (P < 0.0005, r2 = 0.392). Simi-larly, the relationships between age and ∑DDTs and HCB did not require transformation to natural logarithms (P <0.0005, 0.140 < r2 < 0.250). This was consistent with the observed relationships between contaminant loads and size; as fish age they grow. The difference in the shapes of the relationships between age and length with organochlorine levels resulted from the asymptotic relationship between age and length in the pollock (Fig. 4). As pollock age, their contaminant levels apparently increase, but their growth rates level off resulting in a nonlinear relationship between size and contaminant level.
RegionEAINBSPRIBSSEAKWAIWBS
PCBs (ng/g ww)
18
16
14
12
10
8
6
4
2
0
0 2 4 6 8 10 12 14
Age
Figure 3. Relationship between ∑ PCBs (ng per g wet weight) and age of walleye pollock collected from the Bering Sea and southeastern Alaska. Line depicts regression fit for all samples. Abbreviations are the same as those in Fig. 2.
570 Heintz et al.—Organochlorines in Walleye Pollock

The lipid content, expressed as a percentage of wet mass, was un-related to organochlorine level in pollock. Linear regression between ∑PCBs and the percent lipid content was not significant (P = 0.854, r2 = 0.0). Inspection of a scatter plot revealed little indication of any rela-tionship between lipid content and ∑PCBs (Fig. 5). Similarly, there was no relationship between lipid content and ∑DDTs (P = 0.724, r2 = 0.0). However, there was a weakly correlated relationship between lipid and HCB (P < 0.0005, r2= 0.189). The general lack of relationship between percentage lipid and organochlorine content was consistent with a lack of relationship between lipid content and size of the pollock (P = 0.071, r2 = 0.021), which has been previously described (Anthony et al. 2000, Vollenweider 2005).
Spatial variation in organochlorine concentrationsOrdinal logistic regression of the ∑PCBs levels in pollock from different regions indicated a significant elevation in the availability of ∑PCBs to pollock in southeastern Alaska. There was a significant interaction be-tween age and region on ∑PCB level (χ2 = 14.8, P = 0.011) indicating that pollock in different regions acquire ∑PCBs at different rates with respect to time. Removing the northern Bering Sea collection from the regression resulted in no interaction (χ2 = 7.81, P = 0.099) and a significant differ-ence among regions (χ2 = 14.00, P = 0.007). Age-corrected estimates of
RegionEAINBSPRIBSSEAKWAIWBS
Length (mm)700
600
500
400
300
200
100
0
0 2 4 6 8 10 12 14
Age (yrs)
Figure 4. Relationship between age and length for walleye pollock collected from the Bering Sea and southeastern Alaska.
571Sea Lions of the World

the mean ∑PCBs, derived by ANCOVA (Fig. 6) indicated pollock from southeastern Alaska had greater ∑PCBs than those from the western Aleutians and western Bering Sea. Pollock, aged 4.6 years, averaged 5.0 ng ∑PCBs per g wet weight while those from the western Aleutian Islands and western Bering Sea averaged less than 1.7 ng ∑PCBs per g wet weight (Table 2). Pollock from the eastern Aleutians and Pribilofs averaged 3.3 and 2.0 ng per g, respectively. Heterogeneous variances and interactions prevent direct comparison of these means, but comparison of the slopes relating age and ∑PCBs for pollock from southeastern Alaska and north-ern Bering Sea indicated that pollock from southeastern Alaska acquire PCBs at nearly two and one-half times the rate of those in the northern Bering Sea and western Aleutians (t > 14.0, P < 0.0005). However, there was no difference in the slopes relating age and ∑PCBs for pollock from the northern Bering Sea and western Aleutians (t = 1.71, P = 0.115) (Fig. 3). Other comparisons of slopes were not made due to the narrowness of the age ranges in collections from the remaining regions (Table 1).
DDT content of pollock depended on the region in which fish were collected (χ2 = 28.83, P < 0.0005). There was no interaction between region and age on DDT content (χ2 = 3.76, P = 0.440). Pollock from southeastern
RegionEAINBSPRIBSSEAKWAIWBS
PCBs (ng/g ww)18
16
14
12
10
8
6
4
2
0
0 2 4 6 8 10
Percent Lipid (ww)
Figure 5. Relationship between ∑ PCBs (ng per g wet weight) and lipid con-tent (% wet weight) of pollock collected from the Bering Sea and southeastern Alaska. No relationship was detected by regression. Abbreviations are the same as those in Fig. 2.
572 Heintz et al.—Organochlorines in Walleye Pollock

Alaska had the greatest DDT concentrations with age 4.6 pollock averag-ing 4.9 ng ∑DDTs per g wet weight in contrast to those from the western Aleutians, eastern Aleutians, Pribilofs, and northern Bering Sea, which averaged less than 1.33 ng ∑DDTs per g wet. No DDTs were detected in tissues of fish from the western Bering Sea (Table 2) (Fig. 6).
HCB content also varied regionally (χ2 = 14.30, P = 0.014). No inter-action between age and region was observed for HCB content (χ2 = 8.06,
PCBs
DDTs
HCB
ng/g (w.w.)
ng/g (w.w.)
ng/g (w.w.)
6
5
4
3
2
1
0
6
5
4
3
2
1
0
1.81.6
1.4
1.2
1
0.8
0.6
0.4
0.2
0
EAI NBS PRIBS SEAK WAI WBS
EAI NBS PRIBS SEAK WAI WBS
EAI NBS PRIBS SEAK WAI WBS
Figure 6. Age adjusted organochlorine (OC) concentrations (ng OC per g wet weight) (± 1 s.e.) in pollock collected from different locations in the Bering Sea and southeastern Alaska. Top panel: ∑ PCBs, middle: ∑ DDTs, and lower: HCB. Abbreviations are the same as those in Fig. 2.
573Sea Lions of the World

P = 0.153). The regional differences arose from the relatively low levels of HCB observed among pollock from the western Aleutians (Table 2) (Fig. 6). Age 4.6 pollock from the western Aleutians averaged 0.30 ng HCB per g wet weight, in contrast to those from the other regions, whose HCB levels exceeded 1.01 ng HCB per g wet weight.
Spatial variation in composition The generally low levels of organochlorines observed in pollock tissues limited analysis of their composition (Table 2). The only DDT routinely detected was p,p′-DDE and only PCBs 101, 110, 118, 138, and 153 were observed above detection limits more than once in all regions. PCB 101 was the only routinely detected congener found in western Bering Sea pollock, so they were deleted from the compositional analysis. None of the ANCOVAs indicated the presence of an interaction between region and age on the relative concentrations of any of the PCB congeners (F4,55 < 2.01, P > 0.105) or an effect of age (F1,55 < 1.39, P > 0.244). However, there were strong regional effects on the relative concentrations (F4,55 > 3.08, P < 0.023) of PCBs 101, 118, 138, and 153. PCB 110 appeared to be evenly distributed throughout the study area (F4,55 = 0.72, P = 0.581). A conse-quence of the disparate distribution of PCB congeners among regions (Fig. 7) was that the MANOVA indicated differences in PCB composition among regions (Wilks λ = 0.389, P < 0.0005).
101
110
118
138
153
% of PCBs80
70
60
50
40
30
20
10
0EAI NBS PRIBS SEAK WAI
Figure 7. Relative concentrations of selected PCB congeners (age adjusted by ANCOVA) in tissues of pollock from different regions in the Bering Sea and southeastern Alaska.
574 Heintz et al.—Organochlorines in Walleye Pollock
DiscussionSignificant differences occurred in the organochlorine content of pollock from different regions, resulting from variation in the availability of PCBs, DDTs, and HCB to regional food webs and not from regional differences in size or age of the fish. Elevated levels of PCBs, DDTs, and HCB were found in the tissues of pollock collected in southeastern Alaska compared to other regions. Further evidence for regional differences in the availability of organochlorines was offered by PCB congener patterns (101, 118, 138, and 153), which all demonstrated that these congeners are acquired at different rates in different regions and further suggest that food webs in different regions have differing PCB compositions. The low levels of organochlorines observed in western Bering Sea samples relative to those from other regions should be viewed with some caution. Fish collected from the western Bering Sea were younger than those in the remaining data set, indicating that most were juveniles. Therefore, less time was available for uptake of organochlorines. In addition, juveniles are likely to be less piscivorous than adults and therefore occupy a lower trophic level.
Our ability to detect organochlorines in each of the regions demon-strates that these compounds are ubiquitously distributed in the food webs of the Bering Sea and Gulf of Alaska. Southeastern and western Alaska are remote locations with exceedingly low population densities and few identifiable PCB sources (Barron et al. 2003). The availability of PCBs, DDTs, and HCB in these food webs is therefore likely determined through deposition from the atmosphere (AMAP 1998). Rain and snow are the most efficient scavengers for removing these compounds from the atmosphere and the relatively high organochlorine concentrations in southeastern Alaska pollock are consistent with the observation that average annual precipitation in that region is in excess of 125 cm per year. In particular, precipitation in Auke Bay, Alaska, a location near the Lynn Canal sites, averages 164 cm per year. In contrast, the precipitation levels at Akutan, located near the Akun Island site, averages 71 cm per year. Precipitation at Attu averages 124 cm per year, while precipitation for St. Paul and St. George islands in the Pribilofs, the region with the relatively low DDT and PCB levels, averages 58 cm per year. Precipitation in British Columbia and southeastern Alaska are the source of the Alaska coastal current, which flows from western North America to the Aleutian Islands. Organochlorines precipitated in southeastern Alaska may there-fore ultimately be transported to the Bering Sea, effectively exposing all of the southern coast of Alaska.
Regional differences in the trophic level occupied by pollock may offer an alternative explanation for regional variation in organochlorine content. This could describe the relatively low levels observed among pol-lock collected at the western Bering Sea stations. However, the elevated
575Sea Lions of the World

levels of PCBs, DDTs, and HCB found in southeastern Alaska pollock are consistent with reports involving other species. Barron et al. (2003) indi-cated that juvenile Steller sea lions from southeastern Alaska had higher average concentrations of ∑PCBS and ∑DDTs than those from the Bering Sea. Similarly, Vander Pol et al. (2004) found higher levels of PCBs and DDTs in common murre eggs collected from southeastern Alaska com-pared to those from the Pribilof Islands. Conversely, HCB was higher in Pribilof eggs. It is unlikely that all of these species occupy higher trophic levels in southeastern Alaska than in other parts of their range; conse-quently trophic variation likely does not account for regional variation.
We report levels on a wet mass basis because organochlorines are consumed by pollock predators in wet tissue. However, expressing or-ganochlorine concentrations on a lipid mass basis provides a method for comparing concentrations among species whose lipid contents vary. On a lipid mass basis, southeastern Alaska pollock averaged 184 ng ∑PCBS per g lipid (i.e., concentration divided by % lipid) and those from the northern Bering Sea, the most northerly collection of adults, averaged 103 ng per g lipid. These values are intermediate to those estimated for fourhorn sculpin and bearded seal near Pt. Barrow, Alaska (Hoekstra et al. 2003). In contrast, the lipid-normalized PCB levels reported here are an order of magnitude lower than those reported for polycheates and sandeels in the Hvaler archipelago near Norway (Ruus et al. 2002).
Discounting differences in analytical approaches, comparing our data to that from previous reports suggests levels of some organochlorines are declining in the Bering Sea pollock. Kawano et al. (1986) reported levels of 15.8 ng per g wet weight for ∑PCBs and 13.5 ng per g wet weight for ∑DDTs in whole pollock collected in 1982 (Fig. 1). The comparability between Kawano (1986) and data presented here is unknown, but we report levels of 2.7 and 1.1 ng per g wet weight for ∑PCBs and ∑DDTs, respectively for fish collected from approximately the same locations and average sizes. Beckmen (2001) reported levels of 9 ng per g wet weight for pollock collected from the Bering Sea between 1998 and 2000. This level is intermediate to those reported by Kawano et al. (1986) and this study and is therefore consistent with a temporal decline. While the analytical approach employed by Beckmen (2001) was identical to that used here, the ages of those fish are unknown.
Steller sea lion risk assessmentThe risk of organochlorine exposure imposed by pollock to their preda-tors, such as Steller sea lions, depends on where the foraging takes place, and the size and number of fish consumed. Data presented here indicate that Steller sea lions foraging on pollock in southeastern Alaska are likely to encounter higher organochlorine exposures than sea lions in the west-ern stock. This conclusion assumes that sea lions consume equal masses of equally sized pollock, but estimates for the average size of pollock
576 Heintz et al.—Organochlorines in Walleye Pollock

consumed by the western stock range between 359 and 424 mm (Zeppelin et al. 2004) and 410 and 439 mm for the eastern stock (Tollit et al. 2004). Comparison of the regressions between length and natural log ∑PCBS for southeastern Alaska pollock and those from eastern Aleutians, Pribilofs, and western Aleutians combined indicate that the average exposure of sea lions in southeastern Alaska is 4.7 ng ∑PCBs per g tissue consumed, while those from the west consume 1.8 ng ∑PCBs per g tissue. Winship and Trites (2003) estimated a 20% difference in consumption rate between western and eastern stock sea lions, demonstrating that differences in daily consumption rate are unlikely to compensate for differences in ex-posure. Consequently, the data presented here indicate that recovery of the western stock is not likely impeded by exposure to organochlorines, because eastern stock animals receive higher exposures and have increas-ing populations (Sease et al. 2001).
An important limitation to the risk assessment offered here is that variation in organochlorine content among other sea lion prey species has not been described. Western stock sea lions have less diverse diets (Merrick et al. 1997) and the rapidly declining populations in the far west rely heavily on lipid rich species such as Atka mackerel and salmon (Sinclair and Zeppelin 2002). This suggests that lipid intake rates vary among populations and our expectation is that variations in lipid intake will ultimately drive variation in exposure. Consequently, a more detailed analysis of exposure depends on accounting for differences in the rate of lipid ingestion and the lipid burdens in various prey. Such an analysis will ultimately provide the best information on the potential role of con-taminants in the failed recovery of western stock sea lions.
The contaminants described here appear to be precipitated from the atmosphere in coastal mountain ranges and entrained in marine food webs where they can be detected even in low lipid species such as wall-eye pollock. These data indicate significant quantities of organochlorines are precipitated in southeastern Alaska where they can be transported westward in the Alaska coastal current, contaminating food webs along the southern coast of Alaska and eastern Bering Sea. Thus, the same geo-graphic features responsible for the relatively high productivity of the northern Pacific and eastern Bering Sea also effectively pump organochlo-rines into those same food webs (Sambrotto and Lorenzen 1986). While PCB and DDT concentrations may be declining in the region, the general behavior of these compounds may predict the behavior of other lipophilic compounds whose concentrations are increasing, such as polybrominated diphenyl ethers (PBDEs). In addition to seals and sea lions, the dominant fish species in the northern North Pacific Ocean are important to the diets of humans. Consequently, efforts to maintain the health of this ecosystem need to include the development of models that describe the movement of these compounds from their sources to North Pacific food webs, and periodic monitoring of their levels.
577Sea Lions of the World

AcknowledgmentsWe wish to thank those who collected samples for this project, includ-ing Jim Murphy and Doyne W. Kessler from the Alaska Fisheries Science Center, and Jennifer Stahl from the University of Alaska Fairbanks. We appreciate the contaminant analyses completed by Daryle Boyd and Karen Tilbury of the Northwest Fisheries Science Center. In addition we wish to thank Erin Flynn and Mandy Johnson for sample preparation. This project was funded under the NOAA Steller Sea Lion Initiative.
ReferencesAMAP. 1998. AMAP Assessment report: Arctic pollution issues. Arctic Monitoring
and Assessment Programme (AMAP), Oslo, Norway. 859 pp.
Anthony, J.A., D.D. Roby, and K.R. Turco. 2000. Lipid content and energy density of forage fishes from the northern Gulf of Alaska. J. Exp. Mar. Biol. Ecol. 248:53-78.
Barron, M.G., R. Heintz, and M.M. Krahn. 2003. Contaminant exposure and effects in pinnipeds: Implications for Steller sea lion declines in Alaska. Sci. Total Environ. 311:111-133.
Beckmen, K.B. 2001. Contaminants in free-ranging Steller sea lions: Organochlorines in blood, blubber, feces and prey. Workshop to Assess Contaminant Impacts on Steller Sea lions in Alaska, Anchorage, September 5-6. National Marine Fisheries Service, Auke Bay Laboratory, Juneau.
Calkins, D.G. 1998. Prey of Steller sea lions in the Bering Sea. Biosphere Conserv. 1:33-44.
Christie, W.D. 1989. Gas chromatography and lipids: A practical guide. Oily Press, Ayr, UK. 307 pp.
de Brito, A.P.X., D. Ueno, S. Takahashi, and S. Tanabe. 2002. Contamination by organochlorine compounds in walleye pollock (Theragra chalcogramma) from the Bering Sea, Gulf of Alaska, and the Japan Sea. Mar. Pollut. Bull. 44:164-177.
Folch, J., M. Lees, and G.H.S. Stanley. 1957. A simple method for the isolation and purification of total lipids from animal tissues. J. Biol. Chem. 226:497-509.
Hoekstra, P.F., T.M. O’Hara, A.T. Fisk, K. Borga, Kr.R. Solomon, and D.C.G. Muir. 2003. Trophic transfer of persistent organochlorine contaminants (OCs) within an Arctic marine food web from the southern Beaufort-Chukchi seas. Environ. Pollut. 124:509-522.
Kawano, M., S. Matsushita, T. Inoue, H. Tananaka, and R. Tatsukawa. 1986. Biological accumulation of chlordane compounds in marine organisms from the northern North Pacific and Bering Sea. Mar. Pollut. Bull. 17:512-516.
578 Heintz et al.—Organochlorines in Walleye Pollock

Krahn, M.M., G.M. Ylitalo, J. Buzitis, C.A. Sloan, D.T. Boyd, S. Chan, and U. Varanasi. 1994. Screening for planar chlorobiphenyl congeners in tissues of marine biota by high-performance liquid chromatography with photodiode array detection. Chemosphere 29:117-139.
Merrick, R.L., and D.G. Calkins. 1996. Importance of juvenile walleye pollock, Ther-agra chalcogramma, in the diet of Gulf of Alaska Steller sea lions, Eumetopias jubatus. NOAA Tech. Rep. NMFS 126.
Merrick, R.L., M.K. Chumbley, and G.V. Boyd. 1997. Diet diversity of Steller sea lions (Eumetopia jubatus) and their population decline in Alaska: A potential relationship. Can. J. Fish. Aquat. Sci. 54:1342-1348.
Ruus, A., K.I. Ugland, and J.U. Skaare. 2000. Influence of trophic position on or-ganochlorine concentrations and compositional patterns in a marine food web. Environ. Toxicol. Chem. 21:2356-2364.
Sambrotto, R.N., and C.J. Lorenzen. 1986. Phytoplankton and primary production. In: D.W. Hood and S.T. Zimmerman (eds.), The Gulf of Alaska physical environ-ment and biological resources. NOAA OCS Study 86-0095, Washington, D.C.
Sease, J.L., W.P. Taylor, T.R. Loughlin, and K.W. Pitcher. 2001. Aerial and land-based surveys of Steller sea lions (Eumetopias jubatus) in Alaska, June and July 1999 and 2000. NOAA Tech. Memo. NMFS-AFSC-122. 52 pp.
Sinclair, E.H., and T.K. Zeppelin. 2002. Seasonal and spatial differences in diet in the western stock of Steller sea lions (Eumetopias jubatus). J. Mammal. 83:973-990.
Springer, A.M., J.A. Estes, G.B. vanVleit, T.M. Williams, D.F. Doak, E.M. Danner, K.A. Forney, and B. Pfister. 2003. Sequential megafaunal collapse in the north Pacific Ocean: An ongoing legacy of industrial whaling. Proc. Natl. Acad. Sci. 100:12223-12228.
Tollit, D.J., S.G. Heaslip, and A.W. Trites. 2004. Sizes of walleye pollock (Theragra chalcogramma) consumed by the eastern stock of Steller sea lions (Eumeto-pias jubatus) in Southeast Alaska from 1994 to 1999. Fish. Bull. U.S. 102:522-532.
Vander Pol, S.S., P.R. Becker, J.R. Kucklick, R.S. Pugh, D.G. Roseneau, and K.S. Si-mac. 2004. Persistent organic pollutants in Alaskan murre (Uria spp.) eggs: Geographical, species and temporal comparisons. Environ. Sci. Technol. 38:1305-1312.
Vollenweider, J.J. 2005. Variability in Steller sea lion prey quality in southeastern Alaska. Master’s thesis, University of Alaska Fairbanks. 62 pp.
Winship, A., and A.W. Trites. 2003. Prey consumption of Steller sea lions (Eume-topias jubatus) off Alaska: How much prey do they require? Fish. Bull. U.S. 101:147-167.
Wise, S.A., M.M. Schantz, B. J. Koster, R. Demiralp, E.A. Mackey, R.R. Greenbert, M. Burow, P. Ostapczuk, and T.I. Lillestolen. 1993. Development of frozen whale blubber and liver reference materials for the measurement of organic and inorganic contaminants. Fresunius’ J. Anal. Chem. 345:270-277.
579Sea Lions of the World
Womble, J.N., and M.F. Sigler. 2006. Temporal variation in Steller sea lion diet at a seasonal haul-out in Southeast Alaska. In: A.W. Trites, S.K. Atkinson, D.P. De-Master, L.W. Fritz, T.S. Gelatt, L.D. Rea, and K.M. Wynne (eds.), Sea lions of the world. Alaska Sea Grant College Program, University of Alaska Fairbanks.
Zeppelin, T.K., D.J. Tollit, K.A. Call, T.J. Orchard, and C.J. Gundmundson. 2004. Sizes of walleye pollock (Theragra chalcogramma) and Atka mackerel (Pleurogram-mus monopterygius) consumed by the western stock of Steller sea lions (Eume-topias jubatus) in Alaska from 1998 to 2000. Fish. Bull. U.S. 102:509-521.
580 Heintz et al.—Organochlorines in Walleye Pollock