Continental Drift & Seafloor Spreading Marine Science Chapter 11.

Seafloor & Continental Drift - page 1
SEA FLOOR&
CONTINENTALDRIFT
Lesson PlanA CURRICULUM IN MARINE SCIENCES
FOR GRADES 4 - 8
UNIVERSITY OF CALIFORNIA, LOS ANGELESMARINE SCIENCE CENTER
revised for UCLA OceanGLOBE, 4/04

Seafloor & Continental Drift - page 2
SEA FLOOR & CONTINENTAL DRIFT LESSONS
A 2 page written summary of how the Earth’s crustal plates move and, thus, shape the arrangement ofthe continents and oceans. May be duplicated for student reading material or as a subject contentbackground for teachers.
California and National Standards...............................................5
Vocabulary.....................................................................................6A single page that lists and defines 20 of the most important terms that relate to student understand-ing of the sea floor and continental drift..
Activity #1 - Ocean Floor Model..............................................................7A 3 page activity that has students make 3 dimensional models of the ocean floor in a shoe box.Requires student use salt, flour, water, glue and coloring. Label tags for floor features are included.The completed model can then be used for Activity #2.
Activity #2 - Sonar Mapping..........................................................10Students may use their shoe box sea floor model from Activity #1, or may use cardboard layeringinside a shoe box to simulate a section of the ocean floor. In this 5 page activity the students probethe ocean floor (inside their box) to simulate sonar. This data is graphed and made into a 3-D papermodel. Requires shoebox, cardboard, scissors and graph paper.
Activity #3 - Bathymetric Mapping.................................................16A 9 page activity package in which students create contour lines on a bathymetric chart by connectingthe points between similar depth intervals based on soundings. The interval contours can be thencolored in to simulate shallow and deeper depths. Name tags for topographic features can be cut outand glued in place. All steps are based on actual NOAA nautical chart for southern California.
Activity #4 - Pangaea Puzzle Pieces................................................25A puzzle made of all the major continents on Earth today. Students use clues to fit the pieces backtogether into one giant supercontinent representing Pangaea, or Earth 250 million years ago. A 3page scissor and glue activity.
Activity #5 - Seafloor Block Model.................................................28This 5 page activity has students create a 3-D block model of major sea floor features and compo-nents of the Earth’s crust. Major deep ocean water masses are printed on opposite ends to tie-inocean structure and water layers. Requires scissors, glue and coloring tools. Plan ahead to run offthe block model template on card stock if possible, to make a more sturdy box. This is a great culmi-nating summary exercise for the Sea Floor and Continental Drift lesson package.
Introduction to the Sea Floor & Continental Drift .........................3
A one page list that includes the California Science Standards and the National Science Standardsthat apply to these Sea Floor and Continental Drift activities. Suitable for teachers and curriculumdevelopment purposes.

Seafloor & Continental Drift - page 3
Introduction to the Sea Floor and Continental Drift
Oceanographers discovered the shape of the ocean floor by measuring the depth of the ocean inmany places. Early tools included lead weights, lowered on marked ropes or cables to the ocean floor.From such depth readings, scientists gradually built a picture of the ocean floor they could not see.These methods were very slow and eventually were replaced by sonar systems which bounced soundwaves off the bottom. Today, sophisticated side-scan sonar and satellite data are fed into computers,giving even more detailed pictures of the ocean floor. Maps catalog and display a wealth ofinformation. On land, topographic maps provide images of the shape of the land. At sea, bathymetricmaps provide images of the bottom of the oceans. Turning three-dimensional objects like mountains orguyots into accurate two-dimensional representations on a map is a complicated process involving manysteps.
All models of the ocean floor show features with vertical exaggeration, taller and steeper thanthey actually are. This occurs for a very practical reason. If the model or sketch were prepared to exactscale, it would need to be very large. The Pacific Ocean is 6,000 miles wide in some places, but nevermore than about 6 miles deep. If you made a model of the Pacific Ocean basin accurate with regard toscale, and the deepest portion of the model were one foot deep, then the entire model would have to be1,000 feet wide, more than 3 football fields wide. Obviously this is not a good way to illustrate theshape of the Pacific. Instead, we exaggerate the vertical axis in order to reduce the model to a workablesize.
The theory of plate tectonics and continental drift hypothesizes that the continents are in relativemotion. Thus the positions and shapes of the continents we see today were not the same in the past.The internal structure of the earth is, in part, composed of the core, mantle and two types of crust:continental crust and oceanic crust. The continental crust is less dense than the oceanic crust, so itfloats higher in the mantle. It is also thicker and, therefore, extends deeper into the mantle. The crustsfloat on the mantle much like an ice cube floats in a glass of water. The earth’s core is thought to becomprised primarily of very dense nickel and iron compounds in a molten state. Radioactive decayreactions occurring deep in the core produce intense heat. The heat causes convection currents to formin the more “plastic” mantle. As mantle material is heated, its density decreases and it moves towardthe crust. In some places, where the crust is thin, some of the mantle material seeps through and, as itcools, creates new crust. The Mid-Atlantic Ridge was formed in this manner. Sometimes this new crustrises above the water’s surface to form islands. Once it reaches the crust, the mantle material moveslaterally beneath the crust. In this manner, it is thought to drag the plates along with it. Cooling of theseconvection currents results in a downward movement of material under some regions of the continentalcrust and oceanic crusts. As parts of the oceanic crust move downward under the continental and otheroceanic crusts, deep ocean trenches are formed. As the oceanic crust moves downward under thecontinental crust, remelting of the crust occurs, producing new mantle. In these areas, molten rock isoften found rising through the oceanic crust to create volcanic islands. The Philippines, the Marshalls,and Fiji are examples of Pacific volcanic arcs. The Azores are examples of Atlantic volcanic arcs.Hawaii is an example of “hot spot” islands, islands that are formed by volcanic activity due to anoutpouring of rising magma through a hole in the plate. For reasons that are not yet clear, “the hot spot”does not change location but the oceanic plate above it moves over time, and new islands are formedover the hot spot, creating an island chain.

Seafloor & Continental Drift - page 4
As early as 1650, writers commented on the similarities of the coastlines of eastern South America andwestern Africa, but the idea that continents could change shape or location was unbelievable at that time.Even as late as the 1940’s few scientists took the idea of continental drift seriously. No one had been ableto explain HOW the continents could move. So where did this theory of drifting continents come from?What gave anyone the idea that certain parts of continents might have been joined to other continents?From the 1700’s through the early 1900’s scientists had attempted to explain the formation of the earth, itsoceans, and its land masses. Three scientists, James Hutton (geologist), Alfred Wegener and Alexander duToit proposed, somewhat independently, what is today the prevailing theory of how our continents andoceans came to be. This theory is called “the Theory of Plate Tectonics and Continental Drift.” In Hutton’stime, the thought of drifting continents was considered biblical blasphemy. In Wegener’s time, 200 yearslater, it was just considered ludicrous, because no one could explain how the continents moved. It wasn’tuntil the symmetry of seafloor magnetic anomalies and the midocean ridge spreading zones were discoveredon the ocean floor in the 1960’s that the continental drift idea was accepted as scientific fact. Continentaldrift was then unified with the theory of plate tectonics (plate movement) to explain how the Earth’s crust iscomposed of sections, or “plates”. These plates move on currents in the mantle below, and carry thecontinents with them

Seafloor & Continental Drift - page 5
Sea Floor and Continental DriftConcepts Related to the California Science Standards
Grade Six:Plate Tectonics and Earth’s Structure
1. Plate tectonics accounts for important features of Earth’s surface and major geologic events.
2. Topography is reshaped by the weathering of rock and soil and by the transportation and deposition of sediment.
Grade Seven:Earth and Life History (Earth Science)
4. Evidence from rocks allows us to understand the evolution of life on Earth. As a basis for understanding thisconcept: f. Students know how movements of Earth’s continental and oceanic plates through time, with associatedchanges in climate and geographic connections, have affected the past and present distribution of organisms.
Grades Nine through Twelve: Earth ScienceDynamic Earth Processes
3. Plate tectonics operating over geologic time has changed the patterns of land, sea, and mountains on Earth’ssurface.
All Grades:Investigation and Experimentation
Record data by using appropriate graphic representations (including charts, graphs, and labeled diagrams) andmake inferences based on those data.
Draw conclusions from scientific evidence and indicate whether further information is needed to support a specificconclusion.
Write a report of an investigation that includes conducting tests, collecting data or examining evidence, and drawingconclusions.-------------------------------------------------------------------------------------------------------------------
Concepts Related to the National Science Standards1- The floor of the ocean is composed of hills, plains, ridges, trenches and seamounts.
2- Oceanographers have developed methods for mapping the ocean floor, illustrating what cannot be seen.
3- Geologists and oceanographers use maps of the sea floor as tools for research and applied science (technology).
4- land masses on Earth are slowly changing shape as a result of moving for millions of year.
5- Continual convection currents move the earth’s crust, resulting in the formation of islands and deep oceanictrenches.
6- Core drilling has produced information regarding the movement and density of the oceanic and continental crust.

Seafloor & Continental Drift - page 6

Seafloor & Continental Drift - page 7
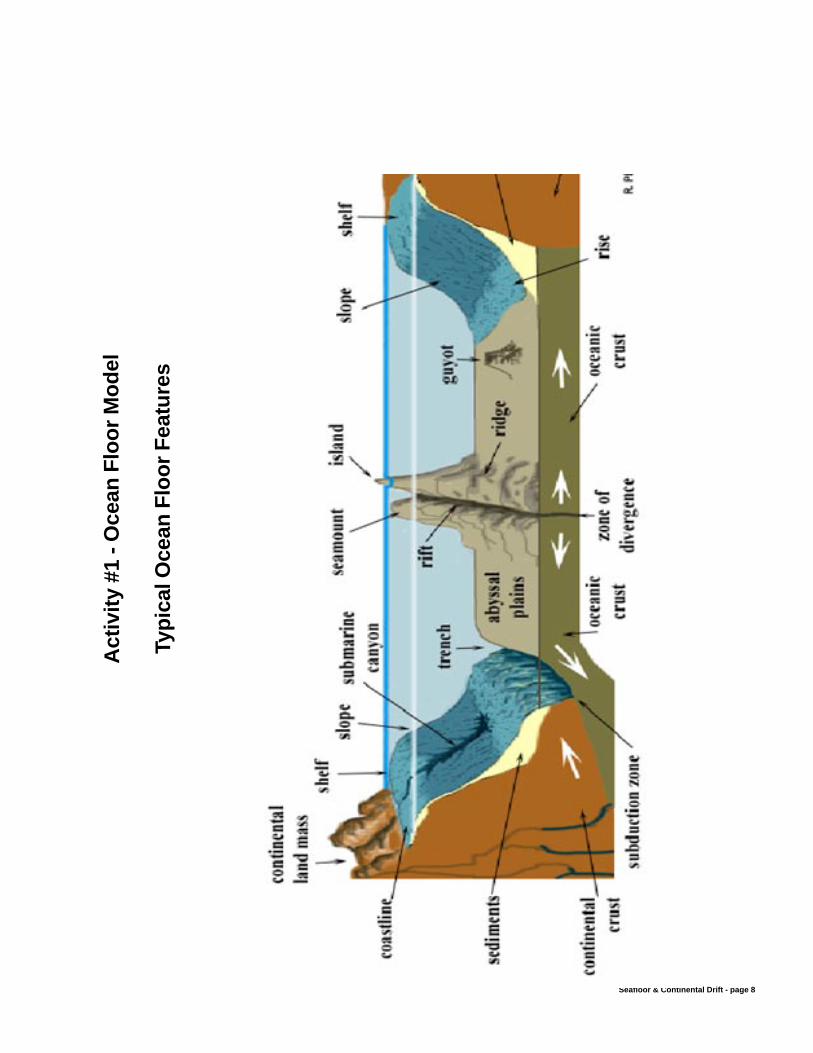
Activity #1 - Ocean Floor Model
Concept # 1#1 The floor of the ocean is composed of hills, plains, ridges, trenches, and seamounts.
Objective:Students construct a simulated model of the ocean floor in a shoebox. The shoebox model can be usedfor a sonar mapping lesson in Activity #2.
Materials:· salt (1 part)· flour (2 parts)· food coloring (2-3 drops)· warm water (1 part)· bowl· spoon· cardboard shoe box (with lid)
Procedures: (See illustrations)1. Place water and food coloring in a bowl, add salt and mix, add flour and continue to mix to form dough.2. Divide students into groups of 4-6.3. Each group draws out a plan for their ocean floor which includes abyssal plains and hills, an atoll, a bay,
continental shelf and slope, guyot, island, rift valley, seamount, trench, mid-ocean range, submarinecanyon, subduction zone.
4. After a plan is completed students obtain dough mixture from the teacher. Students then shape theocean floor with the dough on the bottom of the cardboard box.
5. The dough will dry in 3-5 days. Have students label the ocean features and write a definition for eachfeature.
Evaluation: Which feature forms most of the ocean floor? (abyssal plain) Where would you find the best fishing zone according to the features of the ocean makeup? (continentalshelf)
Where is new ocean floor created? (mid-ocean ridge) How old is the ocean floor? Explain.
Seafloor & Continental Drift - page 8
Act
ivity
#1
- Oce
an F
loor
Mod
el
Typi
cal O
cean
Flo
or F
eatu
res

Seafloor & Continental Drift - page 9
Activity # 1 - Ocean Floor Model
Labels for ocean floor map
abyssal hills
abyssal plains
atoll
bay
continental shelf
continental slope
contour
guyot
island
island arc
rift valley
seamount
subduction zone
submarine canyon
trench
mid-ocean range
abyssal hills
abyssal plains
atoll
bay
continental shelf
continental slope
contour
guyot
island
island arc
rift valley
seamount
subduction zone
submarine canyon
trench
mid-ocean range

Seafloor & Continental Drift - page 10
Activity #2 - Sonar MappingConcept # 2
#2 Oceanographers have developed methods for mapping the ocean floor, illustrating what cannot beseen.
Objective:Students may use their shoe box sea floor mdel from Activiy #1, or may use cardboard layering inside ashoebox, to simulate a section of the ocean floor. Then the students probe the ocean floor to simulatesonar echoes. They graph this data to get a visual picture of the ocean floor.
Materials:· corrugated cardboard· scissors· glue· chop stick· shoebox· papping guide grid· pen
Procedures:1. Students are grouped in pairs. Each pair obtains a shoebox, cardboard, glue, and scissors.2. Students glue layers of cardboard to the bottom of the box to create ocean floor height variations. The
variations will be measured at 1cm heights so the cardboard layers must be thick enough to show heightdifferences.
3. Students tape a mapping guide grid to the box lid labeled Rows A-G and 1-13.4. At the intersection of each row and line a hole is poked with the tip of the scissors. The hole should be
big enough for the probe (chop stick).5. The probe is marked and labeled from one end (the bottom) every cm from 1 to 8 cm with a pen.6. After the box has dried, the lid is put on, and students probe the ocean floor through the holes and record
their findings on a data sheet.
Graphing Alternative 1 - making a 3D paper model7. Numbers (depths) on the data sheet are then plotted on graph sheets, one sheet for each row.8. After plotting each row, color the area below the line connecting the data points (this represents changes
in ocean floor depths).9. Students cut out the graph above the line and discard.10. Glue the cut out sheet onto the stiff cardstock in the order of the rows.11. When finished, open the box and compare your model to the original ocean floor.
Graphing Alternative 2 - making a contour map7. Use the numbers on the data sheet to create a contour map (see Activity #3). Plot a contour line for each
centimeter of depth. Plot the first contour line by connecting all the 1 cm soundings on the data sheet.Plot the next contour line by connecting all the 2’s, and so forth.
8. Color in your depth contours by using light blue, then darker and darker shades of blue indicating deeperdepths.
9. When finished, open the box and compare your model to the original ocean floor.
· tape· stiff paper (card stock)· data sheet· graph sheets· bathymetric map· metric ruler

Seafloor & Continental Drift - page 11
Evaluation:Does the cut out model and/or contour map look like your ocean floor shoebox model? Explain.Were any features missed? Why?Do you think oceanographers have similar problems during their investigations?How could you have improved the accuracy of your results?

Seafloor & Continental Drift - page 12
Activity #2 - Sonar Mapping
Inside of shoebox, lookingdown at cardboard strips
representing ocean floor con-tours.
Graphs of data,cut-out and glued
in order of the rows.
Shoebox with mapping guideon top of lid. Ocean floormodel is inside. Holes are
poked at grid intersections.

Seafloor & Continental Drift - page 13
Act
ivit
y #
2 -
Sona
r M
appi
ng
Map
pin
g G
uid
e fo
r B
ox T
op

Seafloor & Continental Drift - page 14
Act
ivit
y #
2 -
Sona
r M
appi
ng
Dat
a C
hart

Seafloor & Continental Drift - page 15
Activity #2 - Sonar Mapping
Graph Paper - One Graph per Row of Data

Seafloor & Continental Drift - page 16
Activity #3 - Bathymetric Mapping
Concepts # 1, 2#1 The floor of the ocean is composed of hills, plains, ridges, trenches, and seamounts.#2 Oceanographers have developed methods for mapping the ocean floor, illustrating what cannot be seen.
Objective:Students will draw contour lines based on NOAA soundings on a nautical chart. They will color thecontours and glue label tags for topographic features.
Materials:· nautical chart 1 with soundings in fathoms (1 fm = 6 ft) for student activity· nautical chart 2 with contour lines (for reference)· nautical chart 3 with shaded contours (for reference)· nautical chart 4 with topographic labels (for reference)· nautical chart 5 - actual NOAA chart of same region· label tags for topographic features· scissors· colored pencils, water colors or crayon· pencil· bonus activity map (see last evaluation item)
Procedures:1. On nautical chart 1 use a PENCIL to draw contour lines for the following depths (in fathoms): 50, 250,
500, 750, 1000, 1250, 1500, 1750 and 2000. Draw the 50 fathom line by keeping all the soundings lessthan 50 on one side of your line and all the soundings larger than 50 on the other side. Do the samething at 250 fathoms and every 250 fathoms as you go deeper. Remember that contour lines do notcross each other. When done your teacher may want you to check your contours with chart 2.
2. After you have finished drawing your contour lines, color in each contour by using light blue for the firstdepth contour (around the land and islands), then darker and darker blue colors, until you end up usingblack for the deepest contour (bottom left corner). When done your teacher may want you to check yourcontours with chart 3.
3. Finally, cut out the label tags for the topographic features you have drawn and colored in. Glue them inplace to identify the basins, banks and submarine canyons on your chart. When done your teacher maywant you to check your contours with chart 4.

Seafloor & Continental Drift - page 17
Evaluation: How might the geologic formations shown on your map have been formed ? (along fault lines; somecrustal blocks sink to form basins, other are uplifted to form mountains, islands or banks.)
Where is the continental shelf? slope? abyssal plains? (The continental shelf here is not flat, it isinterrupted by islands, basins and banks. The shelf runs to the Patton Escarpement, which is thecontinental slope. The abyssal plains are in the lower left corner).
Suppose you are the captain of a fishing boat. You hear a report of good fishing near San Miguel Islandand sail to the area. GIve at least two reasons for studying a nautical chart with bathymetric informationbefore fishing? (To keep from running aground and to keep from getting your fishing gear caught on thebottom.)
How is the map you drew similar to the nautical chart drawn by professionals? (soundings are the same;some contour lines are barely visible beneath the other data)
How can you account for the differences? (nautical charts show other important navigational informationsuch as the shipping lanes for large commercial vessels, the LORAN grid for older navigational units, thedetails of every lighthouse, buoy and other markers, areas for military testing, dumping and otherinformation)
Students complete map 3 for homework. If the map is done correctly a dolphin fish will appear.

Seafloor & Continental Drift - page 18
Activity #3 - Bathymetric Mapping
Label Tags for Topographic Features
Cut out each tag as close to the lettering as you can.Try NOT to leave too much white space around the edges of the label.
Santa Barbara Basin
SantaCruzBasin
Santa Rosa - Cortes Ridge
Patton Escarpement
TannerBasin
TannerBank
Santa Monica Basin
SanPedroBasin
LasuenBank
OsbornBank
Santa Catalina Basin
San Nicolas Basin
SanFernando
Basin
LosAngeles
Basin
Sant Cruz Canyon
Santa Monica Canyon
Redondo Canyon

Seafloor & Continental Drift - page 19

Seafloor & Continental Drift - page 20

Seafloor & Continental Drift - page 21

Seafloor & Continental Drift - page 22

Seafloor & Continental Drift - page 23
Act
ivity
#3
- Bat
hym
etric
Map
ping
Cha
rt #
5 - S
ectio
n of
NO
AA
Cha
rt 1
8022

Seafloor & Continental Drift - page 24
Activity #3 - Bathymetric Mapping
Bonus Activity Map

Seafloor & Continental Drift - page 25
Activity #4 - Pangaea Puzzle Pieces
Concept # 4#4 Land masses on Earth are slowly changing shape as a result of moving for millions of years.
Objective:Students in groups of 2-3 examine 10 pieces of evidence for the Pangaea theory and use them toreconstruct the supercontinent.
Materials:· large piece of paper (a large 18” blue cirlcle would be ideal, but any paper will do)· scissors· glue· wall world map as reference· Pangaea pieces· evidence sheet
Procedures:1. The teacher discusses the history of plate tectonics and continental drift.2. Students are divided into groups of 2-3.3. The students label each continent on their Pangaea Pieces.4. Cut out the continents.5. Try to reunite the Pangaea puzzle pieces based on the clues.6. Glue your finished Pangaea puzzle in place on a large sheet of paper.
Evaluation: There are some very prolific diamond mines in South Africa. What do you suppose the chances are thatone could find diamonds in South America?
The coal deposits mined in Pennsylvania were formed from plants that grow in tropical climates. Whatdoes this suggest about where Pennsylvania was once located? What does this suggest about thelocations of North and South America?
The fit between Africa and South America along their coastlines is not exact. How might the fit bebetter?
The dotted line you cut along the northern edge of India is where the Himalayan mountains are located.How do you think those mountains were formed?
How would you evaluate the evidence in terms of your fit: Where was the evidence good and where wasit bad?
Does the evidence suffice, in your opinion, to support the theory of Continental Drift? Explain youranswer.
Extension: Based on the direction and speed of crustal plate movements over the past 250 million years, put togethera second world map showing the oceans and continents as they should appear 250 million years in thefuture.

Seafloor & Continental Drift - page 26
Activity #4 - Pangaea Puzzle Pieces
Evidence or “Clues”
1. The paleomagnetic stipes or iron crystal patterns in the rocks of northernBrazil and central Africa are mirror images of each other.
2. There is evidence of glacier activity on both sides ofthe Atlantic Ocean along the Equator.
3. Glossopteris is a genus of extinct seed fern (a Pteriosperm)whose fossils are found throughout India, South America,
southern Africa, Australia, and Antarctica.
4. Mesosaurus was one of the first aquatic reptiles.Fossils have been found in South Africa and South America.
5. The age of the rocks in Europe and north Americaare the same, and get progressively older as you
move inland from the ocean.
6. Fossils of Lystrosaurus, a mammal-like reptile,are known from Antarctica, India, and Africa.
7. Mountains in Greenland and Norway are almostidentical in their geological structure.
8. The locations of earthquakes and volcanoes arenot random. The occur along the margins of
the crustal plates.
9. The mountains of Scotland and the Appalachianmountains of north Americal are almost identical
in their geological structure.
10. The geological structure of southern Senegaland the Amazon Basin are almost identical.

Seafloor & Continental Drift - page 27
Activity #4 - Pangaea Puzzle PiecesCut along edge of each land mass,
don’t cut rectangles !
Base map courtesy of the General Libraries, University of Texas at Austin

Seafloor & Continental Drift - page 28
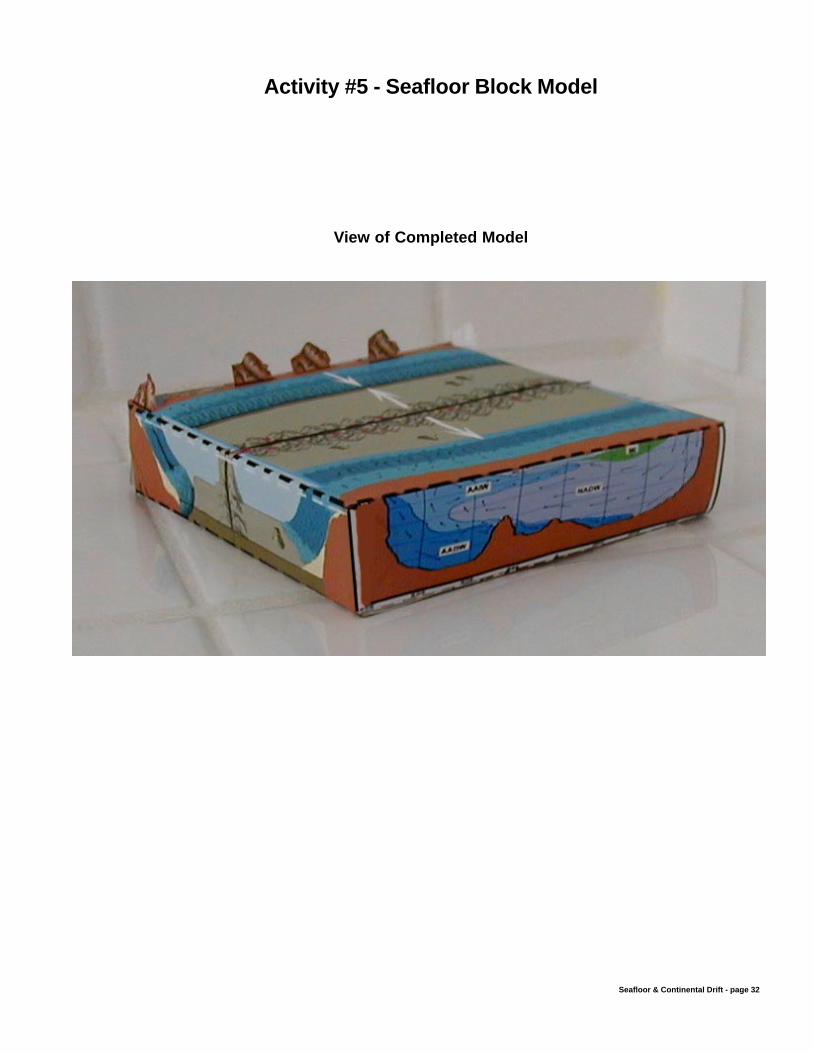
Activity #5 - Seafloor Block Model
Concepts # 1, 3, 5, 6#1 The floor of the ocean is composed of hills, plains, ridges, trenches, and seamounts.#3 Geologists and oceanographers use maps of the sea floor as tools for research and applied science
(technology).#5 Continual convection currents move the earth’s crust, resulting in the formation of islands and deep
oceanic trenches.#6 Core drilling has produced information regarding the movement and density of the oceanic and
continental crusts.
Objective:Students construct a 3-D block model of the ocean floor to study fundamental earth processes.
Materials:· block model sheet (cardstock isn’t necessary, but can be used as an option if available)· label tags sheet· colored pencils or fine tipped felt markers· scissors· glue
Procedures:
1. Cut out the block model from the sheet by cutting on the solid lines.
2. For extra fun cut out the mountains and islands and fold them up above the sea level. (see photo)
3. Make folds on the dashed lines.
4. After fitting your block model together to see how it will look, use your colored pens or pencils to color-in your model. Be creative, but use the same color patten on the top and along the sides.
5. Glue the model together using the flaps that say “glue.”
6. Cut the label tags carefully, as close to the letters and words as possible. (Don’t leave much white spacearound the borders).
7. Glue the label tags on the top and along the sides. Draw neat arrow from each label tag pointing to thecorrect feature.

Seafloor & Continental Drift - page 29
Evaluation:
Which crust, the oceanic or the continental, is thicker? (continental)
Which type of crust floats higher above the mantle? (continental; the top of the continental crust is higherthan the top of the oceanic crust, like an ice cube floating in water.)
Which type of crust must, therefore, be less dense? (continental)
Use arrows to draw in convection currents beneath the surface of the mid-ocean ridge.
Place an “x” at the point(s) where the oceanic crust remelted to form the mantle.
If the amount of crust remains the same, new crust must be formed to replace the crust that is remelted.Where is the new crust formed? ( New crust is formed at the mid-ocean ridges of the deep ocean basin)
Circle the path of molten rock from the mantle to the top of an oceanic volcano.
The Pacific Ocean has many volcanic islands. There are also volcanic islands in the Atlantic Ocean.Name an island group that is an example of a volcanic island arc. (The Azores, Philippines, MarshallIslands, Tuamoto Islands, Fiji islands)
What is thought to cause deep-ocean trenches? (Where plates collide, one dives under the other.)
What does the theory of plate tectonics and continental drift say about the positions of the continents?(Hypothesizes that the continents are in relative motion and are not in the same positions as in the past.The continents are always changing.)
Write a paragraph describing and explaining what the box demonstrates about earth processes. Use theterms found on the label tags in the paragraph.

Seafloor & Continental Drift - page 30

Seafloor & Continental Drift - page 31
Activity #5 - Seafloor Block Model
Label TagsHINT: Try to cut each label tag as close to the letters and
words as you can. (Don’t leave a lot of white space aroundthe edges of each tag). Don’t worry if you end up with extra tags !
ABYSSALPLAINS
RIFT
SEAMOUNT
ISLAND
TRENCH
TRENCH
ABYSSALPLAINS
RIFT
RIDGE
RIDGE
SLOPE
SLOPE
SLOPE
SLOPE
SHELF
SHELF
SHELF
SHELF
CONTINENTALCRUST
CONTINENTALCRUST
OCEANICCRUST
OCEANICCRUST
LANDMASS
LANDMASS
GUYOT
GUYOT
ABYSSALPLAINS
RISE
RISE
Seafloor & Continental Drift - page 32
Activity #5 - Seafloor Block Model
View of Completed Model