SDI: Solar Dome Instrument - Introduction · work proposes a Solar Dome Instrument (SDI), a novel...
12
SDI: Solar Dome Instrument for Solar Irradiance Monitoring Tao Liu 1 , Ankur U. Kamthe 1 , Varick L. Erickson 1 , Carlos F. M. Coimbra 2 and Alberto E. Cerpa 1 1 Electrical Engineering and Computer Science, University of California - Merced {akamthe,tliu,verickson,acerpa}@andes.ucmerced.edu 2 Mechanical and Aerospace Engineering, University of California - San Diego [email protected] Abstract The lack of reliable data for ground solar irradiance (direct normal and global irradiance) is a major obstacle for the de- velopment of adequate policies to promote and take advan- tage of existing solar technologies. Although the radiation that reaches the outer layers of the atmosphere is well defined and can be easily calculated, the solar irradiance that reaches the ground level where solar collectors (thermal and photo- voltaic) operate depends strongly on localized and complex atmospheric conditions. These effects are particularly strong on the Direct Normal Irradiance (DNI). Because cloud cover corresponds to the strongest effect on ground insolation, no statistical method that ignores micro-scale (< 2 km) or meso- gamma scale (2–20 km) weather systems can succeed in es- timating real-time and/or forecasting solar power availabil- ity. In this regard, mass deployment of ground measurement points is often necessary for precise solar irradiance map- ping. However, a significant problem of this approach is that the instrumentation necessary for gathering high qual- ity ground data on solar irradiance in general, and DNI in particular is expensive, so deploying it in large scale requires a non-trivial investment. In order to tackle this problem, our work proposes a Solar Dome Instrument (SDI), a novel low- cost solar irradiance measurement device constructed using commercial off-the-shelf components that provides global ir- radiance (GHI), diffuse irradiance (DHI) and DNI. The SDI hardware and software provides GHI readings with less than 3% NRMSE and DNI readings with less than 7% NRMSE compared to the traditional, more expensive solar irradiance instrumentation such as NIP/PSP solar tracker and MFR- 7 radiometer, while reducing the sensor acquisition cost at least 20 to 30 times and further reducing maintenance and operational costs. 1 Introduction The increasing utilization of solar-based power systems has created much interest in the technical and economic impacts of the solar resource availability and variability [19]. How- ever, the lack of reliable data for ground solar irradiance (di- rect normal and global irradiance) is a major obstacle for the development of adequate policies to promote and take ad- vantage of existing solar technologies [5]. Although the ra- diation that reaches the outer layers of the atmosphere is well defined and can be easily calculated [5], the solar irradiance that reaches the ground level where solar collectors (ther- mal and photovoltaic) operate depends strongly on localized and complex atmospheric conditions. For example, it is well known that cloud cover, aerosol content, and the presence of participating gases in the lower atmosphere (water vapor, carbon dioxide) and in the stratosphere (ozone) can reduce the availability of direct insolation at the ground level to a small fraction of the solar irradiance that reaches the upper atmosphere [5]. Therefore, it is difficult to estimate real-time and/or forecasting solar power availability with only statisti- cal models. The problem is substantially more complicated for the characterization of Direct Normal Irradiance (DNI) [5], which is the portion of the total solar irradiation that is most useful for solar concentrators. Solar concentrators that can concentrate in excess of 500 times the solar flux are currently considered the most viable technology for solar utilization, particularly in direct photovoltaic conversion systems due to economical concerns. Utility-scale solar thermal-power sys- tems also use primarily DNI for both solar-tower and solar- trough power plants, but in this case the concentration ra- tios and the acceptance angles are slightly more forgiven. Because most commercially viable solar technologies use higher concentrator techniques, knowledge about DNI avail- ability is of critical importance in designing, implementing and deploying such power plants. Most importantly, the cor- rect geographical placement of such plants demands, in ex- cess of other critical human and physical geography infor- mation, a solid understanding of the solar resources available locally at the specific deployment sites. DNI information is traditionally measured through two distinct experimental methods: the first is direct measure- ment at the ground level using Normal Incident Pyrheliome- ters (NIPs) mounted on Solar Trackers (STs); the second in- volves the indirect determination of DNI by subtracting the diffuse irradiance from the global irradiance. In the second case, the diffuse radiation is obtained by blocking the direct solar beam with either a shadow band or a shadow disk (in the case of the shadow band, the data collected must be cor- rected for the additional band of sky that is blocked). In prin- ciple, with a Precision Spectral Pyranometer (PSP) equipped with a Shade Disk Kit (SDK), one is able to determine both components that make up the global solar irradiance (DNI and diffuse). However, SDK systems do not replicate abso- lute radiometer results with the same accuracy and precision of NIPs.
Transcript of SDI: Solar Dome Instrument - Introduction · work proposes a Solar Dome Instrument (SDI), a novel...

SDI: Solar Dome Instrument for Solar Irradiance Monitoring
Tao Liu1, Ankur U. Kamthe1, Varick L. Erickson1, Carlos F. M. Coimbra2 and Alberto E. Cerpa11Electrical Engineering and Computer Science, University of California - Merced
akamthe,tliu,verickson,[email protected] and Aerospace Engineering, University of California - San Diego
AbstractThe lack of reliable data for ground solar irradiance (directnormal and global irradiance) is a major obstacle for the de-velopment of adequate policies to promote and take advan-tage of existing solar technologies. Although the radiationthat reaches the outer layers of the atmosphere is well definedand can be easily calculated, the solar irradiance that reachesthe ground level where solar collectors (thermal and photo-voltaic) operate depends strongly on localized and complexatmospheric conditions. These effects are particularly strongon the Direct Normal Irradiance (DNI). Because cloud covercorresponds to the strongest effect on ground insolation, nostatistical method that ignores micro-scale (< 2 km) or meso-gamma scale (2–20 km) weather systems can succeed in es-timating real-time and/or forecasting solar power availabil-ity. In this regard, mass deployment of ground measurementpoints is often necessary for precise solar irradiance map-ping. However, a significant problem of this approach isthat the instrumentation necessary for gathering high qual-ity ground data on solar irradiance in general, and DNI inparticular is expensive, so deploying it in large scale requiresa non-trivial investment. In order to tackle this problem, ourwork proposes a Solar Dome Instrument (SDI), a novel low-cost solar irradiance measurement device constructed usingcommercial off-the-shelf components that provides global ir-radiance (GHI), diffuse irradiance (DHI) and DNI. The SDIhardware and software provides GHI readings with less than3% NRMSE and DNI readings with less than 7% NRMSEcompared to the traditional, more expensive solar irradianceinstrumentation such as NIP/PSP solar tracker and MFR-7 radiometer, while reducing the sensor acquisition cost atleast 20 to 30 times and further reducing maintenance andoperational costs.
1 IntroductionThe increasing utilization of solar-based power systems hascreated much interest in the technical and economic impactsof the solar resource availability and variability [19]. How-ever, the lack of reliable data for ground solar irradiance (di-rect normal and global irradiance) is a major obstacle for thedevelopment of adequate policies to promote and take ad-vantage of existing solar technologies [5]. Although the ra-diation that reaches the outer layers of the atmosphere is welldefined and can be easily calculated [5], the solar irradiancethat reaches the ground level where solar collectors (ther-
mal and photovoltaic) operate depends strongly on localizedand complex atmospheric conditions. For example, it is wellknown that cloud cover, aerosol content, and the presenceof participating gases in the lower atmosphere (water vapor,carbon dioxide) and in the stratosphere (ozone) can reducethe availability of direct insolation at the ground level to asmall fraction of the solar irradiance that reaches the upperatmosphere [5]. Therefore, it is difficult to estimate real-timeand/or forecasting solar power availability with only statisti-cal models.
The problem is substantially more complicated for thecharacterization of Direct Normal Irradiance (DNI) [5],which is the portion of the total solar irradiation that is mostuseful for solar concentrators. Solar concentrators that canconcentrate in excess of 500 times the solar flux are currentlyconsidered the most viable technology for solar utilization,particularly in direct photovoltaic conversion systems due toeconomical concerns. Utility-scale solar thermal-power sys-tems also use primarily DNI for both solar-tower and solar-trough power plants, but in this case the concentration ra-tios and the acceptance angles are slightly more forgiven.Because most commercially viable solar technologies usehigher concentrator techniques, knowledge about DNI avail-ability is of critical importance in designing, implementingand deploying such power plants. Most importantly, the cor-rect geographical placement of such plants demands, in ex-cess of other critical human and physical geography infor-mation, a solid understanding of the solar resources availablelocally at the specific deployment sites.
DNI information is traditionally measured through twodistinct experimental methods: the first is direct measure-ment at the ground level using Normal Incident Pyrheliome-ters (NIPs) mounted on Solar Trackers (STs); the second in-volves the indirect determination of DNI by subtracting thediffuse irradiance from the global irradiance. In the secondcase, the diffuse radiation is obtained by blocking the directsolar beam with either a shadow band or a shadow disk (inthe case of the shadow band, the data collected must be cor-rected for the additional band of sky that is blocked). In prin-ciple, with a Precision Spectral Pyranometer (PSP) equippedwith a Shade Disk Kit (SDK), one is able to determine bothcomponents that make up the global solar irradiance (DNIand diffuse). However, SDK systems do not replicate abso-lute radiometer results with the same accuracy and precisionof NIPs.

To address the need of large scale solar radiation data, so-lar mapping programs such as SWERA [13] and the NationalSolar Radiation Database at NRReDC [12] offer databases ofsolar irradiance mapping for large geographical areas. Themajor limitation of these available databases is the fact thatthere is no real time solar irradiance information, and there-fore no forecasting capability. In addition to these two criti-cal limitations, the current services rely on mechanistic mod-els and satellite image processing to estimate DNI and totalsolar irradiance for very extensive areas that were never actu-ally compared against ground measurements. These models(see e.g. [2, 3, 6, 7, 11, 14, 15, 17, 18]) are poorly validatedagainst high-quality ground data, and therefore the accuracyof the satellite maps is compromised.
The constraints described above indicate the need formore precise and reliable ground data, which in turn shouldbe used to develop more accurate satellite image models.While getting a large number of measurement points is anecessary condition, in practice this is difficult to achieve.The problem of this approach is that the instrumentation(such as PSP and NIPs) necessary for gathering high qual-ity ground data on solar irradiance and DNI is expensive,so deploying it in large scale requires a non-trivial invest-ment. Renting of equivalent equipment is discarded becauseof the well-known longtime exposure degradation of ther-mopiles [5], which would bring uncertainty to our data. Per-haps more importantly, finding suitable locations for deploy-ment is equally or more difficult, due to the size of the equip-ment, the power consumption, access, routine attention dueto the moving parts required for DNI measurement, securityand protection needs.
In this work, we propose the design of a new solar ir-radiance measurement device named Solar Dome Instru-ment (SDI) as a part of Affordable System for Solar Irradi-ance Sensing and Tracking (ASSIST) –a National ScienceFoundation (NSF) funded project–. A major design goalof SDI is to offer accurate solar irradiance measurement atground level with a fraction of the cost of traditional ap-proaches. By eliminating the moving parts, SDI adopts asimple physical structure, which is easy to deploy and main-tain. Also, SDI uses only commercial off-the-shelf (COTS)components, which significantly reduces the total cost of theinstrument. A significant advantage of the simple structureand the low cost of SDI is that multiple SDIs can be poten-tially deployed at multiple locations without much econom-ical cost, and therefore enabling users to obtain very accu-rate solar irradiance data at fine time granularity from a largenumber of measurement points. This, in turn, can be useddevelop more accurate models for solar irradiance mapping.
In our design, SDI is a dome shaped device with a largenumber of solar irradiance sensors (> 200 sensors in our pro-totype design) facing different directions above the horizon-tal plane, such that the solar irradiance can be measured atmultiple angles at the same time. Given the angle of the sen-sors and the corresponding position of the sun at the timeof the measurement, the global and diffuse irradiance canbe inferred from the sensors facing the sun and the sensorswithout direct contact of the sun light respectively. Thus,DNI can be calculated by subtracting the diffuse irradiance
from the global irradiation in a way similar to PSP devices.In our prototype design, a SDI can provide DNI as well asglobal and diffuse irradiance readings at a time granularityof 1 second by continuously polling the sensors.
The contribution of this work is two fold. First, we pro-pose the design of the SDI, an affordable solar irradiancemeasurement instrument with no moving parts that uses onlyCOTS components, and define the algorithm to calculate theglobal irradiance (GHI), diffuse irradiance (DHI) and directnormal irradiance (DNI) with the SDI measurement. Second,we further assemble a prototype SDI with more than 200sensors under a budget of less than 500 dollars, and evalu-ate the prototype in a one month field experimentation. Withthe prototype SDI, we evaluate the choice of the solar irradi-ance sensor, and show that the measurement precision of theprototype is comparable to the MFR-7 co-located in the ex-periment site. Moreover, by analyzing the results of the pro-totype SDI, we gain important insights on the design flawsin the prototype and propose several potential improvementson future implementation of SDI.
The rest of the paper is organized as the follows. Sec-tion 2 introduces basic background information and brieflydiscusses the related work on solar irradiance measurementapproaches and the corresponding instruments. Section 3proposes the overall design of the SDI, whereas Section 4further presents the details of a prototype SDI. The evalua-tion of the prototype is presented in Section 5, and Section 6concludes with potential improvements of SDI.
2 Background and Related WorkLarge-scale generation of electric power based on solar ir-radiance continues progressing as an attractive modality forclean and efficient generation of electric power. Solar irradi-ance may reach a horizontal surface on the earth along twomain paths, such as directly from the sun and by way of dif-fuse irradiance, which does not arrive on a direct path fromthe sun (e.g., has no defined direction) since it is made up ofirradiance scattered by molecules and/or particles in the at-mosphere. Depending upon cloud conditions and/or time ofday (e.g., solar altitude), both the total amount of irradianceon the horizontal surface (GHI) and the respective propor-tions of direct and diffuse irradiance (DNI and DHI), whichmake up the global irradiance, may vary greatly. Such so-lar radiation data are a fundamental input for solar energyapplications such as photovoltaic, solar-thermal systems andpassive solar design.
In order to estimate the short and the long term perfor-mance of tilted flat plate collectors, photovoltaic modulesand other solar devices, often a measurement of at least oneof GHI, DNI and DHI solar irradiance components may beneeded. For example, measurements of DNI may be of par-ticular interest in concentrating solar thermal systems and/orin systems that track the position of the sun [5]. On the otherhand, measurements of DHI or GHI may be of more relevantin photovoltaic-based (PV-based) systems [5].
In the case of measurements of diffuse irradiance, it isknown to use mechanically-rotatable shadowing device (e.g.,MFR-7 [21, 8]), where a shadowing mechanical structure,such as ball, ring or band, generally involves a costly and

complicated mechanical contraption to meet a required me-chanical tracking accuracy, which may be difficult to con-sistently realize over a long period of time in the outdoors.A further undesirable characteristic of such devices may behigh maintenance cost introduced by the shadowing mechan-ical structure, which requires physical care to remove exces-sive dust and dirt to accurately capture the diffuse irradiancecomponent. Another consideration is that high-intensity di-rect irradiance may cause sensor burn-in effects, which mayshorten reliable operation of a sensor over time. These fac-tors limited the wide application and deployment of such de-vices.
Another main sources of solar radiation data are meteo-rological stations. Meteorological stations usually measuresolar global and diffuse radiation intensities on horizontalsurfaces. Measured solar radiation data on tilted surfacesare rarely available from the stations alone. Consequently,the solar radiation incident on a tilted surface must be deter-mined by converting the solar radiation intensities measuredon a horizontal surface to that incident on the tilted surfaceof interest in order to design the system size and estimate itslong term performance. Unfortunately, for many areas, so-lar radiation measurements are not easily available becauseof lack of resources to afford the measuring equipments, re-mote location, and/or simply lack the necessary techniques.Therefore, many models [14, 9, 18, 17] have been developedto estimate the amount of global solar radiation on horizon-tal surfaces on the basis of the more readily available cli-matic parameters, such as sunshine duration, cloud cover,humidity, maximum and minimum ambient temperatures,wind speed, etc. However, considerable error have appearedconcerning estimation of direct solar radiation on horizontalsurfaces because it is usually estimated by subtracting diffuseradiation from global radiation. In most cases, the method ofsubtracting the diffuse radiation from the total radiation doesnot give accurate results.
A conventional approach for solar irradiance monitoringhas been to use sky imagers. One particular type of skyimager is the TSI-880 (TSI), developed by Yankee Environ-mental Systems [21]. The TSI is composed of a hemispher-ical mirror with a CCD camera located above it. The mirrorcontains a sun tracking shadow-band that continuously cov-ers the mirror from the direct sunlight in order to protect thecamera from the suns reflection. Recently, Chi et al. [4] usedTSI images to produce instantaneous values of Global Hor-izontal Irradiance (GHI) using single-point solar irradiancesensors located in the University of California San Diego me-teorological network. They analyzed cloud field propagationby computing matching errors of the future image given thecurrent one translated in the direction of the computed ve-locity field. Their results suggest that TSI could be usefulfor forecasting horizons of up to 15 minutes. In [10], cloudindices obtained from the TSI built-in cloud classificationalgorithms and Infrared Radiometric measurements were re-ported to improve results for 1-hour forecasting of GHI.
The design of SDI proposed in this work differs from pre-vious approaches in two ways. First, SDI eliminates the needof any moving parts, and therefore it simplifies installationand only requires minimal maintenance. Second, SDI uses
Figure 1. A depiction of the SDI sensor covered by smallsolar irradiation sensors.
only commercial off-the-shelf (COTS) components, whichsignificantly reduces the total cost of the instrument. A sig-nificant advantage of the simple structure and the low costof SDI is that multiple SDIs can be potentially deployed atmultiple locations without much economical cost, enablingusers to obtain very accurate solar irradiance data at fine timeand space granularity from a large number of measurementpoints.
SIPS [1] is a distributed wireless sensor network systemcomposed of multiple different sensors distributed over re-gion around a PV solar power plant. The large number,lack of moving parts, and low-cost of the instrumentationshares with our system similar design tenants, but its goalsare different. While SIPS primary goal is to measure GHIaffected by cloud movement at short time scales, and usethis information for PV power plant output predictions inthe 0-10 minutes range (used for real-time and trading inthe power plan operation), the SDI is designed to measureGHI, DHI and DNI, which are measurements more usefulfor solar technologies based on solar concentrators, both forsolar-tower and solar-through power plants.
3 System DesignThis section presents the general design of SDI as well asthe proposed methodology of computing DNI. The detaileddesign of a prototype SDI is discussed in the next section asa reference design.
3.1 SDI OverviewSDI is designed for addressing the cost, deployment andmaintenance limitations of the Normal Incident Pyrheliome-ters (NIPs) mounted on Solar Trackers (STs). By design,SDI avoids using any moving parts and uses the statisticalreadings of several sensors to produce DNI and total solarirradiance. Figure 1 shows a depiction of SDI covered bysmall solar irradiance sensors. It consists of 2 special translu-cent domes of different diameters, such that one dome fitsinto the other one with a space gap between the two. The in-ner dome will house a large number of small solar irradiancesensors to cover the surface of the dome as close as possible,in particular for the top portion of it. The solar irradiancesensors include a design of the geometry of the sensor boardto maximize coverage and alignment on the dome. As anexample, the prototype sensor discussed in Section 4 is com-prised of circle shaped light sensitive sensing surface, with

Analog
Multiplexer(s)
Sensor
Input
Solar
Irradiance
Sensors
Data Collection
Station
Sensor Selection
Data
Figure 2. SDI inner dome with geodesic design. Only asubset of the sensors are illustrated.
a pair of connection cables perpendicular to the sensor sothat the cables can go through a hole to the inside the innerdome. The outer dome seals the unit and provides protec-tions from the elements. The cables run downward inside theinner dome and connect to analog signal multiplexers that areconnected to an outdoor-rated data collection/logging device(PC or other sensor platforms) that is housed on a small caseunderneath the dome. Heating exchange and temperaturecontrol (critical for these type of instruments) is provided byforced fan ventilation exhaust. The proposed methodologyused to recover DNI from the SDI instrument is explained inSection 3.3. The proposed instrument is projected to cost atleast less than five times the price (see quotations from Ep-pley) of a Normal Irradiance Pyrheliometer mounted on anautomatic tracker, and will provide simultaneous readings ofGlobal Horizontal Irradiance (GHI), Diffused Horizontal Ir-radiance (DHI) and Directo Normal Irradiance (DNI).
3.2 Dome Design PrinciplesFigure 2 depicts a general design of the inner dome as wellas the corresponding data collection units. Note that as theouter dome only serves as a protection layer, here we use theterm “dome” to refer to the inner dome which houses all thesensors.
As discussed in the previous section, SDI is equipped withmultiple sensors on the surface of the dome such that the so-lar irradiance can be measured at different angles simultane-ously. In order to maximize the coverage of the sensors onthe dome, these solar irradiance sensors should have a smallform factor and long connection cables that are perpendicu-lar to the sensing surface, so that the sensors can be denselyinstalled on the surface of the dome whereas the connectioncables can be extended into the inside of the dome for cen-tralized data collection. The total number of the sensors thatpopulate the dome is determined by the dimension of the sen-sor and the surface area of the dome. In our prototype, weconstructed a SDI with more than 200 light sensors attached
to a plastic dome with a diameter of 19 inches.
One concern is that due to the the large number of sensors,it is impractical to wire all the sensor cables directly to thedata collection PC. Therefore we adopted a two-layer struc-ture to efficiently collect the readings from all the sensors:the sensors are organized into groups, and each group of sen-sors connects to an analog multiplexer, which in turn is con-trolled by the data collection station (PC or small-form em-bedded computer with network connection). For example,as depicted in Figure 2, six sensors installed on the dome areorganized as a group and connect to an analog multiplexer.Based on the input from the select line, the multiplexer for-wards the selected sensor input to a single output line. There-fore, by controlling the sensor select line, the data collectionstation can instruct the multiplexer to select the correspond-ing sensor as the output and poll all the sensors connectedto the multiplexer. With several many-to-one multiplexers,the data collection station can effectively query hundreds ofsensors in a short time frame.
3.3 DNI Calculation MethodologyThe relationship between the angle of incidence (θ) of theDNI beam to a generically positioned sensor and the otherangles in Figure 3 is calculated by the following formula:
cosθ = cosθz cosβ+ sinθz sinβcos(γs− γ) (1)
Where θz is the solar zenith angle, γs and αs are the solarazimuth angle and altitude angle, and β and γ are the slopeangle and azimuth angle of the tilted surface [5].
However, to simplify the formulation and illustrate themethodology, we describe below the method to determinethe DNI flux Ib for sloped surfaces facing South. Our objec-tive is to compute the DNI flux Ib using statistical data for thetotal irradiance that reaches several inclined planes. Multi-ple sensors for each plane will be used so that the reliabilityof the total irradiance measurements for each direction is en-hanced. We start by computing the total flux on each tiltedplane using the HDKR (Hay, Davies, Klucher and Reindl)model [5]:
IT =(Ib+ ε Id)Rb+ Id(1− ε)(1+ cosβ
2(1+
√
Ib/I sin3 β
2)
+ Iρg(1− cosβ
2),
where ε = Ib/Io, the subscript b stands for beam, the sub-script d stands for diffuse, the subscript o stands for extrater-restrial, and Rb is a time-averaged angle ratio calculated ev-ery interval of 10 minutes (see page 91 of [5]). We define theatmosphere efficiency as η = I/Io and define the followingparameters for each slope:
Ai =1+ cosβi
2Bi = sin3
βi
2Ci = ρg
1− cosβi
2,
where ρg is the glazing transmittance. We also define f =√
Ib/I, so that the ratio of total irradiance in each inclined
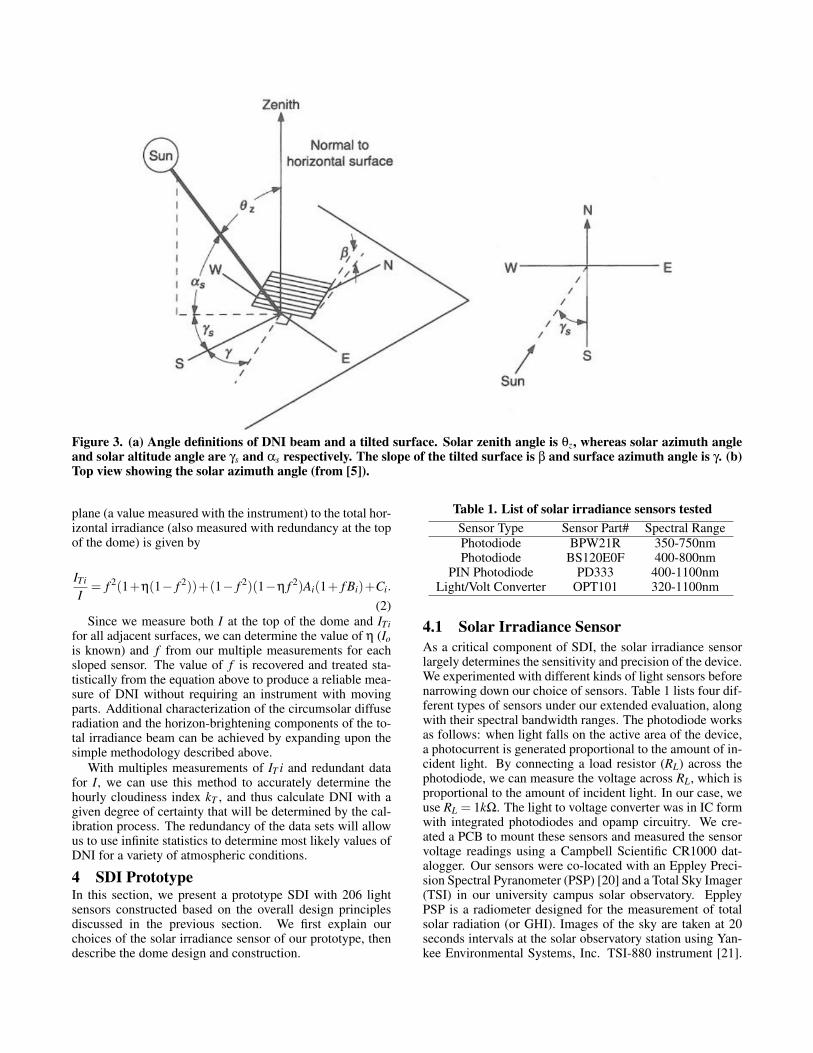
Figure 3. (a) Angle definitions of DNI beam and a tilted surface. Solar zenith angle is θz, whereas solar azimuth angleand solar altitude angle are γs and αs respectively. The slope of the tilted surface is β and surface azimuth angle is γ. (b)Top view showing the solar azimuth angle (from [5]).
plane (a value measured with the instrument) to the total hor-izontal irradiance (also measured with redundancy at the topof the dome) is given by
ITi
I= f 2(1+η(1− f 2))+(1− f 2)(1−η f 2)Ai(1+ f Bi)+Ci.
(2)Since we measure both I at the top of the dome and ITi
for all adjacent surfaces, we can determine the value of η (Iois known) and f from our multiple measurements for eachsloped sensor. The value of f is recovered and treated sta-tistically from the equation above to produce a reliable mea-sure of DNI without requiring an instrument with movingparts. Additional characterization of the circumsolar diffuseradiation and the horizon-brightening components of the to-tal irradiance beam can be achieved by expanding upon thesimple methodology described above.
With multiples measurements of IT i and redundant datafor I, we can use this method to accurately determine thehourly cloudiness index kT , and thus calculate DNI with agiven degree of certainty that will be determined by the cal-ibration process. The redundancy of the data sets will allowus to use infinite statistics to determine most likely values ofDNI for a variety of atmospheric conditions.
4 SDI PrototypeIn this section, we present a prototype SDI with 206 lightsensors constructed based on the overall design principlesdiscussed in the previous section. We first explain ourchoices of the solar irradiance sensor of our prototype, thendescribe the dome design and construction.
Table 1. List of solar irradiance sensors tested
Sensor Type Sensor Part# Spectral RangePhotodiode BPW21R 350-750nmPhotodiode BS120E0F 400-800nm
PIN Photodiode PD333 400-1100nmLight/Volt Converter OPT101 320-1100nm
4.1 Solar Irradiance Sensor
As a critical component of SDI, the solar irradiance sensorlargely determines the sensitivity and precision of the device.We experimented with different kinds of light sensors beforenarrowing down our choice of sensors. Table 1 lists four dif-ferent types of sensors under our extended evaluation, alongwith their spectral bandwidth ranges. The photodiode worksas follows: when light falls on the active area of the device,a photocurrent is generated proportional to the amount of in-cident light. By connecting a load resistor (RL) across thephotodiode, we can measure the voltage across RL, which isproportional to the amount of incident light. In our case, weuse RL = 1kΩ. The light to voltage converter was in IC formwith integrated photodiodes and opamp circuitry. We cre-ated a PCB to mount these sensors and measured the sensorvoltage readings using a Campbell Scientific CR1000 dat-alogger. Our sensors were co-located with an Eppley Preci-sion Spectral Pyranometer (PSP) [20] and a Total Sky Imager(TSI) in our university campus solar observatory. EppleyPSP is a radiometer designed for the measurement of totalsolar radiation (or GHI). Images of the sky are taken at 20seconds intervals at the solar observatory station using Yan-kee Environmental Systems, Inc. TSI-880 instrument [21].

05/22 05/23 05/24 05/25 05/26 05/27 05/28 05/29 05/30 05/31 06/010
500
1000
0
200
400
600
PD333 OPT101P BPW21R BS120E GHI
Date
GlobalHorizontalIrradiance
(W/m
2)
SolarIrradiance
SensorReadings(volt)
Figure 4. Global Horizontal Irradiance (GHI) from the Eppley PSP and voltage readings from solar irradiance sensors(PD333, OPT101P, BPW21R and BS120E0F) measured using a datalogger. The plots has multiple y–axes. The lefty-axes is for GHI (W/m2), whereas the one on the right is for the sensor readings (in volt.)
0 100 200 300 400 500 600 700 800 900 10000
100
200
300
400
500
600
GHI
PD333
0 100 200 300 400 500 600 700 800 900 10000
5
10
15
20
25
30
GHI
OPT101P
0 100 200 300 400 500 600 700 800 900 1000150
200
250
300
350
400
450
500
550
GHI
BPW21R
0 100 200 300 400 500 600 700 800 900 10000
50
100
150
200
250
300
350
400
450
500
GHI
BS120E0F
(a) ρ = 0.77 (b) ρ = 0.17 (c) ρ = 0.6 (d) ρ = 0.7Figure 5. Scatter plots of Global Horizontal Irradiance (GHI) from the Eppley PSP and voltage readings from solar ir-radiance sensors (PD333, OPT101P, BPW21R and BS120E0F). ρ indicates the Pearson’s correlation coefficient betweenGHI and sensor readings.
07/05 07/06 07/06 07/070
1000
xx1
200
400
PD333
GHI
GlobalHorizontalIrradiance
(W/m
2)
SolarIrradiance
SensorReadings(volt)
0 200 400 600 800 1000 12000
50
100
150
200
250
300
350
400
450
xd1
yd
2
(a) GHI and readings from PD333. (b) Scatter plots GHI and PD333 (ρ = 0.98).Figure 6. Global Horizontal Irradiance (GHI) from the Eppley PSP and voltage readings from PD333 sensor whenusing a neutral density filter.

10.6o
50cm
4.6cm
3.5cm
Solar Irradiance
Sensors (PD333)
Data Collection Unit
(a) Prototype dome
mux1
CHAN
OUTSEL
mux2
CHAN
OUTSEL
mux13
CHAN
OUTSEL
...
mux0
CHAN
OUT
SEL
Sensor 1 - 16 Sensor 17 - 32 Sensor 193 - 206
Basestation
mux: TI CD74HC4067 16-Channel Multiplexer
Basestation: Arduino Mega 128
Sensor SelectGroup Select
(b) Data Collection Unit
Figure 7. Left: dimension of the dome. Right: schematic of the data collection unit.
(a) Prototype dome, top view (b) Dome deployed in the solar observatory
Figure 8. Left: top-down view of the prototype dome. Right: Dome deployed in the solar observatory.
We recorded readings from our sensors and the PSP fromApril-July 2011. The goals of this evaluation were two-fold:(i) to see how well our COTS sensors measure the total solarradiation in comparison to the Eppley PSP from the solar ob-servatory, and (ii) to see if these off-the-self sensors are ableto withstand the harsh conditions (temperature, dust) of anoutdoor deployment.
We first discuss the data from our study between April-June 2011. Figure 4 shows the readings of GHI from theEppley PSP and corresponding voltage readings from our so-lar irradiance sensors for a representative subset of the days.Figure 5 shows the scatter plots of the voltage readings fromeach sensor and GHI. From Figures 4 and 5, we can observethat out of the 4 sensors, the PD333 output shows the bestcorrelation with the GHI. The BPW21R and BS120E sensorsdisplayed a bimodal output indicating that they are prone tosaturation, and are unable to capture the solar irradiance dy-namics. The OPT101 sensor was also saturated, did not dis-play any correlation.
Based on this data, we decided to proceed with the PD333PIN photodiode sensor. To improve the correlation betweenGHI and our sensor, we decided to reduce the saturation ef-fect using a neutral density filter. A neutral density filter re-duces and/or modifies intensity of all wavelengths or colorsof light equally, thus making it ideal for purpose of reducingthe saturation effects. From Figure 6, we observe that thePD333 sensor shows even better correlation with respect to
GHI when we introduce a neutral density filter. The Pear-son’s coefficient between the two is 0.98, indicating verygood correlation. Thus, using the PD333 with a neutral den-sity filter is a good choice for inexpensive sensing of solarirradiance.
4.2 Dome SpecificationNext, we construct the dome by installing the disk-shapedsolar irradiance sensors (PD333 light sensor with neutraldensity filter) on the outside of an acrylic dome. The physi-cal dimension of the dome, as well as the photos of the actualdome, are shown in Figure 7 and 8.
As shown in Figure 7(a), the acrylic dome has a diameterof 50 centimeters, whereas the diameter of the sensor is 3.5centimeters. To evenly distribute the sensors, we divide thecross-section of the dome into 17 segments with 10.6, suchthat the surface of each segment can hold just one sensor. Atop-down view of the finished prototype dome is pictured inFigure 8(a), and Figure 8(b) shows the dome deployed in thesolar observatory. The white disks with red rim are the neu-tral density filters, and the PD333 light sensors are directlyattached underneath the neutral density filters by small plas-tic cups. The cups also fix the sensors in the holes drilled onthe dome and guide the wires from the sensor into the insideof the dome. The wires extending from the sensors are di-vided into 13 groups, each group accounts for the wires from16 sensors, except for the last group which only accounts forthe remaining 14 sensors. The groups of wires are connected

to the data collection unit which queries the sensor for solarirradiance in a round-robin fashion.
4.2.1 Data Collection UnitThe role of the data collection unit is to continuously
query the solar irradiance sensors for irradiation data, andstore or transmit the data using a base station computer.However, due to the large number of sensors, it is impossi-ble to directly connect the wires from the sensors to a singlebase station. Therefore, we utilize analog signal multiplex-ers to aggregate the data to the centralized base station. Theoverall schematic of the data collection unit is shown in Fig-ure 7(b).
A multiplexer (mux in Figure 7(b)) is a device that acceptsseveral analog or digital input signals (labeled as CHAN) andforwards one of them as its output (labeled as OUT) based onthe input from the selection line (labeled as SEL). As shownin Figure 7(b), we adopt a hierarchical structure to facilitatethe management of the sensor inputs. The input from thesensors is first directed to 13 multiplexers (mux1 – mux13),whereas the output of these multiplexers are used as the in-put of mux0, a group selection multiplexer. The base stationaccepts the output from mux0 and controls the line selectionof all multiplexers through two SEL lines: one for mux0 asthe group select, and another one for mux1 to mux 13 as thesensor select. In our prototype we use an Arduino Mega asthe base station.
In one round of data collection, the base station first setsthe SEL line of mux0 to 0, which tells mux0 to output thesignals from channel 0, which is wired to mux1 in our case.Then, the base station iterates the sensor SEL line of mux1from 0 to 15, corresponding the sensors number 1 to 16 ingroup one. Once the reading of the first group is finished,the base station selects the next group and repeats the pro-cess. Note that as the SEL lines for mux1 to mux13 are con-nected together, the base station can use a single line to se-lect the sensors in the current group set by mux0. Based onour experiments, the Arduino Mega can collect the readingsfrom all the 206 sensors once every second. The collecteddata is subsequently transmitted to a centralized database forstorage.
4.3 SDI Acquisition and Operational CostsIn this section we evaluate the SDI acquisition costs and
qualitatively estimate the operational costs when runningover longer periods of time.
Table 2 shows the detailed SDI components’ costs. Thecurrent estimated cost, including components, assembly,testing and markup pricing is less than∼$795. For reference,state-of-the-art instruments to measure GHI, DHI and DNI,such as the Multi-Filter Rotating Shadowband Radiometer(MFR-7) developed by Yankee Environmental Systems [21]costs $17K, and the NIP/PSP with Solar Tracker and ShadeDisk Kit solar irradiance measurement unit from The EppleyLaboratory costs $25K. The SDI prototype cost is between20 and 30 times cheaper that the current state-of-the-art in-struments available in the market.
It is important to point out that the current estimated costis for our first prototype, and further costs reductions couldbe obtained when actually producing a commercial product.
Table 2. SDI Breakout Cost
Component Description Qty. Unit $ Total $
Everlight EL-PD333-3C 206 0.388 79.933/8”x12”x12” PTFE Sheet 1 97.42 97.42MXU TI CD74HC4067 16 4.26 68.16Custom Interface Board 1 12.30 12.30Arduino Mega 2560 1 59.00 59.00Acrylic Domes 20” 2 35.00 70.00Electrical Fan 1 12.00 12.00Pelican Case (outdoor rated) 1 98.00 98.00Miscellany (cables, o-rings) 1 50.00 50.00Labor Costs ($25/hour) 5 25.00 125.00Total Cost 671.8118% Markup Price 120.93
Selling Price 792.74
There are many things that could be done to drive downcosts. First, many of the components are not being boughtin bulk, which can drive the components’ prices down. Sec-ond, as our results in Section 5.3.2 show, the unit could bemade much more compact without much increase in overallmeasuring error. Currently, we have 206 sensors installed inthe SDI prototype, and our results indicate that the SDI unitcould be manufactured with an order of magnitude less sen-sors (∼20 sensors) without significant increase in GHI, DNIand DHI measurement errors. This order of magnitude re-duction can drastically reduce not only the cost of the lightsensors, but also the number of diffusers, multiplexers, domesizes, o-rings, cables, size of the case and additional materi-als, as well as manufacturing labor costs, creating a cascadeeffect. Finally, further costs reductions could be achievedby covering the whole dome in a diffuser material instead ofadapting each diffuser to each sensor individually. We leavethese and further cost reduction measures for future work.
Another important aspect of the overall cost to be con-sidered is the operational and maintenance costs. The ma-jority of the sensors currently used to measure solar irradi-ance in general, and more specifically DNI, require signifi-cant human resources to maintain and keep the sensors op-erational. The most common problem is the accumulationof dirt and dust on the sensor surfaces, that requires special-ized crews to clean up the instrumentation periodically, asoften as a couple of times per week depending on weatherconditions. The SDI instrument has two main advantageswith respect to the state-of-the-art instruments available inthe market. First, it has no moving mechanical parts, whichsignificantly reduces the failures of the mechanical compo-nents (solar tracker, shadowing bands, etc.). Second, the SDIuses a Polytetrafluoroethylene (PTFE) diffuser (most com-monly known as Teflon). This material is hydrophobic, i.e.neither water nor water-containing substances wet the mate-rial, making it ideal for outdoor applications exposed to rainand dust. Furthermore, PTFE has a very low coefficient offriction (∼0.05–0.10), meaning substances have a hard timesticking to it, and are very easily removed. In our exper-iments we did not test the prototype over a longer enoughperiods of time to determine quantitatively the MTBF andto more precisely estimate operational and maintance costs,
0 5 10 15 20 250
500
1000
1500
2000
Days
GH
I
Normalized RMSE: 0.053152
Measured GHI
GHI
0 5 10 15 20 250
100
200
300
400
500
Days
DH
I
Normalized RMSE: 0.096548
Measured DHI
DHI
0 5 10 15 20 250
500
1000
1500
2000
Days
DN
I
Normalized RMSE: 0.14587
Measured DNI
DNI
Figure 9. Measured GHI, DHI and DNI calculated using Equation 3.
but we strongly believe that based on the design (no mov-ing parts) and materials used (PTFE diffusers) that the SDIshould have significantly lower maintenance costs over thelife cycle of the device compared with other instruments.
5 EvaluationThis section reports the primarily results of the prototypeSDI deployed in the solar observatory co-located with MFR-7, a high precision solar insolation measurement device witha shadow band.
5.1 Experimental SettingsThe prototype SDI was evaluated experimentally in the solarobservatory in our local campus during June 22 to July 19,2012. The weather during this period was mostly sunny witha few cloudy days. The dome was deployed on a flat woodenrack, and the direction of the sensors were noted for calculat-ing the angle between the solar beam and the sensing surface.The Arduino Mega used in the data collection unit was con-nected to a Linux computer that buffered the sensor readingsand periodically sent readings to the campus network.
A MFR-7 is co-located at the same site to provide theground truth data for GHI, DHI and DHI. The time granular-ity of the MFR-7 is one minute, i.e., it reports a new set ofreadings every minute, whereas the prototype SDI updatesthe sensor readings every second. To align with the groundtruth data, SDI readings are subsampled to one minute gran-ularity using the mean value of the readings gathered dur-ing the subsampled minute. In total, we gathered over onemillion data points from the prototype SDI during the de-ployment, corresponding to more than 300 hours of solar ir-radiance measurements. Next, we present the performance
results in terms of SDI measurement errors with respect tothe MFR-7.
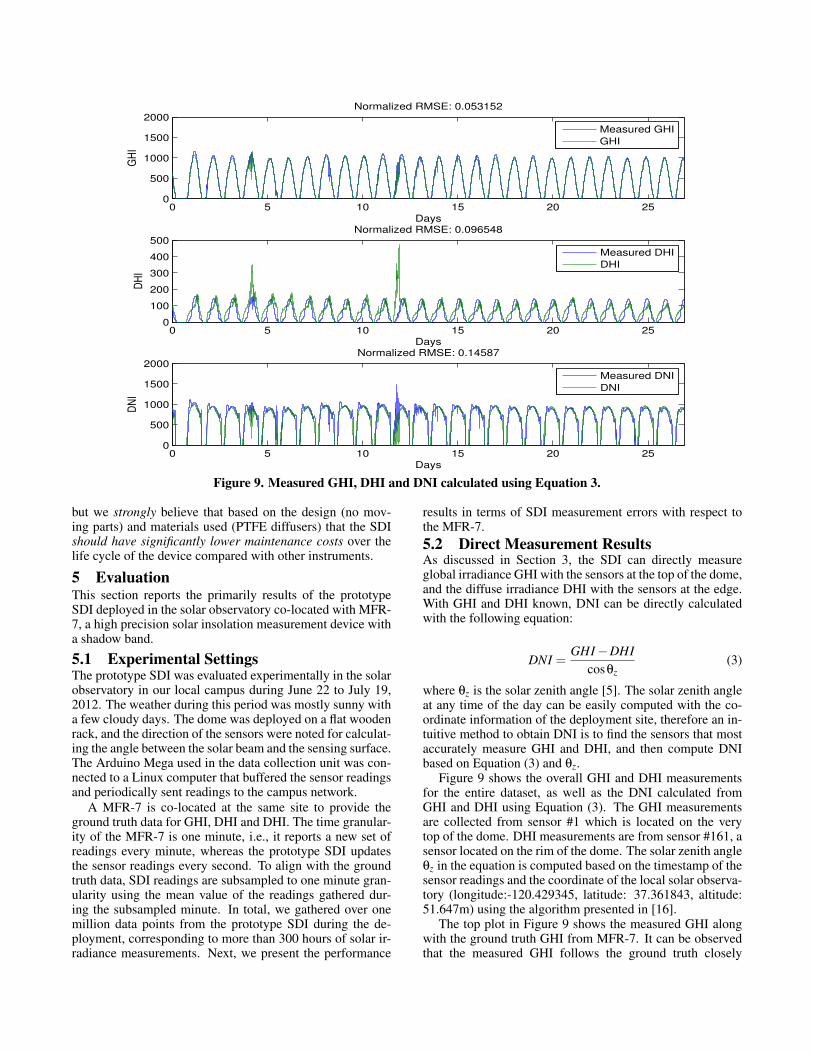
5.2 Direct Measurement ResultsAs discussed in Section 3, the SDI can directly measureglobal irradiance GHI with the sensors at the top of the dome,and the diffuse irradiance DHI with the sensors at the edge.With GHI and DHI known, DNI can be directly calculatedwith the following equation:
DNI =GHI−DHI
cosθz(3)
where θz is the solar zenith angle [5]. The solar zenith angleat any time of the day can be easily computed with the co-ordinate information of the deployment site, therefore an in-tuitive method to obtain DNI is to find the sensors that mostaccurately measure GHI and DHI, and then compute DNIbased on Equation (3) and θz.
Figure 9 shows the overall GHI and DHI measurementsfor the entire dataset, as well as the DNI calculated fromGHI and DHI using Equation (3). The GHI measurementsare collected from sensor #1 which is located on the verytop of the dome. DHI measurements are from sensor #161, asensor located on the rim of the dome. The solar zenith angleθz in the equation is computed based on the timestamp of thesensor readings and the coordinate of the local solar observa-tory (longitude:-120.429345, latitude: 37.361843, altitude:51.647m) using the algorithm presented in [16].
The top plot in Figure 9 shows the measured GHI alongwith the ground truth GHI from MFR-7. It can be observedthat the measured GHI follows the ground truth closely

0 5 10 15 20 250
500
1000
1500
2000
Days
GH
I
Normalized RMSE: 0.050617
Predicted GHI
GHI
0 5 10 15 20 250
100
200
300
400
500
Days
DH
I
Normalized RMSE: 0.055082
Predicted DHI
DHI
0 5 10 15 20 250
500
1000
1500
2000
Days
DN
I
Normalized RMSE: 0.1282
Predicted DNI
DNI
Figure 10. Linear fit of GHI, DHI and DNI calculated using Equation 3. The input dimension is 10, i.e. 10 sensors areused as the input for each model.
with a Normalized Rooted Mean Squared Error (NRMSE)of 0.05. This result confirms the results presented in Sec-tion 4.1: the PD333 light sensor can correctly map the cor-responding sensor readings to solar irradiance with an meanerror less than 5% of the GHI value. The middle plot inFigure 10 shows that in the case of DHI, the measurementaccuracy is worse than GHI with a NRMSE close to 0.1. Inthe bottom plot of Figure 10, we see that the NRMSE of theDNI calculated by Equation (3) is about 0.15, higher thanGHI and DHI. We suspect the error presented in Figure 9is mainly caused by inaccurate measurements of the sen-sor direction, hence affecting the accuracy of GHI and DHImeasurement. Moreover, the error from the GHI and DHImeasurements are cumulative when calculating DNI results,causing the increased error.
To further explore the measurement accuracy of differ-ent sensors, we picked 9 sensors with the most correlatedreadings with respect to GHI and DHI, and computed theNRMSE based on the measurements from these sensors.Figure 11 presents the measurement error (NRMSE) with re-spect to the sensor ID. The sensor IDs presented in the x-axisdenote the sensors with the best GHI measurements, wherethe blue, green and red curve present the NRMSE of GHI,DHI and DNI correspondingly. Note that although all thesensors are located on the top of the dome, only sensors #1, 18, 55, 77 and 78 provide the most accurate measure-ments (NRMSE ≈ 0.05). On the other hand, the accuracyof DHI measurement is close to 0.1 for all the 9 picked sen-sors, showing that the measurement of diffused light is al-most uniform for the sensors around the rim of the dome.
78 77 55 1 18 102 10 2 190
0.05
0.1
0.15
0.2
0.25
Sensor ID
No
rma
lize
d R
MS
E
GHI
DHI
DNI
Figure 11. NRMSE as a function of different sensors.
The calculated DNI values show NRMSE of 0.12 in the bestcase (using sensor #1 for GHI measurement, #161 as DHImeasurement).
These results show the best accuracy we can obtain withsingle, hand picked sensors. In the next section, we try touse multiple sensor reading to improve the measurement ac-curacy with curve fitting methods.
5.3 Curve Fitting Method ResultsAs discussed in Section 3, a major advantage of SDI is thatthere are multiple sensors available for solar irradiance mea-surement. Therefore, with the help of machine learning mod-els, we can use readings from multiple sensors as the input ofa model, and train the model to fit to the desired target output,

5 10 20 30 40 500
0.05
0.1
0.15
0.2
0.25
Number of Input Sensors
No
rma
lize
d R
MS
E
GHI
DHI
DNI
Figure 12. NRMSE as a function of varying number ofsensors for model input.
i.e., GHI, DHI and DNI. This machine learning approach al-low us to create models fit with multiple dimensional inputmatrix from any number of sensors, and hopefully providebetter accuracy than using any single sensor. We first presentthe results from using linear fit model, and then briefly dis-cuss the results of using an artificial neural network as thecurve fitting model.
5.3.1 Linear Fit ModelTo create a curve fitting model, we need to first establish thecorrelation between the raw sensor reading and the actual ir-radiance value. Noticing that Figure 6 shows the relationshipbetween GHI and the sensor reading is mostly linear, an effi-cient approach to establish this correlation is to train a linearmodel with a training dataset, and then use the trained modelto convert the sensor reading to solar irradiance.
In our evaluation, we use the first 20% of the total dataset(roughly corresponding to 7 days worth of data) as the train-ing dataset to train the linear fit models that map the sen-sor readings to GHI and DHI respectively. As seen in Fig-ure 8(a), there are about 10 sensors installed on the top part ofthe dome, therefore we include these 10 sensors as the inputof the GHI linear fit model. Similarly, the DHI model adopts10 sensors from the bottom rim of the dome, as they mostlycorrespond to the diffused irradiance. Figure 10 shows theoverall fit of the linear models for the entire dataset, as wellas DNI calculated from GHI and DHI using Equation (3).The solar zenith angle z in the equation is computed basedon the timestamp of the sensor readings.
The top plot in Figure 10 shows the predicted GHI com-puted by the trained linear model, along with the groundtruth GHI from MFR-7. We notice that the predicted GHIfollows the ground truth closely with a Normalized RootedMean Squared Error (NRMSE) of 0.05. This result indicatesthat the linear model can correctly map the correspondingsensor readings to GHI with an mean error less than 5% ofthe GHI value. The middle plot in Figure 10 shows similarresults in the case of DHI, with NRMSE less than 0.06. How-ever, in the bottom plot of Figure 10, we see that the NRMSEof the DNI calculated by Equation (3) is about 0.13, higherthan GHI and DHI. We suspect this increased error is mainlycaused by inaccurate measurements of the sensor direction,
which might be corrected by inferring the actual angle ofincidence of the sensors with the method introduced in Sec-tion 3.3. We leave this improvement to future work.
5.3.2 Precision Gain with Multiple SensorsAs discussed in the previous section, an advantage of SDI
is that it can consider readings from multiple sensors to im-prove the precision of the measurement result. To furtherquantify this point, we plot the NRMSE with respect to thenumber of sensors used in the input in Figure 12.
From Figure 12, it is apparent that as the linear model in-corporates more sensors, the error (NRMSE) decreases forGHI, DHI and DNI. For example, with 5 sensors as input,the linear model predicts DHI with more than 0.08 NRMSE,whereas with 50 sensor input, the prediction error of DHI re-duces to less than 0.05. We can also observe that the trend oferror reduction slows down after 20 sensors, which impliesa dome with 20 well placed sensors can perform similarlycompared to domes with significantly larger number of sen-sors. This observation can be viewed as an important designguideline in the future iteration of SDI.
5.3.3 Artificial Neural Network ModelIn order to further explore the possible gain of using the mod-eling approach, we also employed an artificial neural net-work (ANN) as the fitting model. Artificial neural network,when used in curve fitting, can create non-linear models thatfit to complicated correlations. Figure 13 presents the mea-surement error with respect to the number of input sensorsusing two ANN models respectively.
Figure 13(a) presents the measurement error using a stan-dard backpropagation ANN model with 1 hidden layer com-prised of 20 hidden units. The training and testing datasetsare the same with the linear models. In general, the GHI re-sults shown in Figure 13(a) are similar to the linear model,but GHI, DHI and DNI accuracy is better than the linear fitresults. In particular, the NRMSE of DNI is typically lowerthan 0.1, and has a best (lower) value of 0.0693, which issignificantly better than the 0.13 error of the linear model.Furthermore, the GHI and DHI errors are also reduced, be-ing typically lower than 0.04 and 0.03, and best (lower) errorvalues of 0.0284 and 0.0217 respectively. This encouragingresult indicates that ANN can improve the measurement ac-curacy significantly.
In Figure 13(b), we increased the complexity of the ANNmodel by using an ANN model with 2 hidden layer, witheach layer containing 20 hidden units. As shown in Fig-ure 13(b), the measurement error is actually worse than thesingle layer ANN, which implies that the 2-layer ANNmightbe over-fitting to the training data, thus decreasing the over-all accuracy of the model and not generalizing quite well totesting data. Further exploration of ANN model parameterselection is left for future work.
6 Conclusion and Future WorkThis paper proposes the Solar Dome Instrument (SDI), anovel low-cost solar irradiance measurement device built us-ing commercial-off-the-shelf components. The SDI providesglobal irradiance (GHI), diffuse irradiance (DHI) and directnormal irradiance (DNI) with a slightly lower accuracy thanstate-of-the-art instruments, such as NIP/PSP and MFR-7,

5 10 20 30 40 500
0.05
0.1
0.15
0.2
0.25ANN, 1 Hidden Layer
Number of Input Sensors
NR
MS
E
GHI
DHI
DNI
(a) ANN: 1 Hidden Layer
5 10 20 30 40 500
0.05
0.1
0.15
0.2
0.25ANN, 2 Hidden Layers
Number of Input Sensors
NR
MS
E
GHI
DHI
DNI
(b) ANN: 1 Hidden Layer
Figure 13. Measurement error (NRMSE) as a function of the number of sensors as input of the ANN model.
but with a cost 20 to 30 times lower. The proposed SDI de-sign eliminates any moving parts and adopts a simple phys-ical structure, which is easy to deploy and maintain. A sig-nificant advantage of the simple structure and the low costof SDI is that multiple SDIs can be potentially be deployedat multiple locations without much economical cost both interms of instrument acquisition and maintenance, and there-fore enabling users to obtain very accurate solar irradiancedata at much larger spatial and temporal scales. The proto-type implementation of SDI shows that the accuracy of GHIand DHI measurements has less than 3% error, whereas theerror rate of DNI measurement is lower than 7% when us-ing an ANN fit model. Future improvements of SDI includebetter DNI computation methodology and reduction in thenumber of sensors per dome to further decrease cost.
7 AcknowledgmentThis material is based upon work partially supported by theNational Science Foundation under grants #CNS-0923586and #CNS-1254192, and the Center for Information Tech-nology Research in the Interest of Society under grants#CITRIS-SPF-81 and #CITRIS-SPF-165.
8 References[1] S. Achleitner, A. U. Kamthe, T. Liu, and A. E. Cerpa. SIPS: So-
lar irradiance prediction system. In Proceedings of the Thirtheenth
ACM/IEEE International Conference on Information Processing on
Sensor Networks (IPSN 2014), page 12 pages, Berlin, BE, Germany,Apr. 2014. ACM/IEEE. 3
[2] R. E. Bird and R. L. Hulstrom. Review, evaluation, and improvementof direct irradiance models. ASME Transactions of Solar Energy En-
gineering, 103:182–192, Aug. 1981. 2
[3] D. Cano, J. M. Monget, M. Albuisson, H. Guillard, N. Regas, andL. Wald. A method for the determination of the global solar radiationfrom meteorological satellite data. Solar Energy, 37(1):31–39, 1986.2
[4] W. C. Chi, B. Urguhart, M. Lave, A. Dominquez, J. Kleissl, J. Shields,and B. Washom. Intra-hour forecasting with a total sky imager at theUC san diego solar energy testbed. Solar Energy, 85(2011):2881–2893, Sept. 2011. 3
[5] J. A. Duffie and W. A. Beckman. Solar Engineering of Thermal Pro-
cesses. John Wiley and Sons, New Jersey, Jan. 2006. 1, 2, 4, 5, 9
[6] C. Gautier, G. Diak, and S. Masse. A simple physical model to esti-mate incident solar radiation at the surface from GOES satellite data.AMS Journal of Applied Meteorology, 19:1005–1012, Aug. 1980. 2
[7] M. Iqbal. An Introduction to Solar Radiation. Academic Press Inc.,Toronto, Canada, Jan. 1983. 2
[8] H. L, M. J, and B. J. Automated multifilter rotating shadow-band ra-diometer: an instrument for optical depth and radiation measurements.Applied Optics, 33:5118–5125, 1994. 2
[9] C. M and Chibani. Global solar radiation estimation in algeria. EnergyConvers Manage, 42:73, 2001. 3
[10] R. Marquez and C. F. M. Coimbra. Intra-hour DNI forecasting basedon cloud tracking image analysis. Solar Energy, 91(0):327–336, 2013.3
[11] E. L. Maxwell. METSTAT–the solar radiation model used in the pro-duction of the national solar radiation data base (NSRDB). Solar En-ergy, 62(4):263–279, 1998. 2
[12] National Renewable Energy Laboratory. Rrenewable Resource DataCenter (NRReDC) – National Solar Radiation Database (NSRDB).http://www.nrel.gov/rredc/solar_resource.html. 2
[13] Open Energy Information. The Solar and Wind Energy Resource As-sessment (SWERA) Program. http://en.openei.org/datasets/.2
[14] E. B. Pereira, S. L. Abreu, R. Stuhlmann, M. Rieland, and S. Colle.Survey of the incident solar radiation in brazil by use of meteosat satel-lite data. Solar Energy, 57(2):125–132, 1996. 2, 3
[15] R. T. Pinker and J. A. Ewing. Modeling surface solar radiation: Modelformulation and validation. AMS Journal of Applied Meteorology,24:389–401, Oct. 1985. 2
[16] I. Reda and A. Andreas. Solar position algorithm for solar radiationapplications. Solar Energy, 76(5):577–589, 2004. 9
[17] C. Schillings, H. Mannstein, and R. Meyer. Operational method forderiving high resolution direct normal irradiance from satellite data.Solar Energy, 76(4):475–484, 2004. 2, 3
[18] C. Schillings, R. Meyer, and H. Mannstein. Validation of a method forderiving high resolution direct normal irradiance from satellite dataand application for the arabian peninsula. Solar Energy, 76(4):485–497, 2004. 2, 3
[19] V. Sundar. Integration of renewable resources: operational require-ments and generation fleet capability at 20 percent RPS. Technicalreport, California Independent System Operator (CAISO), 2010. 1
[20] The Eppley Laboratory Inc. Eppley Precision Spectral Pyranometer.http://www.eppleylab.com/PrdPrecSpectralPyrmtr.htm. 5
[21] YES. TSI-880 Automatic Total Sky Imager Manual. Yankee Envi-ronmental Systems, Inc., Airport Industrial Park 101 Industrial Blvd.Turners Falls, MA 01376 USA, 2011. 2, 3, 5, 8