SDG indicators and analysis · SDG indicators and analysis: From systemic perspective Dr. Xin Zhou...
26
SDG indicators and analysis: From systemic perspective Dr. Xin Zhou Leader of Green Economy Area Mustafa Moinuddin Senior Policy Researcher, Green Economy Area Japan-IIASA Workshop “The Atmospheric Pollution, Climate Change Nexus in Asia: Implications for a New Development Agenda”, 23 February 2016, Hayama, IGES Draft and please do not quote.
Transcript of SDG indicators and analysis · SDG indicators and analysis: From systemic perspective Dr. Xin Zhou...
SDG indicators and analysis:
From systemic perspective
Dr. Xin ZhouLeader of Green Economy AreaMustafa MoinuddinSenior Policy Researcher, Green Economy Area
Japan-IIASA Workshop “The Atmospheric Pollution, Climate Change Nexus in Asia: Implications for a New Development Agenda”, 23 February 2016, Hayama, IGES
Draft and please do not quote.

22
BackgroundSDG indicators and data collectionFramework of SDG indicatorsImplications for national SDGs implementation, monitoring and reporting
Outline

33
Sustainable Development Solutions Network (SDSN) Proposed 100 indicators on 12 June 2015 that were developed
through 18 months of consultations with contributions from nearly 500 organizations and thousands of individuals.
Inter‐Agency and Expert Group on SDG Indicators (IAEG‐SDGs) In March 2015, the UN Statistical Commission (46th session)
created the IAEG‐SDGs composed of Member States and regional and international agencies as observers.
Provided a proposal of 229 indicators (149 “green” and 80 “grey”) on 17 Dec. 2015 for consideration by the Statistical Commission at its 47th session in March 2016.
Background: Indicators development

44
IGES‐funded project (June 2015 – March 2016) on SDG indicators for integrating and implementing SDGs in Asia
10 countries: Bangladesh, China, Cambodia, India, Indonesia, Japan, Korea, Philippines, Vietnam and Mongolia
Data collection and database construction Framework of indicators from systemic perspective Special topics: Water‐energy‐food nexus, sustainable
cities and ecological footprints. Web tool: Data visualization and simulation
Background: IGES project on SDG indicators
55
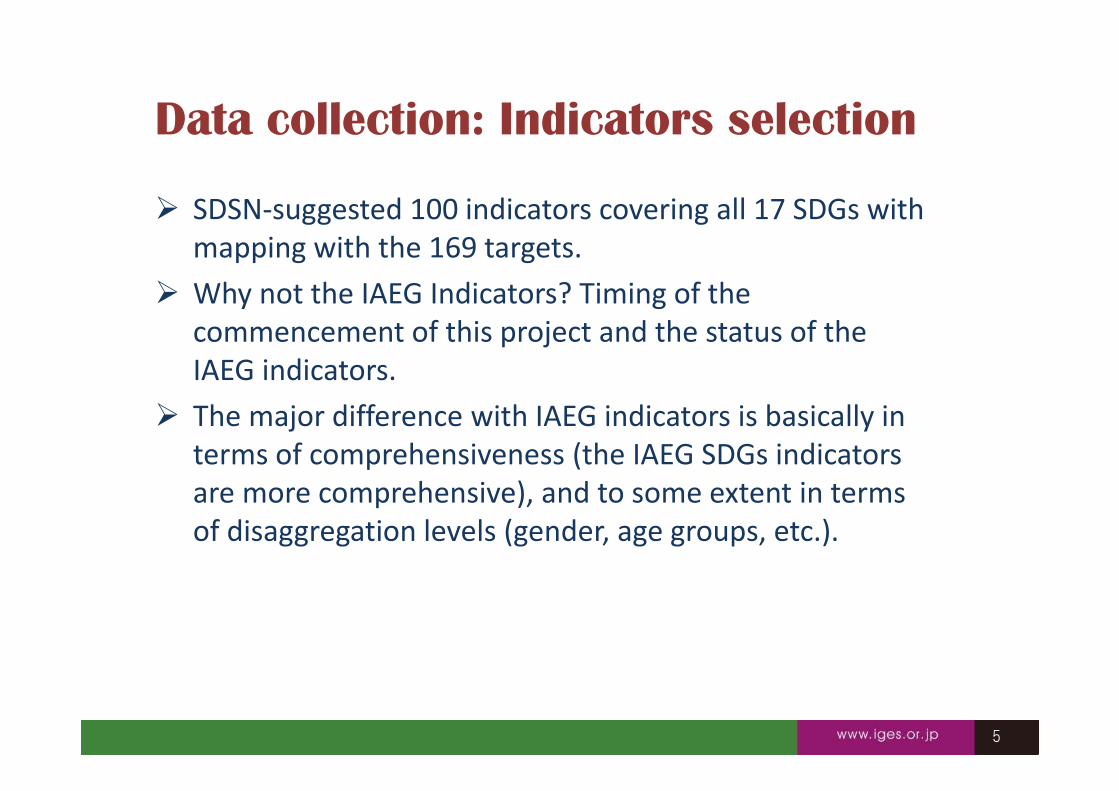
SDSN‐suggested 100 indicators covering all 17 SDGs with mapping with the 169 targets.
Why not the IAEG Indicators? Timing of the commencement of this project and the status of the IAEG indicators.
The major difference with IAEG indicators is basically in terms of comprehensiveness (the IAEG SDGs indicators are more comprehensive), and to some extent in terms of disaggregation levels (gender, age groups, etc.).
Data collection: Indicators selection

66
SDSN indicators and data availability: Category A: Readily available (36 indicators) Category B: Not directly available (19 indicators) Category C and TBD: Newly developed indicators or indicators
not yet developed (45 indicators)
• Collected time series (2001 to 2014) data for 74 SDSN indicators of which 50 are proxy indicators: E.g. For “Percentage of women aged 20‐24 who were married or
in a union before age 18”, we use “Women aged 20‐24 years married before age 18 (% of women in the age group)” as proxy
10 countries: Bangladesh, China, Cambodia, India, Indonesia, Japan, Korea, Philippines, Vietnam and Mongolia
Data collection: Status and challenges

77
Data collection: database and analysis

88
UN documents and existing scientific literature, etc.While the SDGs are addressed as 17 separate elements, “it is clear from systems science that goal areas overlap, that many targets might contribute to several goals and that some goals may conflict.” – ICSU & ISSC scientific review
Dependence of targets on otherse.g. Progress on ending poverty (SDG1) cannot be achieved without progress on the food security (SDG2), full and productive employment and decent work (SDG8), the reduction of inequality (SDG10), and enhancing resilience to climate change (SDG13)
Important trade‐offs between targetse.g. an increase in agricultural land‐use to help end hunger (SDG2) can result in biodiversity loss (SDG15), and in overuse and/or pollution of water resources (SDG6) and downstream (likely negative) effect on marine resources (SDG14), which in turn could exacerbate food security concerns.
Framework of SDG indicators: Scientific background
Need to incorporate a systems perspective to know how targets interact in a network and how they contribute to holistic sustainability

99
SDGs should be limited in number, concise and easily communicable
Important to maintain the 17 SDGs because specific ministries will act upon specific targets and goals
Trade‐off between communicability to the public and steering capacity within bureaucracies.
Framework of SDG indicators: Scientific background
Highly important to develop an integrated framework of targets and indicators to limit the number of targets however achieve the wider spectrum of 17 SDGs in an efficient and effective way.

1010
How the 169 targets and associated indicators are interlinked? What is the structure of their linkages? Do some particular targets/indicators play critical roles (such as
a node in the network) which have more or different ways of connections than other targets?
How to identify the critical targets therefore by addressing which as the priority areas may be efficient (in terms of using limited available resources) but sufficiently effective to achieve the sustainability from systems perspective?
Research questions
Use the technique of Social Network Analysis based on a dataset of SDG indicators

1111
Methodology
Mapping the binary linkages 100 indicators of SDSN Linkages (0,1) based on SDSN,
IAEG, ICSU/ISSC proposals, etc. Own assessment
Quantify the inter‐linkages Linear relations of each pair if the
binary linkages is 1 Quantified 74 by 74 indicator
matrix
Social Network Analysis One network of indicators for each country Identify key indicators based on various
measurements of centrality For each indicator, assess its
synergies/tradeoffs with other indicators
Data collection and analysis 100 indicators of SDSN 10 countries‐10 year time
series‐74 indicators Linear relations analysis

1212
SNA, often used in social and behavioural science, is the analysis of the structure/pattern and structural properties of a social network.
A social network, is made up of social actors (nodes) and their relations (edges).
Social Network Analysis
Alice
Bob
Carol Ted
(a) (b) (c)

1313
Use graph theory for identifying the “most important” actors which placed in strategic locations in the network.
Centrality: Central actors are those extensively involved in relationships with other actors which makes them more visible in the network.
Various measurements of centrality:‐ Degree centrality: Measuring the total ties with others;‐ Closeness centrality: Measuring how close (distance)
to all other actors;‐ Betweeness centrality: Measuring the importance in
connecting nonadjacent actors (groups of actors).
Social Network analysis

1414
Social Network analysis of 100 SDSN indicators
Mapping the binary linkages (0/1)of 100 indicators: SDSN indicatorsVisualising 100‐indicator network in graphIdentification of key indicators measured by various centrality metrics

1515
Key indicators measured by centrality Indicator Outdegree
50 4851 483 4645 4646 4647 3788 336 315 3049 3057 2912 2910 2992 2959 2777 2625 2568 2458 2478 23
Indicator Betweeness
3 0.08772 0.04650 0.03051 0.03057 0.03012 0.0286 0.02168 0.021100 0.02047 0.01870 0.01859 0.01610 0.01645 0.01546 0.01598 0.01579 0.0145 0.01388 0.01355 0.013
Indicator Closeness
50 0.66451 0.66468 0.6603 0.65612 0.63945 0.63946 0.63970 0.63125 0.63110 0.62369 0.62324 0.61966 0.6158 0.6079 0.60711 0.60723 0.60727 0.60757 0.60467 0.600

1616
9 Key indicators and their definitions
No. Indicators Goals
3 Multidimensional Poverty Index Goal 1. End poverty in all its forms everywhere
10 Prevalence of stunting and wasting in children under 5 years of age
Goal 2. End hunger, achieve food security and improved nutrition, and promote sustainable agriculture
12 Percentage of women, 15‐49 years of age, who consume at least 5 out of 10 defined food groups
Goal 2. End hunger, achieve food security and improved nutrition, and promote sustainable agriculture
45 Percentage of population using safely managed water services, by urban/rural (modified MDG Indicator)
Goal 6. Ensure availability and sustainable management of water and sanitation for all
46 Percentage of population using safely managed sanitation services, by urban/rural (modified MDG Indicator)
Goal 6. Ensure availability and sustainable management of water and sanitation for all
50 Share of the population using modern cooking solutions, by urban/rural
Goal 7. Ensure access to affordable, reliable, sustainable, and modern energy for all
51 Share of the population using reliable electricity, by urban/rural
Goal 7. Ensure access to affordable, reliable, sustainable, and modern energy for all
57 Ratification and implementation of fundamental ILO laborstandards and compliance in law and practice
Goal 8. Promote sustained, inclusive and sustainable economic growth, full and productive employment and decent work for all
68 [Ratio of land consumption rate to population growth rate, at comparable scale]– to be developed
Goal 11. Make cities and human settlements inclusive, safe, resilient and sustainable
1717
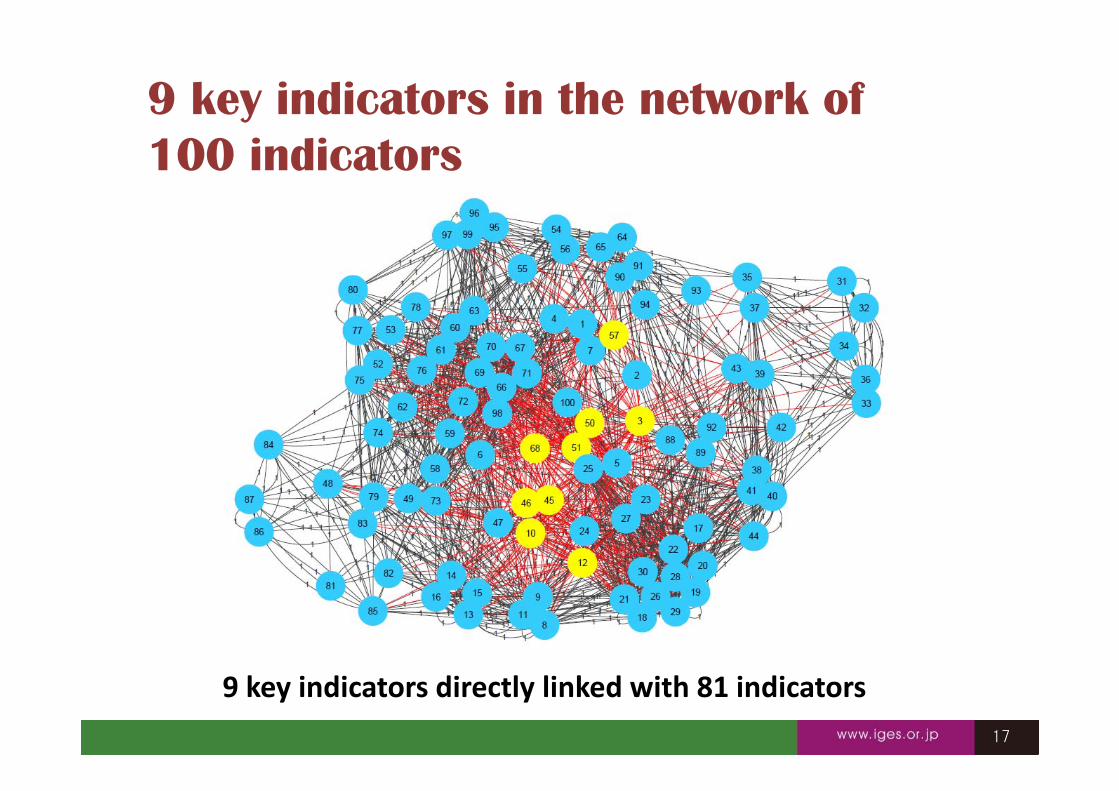
9 key indicators in the network of 100 indicators
9 key indicators directly linked with 81 indicators
1818
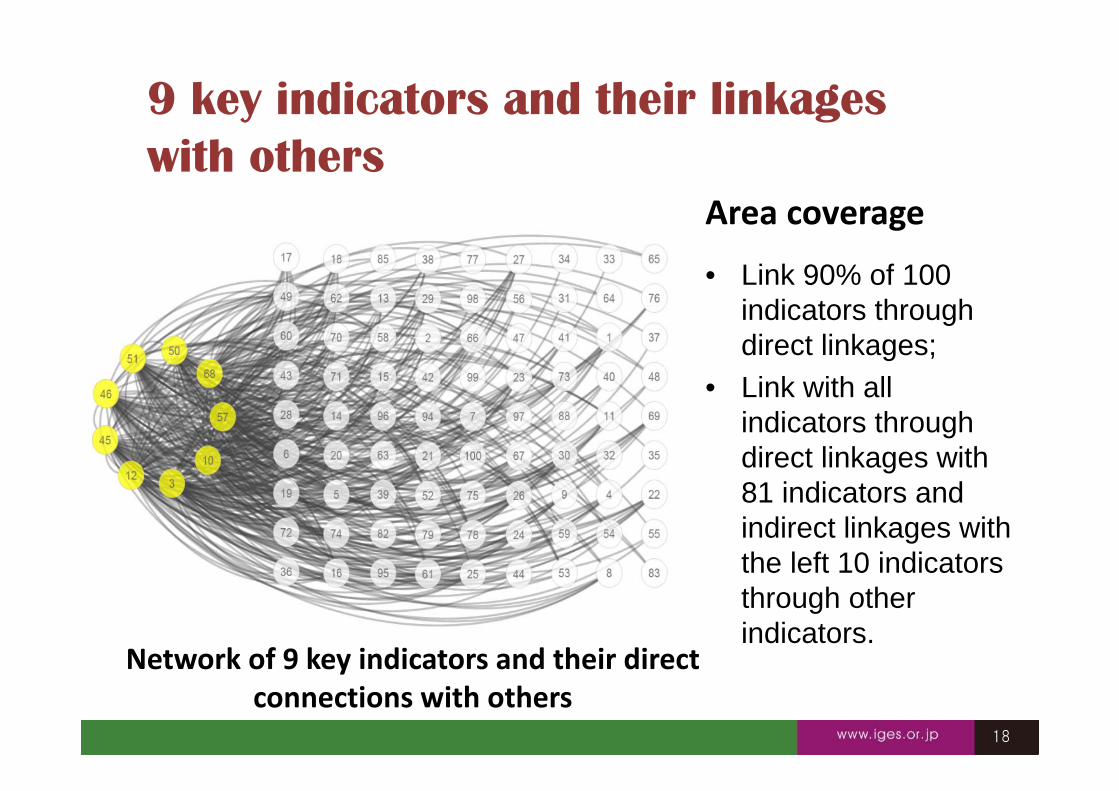
9 key indicators and their linkages with others
Network of 9 key indicators and their direct connections with others
Area coverage
• Link 90% of 100 indicators through direct linkages;
• Link with all indicators through direct linkages with 81 indicators and indirect linkages with the left 10 indicators through other indicators.

1919
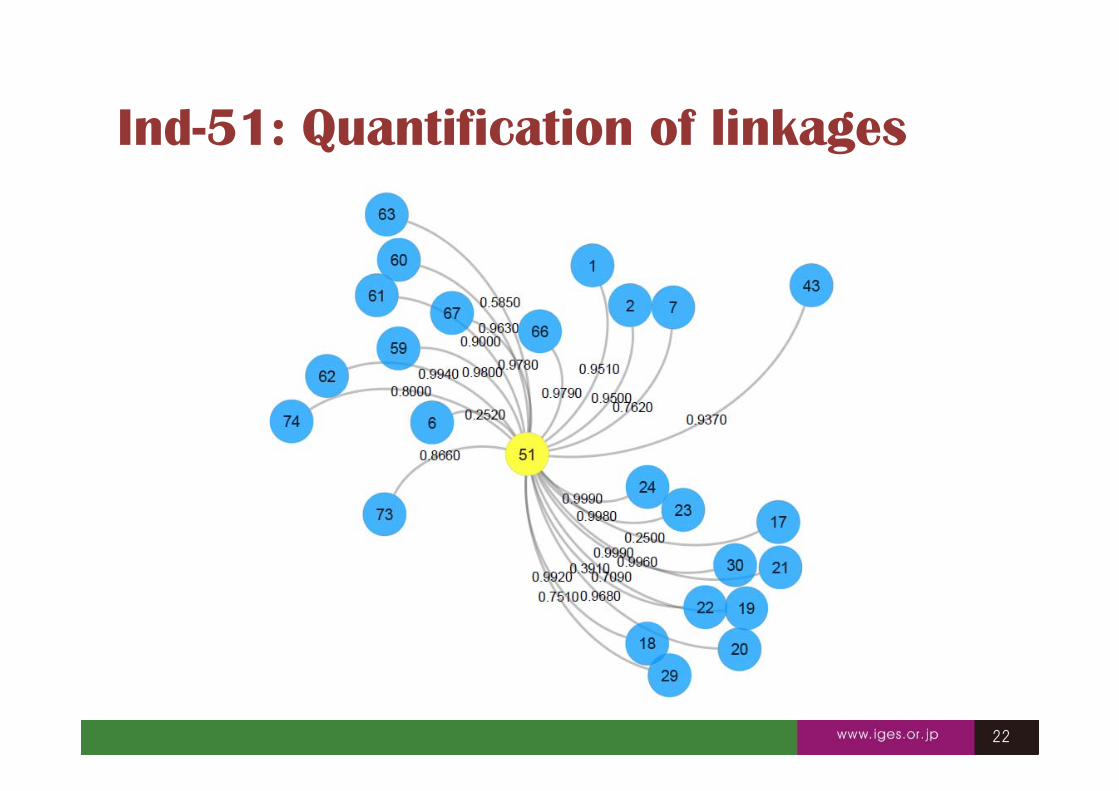
An example: Ind-51 and its linkages (Indonesia)
Indicator 51 and its direct linkages with other 24 indicators arranged by 6 SDGs
No. Indicators Goals
51 Share of the population using reliable electricity, by urban/rural
Goal 7. Ensure access to affordable, reliable, sustainable, and modern energy for all
G3
G1
G5G9
G11
G12

2020
Dataset for Ind-51 and selected linked indicators
Ind‐51 Ind‐1 Ind‐19 Ind‐60 Ind‐73Data source WB/SE4All WB WHO/UNICEF ITU FAOSTAT2001 88.2 32.3 76.0 3.1 27.52002 88.9 29.4 72.0 5.4 28.22003 89.5 26.5 74.0 8.5 28.32004 90.2 23.9 76.0 13.7 28.12005 90.8 21.6 77.0 20.9 28.12006 91.5 21.9 79.0 28.0 28.02007 92.2 22.3 76.0 40.4 27.62008 92.8 22.7 76.0 60.0 26.62009 93.5 20.2 74.0 68.9 24.32010 94.2 18.0 78.0 87.8 21.52011 95.1 16.2 80.0 102.5 18.52012 96.0 14.4 85.0 114.2 16.22013 96.9 12.7 84.0 125.4 14.72014 97.8 11.3 13.9
Ind‐1 (SDG1): Proportion of population below $1.25 (PPP) per day (MDG Indicator).Ind‐19 (SDG3): Percent of children receiving full immunization (as recommended by national vaccination schedules). Ind‐60 (SDG9): Mobile‐cellular telephone subscriptions per 100 inhabitants. Ind‐73 (SDG12): Prevalence of food inadequacy (%).

2121
Correlation analysis: Ind-51 and selected linked indicators
05101520253035
86 88 90 92 94 96 98 100
Ind‐1
Ind‐51
Access to electricity and poverty (population below $1.25 PPP)
70
74
78
82
86
90
86 88 90 92 94 96 98 100
Ind‐19
Ind‐51
Access to electricity and immunization rate
0
30
60
90
120
150
86 88 90 92 94 96 98 100
Ind‐60
Ind‐51
Access to electricity and mobile cellular subscriptoins
05101520253035
86 88 90 92 94 96 98 100
Ind‐73
Ind‐51
Access to electricity and prevalence of food inadquacy
2222
Ind-51: Quantification of linkages
2323
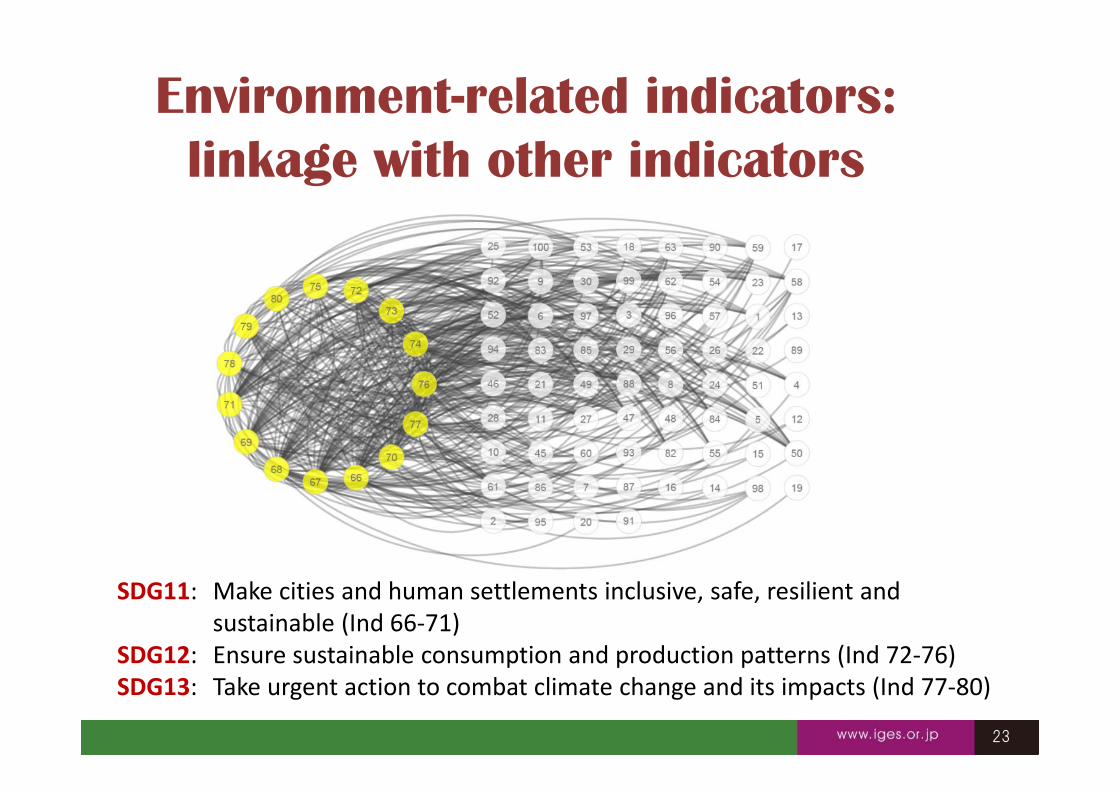
Environment-related indicators: linkage with other indicators
SDG11: Make cities and human settlements inclusive, safe, resilient and sustainable (Ind 66‐71)
SDG12: Ensure sustainable consumption and production patterns (Ind 72‐76)SDG13: Take urgent action to combat climate change and its impacts (Ind 77‐80)

2424
Limited number of indicators can well present the 17 SDGs andtargets through network linkage and easily communicate withthe wide audience from reporting viewpoint.
For developing countries, when monitoring is limited in termsof capacity and resources, etc., selection of key indicators fromsystemic perspective can be helpful and effective.
Key nodes in the network of SDGs and targets can help identifypriority areas for implementation through efficient use oflimited resources and effectively delivery holistic sustainabilityby amplifying the synergies and minimizing the trade offs.
Implications for national implementation, monitoring and reporting

2525
Visualization tool: Under construction

Thank you!