Sculpting Tomorrow’s Miami · Miami luxury real estate market through the ISG Miami Report and...
47
AN IN-DEPTH ANALYSIS OF SOUTH FLORIDA’S NEW CONDOMINIUM MARKET Featured Story New Construction MLS Inventory Rental Trends International Market Arts & Culture ISG CityWatch Miami 2020 On the Ground Sculpting Tomorrow’s Miami The Key Factors Defining Miami’s Future AN IN-DEPTH ANALYSIS OF SOUTH FLORIDA’S NEW CONDOMINIUM MARKET TM FALL 2015
Transcript of Sculpting Tomorrow’s Miami · Miami luxury real estate market through the ISG Miami Report and...

AN IN-DEPTH ANALYSIS OF SOUTH FLORIDA’S NEW CONDOMINIUM MARKET
Featured Story
New Construction
MLS Inventory
Rental Trends
International Market
Arts & Culture
ISG CityWatch
Miami 2020
On the Ground
Sculpting Tomorrow’s MiamiThe Key Factors Defining Miami’s Future
AN IN-DEPTH ANALYSIS OF SOUTH FLORIDA’S NEW CONDOMINIUM MARKET
TM
FALL 2015
Cover Credit:
Principals | Craig Studnicky & Philip Spiegelman
President | Michael AmbrosioVice President | Sergio Pintos
EDITORIALChief Marketing Officer | Veronica EscobedoCommunications Director | Kattie MaldonadoMarketing Coordinator | Melissa Tello
RESEARCHDirector of Market Research | Athena RossanoMarket Research Coordinator | Daniella Aragon DESIGN Creative Director | Edward TrellesGraphic Designer | Anthony Anchante
ISG TEAM CONTRIBUTORSLiliana Gomez, Alex Vidal, Andres Valdivieso, Raquel Kaufman, Amanda Manteiga, Patricia Restrepo, Marly Jaramillo, Andres Penalver, Rowena Luna
COVER ART“City Wheel” Artist: James McNabbwww.mcnabbstudio.comPhotography: Aurelie Laurent, Petit Jules
WELCOME TO THE MIAMI REPORT
CRAIG STUDNICKY ISG Principal
PHILIP SPIEGELMANISG Principal
Welcome to our latest edition of The Miami ReportTM. The ISG WORLD® family is proud to present our most recent update on the current market conditions of our emerging Global City.
Miami is a global gateway and rising star on the world stage. Our city combines a diverse, yet complementary mix of cultures to construct a magical environment of limitless potential.
Throughout the past six years we have chronicled the state of the Miami luxury real estate market through the ISG Miami Report and clarified the many myths, and often misleading facts, questioning Miami’s stability and growth. Over time, our study evolved from a purely statistical analysis into an explanation of the various factors contributing to the growth and maturation of our South Florida region.
While continuing to provide the most comprehensive statistics regarding new construction, resale inventory, rental trends and emerg-ing sub-markets, we also include the cultural and business
trends that serve to solidify Miami’s position as one of the world’s most important cities. In this edition, we go a step further and take an in-depth look into how these cultural livability factors are especially attractive to ultra high- net-worth individuals.
Miami, like all major cities in our global economy, is not immune to world events and cycles. The economic softening in Brazil, Russia, India, China and South Africa (BRICS) and political instability in South America serve to influence the purchasing dynamics within our South Florida market. Currently, the surge in value of the dollar has caused a softening of new condominium absorption in our area. History, however, has proven that once the new currency dynamic is accepted as the norm, the lure of Miami’s stable investment environmentand asset protection will once again fuel foreign investment in our market.
We are also cognizant of the emerg-ing interest of the Chinese market in our city. While not new to Florida, the affluent Chinese are discovering
our city and recognizing the “livability benefits” Miami has to offer. We will continue to monitor this interest and both report and participate in its evolution. We believe this trend, coupled with the Panama Canal expansion, which will bring large Panamax ships to our front door, will increase Asian commerce, trade, investment and employment throughout our region.
Additionally, technological advancements, international finance and entrepreneurial endeavors will provide substantial opportunities for job growth in Miami. The introduction of innovative ideas combined with a well-educated labor force will generate a flow of capital investments to our magical city.We at ISG look forward to witness this exciting time.
We hope you find our ISG World Miami Report 2015 useful and informative.
Thank you for your continued interest.
Craig Studnicky ISG Principal
Philip SpiegelmanISG Principal
Micheal AmbrosioISG President
Sincerely,

4FEATURED STORY
8WEALTH REPORT
10MIAMI’S SKYSCRAPERS
12NEW CONSTRUCTION
16DEVELOPMENT CYCLE
26MLS RESALE INVENTORY
32RENTAL TRENDS
40POPULATION STATISTICS
42INTERNATIONAL MARKET
46TRANSPORTATION
56CULTURAL & ECONOMIC GROWTH
66LANDSCAPE OF THE FUTURE
70ISG CITY WATCH
74SOUTH FLORIDA 2020
88ON THE GROUND

FEATURED STORY
In 2015, Miami moved up in rank to #6 for the world’s most important cities to ultra high-net worth individuals. The Wealth Report, which is issued annually by London-based real estate consultancy Knight Frank, also predicts that Miami will remain in the top 10 for at least the next decade.
Sources: Miami Herald Knight Frank Global Cities Report The Real Deal
“ Miami continues to move up in rankings because ultra high- net-worth individuals want to live there.”
Source: Knight Frank
FACTORS THAT MOVED MIAMI UP IN RANKS?
ECONOMIC ACTIVITYMiami is poised for a prosperous future economic output and increased market activity. The city is known as the “Gateway to the Americas” and is home to a number of Fortune 500 companies and international businesses.
ECONOMICACTIVITY
QUALITY OFLIFE
KNOWLEDGE& INFLUENCE
POLITICALPOWER
QUALITY OF LIFEThe city has an array of cultural and leisure options, as well as its famous climate and beaches. Miami has some of the highest air quality in the nation and consistently promotes pedestrian friendly and green initiatives. Additionally, the region provides high personal security, sound political freedom and stability.
KNOWLEDGE & INFLUENCEMiami has a growing centrality of knowledgeable workers. New education and tech programs have emerged to facilitate a growing tech and start-up scene in the area.
POLITICAL POWERMiami’s international connections and location within the United States, positions it as an influential city of global political thought and opinion. Florida is the 3rd most populated state and is considered a prominent state in decision making during the U.S. presidential elections with its 29 electoral votes.
2014
2015
2013
2011
4 ISG MIAMI REPORT ISG MIAMI REPORT 5
1. London2. New York3. Hong Kong4. Singapore5. Shanghai
6. Miami7. Paris8. Dubai9. Beijing10. Zürich
Top 10 Cities that Matter to UHNWIs - 2015 Global Survey
MIAMI N THE RISE

“A cosmopolitan playground for the world’s wealthy, South Florida is increasingly synonymous with luxury in all its many manifestations: multimillion-dollar real estate, exotic cars, yachts, high-end watches, and designer apparel.”
Miami’s tropical weather attracts foreign buyers to its shores year round.
Miami offers foreign buyers peace of mind. The city provides a safe environment and comfortable lifestyle along with the financialstability of living in the United States.
Miami has higher “good air quality” days than most major cities in the U.S.
Miami is one of four cities in America that offers “playgrounds for adults,” and parks with Fitness Zones, encouraging everyone to spend time with their families outside in an active and green environment.
“ [Florida is the No. 1 state for international real estate sales] There’sastrongflowofforeignmoneyenteringthe American real estate market every day, and especially [through]gatewaycitieslikeMiami.”
- Daily Business Review, July 2015
Top 10 States for InternationalReal Estate Sales
1. Florida2. California3. Texas4. Arizona5. New Jersey
6. New York7. Illinois8. Washington9. Michigan
10. Hawaii
AIR QUALITY
Source: Daily Business Review, National Association of Realtors
WEATHER GREEN SPACELUXURY SHOPPINGFINANCIAL SECURITY
VS.OTHER COUNTRIES
MIAMI’S LIVABILITY FACTORS FOR INTERNATIONAL BUYERS
The quality of life, usually inan urban setting, where the accessibility to needs and services contributes to overall well-being; livable acts.
Livabilitynoun: liv·abil·i·ty
Miami is distinguished by its secure environment, economic prosperity, abundant lifestyle and cultural dynamic. Most importantly, buyers from around the world arrive on themainland with their families confident that Miami will offer them peace of mind.These livability factors continue to drive Miami’s desirability for the ultra- luxury market.
6 ISG MIAMI REPORT ISG MIAMI REPORT 7
Liliana GomezInternational Sales Director
“ Aside from the luxurious lifestyle and remarkable weather,financialsecurityand safety is the No. 1 reason as towhyweseeourinternational clients buying in Miami. City residents enjoy a stable political and economic climate in addition to the vibrant communityandculture.”
Sources: Financial Security – USA Today, May 2015 Source: Miami Herald, January 2015 Sources: Air Quality – OurMiami.org, 2013 Readers Digest
Source: Livability.com, November 2014
QUALITY OFLIFE
248 Sunny days per yearAvg. yearly temp: 77F / 25CAvg. yearly rainfall: 62 inches / 157cm
Sources: U.S. Climate Data BestPlaces.net
#1 Cleanest Air

8 ISG MIAMI REPORT ISG MIAMI REPORT 9
$500 $1,000 $1,500 $2,000 $2,500 $3,000 $3,500 $4,000 $4,500
MIAMISHANGHAI
BEIJING
ZÜRICH
DUBAI
PARIS
NEW YORK
SINGAPORE
HONG KONG
LONDON
AVERAGE PSF ON A $5 MILLION DOLLAR CONDOMINIUM
$1,111 PSF$1,315 PSF
$1,429 PSF
$1,428 PSF
$1,562 PSF
$1,666 PSF
$2,000 PSF
$2,381 PSF
$2,500 PSF
$4,166 PSF
5,000 SQ.FT.
4,500 SQ.FT.
4,000 SQ.FT.
3,500 SQ.FT.
3,000 SQ. FT.
2,500 SQ.FT.
2,000 SQ.FT.
1,500 SQ.FT.
1,000 SQ.FT. LONDON
HONGKONG
SINGAPORE
NEW YORK
PARISDUBAI
BEIJING ZÜRICH
SHANGHAI
MIAMI
TOTAL SQ.FT. $5 MILLION DOLLARS WILL BUY
MIAMI VS KNIGHT FRANK’S TOP 10 GLOBAL CITIES
INVESTMENT – A MILLIONAIRE’S GLOBAL PERSPECTIVE
Sources: Knight Frank Wealth Report Forbes, June 2014, Business Insider, March 2014
WHAT DOES $5 MILLION DOLLARS BUY IN THE LUXURY CONDOMINIUM MARKET OF MIAMI
Miami4,500 SQ.FT.
DOWNTOWN
Shanghai3,800 SQ.FT.
Dubai3,200 SQ.FT.
Singapore2,100 SQ.FT.
Zürich3,500 SQ.FT.
Paris3,000 SQ.FT.
Hong Kong2,000 SQ.FT.
Beijing3,500 SQ.FT.
NewYork2,500 SQ.FT
London1,200 SQ.FT.
Sources: Knight Frank Wealth Report Sotheby’s International Realty - NY LuxuryRealEstate.com
1. London2. New York3. Hong Kong4. Singapore5. Shanghai
6. Miami7. Paris8. Dubai9. Beijing10. Zürich
Top 10 Cities that Matter to UHNWIs - 2015 Global Survey

300 BISCAYNE
2,000 FT
1,500 FT
1,000 FT
900 FT
800 FT
700 FT
600 FT
500 FT
400 FT
300 FT
200 FT
100 FT
FREEDOMTOWER
SUNTRUSTINTERNATIONAL
CENTER
COURTHOUSECENTER
ICON BRICKELLNORTH & SOUTH
TOWER
FOUR SEASONSHOTEL & TOWER
ECHOBRICKELL
1000MUSEUM
PANORAMATOWER
THE WORLD TRADE CENTER OF
THE AMERICAS
SKYRISE MIAMI ONE BRICKELLCITY CENTRE
C O M P L E T E D U N D E R C O N S T R U C T I O N P R O P O S E D
1,049 FT1,000 FT
256 FT
375 FT 405 FT
586 FT
789 FT
637 FT706 FT
822 FT953 FT
1,049 FT
MIAMI REACHING NEW HEIGHTS A historical trend and illustration of Miami’s famed skyscrapers.
BENEFITS OF SKYSCRAPERS FOR A GLOBAL CITY:
• Reduced sprawl and increase in eco-commuting like jogging or cycling
• As buildings rise higher, new technologies emerge to make this possible and cost effective
• Building offices and homes skywards frees up the ground floor for markets and cultural events that improve quality of life
“ Skyscrapers offer a means of delivering large swathes of homes and business space in response to rapid economic and population growth.”
Source: Global Cities Skyscrapers 2015 Report
Source: KnightFrank.com
10 ISG MIAMI REPORT ISG MIAMI REPORT 11
Source: Emporis.com
202020181925 1973 1985 2008 2003 2017 2017 2017 TBD 2019

NEWCONSTRUCTION
12 ISG MIAMI REPORT ISG MIAMI REPORT 13

NEW CONSTRUCTION SUMMARY Total New Construction Condo Units to be built, sold and currently available for sale in Brickell, Biscayne Corridor (Edgewater, Wynwood, Midtown, Design District & Omni)/Downtown Miami, The Beaches (South Beach, Miami Beach, Surfside, Bal Harbour, Sunny Isles, Hallandale, Hollywood Beach) Aventura, North Miami Beach, Coconut Grove & Key Biscayne Since Mid 2011
17,007Total
4,061Unsold
12,946
76% SOLDAS OF JULY 2015
Project units total DeveloPer units solD DeveloPer units unsolD
5 YEAR ANNUAL ABSORPTIONANALYSIS For Condos built from 2010 - 2015Submarkets consist of Brickell, Biscayne Corridor (Edgewater, Midtown, Design District & Omni)/Downtown Miami, The Beaches, (South Beach, Miami Beach, Surfside, Bal Harbour, Sunny Isles, Hallandale & Hollywood Beach), Fort Lauderdale, Aventura, North Miami Beach, Coconut Grove & Key Biscayne.
2,461 PER YEAR
Brickell
Biscayne corridor / downtown MiaMi
the Beaches
north MiaMi Beach,key Biscayne, coconut Grove
aventura
Fort lauderdale
ToTal
611 PER YEAR
750 PER YEAR
105 PER YEAR
160 PER YEAR
210 PER YEAR
625 PER YEAR
Sources: Integrated Realty Information System (Iris); Miami-Dade & Broward County Property Appraiser and Multiple Listing Service (MLS)
average YearlY conDo inventorY absorPtion from 2010-2015
NEW CONSTRUCTION SUMMARY TOTAL NEW CONSTRUCTION CONDOMINIUM DEVELOPMENTS EAST OF 95 AND AVAILABLE FOR SALE SINCE MID 2011 CONSTRUCTION STATUS ANALYSIS
14 ISG MIAMI REPORT ISG MIAMI REPORT 15
Status Total Buildings Total Units Total Sold % Sold Total Unsold
Delivered 21 3,055 2,982 98% 73
Under Construction 49 9,367 7,800 83% 1,567
Pre-Construction 26 4,585 2,164 47% 2,421
Totals 96 17,007 12,946 76% 4,061

NEW CONSTRUCTION INVENTORYCOMPLETION TIMELINE (ACTIVE BUILDINGS) 2012 - 2019 by Submarket
MIAMI’S PRE-CONSTRUCTION DEVELOPMENT CYCLE ISG World® takes a comprehensive look into a high-rise condominium’s development cycle – from inception to completion. Based on previous project cycles, this section outlines the typical 2-3 year process each project must experience before a final product is delivered to the market place.
0 6 months 1 Year 1.5 Years 2 Years 2.5 Years 3 Years 3.5 Years
PRE SALE CONTRACTS TOP OFF COMPLETION
40 Stories More than 40 Stories
GROUND BREAKING
BISCAYNE CORRIDOR
2012
2013
2014
2015
2016
2017
2018
2019
733
675
2,32
6
96 0
488
00
16 ISG MIAMI REPORT ISG MIAMI REPORT 17
Consists of Wynwood, Design District, Edgewater, Midtown & Omni
BRICKELL
2012
2013
2014
2015
2016
2017
2018
2019
948
1,17
01,
074
2,32
1
0 0 0 0
THE BEACHES
2012
2013
2014
2015
2016
2017
2018
2019
794 94
761
3
0
986
00 88
Consists of South Beach, Miami Beach, Surfside, Bal HarbourSunny Isles, Hallandale and Hollywood Beach
NORTH MIAMI / KEY BISCAYNECOCONUT GROVE
2012
2013
2014
2015
2016
2017
2018
2019
234
556
154
0
465
00 0
AVENTURA
2012
2013
2014
2015
2016
2017
2018
2019
142
700
160
00
190
0
FORT LAUDERDALE
2012
2013
2014
2015
2016
2017
2018
2019
529
0 86 00 22 520
DOWNTOWN MIAMI
2012
2013
2014
2015
2016
2017
2018
2019
352
736
0 0 0 00 0
TOTAL UNITS: 5,51385% SOLD
TOTAL UNITS:4,31876% SOLD
TOTAL UNITS:1,08854% SOLD
TOTAL UNITS:3,42874% SOLD
TOTAL UNITS:1,40985% SOLD
TOTAL UNITS:56264% SOLD
TOTAL UNITS:68947% SOLD

1100 Millecento
1010 Brickell
Brickell city centre tower i - reach
Brickell city centre tower ii - rise
Brickell heiGhts east
Brickell heiGhts west
Brickell house
Brickellten
Brickell Flatiron
cassa Brickell
echo Brickell
le Parc
nine at Mary Brickell villaGe
MyBrickell
sls hotel and residences
sls lux
the Bond
5,513 Units total 4,676 Units Sold 837 UnsoldAVG. ABSORPTION: 625 UNITS ANNUALLY OVER THE LAST 5 YEARS
BRICKELL
BISCAYNE CORRIDOR DOWNTOWN MIAMIBiscayneCorridorconsistsofWynwood,DesignDistrict,Edgewater,Midtown&OmniTotal New Construction Condo Units Available for Sale since Mid 2011
develoPer units sold Developer Units UnsolD
382 Total Units100% SOLD
387 Total Units94% SOLD
390 Total Units85% SOLD
358 Total Units95% SOLD
332 Total Units80% SOLD
374 Total Units100% SOLD
548 Total Units40% SOLD
180 Total Units91% SOLD
390 Total Units100% SOLD
192 Total Units100% SOLD
453 Total Units98% SOLD
450 Total Units89% SOLD
323 Total Units95% SOLD
81 Total Units81% SOLD
128 Total Units84% SOLD
155 Total Units95% SOLD
390 Total Units40% SOLD
develoPer units sold Developer Units UnsolD
100% SOLD
399 Total Units99% SOLD
90 Total Units73% SOLD
300 Total Units100% SOLD
368 Total Units100% SOLD
250 wynwood
Baltus house
23 Biscayne Bay
26 edGewater
Bay house
Biscayne Beach
the criMson
elysee
icon on the Bay
Gran Paraiso
one Paraiso
Paraiso Bayviews
Paraiso Bay tower i
hyde Midtown
aria
canvas
centro
1000 MuseuM
krystal towers
ParaMount, MiaMi worldcenter siGnature tower
11 Total Units100% SOLD
165 Total Units98% SOLD
167 Total Units100% SOLD
83 Total Units50% SOLD
647 Total Units43% SOLD
352 Total Units89% SOLD
513 Total Units50% SOLD
276 Total Units100% SOLD
388 Total Units90% SOLD
WYNWOOD
DESIGN DISTRICT
EDGEWATER
MIDTOWN
DOWNTOWN MIAMI
395 Total Units45% SOLD
153 Total Units20% SOLD
86 Total Units84% SOLD
317 Total Units62% SOLD
500 Total Units35% SOLD
Total New Construction Condo Units Available for Sale since Mid 2011
BRICKELL
100 Total UnitsCOMING SOON
*the edGe on Brickell cancelled - reMoved FroM nuMBers
96 Total Units
18 ISG MIAMI REPORT ISG MIAMI REPORT 19
OMNI
Biscayne Corridor: 4,318 Units Total 3,276 Units Sold 1,042 UnsoldDowntown Miami: 1,088 Units Total 586 Units Sold 502 UnsoldAVG. ABSORPTION: 611 UNITS ANNUALLY OVER THE LAST 5 YEARS

239 Total Units65% SOLD
58 Total Units83% SOLD
150 Total Units70% SOLD
BAL HARBOUR
SURFSIDE
47 Total Units100% SOLD
30 Total Units97% SOLD
114 Total Units100% SOLD
321 ocean
Beach house 8
edition residences
Faena house
Glass
l’atelier
louver house
Marea south Beach
one ocean
Palau sunset harBour
Peloro on the Bay
ritz-carlton residences
*1 hotel and hoMes
Fendi chateau
surF cluB Four seasonsPrivate residences
oceana Bal harBour
21 Total Units95% SOLD
8 Total Units100% SOLD
MIAMI BEACH /SOUTH BEACH
10 Total Units100% SOLD
26 Total Units85% SOLD
111 Total Units60% SOLD
159 Total Units81% SOLD
50% SOLD 12 Total Units
45 Total Units100% SOLD
21 Total Units50% SOLD
50 Total Units100% SOLD
*condo residences only
400 sunny isles
residences By arMani casa
chateau Beach
Jade siGnature
the estates at acqualina
Mansions at acqualina
Muse
Parque towers
Porsche desiGn tower
reGalia
ritz carlton residences
turnBerry ocean cluB
Beachwalk
aPoGee Beach
*hyde resort and residences
saGe Beach
oceanBleau
230 Total Units100% SOLD
212 Total Units53% SOLD
308 Total Units58% SOLD
264 Total Units30% SOLD
84 The Total Units100% SOLD
132 Total Units95% SOLD
40 Total Units100% SOLD
49 Total Units100% SOLD
48 Total Units
192 Total Units87% SOLD
68 Total Units65% SOLD
320 Total Units85% SOLD
79 Total Units100% SOLD
39 Total Units92% SOLD
30% SOLD 154 Total Units
24 Total Units85 % SOLD
SUNNY ISLES BEACH
HALLANDALE BEACH
HOLLYWOOD BEACH
84 Total Units100% SOLD
3,428 Units total 2,523 Units Sold 905 UnsoldAVG. ABSORPTION: 750 UNITS ANNUALLY OVER THE LAST 5 YEARS
21 % SOLD
THE BEACHES ConsistsofSouthBeach,MiamiBeach,Surfside,BalHarbour,SunnyIsles,HallandaleandHollywoodBeachCondo Units Available for Sale since Mid 2011
develoPer units sold Developer Units UnsolD develoPer units sold Developer Units UnsolD
*standinG inventory FroM last cycle
the Bath cluB estates canceled - reMoved FroM nuMBers
20 ISG MIAMI REPORT ISG MIAMI REPORT 21

FORT LAUDERDALE Total New Construction Condo Units Available for Sale since Mid 2011
avva
echo aventura
Bellini
Privé
aventura Park square
vida at the Point
190 Total Units90% SOLD
562 Units total 359 Units Sold 203 UnsoldAVG. ABSORPTION: 160 UNITS ANNUALLY OVER THE LAST 5 YEARS
AVENTURA70 Total Units
160 Total Units50% SOLD
131 Total Units38% SOLD
5 Total Units20% SOLD
6 Total Units 17% SOLD
1,409 Units total / 1,198 Units Sold / 211 UnsoldAVG. ABSORPTION: 105 UNITS ANNUALLY OVER THE LAST 5 YEARS
16 Total UnitsCOMING SOON
1800 las olas
adaGio on the Bay
aquaBlu Fort lauderdale
aqualuna las olas
aquaMar las olas
aquavita las olas
auBerGe
Bellavita las olas
*Four season Private residences
*Gale hotel & residences
ParaMount Fort lauderdale
riva
4 Total Units100% SOLD
35 Total Units
FORTLAUDERDALE
22 Total Units100% SOLD
16 Total Units80% SOLD
12 Total Units100% SOLD
20 Total Units45% SOLD
95 Total Units 65% SOLD
100 Total Units55% SOLD
171 Total Units28% SOLD
70 Total Units128 Total Units60% SOLD
43% SOLD
AVENTURA Total New Construction Condo Units Available for Sale since Mid 2011
develoPer units sold Developer Units UnsolD develoPer units sold Developer Units UnsolD
KEY BISCAYNE
NORTH MIAMI BEACH, KEY BISCAYNE& COCONUT GROVE
the harBour
Marina PalMs towers i & ii
oceana
Grove at Grand Bay
one Park Grove
two Park Grove
Park Grove cluB residences
154 Total Units100% SOLD
425 Total Units80% SOLD
87% SOLD
97 Total Units100% SOLD
152 Total Units90% SOLD
40 Total UnitsCOMING SOON
NORTH MIAMIBEACH
COCONUT GROVE
73 Total Units87% SOLD
Total New Construction Condo Units Available for Sale since Mid 2011
468 Total Units
develoPer units sold Developer Units UnsolD
20% SOLD
6 Total Units
22 ISG MIAMI REPORT ISG MIAMI REPORT 23
16 Total Units
81% SOLD
689 Units total / 327 Units Sold / 362 UnsoldAVG. ABSORPTION: 210 UNITS ANNUALLY OVER THE LAST 5 YEARS
*Hotel Units Not IncludedPRIVAGE cancelled - removed from numbers

COCONUT GROVE
EDGEWATER
KEY BISCAYNE
BRICKELL
MIAMI BEACH / SOUTH BEACH
NORTH MIAMI BEACH
SURFSIDE
BAL HARBOUR
SUNNY ISLES BEACH
HALLANDALE BEACH
HOLLYWOOD BEACH
FORT LAUDERDALE
FLO
RID
A’S
TURN
PIKE
595
75
1
95
1
A1A
1
1
A1A
A1A
95
DESIGN DISTRICT
MIDTOWN
DOWNTOWN MIAMI
BISCAYNE CORRIDORWYNWOOD
100% SOLD
75% - 99% SOLD
50% - 74% SOLD
UNDER 50% SOLD
NEW CONSTRUCTION % SOLD SUMMARY BY SUB MARKETS
FORT LAUDERDALE 47% SOLD
HOLLYWOOD BEACH 74% SOLD
AVENTURA 64% SOLD
HALLANDALE BEACH 100% SOLD
SUNNY ISLES BEACH 70% SOLD
BAL HARBOUR 65% SOLD
SURFSIDE 74% SOLD
NORTH MIAMI BEACH 84% SOLD
MIAMI BEACH / SOUTH BEACH 85% SOLD
BISCAYNE CORRIDOR 76% SOLD
DOWNTOWN MIAMI 54% SOLD
BRICKELL 85% SOLD
COCONUT GROVE 82% SOLD
KEY BISCAYNE 100% SOLD
AVENTURA
24 ISG MIAMI REPORT ISG MIAMI REPORT 25
OMNI

MLS-RESALEINVENTORY
26 ISG MIAMI REPORT ISG MIAMI REPORT 27

B r i c k e l l
ACTIVE LISTINGPRICE PSF
200
400
600
800
1,000
1,200
$100
$200
$300
$400
$500
$600
$489
$502$531 $544
1,110
868
659
815
18 Months Ago 12 Months Ago 6 Months Ago Currently Active
200
400
600
800
1,000
1,200
$100
$200
$300
$400
$500
$600
18 Months Ago 12 Months Ago 6 Months Ago Currently Active
$504$515
$562 $571
1,132 876
596
789
Source: Multiple Listing Service
ACTIVE LISTINGPRICE PSF
AVENTURA New Condos built since 2006 & Available for Sale 18 months Ago, 12 Months Ago, 6 Months Ago, and Currently Active
THE BEACHES
100
200
300
400
500
600
$390
$400
$410
$420
$430
$408
$412
$431
$441
392
296
182
240
$1,091
$1,106$1,098
$1,202
1,355
1,045
654812
$1,000
$1,040
$1,080
$1,160
$1,240
$1,320
$1,280
$1,200
$1,120
400
600
800
1,200
1,600
2,000
1,800
1,400
1,000
ACTIVE LISTINGPRICE PSF
ACTIVE LISTINGPRICE PSF
New Condos built since 2006 & Available for Sale 18 months Ago, 12 Months Ago, 6 Months Ago, and Currently Active
BRICKELL
BISCAYNE CORRIDOR DOWNTOWN MIAMIConsist of South Beach/Miami Beach, Surfside, Bal Harbour, Sunny Isles, Hallandale & Hollywood BeachNew Condos built since 2006 & Available for Sale 18 months Ago, 12 Months Ago, 6 Months Ago, and Currently Active
Biscayne Corridor consists of Wynwood, Design District, Edgewater, Midtown & OmniNew Condos built since 2006 & Available for Sale 18 months Ago, 12 Months Ago, 6 Months Ago, and Currently Active
Source: Multiple Listing Service
Source: Multiple Listing Service
Source: Multiple Listing Service
18 Months Ago 12 Months Ago 6 Months Ago Currently Active
18 Months Ago 12 Months Ago 6 Months Ago Currently Active
$440
28 ISG MIAMI REPORT ISG MIAMI REPORT 29

$410
$420
$444 $446
535
426
226 228
$390
$400
$410
$430
$450
$440
$420
100
200
300
500
600
400
BRICKELL
BISCAYNE CORRIDOR / DOWNTOWN MIAMI
AVENTURA
THE BEACHES
GREATER FORT LAUDERDALE
EAST PALM BEACH
41110
38120
4990
4275
51140
45125
B r i c k e l l
ACTIVE LISTINGPRICE PSF
18 Months Ago 12 Months Ago 6 Months Ago Currently Active
100
200
300
400
500
600
$200
$220
$230
$240
$250
18 Months Ago 12 Months Ago 6 Months Ago Currently Active
$206
$212 $216
$243557
425
248 191
Source: Multiple Listing Service
ACTIVE LISTINGPRICE PSF
Consists of Sunrise, Plantation and East Fort LauderdaleNew Condos built since 2006 & Available for Sale 18 months Ago, 12 Months Ago, 6 Months Ago, and Currently Active
GREATER FORT LAUDERDALE
EAST PALM BEACH Consists of Delray Beach, Boynton Beach and West PalmNew Condos built since 2006 & Available for Sale 18 months Ago, 12 Months Ago, 6 Months Ago, and Currently Active
Source: Multiple Listing Service
B r i c k e l l
2013 AVG. DOM2015 AVG. DOM
2013 vs 2015 MLS Analysis for Closed SalesNew Condos built since 2006
DAYS ON THE MARKET (DOM)
Source: Multiple Listing Service
30 ISG MIAMI REPORT ISG MIAMI REPORT 31

RENTALTRENDS
32 ISG MIAMI REPORT ISG MIAMI REPORT 33

JAN 2010 - JULY 2015New Construction Condos Built Since 2006
BRICKELL
Source: Multiple Listing Service
occuPancy vacancy rate
2005
15%
VACANCY RATES HISTORY
9%
2010 $2.30$2.33
$2.42
$2.57
$2.81
$2.98
2010
$2,283
$2,300
$2,462
$2,680
$2,858
$2,200
2011 2012 2013 2014 2015
avG. Price avG. Price PsF
“ We expect Miami home prices to continue to increase in 2015. There is [a] strong demand for both new construction and existing condominiums, so we will continue to see price growth for residential properties in Miami-Dade.”
2015 Residential President of the Miami Association of RealtorsChristopher Zoller
2015
4%
34 ISG MIAMI REPORT ISG MIAMI REPORT 35
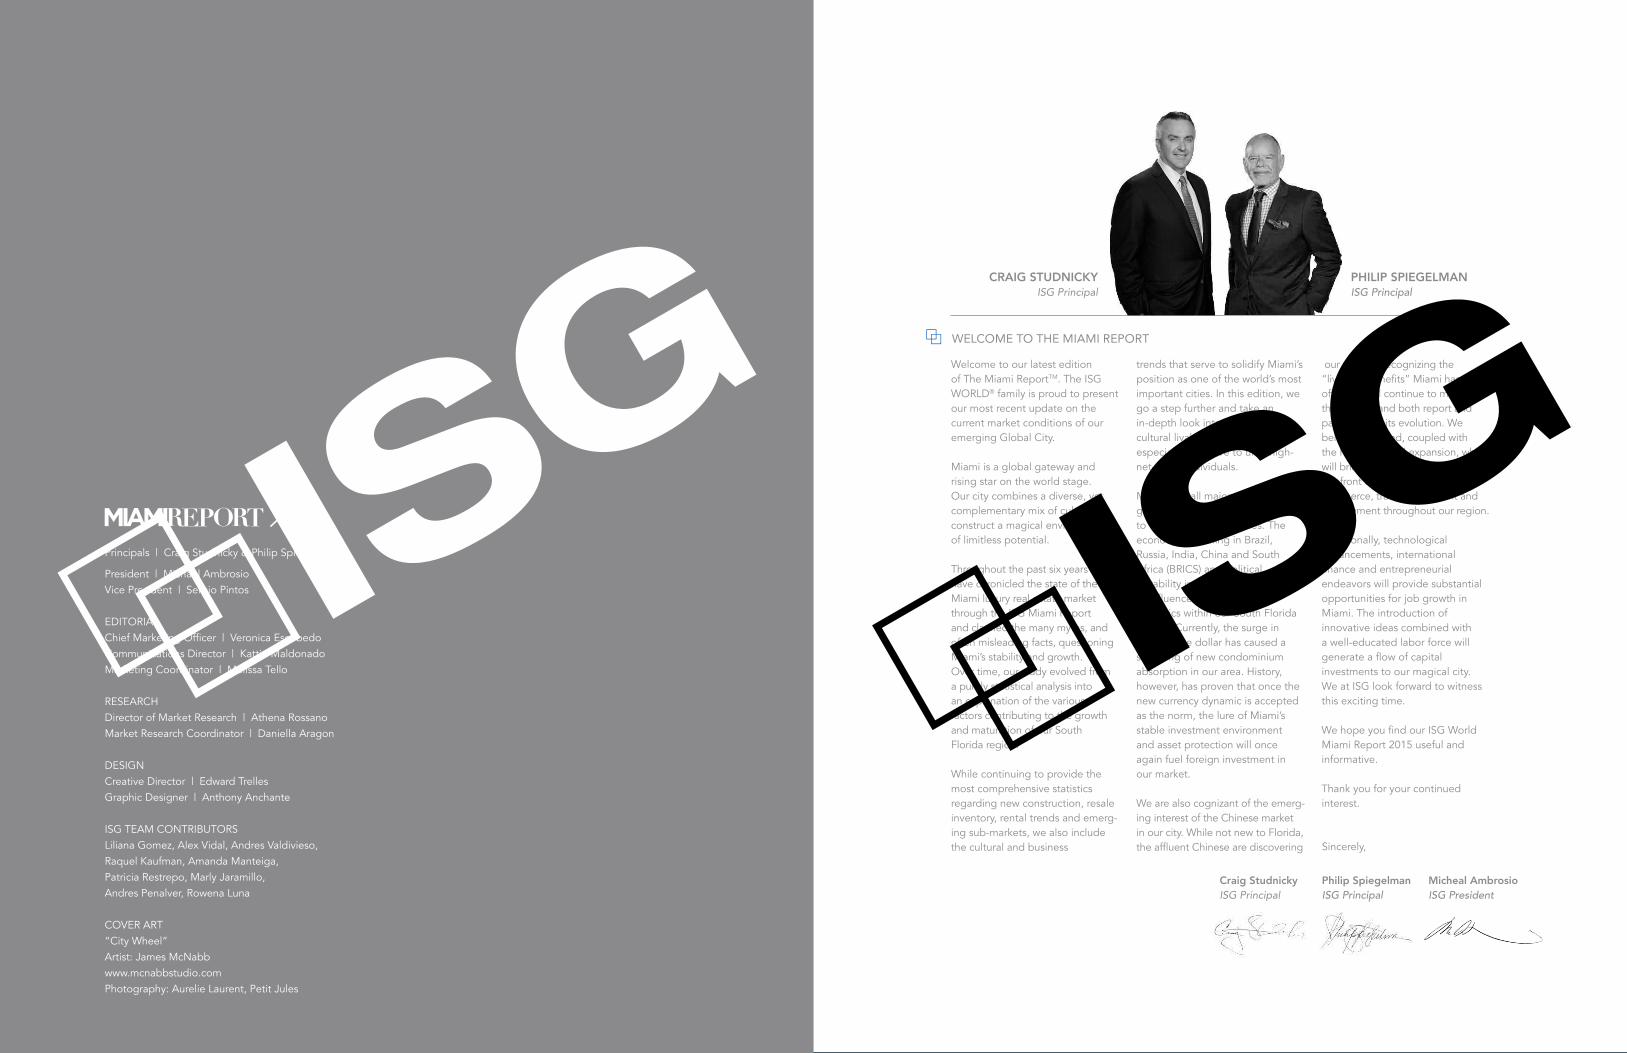
JAN 2010 - JULY 2015BiscayneCorridorconsistsofWynwood,DesignDistrict,Edgewater,Midtown&OmniNew Construction Condos Built Since 2006
BISCAYNE CORRIDOR DOWNTOWN MIAMI
Source: Multiple Listing Service
occuPancy vacancy rate
VACANCY RATES HISTORY
10%
2010
11%
2005 $2.19
$2.28
$2.32
$2.61
$2.74
2010
$2,425
$2,568
$2,687
$2,730
$3,077
$2,211
2011 2012 2013 2014 2015
avG. Price avG. Price PsF
$2.89
JAN 2010 - JULY 2015ConsistsofSouthBeach,MiamiBeach,Surfside,BalHarbour,SunnyIsles,Hallandale&HollywoodBeachNew Construction Condos Built Since 2006
THE BEACHES
Source: Multiple Listing Service
occuPancy vacancy rate
VACANCY RATES HISTORY
3%
2015
$2.49
$2.63
$3.06
$3.26
$3.84
2010
$3,936
$4,425
$4,902
$5,563
$5,894
$3,925
2011 2012 2013 2014 2015
avG. Price avG. Price PsF
$4.24
2015
4%
2010
14%
2005
18%
36 ISG MIAMI REPORT ISG MIAMI REPORT 37

1%
15% 15%
9% 10%
5%
JAN 2010 - JULY 2015New Construction Condos Built Since 2006
AVENTURA
occuPancy vacancy rate
VACANCY RATES HISTORY
2010
2005
$1.40
$1.50
$1.59
$1.69
$1.82
2010
$2,938
$3,056
$3,306
$3,538
$3,925
$2,820
2011 2012 2013 2014 2015
avG. Price avG. Price PsF
$2.03
JAN 2010 - JULY 2015New Construction Condos Built Since 2006
FORT LAUDERDALE
occuPancy vacancy rate
VACANCY RATES HISTORY
2015
$1.53 $1.54
$1.68
$1.82
$1.91
2010
$1,974
$2,226
$2,373
$2,482
$2,657
$1,935
2011 2012 2013 2014 2015
avG. Price avG. Price PsF
$2.01
2015
2010
2005
Source: Multiple Listing ServiceSource: Multiple Listing Service
38 ISG MIAMI REPORT ISG MIAMI REPORT 39

2040*
2020*
2015
2006
1967
1914
400 MIL
336 MIL
321,360,000 MIL
300 MIL
200 MIL
100 MIL
UNITED STATES POPULATION GROWTH
= 10 MIL
2040*
2020*
2015
2006
1967
1914
26 Mil
21.2 Mil
20,297,000 MIL
18 Mil
6.6 Mil
882k
FLORIDA POPULATION GROWTH
= 1 MIL
Florida, once ranked 33rd in U.S. population rankings, has now surpassed New York as the 3rd most
populated state. In August of 2015, the United States Census Bureau also released numbers on
“Metro Area-to-Metro Area Migration Flows.” Between 2009 and 2013, 22,000 New Yorkers
relocated to Miami, the second largest migration flow between America’s largest metro areas.
POPULATION
40 ISG MIAMI REPORT ISG MIAMI REPORT 41
POLITICALPOWER
STATE POPULATION GROWTH
1914
1. new york 5. texas
12. caliFornia
33. Florida
1967
1. new york 2. caliFornia
6. texas
15. Florida
2006
1. caliFornia
2. texas
3. new york
4. Florida
2020*
1. caliFornia
2. texas
3. Florida
4. new york
2040*
1. caliFornia
2. texas
3. Florida
4. new york
2015*
1. caliFornia
2. texas
3. Florida
4. new yorkFlorida’s population numbers have resulted in the appointment of 27 members in the United States House of Representatives and 29 electoral votes for the state; a strongly influential combination during Presidential elections. Florida’s growing population leads to an increasing precedence in the nation’s politics.
United Van Lines, a national moving company also produced the United Van Lines’ 38th Annual National Movers Study, which tracked customers’ migration patterns state-to-state in 2014. Florida was No. 5 of the Top Ten “Inbound States” (55 percent or more of moves within the United States were made to Florida).
UNITED VAN LINES 2014 NATIONAL MOVERS STUDY
OR
NV
ID
CO
OK
TX
VT
NCSC
#5 FLORIDA
DC
UNITED STATES HOUSE OF REPRESENTATIVES
FLORIDA
27FLORIDA
MEMBERS OF THE HOUSE OF REPRESENTATIVES
HIGH INBOUNDHIGH OUTBOUNDBALANCED
CURRENT RANK
1. California 53 Members
2. Texas 36 Members
3. Florida 27 Members
4. New York 27 Members
5. Illinois 18 Members
6. Pennsylvania 18 Members
Source: U.S. Census Bureau
Sources: Govtrack.us, USinfo.about.com
Source: United Van Lines 2014 National Movers Study
Source: U.S. Census Bureau

INTERNATIONALMARKETREPORT
42 ISG MIAMI REPORT ISG MIAMI REPORT 43

PANAMA
EL SALVADOR
GUATEMALA
HONDURAS
NICARAGUA
BELIZE
COSTA RICA
GLOBAL BUYER PROFILE
34%
3%
15%
9%
11%
28%
NORTH AMERICA
SOUTH AMERICA
16%5%
16%
15%
2%
9%
13%
15%
5%
4%
CENTRAL AMERICA
EUROPE & ASIA
Source: ISG - Data as of Dec. 2014
Source: ISG - Data as of Dec. 2014
Source: ISG - Data as of Dec. 2014
Source: ISG - Data as of Dec. 2014
44 ISG MIAMI REPORT ISG MIAMI REPORT 45
FLORIDA
MEXICO
NEW YORK
CANADA
NEW JERSEY
TEXAS
TENNESSEE
MASSACHUSETTS
OHIO
6%
15%
1%
45%
5% 1%1%3%
23%
BRAZIL
VENEZUELA
ARGENTINA
COLOMBIA
PERU
BOLIVIA
RUSSIA
FRANCE
CHINA
ITALY
ASIA
SPAIN
JAPAN
GERMANY
INDONESIA
FINLAND
19%
46%
12%
8%
6%
5%4%

TRANSPORTATION
46 ISG MIAMI REPORT ISG MIAMI REPORT 47

MIAMI’S COMPETITIVE ADVANTAGETHE PANAMA CANAL EXPANSION As of the end of July 2015, the Panama Canal stood at 91.3% complete
100%
Source: PanCanal.com
“PortMiamiwillbetheclosestU.S.porttothePanamaCanalthat’sreadytoaccommodate themegasizecargovesselsthatrequirea-50/52footdepthwhenatfullcapacity. PortMiamiisalreadyknownworldwideastheGatewayoftheAmericas.Oncethedredge iscomplete,PortMiamiwillbewell-positionedtocapturenewtradeopportunities, especiallywithever-growingAsianmarkets.”
- Miami-Dade County Mayor Carlos A. Gimenez
PortMiami will be the only major global logistics hub south of Virginia capable of handling larger vessels after the Panama Canal opens in 2016.
The Port of Miami also known as the “cruise capital” and the “Gateway to the Americas” is the closest port to the Panama Canal. Miami just deepened its channel, an investment that is estimated to create 30,000 new jobs and increase PortMiami’s annual economic impact to more than $34 billion.
U.S. ports are busy deepening harbors and building larger terminalsto allow for larger ships that will pass through the Panama Canalbeginning April 2016.
UNITED STATES PORTSPREPARE FOR PANAMA CANALEXPANSION 1. PORT OF MIAMI
2. PORT OF NEW YORK AND NEW JERSEY
3. PORT OF LONG BEACH
4. PORT OF SEATTLE/TACOMA
APPROXIMATELY
$27 BILLIONOF ECONOMIC IMPACT INMIAMI-DADE COUNTY- Miami-Dade County Mayor Carlos A. Gimenez
48 ISG MIAMI REPORT ISG MIAMI REPORT 49
ECONOMICACTIVITY
Source: USA Today

100 AIRLINES NOW FLY THROUGH MIAMORE THAN ANY OTHER U.S. AIRPORT
“Moreimportantthantherecordsisthefactthatthis[upwardtrend inbothpassengerandcargotraffic]translatestonewjobsand economicgrowthinourcommunity,aswellasnewconnections that further strengthen Miami’s position as one of the nation’s topglobalgateways.”
- Miami-Dade Aviation Director Emilio T. González
MIAMI - SKY’S THE LIMIT
Source: Miami Dade Airport | Miami-Airport.com
WashingtonDulles(IAD)
Newark(EWR)
DallasFort Worth
(DFW)
HartsfieldAtlanta
(ATL)
Chicago(ORB)
Houston(IAU)
San Francisco(SFO)
Los Angeles(LAX)
Miami(MIA)
New York(JFK)
2524
16
100
83
75
434239
30
TOTAL AIRLINES WHICH OPERATEOUT OF THE BUSIEST AIRPORTS INTHE UNITED STATES
ECONOMIC IMPACT
MIA continues to be the leading economic engine for Miami-Dade County and the state of Florida. The airport’s most recent economic impact study shows that MIA has an annual financial impact of $33.5 Billion on local tourism, cruise operations, international banking, trade and commerce. MIA and aviation-related industries contribute 278,081 jobs directly and indirectly to Miami-Dade County, equating to one out of every four jobs.
HOW DOES MIAMI MEASURE UP? MIA$33.5 BIL
Disney World - $18.2 BIL
Florida Cruise Industry - $12.9 BILFt. Lauderdale Int’l Airport - $10.6 BILUniversity of Florida - $8.7 BIL
$40 BIL
$30 BIL
$20 BIL
$10 BIL
Source: 2014 Annual Report Miami-Dade Aviation Department
1. New York (JFK)
2. Miami (MIA)
3. Los Angeles (LAX)
4. Newark (EWR)
5. Hartsfield Atlanta (ATL)
6. Chicago O’Hare (ORD)
7. San Francisco (SFO)
8. Houston (IAH)
9. Washington Dulles (IAD)
10. Dallas Fort Worth (DFW)
#2 U.S. AIRPORTS - INTERNATIONAL PASSENGERS
1. Miami (MIA)
2. Los Angeles (LAX)
3. New York (JFK)
4. Chicago O’Hare (ORD)
5. Louisville / UPS (SDF)
6. Hartsfield Atlanta (ATL)
7. Dallas Fort Worth (DFW)
8. Memphis / FedEx (MEM)
9. Newark (EWR)
10. San Francisco (SFO)
#1U.S. AIRPORTS - INTERNATIONAL FREIGHT
50 ISG MIAMI REPORT ISG MIAMI REPORT 51
ECONOMICACTIVITY

ANNUAL INTERNATIONAL PASSENGER GROWTH
2011 2012 2013 2014
30%
25%
20%
15%
10%
5%
0%
Source: CAPA - Centre for Aviation
FORT LAUDERDALE AIRPORT With Fort Lauderdale’s current international and domestic passenger growth, came a $2.3 billion proposal to provide faster check-in times, decrease delays, and provide additional restaurant and retail options. This proposal, known as The FLL Airports Improvements and Renovations Program, will modernize terminals, add gates for international and domestic destinations and make way for additional commercial tenants in efforts to enhance the passenger experience.
Source: CAPA - Centre for Aviation
$2.3BIL IN RENOVATIONS
South Runaway Expansion $791MIL Complete
Terminal 4 Redevelopmentand Expansion $450MIL West 2015 / East 2017
Terminal Concourse A $150MIL Early 2017
Terminal Renovation Program $300 Early 2017 for Terminals 1,2 & 3
In-Line Baggage System $100 Terminal 1 & 2 Complete
Noise Mitigation Program $175MIL Ongoing
In-Progress Projects $334MIL Ongoing
Source: CAPA - Centre for Aviation
2014
2013
2012
2011
60M 65M 70M 75M
74.8Mil
72.7Mil
70.3Mil
69.3Mil
Source: CAPA - Centre for Aviation
2015 WEEKLY DIRECT FLIGHTS
Canada - 446
San Francisco - 342
Los Angeles - 850
Dallas - 840Houston - 686
Chicago - 872 NewJersey-752 NewYork-2,638
Washington D.C. - 994Atlanta - 1,593
Mexico - 393
Guatemala - 71El Salvador - 43
Honduras - 77Nicaragua - 78Costa Rica - 164
Panama - 152
Ecuador - 80
Peru - 70
Colombia - 137
Trinidad & Tobago - 62
Brazil - 123
Haiti - 134Dominican Republic - 162
Chile - 27Argentina - 42
Uruguay - 7
Paraguay - 4
Bolivia - 7
Venezuela - 66
Latin America - 1,899
Domestic - 9,567
Canada - 446
Miami International Airport &Fort Lauderdale International Airport
52 ISG MIAMI REPORT ISG MIAMI REPORT 53
ECONOMICACTIVITY
MIAMI FORT LAUDERDALE
Sources: Marketing Division Miami-Dade Aviation Department Business Development Manager Broward County Aviation Department
TOTAL ANNUAL PASSENGERSMIAMI INTERNATIONAL AIRPORT / FORT LAUDERDALE INTERNATIONAL AIRPORT

Florida will soon feature one of the most advanced passenger rail systems in the United States.All Aboard Florida is preparing a service that will connect Orlando and Miami with train travel that covers 235 miles in about three hours — 25% less time than when making the same trip by car. Additional train stops will include Fort Lauderdale and West Palm Beach.
A MODERN TRAVEL EXPERIENCEAll Aboard Florida was created with passengers in mind.Siemens trains features: • Ergonomic seating
• Wi-Fi
• Level boarding
• Train schedule will include 16 southbound and 16 northbound trips each day which provides flexibility of schedules
SERVICE BEGINS IN 2017
MiamiCentral Station, now
under construction, is located in
Downtown Miami and will connect
with existing public transit systems,
accessible through the new
terminal. Get quick and easy access
to renowned beaches, world-class
sporting events, outdoor and water
recreation, nature and wildlife tours,
shopping, museums and more.
Fort Lauderdale - Approx. 25 min.Miami
West Palm Beach - Approx. 1 Hour
Orlando- Approx. 3 Hours
Source: All Aboard Florida
Source: All Aboard Florida
MIAMI’S “GRAND CENTRAL” STATION...ALL ABOARD
“AllAboardFloridawillbeoneofthemosttransformativeprojectsfor theCityofMiami.Thismultibilliondollar,privateinvestmentwillspur economicandtourismgrowthinourdowntownandtheHistoric Overtowncommunity,resultinginthecreationofthousandsofjobs andhundredsofmillionsofdollarsineconomicimpact.”
City of Miami MayorTomas Regaloado
54 ISG MIAMI REPORT ISG MIAMI REPORT 55
ECONOMICACTIVITY
QUALITY OFLIFE

CULTURAL &ECONOMICGROWTH
56 ISG MIAMI REPORT ISG MIAMI REPORT 57

MIAMI - BUILDING SILICON SOUTH
Miami - one of 5 cities poised to be the next Silicon Valley Tech Hub.
• Miami, Florida
• Austin, TX
• Dallas, TX
• Seattle, WA
• Chicago, Illinois
In less than 2 years, Miami has positioneditself as a hub for tech and innovation inthe Americas.
The city is now home to a host of impressive venture-backed tech companies including:
- Modernizing Medicine (recently featured as one Forbes’ 10 companies revolutionizing entrepreneurship, second only to Tesla Motors)
- YellowPepper
- OpenEnglish
- LearnerNation
Apple, Uber, Twitter and Facebook have openedregional offices in Miami.
Sources: CNBC
NINE TOWERS TO FORM NEW TECH MIAMI INNOVATION DISTRICT
The Miami Innovation District, a $2 billion project, will bring together a synergistic mash-up of start-ups, middle-market and international corporations in an innovative mixed-usedevelopment like never seen before.
The Miami Innovation Tower is a $250 million investment that will create:
- 1,700 construction jobs- 700 permanent jobs- 13,000 high-paying jobs
Building features:
- 3,850,000 square feet of office space- 2,400,000 square feet of residential space- 250,000 square feet of retail- 2,500 parking spaces
eMERGE AMERICAS
eMerge Americas is an annual conference that provides a platform for the advancement of technology, a forum for idea exchange, and a launch pad for innovation connecting Latin America, North America, and Europe.
“Simplyput,Miamiisataninflectionpoint.Aonce-secondaryplayer ontheglobaltechnologyscene,Miamiisfindingitsnicheasan indispensableplayerduetoseveraluniquefactors...Miamicannow addanewdimensiontoitsoutsizedpersonality—thatofabooming techscene.”
- Founder of eMerge Americas, Manuel D. Medina
ECONOMIC IMPACT
2014 2015 2016 2017 2018 2019 2020 2021 20232022
$2,000,000,000
$1,500,000,000
$1,000,000,000
$500,000,000
$18M $29M
$630M
$1,68M
JOB OPPORTUNITIES
2014 2015 2016 2017 2018 2019 2020 2021 20232022
20,000
15,000
10,000
5,000
176 271
6,817
18,632
Sources: Washington Economic Group
58 ISG MIAMI REPORT ISG MIAMI REPORT 59
ECONOMICACTIVITY
KNOWLEDGE& INFLUENCE
MIAMI BEACH APRIL 18-192016

67
MIAMI’S CULTURAL RENAISSANCE The evolution of different art districts in South Florida is attracting a growing presence of international artists to the area and promoting expansions to museums and their collections.
ART GALLERIES / GALLERY WALKS
1974 20021998 2015
WynwoodArt Walk
Art SpaceVirginia Miller
FredricSnitzer
BrittoCentral
LocustProjects
Coral GablesGallery Night
Jazz atMOCA
EmersonDorschGallery
ViernesCultural
SpinelloProjects
AvantGallery
Dimensions Variable
PrimaryProjects
CoconutGrove
Art WalkF.A.M.Nights
Studio CrawlBird RoadArt Walk
David CastilloGallery
Dina MitraniGallery
WynwoodWalls
6th StreetContainer
MiamiDowntownArt Walk
SiteSpecific
ART FAIRS / FESTIVALS
1951 1984 2005 2015
Art DecoWeekendFestival
MiamiBook Fair
Intl Design Miami
HoltzChildren’sHospital
NADAArt Fair
MiamiProject Untitled Select
South BeachComedyFestival
ScopeMiami Beach
CoconutGrove Arts
Festival
MiamiIntl’ FilmFestival
Art Miami AquaArt Miami
PulseMiami
ContextArt Miami
Miami RiverArt Fair
MiamiBeach
Gay Parade
MUSEUMS / COLLECTIONS / ART CENTERS
1920 19811940 1960 2002 2016
Gusman Center
ColonyTheatre
FloridaGrand Opera
The Fillmore Miami Beach at the
Jackie GleasonTheater
Bass Museum
Frost ArtMuseum
Art Center BakehouseArt Complex
Little HaitiCultural Center
PAMM
South Miami-Dade Cultural Arts
Center
Adrienne Arsht CenterFrostMuseumof Science
CIFO
Fairchild TropicalBotanic Garden
Lowe ArtMuseum
Rubell FamilyCollection
NationalYoung ArtsFoundation
MiamiChildren’sMuseum
Vizcaya Museum & Gardens
Museum ofContemporary Art
TheWolfsonian
MarguliesCollection
Haitian HeritageMuseum
De La CruzCollection
MDCMuseum of
Art + DesignLatin AmericaArt Museum
Institute ofContemporary Art
New World Center
“ Over the years art galleries in this community made an importantcontributiontotheculturallifeweenjoytoday... [They]createdafertilegroundforthefairsandworld-class museums that catapulted Miami to its prominence in contemporaryart.”
- Virginia Miller, Founder and Director of ArtSpace, South Florida’s longest established fine art gallery.
$1.1 BILin local economic activity
generated by Miami-Dadecounty’s nonprofit arts and
cultural organizations.Sources: Miami Dade Arts
60 ISG MIAMI REPORT ISG MIAMI REPORT 61
QUALITY OFLIFE
ECONOMICACTIVITY
KNOWLEDGE& INFLUENCE
2002
2006 20132011

HEALTH REVOLUTION “ Miami ranked #4 Healthiest City in America”
• PARKS AND RECREATION SERVICES• AIR QUALITY • BEACH ACTIVITIES • HEALTHY NUTRITION OPTIONS• HIGH DOCTOR-TO-RESIDENT RATIO
Livabilty.com named Miami as oneof top healthiest cities in Americafor the following factors:
PROTON THERAPY CENTERS
Home to some of the best U.S. hospitals South Florida is home to some of the best hospitalsin America offering the latest in cutting-edge technology.
• Ranked #1 - Bascom Palmer in Ophthalmology for 11th Consecutive Year
• Miami Jackson Memorial Hospital is one of the nation’s largest health care facilities
• Miami Children’s Hospital Ranked one of Best U.S Hospitals
Source: Livability.com
Source: The National Association for Proton Therapy
IN OPERATION UNDER CONSTRUCTION
Baptist Health New MiamiCancer Institute - Opening 2016
Source: U.S. News
Proton therapy is an advanced treatment that beams radiation directly to any tumor to destroy cancer cells while avoiding healthy surrounding tissues.
Baptist Health New Miami Cancer Institute to open in 2016 and will offer first proton therapy center in South Florida.
Source: University of Miami - Miller School of Medicine
MIAMI’S GLOBAL ECONOMY Florida is ranked No. 2 best state for business and is home to 16 Fortune 500 corporate headquarters. Florida’s tax climate provides advantages that make Florida alocation profitable for every type of business.
1. Texas
2. Florida
3. North Carolina
4. Tennessee
5. Georgia
6. Indiana
7. Louisiana
8. Nevada
9. Arizona
10. South Carolina
Sources: Chief Executive Magazine & Enterprise Florida
Source: Miami DDA
CITY STATE LOCAL STATE LOCAL STATE LOCAL
MIAMI 0.0 0.0 5.5 0.0 6.0 1.0
NEW YORK 4.0-8.9 2.9-3.6 7.1 8.85 4.0 4.5
LOS ANGELES 1.0-9.55 0.0 8.84 0.0 8.25 1.5
PERSONALINCOME TAX
CORPORATEINCOME TAX
SALES TAX
% % %
4%
3.5%
3%
2.5%
2%
1.5%
1%
.5%
Atlanta Boston Chicago Dallas Houston LosAngeles
Miami NewYork
Philadelphia Phoenix SanFrancisco
Washington
3.3
1.5 1.4
3.6
2.9 3.0
3.8
1.71.3
3.03.4
1.6
MIAMI NO. 1 METROPOLITAN AREA WITH FASTEST JOB GROWTH RATE
Source: U.S. Bureau of Labor Statistics
ABOUT $300 BILLION IS MANAGEDBY THE PRIVATE-WEALTH INDUSTRY IN SOUTH FLORIDA. Source: Miami Herald
MONEY MANAGEMENT FIRMS HEADQUARTERED IN FLORIDA
2013 2014 2015
349 408
500
Source: CNBC
62 ISG MIAMI REPORT ISG MIAMI REPORT 63
ECONOMICACTIVITY
QUALITY OFLIFE

SOUTH FLORIDA’S SPORTS SCENE
South Florida has seen an astounding growth and increased popularity in sports since 1967 when it was home to the Miami Dolphins. Today, South Florida entertains residents and visitors from around the world with some of the most celebrated sports teams in the nation.
MIAMI SPORTS EVOLUTION
Founded in 1991
2 World Championships
2 Pennants
2 Playoff Appearances
MIAMI MARLINS
Founded in 1988
3 Championships
18 Playoff Appearances
MIAMI HEAT
Founded in 1966
2 Super Bowl Winners
5 Super Bowl Appearances
20-20 Playoff Record
MIAMI DOLPHINS
Founded in 1993
1 Finals Appearance
1 Playoff Appearance
PANTHERS
Miami,Florida
New Orleans,Louisiana
Pasadena,California
Tampa,Florida
San Diego,California
Glendale,Arizona
10 10
54
3 3
SUPERBOWLS HOSTBY STATE
Initial deal with Miami-Dade city officials could see 25,000-seat arena next door to the Miami Marlins arena
DAVID BECKHAM‘S NEW SOCCER STADIUM COMING TO MIAMI
Source: Miami New Times, MLS Soccer
“We are getting closer. There’s a lot of positivity around the city and I’ve always said that Miami is a
place that will love a team.”- David Beckham
MLS Commissioner Don Garber, David Beckham, Miami-Dade Mayor Carlos Gimenez
SUPERBOWLS HOSTBY CITIES
64 ISG MIAMI REPORT ISG MIAMI REPORT 65
ECONOMICACTIVITY
QUALITY OFLIFE
1. Florida - 15
2. California - 11
3. Louisiana - 10
4. Texas - 3
5. Arizona - 3
“AsingleSuperBowlgeneratesover$300millionineconomicbenefitsto SouthFloridaanditsbusinesses”
- Sen. Oscar Braynon, Miami Gardens

MIAMI’S BIKE-SHARE PROGRAM This year, Citi Bike Miami launched their Bike Share Program that extends from the city’s Upper East Side to south of Coconut Grove.
CARS ON DEMAND Car sharing programs allow for car access on demand and are each part of a free-floating network around the tri-county.These programs and cars can be found from Miami Beach, Coconut Grove and Brickell to Downtown Miami and the Design District.
In conjunction with new green promenades and walkways, the city of Miami is also working on a Bicycle/Pedestrian plan to promote alternative forms of transpor-tation. These initiatives, paired with new private forms of transportation, by the means of sharing bicycles and cars in the city, suggest an increasing metropolitan influence on the city of Miami.
Per Capita Spending onBicycle/Pedestrian Projects1. Florida2. California3. Texas4. Arizona5. New Jersey6. New York7. Illinois8. Washington9. Michigan
10. Hawaii
MIAMI IS THE NATION’S NO. 1 SUPPORTER OF PEDESTRIAN & BICYCLING INITIATIVES. FOR EVERY CITIZEN IN MIAMI THERE’S $14.22 BEING SPENT BY THE GOVERNMENT ON BIKE-RELATED PROJECTS.
4.5 MILLIONRIDES TAKEN TO DATE
Source: the305.com
DOWNTOWN MIAMI
1 bike per300 residents
20 stationsper square mail
LANDSCAPE OF THE FUTURE MIAMI’S ENHANCED TRANSPORTATION NETWORKAND A SHARING ECONOMY
WHY SHARING? 1. Cities experience an increase in Urbanization 2. Changing conditions in Economics3. Generational changes in User Preferences/Lifestyle
The sharing, or collaborative, economy is a new type of business built on the concept of shared resources. This ability to share what is available allows customers to access goods or services when they are needed, rather than having to purchase them “just in case” they need them.
-
1. UNLOCK FROM ANY STATION
2. RIDE WHEREVER YOU WANT
3. RETURN TO ANY STATION
Source: Car2Go.com, Huffington Post, Hertz247.com
Source: Alliance for Biking & Walking’s 2014 Benchmark Report
66 ISG MIAMI REPORT ISG MIAMI REPORT 67
QUALITY OFLIFE

PORT OF MIAMI
BRICKELLKEY
VIRGINIA KEY
112
MACARTHUR CAUSEWAY
I-95
DOLPHIN EXPY
US 27
W FLAGLER ST.
LANDSCAPE OF THE FUTURE GREEN LANDSCAPE INITIATIVES
Miami is set to beone of the top 5most walkable citiesin the nation. - Time Magazine, June 2014
THE MIAMI RIVER GREENWAYA scenic, 10-mile trail featuring historical markers, information kiosks, public art and decorative lighting.
Source: Theunderline.org
DOLPHIN EXPY
I-95
I-95
US 1
US 1
RICKENBACKER CAUSEWAY
THE BISCAYNE LINESeven miles of Miami’s future baywalk system will stretch from the Rickenbacker Causeway to the Julia Tuttle, with an additional 5 miles along the Miami River creating a visionary waterfront redevelopment plan.
Source: MiamiDade.Gov
DOWNTOWNMIAMI
THE MIAMI UNDERLINEThe Underline is a future world-class linear park and living artdestination offering safer paths for pedestrians and bicyclists.This urban parkland will include innovative public art installations by recognized national and Miami-based visual artists that will enrich the public realm and environment.
Source: Theunderline.org
BISCAYNE GREEN This future open space urban park involves a near-total makeover of a six-block stretch of Biscayne Boulevard located only blocks away from the AmericanAirlines Arena, Bayfront Park and Bayside.
Source: MiamiDade.Gov
US 1
EDGEWATER
WYNWOOD
BRICKELL
MIAMI
COCONUTGROVE
MIAMIRIVER DISTRICT
EST. TOTAL INVESTMENT:
$180 MIL
68 ISG MIAMI REPORT ISG MIAMI REPORT 69
QUALITY OFLIFE

ISG CITY WATCHFORT LAUDERDALE
70 ISG MIAMI REPORT ISG MIAMI REPORT 71

For an in-depth analysis into Fort Lauderdale’s Real Estate market please email us at info@isgworld to receive your complimentary copy of theISG World Miami Report 2015 Fort Lauderdale Edition.
ISG CITYWATCHFORT LAUDERDALE
ARTS, ENTERTAINMENT & CULTUREREJOICE IN THE HEART OFFORT LAUDERDALE
ARTS & CULTURE• Broward Center for the Performing Arts - $50MIL renovation
• Museum of Discovery and Science - 400,000 visitors each year
SPORTS & RECREATION• Sun Life Stadium - $350MIL renovation
SHOPPING• Galleria Mall $1BIL Redevelopment Plan
FEATURED REDEVELOPMENTThe Las Olas Corridor & Streetscape ProgramThe community redevelopment agency of Fort Lauderdale is allocating over $78 million dollars in redeveloping Fort Lauderdale Beach along with other popular resident and visitor attractions.
300-plus miles of Intracoastal Waterway and navigable inland canals make GreaterFortLauderdaletheyachtingcapitaloftheworldandthe
“VeniceofAmerica.”Source: Greater Fort Lauderdale Alliance
Source: denisonyachtsales.com
Worth of Boats and Marine Products
$4 BILVisitors130,000
Fort Lauderdale is one of the nation’s fastest-growing metropolises with countless expansions underway throughout the coast. Attracting over 14.3 MILLION VISITORS YEARLY for its famous beaches, scenic waterways, upscale shopping and vibrant nightlife, Fort Lauderdale is truly becoming a world-class destination.
FORT LAUDERDALE INTERNATIONAL BOAT SHOWONE OF THE LARGEST BOAT SHOWS IN THE WORLD
72 ISG MIAMI REPORT ISG MIAMI REPORT 73

SOUTH FLORIDA 2020
74 ISG MIAMI REPORT 75 ISG MIAMI REPORT
With the extensive construction and expansion taking place in our region, what will Greater Miami actually look like by the end of this decade?
The following pages illustrate a variety of “2020’s”, broken down by neighborhood.
Photo Credit:Photographer: Nick Garcia

EPIC
MIAMI RIVER
MET
TO SOUTH BEACH
CRUISE SHIP PORT
BAYFRONT PARK BAYSIDE MARINA
MIAMI DADE COLLEGE
BISCAYNE BAY
VICEROY
DOWNTOWN MIAMI: $12 BILLION IN NEW DEVELOPMENT THROUGHOUT 20 BLOCKSDOWNTOWN MIAMI 2020
One Bayfront Plaza (FECR)
4.2 million sq. ft. 72 Story Tower
Mixed-use, Office, Hotel, Retail
$2 Billion
VizcayneTwo 49 Story Towers849 Condos55,000 s.f. Retail$265 Million
Biscayne Boulevard Beautification
Grand Boulevard Landscaping & Baywalk Links Streets,
Parks and Bay
MET (MDM)JW Marriott Hotel Beaux Arts Hotel
MET Square470 Hotel Rooms
1,700 Seat Theatre4 Story Retail,
41,000 Sq. Ft. Restaurant Whole Foods
GUSMAN CENTER
Skyrise Miami Tower (Berkowitz)
1000 Ft. Observation TowerMixed Use Retail and
Hospitality$400 Million
CENTRO (Newgard)37 Stories352 Loft Style Condos$90 Million
Flagler on the River(MELO)32 Stories300 Condo Residences
Krystal Tower(Rodolfo Ishak)35 Stories153 Condos
300 Biscayne(PMG)Residential and Commercial
AMOUNTS ARE AN ESTIMATE
PERFORMING ARTS CENTER
WATSON ISLAND MARINA
STAR ISLAND
MIAMI INTERNATIONAL AIRPORT
BISCAYNE BAY
I-395AMERICAN AIRLINES ARENA
MARLINS STADIUM
Omni (Genting)1.5 million sq.ft.Hilton Hotel, Office, Retail & Potential Casino$400 Million
Resorts World Miami (Genting)14 acres
Destination Resort Hotels & Residences
$3 BillionProposed
Port of Miami Tunnel Connects I-395 and
Watson Island to Port$607 Million
Museum Park 29 acres. Perez Art Museum MiamiPatricia & Phillip Frost Museum of Science$500 Million
Miami World Center (Falcone)12 million sq. ft.27 AcresHotel, Retail, Civic Space, Office, Residential $4 Billion
Adrienne Arsht Center48,000 sq. ft.
Film Production Studio$13.6 Million
FREEDOM TOWER
1000 Museum(Covin)63 Stories83 CondosDesign by Zaha Hadid$300 Million
MIAMI RIVER DISTRICT
Overtown Gateway (Peebles)2 Phases150 Staybridge Hotel Room Suites635 Apartment Units60,000 Sq. Ft. Retail100,000 Sq. Ft. Office$200 MillionProposed
ParamountMiami World Center749 Ft. Signature Tower500 Condos
Canvas(NR Investments)37 Stories513 Condos
600 BiscayneTBD
LAMMNadar Latin
American Art Museum at MDC50 Floors270 Units
All Aboard Florida(Florida East Coast
Industries)Mixed use 9 Acres
1.5 Million Sq. Ft. Office, Residential, Retail , and
Hotel
76 ISG MIAMI REPORT ISG MIAMI REPORT 77

BRICKELL 2020
Landscape ParkPublic
Bayfront Park Proposed
Echo Brickell (PMG & JDS)
180 Luxury Residences
57 StoriesCollaboration by
Carlos Ott + yoo Studio
Le Parc (ALTA & Strategic)
128 Boutique Condos
12 Stories
Brickell House (New Guard)
374 Condos46 Stories
SLS Brickell (Related)
453 Condos120 Hotel Rooms
52 StoriesDesign by
Phillipe Stark
BISCAYNE BAY
CORAL GABLES
Atton Hotel270 Rooms
12 StoriesDesign by
Luis Revuelta
Cassa Brickell(TSG)
10 Stories81 Condos
AMOUNTS ARE AN ESTIMATE
BRICKELL: $6 BILLION IN NEW DEVELOPMENT
The Bond(MDR)323 Condos43 Stories
1010 Brickell (Key International)387 Condos47 StoriesDesign by Sieger Suarez
NINE at Mary Brickell(Starwood Capital & Lynd)390 Condos 48 StoriesDesign by ADD
Brickell City Centre(Swire)5.4 million Sq. Ft. 9 Acres773 Condos 93 Apartments243 Hotel Rooms 520,000 Sq. Ft. Retail240,000 Sq. Ft. Office
Brickell Heights (Related)2 Towers690 Condos 48 StoriesDesign by Arquitectonica
My Brickell (Related)
192 Condos 27 Stories
One Brickell(Related) 3 Towers80 Stories70 Stories55 Stories1,200 Condos200 Hotel Rooms200,000 Sq. Ft. RetailProposed
BISCAYNE BAY
MARLIN’S STADIUM
DOWNTOWN
BRICKELL KEY
MIAMI RIVERDISTRICT
BrickellTen (IBGroup)155 Condos22 Stories
Brickell Flatiron(Ugo Colombo)548 Condos65 StoriesDesignBy Luis Revuelta
SLS Lux(Related)450 Condos85 Hotel Suites57 StoriesDesign by Arquitectonica
1100 Millecento (Related)382 Condos42 StoriesDesign by Carlos Ott + Pininfarina
Panorama Tower(Florida East Coast)
821 Condos 128 Hotel Rooms
81 Stories82,000 Sq. Ft. Retail38,000 Sq. Ft. Office
78 ISG MIAMI REPORT ISG MIAMI REPORT 79

BISCAYNE CORRIDOR 2020
National Young Arts Foundation Proposed New Campus
Designed by Frank Gehry at Historic Bacardi Building
Biscayne LinePublic Bay Walk
Proposed from Venetian Cswy to Julia Tuttle Cswy
Mbay (Hyperion)129 Condos
39 StoriesProposed
MARLIN’S STADIUM
VENETIAN CAUSEWAY
TO MIAMI BEACH
ADRIENNE ARSHT PERFORMING ARTS CENTER
Wynwood Art District Walls
On-going Art Movement
PÉREZ ART MUSEUM
AMERICAN AIRLINES ARENA
The Filling Station(FLS Development)
81 CondosProposed
MACARTHUR CAUSEWAY
TO MIAMI BEACH
DOWNTOWN MIAMI
MIAMI RIVER DISTRICT
Aria on the Bay(Melo)
647 Condos50 Stories
40,000 SF Commercial Space
250 Wynwood (Fortis)
11 Condos6 Stories
Mixed-Use Retail
EDGEWATER, MIDTOWN AND DESIGN DISTRICT: $4 BILLION IN NEW DEVELOPMENT
AMOUNTS ARE AN ESTIMATE
Bay House (Melo)164 Condos38 Stories
NEW PUBLIC& PRIVATE PARK
1/2 ACRE
Icon Bay (Related)300 Condos42 Stories
Biscayne Beach Club(Eastview)399 Condos51 Stories
Paraiso Bay / Gran Paraiso(Related)2 Towers685 Condos55 Stories
LUXURY BAYFRONTRESTAURANT
Hyde Midtown (Related)40 Hotel Units395 Condos 31 Stories*Midtown
The District 36 (Terra)
60,000 Sq. Ft.High-End Home
Furnishing RetailProposed
Dacra Project (Craig Robins)540,000 Sq. Ft. Luxury Retail*Design DistrictProposed
JULIA TUTTLE CAUSEWAY
TO MIAMI BEACH
New Public & Private Bayfront Marina and Park
MIAMIDESIGN DISTRICT
The Crimson(Mckafka)90 Condos20 Stories
Baltus House(Related)
167 Condos15 Stories
WY NWOO DSHOPS AT MIDTOWN
Paraiso Bayviews (Related)388 Condos44 Stories
One Paraiso(Related)276 Condos53 Stories
MIAMI INTERNATIONALAIRPORT
Elysee (Eastview)100 Units57 Stories
26 Edgewater(Stripey)
86 Condos10 Stories
23 Biscayne (Melo)96 Condos18 Stories
80 ISG MIAMI REPORT ISG MIAMI REPORT 81

82 ISG MIAMI REPORT ISG MIAMI REPORT 83
SUNNY ISLES 2020 $11.5 MILLION IN NEW DEVELOPMENT
Regalia(Regalia Beach Developers)46 Stories39 Units
Porsche Design Tower(Dezer)
57 Stories132 Units
Turnberry Ocean Club(Turnberry Associates)54 Stories154 Units
Armani Casa(Related/Dezer)60 Stories308 Units
The Estates at Acqualina(GSF Acquisition)
Two Towers50 Stories264 Units
Mansions at Acqualina(GSF Acquisition)
47 Stories79 Units
Chateau Beach(Chateau Group)33 Stories84 Units
MUSE(PMG)48 Stories68 Units
Jade Signature(Fortune)57 Stories192 Units
Parque Towers(Milton)26 Stories320 Units
400 Sunny Isles(Key International)230 Units
The Ritz-Carlton Residences(Fortune/Chateau Group)
50 Stories212 Units
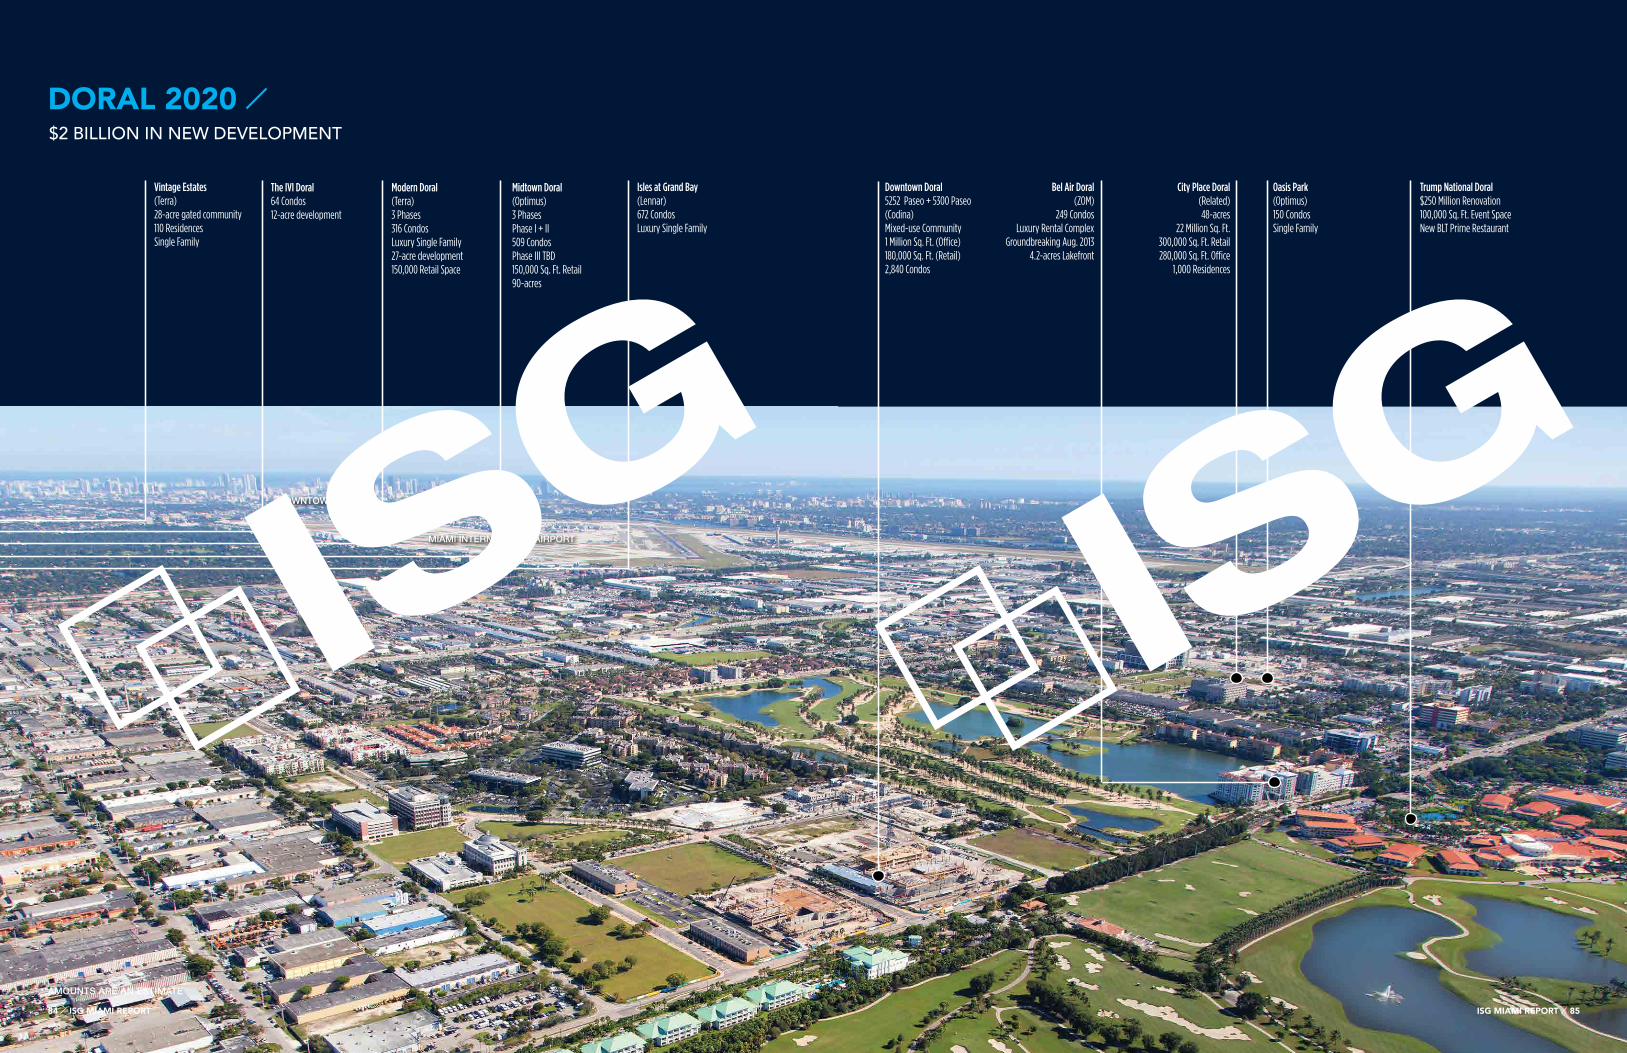
DORAL 2020
The IVI Doral64 Condos12-acre development
Vintage Estates (Terra)28-acre gated community110 ResidencesSingle Family
DOWNTOWN MIAMI
Modern Doral (Terra)3 Phases316 CondosLuxury Single Family27-acre development150,000 Retail Space
Isles at Grand Bay(Lennar)672 CondosLuxury Single Family
Midtown Doral (Optimus)3 PhasesPhase I + II509 CondosPhase III TBD150,000 Sq. Ft. Retail90-acres
$2 BILLION IN NEW DEVELOPMENT
MIAMI INTERNATIONAL AIRPORT
AMOUNTS ARE AN ESTIMATE
Downtown Doral5252 Paseo + 5300 Paseo (Codina)Mixed-use Community1 Million Sq. Ft. (Office)180,000 Sq. Ft. (Retail)2,840 Condos
Bel Air Doral(ZOM)
249 Condos Luxury Rental Complex
Groundbreaking Aug. 20134.2-acres Lakefront
City Place Doral(Related)48-acres
22 Million Sq. Ft.300,000 Sq. Ft. Retail280,000 Sq. Ft. Office
1,000 Residences
Oasis Park(Optimus)150 CondosSingle Family
Trump National Doral$250 Million Renovation100,000 Sq. Ft. Event SpaceNew BLT Prime Restaurant
84 ISG MIAMI REPORT ISG MIAMI REPORT 85

FORT LAUDERDALE 2020
2nd Street Residences(Ellis Diversified)
30 Stories398 Condos
2,200 Sq. Ft. RetailProposed
Elan 16Forty(Greystar)10 Stories261 Condos6,000 Sq. Ft. Gym2,300 Sq.Ft. RetailProposed
Paramount (Encore Housing and Kodsi)18 Stories95 Condos
AquavitaLas Olas
(Roy & Eisinger)Two Waterfront Buildings
22 Condos
The Pearl at Flagler Village (Morgan)7 Stories331 CondosHenry Square (Related)6 Stories382 Residences25,000 Sq. Ft. Retail
BROWARD CENTER FOR THE PERFORMING ARTS
MUSEUM OF DISCOVERY AND SCIENCE
DOWNTOWN FORT LAUDERDALE
BROW
ARD
BOUL
EVAR
D
AquaBluFt. Lauderdale(Roy & Eisinger)45 Condos
AquaLunaLas Olas
(Roy & Eisinger)Two Waterfront
Buildings16 Condos
AquaMarLas Olas
(Roy & Eisinger)Three Waterfront
Buildings20 Condos
AdagioOn the Bay(Grupo Alco, Garcia Stromberg + GS4 Studio Architects)12 Condos
Privage(Roy & Eisinger)22 Condos
BellaVitaLas Olas
(Roy & Eisinger)16 Condos
$3 BILLION IN NEW DEVELOPMENT
Auberge Beach Residences(Related)Two Towers17 - 22 Stories171 Condos
AMOUNTS ARE AN ESTIMATE
Gale Hotel &Residences (Neward Development &Menin Hospitality)128 Condos
W Hotel & Residences (Related NY)171 Condos
Crocker Tower(Crocker)
42 Stories395 Condos
Proposed
South Andrews Tower(Fred Kern)37 StoriesOffice, Hotel &ResidencesProposed
8th Avenue Residences(Rockefeller)262 Condos2,500 Sq. Ft. Retail
Airport and I-595$42.5 Million Expansion to I-595$791 Million runway renovation atFt. Lauderdale Airport
RIVER FRONT
LAS
OLA
S BO
ULE
VARD
SOUTH FEDERAL HIGHWAY
ICON Las Olas(Related)272 ResidencesUnder Construction
RIVA(Premier)14 Stories100 Condos
1800Las Olas
(Roy & Eisinger)4 Condos
New RiverVillage III(American Land Ventures)15 Stories209 Condos2,245 Sq. Ft. Restaurant
86 ISG MIAMI REPORT ISG MIAMI REPORT 87
Marina Lofts(Asi Cymbal)2 Towers28 - 30 Stories856 Condos29,000 Sq. Ft. Retail & RestaurantDesigned by Bjarke InglesProposed
New River Yacht Club (Related)26 Stories249 Condos$36 Million

Alex VidalPresidentRelatedISG International Realty
ON THE GROUND The current state of South Florida Realty
Q: In your opinion, why are rental prices on the rise in Miami? When do you think they will level out?
A: Rents are on the rise due to the population growth Miami is experiencing on a day-to-day basis. The majority of people coming to the city for the first time typically rent before they buy. They want to experience Miami before making a commitment to a particular area or submarket. Current South Florida residents are also driving rental demand because it’s an economically feasible choice,especially with the recent difficulty in obtaining mortgage financing. These factors are contributing to the lack of rental inventory in South Florida, especially in popular areas such as Brickell and Downtown Miami. Rents will stabilize once new construction buildings are completed and more supply becomes available in the market.
Q: Luxury condo and home development is a big market in Miami at the moment. What drivers do you see keeping this trend sustainable in the long run?
A: Both domestic and international buyers are playing a key role in the luxury real estate market.
Florida has a favorable tax climate for businesses. I have personal friends who have moved their headquarters from New York to Miami and have saved millions in taxes. This is a key factor in bringing domestic buyers to our shores, aside from our pristine weather.
Internationally, Miami will continue to be a big draw. When buyers compare the political and economic stability of their respective countries to South Florida, they are convinced that we provide a more comfortable and less stressful lifestyle. Luxury inventory in Miami meets those objectives. We have also seen an influx of Asian buyers investing in Miami real estate. One of our realtors recently hosted a group of over 20 Chinese CEO’s who are looking for investment opportunities in South Florida.
Q: Luxury real estate, especially in Miami, is an increasingly competitive market. If you had to narrow it down, what is the most important key to success in Miami’s luxury market?
A: Our goal is to establish trust and an emotional connection with our clients. This is critical when working with high net worth individuals in the luxury market. It is important our clients have confidence in our ability to manage their real estate transactions in a professional, careful and authentic manner.
Q: Drawing from your experience, what do you think is Miami’s next big popular neighborhood?
A: Edgewater. It is the next logical neighborhood to be redeveloped in our expanding downtown area.
Q: What are the benefits of joining a large brokerage compared to working on your own?
A: Experienced agents join a large brokerage because the firm’s values and way of doing business is similar to theirs or because the brokerage offers an invaluable learning potential.
In our case, experienced agents join to leverage two of the biggest names in the South Florida real estate market, Related & ISG. Both of these firms are synonymous for luxury, preconstruction, high rises and exceptional marketing. RelatedISG Intl Realty also leverages multiple office locations and sales centers, locally and internationally.
Our brokerage additionally promotes an environment and culture that encourages agents to excel. We want them to represent themselves and our brand to the best of their abilities. Our team has a synergy that is second to none and it is truly an exciting and motivating environment in which to work.
The Miami Report is produced for general interest only; it is not definitive and is not intended to give advice. It must not be relied upon in any way. Although high standards have been used in the preparation of the information, analysis and views presented in The Miami Report, no responsibility or liability whatsoever can be accepted by ISGWorld for the contents. We make no express or implied warranty or guarantee of the accuracy of any of the contents. As far as applicable laws allow, we do not accept responsibility for errors, inaccuracies or omissions, nor for loss or damage that may result directly or indirectly from reliance on or use of its contents. The Miami Report does not necessarily reflect the view of ISGWorld in any respect. Readers should not take or omit to take any action as a result of information in The Miami Report.
CELEBRATING SIX YEAR’S OF THE ISG MIAMI REPORT
88 ISG MIAMI REPORT
WORLD HEADQUARTERSInternational Sales Group, LLCTurnberry Plaza2875 Northeast 191 Street • 2nd FloorAventura, FL 33180P: 305.931.6511 | isgworld.com
LOCAL OFFICES:Aventura | South Beach | EdgewaterFort Lauderdale
INTERNATIONAL OFFICES:Buenos Aires, Argentina | Rio, BrazilSão Paulo, Brazil | Bogotá, Colombia Caracas, Venezuela | Panama City, Panama


![[hal-00945905, v2] Crowd Sculpting: A space-time sculpting ...](https://static.fdocuments.in/doc/165x107/61d00833c69c8e549e339118/hal-00945905-v2-crowd-sculpting-a-space-time-sculpting-.jpg)