SCSI Connector and Cable Modeling from TDR … Connector and Cable Modeling from TDR Measurements...
48
The Interconnect Modeling Company™ SCSI Connector and Cable Modeling from TDR Measurements Dima Smolyansky TDA Systems, Inc. http://www.tdasystems.com Presented at SCSI Signal Modeling Study Group Rochester, MN, December 1, 1999
Transcript of SCSI Connector and Cable Modeling from TDR … Connector and Cable Modeling from TDR Measurements...
The Interconnect Modeling Company™
SCSI Connector and Cable Modelingfrom TDR Measurements
Dima SmolyanskyTDA Systems, Inc.
http://www.tdasystems.com
Presented at SCSI Signal Modeling Study GroupRochester, MN, December 1, 1999

The Interconnect Modeling Company™
Outline
* Interconnect Modeling Methodologyl Single-Ended TDR Modeling
– TDR Basics– REQ Signal Model
l Differential TDR Modeling– TDR Basics– REQ Signal Model

The Interconnect Modeling Company™
Signal Integrity Modeling
l Goal: create SPICE models to predictconnector/cable performance
l Model required range of validity is definedby a greater of
– signal rise time: fbw=0.35 / trise
– signal clock rate: fbw= (3~5) ·fclock
l It may be desired to extend the requiredrange of model validity beyond fbw

The Interconnect Modeling Company™
Measurement Based Approach
Measure
Model
Simulate
Compare and Verify
Component Simulations
Component SPICE Model
Compare and Verify Model
System Layout
ComponentMeasurements
Fin
e-T
une
the
Mod
el
System Simulations
Com
pone
nt R
edes
ign

The Interconnect Modeling Company™
IConnect™ Modeling Process
Measureand acquire
Processdata
Extractmodel
Simulate,compareand verify

The Interconnect Modeling Company™
Outline
4 Interconnect Modeling Methodology* Single-Ended TDR Modeling
– TDR Basics– REQ Signal Model
l Differential TDR Modeling– TDR Basics– REQ Signal Model

The Interconnect Modeling Company™
TDR Block Diagram
Ztermination
Cable: Z0, tdRsource
TD
R O
scill
osco
pe F
ront
P
anel
Rsource = 50 ΩZ0 = 50 Ωthen Vincident = ½V
VincidentVreflected
V
D
Note: TDR source may actually be implemented as a Nortonequivalent current source

The Interconnect Modeling Company™
TDR Visual Representation
½ V
0
Zload > Z0
Zload < Z0
V •Zload / load+ Z0)V
½ V
0Short circuit

The Interconnect Modeling Company™
Inductance and Capacitance Analysis
L-C discontinuity
C-L-C discontinuity
Z0Z0
Z0Z0
Shunt C discontinuity
Z0 Z0
Z0Z0
½ V
0
½ V
0
½ V
0
½ V
0
The Interconnect Modeling Company™
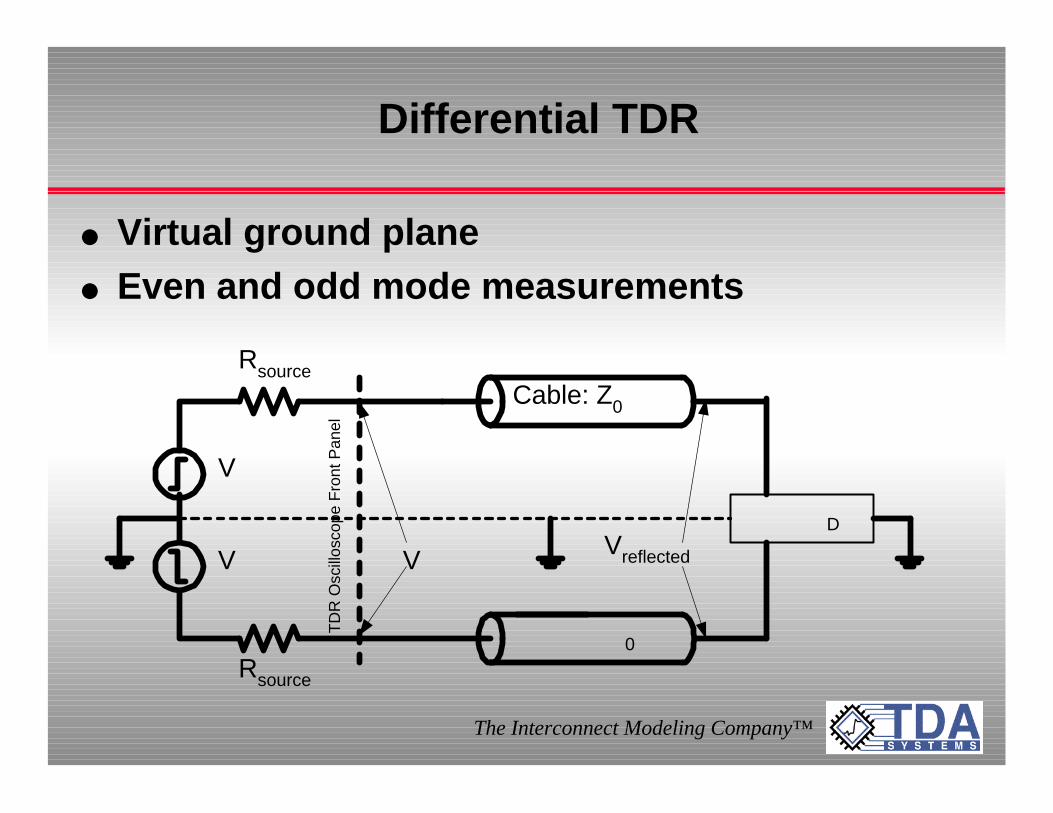
Differential TDR
l Virtual ground planel Even and odd mode measurements
Cable: Z0
Rsource
TD
R O
scill
osco
pe F
ront
Pan
el
V Vreflected
D
V
V
0
Rsource

The Interconnect Modeling Company™
REQ: Acquire Waveforms

The Interconnect Modeling Company™
Partition Impedance Profile and Create a Model

The Interconnect Modeling Company™
Model Listing
****** Partition #1
l1 1 4 3.54n
****** Partition #2
c1 4 3 1p
l2 4 5 1n
****** Partition #3
t1 5 3 6 3Z0=80.5 TD=1.41n****** Partition #4
t2 6 3 2 3 Z0=65.5 TD=143p
Connector
Cable

The Interconnect Modeling Company™
Composite Model Generation

The Interconnect Modeling Company™
Create Piecewise Linear Source

The Interconnect Modeling Company™
Simulate and Verify
The Interconnect Modeling Company™
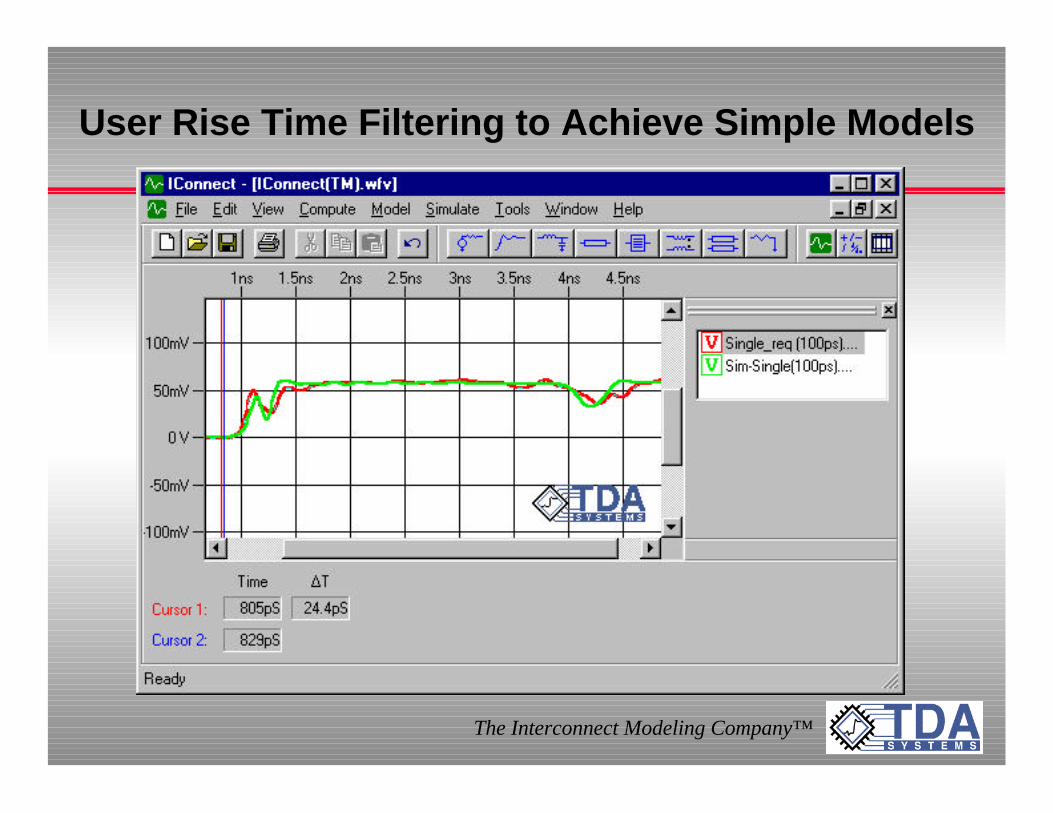
User Rise Time Filtering to Achieve Simple Models

The Interconnect Modeling Company™
Correlation to Physical Structure
PCB section Cable section
Partition 1 Partition 2

The Interconnect Modeling Company™
Outline
4 Interconnect Modeling Methodology4
– TDR Basics–
* Differential TDR Modeling–
– REQ Signal Model

The Interconnect Modeling Company™
Symmetrical Coupled Line Model
l Assumptions:– the lines are symmetrical– TDR pulses are symmetrical– TDR pulses arrive at the lines at the same time at the
beginning of both lines
Board lines
TDR source 2

The Interconnect Modeling Company™
Differential TDR Measurement Setup
Cable: Z0
RsourceT
DR
Osc
illos
cope
Fro
nt P
anel
V Vreflected
V
V
Cable: Z0, tdRsource
ZDUT, tDUT
ZDUT, tDUT
Ztermination
Ztermination
l Virtual ground planel Assumptions:
– Lines under test (DUT) are symmetrical– TDR pulses are symmetrical– TDR pulses arrive at the DUT at the same time

The Interconnect Modeling Company™
Equalize the TDR Delay
l Watch for the symmetry in the traces rather than relative position in time

The Interconnect Modeling Company™
Acquire Waveforms

The Interconnect Modeling Company™
Single Line Impedance vs. Odd and Even

The Interconnect Modeling Company™
Create a Model

The Interconnect Modeling Company™
Symmetrical Coupled Line Model
l Zodd, Zeven, todd, teven:directly obtained from odd and even impedance profiles
⇒⇒Z0
Z0 -Zodd/2, todd
Zeven/2, teven
Zodd, todd
Zodd, todd

The Interconnect Modeling Company™
Practical Model Output
Zodd/2, todd
Zeven/2, teven
Zodd, todd
Zodd, todd
-2V1 -2V2VCVS VCVS
V1 V2
-Zodd/2, todd
Zeven/2, teven
Zodd, todd
Zodd, todd
Theoretical model Practical model
lTo avoid negative Z in theoretical model:

The Interconnect Modeling Company™
Model Listing
****** Partition #1
l1 1 6 4n
c1 6 5 710f
l2 3 7 4n
c2 7 5 710f
c3 6 7 33.7f
k1 l1 l2 226m
****** Partition #2
t1 6 8 9 10 Z0=51.4 TD=43.5p
t2 7 8 11 10 Z0=51.4 TD=43.5p
e1 12 8 12 13 2
e2 14 10 14 15 2
t3 12 13 14 15 Z0=25.7 TD=43.5p
t4 13 5 15 5 Z0=58.5 TD=44.5p
****** Partition #3
c4 9 5 423f
l3 9 16 7.96n
c5 11 5 423f
l4 11 17 7.96n
c6 9 11 643f
k2 l3 l4 603m
****** Partition #4
t5 16 18 19 20 Z0=66 TD=1.37n
t6 17 18 21 20 Z0=66 TD=1.37n
e3 22 18 22 23 2
e4 24 20 24 25 2
t7 22 23 24 25 Z0=33 TD=1.37n
t8 23 5 25 5 Z0=281 TD=1.4n
****** Partition #5
t9 19 26 2 27 Z0=45.7 TD=125p
t10 21 26 4 27 Z0=45.7 TD=125p
e5 28 26 28 29 2
e6 30 27 30 31 2
t11 28 29 30 31 Z0=22.9 TD=125p
t12 29 5 31 5 Z0=208 TD=140p
ConnectorsCables

The Interconnect Modeling Company™
Composite Model Generation

The Interconnect Modeling Company™
Simulate and Verify

The Interconnect Modeling Company™
Filter to Desired Rise Time

The Interconnect Modeling Company™
Correlation to Physical Structure: Differential
PCB section Cable sectionPartition 2
Partition 3

The Interconnect Modeling Company™
Summary and Further Work
l Accurate cablemodels are obtained
l Better understandingof connectorgeometries willimprove theconnector model

The Interconnect Modeling Company™
Supplementary Information
The Interconnect Modeling Company™
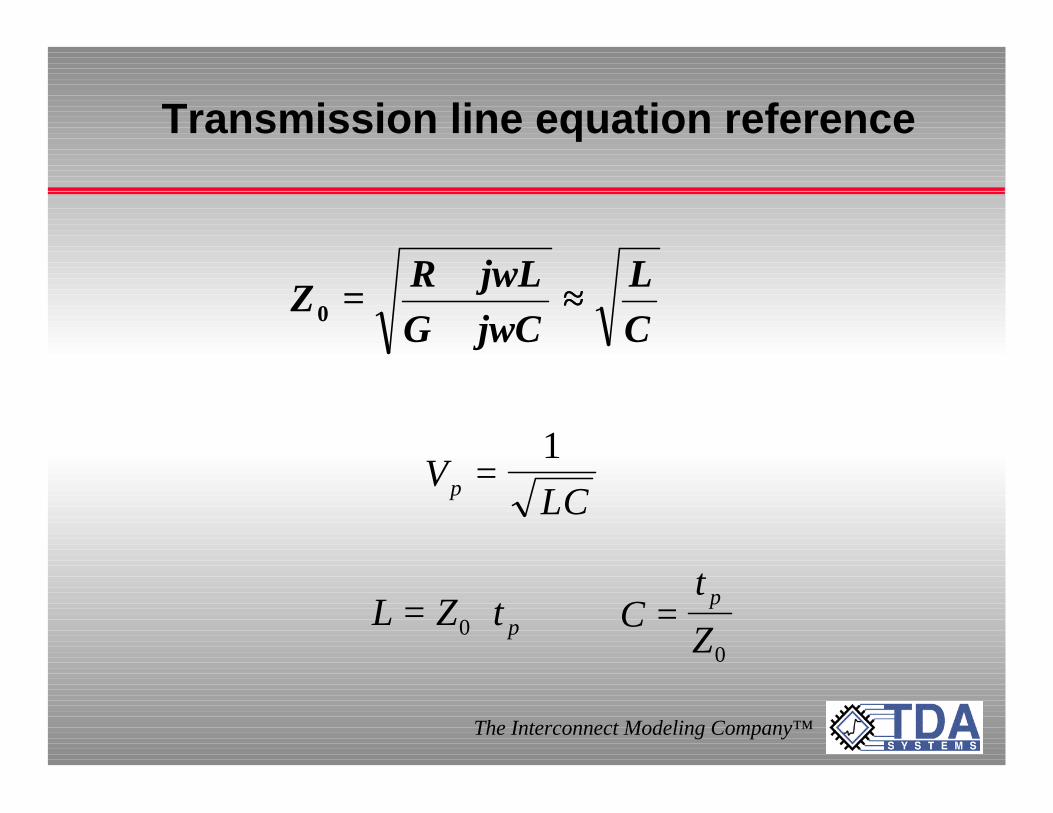
Transmission line equation reference
VLCp =1
L Z t p= ⋅0 Ct
Zp=0
CL
jwCGjwLR
Z ≈≈++++
==0

The Interconnect Modeling Company™
Differential Transmission Line
mtot
mselfodd CC
LLZ
++
−−==
mtot
mselfeven CC
LLZ
−−
++==
))(( mtotmselfodd CCLLt ++−−==
))(( mtotmselfeven CCLLt −−++==

The Interconnect Modeling Company™
TDR Multiple Reflection Effects
Z0 Z1 Z2 Z3 Z4
Vtransmitted1
Vreflected1 Vreflected2
t0
Time Direction of propagation

The Interconnect Modeling Company™
Z-line Example

The Interconnect Modeling Company™
L-C Even-Odd Mode Analysis for Line withConstant Impedance
(( ))oddoddeveneven ZtZtL ++==21
(( ))oddoddevenevenm ZtZtL −−==21
even
even
Zt
C ==
−−==
even
even
odd
odd
Zt
Zt
C21

The Interconnect Modeling Company™
3-Line Symmetrical Coupled Line Model
! assume: todd=teven !
Alternatively, for differentiallines: tmutual = todd
evenoddZZZ =0
oddeven
evenoddm ZZ
ZZZ
++==
2
⇒⇒
Z
Z
Zmutual
evenZZ =
Z0
Z0
Note:

The Interconnect Modeling Company™
Differential Line Modeling
l Short interconnect– use lumped-coupled model
l Long interconnect– split lines in multiple segments
l Longer yet interconnect– symmetric distributed coupled line model

The Interconnect Modeling Company™
Can you ignore interconnect effects?
Practical rule of “short” or “lumped” (RLC) interconnect
trise
tpropdelay
trise > tprop delay• 6

The Interconnect Modeling Company™
Propagation delay
l Time required for signal to propagate throughinterconnect
l Dependent on velocity and interconnect lengthl Examples:
– prop. delay in vacuum: 1/clight=1 ns/foot (velocity 3•108 m/sec)– propagation delay per length in FR4: 150ps/inch
Z0, td, l (length)
Propagation delay
efflight
delaypropc
lT
εε==
The Interconnect Modeling Company™
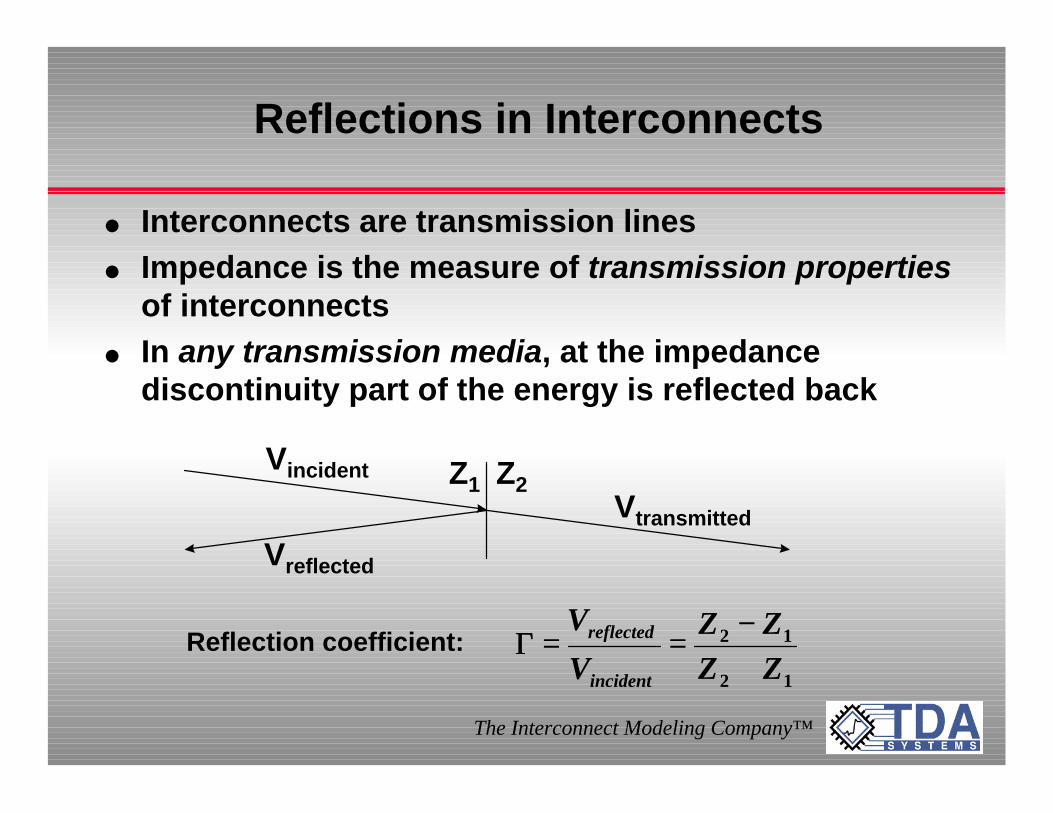
Reflections in Interconnects
l Interconnects are transmission linesl Impedance is the measure of transmission properties
of interconnectsl In any transmission media, at the impedance
discontinuity part of the energy is reflected back
12
12
ZZZZ
V
V
incident
reflected
++−−
====ΓΓReflection coefficient:
Vincident
Vreflected
Vtransmitted
Z1 Z2
The Interconnect Modeling Company™
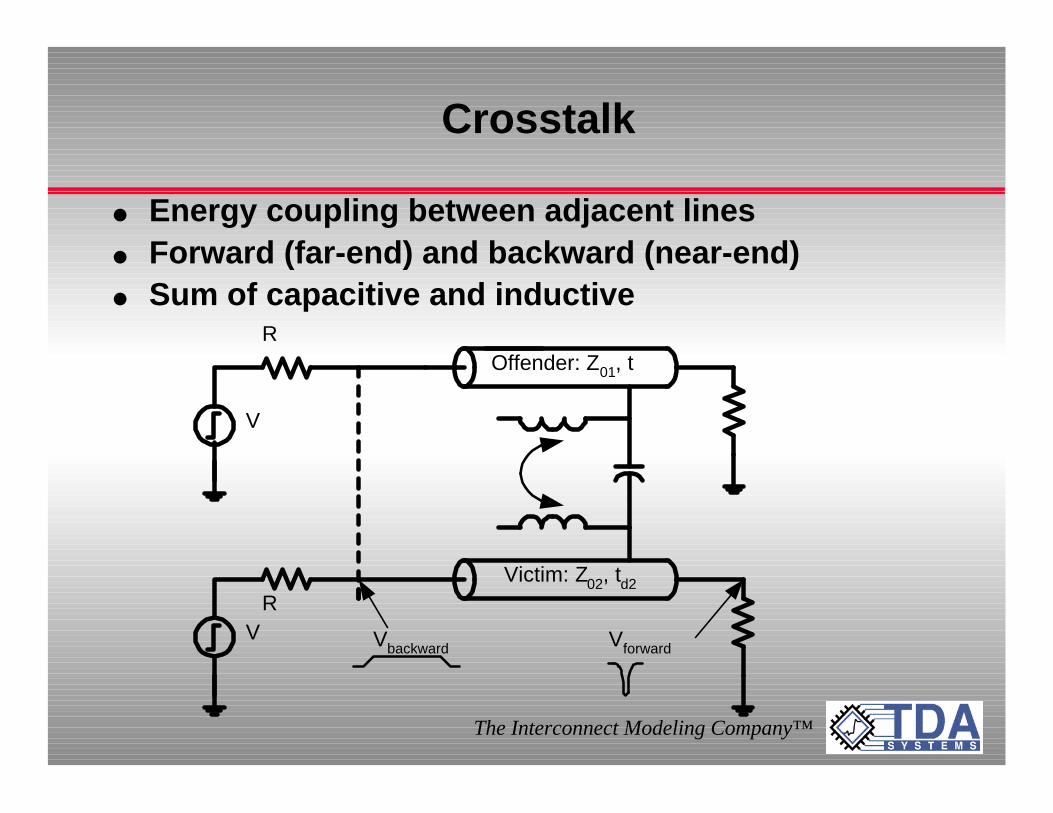
Crosstalk
l Energy coupling between adjacent linesl Forward (far-end) and backward (near-end)l Sum of capacitive and inductive
VbackwardV
Victim: Z02, td2
R
R
V
Offender: Z01, t
Vforward
The Interconnect Modeling Company™
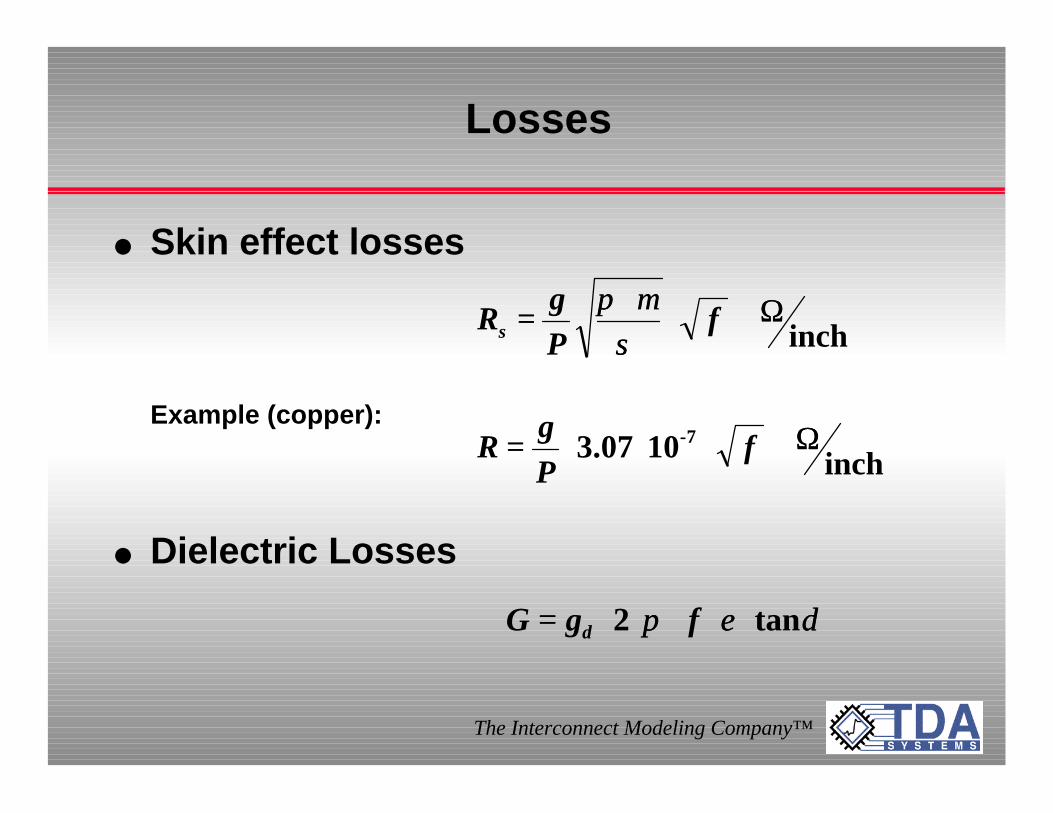
Losses
l Skin effect losses
Example (copper):
l Dielectric Losses
inchΩΩ⋅⋅
⋅⋅== f
Pg
Rs σσµµππ
δδεεππ tan2 ⋅⋅⋅⋅⋅⋅⋅⋅⋅⋅== fgG d
inch103.07 7- ΩΩ⋅⋅⋅⋅⋅⋅== fPg
R
The Interconnect Modeling Company™
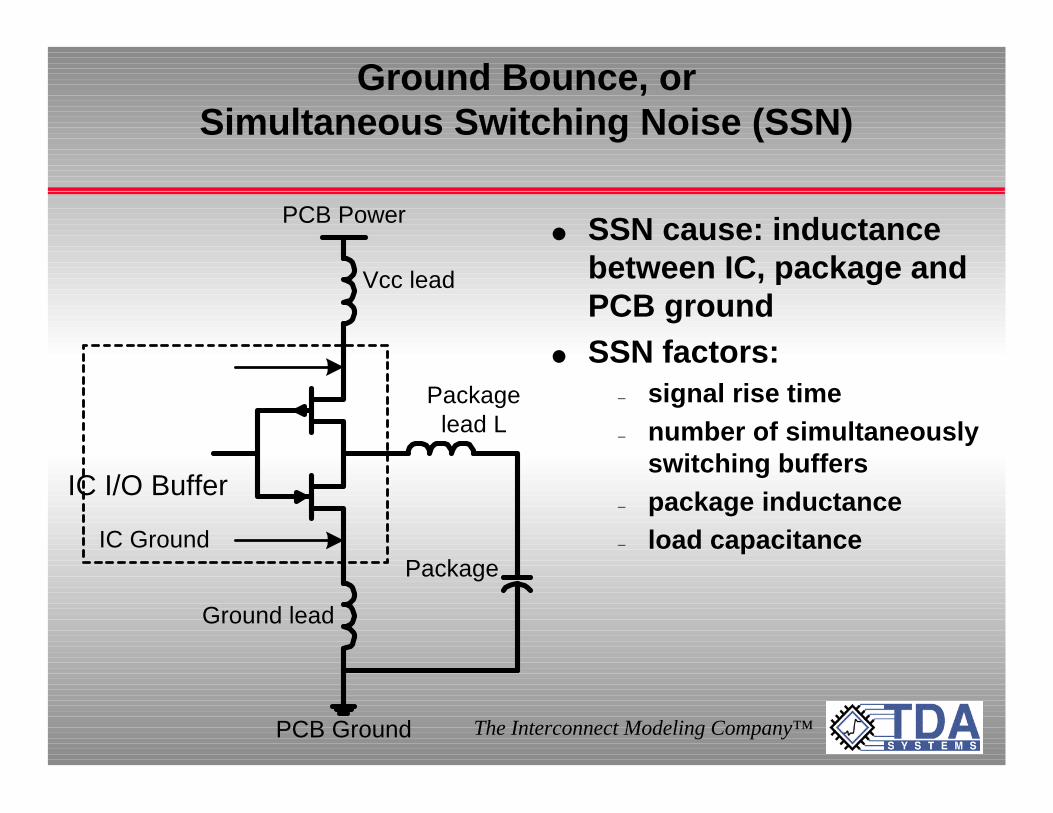
Ground Bounce, orSimultaneous Switching Noise (SSN)
l SSN cause: inductancebetween IC, package andPCB ground
l SSN factors:– signal rise time– number of simultaneously
switching buffers– package inductance– load capacitance
PCB Ground
PCB Power
IC I/O Buffer
Vcc lead
Ground lead
Packagelead L
PackageIC Ground

The Interconnect Modeling Company™
Rise time degradation
interconnect
35.0interconnect BW
t ==
2interconnect
2 ttt signalfinalr ++==