2020 Texas A&M AgriLife Bushland Forage Sorghum Silage Trial

2011
Texas Cool-Season Annual Forage
and Grain Results varietytesting.tamu.edu/wheat
SCS-2011-09

2011 Texas Cool-Season Annual Forage and Grain Results
varietytesting.tamu.edu/wheat
Texas AgriLife Extension Service
Robert Duncan, Daniel Hathcoat, Brent Bean, Todd
Baughman, David Drake, Larry Redmon, and Travis Miller
Texas AgriLife Research
Amir Ibrahim, Jim Muir, Lloyd Nelson, Jackie Rudd, Russell Sutton, Jason Baker, Bryan Simoneaux, and Rex Herrington

Table of Contents
Introduction……………………………………………………………………..1
Texas Regions Map……………………………………………………………..3
2011 Texas Region Overview…………………………………………………..4
Forage Trial Agronomic Data…………………………………………………..5
Dual-Purpose Forage and Grain Trials:
College Station Agronomy Farm………………………………….6
College Station Beef Center……………………………………….7
McGregor………………………………………………………….8
Forage Trials:
Bushland…………………………………………………………..9
Clifton……………………………………………………………10
College Station Agronomy Farm………………………………...11
College Station Beef Center……………………………………...12
Delta County………………………………………...…………...13
McGregor………………………………………………………...14
Overton Oats…….……………………………………………….15
Overton Small Grains...………………………………………….16
Vernon……………………………………………………………17
Acknowledgements…………………………………………...……………….18

Introduction
The Cool-Season Annual Forage Variety Trial data presented in the following pages is coordinated and implemented by numerous Texas AgriLife Extension and Research faculty and staff. We also appreciate the cooperation from numerous Texas County Extension Agents, producers, and private industry partners that contributed locations, property, and seed to conduct these field trials. The purpose of this publication is to provide unbiased yield data for forage producers across the state. With this information, Texas forage producers can make an educated decision regarding the most appropriate varieties for their geographic region. This is the second annual publication for the state-wide variety trial. Variety Selection: Selection of an appropriate small grain variety is one of the most important decisions a producer will make. This decision can impact the potential yield (forage and/or grain), forage nutritive value, disease and insect management, and maturity of the crop. It is important producers have diversity in the varieties planted on their farms and this depends on the intended use of the crop (grain, forage, or dual-purpose). Variety diversification spreads the risk associated with potentially devastating pests (rusts, Hessian fly, wheat curl mite, greenbugs, etc.) and yield loss from adverse environmental factors (freeze, drought, hail, etc.). Producers should select no fewer than two varieties to plant on their farms and preferably more, depending upon size, location, and purpose of fields. Variety selection should be based upon sound data produced from university trials and other reliable sources. Varieties should be chosen based on multiple years of data (yield, pest resistance, grain and forage nutritive value and maturity). High yields over multiple years and multiple locations demonstrate a variety’s ability to perform well over diverse environmental factors. Stable yield performance of quality grain or forage is the best variety selection tool. It is important to consider decreasing yield over a two or three year time frame, which may reflect a change in disease and/or insect resistance. When selecting a variety for the 2011-12 season, producers need to consider the results from the 2010-11 season, recognizing the unusually dry, hot conditions that impacted yield and quality. We strongly encourage producers to look at multiple year averages, where available, and to look at numerous relevant variety trial locations.
1

Interpreting the Data: Forage yield, grain yield and test weight, at each location have been statistically analyzed using recommended procedures. The statistical analysis provides the mean, coefficient of variation (CV), and LSD values. It is important to note these statistical values to prevent misinterpretation of the data. The mean is another term for the average. Therefore, a mean yield is the average of all plots for each variety within a trial. The CV value, expressed as a percentage, indicates the level of unexplained variability present within the trial. A high CV value indicates a lot of variability existed within the trial not related to normal variations that might be expected between the varieties in the test. This variability may be the result from non-uniform stands, non-uniform insect or disease pressure, variability in harvesting, or other issues. High CV values indicate a great deal of variation due to factors other than the genetic variation between varieties. Readers should be aware when CV values are above 25% (for forage yields). These high CV values should cause concerns regarding the validity of the data as a true representation of varietal performance. The CV values for forage trials are much higher than those of grain trials due to the added variation of harvesting plants multiple times throughout the growing season and the different growth habits between varieties. The LSD value is a numeric range to help the reader determine if the varieties performed differently from each other within the trial. If the LSD value is 300 lb/ac in a trial in which Variety A yielded 1500 lb/ac and Variety B yielded 1150 lb/ac, then Variety A is said to be significantly better. In a trial with an LSD value of 300 lb/ac at a 0.05 (or 5%) level, the statistical inference is that Variety A would yield better than Variety B in 19 out of 20 trials conducted in which there was a 300 lb difference in yield. In this hypothetical comparison, you might have a 20th trial with a 300 lb/ac difference where there is not truly a difference between Variety A and B, but random chance caused the 300 lb difference.
2

Texas Regional Map
Legend: Texas High Plains Texas Rolling Plains Texas Blacklands and East Texas South Texas
3

2011 Texas Region Overview
Texas Blacklands: The Texas Blacklands this past growing season gave many challenges to forage producers. Inconsistent rainfall from September to May was one of the biggest challenges. Yield was lower than expected for all varieties tested within this region. In addition to the drought, freezing temperatures on February 3-4 had a significant impact on forage yield. Texas High Plains: Unfortunately, 2011 will go down as one of the driest years on record for the region. Much of the dryland wheat acreage throughout the area was not harvested for grain due to the drought. Dryland grazing yield was limited based on poor stands early in the growing season. Irrigated forage yield was also reduced. Many producers quit watering wheat early in order to concentrate their irrigation water on establishing corn or cotton. Insect infestation and disease infection were low throughout most of the region, although wheat streak mosaic and barley yellow dwarf disease could be found in some fields. A few low lying fields in the southwest panhandle was damaged by freezing temperatures.
Texas Rolling Plains: A severe drought was observed in the Texas Rolling Plains this year. Isolated rains allowed for some early planting and grazing but much of the area was planted dry with the anticipation of rain. Limited winter precipitation allowed for some emergence, but heat and drought resulted in limited fields being harvested for grain with poor yield. Irrigated yield was also reduced by heat and drought. South Texas: Forage producers in South Texas, like the rest of the state, had extremely dry conditions. Below normal rainfall was persistent throughout the entire growing season. Poor stands in dryland fields lead to poor grazing potential. Fields planted in September for fall forage performed respectively due to early rainfalls and subsequent crop establishment. Later emerging fields were severely damaged by the freeze in February.
4

Forage Trial Agronomic Data
Location1 Yield Limiting
Issues Planting
Date Fertilizer
(Total) Pesticide Applied
Pesticide Application
Date (lb N/a)
Bushland Above Average Temperatures 9/15/2010 none none -
Clifton Drought and Heat Stressed 9/30/2010 70 Huskie 2/15/2011
College Station –
Agronomy2
Above Average Temperatures 9/21/2010 140 Huskie 2/16/2011
College Station –
Beef Center
Severe Drought Stressed 9/21/2010 100 Huskie 2/16/2011
Delta County Uneven Stands 9/30/2010 100 Amber 9/30/2010
McGregor Drought and Heat Stressed 9/30/2010 110 Huskie 2/15/2011
Millersview Severe Drought
Stressed; Data Not Shown
9/28/2010 90 none -
Overton Above Average Temperatures 9/22/2010 225 Glean 11/4/2010
Vernon2 Severe Drought 9/21/2010 80 none -
1These locations were planted with a seeding rate of 90 lb/a, under conventionally tilled field conditions. Bushland was the only location planted with a seeding rate of 60 lb/a. All seed was treated with Gaucho XT at a rate of 3.4 oz/cwt.
2College Station-Agronomy and Vernon were the only locations that were irrigated. College Station required an additional 1.5 inches of supplemental irrigation, while Vernon only applied 0.5” for stand establishment.
5
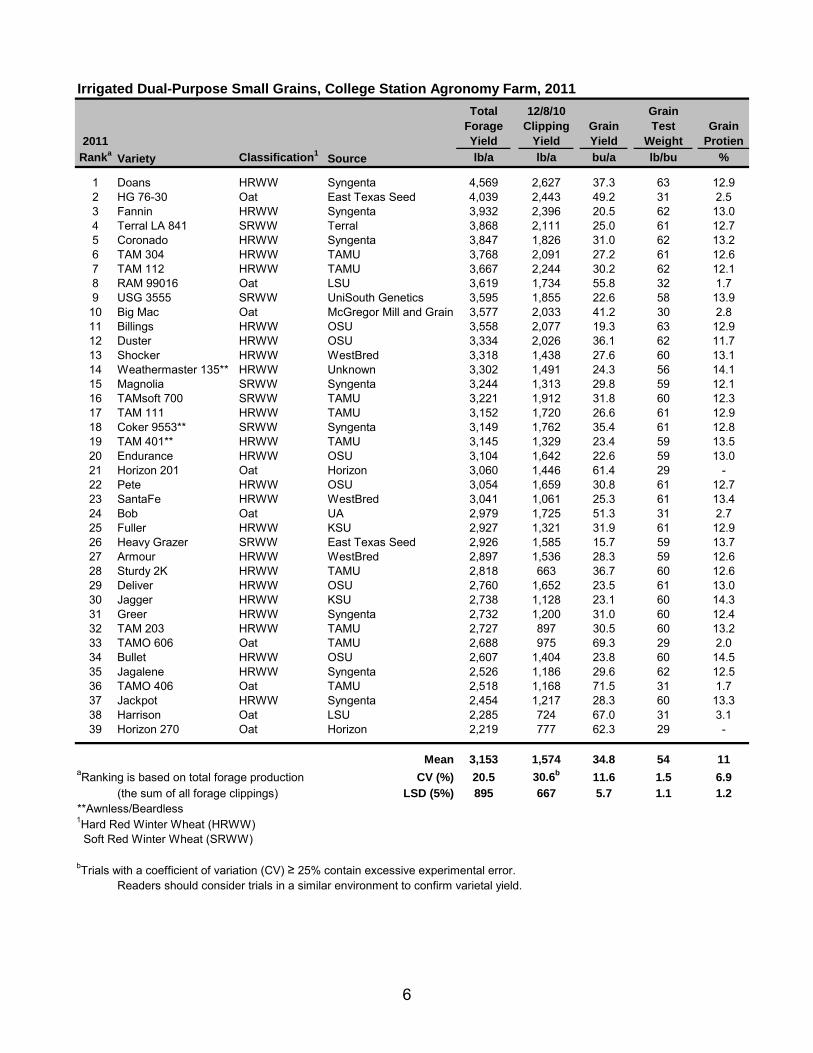
Irrigated Dual-Purpose Small Grains, College Station Agronomy Farm, 2011
2011
Total Forage Yield
12/8/10 Clipping
Yield Grain Yield
Grain Test
WeightGrain
ProtienRanka Variety Classification1 Source lb/a lb/a bu/a lb/bu %
1 Doans HRWW Syngenta 4,569 2,627 37.3 63 12.92 HG 76-30 Oat East Texas Seed 4,039 2,443 49.2 31 2.53 Fannin HRWW Syngenta 3,932 2,396 20.5 62 13.04 Terral LA 841 SRWW Terral 3,868 2,111 25.0 61 12.75 Coronado HRWW Syngenta 3,847 1,826 31.0 62 13.26 TAM 304 HRWW TAMU 3,768 2,091 27.2 61 12.67 TAM 112 HRWW TAMU 3,667 2,244 30.2 62 12.18 RAM 99016 Oat LSU 3,619 1,734 55.8 32 1.79 USG 3555 SRWW UniSouth Genetics 3,595 1,855 22.6 58 13.910 Big Mac Oat McGregor Mill and Grain 3,577 2,033 41.2 30 2.811 Billings HRWW OSU 3,558 2,077 19.3 63 12.912 Duster HRWW OSU 3,334 2,026 36.1 62 11.713 Shocker HRWW WestBred 3,318 1,438 27.6 60 13.114 Weathermaster 135** HRWW Unknown 3,302 1,491 24.3 56 14.115 Magnolia SRWW Syngenta 3,244 1,313 29.8 59 12.116 TAMsoft 700 SRWW TAMU 3,221 1,912 31.8 60 12.317 TAM 111 HRWW TAMU 3,152 1,720 26.6 61 12.918 Coker 9553** SRWW Syngenta 3,149 1,762 35.4 61 12.819 TAM 401** HRWW TAMU 3,145 1,329 23.4 59 13.520 Endurance HRWW OSU 3,104 1,642 22.6 59 13.021 Horizon 201 Oat Horizon 3,060 1,446 61.4 29 -22 Pete HRWW OSU 3,054 1,659 30.8 61 12.723 SantaFe HRWW WestBred 3,041 1,061 25.3 61 13.424 Bob Oat UA 2,979 1,725 51.3 31 2.725 Fuller HRWW KSU 2,927 1,321 31.9 61 12.926 Heavy Grazer SRWW East Texas Seed 2,926 1,585 15.7 59 13.727 Armour HRWW WestBred 2,897 1,536 28.3 59 12.628 Sturdy 2K HRWW TAMU 2,818 663 36.7 60 12.629 Deliver HRWW OSU 2,760 1,652 23.5 61 13.030 Jagger HRWW KSU 2,738 1,128 23.1 60 14.331 Greer HRWW Syngenta 2,732 1,200 31.0 60 12.432 TAM 203 HRWW TAMU 2,727 897 30.5 60 13.233 TAMO 606 Oat TAMU 2,688 975 69.3 29 2.034 Bullet HRWW OSU 2,607 1,404 23.8 60 14.535 Jagalene HRWW Syngenta 2,526 1,186 29.6 62 12.536 TAMO 406 Oat TAMU 2,518 1,168 71.5 31 1.737 Jackpot HRWW Syngenta 2,454 1,217 28.3 60 13.338 Harrison Oat LSU 2,285 724 67.0 31 3.139 Horizon 270 Oat Horizon 2,219 777 62.3 29 -
Mean 3,153 1,574 34.8 54 11aRanking is based on total forage production CV (%) 20.5 30.6b 11.6 1.5 6.9
(the sum of all forage clippings) LSD (5%) 895 667 5.7 1.1 1.2**Awnless/Beardless1Hard Red Winter Wheat (HRWW) Soft Red Winter Wheat (SRWW)
bTrials with a coefficient of variation (CV) ≥ 25% contain excessive experimental error.Readers should consider trials in a similar environment to confirm varietal yield.
6
2011
Total Forage Yield
Grain Yield
Grain Test
WeightGrain
ProtienRanka Variety Classification1 Source lb/a bu/a lb/bu %
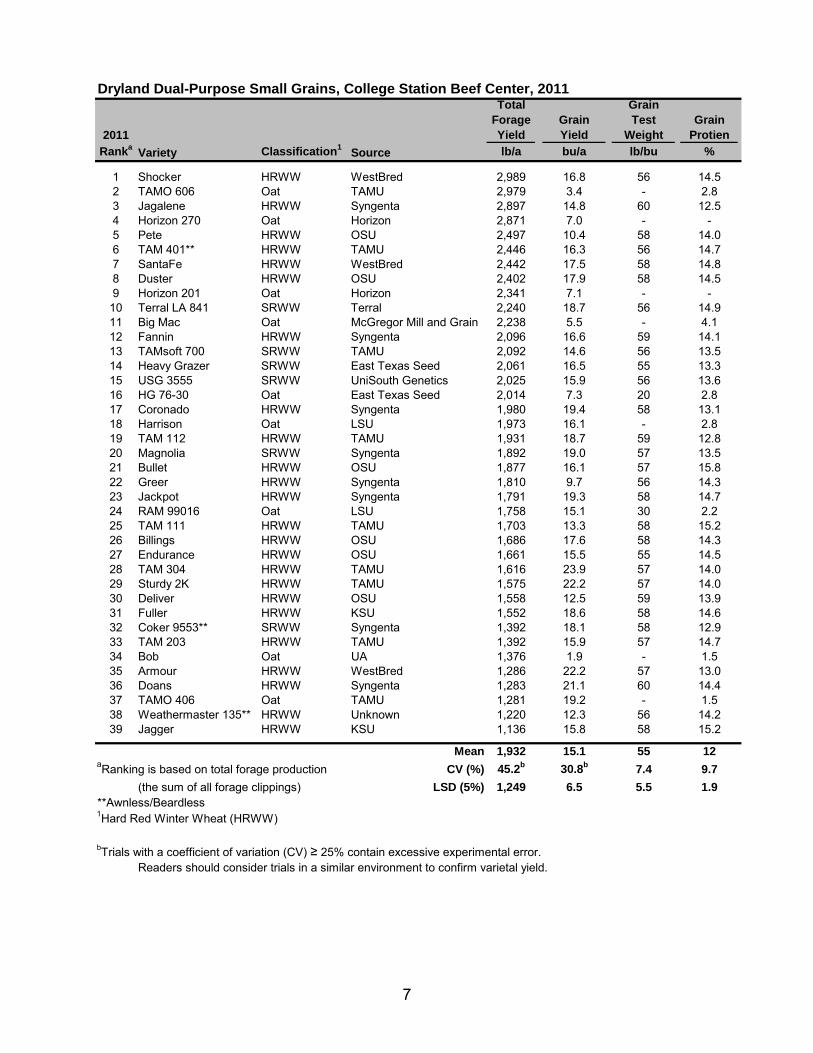
1 Shocker HRWW WestBred 2,989 16.8 56 14.52 TAMO 606 Oat TAMU 2,979 3.4 - 2.83 Jagalene HRWW Syngenta 2,897 14.8 60 12.54 Horizon 270 Oat Horizon 2,871 7.0 - -5 Pete HRWW OSU 2,497 10.4 58 14.06 TAM 401** HRWW TAMU 2,446 16.3 56 14.77 SantaFe HRWW WestBred 2,442 17.5 58 14.88 Duster HRWW OSU 2,402 17.9 58 14.59 Horizon 201 Oat Horizon 2,341 7.1 - -
10 Terral LA 841 SRWW Terral 2,240 18.7 56 14.911 Big Mac Oat McGregor Mill and Grain 2,238 5.5 - 4.112 Fannin HRWW Syngenta 2,096 16.6 59 14.113 TAMsoft 700 SRWW TAMU 2,092 14.6 56 13.514 Heavy Grazer SRWW East Texas Seed 2,061 16.5 55 13.315 USG 3555 SRWW UniSouth Genetics 2,025 15.9 56 13.616 HG 76-30 Oat East Texas Seed 2,014 7.3 20 2.817 Coronado HRWW Syngenta 1,980 19.4 58 13.118 Harrison Oat LSU 1,973 16.1 - 2.819 TAM 112 HRWW TAMU 1,931 18.7 59 12.820 Magnolia SRWW Syngenta 1,892 19.0 57 13.521 Bullet HRWW OSU 1,877 16.1 57 15.822 Greer HRWW Syngenta 1,810 9.7 56 14.323 Jackpot HRWW Syngenta 1,791 19.3 58 14.724 RAM 99016 Oat LSU 1,758 15.1 30 2.225 TAM 111 HRWW TAMU 1,703 13.3 58 15.226 Billings HRWW OSU 1,686 17.6 58 14.327 Endurance HRWW OSU 1,661 15.5 55 14.528 TAM 304 HRWW TAMU 1,616 23.9 57 14.029 Sturdy 2K HRWW TAMU 1,575 22.2 57 14.030 Deliver HRWW OSU 1,558 12.5 59 13.931 Fuller HRWW KSU 1,552 18.6 58 14.632 Coker 9553** SRWW Syngenta 1,392 18.1 58 12.933 TAM 203 HRWW TAMU 1,392 15.9 57 14.734 Bob Oat UA 1,376 1.9 - 1.535 Armour HRWW WestBred 1,286 22.2 57 13.036 Doans HRWW Syngenta 1,283 21.1 60 14.437 TAMO 406 Oat TAMU 1,281 19.2 - 1.538 Weathermaster 135** HRWW Unknown 1,220 12.3 56 14.239 Jagger HRWW KSU 1,136 15.8 58 15.2
Mean 1,932 15.1 55 12aRanking is based on total forage production CV (%) 45.2b 30.8b 7.4 9.7
(the sum of all forage clippings) LSD (5%) 1,249 6.5 5.5 1.9**Awnless/Beardless1Hard Red Winter Wheat (HRWW)
bTrials with a coefficient of variation (CV) ≥ 25% contain excessive experimental error.Readers should consider trials in a similar environment to confirm varietal yield.
Dryland Dual-Purpose Small Grains, College Station Beef Center, 2011
7
2011
Total Forage Yield
Grain Yield
Grain Test
WeightGrain
ProtienRanka Variety Classification1 Source lb/a bu/a lb/bu %
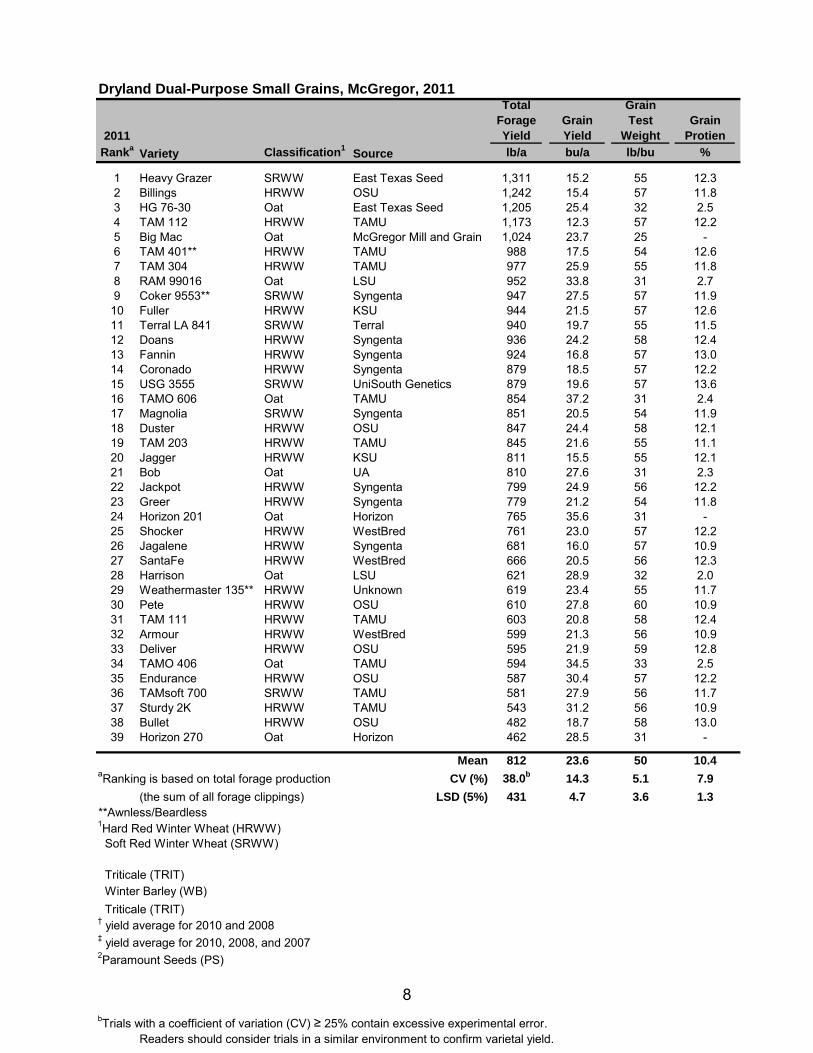
1 Heavy Grazer SRWW East Texas Seed 1,311 15.2 55 12.32 Billings HRWW OSU 1,242 15.4 57 11.83 HG 76-30 Oat East Texas Seed 1,205 25.4 32 2.54 TAM 112 HRWW TAMU 1,173 12.3 57 12.25 Big Mac Oat McGregor Mill and Grain 1,024 23.7 25 -6 TAM 401** HRWW TAMU 988 17.5 54 12.67 TAM 304 HRWW TAMU 977 25.9 55 11.88 RAM 99016 Oat LSU 952 33.8 31 2.79 Coker 9553** SRWW Syngenta 947 27.5 57 11.910 Fuller HRWW KSU 944 21.5 57 12.611 Terral LA 841 SRWW Terral 940 19.7 55 11.512 Doans HRWW Syngenta 936 24.2 58 12.413 Fannin HRWW Syngenta 924 16.8 57 13.014 Coronado HRWW Syngenta 879 18.5 57 12.215 USG 3555 SRWW UniSouth Genetics 879 19.6 57 13.616 TAMO 606 Oat TAMU 854 37.2 31 2.417 Magnolia SRWW Syngenta 851 20.5 54 11.918 Duster HRWW OSU 847 24.4 58 12.119 TAM 203 HRWW TAMU 845 21.6 55 11.120 Jagger HRWW KSU 811 15.5 55 12.121 Bob Oat UA 810 27.6 31 2.322 Jackpot HRWW Syngenta 799 24.9 56 12.223 Greer HRWW Syngenta 779 21.2 54 11.824 Horizon 201 Oat Horizon 765 35.6 31 -25 Shocker HRWW WestBred 761 23.0 57 12.226 Jagalene HRWW Syngenta 681 16.0 57 10.927 SantaFe HRWW WestBred 666 20.5 56 12.328 Harrison Oat LSU 621 28.9 32 2.029 Weathermaster 135** HRWW Unknown 619 23.4 55 11.730 Pete HRWW OSU 610 27.8 60 10.931 TAM 111 HRWW TAMU 603 20.8 58 12.432 Armour HRWW WestBred 599 21.3 56 10.933 Deliver HRWW OSU 595 21.9 59 12.834 TAMO 406 Oat TAMU 594 34.5 33 2.535 Endurance HRWW OSU 587 30.4 57 12.236 TAMsoft 700 SRWW TAMU 581 27.9 56 11.737 Sturdy 2K HRWW TAMU 543 31.2 56 10.938 Bullet HRWW OSU 482 18.7 58 13.039 Horizon 270 Oat Horizon 462 28.5 31 -
Mean 812 23.6 50 10.4aRanking is based on total forage production CV (%) 38.0b 14.3 5.1 7.9
(the sum of all forage clippings) LSD (5%) 431 4.7 3.6 1.3**Awnless/Beardless1Hard Red Winter Wheat (HRWW) Soft Red Winter Wheat (SRWW)
Triticale (TRIT) Winter Barley (WB) Triticale (TRIT)† yield average for 2010 and 2008‡ yield average for 2010, 2008, and 20072Paramount Seeds (PS)
Dryland Dual-Purpose Small Grains, McGregor, 2011
bTrials with a coefficient of variation (CV) ≥ 25% contain excessive experimental error.Readers should consider trials in a similar environment to confirm varietal yield.
8

20112011
Totala2011
First ClipRank Variety Classification1 Source 12/2/10
1 Greer HRWW Syngenta 4,228 1,4712 Endurance HRWW OSU 3,910 1,5033 Hatcher HRWW CSU 3,699 1,3594 TAM 111 HRWW TAMU 3,644 1,4555 TAM 203 HRWW Syngenta 3,621 1,2316 Jackpot HRWW Syngenta 3,472 1,1997 Duster HRWW OSU 3,248 1,3438 TAM 304 HRWW TAMU 3,151 5449 TAM 112 HRWW TAMU 3,150 92710 TAM 111 (2x seeding rate*) HRWW TAMU 3,123 1,15111 Trical 348 TRIT Syngenta 2,903 1,23112 TAM 401** HRWW Syngenta 2,883 54413 Walken Oat UK2 2,740 38414 Weathermaster 135** HRWW Unknown 2,498 560
Mean 3,305 1,065aTotal forage is the sum of all forage clippings CV (%) 28.6b 21.9*120 lbs/a LSD (5%) 1,467 391**Awnless/Beardless1Hard Red Winter Wheat (HRWW) Triticale (TRIT)2University of Kentucky
bTrials with a coefficient of variation (CV) ≥ 25% contain excessive experimental error.Readers should consider trials in a similar environment to confirm varietal yield.
Dry Matter Yield (lb/a)
Forage Trial; Bushland, Dryland, 2011
9
20112011
Totala2011
First ClipRank Variety Classification1 Source 3/3/11
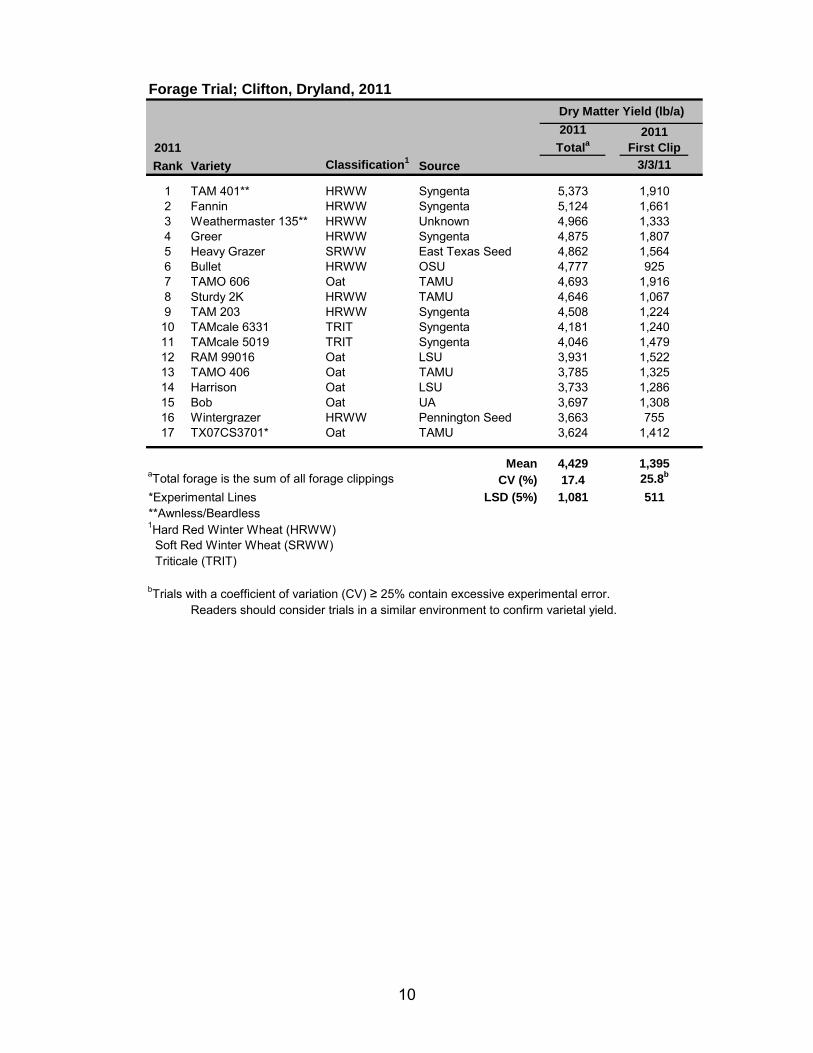
1 TAM 401** HRWW Syngenta 5,373 1,9102 Fannin HRWW Syngenta 5,124 1,6613 Weathermaster 135** HRWW Unknown 4,966 1,3334 Greer HRWW Syngenta 4,875 1,8075 Heavy Grazer SRWW East Texas Seed 4,862 1,5646 Bullet HRWW OSU 4,777 9257 TAMO 606 Oat TAMU 4,693 1,9168 Sturdy 2K HRWW TAMU 4,646 1,0679 TAM 203 HRWW Syngenta 4,508 1,22410 TAMcale 6331 TRIT Syngenta 4,181 1,24011 TAMcale 5019 TRIT Syngenta 4,046 1,47912 RAM 99016 Oat LSU 3,931 1,52213 TAMO 406 Oat TAMU 3,785 1,32514 Harrison Oat LSU 3,733 1,28615 Bob Oat UA 3,697 1,30816 Wintergrazer HRWW Pennington Seed 3,663 75517 TX07CS3701* Oat TAMU 3,624 1,412
Mean 4,429 1,395aTotal forage is the sum of all forage clippings CV (%) 17.4 25.8b
*Experimental Lines LSD (5%) 1,081 511**Awnless/Beardless1Hard Red Winter Wheat (HRWW) Soft Red Winter Wheat (SRWW) Triticale (TRIT)
bTrials with a coefficient of variation (CV) ≥ 25% contain excessive experimental error.Readers should consider trials in a similar environment to confirm varietal yield.
Dry Matter Yield (lb/a)
Forage Trial; Clifton, Dryland, 2011
10

2011 2011
Totala2011
First Clip2 Year †
Mean 2 Year†
First ClipRank Variety Classification1 Source 12/8/10
1 TAMbar 501 WB TAMU 7,129 1,295 - -2 Pennbar 66 WB Penn State 6,652 1,829 9,495 1,5363 P-919** WB Paramount Seeds 6,459 2,444 10,403 2,2834 TAMO 606 Oat TAMU 6,411 1,602 7,110 1,2385 Sturdy 2K HRWW TAMU 6,281 2,089 6,677 1,3956 TX06V7266* HRWW TAMU 6,103 2,164 - -7 TX05A001188* HRWW TAMU 5,988 2,024 - -8 TX05CS347-1* Oat TAMU 5,708 1,572 8,322 1,3209 TX07CS3697* Oat TAMU 5,596 2,051 6,820 1,523
10 TX06A001263* HRWW TAMU 5,494 1,682 6,852 1,13811 TAMcale 6331 TRIT Syngenta 5,249 2,087 7,952 1,74312 Fannin HRWW Syngenta 5,127 2,232 6,444 1,51213 Heavy Grazer SRWW East Texas Seed 5,085 1,553 - -14 TAM 401 HRWW Syngenta 5,042 2,040 5,934 1,60715 RAM 99016 Oat LSU 5,022 2,167 16 TAMO 406 Oat TAMU 5,002 1,301 7,701 1,18117 TX05CS542* Oat TAMU 4,996 2,062 8,369 2,00718 Weathermaster 135** HRWW Unknown 4,942 1,648 6,825 1,37119 TX06A001281* HRWW TAMU 4,919 1,725 - -20 TAMcale 5019 TRIT Syngenta 4,851 1,434 7,790 1,40921 TAM 203 HRWW Syngenta 4,841 1,459 6,634 1,19022 TAMsoft 700 SRWW TAMU 4,708 2,105 - -23 Harrison Oat LSU 4,700 1,300 - -24 Maton II Rye Noble Foundation 4,452 1,243 - -25 TX07CS2783* Oat TAMU 4,425 1,190 - -26 Bob Oat UA 4,395 1,583 - -
Mean 5,368 1,765 7,555 1,497aTotal forage is the sum of all forage clippings CV (%) 17.9 39.1 b 24.4 41.7b
*Experimental Lines LSD (5%) 1,353 972 2,096 776**Awnless/Beardless 1Hard Red Winter Wheat (HRWW) Soft Red Winter Wheat (SRWW) Triticale (TRIT) Winter Barley (WB) Triticale (TRIT) †Forage average for 2011 and 2010
bTrials with a coefficient of variation (CV) ? 25% contain excessive experimental error.Readers should consider trials in a similar environment to confirm varietal yield.
Dry Matter Yield (lb/a)
Forage Trial; College Station Agronomy Research Farm, Irrigated, 2011
11

2011 2011
Totala2011
First ClipRank Variety Classification1 Source 12/8/10
1 Fannin HRWW Syngenta 6,043 1,790 2 TX05CS556* Oat TAMU 5,614 2,675 3 TX05CS542* Oat TAMU 5,600 2,815 4 TX07CS1066* Oat TAMU 5,592 2,745 5 TX07CS3697* Oat TAMU 5,264 2,709 6 TAMsoft 700 SRWW TAMU 5,205 1,906 7 Bob Oat UA 5,080 2,324 8 Sturdy 2K HRWW TAMU 5,073 1,991 9 TAMO 406 Oat TAMU 4,841 1,884
10 Heavy Grazer SRWW East Texas Seed 4,828 1,547 11 Terral LA 841 SRWW Terral Seed 4,799 1,690 12 TAM 203 HRWW Syngenta 4,527 1,350 13 TAMcale 6331 TRIT Syngenta 4,519 1,740 14 RAM 99016 Oat LSU 4,505 1,717 15 TAM 401 HRWW Syngenta 4,244 1,381 16 Harrison Oat LSU 4,139 1,479 17 TAMO 606 Oat TAMU 4,095 1,584 18 TX09CS1112* Oat TAMU 4,046 1,815 19 Elbon Rye Noble Foundation 3,998 1,192 20 Weathermaster 135** HRWW Unknown 3,812 1,251 21 USG 3555 SRWW UniSouth Genetics 3,778 1,265 22 TAMcale 5019 TRIT Syngenta 3,731 1,727 23 TX05CS347-1* Oat TAMU 3,409 1,501 24 Coker 9700 SRWW Syngenta 3,357 1,299 25 TX07CS1056* Oat TAMU 3,291 1,487
Mean 4,535 1,795 aTotal forage is the sum of all forage clippings CV (%) 20.9 37.8 b *Experimental Lines LSD (5%) 1,336 963 **Awnless/Beardless 1Hard Red Winter Wheat (HRWW) Soft Red Winter Wheat (SRWW) Triticale (TRIT) Winter Barley (WB)
bTrials with a coefficient of variation (CV) ? 25% contain excessive experimental error. Readers should consider trials in a similar environment to confirm varietal yield.
Dry Matter Yield (lb/a)
Forage Trial; College Station Beef Center, Dryland, 2011
12
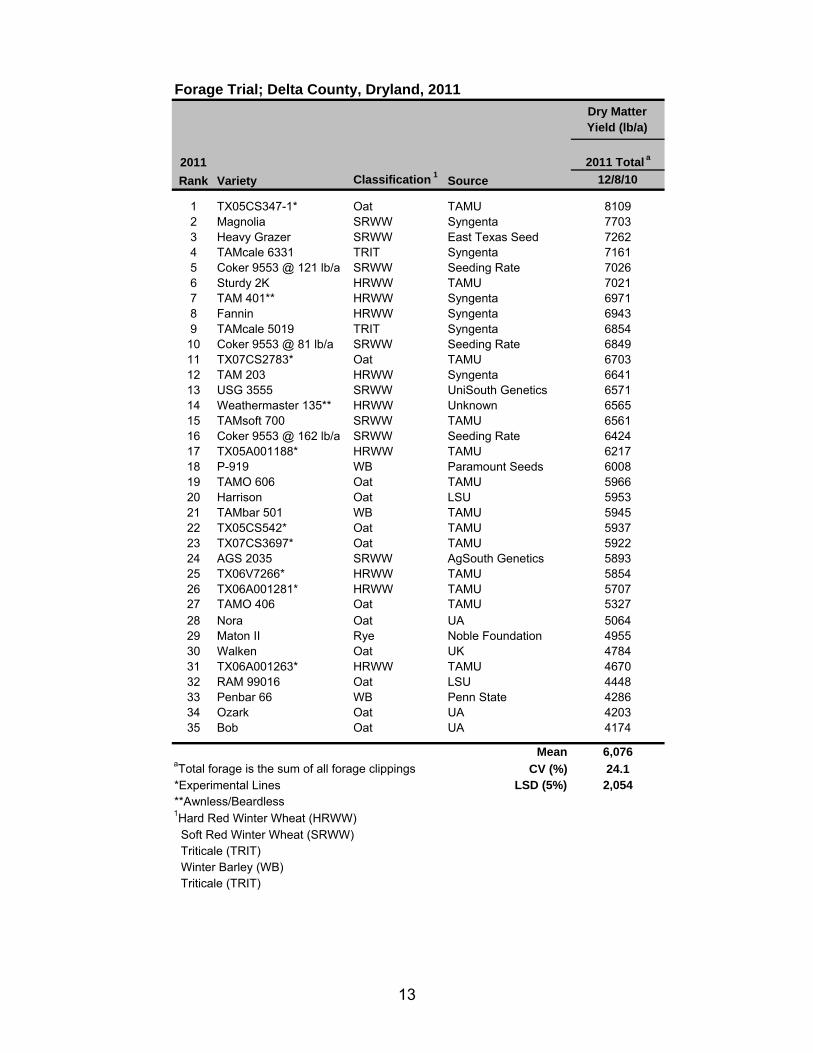
2011 2011 Total a
Rank Variety Classification 1 Source 12/8/10
1 TX05CS347-1* Oat TAMU 8109 2 Magnolia SRWW Syngenta 7703 3 Heavy Grazer SRWW East Texas Seed 7262 4 TAMcale 6331 TRIT Syngenta 7161 5 Coker 9553 @ 121 lb/a SRWW Seeding Rate 7026 6 Sturdy 2K HRWW TAMU 7021 7 TAM 401** HRWW Syngenta 6971 8 Fannin HRWW Syngenta 6943 9 TAMcale 5019 TRIT Syngenta 6854
10 Coker 9553 @ 81 lb/a SRWW Seeding Rate 6849 11 TX07CS2783* Oat TAMU 6703 12 TAM 203 HRWW Syngenta 6641 13 USG 3555 SRWW UniSouth Genetics 6571 14 Weathermaster 135** HRWW Unknown 6565 15 TAMsoft 700 SRWW TAMU 6561 16 Coker 9553 @ 162 lb/a SRWW Seeding Rate 6424 17 TX05A001188* HRWW TAMU 6217 18 P-919 WB Paramount Seeds 6008 19 TAMO 606 Oat TAMU 5966 20 Harrison Oat LSU 5953 21 TAMbar 501 WB TAMU 5945 22 TX05CS542* Oat TAMU 5937 23 TX07CS3697* Oat TAMU 5922 24 AGS 2035 SRWW AgSouth Genetics 5893 25 TX06V7266* HRWW TAMU 5854 26 TX06A001281* HRWW TAMU 5707 27 TAMO 406 Oat TAMU 5327 28 Nora Oat UA 5064 29 Maton II Rye Noble Foundation 4955 30 Walken Oat UK 4784 31 TX06A001263* HRWW TAMU 4670 32 RAM 99016 Oat LSU 4448 33 Penbar 66 WB Penn State 4286 34 Ozark Oat UA 4203 35 Bob Oat UA 4174
Mean 6,076 aTotal forage is the sum of all forage clippings CV (%) 24.1 *Experimental Lines LSD (5%) 2,054 **Awnless/Beardless 1Hard Red Winter Wheat (HRWW) Soft Red Winter Wheat (SRWW) Triticale (TRIT) Winter Barley (WB) Triticale (TRIT)
Dry Matter Yield (lb/a)
Forage Trial; Delta County, Dryland, 2011
13

2011 2011
Totala2011
First ClipRank Variety Classification 1 Source 3/3/11
1 Fannin HRWW Syngenta 5,841 3,0592 P-919** WB Paramount Seeds 5,705 2,8233 TAMbar 501 WB TAMU 5,705 1,3004 TX05A001188* HRWW TAMU 5,528 2,1285 Sturdy 2K HRWW TAMU 5,463 1,6266 Heavy Grazer SRWW East Texas Seed 5,257 2,6867 Maton II Rye Noble Foundation 4,977 2,7218 TAM 203 HRWW Syngenta 4,920 2,0069 Penbar 66 WB Penn State 4,868 1,771
10 TX06V7266* Wheat TAMU 4,864 1,75311 TX06A001281* HRWW TAMU 4,806 1,53712 TX06A001263* HRWW TAMU 4,734 1,77113 Weathermaster 135** HRWW Unknown 4,666 1,80714 TAMsoft 700 SRWW TAMU 4,625 1,98015 TAMcale 6331 TRIT Syngenta 4,550 1,96216 TAMcale 5019 TRIT Syngenta 4,508 2,29317 TAM 401** HRWW Syngenta 4,391 2,07718 Harrison Oat LSU 3,943 1,96219 TX05CS347-1* Oat TAMU 3,694 1,62720 Bob Oat UA 3,530 1,25821 RAM 99016 Oat LSU 3,378 1,35122 TAMO 406 Oat TAMU 3,179 947 23 TAMO 606 Oat TAMU 3,164 1,14924 TX07CS3697* Oat TAMU 3,149 1,45125 TX05CS542* Oat TAMU 2,529 1,08726 TX07CS2783* Oat TAMU 2,120 505
Mean 4,388 1,794aTotal forage is the sum of all forage clippings CV (%) 19.6 42.2 b*Experimental Lines LSD (5%) 1,209 1,066**Awnless/Beardless 1Hard Red Winter Wheat (HRWW) Soft Red Winter Wheat (SRWW) Triticale (TRIT) Winter Barley (WB)
bTrials with a coefficient of variation (CV) ? 25% contain excessive experimental error. Readers should consider trials in a similar environment to confirm varietal yield.
Dry Matter Yield (lb/a)
Forage Trial; McGregor, Dryland, 2011
14

20112011
Totala2011
First Clip2 Year Mean†
2 Year First Clip†
Rank Variety Source 12/6/10
1 TAMO 606 TAMU 5,893 1,440 5,429 8982 TX05CS3347-1* TAMU 5,662 1,357 6,024 1,0883 Ozark UA 5,527 1,442 5,370 9164 Heavy Grazer 76-30 East Texas Seed 5,433 1,615 5,225 8305 TX07CS3701* TAMU 5,410 1,271 - -6 Harrison LSU 5,367 1,311 5,836 1,5427 Nora UA 5,356 1,237 4,905 1,3368 RAM 99016 LSU 5,343 1,390 5,444 9949 TX05CS542* TAMU 5,331 1,485 5,359 1,31410 LA03063-S4* LSU 5,231 1,767 - -11 TX07CS2783* TAMU 5,200 1,176 5,460 1,19112 TX07CS3697* TAMU 5,129 1,848 5,237 1,13713 LA05006-65S1* LSU 4,978 1,436 5,678 1,41514 TAMO 406 TAMU 4,830 1,273 5,183 99615 Bob UA 4,830 1,375 4457 1,20116 Walken Justin Seed Company 4,690 1,194 4,785 78017 07-LFWH* - 4,675 1,905 - -18 F10522-92-S1* UF 4,446 1,362 4,664 950
Mean 5,185 1,438 5,270 1,106aTotal forage is the sum of all forage clippings CV (%) 13.0 18.0*Experimental Lines LSD (5%) 821 309† Forage average for 2011 and 2010
Dry Matter Yield (lb/a)
Oat Forage Trial; Overton, Dryland, 2011
15

20112011
Totala2011
First Clip2 Year Mean†
2 Year First Clip†
Rank Variety Classification1 Source 12/6/10
1 NF 95319B* RYE Noble Foundation 6,207 3,070 - -2 Elbon RYE Noble Foundation 6,141 2,330 - -3 NF 95307A* RYE Noble Foundation 5,724 2,479 6,475 1,7584 Bates RS4 RYE Noble Foundation 5,721 2,605 5,765 1,5095 Maton II RYE Noble Foundation 5,440 1,888 6,100 1,5086 TAMbar 501 WB TAMU 5,430 2,067 - -7 Fannin HRWW Syngneta 5,241 1,641 5,090 1,1978 TX06A001281* HRWW TAMU 5,188 1,277 - -9 TAMsoft 700 SRWW TAMU 5,144 1,440 5,257 1,15310 Pennbar 66 WB Penn State 5,016 1,664 5,824 1,01411 P-919** WB Paramount Seed 5,006 1,983 4,976 1,22212 TAMcale 5019 TRIT TAMU 4,667 1,346 5,234 76013 Coker 9553 SRWW Syngneta 4,526 717 4,873 51114 USG 3555 SRWW UniSouth Genetics 4,509 1,382 4,636 1,09815 Magnolia SRWW Syngneta 4,464 1,561 4,827 1,15216 Sturdy 2K HRWW TAMU 4,413 1,223 4,884 78117 TAM 113 HRWW TAMU 4,325 1,692 4,564 98818 TAM 401** HRWW TAMU 4,310 1,361 4,702 1,19919 TX06V7266* HRWW TAMU 4,302 1,187 - -20 Ranger SRWW Noble Foundation 4,271 1,376 - -21 05TF 131d TRIT - 4,252 1,344 - -22 TAM 203 HRWW TAMU 4,147 1,139 4,178 72023 Weathermaster 135** HRWW Unknown 4,097 1,454 4,275 89024 Heavy Grazer 73-06 SRWW East Texas Seed 4,091 1,139 4,795 84525 TX05A001188* HRWW TAMU 4,054 1,325 - -26 TX06A001263* HRWW TAMU 4,021 1,490 4,440 1,02727 AGS 2035 SRWW AgSouth Genetics 3,884 1,255 - -28 06TF 148e TRIT - 3,754 1,521 - -29 TAMcale 6331 TRIT TAMU 3,746 521 4,536 48730 MBS 327 SRWW MBS Seeds 3,708 866 4,039 643
Mean 4,660 1,545 4,973 1,023aTotal forage is the sum of all forage clippings CV (%) 13.0 21.0*Experimental Lines LSD (5%) 699 380**Awnless/Beardless1Hard Red Winter Wheat (HRWW) Soft Red Winter Wheat (SRWW) Triticale (TRIT) Winter Barley (WB)†Forage average for 2011 and 2010
Dry Matter Yield (lb/a)
Forage Trial; Overton, Dryland, 2011
16

2011 2011
Totala2011
First Clip2 Year Mean †
2 Year First Clip†
Rank Variety Classification1 Source 12/8/10 1 Maton II Rye Noble Foundation 5,274 1,434 - -2 TX05V7259* HRWW TAMU 4,300 977 - -3 TAMcale 6331 TRIT Syngenta 4,112 702 5,821 2,0964 TAMcale 5019 TRIT Syngenta 3,860 613 5,904 2,0515 TX06V7266* HRWW TAMU 3,816 681 - -6 Weathermaster 135** HRWW Unknown 3,809 943 6,368 2,4377 TAM 112 HRWW TAMU 3,785 803 - -8 TX06A001281* HRWW TAMU 3,764 986 - -9 Lockett HRWW TAMU 3,690 694 - -10 Fannin HRWW Syngenta 3,690 789 6,224 2,32011 TAM 113 HRWW TAMU 3,679 1,100 6,346 2,50712 P-919** WB Paramount Seeds 3,641 953 - -13 Harrison Oat LSU 3,576 726 - -14 Heavy Grazer SRWW East Texas Seed 3,523 625 - -15 Bob Oat UA 3,515 879 - -16 TX06A001263* HRWW TAMU 3,483 666 6,090 2,21317 TAMO 406 Oat TAMU 3,483 601 5,889 2,14118 TX05A001188* HRWW TAMU 3,436 666 - -19 TX05CS542* Oat TAMU 3,405 746 5,624 2,26220 TX07CS2783* Oat TAMU 3,399 849 - -21 TX07CS3697* Oat TAMU 3,397 948 5,923 2,37222 TX07CS3701* Oat TAMU 3,392 783 - -23 TX05CS347-1* Oat TAMU 3,340 685 5,568 2,08824 RAM 99016 Oat LSU 3,279 640 6,925 2,12125 Sturdy 2K HRWW TAMU 3,275 810 6,624 2,33826 Pennbar 66 Barley Penn State 3,269 882 - -27 TAM 203 HRWW Syngenta 3,255 547 5,887 2,19128 TAM 401 HRWW Syngenta 3,036 769 6,142 2,44729 TAMO 606 Oat TAMU 2,737 649 5,529 2,01430 TAMbar 501 WB TAMU 2,718 548 5,737 2,018
Mean 3,565 790 6,037 2,226aTotal forage is the sum of all forage clippings CV (%) 21.0 36.2 b *Experimental Lines LSD (5%) 1,050 402 **Awnless/Beardless 1Hard Red Winter Wheat (HRWW) Triticale (TRIT) Winter Barley (WB)†Forage average for 2011 and 2010
bTrials with a coefficient of variation (CV) ? 25% contain excessive experimental error.Readers should consider trials in a similar environment to confirm varietal yield.
Dry Matter Yield (lb/a)
Forage Trial; Vernon, Irrigated, 2011
17

Acknowledgements
The authors of this publication would like to express great appreciation to the generosity of the following companies who donated the seed for this research. Without partners such as these, research like this would not be possible.
18

Educational programs of the Texas AgriLife Extension Service are open to all people without regard to race, color, sex, disability, religion, age, or national origin. The Texas A&M University System, U.S. Department of Agriculture, and County Commissioners Courts of Texas Cooperating.
Issued in furtherance of Cooperative Extension Work in Agriculture and Home Economics, Acts of Congress of May 8, 1914, as amended, and June 30, 1914, in cooperation with the United States Department of Agriculture, Edward G. Smith, Director, Texas AgriLife Extension Service, Texas A&M System.