Screening: The First Step to Finding a Winning Stock · highlight winning stocks ... Make Money in...
29
Screening: The First Step to Finding a Winning Stock John M. Bajkowski [email protected] Vice President, Financial Analyst, AAII 2 Discussion Overview A computerized screening program can be used to locate/analyze stocks in an organized, systematic, and disciplined fashion Discuss screening factors that help to highlight winning stocks Value approach Growth approach AAII Stock Screens
Transcript of Screening: The First Step to Finding a Winning Stock · highlight winning stocks ... Make Money in...
Screening: The First Step to Finding a Winning Stock
John M. [email protected] President, Financial Analyst, AAII
2
Discussion OverviewA computerized screening program can be used to locate/analyze stocks in an organized, systematic, and disciplined fashion
Discuss screening factors that help to highlight winning stocks
Value approach
Growth approach
AAII Stock Screens

3
Stock Selection Strategies
Screening Process Establishing criteria for narrowing a large universe of stocks to a few that might hold promise and warrant further analysis
A computerized screening program can be used to locate/analyze stocks in an organized, systematic, and disciplined fashion
Valuation ProcessIn-depth examination of a company to establish if its stock price reflects a fair value
4
Benefits of Stock Screening
Discover potential investment opportunities you might not have otherwise noticed
Avoid wasting time on companies that don’t meet your basic criteria
Adds a level of discipline to your investingForces you to develop and hone investing parameters
Helps you to think more clearly about your investing style
Helps to keep your emotions in check

5
Pitfalls of Stock ScreeningDependent on the accuracy of the underlying data
Limited mainly to quantitative factorsFactors such as management, brand strength, competitive position, etc. must be evaluated separately
May still be missing good companies that meet most but not all criteria
Introduces you to companies you are not familiar with and that require further analysis
6
Screening Process
Identify stock selection philosophy that fits with time horizon, risk tolerance, analytical skills, and time commitment
Define clear objectives, and construct and refine primary criteria
Construct secondary criteria to determine if companies passed the screen for the right reasons
Even the best screen is only a starting point for further analysis
7
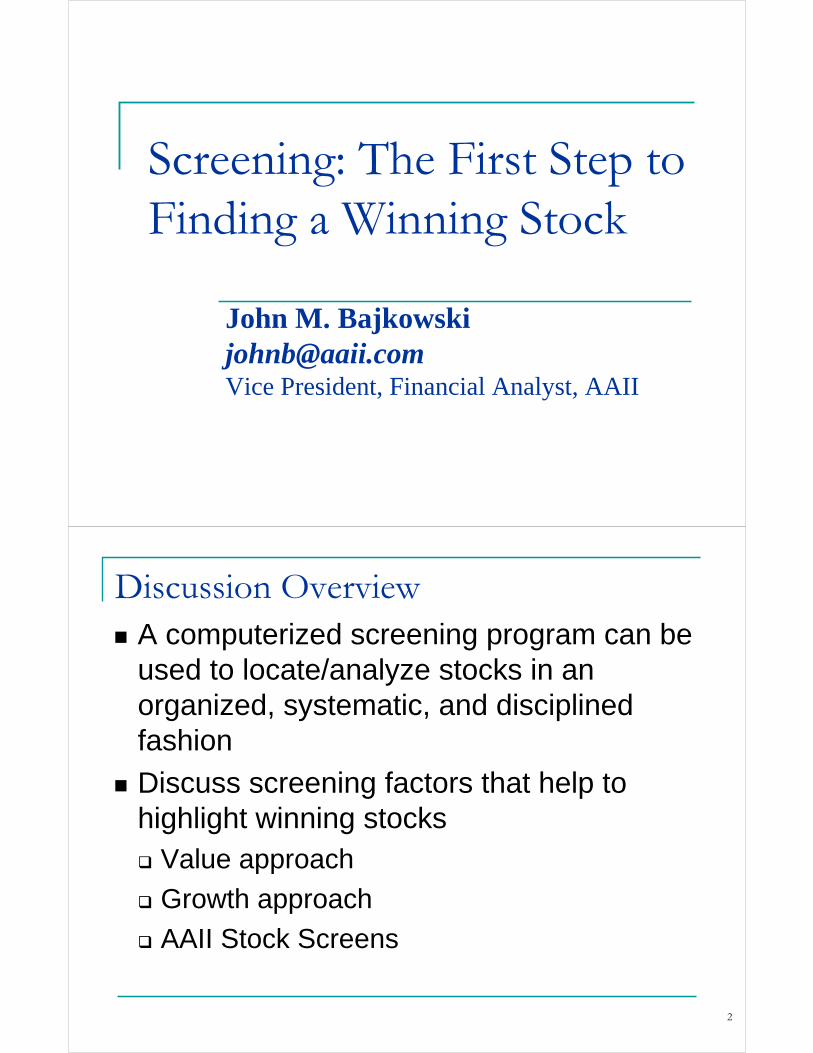
Value GrowthBuy Cheap, Sell Dear
Investors do not always act rationally, often assess information emotionally, creating price distortions that can be exploited
Locate stocks whose market values are low relative to valuation measures such as dividends, earnings, and assets
Horizon: Typically longer term, less need to monitor stocks tick-by-tick
Buy High, Sell Higher
High sales and earnings growth will continue to attract more investors pushing up multiple investors will pay for a stock
Locate companies and industries in stage of rapid and expanding growth with earnings momentum
Horizon: Typically shorter term, typically higher turnover, need to monitor stocks closely
8
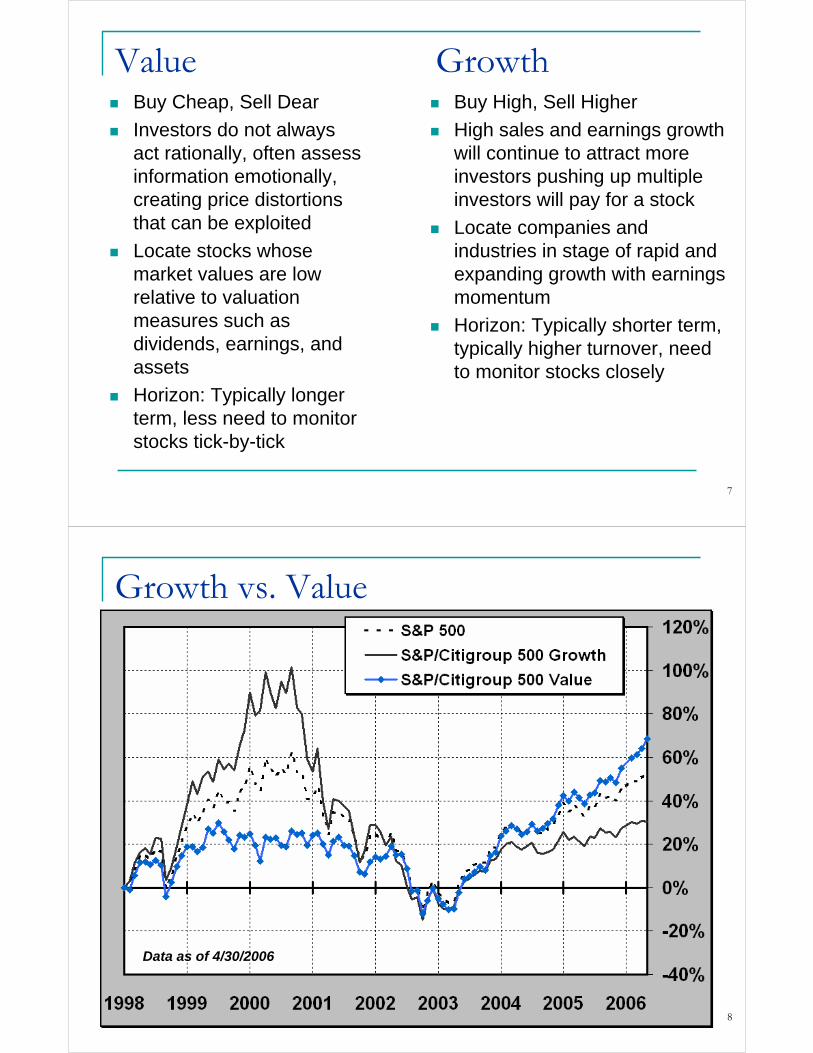
Growth vs. Value
Data as of 4/30/2006

9
Large Cap vs. Small Cap
Data as of 4/30/2006
10
Popular Approaches
AAII Journal and Computerized Investing have examined the characteristics of successful investors
Tracking performance of our interpretation of these approaches in Stock Investor
Companies passing screens and tables detailing results available on AAII Web site within “AAII Stock Screens” segment in the Portfolios section
11
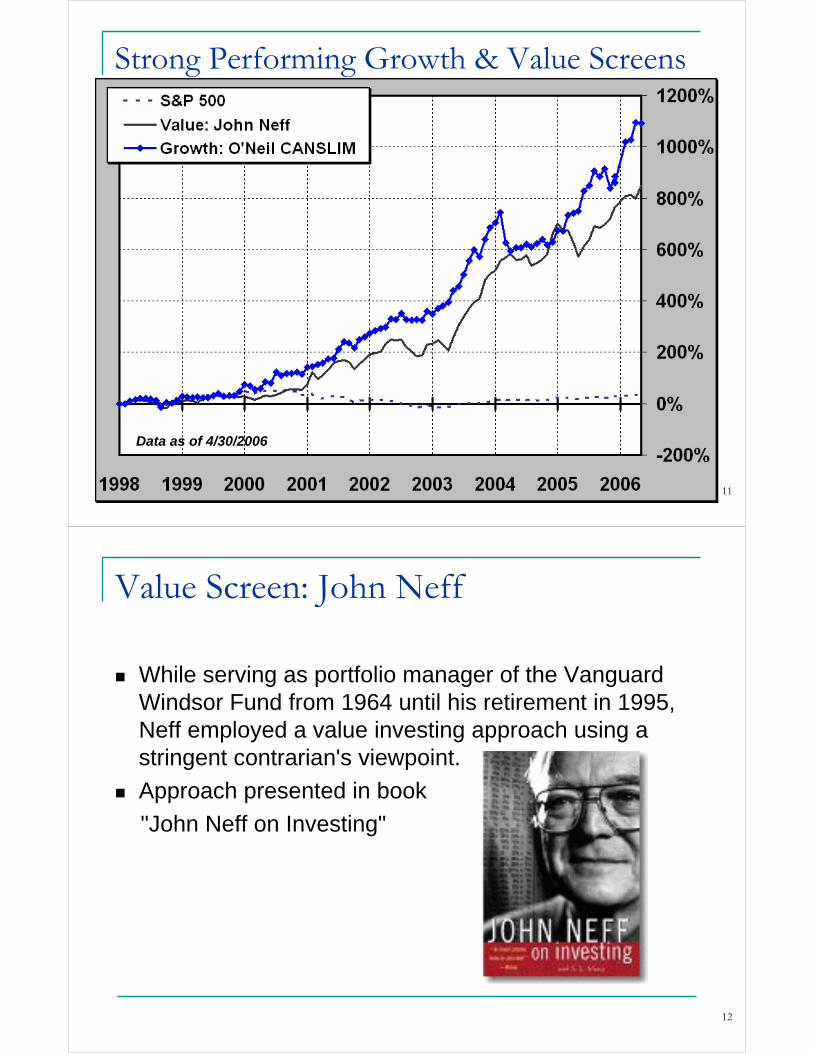
Strong Performing Growth & Value Screens
Data as of 4/30/2006
12
Value Screen: John Neff
While serving as portfolio manager of the Vanguard Windsor Fund from 1964 until his retirement in 1995, Neff employed a value investing approach using a stringent contrarian's viewpoint.
Approach presented in book
"John Neff on Investing"

13
Primary Factor: PEGThe P/E to growth ratio (PEG ratio) is computed by dividing the price-earnings ratio by the earnings growth rate.
Rule of thumb: Ratios below one (<1.0) indicate that a stock may be undervalued, while stocks with ratios above one (>1.0) may be overvalued.Purchase stock with earnings growth prospects that are not fully recognized by the market as measured through the price-earnings ratio.Possible variations:
Future vs. historical earnings growthAdding dividend yield to growth rate
For further info see AAII stock screen “A Combination Approach: Value on the Move”(www.aaii.com/stockscreens/screendata/overview.cfm?screen=Value)
14
P/E Ratio = 10, EPS Growth = 5%PEG = P/E ÷ Growth = 10 ÷ 5 = 2.0
P/E Ratio = 10, EPS Growth = 10%PEG = P/E ÷ Growth = 10 ÷ 10 = 1.0
P/E Ratio = 10, EPS Growth = 10, Yield = 5%Div Adj. PEG = P/E ÷ (Growth + Yield)
= 10 ÷ (10 + 5) = 0.67
www.aaii.com/stockscreens/screendata/overview.cfm?screen=Value

15
Data as of 4/29/2005
16
The ratio of the price-earnings ratio to the sum of the estimated growth in earnings and dividend yield (div-adjusted PEG ratio) is less than or equal to half the median value for the entire database
Current Market PEGAvg: 2.28Median: 1.50Stocks: 2,499
194 firms passing from a total of 8,706 companies
(data as of 5/5/2006)
• Look for “cheapo” stocks with a dividend-adjusted PEG that is noticeably out of line with market or industry benchmarks
17
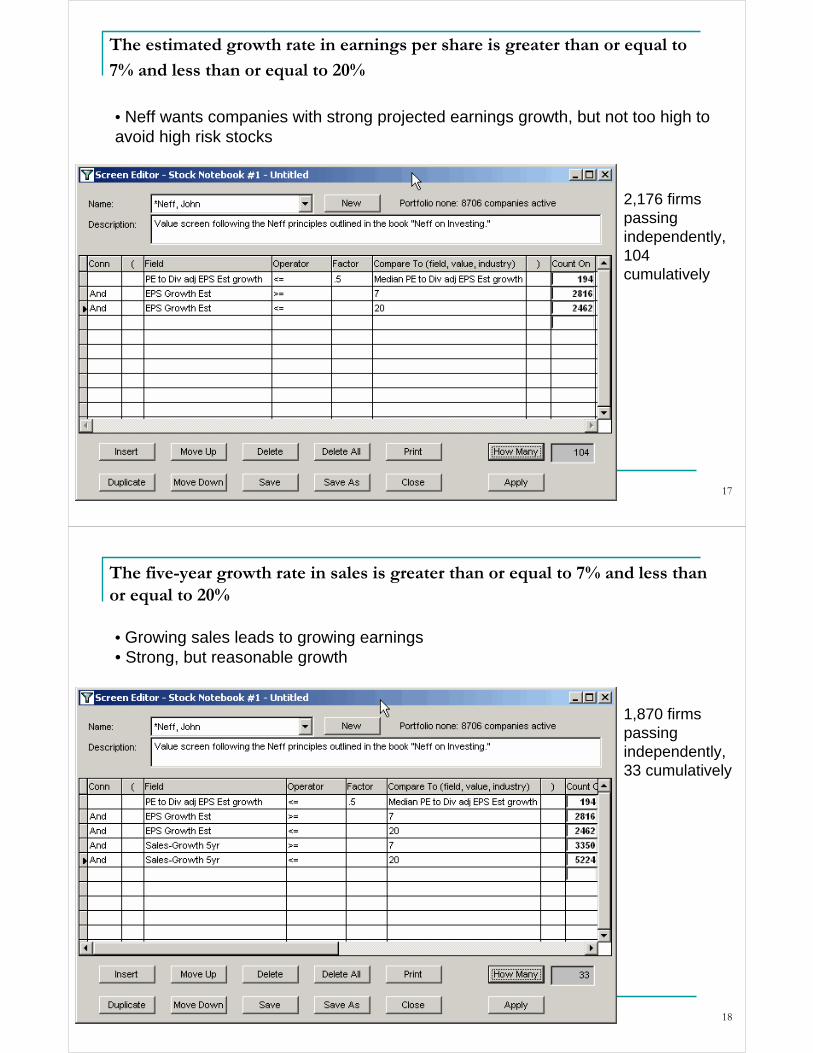
The estimated growth rate in earnings per share is greater than or equal to
7% and less than or equal to 20%
2,176 firms passing independently, 104 cumulatively
• Neff wants companies with strong projected earnings growth, but not too high to avoid high risk stocks
18
The five-year growth rate in sales is greater than or equal to 7% and less than or equal to 20%
1,870 firms passing independently, 33 cumulatively
• Growing sales leads to growing earnings• Strong, but reasonable growth
19
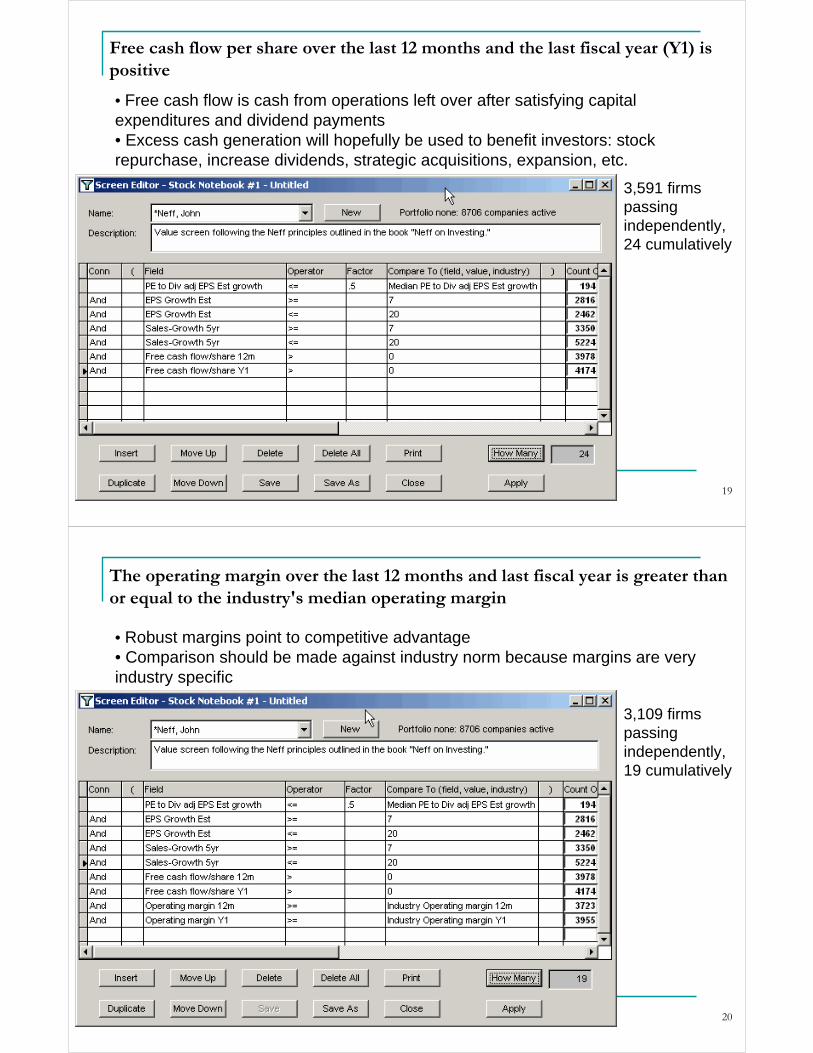
Free cash flow per share over the last 12 months and the last fiscal year (Y1) is positive
3,591 firms passing independently, 24 cumulatively
• Free cash flow is cash from operations left over after satisfying capital expenditures and dividend payments• Excess cash generation will hopefully be used to benefit investors: stock repurchase, increase dividends, strategic acquisitions, expansion, etc.
20
The operating margin over the last 12 months and last fiscal year is greater than or equal to the industry's median operating margin
3,109 firms passing independently, 19 cumulatively
• Robust margins point to competitive advantage• Comparison should be made against industry norm because margins are very industry specific
21
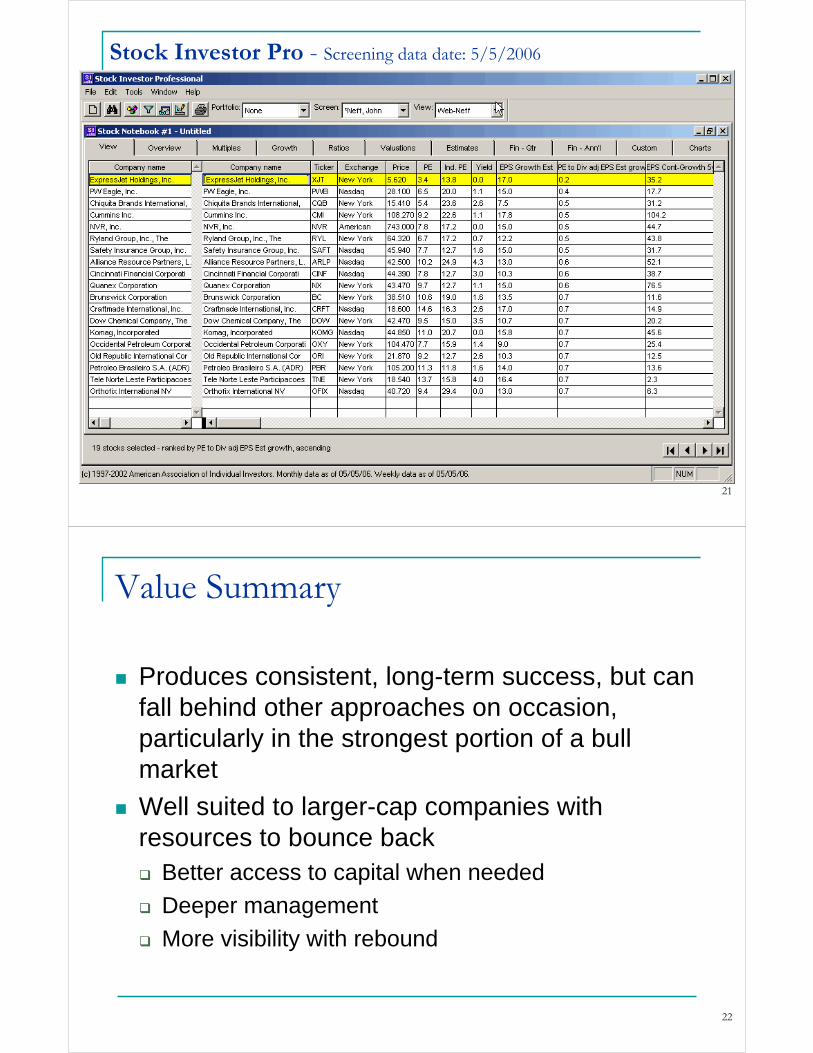
Stock Investor Pro - Screening data date: 5/5/2006
22
Value Summary
Produces consistent, long-term success, but can fall behind other approaches on occasion, particularly in the strongest portion of a bull market
Well suited to larger-cap companies with resources to bounce back
Better access to capital when needed
Deeper management
More visibility with rebound

23
Growth Screen: CAN SLIM
William O’Neil developed his growth stock approach through study of company characteristics prior to their big stock increase
Approach presented in “How to
Make Money in Stocks: A Winning
System in Good Times or Bad”
24
C=Current Quarterly EarningsStrong and improving quarterly EPS performance—at least 18% to 20%
Important to compare a quarter to the same quarter from the previous year
O’Neil looks at earnings from continuing operations
1,232 firms passing from a total of 8,706 companies
(data as of 5/5/2006)
25
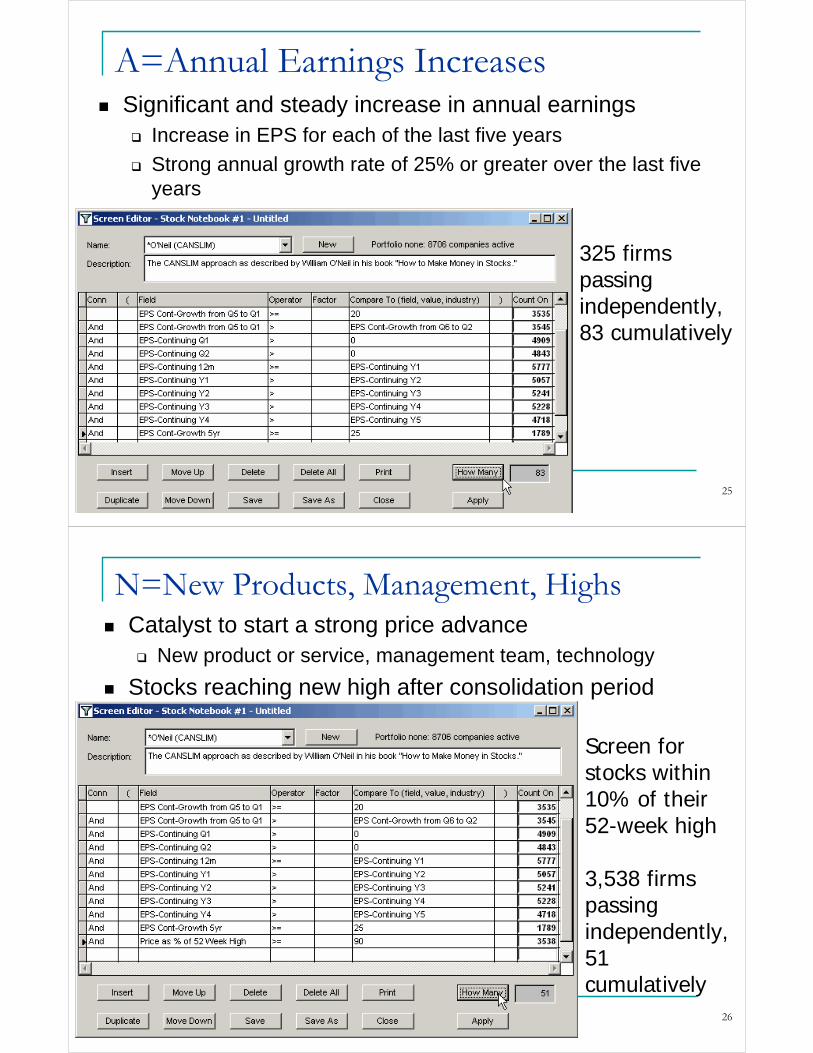
A=Annual Earnings IncreasesSignificant and steady increase in annual earnings
Increase in EPS for each of the last five years
Strong annual growth rate of 25% or greater over the last five years
325 firms passing independently, 83 cumulatively
26
N=New Products, Management, HighsCatalyst to start a strong price advance
New product or service, management team, technology
Stocks reaching new high after consolidation period
Screen for stocks within 10% of their 52-week high
3,538 firms passing independently, 51 cumulatively

27
S=Supply and DemandFirms with a smaller number of shares outstanding should increase more quicklyO’Neil recommends looking at “float”
Shares outstanding less shares held by insiders
Screen for float of less than 20 million shares outstanding
4,501 firms passing independently, 18 cumulatively
28
L=Leader or LaggardLook for market leaders in rapidly expanding industries
Buy among the best two or three stocks in a group
Use relative strength to identify market leaders
Screen for 52-week relative strength rank above 70%
2,546 firms passing independently, 10 cumulatively
29
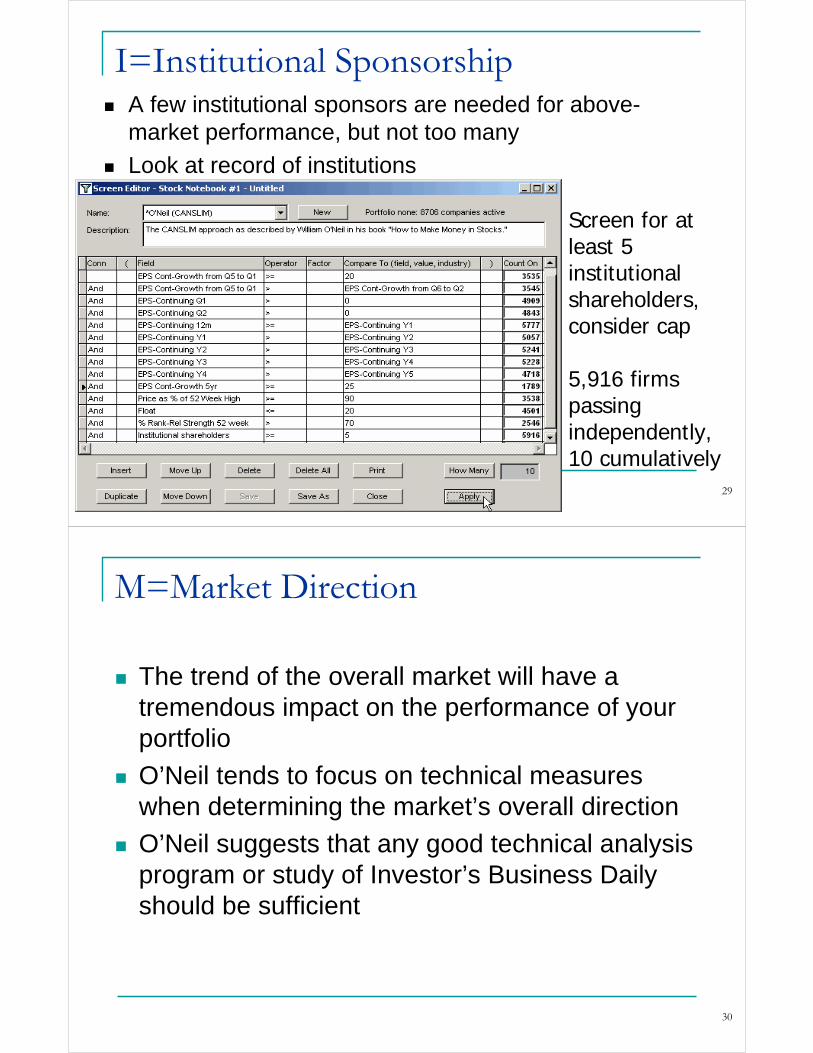
I=Institutional SponsorshipA few institutional sponsors are needed for above-market performance, but not too many
Look at record of institutions
Screen for at least 5 institutional shareholders, consider cap
5,916 firms passing independently, 10 cumulatively
30
M=Market Direction
The trend of the overall market will have a tremendous impact on the performance of your portfolio
O’Neil tends to focus on technical measures when determining the market’s overall direction
O’Neil suggests that any good technical analysis program or study of Investor’s Business Daily should be sufficient
31
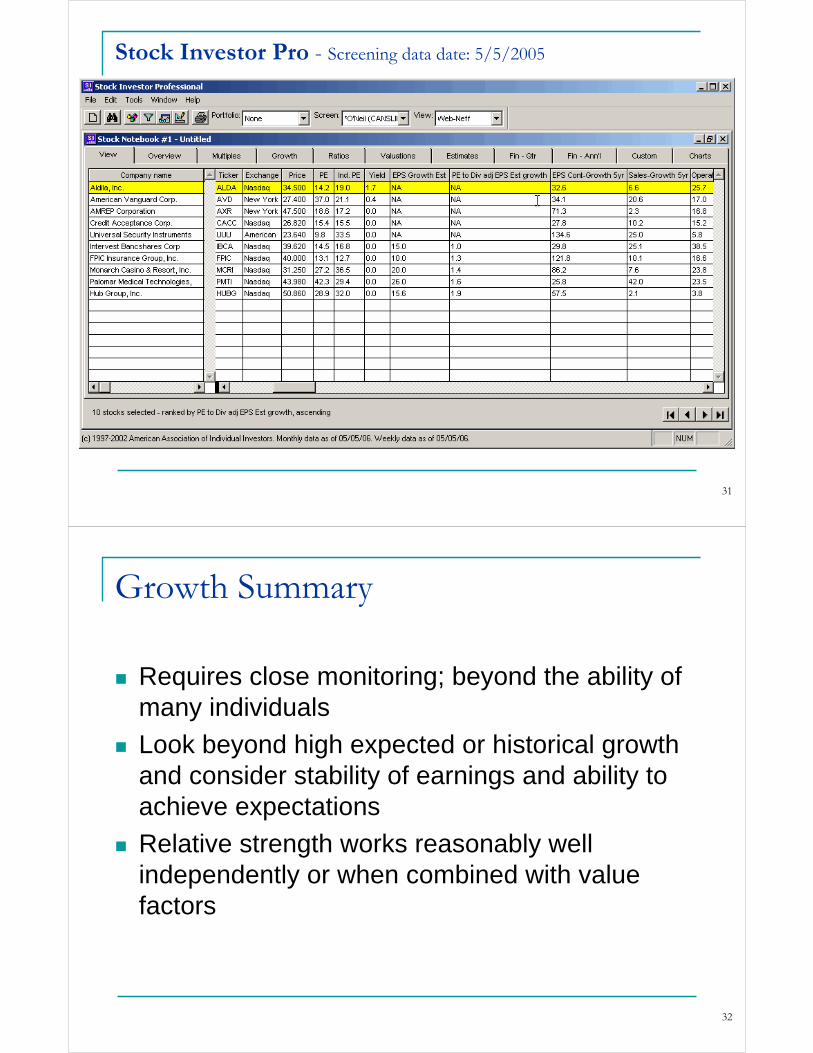
Stock Investor Pro - Screening data date: 5/5/2005
32
Growth Summary
Requires close monitoring; beyond the ability of many individuals
Look beyond high expected or historical growth and consider stability of earnings and ability to achieve expectations
Relative strength works reasonably well independently or when combined with value factors

33
Popular Approaches
AAII Journal/Computerized Investing has examined the characteristics of successful investors
Tracking performance of our interpretation of these approaches in Stock Investor
Companies passing screens and chart of results available on AAII Web site within “AAII Stock Screens” segment in the Portfolios section
34
Screens are located within “AAII Stock Screens”segment of Web site

35
36

Table 1. Performance of Stock Screens on AAII's Web Site.
Value Strategies YTD* 2005 2004 2003 2002 2001 2000 1999 1998 Total* Std Dev Gain Loss Avg # Turnover %Cash Rich Firms 12.3 -2.5 18.6 64.0 -9.4 20.1 40.5 37.1 -3.8 329.8 6.8 17.6 -20.7 32 24.1Dividend (High Relative Yield) 2.6 -1.0 19.1 27.9 0.4 24.1 23.3 -2.1 6.3 147.5 4.4 12.5 -12.0 37 21.6Dividend Screen--DRPs 6.1 -1.5 17.4 28.3 -1.2 38.9 27.7 -1.1 -4.1 161.6 4.6 15.6 -14.2 30 25.3Dividend Screen--Non-DRPs 5.6 7.1 22.8 40.5 28.6 54.7 16.5 -3.6 0.6 338.7 3.8 10.5 -13.6 30 29.1Dogs of the Dow 7.6 -9.8 -1.3 20.4 -9.8 -1.2 4.1 5.7 9.8 24.0 5.3 16.1 -15.5 10 7.2Dogs of the Dow--Low Priced 5 12.3 -11.8 6.1 17.6 -6.5 7.2 3.2 -2.0 24.6 56.1 6.4 19.4 -15.8 5 16.4Dreman 8.5 18.7 24.2 37.7 8.3 26.4 38.0 -3.0 -1.5 297.4 4.6 12.6 -15.4 22 30.6Dreman With Est Revisions 23.7 9.3 35.0 69.2 16.6 -29.9 38.7 6.7 10.7 313.4 6.5 15.2 -25.8 12 80.2Fundamental Rule of Thumb 17.4 5.0 49.6 83.3 4.7 42.3 28.7 11.7 -9.4 556.0 8.0 33.8 -19.2 50 22.6Graham--Defensive Investor (Non-Utility) 20.3 26.2 11.7 32.7 3.1 61.5 12.0 3.6 9.6 376.2 6.0 15.7 -14.6 17 20.9Graham--Enterprising Investor 39.1 21.3 18.9 25.9 43.5 55.3 24.2 -5.0 -7.3 516.1 8.0 33.1 -18.7 5 34.9Lakonishok 12.4 14.0 31.2 39.9 -5.2 -3.5 36.7 14.8 7.3 262.3 5.6 16.6 -13.7 27 90.6Neff 10.0 7.7 29.5 85.1 15.0 65.2 37.3 17.4 9.3 849.8 7.0 26.8 -20.2 18 36.0O'Shaughnessy--Value 11.6 2.2 20.2 47.2 -12.1 10.6 22.3 -3.9 7.2 147.3 5.4 15.5 -14.0 50 19.4P/E Relative 19.2 17.2 24.7 51.1 11.1 16.1 20.3 -6.0 26.5 385.5 4.6 14.9 -12.4 35 77.3Piotroski -15.8 -8.5 82.2 154.6 -15.9 100.2 -0.9 27.1 17.9 793.3 8.7 34.3 -17.2 6 22.5Price-to-Free-Cash-Flow 7.4 10.6 30.9 61.7 13.6 63.8 17.8 10.0 2.6 521.6 6.0 25.1 -14.4 30 23.4Weiss Blue Chip Div Yield 7.9 6.4 16.6 48.9 -14.1 25.6 18.8 3.9 3.3 174.5 6.0 14.3 -14.8 11 26.4
Growth & Value Strategies YTD* 2004 2004 2003 2002 2001 2000 1999 1998 Total* Std Dev Gain Loss Avg # Turnover %Buffett--Hagstrom 8.9 11.4 27.6 35.2 -8.7 13.9 11.4 31.4 27.5 306.1 5.1 13.2 -15.5 30 23.1Buffettology--EPS Growth 11.4 11.9 13.2 32.8 -10.9 25.7 5.9 17.7 4.0 172.4 5.7 15.0 -20.4 43 12.1Buffettology--Sustainable Growth 8.5 9.5 17.5 37.6 -11.9 29.7 3.3 14.6 7.4 178.7 6.1 16.5 -18.0 31 15.2Fisher (Philip) 7.6 -11.7 -3.9 78.1 -10.7 70.7 -16.7 5.4 2.6 123.6 10.2 27.1 -27.9 25 32.9Lynch 17.8 7.8 59.8 59.0 -7.2 39.3 3.2 8.9 1.3 374.6 5.2 18.9 -17.4 23 22.8Muhlenkamp 0.8 23.6 31.0 41.2 5.9 43.5 22.2 12.8 -6.6 350.3 5.3 15.1 -17.6 21 25.5Oberweis Octagon 28.7 4.1 42.3 67.8 -17.5 20.2 18.4 33.4 15.6 479.9 8.9 23.3 -23.2 18 41.7O'Shaughnessy--Growth 27.3 14.4 45.1 90.3 10.1 19.2 11.5 19.5 19.4 739.7 6.8 18.6 -17.9 50 38.2Price-to-Sales 16.0 16.9 11.1 69.8 1.3 43.3 23.3 21.1 13.2 527.3 5.9 14.8 -17.8 46 40.6Stock Market Winners 9.0 25.9 9.6 131.5 32.1 41.6 27.6 21.7 -12.0 789.6 6.9 22.0 -23.4 16 60.4T. Rowe Price -4.8 23.1 50.4 39.2 -15.1 8.4 35.2 -4.5 1.8 196.9 6.6 18.3 -18.0 12 33.7Templeton 3.4 4.7 21.9 46.8 -32.6 22.0 20.3 8.1 16.2 140.9 5.9 14.3 -18.2 24 27.4Value on the Move--PEG With Est Growth 22.2 23.1 54.1 87.0 7.9 34.8 22.9 11.0 2.1 779.3 6.2 15.7 -23.1 49 44.5Value on the Move--PEG With Hist Growth 11.2 17.2 32.5 50.1 12.1 22.4 19.4 18.0 1.5 408.3 4.6 12.7 -19.1 101 36.5Wanger (Revised) 16.2 14.5 19.3 53.2 -13.1 21.1 -2.8 3.2 -2.4 151.0 6.9 22.8 -19.8 31 26.9Zweig 12.6 27.8 49.5 88.8 16.9 57.9 46.2 17.1 54.5 1,880.3 8.4 32.7 -24.2 14 43.5
Growth Strategies YTD* 2004 2004 2003 2002 2001 2000 1999 1998 Total* Std Dev Gain Loss Avg # Turnover %Driehaus 27.1 4.3 -10.8 87.8 -42.6 -27.4 -8.3 107.4 nmf 75.9 11.7 51.3 -25.7 15 64.2Foolish Small Cap 8 14.0 22.6 10.1 107.7 -19.4 -8.6 24.2 80.9 17.7 522.5 9.8 38.8 -22.5 24 34.7Foolish Small Cap 8 Revised 23.8 15.3 -3.9 67.8 22.2 29.5 51.5 36.5 12.4 747.5 9.0 26.6 -24.2 7 31.7IBD Stable 70 5.4 1.8 29.0 48.4 -11.0 9.5 23.9 3.6 21.9 213.0 5.1 12.0 -18.9 56 10.5Inve$tWare Quality Growth 5.5 14.9 18.0 33.3 -25.0 8.0 18.5 -3.0 14.5 103.4 5.6 18.2 -22.0 28 11.3O'Neil's CAN SLIM 24.1 24.1 -3.8 79.0 20.5 54.4 38.0 36.6 28.2 1,091.3 6.8 23.6 -23.1 10 53.2O'Neil's CAN SLIM Revised 3rd Edition 5.9 -1.0 -2.6 74.7 -10.3 33.4 96.3 59.0 7.8 618.6 9.3 52.7 -26.7 10 62.7Return on Equity 13.0 17.6 26.2 46.9 -3.8 18.1 31.4 1.0 18.8 341.3 5.8 13.0 -22.2 35 20.2
Sector/Specialty Strategies YTD* 2004 2004 2003 2002 2001 2000 1999 1998 Total* Std Dev Gain Loss Avg # Turnover %ADRs 17.8 12.9 14.5 82.3 -4.4 -5.3 9.9 4.0 2.3 194.0 6.5 31.1 -17.7 21 42.9Dual Cash Flow 14.8 10.4 24.7 66.9 -13.9 24.6 5.7 114.3 0.9 547.0 7.2 34.7 -16.2 61 31.2Est Rev Down 9.9 -0.4 13.4 51.8 -43.8 26.7 -7.1 21.9 -15.0 29.2 7.4 17.6 -23.3 190 79.5Est Rev Down 5% 12.9 2.5 8.0 70.9 -61.5 28.3 -4.2 27.8 -3.9 24.3 9.2 23.6 -23.2 68 89.5Est Rev Up 16.7 17.3 25.2 57.3 0.8 -3.5 2.2 38.2 29.9 380.4 6.1 12.2 -18.6 169 81.2Est Rev Up 5% 28.5 24.5 25.8 75.0 12.9 -8.1 3.6 107.1 43.3 1,022.7 9.3 30.8 -21.7 42 93.2Graham--Defensive Investor (Utility) 7.5 18.5 16.2 16.6 -15.9 5.2 51.4 -8.4 14.6 142.5 4.5 12.0 -11.0 16 16.7Insider Net Purchases 15.7 -14.6 33.5 86.8 -20.9 21.8 -38.3 7.5 nmf 57.4 8.6 26.7 -19.0 27 29.3Murphy Technology -6.4 34.1 107.9 -33.7 -79.6 26.7 -52.1 139.7 29.7 -33.5 15.9 58.5 -44.9 11 24.5Short % Outstanding 7.1 -14.6 -2.3 88.5 -35.6 8.3 -31.7 -26.9 nmf -41.2 11.4 33.3 -26.2 25 17.9Short Interest Change 0.0 -29.9 11.7 120.5 -34.9 11.6 -51.8 111.1 nmf 27.5 11.2 34.1 -27.4 25 85.1Short Ratio 22.8 -15.9 -1.7 52.1 -30.7 18.3 -40.9 2.2 nmf -23.6 9.5 37.8 -24.5 25 51.4
Indexes YTD* 2004 2004 2003 2002 2001 2000 1999 1998 Total* Std Dev Gain LossAll Exchange-Listed Stocks 13.7 4.5 22.8 81.1 -13.3 21.2 -14.2 35.1 5.9 241.0 6.5 23.9 -20.2Dow Jones 30 6.1 -0.1 2.6 25.3 -16.8 -7.1 -6.2 25.2 16.1 43.7 4.6 11.8 -15.1Nasdaq 100 3.4 1.5 10.4 49.1 -37.6 -32.7 -36.8 102.0 85.5 71.8 10.2 25.0 -27.5S&P 500 5.0 3.0 9.0 26.4 -23.4 -13.0 -10.1 19.5 26.7 35.1 4.5 9.7 -14.6 S&P/Citigroup 500 Growth (incl div) 2.5 1.1 7.0 27.1 -28.1 -16.1 -19.1 37.4 38.2 30.5 5.6 10.8 -15.8 S&P/Citigroup 500 Value (incl div) 8.8 8.7 15.0 30.4 -16.6 -8.2 -0.5 4.9 18.9 68.6 4.1 9.6 -13.1S&P MidCap 400 8.8 11.3 15.2 34.0 -15.4 -1.6 16.2 13.3 17.7 140.8 5.4 12.0 -18.7 S&P/Citigroup MidCap Growth (incl div) 6.9 14.4 15.8 37.6 -19.7 -2.6 15.8 36.1 37.2 229.7 6.4 19.0 -22.2 S&P/Citigroup MidCap Value (incl div) 11.4 10.8 17.2 33.8 -9.4 1.4 19.5 -2.6 3.7 114.5 4.5 10.9 -15.2S&P SmallCap 600 12.5 6.7 21.4 37.8 -15.3 5.7 11.0 11.5 -2.1 117.8 5.8 13.3 -19.4 S&P/Citigroup SmallCap Growth (incl div) 13.7 7.3 24.3 38.5 -16.6 3.0 7.6 19.7 -0.1 132.2 6.2 17.0 -21.7 S&P/Citigroup SmallCap Value (incl div) 17.6 8.5 21.1 39.2 -12.9 9.5 15.8 4.9 -2.6 142.5 5.2 12.8 -16.9Unless otherwise stated, figures do not include dividends or transactions costs.*Through 4/28/2006
Monthly HoldingsMonthly Var (%)
Monthly Var (%) Monthly Holdings
Monthly Holdings
Monthly Var (%) Monthly Holdings
Monthly Var (%)
Monthly Var (%)

37
38
39
40

41
42
43
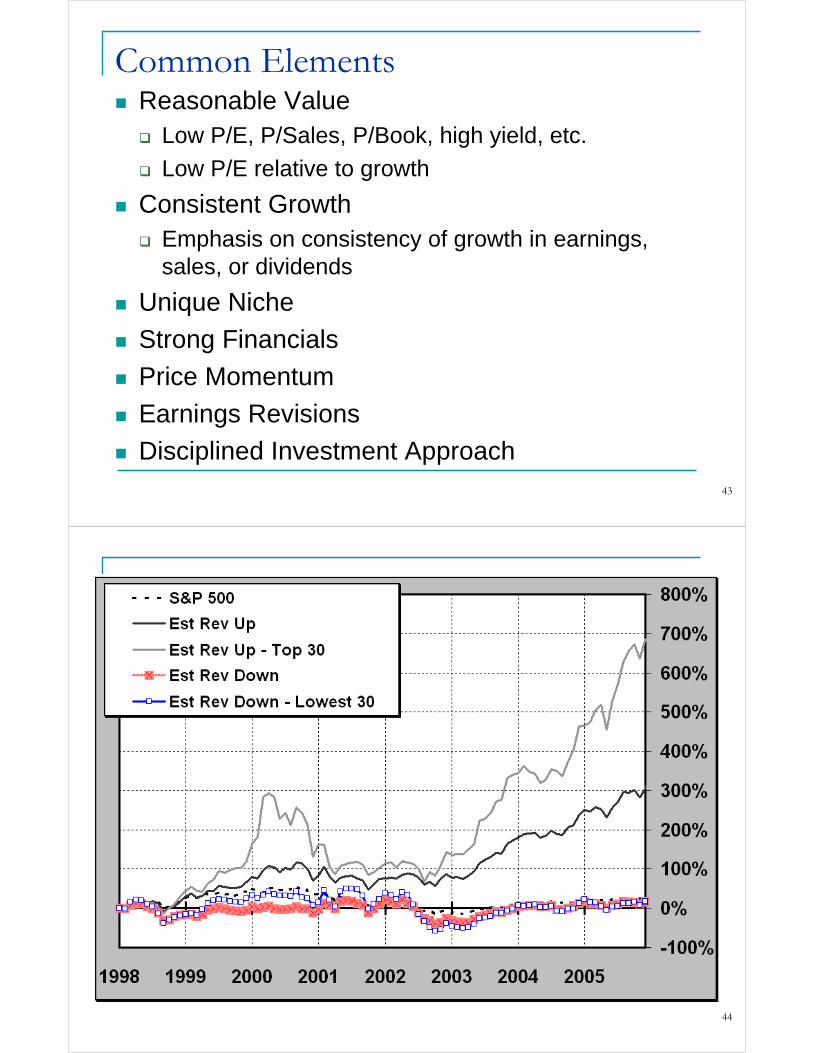
Common ElementsReasonable Value
Low P/E, P/Sales, P/Book, high yield, etc.
Low P/E relative to growth
Consistent GrowthEmphasis on consistency of growth in earnings, sales, or dividends
Unique Niche
Strong Financials
Price Momentum
Earnings Revisions
Disciplined Investment Approach
44
Data as of 4/29/2005

45
Top Screening Systems
46
AAII’s Guide to the Top Investment Web SitesAppears annually in September Journal
Available at AAII Web site
47
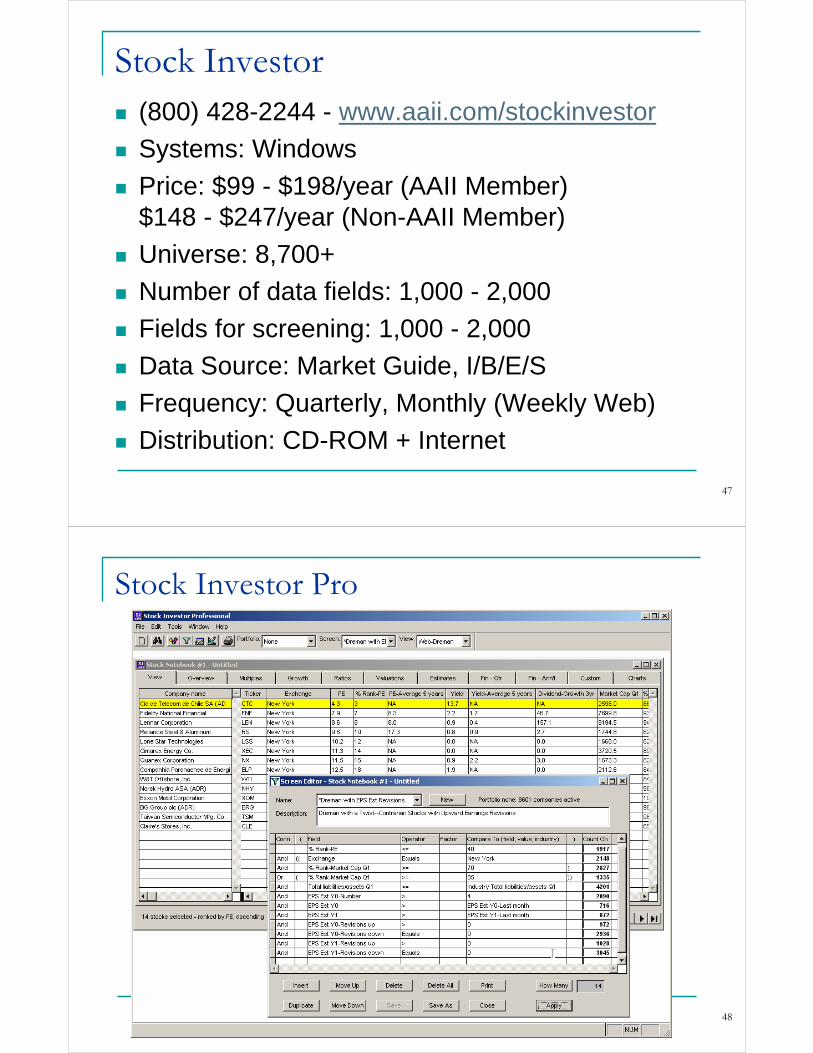
Stock Investor(800) 428-2244 - www.aaii.com/stockinvestor
Systems: Windows
Price: $99 - $198/year (AAII Member) $148 - $247/year (Non-AAII Member)
Universe: 8,700+
Number of data fields: 1,000 - 2,000
Fields for screening: 1,000 - 2,000
Data Source: Market Guide, I/B/E/S
Frequency: Quarterly, Monthly (Weekly Web)
Distribution: CD-ROM + Internet
48
Stock Investor Pro

49
MSN Money
(800) 373-3676 - moneycentral.msn.com
Price: Free; registration required
Universe: 8,000+
Number of data fields: 1,500+
Fields for screening: 190+
Data Source: Media General, Zacks
Frequency: Daily
Distribution: Internet
50
MSN Money

51
Morningstar.com Premium
www.morningstar.com
Price: Free to $135 per year
Universe: 8,000+
Number of data fields: 800+
Fields for screening: 450+
Data Source: Morningstar
Frequency: Daily
Distribution: Internet
52
Morningstar.com Premium
53
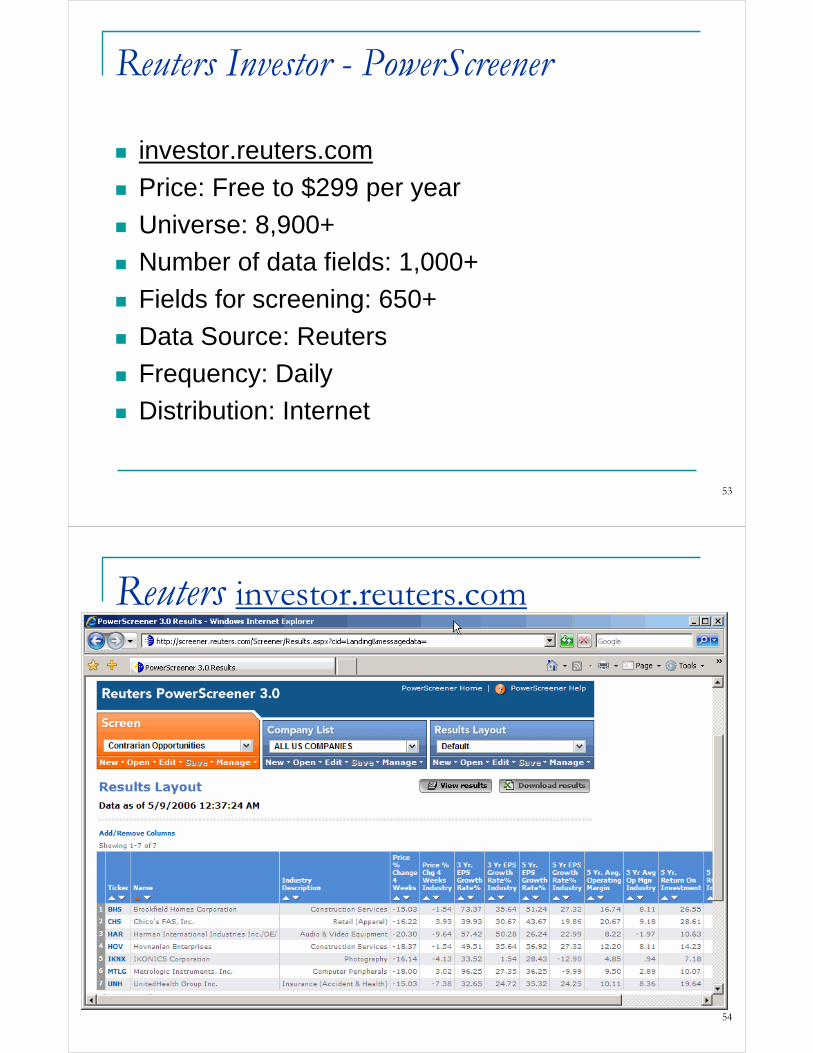
Reuters Investor - PowerScreener
investor.reuters.com
Price: Free to $299 per year
Universe: 8,900+
Number of data fields: 1,000+
Fields for screening: 650+
Data Source: Reuters
Frequency: Daily
Distribution: Internet
54
Reuters investor.reuters.com
55
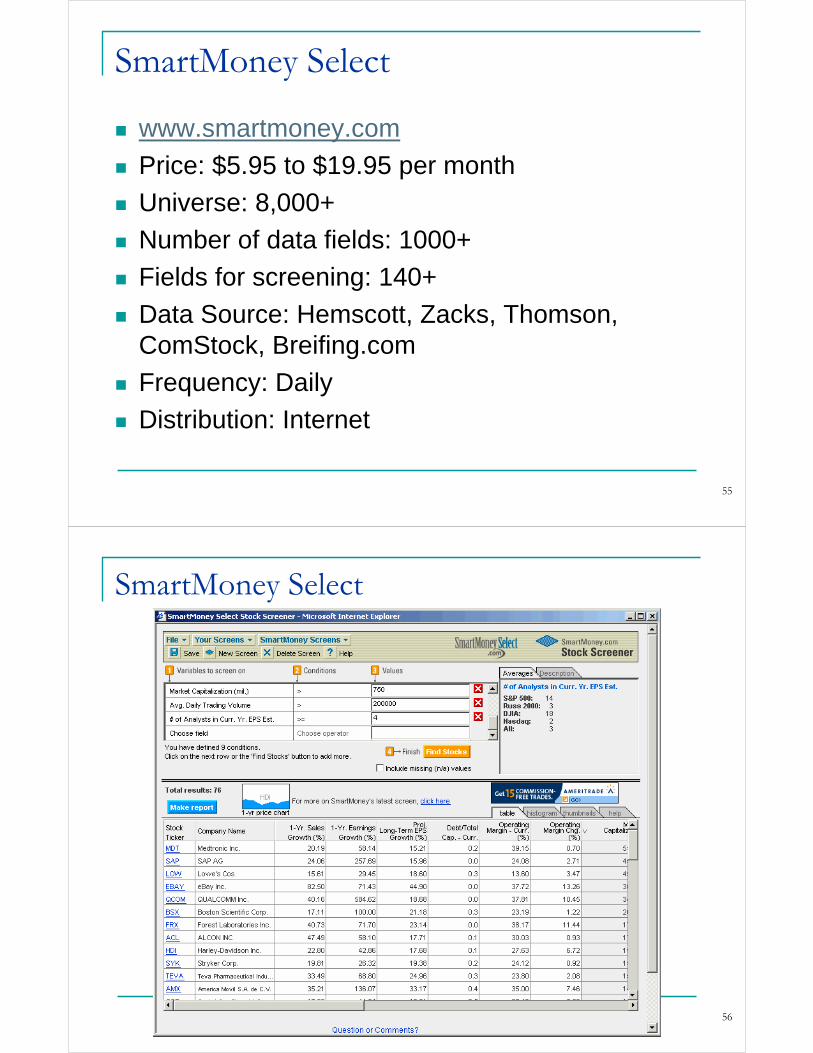
SmartMoney Select
www.smartmoney.com
Price: $5.95 to $19.95 per month
Universe: 8,000+
Number of data fields: 1000+
Fields for screening: 140+
Data Source: Hemscott, Zacks, Thomson, ComStock, Breifing.com
Frequency: Daily
Distribution: Internet
56
SmartMoney Select