Screening Model for Determining Likelihood of Site Occupancy
33
STATE OF WASHINGTON March 2004 Screening Model for Determining Likelihood of Site Occupancy by Oregon Spotted Frogs (Rana pretiosa) in Washington State Stephen S. Germaine and Brian L. Cosentino Funded by: Washington State Department of Transportation Environmental Affairs 310 Maple Park Ave, SE Olympia, WA 98504-7331 Washington Department of FISH AND WILDLIFE Wildlife Management Program Science Division Final Report
Transcript of Screening Model for Determining Likelihood of Site Occupancy

STATE OF WASHINGTON March 2004
Screening Model for Determining Likelihood of Site Occupancy by Oregon Spotted Frogs (Rana pretiosa) in
Washington State
Stephen S. Germaine and Brian L. Cosentino
Funded by: Washington State Department of Transportation
Environmental Affairs 310 Maple Park Ave, SE
Olympia, WA 98504-7331
Washington Department of FISH AND WILDLIFE Wildlife Management Program Science Division
Final Report

Oregon spotted frog screen 2
Suggested citation: Germaine, S. S. and B. L. Cosentino. 2004. Screening Model for
Determining Likelihood of Site Occupancy by Oregon Spotted Frogs (Rana pretiosa) in Washington State. Final Report. Washington Department of Fish and Wildlife, Olympia, Washington, USA.
Cover photos by S eve Germainet

Oregon spotted frog screen 3
Screening Model for Determining Likelihood of Site Occupancy by Oregon Spotted Frogs (Rana pretiosa) in
Washington State
STEPHEN S. GERMAINE AND BRIAN L. COSENTINO
Washington Department of Fish and Wildlife Wildlife Program, Science Division
600 Capitol Way N. Olympia, WA 98501
Final Report March 2004

Oregon spotted frog screen 4
EXECUTIVE SUMMARY The Oregon spotted frog (Rana pretiosa; OSF) is a Washington State Endangered species and a Federal Endangered Species Act candidate. Historic abundance and distribution of Oregon spotted frogs within Washington are poorly understood (McAllister and Leonard 1993). However, Oregon spotted frog populations have declined markedly since Euro-American settlement of the coastal Pacific Northwest region, and <10 extant sites are presently known to be occupied in Washington (WDFW unpublished data). Putative reasons for population declines include altered hydrology, wetland loss, predation and competition from exotic fish and amphibians, altered water chemistry, and ultraviolet radiation (Hayes et al. 1997). Beginning May 2003, the Washington State Department of Transportation (WDOT) funded the Washington Department of Fish and Wildlife to conduct an exhaustive literature review on the Oregon spotted frog. The goal of this review was to synthesize existing information into a comprehensive document describing Oregon spotted frog ecology and habitat associations, and to develop a screen for determining potential suitability of wetland sites in western Washington for supporting populations of Oregon spotted frogs. The wetland screening model is presented here. This model is explicitly designed to evaluate wetland sites on a case-by-case basis and determine whether they contain habitat characteristics that make them potentially suitable for supporting an established and successfully reproducing population of Oregon spotted frogs. It does not address, nor are ample data available to determine, site suitability for occupancy and survival by dispersing individuals. Because the sample size from which to draw inferences within Washington was prohibitively small (n < 10), we included data from currently occupied wetlands in Oregon and British Columbia, Canada. Since features of occupied sites such as elevation and site size are known to vary with latitude over the species’ geographic range, the model focuses on data relevant to Washington State in instances where range-wide values far exceed those of Washington. The screening model has a two-tier hierarchy. Each tier contains variables known or believed (based on the literature synthesis and professional expert opinion) to influence site suitability for Oregon spotted frogs. Parameters of variables in Tier 1 are the maximum and minimum observed values for each variable in the tier. Since the region-wide number of known occupied sites was small (n <40) and relevant data often were not available for all of these sites, we expanded parameter bounds by 25% as a buffer to minimize the error of failing to recognize a suitable wetland due to potentially artificially narrow variable bounds. Tier 1 addresses landscape-level factors known to influence wetland hydrology, floristics, structure, and function, and is quantitative in nature. Tier 1 evaluates candidate wetland suitability based on soils, elevation, U.S.F.W.S. National Wetland Inventory habitat classification, wetland size, U.S.G.S. National Land Cover Descriptions, and the potential influence of connectivity to adjacent wetlands. Suitable wetlands in western Washington

Oregon spotted frog screen 5
are expected to contain: loams, mucks, loamy sands, and/or poorly drained fibrisols, mesisols, organic cryosols, gleysols, or humisols; occur from the upper hydrologic limit of brackish water influence – 2,624 ft (800 m); have Palustrine emergent habitat present; be at least 8.9 ac (3.6 ha) in size; and have ≤9.8 % area within a 1.6 km radius developed for residential, commercial, industrial, and/or transportation use. Wetlands smaller than 8.9 ac may be considered suitable if connected by surface water and <1 km from an adjacent wetland, with both wetlands (using pooled data) mutually satisfying all Tier 1 criteria. If a wetland meets all Tier 1 criteria then we recommend using Tier 2 screening. Tier 2 is qualitative in nature and describes habitat characteristics of occupied sites during 3 seasons; breeding, summer, and winter. Wetlands suitable during breeding season are expected to contain vernal shallows 5 – 30 cm in depth; be dominated by native submergent and emergent vegetation, (Typha and/or Phalaris are typically present, but usually not dominant at occupied sites unless domestic livestock grazing also occurs); have >10% bottom substrate covered by submergent, floating, or low emergent vegetation; have low overhead canopy closure by woody-stemmed shrubs and trees; and remain surface-connected to summer habitat until after larvae hatch (usually by April 31) in an average year. Suitable summer habitats will have perennial lentic pools within 1 km of breeding habitat; be dominated by native vegetation in low emergent, floating, or submerged form; have palustrine forested habitat capable of providing partial or greater amounts of shade; and be surface-water connected to suitable winter habitat during fall. Suitable winter sites will be <1 km from summer sites; exceed 15 cm depth; have aquatic bed, emergent, or scrub-shrub, and unconsolidated bottom habitat present in areas not scoured by winter floods; and have springs or upwellings present in sites where average winter ice-cap persists for >1-2 weeks. Wetlands that meet all Tier 1 and 2 criteria are considered potentially suitable Oregon spotted frog habitat, and we recommend on-site Oregon spotted frog surveys prior to activities that may disturb these sites.

Oregon spotted frog screen 6
INTRODUCTION The model presented here is designed to serve as a screen for evaluating potential suitability of wetland sites for occupancy by Oregon spotted frogs (Rana pretiosa) within their historic range in Washington State. The intent of the model is to evaluate individual wetland sites and, based on characteristics of existing habitat, determine potential for on-site occupancy by populations of Oregon spotted frogs that are established and reproducing. The model was not designed to address the likelihood of site occupancy by dispersing, dispersed, or other individual Oregon spotted frogs. This model was derived from published descriptions of wetland characteristics at sites where established populations of Oregon spotted frogs are known to occur, from summaries of landscape scale data acquired from county, state, federal, and provincial government sources, and from input/clarification from biologists who have studied Oregon spotted frog ecology. Due to the rarity of Oregon spotted frogs throughout their occupied range, data from Oregon, Washington, and British Columbia, Canada were used to generate bounds on model variables. However, the intended focus of the screen is for use in Washington State and in assisting in habitat analysis used in satisfying Endangered Species Act Section 7 consultation requirements. Therefore, in instances where range-wide values for relevant variables (e.g., elevation) far exceed known parameters within Washington State, bounds appropriate for Washington State were reported in addition to range-wide bounds. Range-wide bounds for model variables are presented so that the model may be used in Oregon and British Columbia, and because the model may have secondary value as a tool for prioritizing candidate sites for translocations or reintroductions at some future time. The model is separated into two tiers, each of which addresses habitat composition at a unique spatial scale. Tier 1 is designed to enable remote assessment of site suitability by a GIS analyst prior to an on-site visit. Tier 1 screens wetlands based on abiotic variables (e.g., underlying soils) or generalized descriptors compiled from biotic variables (e.g., National Wetlands Inventory habitat composition [U. S. Fish and Wildlife Service; http://wetlands.fws.gov]), which are discernable at landscape scale. Tier 1 also incorporates National Land Cover Description data (U. S. Geological Survey; http://landcover.usgs.gov/classes.asp), which describes levels of human development of lands surrounding candidate wetlands. Tier 2 is an on-site wetland screen, intended for use by a qualified wildlife biologist (or similarly qualified professional). Tier 2 model parameters were drawn from reports describing wetland sites occupied by Oregon spotted frogs, and include both abiotic and biotic descriptors of on-site characteristics reported as important to Oregon spotted frogs. Due to differences in data collection methods and variables that were considered in the studies from which we drew information, Tier 2 of this model is qualitative in nature. The model, which is hierarchical in its application, is designed to evaluate site-suitability at a large spatial scale first, than at a smaller, more refined scale. Therefore, a Tier 1 assessment should precede that of Tier 2. Tier variables should be evaluated in the order presented, proceeding to the next model variable only if conditions of the candidate site

Oregon spotted frog screen 7
being evaluated meet model criteria for the variable under consideration. Only if ALL conditions of Tier 1 are satisfied should Tier 2 be consulted. For screening model purposes, in any instance where conditions of a candidate site fail to meet stated model criteria in either tier, the site should be considered poorly suited and unlikely to support a reproducing population of Oregon spotted frogs. Model Explanation Tier 1 is designed for screening in a GIS setting prior to an on-site visit (Appendix E). Tier 1 screens candidate wetlands against characteristics of variables estimated at occupied sites. Screening variables are soils, elevation, National Wetlands Inventory (NWI) habitat classification, size, connectivity, and amount of adjacent developed land (using National Land Cover Definition [NLCD] data).
• Soils data (Appendix A) were derived from digital soils maps and a qualitative list of soil types present at occupied wetlands.
• Elevation data (Appendix B) were acquired directly from published reports or from digital elevation models.
• National Wetland Inventory habitat summaries (Appendix C) were generated from overlays of extant frog locations on digital NWI habitat data. NWI wetland habitat types were pooled into the following categories: palustrine emergent, palustrine forested, palustrine scrub-shrub, palustrine open water, palustrine aquatic bed, palustrine unconsolidated bottom, lacustrine (intermittently – permanently flooded), or riverine (intermittent, low, and high gradient flows). Type and number of NWI habitat types present at each site were determined.
• Wetland size (Appendix C) was estimated by pooling contiguous NWI polygons at each occupied site.
• NLCD landscape composition (Appendix D) was summarized within a 1-mi (1.6-km) buffer extending from the perimeter of each occupied wetland, as defined by NWI polygons. NLCD residential and commercial/industrial/transportation classes were summed to generate percentage estimates of developed land surrounding occupied sites.
• Connectivity: wetlands that satisfy the Tier 1 screen excepting they are below the minimal size threshold need be visited by a qualified biologist to determine if they are connected at least intermittently by surface-water to, and within reasonable inter-seasonal movement distance (1 km) of an adjacent wetland. If these conditions are met as described in the model, the candidate wetland would then be considered potentially habitable, and both wetlands will be assessed jointly during Tier 1 and 2 screening.
Maxima and minima of quantitative variables (elevation, NWI classification, size, NLCD composition) describing occupied sites were expanded ±25 % to minimize risk of a Type II assessment error during screening. A Type II error would be excluding a candidate wetland as unsuitable when it is in fact suitable, because variable parameter estimates were too narrow. Narrow parameter estimates can result when the number of original

Oregon spotted frog screen 8
sites from which estimates were generated is small. These estimates, plus the soils list, form the basis for screening in Tier 1. Parameter estimates were generated using data from Washington, Oregon, and British Columbia, with the following exceptions:
1) British Columbia site data contributed only to soils, elevation, and wetland size descriptions. National Wetlands Inventory and National Land Cover Definition data do not cover Canada, and we found no Canadian digital data with sufficiently similar habitat designations.
2) Oregon sites were not included in soils data summarization because digital
data were not available. National Wetland Inventory digital data were not available for 10 of the 27 Oregon sites. Therefore, wetland size and NLCD landscape composition also were not estimated at these sites.
Tier 2 is an on-site screen, to be performed by a qualified biologist. Tier 2 variables are based on reported OSF habitat associations for breeding, post-breeding summer, and winter seasons. Tier 2 is partitioned accordingly. Tier 2 does not warrant a site-visit during each season, but does require knowledge of the candidate wetlands’ seasonal hydroperiod, plant species composition, and vegetative growth forms. Relevant biological seasons are defined using relevant factors such as water temperature and ice formation and persistence, reducing reliance on calendar dates, which vary by latitude, elevation, etc.

Oregon spotted frog screen 9
SCREENING MODEL Tier 1- candidate wetlands should satisfy each the following criteria, assessed via Geographic Information System, to be further considered potential OSF sites. Soils (Appendix A): soils underlying wetlands should consist of loams (silt, clay, fine
sandy, gravelly, cobbly, and stony), mucks (e.g., Semiahmoo, Mukilteo), loamy sands, or other poorly drained fibrisols, mesisols, organic cryosols, gleysols, and humisols, and
Elevation (Appendix B): range-wide potentially habitable elevations range from sea level
(above the influence of seawater) to 1962 m (6,615 ft) above sea level. In Washington, Oregon spotted frogs have been found at habitable elevations ranging between 43 – 640 m (141 – 2099 ft). Adding ± 25% buffer produces a potentially suitable elevation estimate of sea level, above tidally influenced brackish waters – 800 m (2624 ft)(1), and
NWI classification (Appendix C): Palustrine emergent habitat was the only type present
at every occupied site for which NWI data were available. A wetland containing palustrine emergent habitat, alone or in any combination with ≥1 additional palustrine, lacustrine, or riverine habitat type in listed the attached appendix should be considered potential OSF habitat, and
Wetland size (Appendix B): Minimum known wetland size at an occupied and
reproductively active site in Washington State, determined by aerial extent of NWI vegetation, was 4.8 ha (11.9 ac). Buffering this value by 25%, any wetland ≥3.6 ha (8.9 ac) should be considered potentially habitable, and
NLCD Landscape composition (Appendix D): Between 0 – 7.8% of all area within 1.6
km (1 mi) of occupied wetland sites contained developed classes of NLCD. Buffering by 25% produced an upper estimate of ≤9.8 % of the area within 1.6 km of a candidate wetland perimeter that may be developed for residential, commercial, industrial, and/or transportation purposes, and
Connectivity adjustment to size: Wetlands that satisfy all other criteria stated in Tier 1
above but which are <3.6 ha in size should be considered suitable if ALL of the following conditions exist: A) located <1 km(2) (0.63 mi) from, and connected by surface water during
intermittent (as defined in USFWS National Wetland Inventory) or more-frequent flooding to, an adjacent wetland, and
_________________ (1) The upper elevation limit may need upwards revision if new sites are discovered above current known elevations. A potentially occupied site exists near Conboy Reservoir at approximately 2,600’ elevation (M. P. Hayes, personal communication) (2) Hallock and Pearson (2001) observed 2-3 Oregon spotted frogs that moved ~1 km between fall and winter locations. These were presumably seasonal movements, not juvenile dispersal.

Oregon spotted frog screen 10
B) the combined size of both wetlands is ≥3.6 ha, and C) at least one of the wetlands contains palustrine emergent habitat.
Wetlands that satisfy all criteria of the Tier 1 screen will be visited by a WSDOT Biologist who will perform an on-site review (Tier 2). If any condition in Tier 1 is not met, the site is not considered potentially suitable for Oregon spotted frog presence. Tier 2- IF a wetland satisfies Tier 1 criteria for potential suitability for OSF, it must contain each of the following seasonal on-site characteristics, within the specified descriptions, to be further considered potential OSF habitat. Breeding habitat criteria (best current information suggests these conditions must be present as springtime wetland water temperatures reach 7 – 10 C) 1) contains low gradient shallows that:
a. have an average depth between 5 – 30 cm (Hayes et al. 2000, Leonard 1997, McAllister and White 2001, Watson et al. 2003), in areas that
b. are dominated by (constituting >50 % of existing vegetative cover) native
wetland vegetation such as Carex, Eleocharis, Juncus, Potamogeton, Ranunculus, Scirpus, Sparganium, Utricularia, filamentous algae, and/or native grasses, but which may also contain subdominant vegetation including Typha, Phalaris (Typha or Phalaris may be dominant at occupied sites where livestock grazing reduces the canopy), or other plant species having an upright submergent or emergent growth form (Lewis et al. 2001, Risenhoover et al. 2001, personal communication with M. Hayes and C. Pearl), and
c. have >10 % plant coverage of bottom substrate, primarily in submergent and
emergent growth forms (Lewis et al. 2001, McAllister and White 2001), and
d. have low surface and above-water canopy closure in the form of woody-stemmed shrubs and trees, such that Palustrine Forested and ungrazed Phalaris-dominated habitats are not suitable (Watson et al. 2000, personal communication with B. Leonard), and,
e. remain hydrologically surface-connected to summer-season habitat until post-
hatching in an average year (Backhouse 2002, personal communication with M. Hayes, K. McAllister, and C. Pearl). This period will be 5 – 8 weeks from the date of egg deposition, and will usually occur by April 31 in an average year.

Oregon spotted frog screen 11
If answers to a – e are “Yes”, screen for suitable Summer-season features. If any condition of Breeding habitat is not met, the site is not considered potentially suitable for Oregon spotted frog presence. Summer-season habitat criteria 1) contains persistent (perennial) lentic pools that:
a. are in close proximity to breeding habitat (present in same wetland and <1 km distant, or surface-water connected during breeding-summer season and <1 km distant; Hallock and Pearson 2001, personal communication with K. McAllister and C. Pearl), and
b. have Carex, Eleocharis, Juncus, Phalaris, Sparganuim, Spiraea,
Potamogeton, Utricularia, Ranunculus, or other wetland vegetation present in emergent, floating, or submergent growth form (Watson et al. 2000, 2003, personal communication with M. Hayes, B. Leonard, K. McAllister, C. Pearl), and
c. have Palustrine Forested vegetation including Spiraea, Salix, or Alnus in shrub
or tree form, or upland shrub-tree form vegetation present and within a distance to provide at least partial shading (Watson et al. 2000, 2003, personal communication with M. Hayes, B. Leonard, K. McAllister, C. Pearl), and
d. are/become surface-water connected to suitable winter habitat during fall
(Hallock and Pearson 2001, Backhouse 2002; personal communication with M. Hayes, K. McAllister, and C. Pearl).
If answers to a – d are “Yes” screen for suitable Winter-season features. If any condition of Summer habitat is not met, the site is not considered potentially suitable for Oregon spotted frog presence. Winter habitat criteria
1) contains ponded, pooled, or channeled areas of either lotic or lentic water that: a. are in close proximity (present in same wetland, or surface-water connected
during fall migratory season and <1 km) to both breeding and summer season habitat during the appropriate season (Watson et al. 2000, Hallock and Pearson 2001, Hayes et al. 2001, Backhouse 2002), and
b. exceed 15 cm depth (Hallock and Pearson 2001, Hayes et al. 2001), and

Oregon spotted frog screen 12
c. have some combination of Aquatic Bed, Emergent, and Scrub-shrub vegetation present and intermixed with Unconsolidated Bottom habitat (Watson et al. 2000, 2003), and
d. are not scoured (scoured = having flows capable of removing rooted
vegetation or re-arranging distribution of large-grained sand and gravel substrates) by winter storm-related flows during an average year (Cowardin et al. 1979).
e. IF site elevation is such that ice cap persists for >1-2 weeks during an average
winter, then in-channel flow or springs/upwelling must be present in habitat described in item C (Hayes et al. 2001, Hallock and Pearson 2001, Backhouse 2002, personal communication with M. Hayes and C. Pearl).
If answers to a – e are “Yes”, surveys for Rana pretiosa are warranted. If any condition of Winter habitat is not met, the site is not considered potentially suitable for Oregon spotted frog presence.
Acknowledgements A grant from the Environmental Services Office of the Washington State Department of Transportation funded the development of this model. The following individuals improved drafts of the model through critical review, shared information, or both: M. Carey, R. Haycock, M. Hayes, B. Leonard, K. McAllister, C. Pearl, J. Pierce, M. Vander Haegen, and J. Watson.

Oregon spotted frog screen 13
SOURCE LITERATURE Following is a list of reports from which information used in model development was drawn. Backhouse, F. 2002. Oregon spotted frog: Wildlife in British Columbia at risk. British
Columbia Ministry of Water, Land, and Air Protection Brochure. Victoria, British Columbia, Canada. 6 pp.
COSEWIC (Committee on the Status of Endangered Wildlife in Canada). 1999.
Canadian species at risk. Canadian Wildlife Service. Ottowa, Canada. Cowardin, L.M., V. Carter, F.C. Golet, and E.T. LaRoe. 1979. Classification of
wetlands and deepwater habitats of the United States. Biological Services Program, U. S. Fish and Wildlife Service. Washington, D.C.
Dettmers, R. and J. Bart. 1999. A GIS modeling method applied to predicting forest
songbird habitat. Ecological Applications 9:152-163. Haycock, R. 1999. Status report on the Oregon spotted frog (Rana pretiosa) in Canada.
Report to the Committee on the Status of Endangered Wildlife in Canada. Ottawa. 19 pp.
Hayes, M.P., J.D. Engler, R.D. Haycock, D.H. Knopp, W.P. Leonard, K.R. McAllister
and L.L. Todd. 1997. Status of the Oregon spotted frog (Rana pretiosa) across its geographic range. In The Spotted Frogs of Oregon, proceedings of August 15, 1997 workshop for Oregon Chapter of The Wildlife Society. Corvallis, Oregon.
Hayes, M.P., J.D. Engler, D.C. Friesz, and K. Hans. 2000. Oregon Spotted Frog (Rana
pretiosa) oviposition at Conboy National Wildlife Refuge (Klickitat County, Washington): Management implications of embryonic mortality. Final Report to U.S. Fish and Wildlife Service. Lacey, Washington. 14 pp + Appendices.
Hayes, M.P., J.D. Engler, S. Van Leuven, D.C. Friesz, T. Quinn, and D.J. Pierce. 2001.
Overwintering of the Oregon Spotted Frog (Rana pretiosa) at Conboy National Wildlife Refuge, Klickitat County, Washington, 2000-2001. Final Report to the Washington Department of Transportation. Washington Department of Fish and Wildlife. Olympia. 86 p.
Hallock, L, and S. Pearson. 2001. Telemetry study of fall and winter Oregon spotted frog
(Rana pretiosa) movement and habitat use at Trout Lake, Klickitat County, Washington. Washington Department of Natural Resources final Report to Washington Department of Transportation. Olympia, Washington. 36 p.

Oregon spotted frog screen 14
Jennings, M. R., and M. P. Hayes. 1994. Amphibian and reptile species of special concern in California: Spotted frog (Rana pretiosa Baird and Gerard 1853). Report submitted to California Department of Fish and Game, Rancho Cordova, CA. pp 84-87.
Leonard, W.P. 1997. Oregon spotted frog (Rana pretiosa) monitoring at Trout Lake
Natural Area Preserve and vicinity, Klickitat and Skamania counties, Washington. Unpubl. Report, Washington Natural Heritage Program. Washington Natural Resources Dept, Olympia. 22 pp.
Leonard, W.P., L. Hallock and K.R. McAllister. 1997. Behavior and reproduction-Rana
pretiosa (Oregon spotted frog). Herpetological Review 28:28. Lewis, J.C., Anderson, D.P., and S. Van Leuven. 2001. Oviposition ecology of the
Oregon spotted frog at Trout Lake Marsh, Washington. Washington Department of Fish and Wildlife. Olympia. 13 p.
Licht, L.E. 1975. Comparative life history features of the western spotted frog, Rana
pretiosa, from low- and high-elevation populations. Canadian Journal of Zoology 53:1254-1257.
McAllister, K.R. 1995. Distribution of amphibians and reptiles in Washington State.
Northwest Fauna 3:81-112. McAllister, K.R. and W. P. Leonard. 1990. 1989 Progress report- past distribution and
current status of the spotted frog in Western Washington. Washington Department of Wildlife, Wildlife Management Nongame Program Report. Olympia, WA. 16 pp.
McAllister, K.R. and W. P. Leonard. 1991. Past distribution and current status of the
spotted frog in Western Washington: 1990 progress report. Washington Department of Wildlife, Wildlife Management Nongame Program Report. Olympia, WA. 21 pp.
McAllister, K.R. and W. P. Leonard. 1993. Searches for spotted frogs (Rana pretiosa)
and other amphibians on National Forest lands in Washington, 1993. Unpublished Report of the Washington Wildlife Dept. Olympia, WA.
McAllister, K.R. and W. P. Leonard. 1997. Washington State status report of the
Oregon spotted frog. Washington Department of Fish and Wildlife. Olympia, WA. 38 pp.
McAllister, K.R., W.P. Leonard and R.M Storm 1993. Spotted frog (Rana pretiosa)
surveys in the Puget Trough of Washington, 1989-1991. Northwestern Naturalist 74:10-15.

Oregon spotted frog screen 15
McAllister, K. and M. Walker. 2003. An inventory of Oregon spotted frogs (Rana pretiosa) in the upper Black River drainage, Thurston County, Washington. Washington Dept. Fish and Wildlife Wildlife Program Report. Olympia, WA. 12 pp.
McAllister, K.R., and H.Q. White. 2001. Oviposition ecology of the Oregon spotted frog
at Beaver Creek, Washington. Washington Department of Fish and Wildlife. Olympia. 25 p.
Munger, J.C., M. Gerber, K. Madrid, M.-A. Carroll, W. Petersen, and L. Heberger. 1998.
U.S. National Wetland Inventory Classifications as Predictors of the Occurrence of Columbia Spotted Frogs (Rana luteiventris) and Pacific Treefrogs (Hyla regilla). Conservation Biology 12:320-330.
National Land Cover Description data. 1995. U. S. Geological Survey;
http://landcover.usgs.gov/classes.asp. National Wetlands Inventory habitat composition. 1979. U. S. Fish and Wildlife
Service; http://wetlands.fws.gov. Nussbaum, R.A., E.D. Brodie, Jr. and R.M. Storm 1983. Amphibians and Reptiles of the
Pacific Northwest. University of Idaho Press. Moscow, Idaho. Oregon Natural Heritage Program 1995. Rare, threatened and endangered plants and
animals of Oregon. Oregon Natural Heritage Program. Portland, Oregon. Pearl, C.A. 1999. The Oregon spotted frog (Rana pretiosa) in the Three Sisters
Wilderness Area/Willamette National Forest: 1998 Summary of Findings. Unpublished report to U.S. Fish and Wildlife Service, Portland, Oregon.
Pearl, C.A. and R.B. Bury. 2000. The Oregon spotted frog (Rana pretiosa) in the Three
Sisters Wilderness Area, Oregon: 1999 Findings. Unpublished report to U.S. Fish and Wildlife Service, Portland, Oregon. 14 pp.
Pearl, C.A. and M.P. Hayes. 2003. Habitat associations of the Oregon spotted frog
(Rana pretiosa): a literature review. Washington Dept. Fish and Wildlife report submitted to the Washington State Department of Transportation. 38 pp.
Pechmann, J. H. K., and H. M. Wilbur. 1994. Putting declining amphibian populations
in perspective: natural fluctuations and human impacts. Herpetologica 50:65-84. Pilloid, D. S., C. R. Peterson, and P. I. Ritson. 2002. Seasonal migration of Columbia
spotted frogs (Rana luteiventris) among complementary resources in a high mountain basin. Canadian Journal of Zoology 80:1849-1862.
Pulliam, H.R. 1988. Sources, sinks, and population regulation. American Naturalist
132:652-661.
Oregon spotted frog screen 16
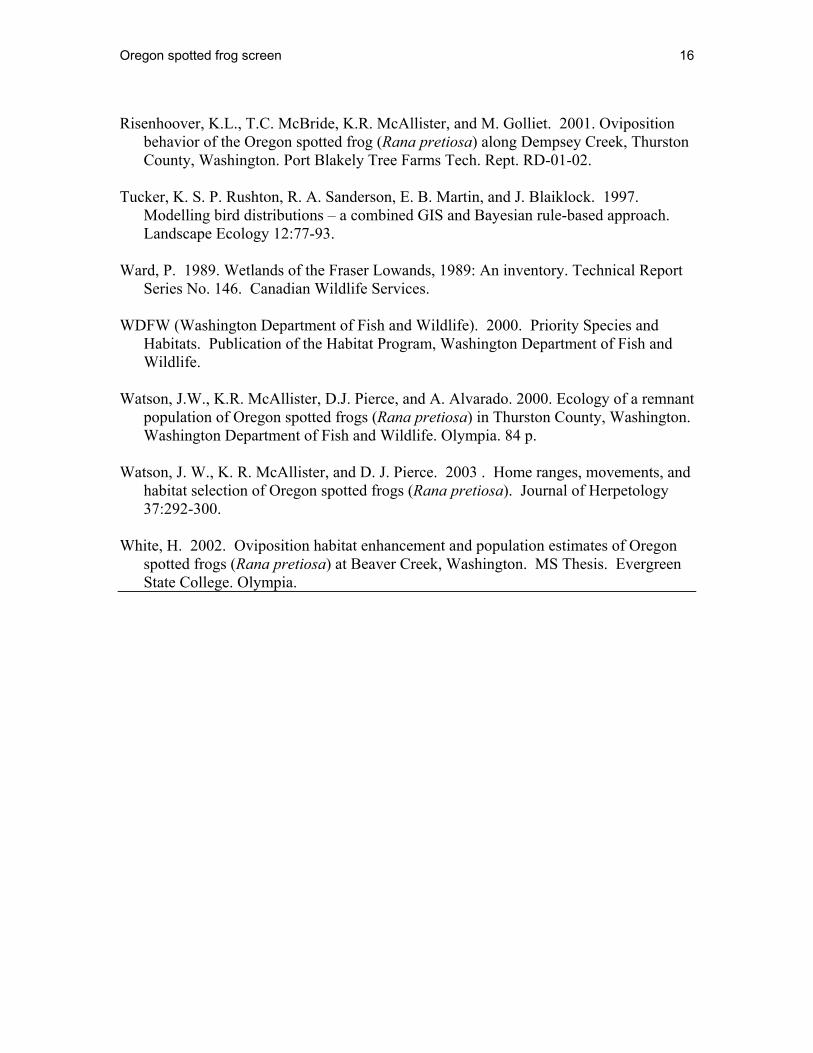
Risenhoover, K.L., T.C. McBride, K.R. McAllister, and M. Golliet. 2001. Oviposition
behavior of the Oregon spotted frog (Rana pretiosa) along Dempsey Creek, Thurston County, Washington. Port Blakely Tree Farms Tech. Rept. RD-01-02.
Tucker, K. S. P. Rushton, R. A. Sanderson, E. B. Martin, and J. Blaiklock. 1997.
Modelling bird distributions – a combined GIS and Bayesian rule-based approach. Landscape Ecology 12:77-93.
Ward, P. 1989. Wetlands of the Fraser Lowands, 1989: An inventory. Technical Report
Series No. 146. Canadian Wildlife Services. WDFW (Washington Department of Fish and Wildlife). 2000. Priority Species and
Habitats. Publication of the Habitat Program, Washington Department of Fish and Wildlife.
Watson, J.W., K.R. McAllister, D.J. Pierce, and A. Alvarado. 2000. Ecology of a remnant
population of Oregon spotted frogs (Rana pretiosa) in Thurston County, Washington. Washington Department of Fish and Wildlife. Olympia. 84 p.
Watson, J. W., K. R. McAllister, and D. J. Pierce. 2003 . Home ranges, movements, and
habitat selection of Oregon spotted frogs (Rana pretiosa). Journal of Herpetology 37:292-300.
White, H. 2002. Oviposition habitat enhancement and population estimates of Oregon
spotted frogs (Rana pretiosa) at Beaver Creek, Washington. MS Thesis. Evergreen State College. Olympia.

Oregon spotted frog screen 17
Appendix A. Soils present at wetland sites occupied by Oregon spotted frogs (Rana pretiosa) in Washington and British Columbia. WA soils data provided by NRSC-Spokane via ftp. Soils: Thurston County = SSURGO Soils: Klickitat County = soils are in draft form; original source is WDNR Conboy Reservoir, WA Conboy clay loam, 0 to 1 percent slopes Fanal sandy loam, 2 to 8 percent slopes Firoke stony fine sandy loam, 5 to 30 percent slopes Glen sandy loam, 0 to 2 percent slopes Grayland silty clay loam, 0 to 1 percent slopes Guler stony sandy loam, 2 to 20 percent slopes Kaiders stony loam, 5 to 30 percent slopes Kreft sandy loam, 0 to 2 percent slopes Mazdale very stony loam, 30 to 75 percent slopes Panak loam, 5 to 30 percent slopes Pinbit stony loam, 2 to 10 percent slopes Pinbit very stony sandy loam, 2 to 8 percent slopes Segidal sandy loam, 0 to 2 percent slopes Underwood loam, 2 to 8 percent slopes Dempsey Creek, WA Alderwood gravelly sandy loam, 0 to 3 percent slopes Alderwood gravelly sandy loam, 3 to 15 percent slopes Bellingham silty clay loam Everett very gravelly sandy loam, 0 to 3 percent slopes Everett very gravelly sandy loam, 3 to 15 percent slopes Everson clay loam Giles silt loam, 3 to 15 percent slopes Godfrey silty clay loam Kapowsin silt loam, 3 to 15 percent slopes McKenna gravelly silt loam, 0 to 5 percent slopes Norma silt loam Semiahmoo muck Spanaway gravelly sandy loam, 0 to 3 percent slopes Tenino gravelly loam, 3 to 15 percent slopes Yelm fine sandy loam, 3 to 15 percent slopes Rocky Prairie, WA Alderwood gravelly sandy loam, 0 to 3 percent slopes Alderwood gravelly sandy loam, 15 to 30 percent slopes Alderwood gravelly sandy loam, 3 to 15 percent slopes Alderwood gravelly sandy loam, 30 to 50 percent slopes Cagey loamy sand Cathcart gravelly loam, 15 to 35 percent slopes

Oregon spotted frog screen 18
Rocky Prairie, WA, continued Cathcart gravelly loam, 3 to 15 percent slopes Everett very gravelly sandy loam, 0 to 3 percent slopes Everson clay loam Indianola loamy sand, 0 to 3 percent slopes Indianola loamy sand, 3 to 15 percent slopes Kapowsin silt loam, 0 to 3 percent slopes Mukilteo muck, drained Norma fine sandy loam Norma silt loam Semiahmoo muck Spanaway gravelly sandy loam, 0 to 3 percent slopes Spanaway-Nisqually complex, 2 to 10 percent slopes Tisch silt loam Trout Lake, WA, West Unit No soils data available Trout Lake, WA, East Unit Chemawa loam, 2 to 8 percent slopes Flotag gravelly sandy loam, 0 to 2 percent slopes Fluvaquentic endoqualls, nearly level Kinftain cobbly loam, 30 to 65 percent slopes Troutlake loam, 1 to 5 percent slopes BC soils data provided by: Ward, P., K. Moore, and R. Kistritz. 1992. Wetlands of the Fraser Lowland, 1989: An inventory. Tech. Rep. Series No. 146, Canadian Wildlife Service, Pacific and Yukon Region, British Columbia, Canada. Fraser River Valley, British Columbia, Canada No site-specific data available. However, Fraser lowland wetlands lie on poorly drained fibrisols, mesisols, organic cryosols, gleysols, and humisols, and these soil types should be considered indicative of suitable habitat.

Oregon spotted frog screen 19
Appendix B. Site name, size, and elevations (m) for wetlands occupied by Oregon spotted frogs (Rana pretiosa) in Washington, Oregon, and British Columbia. Site Location Elev (ft) Elev (m) Size (Ha)
Conboy Reservoir WA 1840.0 560.8 2452.0 Dempsey Creek WA 141.0 43.0 444.8 Rocky Prairie WA 220.0 67.1 225.3 Trout Lake East WA 1952.0 595.0 396.3 Trout Lake West WA 2099.0 639.8 4.8 Big Marsh OR 4778.1 1417.0 - Buck Lake OR 4997.3 1482.0 715.0 Camas Prairie OR 3186.5 945.0 40.1 Crane Creek* OR 4289.2 1272.0 24834.9Crane Prairie/"Quinn R Campgr(Hayes1997)" OR 4494.9 1333.0 - Cross Water OR 4225.1 1253.0 - Cultus Cr Gravel Pit Pond OR 4515.1 1339.0 - Fourmile Creek* OR 4198.1 1245.0 - Gold Lake Bog OR 4865.8 1443.0 - Goose Lake OR 4892.8 1451.0 10.4 Hosmer Lake OR 5020.9 1489.0 107.6 Jack Creek OR 5321.0 1578.0 309.9 Klamath Marsh Wildlife Refuge OR 4633.1 1374.0 26852.9Lapine Pond OR 4346.5 1289.0 - Lava Lake OR 4795.0 1422.0 156.8 Little Cultus Lake OR 4815.2 1428.0 43.2 Little Deschutes/Casey Tract OR 4265.6 1265.0 - Little Lava Lake OR 4791.6 1421.0 107.8 Long Prairie OR 4400.5 1305.0 - Muskrat Lake OR 5041.1 1495.0 5.5 Penn Lake OR 4852.3 1439.0 16.4 Sunriver OR 4242.0 1258.0 - Unnamed Marsh/Mud Lake OR 4852.3 1439.0 4.1 Upper Williamson River OR 4724.2 1401.0 - Wickiup Reservoir drainage ditch OR 4370.1 1296.0 - Wickiup Reservoir Proper OR 4383.6 1300.0 - Winopee Lake OR 5054.6 1499.0 56.0 Wood River* OR 4191.4 1243.0 - Campbell Valley Regional Park BC 492.1 <150.0 279.4 Mountain Slough BC 492.1 <150.0 49.3 NRS Aldergrove (MS1 West) BC 492.1 <150.0 6.6 Seabird Island (Maria Slough) BC 492.1 <150.0 122.0 * these sites pooled for size data; - = data not available
Oregon spotted frog screen 20
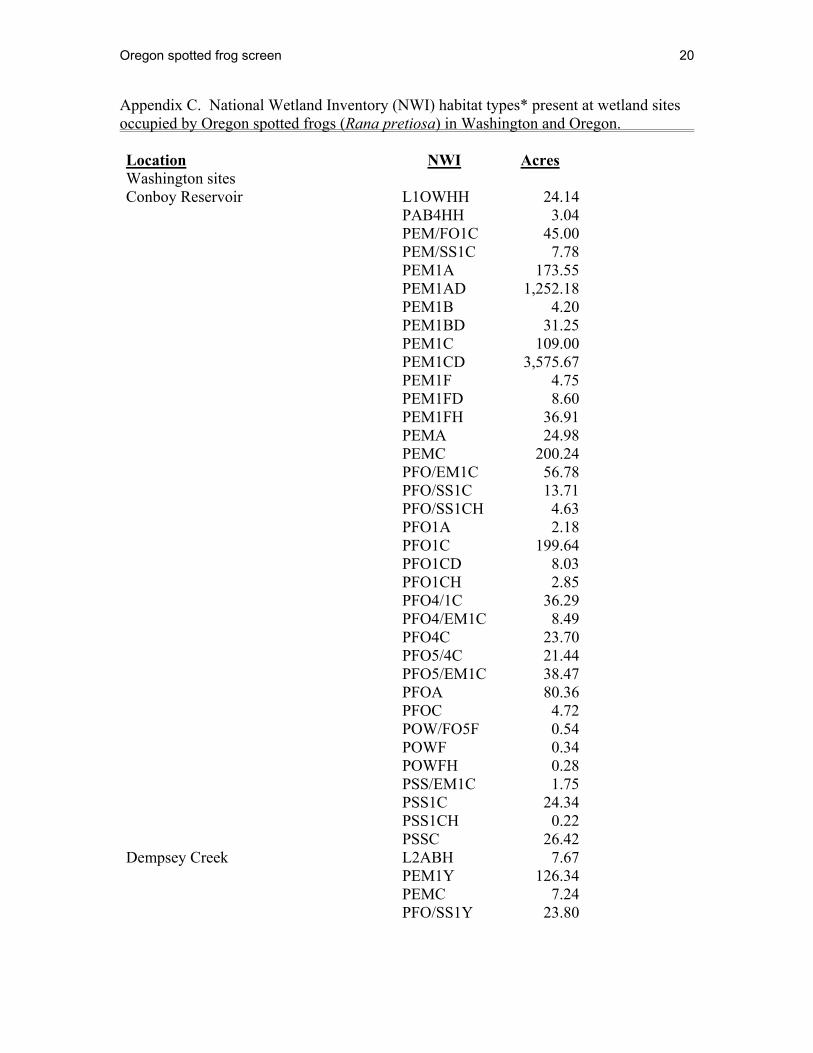
Appendix C. National Wetland Inventory (NWI) habitat types* present at wetland sites occupied by Oregon spotted frogs (Rana pretiosa) in Washington and Oregon. Location NWI Acres Washington sites Conboy Reservoir L1OWHH 24.14 PAB4HH 3.04 PEM/FO1C 45.00 PEM/SS1C 7.78 PEM1A 173.55 PEM1AD 1,252.18 PEM1B 4.20 PEM1BD 31.25 PEM1C 109.00 PEM1CD 3,575.67 PEM1F 4.75 PEM1FD 8.60 PEM1FH 36.91 PEMA 24.98 PEMC 200.24 PFO/EM1C 56.78 PFO/SS1C 13.71 PFO/SS1CH 4.63 PFO1A 2.18 PFO1C 199.64 PFO1CD 8.03 PFO1CH 2.85 PFO4/1C 36.29 PFO4/EM1C 8.49 PFO4C 23.70 PFO5/4C 21.44 PFO5/EM1C 38.47 PFOA 80.36 PFOC 4.72 POW/FO5F 0.54 POWF 0.34 POWFH 0.28 PSS/EM1C 1.75 PSS1C 24.34 PSS1CH 0.22 PSSC 26.42 Dempsey Creek L2ABH 7.67 PEM1Y 126.34 PEMC 7.24 PFO/SS1Y 23.80

Oregon spotted frog screen 21
Dempsey Creek, continued NWI Acres PFO/SSC 123.71 PFO1W 11.10 PFO1Y 268.01 PFOC 129.77 POWZ 1.04 PSS/EM1Y 26.77 PSS/EMC 13.36 PSS1Y 7.09 PSSC 352.35 R2OWZ 0.49 Rocky Prairie PEMA 3.45 PEMC 130.37 PEMF 57.35 PFOA 4.67 PFOC 137.61 PSSC 223.14 Trout Lake, East Unit PABH 4.52 PEMA 34.91 PEMC 75.68 PEMF 101.19 PEMH 14.38 PFOA 100.48 PFOC 158.09 PSS/EMF 62.85 PSSA 36.70 PSSC 370.05 PSSF 10.33 R3USC 9.56 Trout Lake, West Unit PEMF 2.37 POWHB 1.77 PSSC 7.70 Oregon sites Penn Lake PABH 14.08 PEMC 3.38 PEMF 22.22 PUBH 0.76 Unnamed Marsh/Mud Lake PEMF 10.09 Winopee Lake L1UBH 23.48 L2ABH 35.45 PABF 2.75 PABH 1.63

Oregon spotted frog screen 22
Winopee Lake, continued NWI Acres PEMF 0.39 PEMC 38.00 PFOC 15.74 PSSC 20.79 0.00 Jack Creek PEMA 2.04 PEMC 470.99 PFOA 6.02 PFOC 275.36 PSSA 1.93 PSSC 9.10 Lava Lake L1UBH 333.63 PABF 4.43 PABH 0.53 PEMC 5.12 PEMF 9.23 PEMH 27.33 PFOC 7.04 Little Lava Lake L1UBH 111.64 PABF 2.85 PEMC 45.00 PEMF 33.30 PEMH 13.75 PFOC 15.16 PSSC 1.38 PUBH 0.59 R3UBH 42.65 Hosmer Lake L1UBH 114.47 PABH 11.27 PEMC 6.89 PEMF 108.09 PEMH 24.34 PUBH 0.77 Muskrat Lake L1UBH 4.73 PEMC 1.96 PEMF 6.80 Little Cultus Lake L1UBH 70.53 PEMC 36.06 PUBH 0.14

Oregon spotted frog screen 23
Klamath Marsh N.W.R. NWI Acres L1ABH 453.77 PABFh 11.26 PABF 137.94 PABFx 4.74 PEMA 14,986.57 PEMB 2.02 PEMC 34,888.93 PEMCh 40.64 PEMCx 0.21 PEMF 14,347.27 PEMFh 4.28 PEMG 388.19 PFOA 248.11 PFOB 1.49 PFOC 167.22 PSSA 290.76 PSSC 31.84 PUBF 33.27 PUBFx 1.16 PUBG 5.81 PUBGh 0.76 PUBGx 1.55 PUSCx 0.22 R3ABH 6.80 R3UBH 271.84 Crane Cr., Fourmile Cr., Wood River L1ABHh 84.16 L1UBG 85.17 L1UBGh 51.56 L1UBHh 419.10 L1UBHx 1.65 L2ABFh 50.54 L2ABGh 1,217.43 L2ABHh 154.77 L2UBHh 6.28 PABF 418.78 PABFh 41.37 PABFx 0.98 PABG 9.18 PABGh 217.60 PABGx 0.31 PABH 6.33 PABHh 3.68 PEMA 802.29 PEMAh 38.24

Oregon spotted frog screen 24
Crane Cr., Fourmile Cr., Wood River NWI Acres PEMB 2.14 PEMC 29,058.43 PEMCdh 6,930.01 PEMCd 9,101.04 PEMCh 96.31 PEMCx 0.31 PEMF 2,834.72 PEMFh 6,611.01 PEMG 2.70 PEMGh 700.31 PFOA 388.00 PFOAh 9.94 PFOB 1.08 PFOC 770.27 PSSA 24.52 PSSC 687.01 PSSCh 54.35 PSSF 15.18 PSSFh 31.33 PUBFx 0.54 PUBH 10.88 PUBHh 5.32 PUBHx 4.98 R2ABFx 71.49 R2ABHx 22.28 R2UBFx 19.57 R2UBH 89.18 R2UBHx 136.28 R3UBH 40.23 R4SBFx 13.36 Buck Lake PEMA 36.14 PEMAd 106.42 PEMB 8.01 PEMC 78.42 PEMCb 2.81 PEMCd 1,130.10 PEMF 10.08 PEMFd 164.66 PFOA 2.64 PFOC 80.02 PSSB 0.75 PSSC 115.79 PUBF 0.35 PUSC 24.16
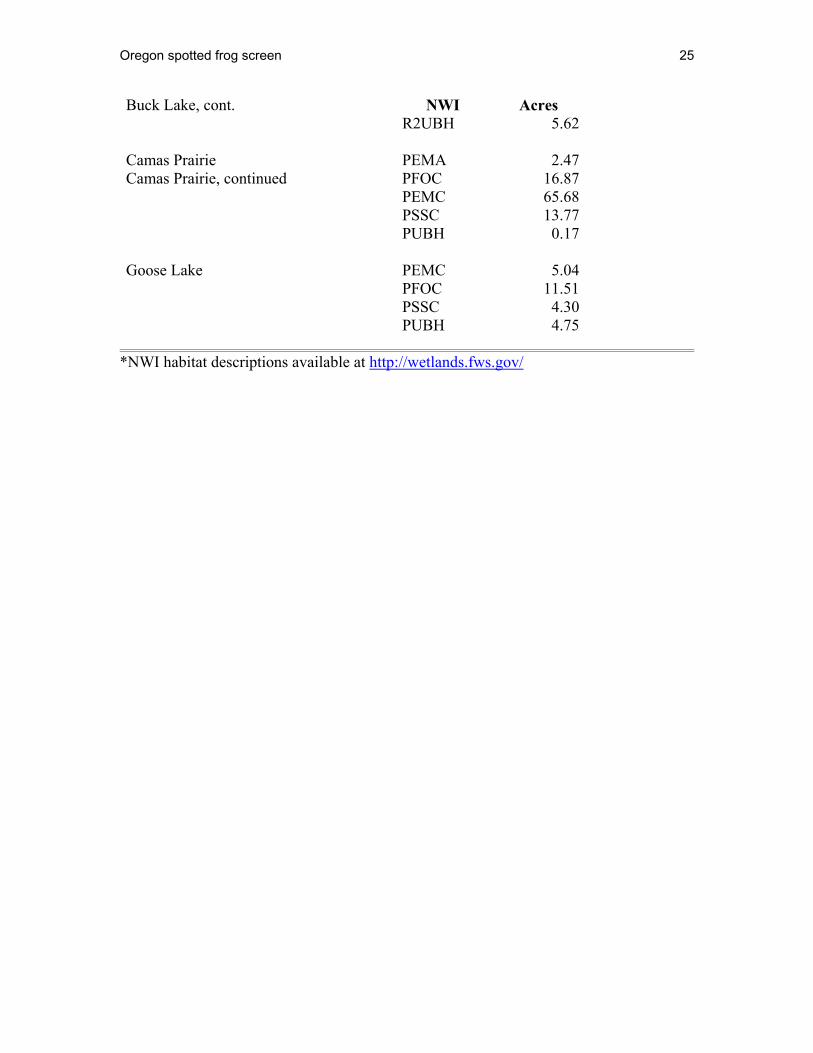
Oregon spotted frog screen 25
Buck Lake, cont. NWI Acres R2UBH 5.62 Camas Prairie PEMA 2.47 Camas Prairie, continued PFOC 16.87 PEMC 65.68 PSSC 13.77 PUBH 0.17 Goose Lake PEMC 5.04 PFOC 11.51 PSSC 4.30 PUBH 4.75
*NWI habitat descriptions available at http://wetlands.fws.gov/
Oregon spotted frog screen 26
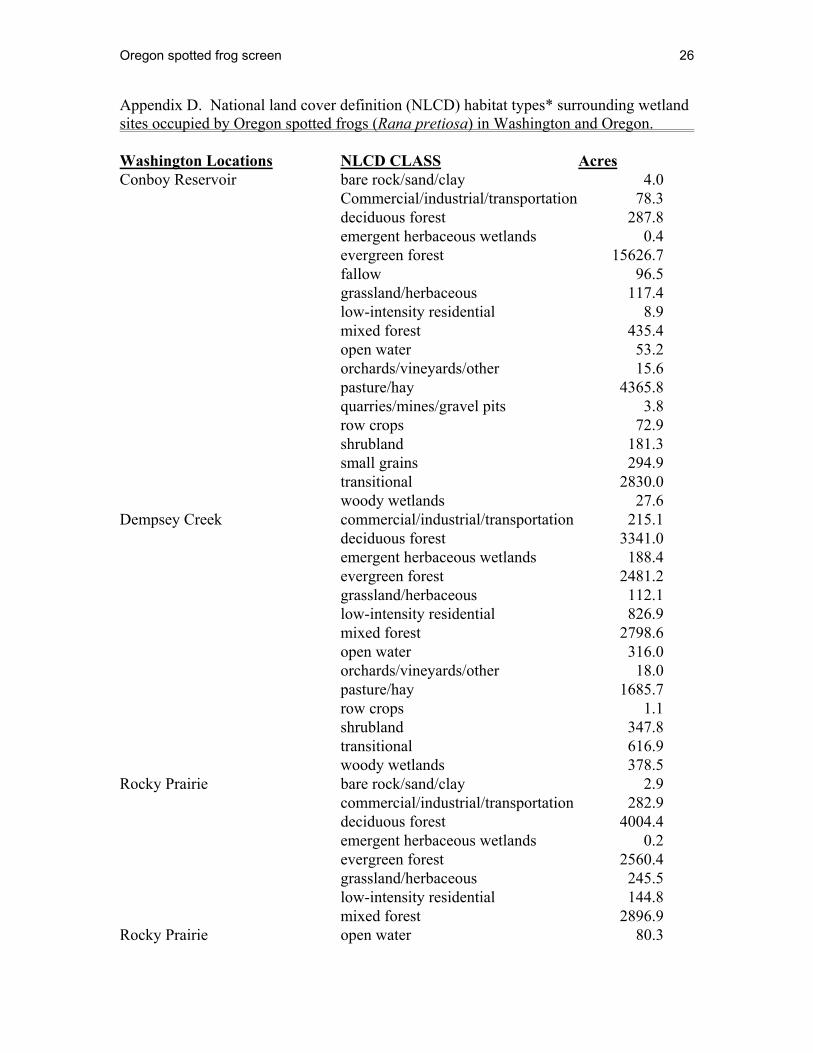
Appendix D. National land cover definition (NLCD) habitat types* surrounding wetland sites occupied by Oregon spotted frogs (Rana pretiosa) in Washington and Oregon. Washington Locations NLCD CLASS Acres Conboy Reservoir bare rock/sand/clay 4.0 Commercial/industrial/transportation 78.3 deciduous forest 287.8 emergent herbaceous wetlands 0.4 evergreen forest 15626.7 fallow 96.5 grassland/herbaceous 117.4 low-intensity residential 8.9 mixed forest 435.4 open water 53.2 orchards/vineyards/other 15.6 pasture/hay 4365.8 quarries/mines/gravel pits 3.8 row crops 72.9 shrubland 181.3 small grains 294.9 transitional 2830.0 woody wetlands 27.6Dempsey Creek commercial/industrial/transportation 215.1 deciduous forest 3341.0 emergent herbaceous wetlands 188.4 evergreen forest 2481.2 grassland/herbaceous 112.1 low-intensity residential 826.9 mixed forest 2798.6 open water 316.0 orchards/vineyards/other 18.0 pasture/hay 1685.7 row crops 1.1 shrubland 347.8 transitional 616.9 woody wetlands 378.5Rocky Prairie bare rock/sand/clay 2.9 commercial/industrial/transportation 282.9 deciduous forest 4004.4 emergent herbaceous wetlands 0.2 evergreen forest 2560.4 grassland/herbaceous 245.5 low-intensity residential 144.8 mixed forest 2896.9Rocky Prairie open water 80.3
Oregon spotted frog screen 27
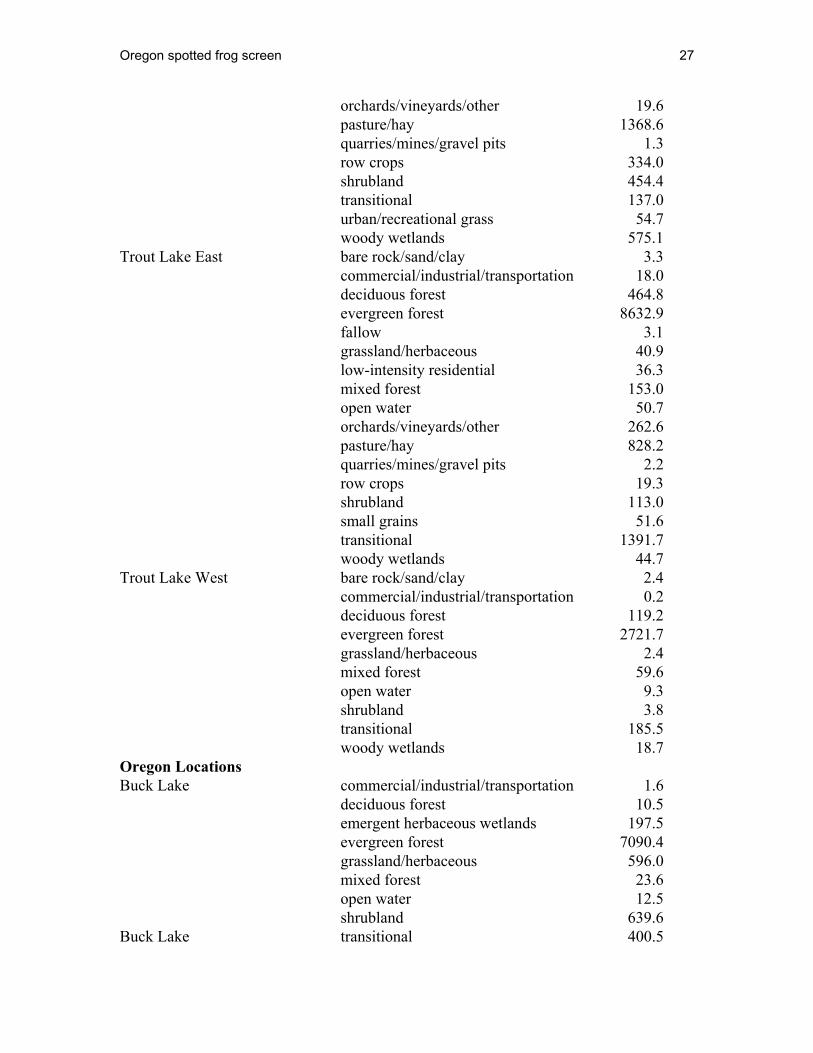
orchards/vineyards/other 19.6 pasture/hay 1368.6 quarries/mines/gravel pits 1.3 row crops 334.0 shrubland 454.4 transitional 137.0 urban/recreational grass 54.7 woody wetlands 575.1Trout Lake East bare rock/sand/clay 3.3 commercial/industrial/transportation 18.0 deciduous forest 464.8 evergreen forest 8632.9 fallow 3.1 grassland/herbaceous 40.9 low-intensity residential 36.3 mixed forest 153.0 open water 50.7 orchards/vineyards/other 262.6 pasture/hay 828.2 quarries/mines/gravel pits 2.2 row crops 19.3 shrubland 113.0 small grains 51.6 transitional 1391.7 woody wetlands 44.7Trout Lake West bare rock/sand/clay 2.4 commercial/industrial/transportation 0.2 deciduous forest 119.2 evergreen forest 2721.7 grassland/herbaceous 2.4 mixed forest 59.6 open water 9.3 shrubland 3.8 transitional 185.5 woody wetlands 18.7Oregon Locations Buck Lake commercial/industrial/transportation 1.6 deciduous forest 10.5 emergent herbaceous wetlands 197.5 evergreen forest 7090.4 grassland/herbaceous 596.0 mixed forest 23.6 open water 12.5 shrubland 639.6Buck Lake transitional 400.5
Oregon spotted frog screen 28
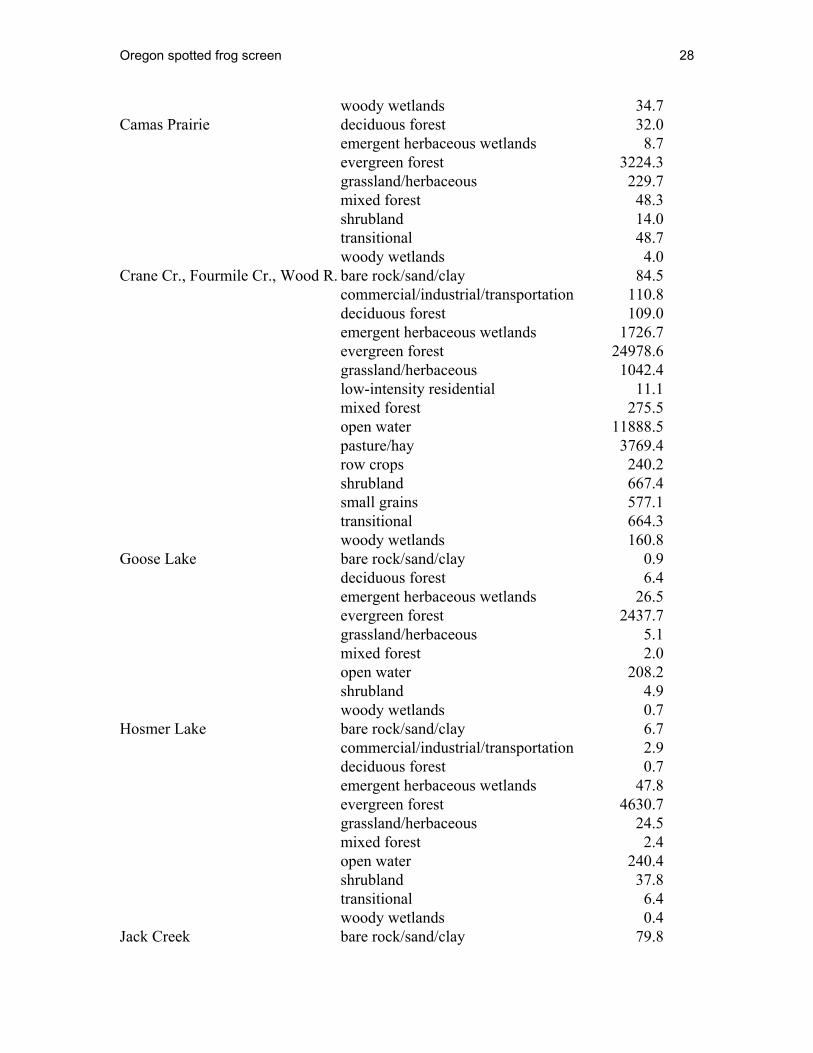
woody wetlands 34.7Camas Prairie deciduous forest 32.0 emergent herbaceous wetlands 8.7 evergreen forest 3224.3 grassland/herbaceous 229.7 mixed forest 48.3 shrubland 14.0 transitional 48.7 woody wetlands 4.0Crane Cr., Fourmile Cr., Wood R. bare rock/sand/clay 84.5 commercial/industrial/transportation 110.8 deciduous forest 109.0 emergent herbaceous wetlands 1726.7 evergreen forest 24978.6 grassland/herbaceous 1042.4 low-intensity residential 11.1 mixed forest 275.5 open water 11888.5 pasture/hay 3769.4 row crops 240.2 shrubland 667.4 small grains 577.1 transitional 664.3 woody wetlands 160.8Goose Lake bare rock/sand/clay 0.9 deciduous forest 6.4 emergent herbaceous wetlands 26.5 evergreen forest 2437.7 grassland/herbaceous 5.1 mixed forest 2.0 open water 208.2 shrubland 4.9 woody wetlands 0.7Hosmer Lake bare rock/sand/clay 6.7 commercial/industrial/transportation 2.9 deciduous forest 0.7 emergent herbaceous wetlands 47.8 evergreen forest 4630.7 grassland/herbaceous 24.5 mixed forest 2.4 open water 240.4 shrubland 37.8 transitional 6.4 woody wetlands 0.4Jack Creek bare rock/sand/clay 79.8

Oregon spotted frog screen 29
commercial/industrial/transportation 12.7 deciduous forest 1.1 emergent herbaceous wetlands 389.0 evergreen forest 14928.0 grassland/herbaceous 1079.7 mixed forest 6.9 open water 4.7 shrubland 1119.3 transitional 727.2 woody wetlands 200.6Klamath Marsh N.W.R. bare rock/sand/clay 114.5 commercial/industrial/transportation 220.4 deciduous forest 6.0 emergent herbaceous wetlands 3903.2 evergreen forest 68473.5 grassland/herbaceous 4663.8 mixed forest 23.8 open water 71.2 pasture/hay 5751.1 quarries/mines/gravel pits 7.3 row crops 1.1 shrubland 1233.4 small grains 93.6 transitional 1040.8 woody wetlands 178.1Lava Lake bare rock/sand/clay 2.2 commercial/industrial/transportation 4.9 deciduous forest 2.0 emergent herbaceous wetlands 68.9 evergreen forest 3993.5 grassland/herbaceous 27.4 mixed forest 4.9 open water 185.5 pasture/hay 2.2 shrubland 6.4 transitional 56.7 woody wetlands 1.1Little Cultus Lake bare rock/sand/clay 1.3 deciduous forest 5.8 emergent herbaceous wetlands 20.2 evergreen forest 3300.3 grassland/herbaceous 13.8 mixed forest 4.2 open water 212.4Little Cultus Lake shrubland 30.2

Oregon spotted frog screen 30
transitional 83.8 woody wetlands 8.0Little Lava Lake bare rock/sand/clay 4.7 commercial/industrial/transportation 3.8 deciduous forest 2.2 emergent herbaceous wetlands 46.0 evergreen forest 5289.2 grassland/herbaceous 36.9 mixed forest 3.6 open water 316.5 pasture/hay 0.4 shrubland 17.3 transitional 109.2 woody wetlands 1.1Muskrat Lake bare rock/sand/clay 0.4 deciduous forest 1.6 emergent herbaceous wetlands 14.5 evergreen forest 2308.7 grassland/herbaceous 3.6 mixed forest 1.1 open water 69.4 shrubland 1.6 woody wetlands 2.4Penn Lake deciduous forest 6.0 emergent herbaceous wetlands 27.8 evergreen forest 2837.5 grassland/herbaceous 2.7 mixed forest 8.2 open water 92.1 shrubland 9.8 woody wetlands 0.4Unnamed Marsh/Mud Lake deciduous forest 5.8 emergent herbaceous wetlands 21.6 evergreen forest 2046.9 grassland/herbaceous 3.6 mixed forest 2.4 open water 280.2 shrubland 4.0 woody wetlands 0.2Winopee Lake bare rock/sand/clay 0.9 deciduous forest 4.4 emergent herbaceous wetlands 12.7 evergreen forest 3653.3 grassland/herbaceous 6.0Winopee Lake mixed forest 1.6

Oregon spotted frog screen 31
open water 95.6 shrubland 2.0 woody wetlands 3.3
*NLCD definitions available at: http://landcover.usgs.gov/classes.asp
Oregon spotted frog screen 32
Appendix E. Summary GIS Statistics Extraction. Oregon spotted frog Point Data Preparation For the Washington locations, Oregon spotted frog observations were selected from the Heritage Database using Year of observation greater than or equal to 1990. The Oregon spotted frog locations generally clustered into five geographic areas. Oregon and British Columbia locations were provided by Wetland Polygon Location Attribution and Aggregation The wetland polygon covers used in the data summaries were manually encoded with a location attribute specifying Oregon spotted frog cluster locations. Once these procedures were completed it was possible to summarize the spatially contiguous, connected wetland polygons, by Oregon spotted frog geographic location. Washington. NWI data were extracted from the WDFW GIS library. Guided by the geographic clustering of the Oregon spotted frog observations, the NWI polygon coverage was encoded with a location attribute: LOC. The LOC labels were: Dempsey(10) Rocky Prairie(20), Trout Lake East(30), Trout Lake West(31), and Conboy(40). Oregon. NWI data were extracted from the NWI website. The geographic location of the Oregon Oregon spotted frog points were reviewed on-screen with the NWI polygon cover. A geographic grouping ID value was placed in the LOC attribute of the Oregon NWI polygon cover. Moving from north to south, the LOC values were: 20, 21, 22, 23,24,25,26,27,28,40,50,60,70,80. Most areas had complete NWI coverage. British Columbia. Wetland polygons were acquired for the lower Fraser River from Environment Canada, Canadian Wildlife Service. Oregon spotted frog points were reviewed on-screen and the wetland polygons encoded: Campbell Regional Park (10), NRS Aldergrove(20), Mountain Slough(30), Seabird Island (40). Feature interpretation and map compilation procedures differed between the Canadian and American wetland maps therefore causing data summary procedures to differ between the two countries. Many Oregon spotted frog locations did not fall within a wetland polygon, therefore, polygons were manually attributed (LOC) that were in close proximity to the Oregon spotted frog locations. Soil DataSummary Soil polygons were acquired from USDA NRCS. Data in Klickitat County were provided by NRSC in draft form. The Trout Lake West location did not have soils information. The NWI contiguous polygons were intersected with the soils polygons and summarized. Availability of Oregon soils data within the aggregated NWI polygons was highly inconsistent. An Oregon summary was not performed due soil data limitations. Soil data were not available to the project for the Fraser River, BC area as well.

Oregon spotted frog screen 33
Elevation Data Summary Elevation data were extracted from 10-meter DEMs for the Washington and Oregon Oregon spotted frog points. Digital elevation data were not available to the project for Fraser River, BC area. Land Cover Data Summary. Land cover data were generated from the USGS National Land Cover Data (NLCD). Land cover data were originally processed from Landsat Thematic Mapper satellite imagery, ca. 1992, with a pixel size of 30 meters. A 5314.95-foot buffer was generated for each set of contiguous NWI polygons in Washington and Oregon. For each contiguous NWI buffer, an overlay was performed to extract the raster land cover. The interior area within each buffer ( “donut hole” ) was excluded from the data summary. Land cover was not processed for the British Columbia area.