Screening for collusion: Evidences from the Indian cement...
19
Screening for collusion: Evidences from the Indian cement industry | BEH: www.beh.pradec.eu - 96 - © 2015 Prague Development Center Peer-reviewed and Open access journal ISSN: 1804-5006 | www.academicpublishingplatforms.com BEH - Business and Economic Horizons Volume 11 | Issue 2 | 2015 |pp.96-114 The primary version of the journal is the on-line version DOI: http://dx.doi.org/10.15208/beh.2015.08 Screening for collusion: Evidences from the Indian cement industry Sylwester Bejger Faculty of Economics and Management, Department of Econometrics and Statistics, Nicolaus Copernicus University of Toruń, Poland e-mail: e-mail: [email protected] address: ul. Gagarina 13a, 87-100 Toruń, Poland The paper is devoted to evaluation of the econometric method applied as a part of a variance screen in collusion detection procedure. Validation is based on ex-post analysis of Indian cement industry in the 1994 - 2009 time period and comparative study of the obtained results with factual evidences of collusion at that market. The method in question is based on MS(M)AR (p, q) Markov switching model specification. As a result of the research we could identify variability regimes consistent with theoretical motivation of the marker and detect collusion and competition phases partly consistent with historical evidences. However promising, method had some drawbacks applied to high frequency data in the context of variance screen. We proposed some solutions for further research to overcome it. JEL Classifications: L13, L61, C22 Keywords: Explicit and tacit collusion, cartel detection, behavioural screening, price variance, Markov switching model, Indian cement market Introduction One of the underlying problems of competition policy is detecting and assessing various forms of anticompetitive behaviour that are listed directly or indirectly in the sources of the anti-trust law. An important and most widespread1 category of competition concerns is that of horizontal constraints among firms that have the prevention, restriction or distortion of competition as their object or effect. This category includes hardcore cartel cases of price fixing and market sharing, but also more sophisticated anticompetitive horizontal agreements such as joint sales agencies, agreements on limiting marketing activities, capacity restrictions and other aspects of production, information sharing on prices and sales, service and distribution agreements, export cartels, and exclusionary practices towards entrants 2 . Within a set of horizontal anticompetitive practices most of them are connected with oligopolistic markets or industries. In our work we want to concentrate on such a market structure. That distinction is necessary, as behavior of players in oligopoly has a very different strategic motivation than behavior of players in the other structures. For European competition legislation leading role plays the Treaty on the Functioning of the European Union (FEU Treaty). Competition rules are set out in Articles 101-106 of the FEU Treaty. Especially important in a case of horizontal practices is Article 101(1) FEU Treaty and the Horizontal Guideline 3 . Those two sources establish the prohibition of agreements and concerted practices among undertakings affecting trade 1 About 43% o formal European Commission decisions on competition till year 2009 was connected with horizontal agreements. See: Russo et. al (2010). 2 Russo et. al (2010), p. 26. and various antitrust guidelines, for example: U.S. DOJ (2005). 3 Guidelines on the applicability of Article 101 of the Treaty on the Functioning of the European Union to horizontal co-operation agreements.
Transcript of Screening for collusion: Evidences from the Indian cement...
Screening for collusion: Evidences from the Indian cement industry | BEH: www.beh.pradec.eu
- 96 - © 2015 Prague Development Center
Peer-reviewed and Open access journal
ISSN: 1804-5006 | www.academicpublishingplatforms.com
BEH - Business and Economic Horizons
Volume 11 | Issue 2 | 2015 |pp.96-114
The primary version of the journal is the on-line version DOI: http://dx.doi.org/10.15208/beh.2015.08
Screening for collusion: Evidences from the Indian cement industry
Sylwester Bejger
Faculty of Economics and Management, Department of Econometrics and Statistics,
Nicolaus Copernicus University of Toruń, Poland
e-mail: e-mail: [email protected]
address: ul. Gagarina 13a, 87-100 Toruń, Poland
The paper is devoted to evaluation of the econometric method applied as a part of a variance screen in collusion detection procedure. Validation is based on ex-post analysis of Indian cement industry in the 1994 - 2009 time period and comparative study of the obtained results with factual evidences of collusion at that market. The method in question is based on MS(M)AR (p, q) Markov switching model specification. As a result of the research we could identify variability regimes consistent with theoretical motivation of the marker and detect collusion and competition phases partly consistent with historical evidences. However promising, method had some drawbacks applied to high frequency data in the context of variance screen. We proposed some solutions for further research to overcome it.
JEL Classifications: L13, L61, C22
Keywords: Explicit and tacit collusion, cartel detection, behavioural screening, price variance, Markov
switching model, Indian cement market
Introduction
One of the underlying problems of competition policy is detecting and assessing various forms of anticompetitive behaviour that are listed directly or indirectly in the sources of the anti-trust law. An important and most widespread1 category of competition concerns is that of horizontal constraints among firms that have the prevention, restriction or distortion of competition as their object or effect. This category includes hardcore cartel cases of price fixing and market sharing, but also more sophisticated anticompetitive horizontal agreements such as joint sales agencies, agreements on limiting marketing activities, capacity restrictions and other aspects of production, information sharing on prices and sales, service and distribution agreements, export cartels, and exclusionary practices towards entrants2. Within a set of horizontal anticompetitive practices most of them are connected with oligopolistic markets or industries. In our work we want to concentrate on such a market structure. That distinction is necessary, as behavior of players in oligopoly has a very different strategic motivation than behavior of players in the other structures. For European competition legislation leading role plays the Treaty on the Functioning of the European Union (FEU Treaty). Competition rules are set out in Articles 101-106 of the FEU Treaty. Especially important in a case of horizontal practices is Article 101(1) FEU Treaty and the Horizontal Guideline3. Those two sources establish the prohibition of agreements and concerted practices among undertakings affecting trade
1 About 43% o formal European Commission decisions on competition till year 2009 was connected with
horizontal agreements. See: Russo et. al (2010). 2 Russo et. al (2010), p. 26. and various antitrust guidelines, for example: U.S. DOJ (2005). 3 Guidelines on the applicability of Article 101 of the Treaty on the Functioning of the European Union to
horizontal co-operation agreements.
Screening for collusion: Evidences from the Indian cement industry | BEH: www.beh.pradec.eu
- 97 -
Busin
ess a
nd E
conom
ic H
orizons
© 2015 Prague Development Center
between Member States when restrictive of competition within the common market. Prohibited horizontal practices (agreements or concerted practices) are named collusive. Collusion may be sustained by a variety of forms, from a formally organized structure to a minimal or no communication between the parties (common understanding). Modern industrial organization, competition policy literature and, to some extent, case law distinguish two types of collusion - explicit and tacit. Economic understanding of both types of collusion is well defined and common, as a market outcome in which prices and/or other characteristics differs from some competitive level (Motta, 2004), Buccirossi (2008)).
On the other hand competition law faces the challenge of distinguishing between these different situations. The discussion is a long lasted one (we can point to Posner (1969) as one of the most influential early works on the topic) and evolves to conclusion that there could exists potential “enforcement gap” whereby firms engaged in strategic interactions may be able to sustain (undesirable) collusive outcomes without violating cartel laws (OECD, 2015). The last works of Hay (2013), Petit (2012), and Kaplow (2011) could be a sign of new direction in practice of antitrust law, towards unification with economic theory of collusion. However, when primary goal is to quantitatively detect (confirm) collusion ex-post, the difference between legal interpretation (a specific antitrust infringement) and economic understanding (a market outcome of some strategic interactions) of collusion is not as important as we utilize publically observable statistical data. Within the meaning of the contemporary industrial organization (and in the opinion of the author of this article) most of the anticompetitive behaviours that can be observed in the industries are the results of strategic interactions between market players that could be described by suitable models of game theory. The set of game theory models (usually non-cooperative, static or dynamic, with various strategic and informational assumptions) that replicate the mechanism of an explicit and especially, tacit collusion is very rich and could be a basis of research hypotheses concerning market players‟ behaviour1. However, their empirical application seems to be very challenging. The causes of such a situation can be as follows:
- Informational advantage of the participants of a collusive agreement over the observer: players possess private information that is protected by virtue of law (company‟s confidential information), or is protected because it is a proof for breaching the law;
- Scarce resources of publicly available statistics at the levels of industrial disaggregation or individual players.
Taking into account the practical dimension, the possibility of objectively detecting and assessing collusion2 is highly demanded. There is a significant set of researches that have already been done to find and test adequate methods for realizing the task. One of the most promising tools in this context is a behavioural screening (Harrington, 2006). The present paper is devoted to testing one of the econometric methods applied for the purposes of detecting collusion in a screening procedure. The method in question, based on the Markov switching model specification, was proposed by Bejger (2009), and the present paper is another attempt to verify it; however, it uses a sample of a considerably greater length and the data with a higher frequency of observations. We used statistical data from the Indian cement industry as a testing data set.
1 Analysis of current literature dealing with various strategic models of collusive behavior (with such strategic
variables as prices, quantities, capacities, information‟s announcements, marketing efforts etc.) is far beyond scope of this paper. We can point here to well known sources of knowledge and literature in a topic, such as Jacqemin and Slade (1989), Tirole (1998) or Vives (1999).
2 As pointed out in Connor and Helmers (2006), in the time period 1990-2005 alone, the existence of 283 so-called „hard core cartels‟ of domestic and/or global reach was proved. Financial penalties of the total nominal value of 25.4 billion USD were imposed on them. Therefore, the ability to prove objectively the existence of a collusive agreement in an industry is not only of a scientific character but also practical and constitutes an important (or key) element in anti-trust proceedings affecting the involved parties.
Screening for collusion: Evidences from the Indian cement industry | BEH: www.beh.pradec.eu
- 98 - © 2015 Prague Development Center
Research objective and methodology
The major objective of the research is a validation of the usability of the proposed econometric method by ex-post confirmation of detection of a collusive agreement of cement producers in India in the time period 1994 - 2009. Other research objectives include checking the functioning of the selected method for the data with the frequency of observations higher than those from the previous application (we have weekly data), as well as conducting a comparative analysis of conclusions which may be drawn from the present research and from other research with a similar objective, but a different methodology.
A general method of detecting collusive agreements in a situation when statistical information is limited needs to be relatively cost-effective (requiring little human, time and hardware resources) and convincing. It can be assumed that such a method ought to meet, at least, the three following conditions:
- It needs to utilize the provided statistical data effectively and be oriented towards the use of information on industries that is most frequently available in the resource of the public statistical data - these are usually series of price levels (price indexes) of suitable products at various stages of distribution and/or series of the product‟s sales levels (indexes);
- It needs to be a method of initial and quick verification of a hypotheses of the existence of a collusive agreement in an industry/a corresponding market which may be applied straightforwardly to the existing data;
- It needs to be tied to proper theoretical models generating collusive equilibria.
The methods within which the above postulates are attempted to be realized are the indirect methods of detecting collusion which are defined as collusion (cartel) screens (structural or behavioural) (Harrington (2008). A structural approach typically involves screening a set of industries or markets in the attempt to identify those which exhibit characteristics which make them more prone to collusion. The present paper is devoted to behavioural screening, which are generally designed to flag firms behaviour or market outcomes which may raise suspicions that firms have in fact colluded. Cartel screens itself are economic tools designed to analyse observable economic data and information, such as the information on various product and market characteristics, the data on costs, prices, market shares, various aspects of firm behaviour, etc. and flag markets which may have been affected by collusion. Abrantez-Metz (2013) defines screening as: “the ability to flag unlawful behaviour through economic and statistical analyses.” Harrington‟s definition focuses on the methodology used: screening refers to the process whereby industries for which the existence of a cartel is likely are identified. […] Screening methods [are] designed to pick up the transition from non-collusion to collusion - looking for a radical change in firm behaviour - or the stationary collusive phase - finding differences in behaviour from when firms compete (Harrington, 2006)”. Especially, the second view is representative to actual research. There is substantial literature on behavioural screening based on various screening markers and variables. We can point to Porter and Zona (1999), Bajari and Ye (2003) as important papers on screening. However, this works are off topic of our research as connected with the bid rigging conspiracies and based on different theoretical basis (theory of auctions). As the important findings in screening - based detection of collusive oligopolistic behavior we can list, besides above mentioned works of Harrington (2006; 2008), Abrantez-Metz (2013) and Abrantes-Metz and Bajari (2010) the studies of Lorenz (2008), Blanckenburg and Geist (2009) and Blanckenburg et al. (2012).
Lorenz (2008) developed a model called Coordination Failure Diagnostics (CFD) which analyses 5 market processes with associated markers of collusion. He applied his method to various industries, but the main object of research was a German cement market. In an assessment of price volatility in that market he stated that “cement producer determined
Screening for collusion: Evidences from the Indian cement industry | BEH: www.beh.pradec.eu
- 99 -
Busin
ess a
nd E
conom
ic H
orizons
© 2015 Prague Development Center
their prices at a high level and adapted them sporadically. The slump took place after the detection of the cartel in 2002, when cement prices dropped dramatically. At the same time Readymix (a player in that market) started a price war in all four local markets in Germany.” That observation is coherent with general, supergame motivation of a variance marker.
In another interesting work Blanckenburg and Geist (2009) enhanced findings of Lorenz (2008) and developed a testable System of Cartel Markers (SCM). They use the German cement industry as a test market where a cartel had been prosecuted by German antitrust authority in 2002. As a competitive benchmark they analyzed the 4 other German industries. The most interesting conclusion, in a context of our work, was a confirmation that cartel phase could be identified by such markers, included in SCM method, as constant excess rates of return, lower price volatility and constant capacities. Empirical studies usually include identification of the so-called collusion markers1 (markers of non-competitive behaviour), which are the certain patterns of associated economic variables (or relationships of variables) typical to collusion. Those patterns relate to:
a) relationships between players‟ prices and changes in the demand on the market;
b) stability of prices and market shares;
c) relationships between players‟ prices;
d) investments made in production capacity.
Some of the most promising collusion markers are those based on the analysis of changes in the variance of market price processes. It is essential that players in the industry should manufacture a homogeneous product (of a high substitutability, based on a similar technology).
An analysis of price levels, price trends, or even of relationships between prices and production factors (where the latter occur) cannot be regarded as a collusion marker. The exception, however, is an analysis of seasonal volatility related to a variability analysis, e.g. in Bejger (2010).
A screen based on price variability has at least three attributes of a good screen in development and construction2:
- It is easy to implement, being based on limited set of variables (usually series of market price(s));
- It has theoretical support and therefore;
- It creates a view of how cheating will affect market outcomes.
A price variability analysis has a strong theoretical motivation that makes it possible to combine disturbances in the variance of a price process and the possibility of occurrence of collusive equilibrium in an industry.
The method of the identification of collusive equilibrium is based on the following assumption: The variance of a price process is on average lower in collusion phases and may be subject to changes of the regime type.
Theoretical motivation of the method
Why does the product price variability in the market collusion phase need to be relatively low and why is it to signal that kind of market equilibrium?
The question leads to the theoretical motivation for a selected marker. In the author‟s opinion, the basis for the specification of every detection method applied for collusive equilibrium as well as for collusive markers needs to be an adequate model of strategic
1 Determined in that way in Harrington (2006). Hüschelrath (2010) constructed a list of usually analyzed
economic variables associated with markers. 2 As listed in Abrantez-Metz (2013) and Abrantes-Metz and Bajari (2012).

Screening for collusion: Evidences from the Indian cement industry | BEH: www.beh.pradec.eu
- 100 - © 2015 Prague Development Center
interaction utilizing the instruments of the game theory. The three most essential model specifications may be distinguished here as a source of testable hypotheses related to the price variance.
In their work, Rotemberg and Saloner (1990) developed a repeated game with incomplete information corresponding to the phenomenon of the so-called „collusive price leadership‟. The phenomenon consists in a price change being announced by the leader (usually it is an upward pricing) prior to the date when the new price becomes effective. Other market players follow their leader in establishing the price level and the date of the new price implementation. The major conclusion drawn from the paper is the statement that in the equilibrium of the game constructed by them the market price controlled by the leader is characterized by some rigidity, which means a variance that is lower than the variance in the case of competitive equilibrium.
Athey, Bagwell and Sanchirico (2004) proposed a repeated game pricing model (a supergame) with exogenous distortion of players‟ costs (which constitute their private information) and of observable prices. Therefore, this game is one with incomplete information where a stage game is Bertrand competition model with the Bayesian-Nash equilibrium. The authors, applying their own concept of the game equilibrium of the SPPE type, proved that in the equilibrium collusive prices can be observed, and that they are characterized by rigidity (used to maintain the collusion). Therefore, in the collusion phase, the price variance should be lower. In addition, it must be added that on the equilibrium path price wars should not occur, which is typical of the majority of standard supergames based on punishment strategies.
In their article Maskin and Tirole (1988) introduced a repeated game model with players‟ asynchronous choices. Two players participate in the game and they take turns in movements. For the action space being a set of prices, reactions‟ functions of the Markov type and a sufficiently high discount factor, there exists a unique equilibrium that is subgame perfect (MPE) and that equilibrium Pareto dominates over other equilibria and is characterized by price-rigidity at the monopoly price level. That price is called „focal price‟. The Maskin and Tirole model is, in fact, a truly dynamic version of the mechanism of the kinked demand curve that has been known since the 1930s of XX century. Equilibrium strategies for the model (provided suitable assumptions are made) imply a small price variance in a collusive agreement.
Moreover, Bejger (2010a) shows that the supergame model with a constant structure of cartel quotas indicates the following:
a) A possibility of the occurrence of a price war phase evoked by the player that did not intend to keep or enter a collusive agreement due to a too low predicted or actual market share;
b) On average, a lower market price variance in the collusive agreement phase caused by the price rigidity in the periods when the market was shrinking.
The “variance screen” (in short) was applied in the literature earlier. The works by Connor (2005), Abrantes-Metz et al. (2006), Bolotova et al. (2008), Jiménez and Perdiguero (2011) and the most prominent Abrantes-Metz et al. (2012) on LIBOR manipulation are good examples, but in the line of that paper i.e. an ex-post validation of the screen and especially a validation of econometric tool for that particular screen, are the works of Hüschelrath and Veith (2014) concerning the German cement market, where the authors show that buyers could have detected this cartel ahead of the launch of investigations, through the use of screens for structural breaks, Esposito and Ferrero (2006), where the authors tested and confirmed the power of the variance screen for prices to detect previously known illegal conspiracies in gasoline market and Bejger (2009) and Bejger and Bruzda (2011) devoted to assessment of two statistical tools for a variance screen on the basis of the well-known Lysine conspiracy.
To summarize, if a collusive marker is to be based exclusively on the analysis of a price process, then we can formulate the hypothesis that in the collusive agreement phase the

Screening for collusion: Evidences from the Indian cement industry | BEH: www.beh.pradec.eu
- 101 -
Busin
ess a
nd E
conom
ic H
orizons
© 2015 Prague Development Center
price variance would be, on average, lower than in the competition phase. We can also expect regime changes in the variance, while passing from the collusive agreement phase to the competition phase; however, it cannot be stated whether that phase is the punishment phase in a repeated game, or a breakdown of an explicit collusion cartel brought about by some other causes1.
Econometric instrument
Within the econometric methods2 of detecting changes in the process variance, the most beneficial are the methods which are objective and coherent with theoretical motivation - which means those for which the knowledge of the moments of changes in the variance is unnecessary. This postulate is fulfilled by the following two instruments: the Markov switching model of the price process and a wavelet analysis of a variance.
Markov switching model of the MSV or MSMV type for the variance or for the mean of the price process.
Dynamic econometric models with Markov switching are well-known in the literature, from Hamilton‟s seminal works (1989, 1994), Kim and Nelson (1999), Clements and Krolzig (2000), models with switching in variance or both variance and mean introduced by Tumer et al. (1989), Yin (2003), MSVAR models Linne (2002), Krolzig (2001) to general specification of MS(M)(AR(p))GARCH(p,q) (Hamilton and Susmel (1993)). The set of empirical applications of MS models is huge, but in the context of behavioural screening we know only work of Bejger (2009). Applying such a method in this context has the following advantages:
- The method is theoretically coherent with the strategy structure of the supergame model equilibrium ( supports trigger strategies well-known from that kind of models);
- It enables us to model directly the structural changes of the variance process without using any extra artificial variables; such modelling is not possible in, e.g., the ARCH/GARCH specifications;
- The method is coherent with the informational asymmetry occurring between cartel members and an observer. The MSV specification does not require observing (knowledge of) the state variable, so it can serve the purpose of actual detection of the variance regimes and objective determining of the switching moments, in order to detect the phases of collusive agreements and competition;
- There is a possibility of an initial graphical assessment of collusion/competition phase on a basis of smoothed probabilities graphs.
We consider Markov-switching heteroscedasticity specification with invariant mean, intercept and autoregressive parameters (MSH in Krolzig terminology, see Krolzig (1998)) of general MS(M) specification. General formula of this model is given by (1)3:
p
m
tmtmt uyy1
0 , (1)
where: ),0(~ 2
tSt Nu .
1 We do not address in this paper the problem of distinguishing tacit and over collusion on the screen basis. 2 The examples of works that apply the discussed marker with the use of various statistical and econometric
instruments include Abrantes-Metz et al. (2006) and Bolotova et al. (2008). 3 As regards the specification and estimation methods see Davidson (2004), Hamilton (1989), Hamilton and
Susmel (1994), Krolzig (1998).
Screening for collusion: Evidences from the Indian cement industry | BEH: www.beh.pradec.eu
- 102 - © 2015 Prague Development Center
In model (1) parameters 0 , m are state independent. Only regime dependant parameter
is variance 2
u which is a random variable switched between the values from a finite set
of values depending on the current state St. where St = 1, ..., M.
Variable tS is assumed to be the exogenous, homogeneous Markov process with fixed
transition probabilities ijp where: ijp = Pr(St =j| St-1 = i). Which means that the
probability of the process at the moment t relies on the state of this process at the moment t-1, and is defined as the probability of transition from state i into state j.
The probability that the observed yt process is in the j state in the t period is provided by means of the following filtering equation (updating equation):
)|Pr(),|(
)|Pr(),|()|Pr(
11 1
11
tt
M
i ttt
ttttttt
iSiSyf
jSjSyfjS , (2)
where, t denotes all the information (i.e. yt-j, St-j, j 0 ) that is available in the t moment and:
)|Pr()|Pr( 1111 tt
M
i ijtt iSpjS , (3)
where, the transition probability ijp constitutes M(M-1) parameters to be estimated.
The form of conditional density function of observed variable ),|(. 1 tt jSf requires
accepting the assumptions on the type of distribution.
The estimation of model parameters may be obtained through the maximum likelihood method. For this purpose, a likelihood function is used:
)|Pr(),|(Prlog 11 1
1
tt
M
i ttt
T
t
jSjSyfL , (4)
The maximization of the function (4) is performed by means of a well-known method based on the EM or BFGS algorithms.1 We have to mention here, that an alternative tool for variance screen evaluation could be a wavelet analysis, applied for this purpose by Bejger and Bruzda (2011), but for the purposes of this research, the MSV (MSH) model was selected as the econometric instrument to be applied.
Empirical analysis
The researched subject is the Indian cement industry. The research covers the time period from 1994 to 2009. The information on the industry is derived mainly from Anand (2009).
1 For detailed information see: Krolzig (1998, p.8).
Screening for collusion: Evidences from the Indian cement industry | BEH: www.beh.pradec.eu
- 103 -
Busin
ess a
nd E
conom
ic H
orizons
© 2015 Prague Development Center
Characteristics of the cement industry
Cement constitutes one of the major building materials used in the world economy. It must be explained that, unless mentioned otherwise, while talking about cement production what we mean is the grey cement (Portland cement), widely used in the world construction industry. The cement production technology is typically based on the so-called „dry method‟. As a result of the process, clinker is obtained, which is then mixed with other ingredients to obtain a final product - cement. In fact, the same manufacturing technology is used worldwide. Also, cement use across the globe is similar; the majority of it goes for producing concrete, a relatively small part of cement production is used directly in construction works (for instance, subgrade stabilization in road building). For those reasons, we can assume that Portland cement is a homogeneous product1 and does not have any near substitutes. From that point of view, a variance screen is very justifiable in that case. The overall world production of cement in 2008 amounted to 2,000 Mt.
It must be emphasized that cement manufacturing is connected with certain considerable barriers to entering the industry (high costs of the installation of a production line, logistic barriers concerning the necessity of locating production facilities in the neighbourhood of raw materials, a very high energy consumption that characterizes the production process and due to which it is necessary to select a location with access to energy sources). That fact together with the lack of substitutes for cement and the strong links between the demand for cement and the civilisation development means that cement industries foster making collusive agreements and setting up cartels. Indeed, the cement industry is one of most cartelized industries on the global scale. In order to illustrate that phenomenon, in the time period 1994-2009 alone, the existence of 11 collusions in 11 countries and of one continent-spanning cartel was detected (the players were sued).2
The Indian cement industry (as at the beginning of 2009) had the installed capacity of approximately 217 Mt (in comparison, in author‟s domestic economy of Poland it was 17 Mt) and was the world‟s second largest producer (China ranked first). The industry comprised of 51 companies altogether (in comparison, in Poland there are 6 main players) but 12 major players controlled 60% of the cement market. The yearly average rate of consumption growth in India in the years 2002 - 2009 reached 8.4% (the minimum value of 5.8% was reached in 2004 and the maximum of 11.35% in 2006).
It must be noted that up to 1989 the functioning of the cement industry in India had been controlled (regulated), entirely or partially, by the state administration.
Statistical data
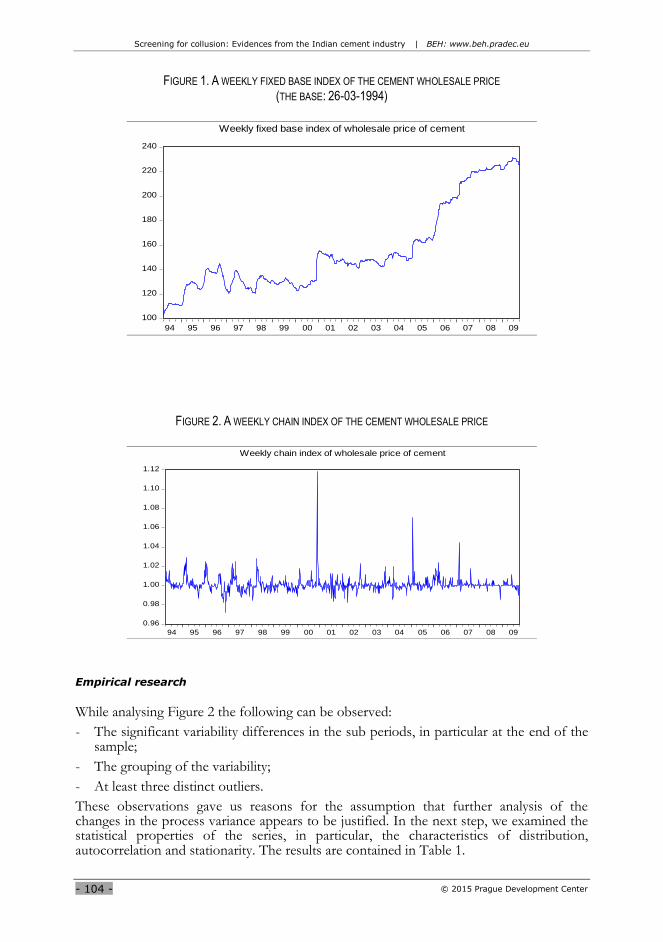
The variable that is going to be taken for the purpose of the empirical analysis is the average wholesale price of cement. The research included the index of weekly wholesale prices of cement3 for the period from 02 April 1994 to 10 October 2009 (811 observations). The raw data are illustrated in Figure 1.
The data presented in Figure 1 do not reflect precisely the phenomenon which is the subject of the research (changes within the variability of prices). Therefore, the series was converted to chain index (named pricechidx). The graphical representation of an index is shown on Figure 2.
1 There are of course types of construction cement dependent on the content of clinker in its composition,
e.g., in Poland this content ranges from nearly 100% in the CEMI class to 5% in CEMIIIC. However, a mention should be made that the majority of cement sold is either the CEMI or CEMII class.
2 For detailed information see, for example Bejger (2011, p.3) 3 Cement Wholesale Price Index, the data are available on http://eaindustry.nic.in/
Screening for collusion: Evidences from the Indian cement industry | BEH: www.beh.pradec.eu
- 104 - © 2015 Prague Development Center
FIGURE 1. A WEEKLY FIXED BASE INDEX OF THE CEMENT WHOLESALE PRICE
(THE BASE: 26-03-1994)
FIGURE 2. A WEEKLY CHAIN INDEX OF THE CEMENT WHOLESALE PRICE
Empirical research
While analysing Figure 2 the following can be observed:
- The significant variability differences in the sub periods, in particular at the end of the sample;
- The grouping of the variability;
- At least three distinct outliers.
These observations gave us reasons for the assumption that further analysis of the changes in the process variance appears to be justified. In the next step, we examined the statistical properties of the series, in particular, the characteristics of distribution, autocorrelation and stationarity. The results are contained in Table 1.
100
120
140
160
180
200
220
240
94 95 96 97 98 99 00 01 02 03 04 05 06 07 08 09
Weekly fixed base index of wholesale price of cement
0.96
0.98
1.00
1.02
1.04
1.06
1.08
1.10
1.12
94 95 96 97 98 99 00 01 02 03 04 05 06 07 08 09
Weekly chain index of wholesale price of cement

Screening for collusion: Evidences from the Indian cement industry | BEH: www.beh.pradec.eu
- 105 -
Busin
ess a
nd E
conom
ic H
orizons
© 2015 Prague Development Center
TABLE 1. SERIES CHARACTERISTICS
Average Min. value Max. value Standard dev.
1.0009 1.1181 0.9722 0.0078
Jarque-Bera normality test
169191.2 (0.0000)
ADF Test -14.0165* (0.0000)
Skewness Kurtosis
5.5261 72.9351
Ljung - Box test for levels - Q(5)
182.70 (0.0000)
KPSS Test 0.0610**
Source: Author’s own calculations.
Note: p- values given in brackets, * value of t statistics (critical values for 1%; 5%; 10% sig.
levels - (-3,438); (-2,864); (-2,568), ** value of LM statistics (asympt. critical values for 1%; 5%;
10% sig. levels - 0.739; 0.463; 0.347).
The series is skewed and leptokurtic. The hypothesis of a normal distribution was rejected and with the tests of various configurations (confirming analysis) of the hypotheses the lack of unit roots was confirmed.
Cement is a type of product typically characterized by a seasonal demand and, consequently, by a seasonal price volatility. We examined seasonality patterns by inspecting visually Figure 2, analysing periodogram and estimating simple seasonal component of econometric model of the chain index process. From Figure 2 we can observe distinct seasonal pattern at the beginning of the sample (till year 2008) with a peak of price in the first quarter of each year. The periodogram depicted in Figure 3 confirms low frequency periodicity.
FIGURE 3. PERIODOGRAM OF PRICECHIDX SERIES
Estimated yearly seasonal component of chain index process for weekly data took the form (see Kufel, 2010):
pricechidx3 51
t i it j jt t
i 1 j 1
const d D w Q
, (5)
where, const represents trend component, Dit is a dummy variable for an outlier at dates t, Qj is 0-1 seasonal variable for each week of the year and di, wj are parameters to be
Screening for collusion: Evidences from the Indian cement industry | BEH: www.beh.pradec.eu
- 106 - © 2015 Prague Development Center
estimated. We estimated simplified version for 51 seasonals. Estimation output confirmed significant 26 to 52 period‟s seasonality in the sample data.
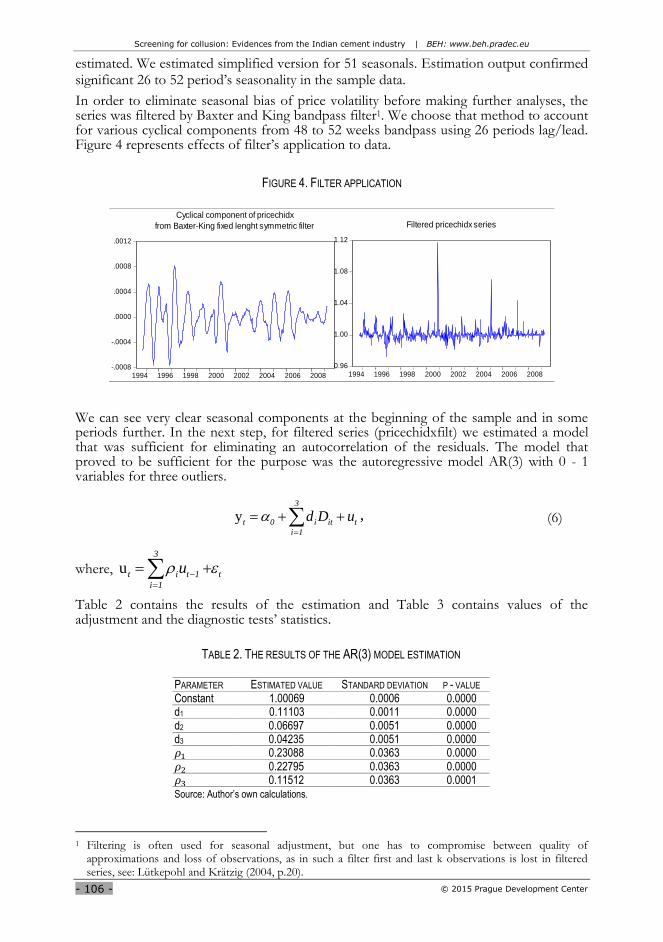
In order to eliminate seasonal bias of price volatility before making further analyses, the series was filtered by Baxter and King bandpass filter1. We choose that method to account for various cyclical components from 48 to 52 weeks bandpass using 26 periods lag/lead. Figure 4 represents effects of filter‟s application to data.
FIGURE 4. FILTER APPLICATION
We can see very clear seasonal components at the beginning of the sample and in some periods further. In the next step, for filtered series (pricechidxfilt) we estimated a model that was sufficient for eliminating an autocorrelation of the residuals. The model that proved to be sufficient for the purpose was the autoregressive model AR(3) with 0 - 1 variables for three outliers.
y3
t 0 i it t
i 1
d D u
, (6)
where, u3
t i t 1 t
i 1
u
Table 2 contains the results of the estimation and Table 3 contains values of the adjustment and the diagnostic tests‟ statistics.
TABLE 2. THE RESULTS OF THE AR(3) MODEL ESTIMATION
PARAMETER ESTIMATED VALUE STANDARD DEVIATION P - VALUE Constant 1.00069 0.0006 0.0000 d1 0.11103 0.0011 0.0000 d2 0.06697 0.0051 0.0000 d3 0.04235 0.0051 0.0000 0.23088 0.0363 0.0000 0.22795 0.0363 0.0000 0.11512 0.0363 0.0001 Source: Author’s own calculations.
1 Filtering is often used for seasonal adjustment, but one has to compromise between quality of
approximations and loss of observations, as in such a filter first and last k observations is lost in filtered series, see: Lütkepohl and Krätzig (2004, p.20).
-.0008
-.0004
.0000
.0004
.0008
.0012
1994 1996 1998 2000 2002 2004 2006 2008
Cyclical component of pricechidx
from Baxter-King fixed lenght symmetric filter
0.96
1.00
1.04
1.08
1.12
1994 1996 1998 2000 2002 2004 2006 2008
Filtered pricechidx series
Screening for collusion: Evidences from the Indian cement industry | BEH: www.beh.pradec.eu
- 107 -
Busin
ess a
nd E
conom
ic H
orizons
© 2015 Prague Development Center
TABLE 3. ADJUSTMENT AND DIAGNOSTIC TESTS
NAME OF MEASURE / TEST VALUE P - VALUE
Log Likelihood 2872.06 -
R2 0.533 -
Jarque-Bera test 646.09 0
Schwarz criterion -7.5466 -
Ljung-Box test (residuals). Q(12) 8.6184 0.4732
Ljung-Box test (squared residuals). Q(12) 22.535 0.0322
Durbin - Watson statistics 2.0093 -
LM test for the autocorrelation of residuals 11.4780 0.4885
LM for ARCH test (Chi-stat) 15.9199 0.0140
LM test for heteroscedascity of residuals (Chi-stat) 0.6218 0.4300 Source: Author’s own calculations.
Interpreting the content of Table 3, it can be stated that the model was fairly fitted to the data, but also that autocorrelation of residuals was not observed. However, important results for research purpose were obtained: there was no heteroscedasticity in residuals, but the result of the test for the neglected ARCH effect associated with the autocorrelation of the squared residuals indicated that the process variance should be modelled separately. That denotes that the marker of the changes in variance may be applied here.
In accordance with the chosen methodology and autoregressive specification of a process, we estimated switching model of the MSV(2)AR(3) type of the following form:
y3 3
t 0 i it m t m t
i 1 m 1
d D y u
, (7)
where:
),0(~ 2
tSt Nu , (8)
and: St = 1,2.
TABLE 4. THE RESULTS OF THE ESTIMATION OF THE MSV(2)AR(3) MODEL
PARAMETER ESTIMATION STANDARD DEVIATION P - VALUE
p11 0.824727 ---- 0
p22 0.900972 ---- 0
log σu1 -4.743920 0.062939 0
log σu2 -5.784835 0.065441 0
1 0.368759 0.035416 0
2 0.432123 0.034495 0
3 0.199243 0.033775 0
d1 0.115198 0.003843 0
d2 0.067680 0.003035 0
d3 0.041799 0.002923 ----
constant 1.406552 0.745057 0.0591 Source: Author’s own calculations.
The model in the specification (7), (8) assumes controlling the observable price process through non-observable stochastic process of state variable St, which is assumed to be a
Screening for collusion: Evidences from the Indian cement industry | BEH: www.beh.pradec.eu
- 108 - © 2015 Prague Development Center
homogeneous Markov chain of two states and proper matrix of transition probabilities between the states. The Dit variable, similar to the previous AR(3) specification, is a 0-1 variable with the value of one equal for week with outlier and of zero for the remaining weeks of the sample.
The only parameters dependent on the regime are variances 2
1u and 2
2u . The estimation
output is presented in Tables 4 and 5.
TABLE 5. ADJUSTMENT AND DIAGNOSTIC TESTS
NAME OF MEASURE / TEST VALUE P - VALUE
Log Likelihood 2914.989 -
R2 0.52 -
Schwarz criterion -7.6252 0
The Jarque-Bera test 509.372 0
The Ljung-Box test (residuals) Q(12) 31.78 0
The Ljung-Box test (squared residuals) Q(12) 11.36 0.4981
The Durbin - Watson statistics 2.0643 -
LM for ARCH test (Chi-stat) 16.023 0.0210
LM test for heteroscedascity of residuals (Chi-stat) 0.582 0.4452 Source: Author’s own calculations.
On the basis of Tables 4 and 5, we can state that the model represents properly the examined process. The estimates of all the parameters are statistically significant and the fit to the data is satisfactory (the value of the likelihood logarithm /Schwartz criterion increased/decreased if compared with the specification without switching in a residual variance). Residuals are homoscedastic, squared residuals do not show autocorrelation, but the ARCH effect seems to be still not encompassed.
The most important finding was, however, in the field of the research objective. As theoretical marker implied, the differentiation of the variability levels was proved. The estimated model clearly indicates a regime change in the variance, characterized by a significant persistence (the estimates of the transitions probabilities p11 and p22 are close to 1). In regime 1 the implied standard deviation equals 0.008704 and is clearly higher than in regime 2, where the implied standard deviation equals 0.003074. We can say that these values of state dependant parameters indicate, on average, a lower variability level in regime 2. The Constant expected duration of process in regime 1 equals 5.705 (about 6 weeks) and in regime 2 equals 10.098 (10 weeks).
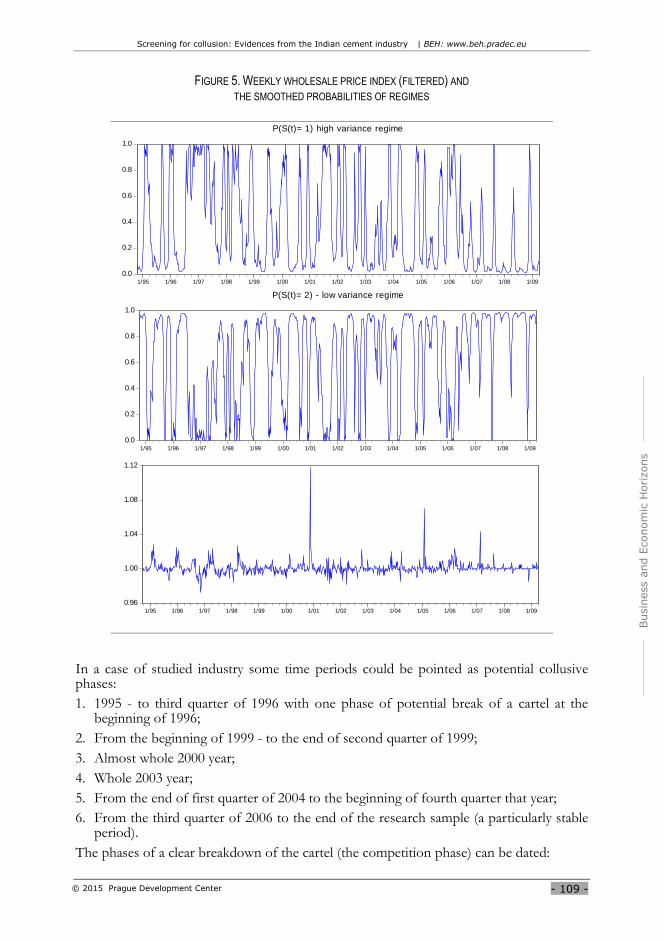
The most important question is whether the proposed model can serve as a fairly simple tool of detection of collusive behaviour phases. We suggest that could be done visually basing on smoothed probabilities graphs. Figure 5 contains a comparison of the filtered series pricechidxfilt and the smoothed probabilities for regimes 1 and 2 (i.e. conditional probabilities of the process is in state St, t=1, 2 while taking into account information from the entire sample).
Based on the estimation results and Figure 5, we can draw following conclusions. There were clearly two distinct regimes of variability of price. In a regime with low variability market it lasted on average 10 weeks, which means that was a more persistent mode. A visual inspection of Figure 5 could help in screening of an industry by pointing long periods in regime 1 of variability (competition phases) and pointing long periods in regime 2 (potential collusion). Such a preliminary assessment could be helpful in making a decision to further investigate a market.
Screening for collusion: Evidences from the Indian cement industry | BEH: www.beh.pradec.eu
- 109 -
Busin
ess a
nd E
conom
ic H
orizons
© 2015 Prague Development Center
FIGURE 5. WEEKLY WHOLESALE PRICE INDEX (FILTERED) AND
THE SMOOTHED PROBABILITIES OF REGIMES
In a case of studied industry some time periods could be pointed as potential collusive phases:
1. 1995 - to third quarter of 1996 with one phase of potential break of a cartel at the beginning of 1996;
2. From the beginning of 1999 - to the end of second quarter of 1999;
3. Almost whole 2000 year;
4. Whole 2003 year;
5. From the end of first quarter of 2004 to the beginning of fourth quarter that year;
6. From the third quarter of 2006 to the end of the research sample (a particularly stable period).
The phases of a clear breakdown of the cartel (the competition phase) can be dated:
0.0
0.2
0.4
0.6
0.8
1.0
1/95 1/96 1/97 1/98 1/99 1/00 1/01 1/02 1/03 1/04 1/05 1/06 1/07 1/08 1/09
P(S(t)= 1) high variance regime
0.0
0.2
0.4
0.6
0.8
1.0
1/95 1/96 1/97 1/98 1/99 1/00 1/01 1/02 1/03 1/04 1/05 1/06 1/07 1/08 1/09
P(S(t)= 2) - low variance regime
0.96
1.00
1.04
1.08
1.12
1/95 1/96 1/97 1/98 1/99 1/00 1/01 1/02 1/03 1/04 1/05 1/06 1/07 1/08 1/09

Screening for collusion: Evidences from the Indian cement industry | BEH: www.beh.pradec.eu
- 110 - © 2015 Prague Development Center
I. from the middle of 1996 to the end of third quarter of 1997;
II. almost whole year 2001;
III. the first three quarters of the year 2006.
The remaining periods of the sample could not be defined decisively.
For reference purposes we use concept of Blanckenburg et al. (2012) and estimated kernel densities1 of two detected phases: cartel phase number 3 and competition phase number II. We estimated densities for both unfiltered and filtered series of price index. Figure 6 contains graphs of estimated densities.
FIGURE 6. KERNEL DENSITY ESTIMATES OF PRICE INDEX
0
20
40
60
80
100
120
140
0.98 0.99 1.00 1.01 1.02 1.03 1.04 1.05 1.06 1.07 1.08 1.09 1.10 1.11 1.12 1.13
De
nsi
ty
Pricechidx
detected cartel phase 3
0
20
40
60
80
100
120
0.98 0.99 1.00 1.01 1.02 1.03 1.04 1.05 1.06 1.07 1.08 1.09 1.10 1.11 1.12 1.13
De
nsi
ty
Pricechidxfiltered
detected cartel phase 3
0
20
40
60
80
100
120
0.976 0.980 0.984 0.988 0.992 0.996 1.000 1.004 1.008 1.012 1.016 1.020
De
nsi
ty
Pricechidxfiltered
detected competition phase II
0
20
40
60
80
100
120
0.976 0.980 0.984 0.988 0.992 0.996 1.000 1.004 1.008 1.012 1.016 1.020
De
nsi
ty
Pricechidx
detected competition phase II
We have two observations:
- As we could expect densities are statistically different (checked by Kolmogorov-Smirnov test) in a case of cartel and competition, prices are more “sticky” in cartel phase;
- There is a difference in density estimation of a competition phase depending on the elimination of cyclical component. We should be careful on that if we want to relay on such a test only.
A fundamental question in the context of research is whether the assumed collusion detection mechanism really works. We could perform an ex post verification, as some important information on the conducted anti-trust proceedings and certain facts on the activity of the industry were available. The most essential facts related to the functioning of the Indian cement industry, which could be helpful in the indication of collusive phases were as follow.
1 Bandwidth selected by formula of Silverman (1986, equation 3.31).
Screening for collusion: Evidences from the Indian cement industry | BEH: www.beh.pradec.eu
- 111 -
Busin
ess a
nd E
conom
ic H
orizons
© 2015 Prague Development Center
Basing on the decisions issued by the Indian Monopolies and Restrictive Trade Practices Commission1 it is evident that:
a) On 05 July, 2000 in Jabalpur a meeting of the players controlled then over 60% of the cement market took place where they took a concerted action to fix the cement prices artificially and also decided to control the quantity of cement flowing in the market by suspending production and dispatches either from dump or from factory to direct dealers for five days from 5th July to 9th July, 2000. In the said meeting it was further decided to hike the price of cement from 10.7.2000 to Rs. 107/- Rs. 109/- per bag, and arrangements concerning the establishment of the cement price and the supply level were made.
b) Further coordinated suspensions of cement supplies were realized on the following dates: 27.11.2000 - 4.12.2000 and 12.01.2001 - 19.01.2001.
Other essential related facts are as follows:
c) In the years 2001 and 2004 there was a significant slow-down (if compared with the other part of the sample) in the annual growth rate in cement production;2
d) In year 2006 a sudden rise in cement consumption was observed;
e) In March 2004 a new player enter the industry - Shanghi Cement.
In order to verify the effectiveness of the econometric tool we compared the identified phases with the historical facts.
- facts a) and b) confirm the correctness of the detection of the collusive phase 3,
- fact c) corresponds to the competition phase II (based on model in (Bejger, 2010), within the market shrinking phase, a minimum market share when the least important player is ready to join the collusive agreement tends to increase and then a dissatisfied player may break off the agreement unilaterally), but is not confirmed in the assessment of year 2004.
- competition phase III in connection with the fact d) and with an analysis of nature of price variance increase in that period (as we can observe from filtered series, the main cause of the increase of variance was fast, a constant increase of the price of cement that lasted half of the period, and was followed by a period of stable price, which lasted to the end of the phase) cannot be unambiguously qualified as real break down of the cartel without additional information about market level demand.
Conclusion
We can conclude the results of the research with the following statements:
- Assuming the validity of the variance screen to the market and taking into consideration its theoretically justified mechanism that determines a market collusive equilibrium with significant price variability disturbances, it was possible to detect such disturbances by a tested econometric instrument.
- Basing on the type of the disturbance determined, the possible collusive agreement phases and the possible competition (the non-cooperative equilibrium other than explicit or tacit collusion) phases were identified.
- Theoretically identified phases were partially consistent with the historical facts and evidence of collusion.
- There was high fluctuation of phases (connected with estimated expected duration of regimes, 10 and 6 weeks). It seems to be contrary to various studies of cartel duration. In Levenstein and Suslow (2006) average cartel duration is reported as from 3.7 to 7.5
1 MRTPC (2001). 2 The data come from Cement Manufacturer Association Annual Report (2010).
Screening for collusion: Evidences from the Indian cement industry | BEH: www.beh.pradec.eu
- 112 - © 2015 Prague Development Center
years, Connor and Helmers (2006) there are similar median or average duration (table 23). However, in both studies there were cartels of 1 year of life and even if a cartel last longer, there could be periodical break downs. So, we can conclude that our findings could be plausible (in a context of short phase durations and frequent fluctuations between them), but the expected durations of regimes and very frequent switching seems to be artefacts not consistent with economic intuition.
To summarize, high frequency data should be modelled carefully in a context of MS(M)AR(p,q) model with application to variance screen to avoid inconclusiveness of predictions, especially high frequency switching. Even if distinct regimes of variance were detected, short expected duration of regimes disturbs player‟s behaviour detection.
We could point to further research directions, which could improve tested econometric tool usability in the context of a variance screen. We would formulate that on the basis of proposed procedure for that tool, which should automate screen development:
The first stage - evaluating price/index of price process characteristics,
The second stage - carefully removing any seasonality in data, as seasonal variability could be misinterpreted as competition/collusion phase. The procedure of seasonality adjustment should be conducted very carefully, especially with a high frequency (weekly or daily) data,
The third stage - control for outliers. We introduced only three 0 -1 variable for that purpose, but for weekly data it seems not enough. At this stage, we suggest the construction of ARIMA model for seasonality adjusted series to automatically detect outliers (on a basis of usual criterion of 2.5 std. error of residual) and add 0 - 1 variable for each (built some kind of saturation model).
The fourth stage - apply switching model of the most uncomplicated structure, which is enough to describe the data. As a reference to this point we could compare the estimation of MS(M)(AR(p))GARCH(p,q) model from Bejger (2009) and our earlier, unpublished paper Bejger (2012) with the actual one, and we could assess the computational burden (cost of practical application of a screen) as much less in simpler specification without significant degeneration in results.
The fifth stage - the interpretation of filtered/smoothed probabilities graph and estimation‟s results.
We hope that our research will start the discussion on the connection of particular screen and econometric tool we proposed.
References
Buccirossi P. (Ed.), 2008. Handbook of antitrust economics, The MIT Press
Lütkepohl H., Krätzig M. (Eds.), 2004. Applied time series econometrics, Cambridge University Press
Silverman B.W., 1986. Density estimation for statistics and data analysis, London: Chapman & Hall
Abrantes-Metz R., 2013. “Pro-active vs. reactive anti-cartel policy: the role of empirical screens”, mimeo
Abrantes-Metz R., Kraten M., Metz A.D., Seow G.S., 2012. “Libor manipulation?”, Journal of Banking and Finance, 36, pp.136-150
Abrantes-Metz R., Villas-Boas S.B., Judge G., 2011. “Tracking the libor rate”, Applied Economics Letters, 18, pp.893-899
Abrantes-Metz R., Froeb L., Geweke J., Taylor C., 2006. “A variance screen for collusion”, International Journal of Industrial Organization, Vol. 24, pp.467-486
Anand S., 2009. “Identifying cartels using economic evidence. A case study of Indian cement industry”, Competition Commision of India, New Delhi
Screening for collusion: Evidences from the Indian cement industry | BEH: www.beh.pradec.eu
- 113 -
Busin
ess a
nd E
conom
ic H
orizons
© 2015 Prague Development Center
Athey S., Bagwell K., Sanchirico C., 2004. “Collusion and price rigidity”, Review of Economic Studies, Vol.71, pp.317-349
Bajari P., Ye L., 2003. “Deciding between competition and collusion”, Review of Economics and Statistics, Vol.85, pp.971-89
Bejger, S., 2009. “Econometric tools for detection of collusion equilibrium in the industry”, Dynamic Econometric Models, Vol.X, pp.34-45
Bejger S., 2010. “Collusion and seasonality of market price - a case of fixed market shares”, Business and Economic Horizons, Vol.2, pp.48-59
Bejger S., Bruzda J., 2011. “Detection of collusion equilibrium in an industry with application of wavelet analysis”, Dynamic Econometric Models, Vol.11, pp.171-184
Bejger S., 2011. “Polish cement industry cartel - preliminary examination of collusion existence”, Business and Economic Horizons, Vol.4, pp.88 - 107.
Bejger S., 2012. “Cartel in the Indian cement industry: An attempt to identify it”, Economics E-journal Discussion paper
Blanckenburg K., Geist A., Kholodilin K.A., 2012. “The influence of collusion on price changes: New evidence from major cartel cases”, German Economic Review, Vol.13(3), pp.245-56
Blanckenburg K., Geist A., 2009. “How can a cartel be detected?”, International Advances in Economic Research, Vol.15, pp.421-436
Bolotova Y., Connor J.M., Miller D.J., 2008. “The impact of collusion on price behavior: Empirical results from two recent cases”, International Journal of Industrial Organization, Vol. 26, pp.1290-1307
Cement Manufacturer Association Annual Report, 2010. Electronic document: http://www.cmaindia.org/portal/static/AnnualReport2009-10.pdf
Connor J.M., 2005. “Collusion and price dispersion”, Applied Econometric Letters, Vol.12, pp.335-38
Connor J., Helmers G., 2006. “Statistics on modern private international cartels, 1990-2005”, Dept. of Agricultural Economics, Purdue University, Working Paper No.06-11
Davidson J., 2004. “Forecasting Markov-switching dynamic, conditionally heteroscedastic processes”, Statistic and Probability Letters, 68(2), pp.137-147
Consolidated versions of the Treaty on European Union and the Treaty on the Functioning of the European Union, Official Journal C 326, 26/10/2012, pp.0001-0390
Guidelines on the applicability of Article 101 of the Treaty on the Functioning of the European Union to horizontal co-operation agreements - 2011/C 11/01, 2011, Official Journal of the European Union
Esposito F.M., Ferrero M., 2006. “Variance Screens for Detecting Collusion: An Application to Two Cartel Cases in Italy”, (mimeo)
Hamilton J.D., 1989. “A new approach to the economic analysis of nonstationary time series and the business cycle”, Econometrica, Vol.57, pp.357-384
Hamilton J.D., Susmel, R., 1994. “Autoregressive conditional heteroscedasticity and changes in regime”, Journal of Econometrics 64, 307-333
Harrington J.E., 2008. “Detecting Cartels”, in Handbook of Antitrust Economics, pp.213-258
Harrington J.E., 2006. “Behavioral screening and the detection of cartels”, in European Competition Annual 2006: Enforcement of Prohibition of Cartels, pp.51-68
Hay, G., 2013. “Anti-competitive agreements: The meaning of “Agreement”, Cornell Law Faculty Working Papers, Paper 105
Hüschelrath R., 2010. “How are cartels detected? The increasing use of pro-active methods to establish antitrust infringements”, Journal of European Competition Law & Practice, Vol.1, No.6
Hüschelrath K., Veith T., 2014. “Cartel detection in procurement markets”, Managerial and Decision Economics, Vol.35(6), pp.404-422
Jacqemin A., Slade M.E., 1989. “Cartels, collusion and horizontal merger”, in: Schmalensee R., Willig R.D., 1989. Handbook of Industrial Organization, Vol.II, Elsevier Science Publishers B.V.
Screening for collusion: Evidences from the Indian cement industry | BEH: www.beh.pradec.eu
- 114 - © 2015 Prague Development Center
Jimenez J.L., Perdiguero J., 2011. “Could transport costs be lower? The use of a variance screen to evaluate competition in the petrol market in Spain”, International Journal of Transport Economics, Vol.38 (3), pp.265-284
MRTPC, 2001. electronic document: http://www.baionline.in/media/data/MRTP2.pdf.
Kaplow L., 2011. “On the meaning of horizontal agreements in competition law”, Harvard Law and Economics Discussion Paper No.691
Krolzig H.M., 1998. “Econometric modelling of Markov-Switching vector autoregressions using MSVAR for Ox”, Working paper
Kim C.J., Nelson C.R., 1999. State-space models with regime switching, The MIT Press, London.
Kufel T., 2010. Ekonometryczna analiza cykliczności procesóe gospodarczych o wysokiej częstotliwości obserwowania, Wydawnictwo UMK, Toruń
Levenstein M., Suslow V., 2006. “What determines cartel success?”, Journal of Economic Literature, 44(1), pp.43-95
Lorenz C., 2008. “Screening markets for cartel detection: Collusive markers in the CFD cartel-audit”, European Journal of Law and Economics, 26(2), 213-32
Maskin E., Tirole J., 1988. “A theory of dynamic oligopoly II”, Econometrica 56, 571-599
Petit N., 2012. “The oligopoly problem in EU competition law”. In: Liannos I. and Geradin D. (Eds.), Research Handbook in European Competition Law, Edward Elgar, September 2013
Porter R.H., Zona J.D., 1999. “Ohio school milk markets: An analysis of bidding”, RAND Journal of Economics, Vol.30, pp.263-88
Posner R., 1969. “Oligopoly and the antitrust laws: A suggested approach”, 21 Stanford Law Review
Rotemberg J., Saloner G., 1990. “Collusive price leadership”, The Journal of Industrial Economics, Vol.39, pp.93-111
Russo F., Schinkel M.P., Gunster A., Carree M., 2010. European Commission decisions on competition. Economic perspectives on landmark antitrust and merger cases, Cambridge University Press, New York
Tirole J., 1998. The theory of industrial organization, The MIT Press, England
Vives X., 1999. Oligopoly pricing. Old ideas and new tools, The MIT Press, Cambridge MA
U.S. DOJ, 2005. “An antitrust primer for federal law enforcement personnel”, Antitrust Division U.S. Department of Justice, August 2003, Revised: April 2005


![Algorithmic Collusion 140318 [Read-Only] · Algorithmic Collusion for IO Reading Group, Slide 7 of 26 Chris Doyle, Department of Economics, March 2018 Collusion – Collusion is an](https://static.fdocuments.in/doc/165x107/5b1f9ec77f8b9a60128b6205/algorithmic-collusion-140318-read-only-algorithmic-collusion-for-io-reading.jpg)