Screening and Interventions for Overweight and … and Interventions for Overweight and ... Agency...
128
i i This report may be used, in whole or in part, as the basis for development of clinical practice guidelines and other quality enhancement tools, or a basis for reimbursement and coverage policies. AHRQ or U.S. Department of Health and Human Services endorsement of such derivative products may not be stated or implied. AHRQ is the lead Federal agency charged with supporting research designed to improve the quality of health care, reduce its cost, address patient safety and medical errors, and broaden access to essential services. AHRQ sponsors and conducts research that provides evidence-based information on health care outcomes; quality; and cost, use, and access. The information helps health care decisionmakerspatients and clinicians, health system leaders, and policymakers make more informed decisions and improve the quality of health care services.
Transcript of Screening and Interventions for Overweight and … and Interventions for Overweight and ... Agency...
i i
This report may be used, in whole or in part, as the basis for development of clinical practice guidelines and other quality enhancement tools, or a basis for reimbursement and coverage policies. AHRQ or U.S. Department of Health and Human Services endorsement of such derivative products may not be stated or implied. AHRQ is the lead Federal agency charged with supporting research designed to improve the quality of health care, reduce its cost, address patient safety and medical errors, and broaden access to essential services. AHRQ sponsors and conducts research that provides evidence-based information on health care outcomes; quality; and cost, use, and access. The information helps health care decisionmakers�patients and clinicians, health system leaders, and policymakers�make more informed decisions and improve the quality of health care services.
i i
Systematic Evidence Review Number 21
Screening and Interventions for Overweight and Obesity in Adults
Prepared for: Agency for Healthcare Research and Quality U.S. Department of Health and Human Services 540 Gaither Road Rockville, MD 20850 http://www.ahrq.gov
Contract No. 290-97-0011 Task No. 3 Technical Support of the U.S. Preventive Services Task Force
Prepared by: Research Triangle Institute 3040 Cornwallis Road P.O. Box 12194 Research Triangle Park, NC 27709 Kathleen McTigue, MD, MPH Russell Harris, MD, MPH M. Brian Hemphill, MD Audrina J. Bunton, BA Linda J. Lux, MPA Sonya Sutton, BSPH Kathleen N. Lohr, PhD December 2003
i i
Preface
The Agency for Healthcare Research and Quality (AHRQ) sponsors the development of Systematic Evidence Reviews (SERs) through its Evidence-based Practice Program. With guidance from the U.S. Preventive Services Task Force∗ (USPSTF) and input from Federal partners and primary care specialty societies, the Evidence-based Practice Center at the Oregon Health Sciences University systematically review the evidence of the effectiveness of a wide range of clinical preventive services, including screening, counseling, and chemoprevention, in the primary care setting. The SERs�comprehensive reviews of the scientific evidence on the effectiveness of particular clinical preventive services�serve as the foundation for the recommendations of the USPSTF, which provide age- and risk-factor-specific recommendations for the delivery of these services in the primary care setting. Details of the process of identifying and evaluating relevant scientific evidence are described in the �Methods� section of each SER. The SERs document the evidence regarding the benefits, limitations, and cost-effectiveness of a broad range of clinical preventive services and will help further awareness, delivery, and coverage of preventive care as an integral part of quality primary health care. AHRQ also disseminates the SERs on the AHRQ Web site (http://www.ahrq.gov/clinic/uspstfix.htm) and disseminates summaries of the evidence (summaries of the SERs) and recommendations of the USPSTF in print and on the Web. These are available through the AHRQ Web site and through the National Guideline Clearinghouse (http://www.ncg.gov). We welcome written comments on this SER. Comments may be sent to: Director, Center for Practice and Technology Assessment, Agency for Healthcare Research and Quality, 540 Gaither Road, Suite 3000, Rockville, MD 20850.
Carolyn Clancy, M.D. Jean Slutsky, P.A., M.S.P.H. Director Acting Director, Center for Practice and Agency for Healthcare Reseach and Quality Technology Assessment Agency for Healthcare Research and Quality
∗ The USPSTF is an independent panel of experts in primary care and prevention first convened by the U.S. Public Health Service in 1984. The USPSTF systematically reviews the evidence on the effectiveness of providing clinical preventive services--including screening, counseling, and chemoprevention--in the primary care setting. AHRQ convened the USPSTF in November 1998 to update existing Task Force recommendations and to address new topics.

i i
vi vi
Acknowledgments
This study was supported by Contract 290-97-0011 from the Agency of Healthcare
Research and Quality (Task No. 3). We acknowledge at AHRQ the continuing support of
Jacqueline Besteman, JD, MA, Director for the Evidence-based Practice Center program; David
Atkins, MD, MPH, Chief Medical Officer of the AHRQ Center for Practice and Technology
Assessment; and Jean Slutsky, PA, MSPH, the Task Order Officer for this project. We would
also like to acknowledge the guidance and assistance from our US Preventive Services Task
Force liaisons, Janet Allan, PhD, RN, CS, FAAN and Mark Johnson, MD, MPH.
The investigators deeply appreciate the contributions of Loraine Monroe at RTI, for
superior secretarial assistance. In addition, we are indebted to Timothy S. Carey, MD, MPH,
Co-Director of the RTI-UNC Evidence-based Practice Center at the University of North Carolina
Cecil G. Sheps Center for Health Services Research.
We also owe our thanks to the following external peer reviewers, who provided
constructive feedback and insightful suggestions for improvement of this systematic evidence
review: David Arterburn, MD, University of Washington, Seattle, WA; James D. Douketis, MD,
McMaster University, Hamilton, Onatario, Canada; Evelyn L. Lewis-Clark, MD Bowie, MD,
representing the American Academy of Family Physicians; F. Xavier Pi-Sunyer, MD, MPH, St
Luke�s/Roosevelt Hospital Center, New York, NY; Walter J. Pories, MD, East Carolina School
of Medicine, Greenville, NC; Bruce A. Reeder, University of Saskatchewan, Saskatoon, Canada
and representing the Canadian Task Force on Preventive Health Care; and Vincenza Snow, MD,
American College of Physicians-American Society of Internal Medicine, Philadelphia, PA.
vii vii
Structured Abstract
Background
Obesity, a condition characterized by excess body fat, carries substantial health
implications for both chronic disease and mortality. This fact and its increasing prevalence make
obesity an important health problem.
Purpose
To examine the evidence of the benefits and harms of screening and earlier treatment in
reducing morbidity and mortality from overweight and obesity.
Data Sources
We developed an analytic framework and 6 key questions that represent a logical chain
between screening and sustained weight reduction and reduced morbidity and mortality. We
searched MEDLINE from January 1, 1994 (the end date for prior USPSTF searches), to July 31,
2001, using the Medical Subject Heading obesity and overweight and combining this term with
predefined strategies to identify relevant English-language studies. We also searched the
Cochrane Library, contacted experts, and scanned review bibliographies. We found 4 recent,
well-conducted systematic reviews and relied on their analyses of the studies they included.

vii vii
Study Selection
We included: (1) large, population-based surveys of the prevalence of overweight and
obesity; (2) randomized controlled trials (RCTs) with at least 1 year follow-up (6 months for
pharmacological studies) reporting weight reduction or health outcomes for treatment and harms
questions. The shorter follow-up period for pharmacological studies was driven by the available
literature: weight loss trials were frequently only of 6 months� duration but were complemented
by studies designed specifically to evaluate maintenance of that loss. When we found few or no
RCTs, we examined cohort studies concerning the efficacy or harms of treatment. Two
reviewers examined all abstracts and articles to determine which met inclusion criteria.
Data Extraction
Two reviewers abstracted relevant information from each article, using standardized
abstraction forms. We graded the quality of all included articles according to criteria established
by the U.S. Preventive Services Task Force.
Data Synthesis
No RCT of screening for obesity has been performed. Obesity is most commonly
measured as body mass index (BMI, weight in kilograms [kg] divided by height in meters
squared). Although other measures have been developed, BMI is the most consistently used in
the literature, and so we focused on it as the preferred screening tool. The prevalence of obesity
(BMI >30) has been increasing; currently; at least 27% of the adult population is obese. The
prevalence of overweight (BMI 25-29.9) is about 34%. Among people with BMI of about 30 or
viii viii
greater, intensive counseling and behavioral treatment for obesity is effective in reducing mean
weight by about 3 kg to 5 kg after 1 year. Pharmacotherapy with sibutramine or orlistat is also
effective in reducing mean weight by about 3 to 5 kg. For people with BMI of 35 or greater,
surgical therapy leads to dramatic reductions in weight of 20 kg or more.
Both counseling-based and drug-based maintenance interventions were helpful in
retaining weight loss. Weight reduction of 5% to 7% body weight is associated with lower
incidence of diabetes, reduced blood pressure, and improved dyslipidemia. Larger weight loss
has been linked with more dramatic improvements in glycemic control and lipids in limited
surgical outcomes data.
We did not find evidence evaluating potential harms of counseling-based interventions.
Sibutramine is sometimes associated with increased blood pressure (mean increase of 0-3.5 mm
Hg); orlistat causes gastrointestinal distress in 15% to 37% of people taking the drug. Surgical
procedures lead to mortality in less than 1% of patients in pooled samples, but in up to 25%
patients re-operation is necessary over 5 years.
Conclusions
Screening with BMI would detect a large percentage of adults who are obese or
overweight. Limited evidence suggests that counseling interventions may promote modest
weight loss in the overweight (BMI 25-29.9). Effective treatments for people with BMI >30
include intensive counseling and behavioral interventions for lifestyle change, and
pharmacotherapy. Surgery is effective in reducing weight for people with BMI of 35 or greater.
Adverse effects include increased blood pressure and gastrointestinal distress with drugs and a
small percentage of serious side effects with surgery

Table of Contents ix
ix
Contents
Systematic Evidence Review Chapter 1. Introduction��������������������������������..1 Background�����������������������������������.1
Cost of Obesity and Overweight ............................................................................................................ 5 Prior Recommendations About Obesity Screening................................................................................ 6 Organization of This Review.................................................................................................................. 7
Chapter 2. Methods.................................................................................................................................... 13
Analytic Framework and Key Questions�����������������������..13 Analytic Framework�����������������������������...13 Key Questions................................................................................................................................ 14
Literature Search Strategy and Synthesis ............................................................................................. 14 Search Terms ................................................................................................................................. 14 Inclusion and Exclusion Criteria.................................................................................................... 15
Article Review and Data Abstraction................................................................................................... 15 Preparation of this Systematic Evidence Review................................................................................. 16
Chapter 3. Results ...................................................................................................................................... 21
Key Question No. 1: Does Screening for Overweight and Obesity Affect Health Outcomes? ........... 21 Key Question No. 2: What is the Prevalence of Overweight and Obesity? ......................................... 21 Key Question No. 3: Is There a Reliable and Valid Screening Test?................................................... 22 Key Question No. 4a: Do Any Interventions Lead to Sustained Weight Reduction? .......................... 24
Counseling and Behavioral Interventions...................................................................................... 24 Pharmacotherapy Interventions ..................................................................................................... 31 Surgical Approaches ...................................................................................................................... 37
Key Question No. 4b: Do Interventions Improve Other Intermediate Health Outcomes?................... 40 Key Question No. 5: Do Interventions Improve Final Health Outcomes?.......................................... 43 Key Question No. 6: What are the Harms of Screening and Treatment?............................................. 44
Screening or Counseling and Behavioral Interventions................................................................. 44 Medications.................................................................................................................................... 44 Surgical Approaches ...................................................................................................................... 46
Chapter 4. Discussion ................................................................................................................................ 51
General Conclusions............................................................................................................................. 51 Cross-cutting Findings and Future Research Issues ...................................................................... 53
References................................................................................................................................................... 58 Appendices Appendix A. Evidence Tables .................................................................................................. A-1 Appendix B. Counseling Intervention Descriptions..................................................................B-1 Appendix C. Descriptions of Intensive Counseling and Behavioral Intervention Studies .......C-1
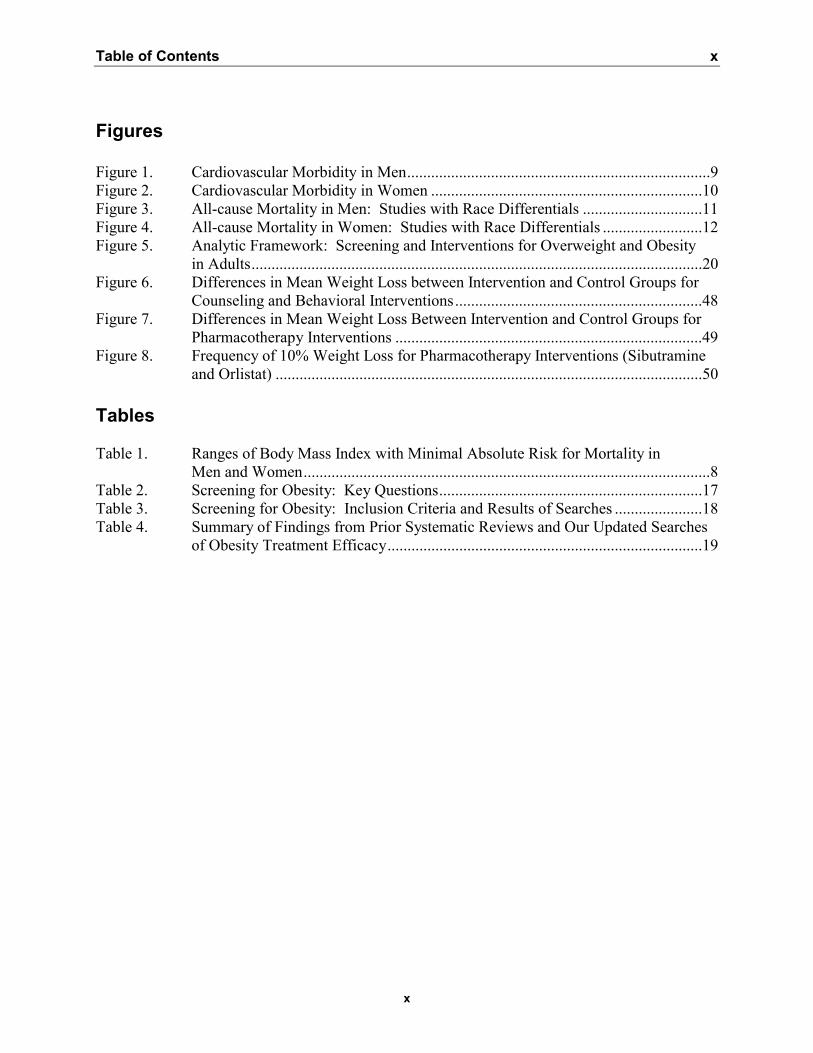
Table of Contents x
x
Figures Figure 1. Cardiovascular Morbidity in Men............................................................................9 Figure 2. Cardiovascular Morbidity in Women ....................................................................10 Figure 3. All-cause Mortality in Men: Studies with Race Differentials ..............................11 Figure 4. All-cause Mortality in Women: Studies with Race Differentials .........................12 Figure 5. Analytic Framework: Screening and Interventions for Overweight and Obesity
in Adults.................................................................................................................20 Figure 6. Differences in Mean Weight Loss between Intervention and Control Groups for
Counseling and Behavioral Interventions..............................................................48 Figure 7. Differences in Mean Weight Loss Between Intervention and Control Groups for
Pharmacotherapy Interventions .............................................................................49 Figure 8. Frequency of 10% Weight Loss for Pharmacotherapy Interventions (Sibutramine
and Orlistat) ...........................................................................................................50 Tables Table 1. Ranges of Body Mass Index with Minimal Absolute Risk for Mortality in
Men and Women......................................................................................................8 Table 2. Screening for Obesity: Key Questions..................................................................17 Table 3. Screening for Obesity: Inclusion Criteria and Results of Searches ......................18 Table 4. Summary of Findings from Prior Systematic Reviews and Our Updated Searches
of Obesity Treatment Efficacy...............................................................................19

Table of Contents xi
xi
Structured Abstract
1
1. Introduction Background
Obesity, a condition characterized by excess body fat, carries significant health
implications for both chronic disease and mortality. In the setting of escalating prevalence, the
importance of obesity as a health problem in the United States is increasingly evident � as
emphasized by the recent Surgeon General�s �Call to Action to Prevent and Decrease
Overweight and Obesity.�1
Obesity is usually defined in terms of the body mass index (BMI, calculated by dividing
kilograms of weight by meters of height squared), which is a measure of weight adjusted for
height. Although numerous techniques are available for evaluating body fat, the variables for
BMI are easy to measure. BMI has been shown to correlate closely with body fat content in
adults and children.2
Adults with a BMI of 25 to 29.9 are identified as overweight and those with a BMI > 30
as obese. These cutoffs are based on epidemiologic evidence of discernible, then substantial,
increases in mortality.3 For example, if a 5'6" women weighs 155 pounds, her BMI is 25
(overweight); if she weighs 186 pounds, her BMI is 30 (obese). BMI calculations can be
tedious, so electronic BMI calculators (eg, from the National Institutes of Health [NIH],
http://www.nhlbisupport.com/bmi/) or tables of BMI by height and weight (eg, from NIH,
http://www.nhlbi.nih.gov/guidelines/obesity/bmi_tbl.htm) may be useful tools for clinicians and
patients. Waist circumference and the waist-to-hip ratio are common adjuvant measures used to

Structured Abstract
2
classify the distribution of body fat in people who are overweight, as obesity-related
complications are most closely correlated with abdominal fat distribution.4-6
Chapter 1. Background
2
The prevalence of obesity is increasing. Data from the National Center for Health
Statistics show that, over the past 40 years, obesity prevalence increased from 13% to 27% of the
U.S. adult population; the prevalence of the less severe overweight category increased from 31%
to 34%.7,8 Concurrently, a rise in prevalence of obesity has been noted in adolescent and
pediatric populations.9,10 Self-report data from the Behavioral Risk Factor Surveillance Survey
(BRFSS) show the increase in prevalence continuing into the year 2000.11
Obesity prevalence is higher in women; overweight is more common in men.7 Obesity is
especially common in certain minority ethnic groups, including African Americans, some
Hispanic populations, Native Americans, and Native Hawaiians.
All classes of excess body weight have substantial prevalence among U.S. adults. In the
National Health and Nutrition Examination Survey III (NHANES III, 1988-1994), the
prevalence of BMI 25 to 29.9 was 44% for people ages 55 years and older and 41% for people
ages 25 to 54.9 years.12,13 For these older (55 years of age and older) and younger (25-54.9
years) groups, the prevalence of BMI 30 to 34.9 was 18% and 14%, respectively. The
prevalence of BMI 35 to 39.9 was 4% and 3%, respectively, and for BMI 40 or above, 1% and
2%.
Obesity is a risk factor for major causes of death, including cardiovascular disease, some
cancers, and diabetes. Obesity has also been linked with many sources of morbidity, including
osteoarthritis, gall bladder disease, sleep apnea, and respiratory impairment. Excess weight is a
risk factor for cancers of the colon, rectum, prostate, gall bladder, biliary tract, breast, cervix,
endometrium, and ovary.2 It is associated with concerns of quality of life, including diminished
mobility and social stigmatization.14

Chapter 1. Background
3
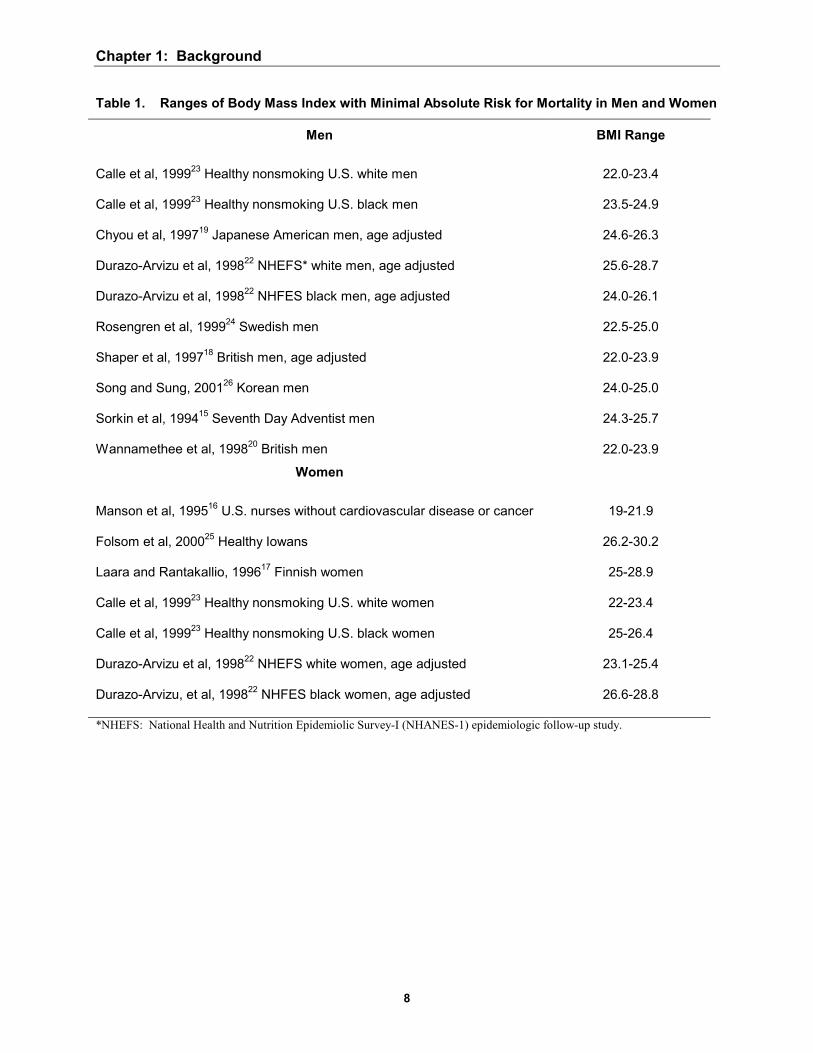
Most studies have found that mortality assumes a J-shaped or U-shaped relationship with
BMI, with elevated risk at low BMI being attributable, at least in part, to the effect of smoking or
concurrent disease. The BMI associated with the lowest risk varies among studies and
populations. For example, in our review of cohort studies with at least 10 years of follow-up
data,15-26 the BMI range associated with the lowest overall mortality risk was generally within
the �normal� BMI range for men, but in the normal-to-overweight range for women (Table 1).
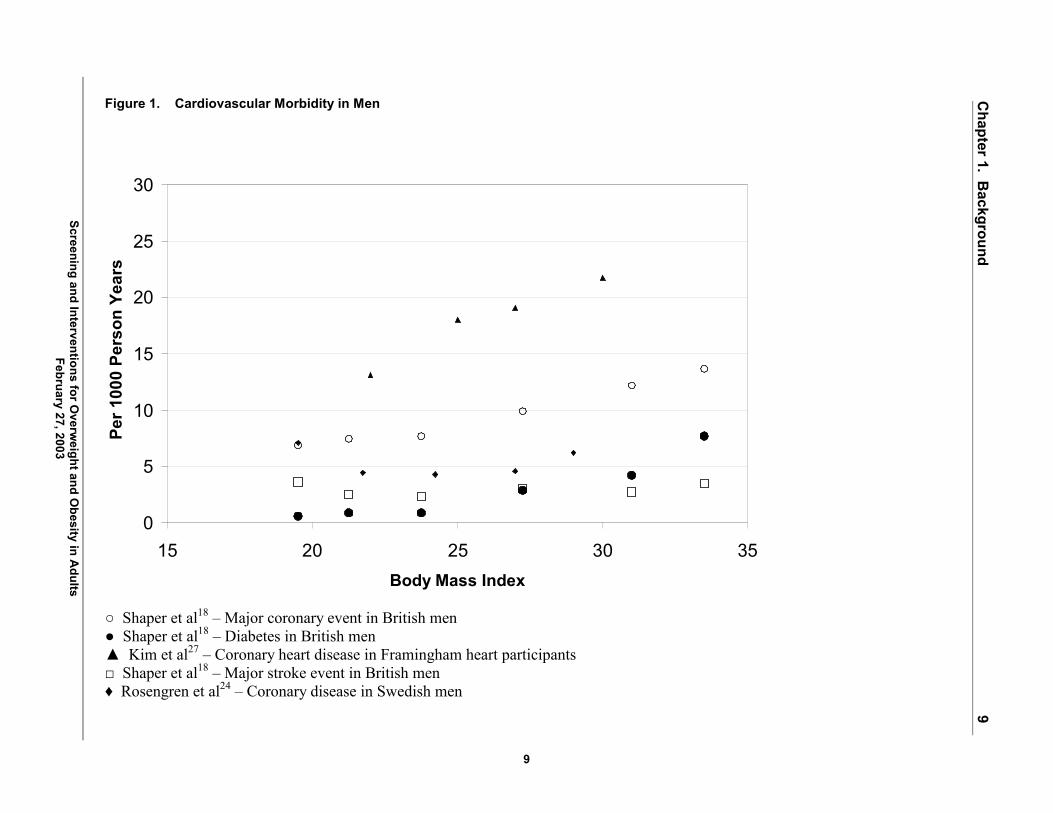
Risk associated with specific morbidity tends to increase more linearly with BMI than the
risk associated with total mortality. This trend has been demonstrated most frequently for
cardiovascular disorders, so we focus on those health outcomes in this systematic evidence
review (SER). In a study of a British cohort of men, the incidence of major coronary events was
9.1 per 1,000 person-years for those with a baseline BMI of 24 to 25.9.18 By contrast, coronary
heart disease incidence in Framingham heart participants was 18 per 1,000 person-years for men
with a baseline BMI of 23.8 to 25.9.27 In both these cohorts, and in a third from Sweden,24
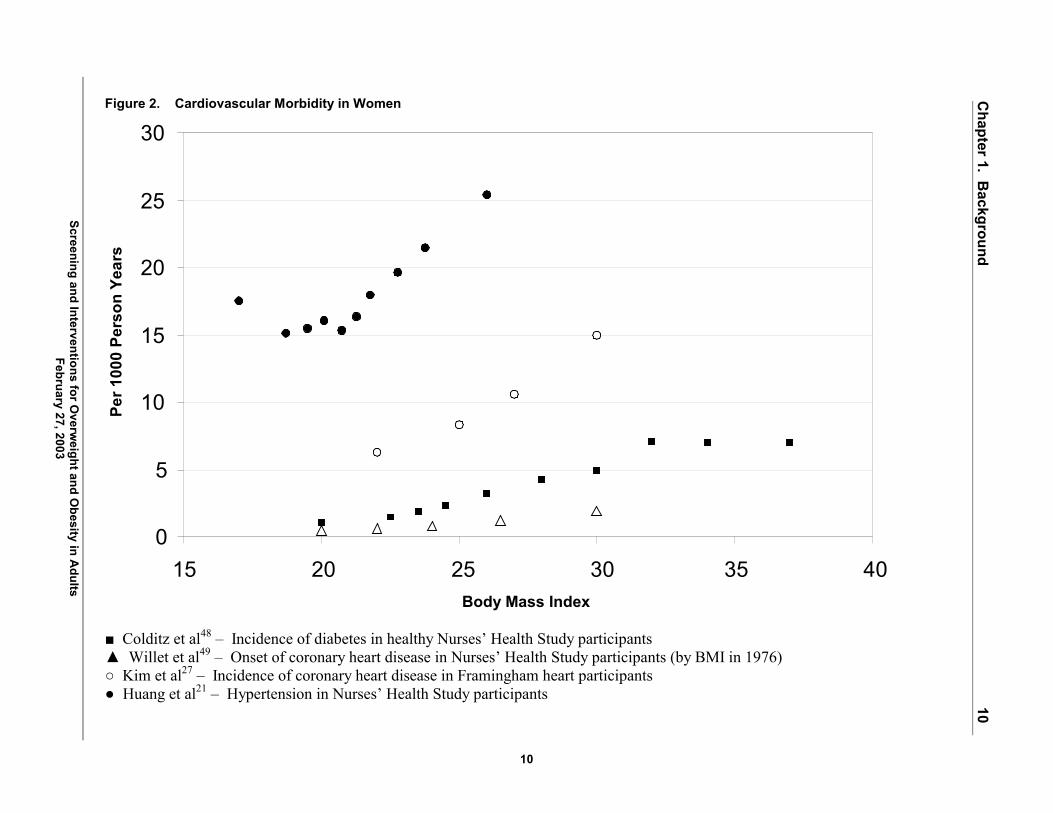
cardiovascular risk generally increased with increasing baseline BMI for men (Figure 1). A
similar rise in cardiovascular health risk is seen with increasing baseline BMI in cohort studies of
women (Figure 2).
Excess body weight has been linked to increased mortality for patients up to 74 years in
age. The risk lessens with age:28 however, the relationship between weight and health risk is
unclear beyond that point.3,29
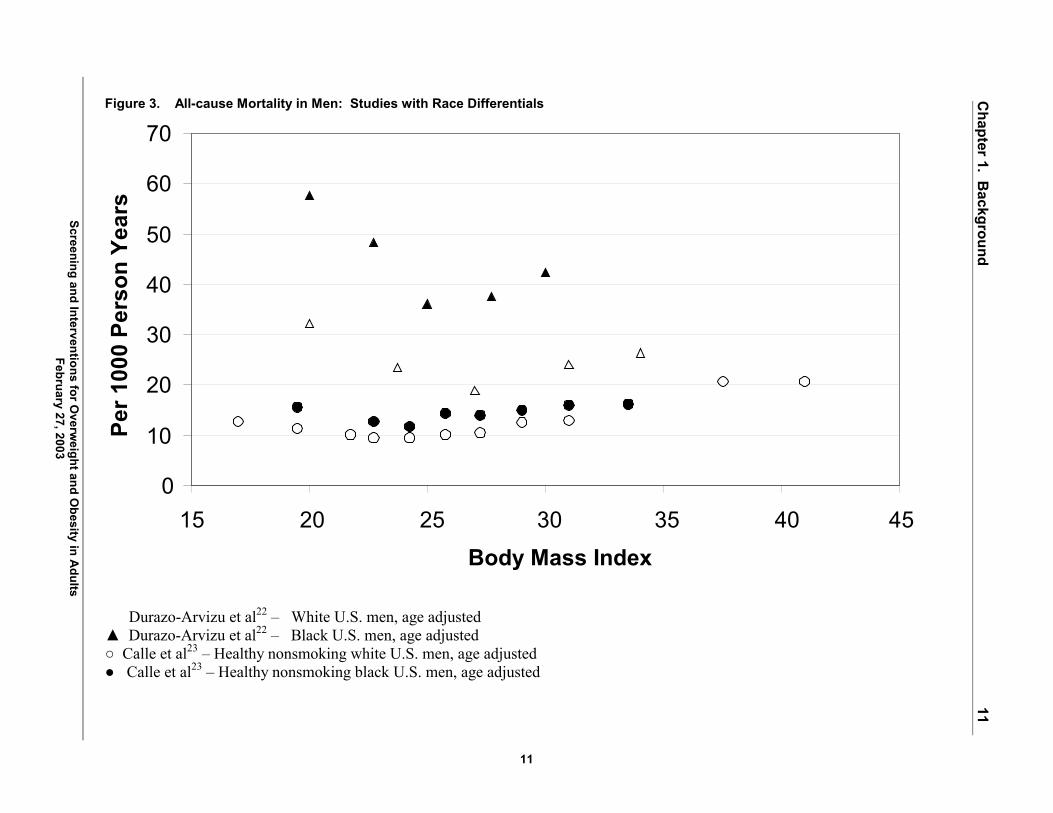
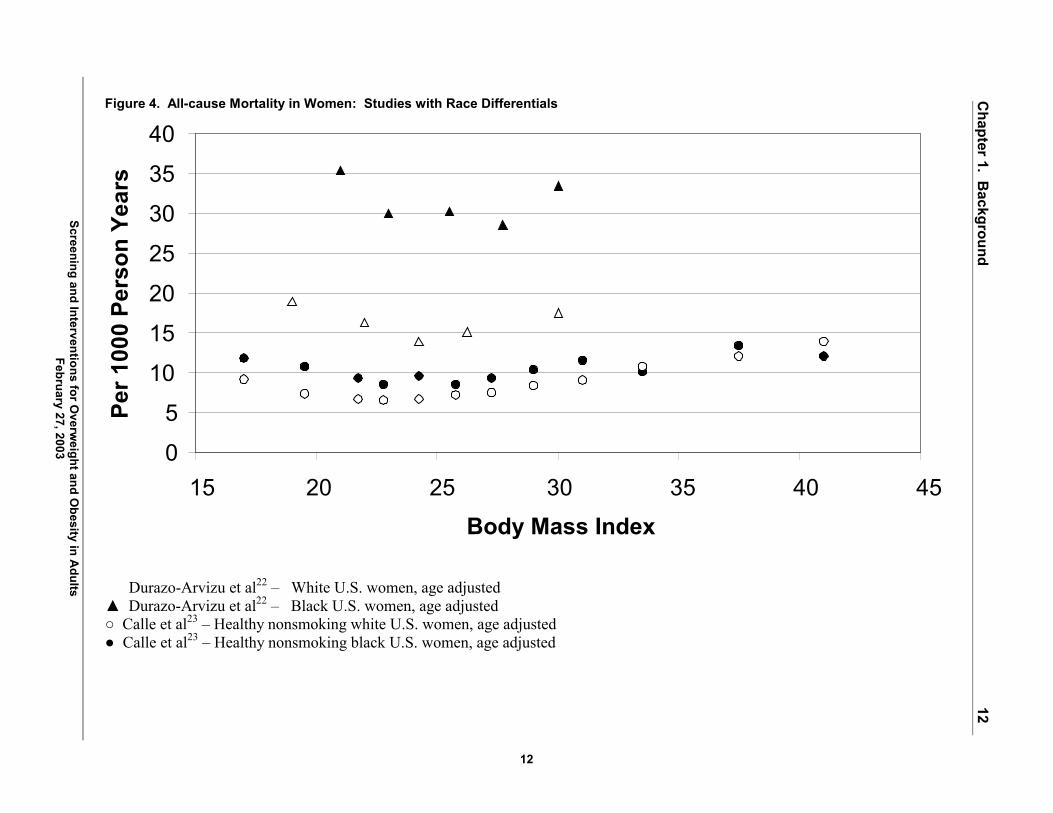
The association between obesity and health outcomes may vary by ethnic group. Figures
3 and 4 present data from 2 long (>10 year) cohort studies that reported data on more than 1
racial group.22,23 These studies suggested that the association between excess body weight and
mortality may be weaker for black populations than for white. One review of these and other

Chapter 1. Background
4
studies found that only tentative conclusions could be reached about mortality at elevated levels
of BMI in black men, with the best evidence showing only modest increases in risk.30 Likewise,
the BMI-mortality association appears weaker in black women than in white women. These
ethnic-specific studies assessed only all-cause mortality, not disease-specific mortality or
morbidity. Evidence about obesity and other outcomes for black populations and about the
association of obesity and health outcomes in general in other ethnic groups is insufficient to
draw conclusions.
Weight cycling � cycles of weight loss followed by weight regain � potentially carries
health risk, but the relationship has not been clearly established. Weight cycling has been linked
with increases of mortality;31-34 this association is not, however, found consistently,35 and these
studies do not distinguish between intentional and unintentional weight loss. The evidence is
mixed about the relationship between weight cycling associated with intentional weight loss (on
the one hand) and coronary artery disease risk factors (on the other). One observational study
showed 7% lower high-density lipoprotein (HDL) cholesterol levels among women with
coronary risk factors,36 and another showed a 4-fold increased risk of hypertension (odds ratio
[OR], 4.1; confidence interval [CI], 2.4 � 6.9) in Italian women.37 However, in 46,224 women of
the Nurses Health Study II, adjusting for BMI and weight gain, mild or severe weight cycling
was not associated with increased risk of hypertension incidence.38 Likewise, in a large cohort
of men, those who weight cycled did not have smaller improvements in total cholesterol, HDL,
or blood pressure compared with noncyclers.39 The psychological impact of weight cycling is
also unclear: weight fluctuation has been linked with covert hostility40 in one study and not
associated with measures of depression, stress, anxiety, and anger in another.41
Chapter 1. Background
5
Cost of Obesity and Overweight
Financially, obesity incurs substantial cost. Recent analyses estimate that direct costs of
obesity are 5.7% of total U.S. health expenditures42 and 2.4% of the total health care budget of
Canada.43 A U.S.-based study looking at the impact of obesity on the cost of expected lifetime
medical care on 5 diseases (hypertension, hypercholesterolemia, diabetes mellitus, coronary
heart disease, and stroke) found that costs increased by 20% with mild obesity, by 50% with
moderate obesity, and nearly 200% with severe obesity.44
At least 2 types of interventions might be considered for reducing the burden of suffering
from obesity: public health measures for the population at large or screening and intervention in
the individual patient�s clinical encounter. This systematic evidence review considers the
question of efficacy and effectiveness of screening and intervention in the clinical setting.
Some might ask why the issue of screening for obesity arises at all, as the diagnosis of
obesity may seem obvious. Clinicians, however, frequently do not address the issue of obesity
with obese patients. In a large national study of adults with a BMI of 30 or greater, for example,
only 42% reported that their health care professional advised them to lose weight.45 Thus, by
screening we refer here to the conscious measurement of BMI by the clinician, with the purpose
of addressing body weight in the clinical setting.
Obesity is a difficult problem to treat. This difficulty is the main concern that led prior
systematic reviews to have reservations about screening for obesity. Our SER focuses primarily
on the efficacy of potential interventions that might be initiated within the clinical setting. These
interventions include counseling and behavioral therapy for calorie reduction and increasing
physical activity, pharmacotherapy, and surgical approaches.

Chapter 1. Background
6
Prior Recommendations about Obesity Screening
In 1996, the U.S. Preventive Services Task Force (USPSTF) recommended periodic
measurement of height and weight for all patients.2 Since then, 3 large systematic reviews have
examined screening for obesity; they are evidence reports from National Institutes of Health
(NIH),3 the Canadian Task Force on Preventive Health Care,46and the University of York for the
UK National Health Service (NHS).47
Although all 3 reviews promoted clinical attention to obesity, their specific
recommendations varied. Since their completion, the prevalence of obesity has continued to
climb precipitously, new medications have become available, and more studies have addressed
the role of weight loss on health outcomes. To assist the USPSTF in updating its
recommendation, the RTI-UNC Evidence-based Practice Center undertook a systematic review
of the evidence concerning screening for obesity. In our analysis, we combined the findings of
the prior reviews with an assessment of more recent or not previously covered studies of fair to
good quality.
In our SER, we address screening for adult populations. Obesity in childhood and
adolescence is a significant and compelling issue that requires an evidence review dedicated to
that age group.9,10 The USPSTF regards the issue as sufficiently important that it expects to
review screening for obesity in children and adolescents separately in the future.

Chapter 1. Background
7
Organization of This Review
Chapter 2 of the SER documents our methods. Results appear in Chapter 3; Chapter 4
discusses the implications of our findings and offers suggestions about future research. Figures
and tables are found at the end of chapters where they are first called out. Appendix A
acknowledges the assistance of USPSTF liaisons to this project, the work of EPC staff, and the
helpful comments from external peer reviewers. Evidence tables are presented in Appendix B.
Chapter 1: Background
8
Table 1. Ranges of Body Mass Index with Minimal Absolute Risk for Mortality in Men and Women
Men BMI Range Calle et al, 199923 Healthy nonsmoking U.S. white men 22.0-23.4 Calle et al, 199923 Healthy nonsmoking U.S. black men 23.5-24.9 Chyou et al, 199719 Japanese American men, age adjusted 24.6-26.3 Durazo-Arvizu et al, 199822 NHEFS* white men, age adjusted 25.6-28.7 Durazo-Arvizu et al, 199822 NHFES black men, age adjusted 24.0-26.1 Rosengren et al, 199924 Swedish men 22.5-25.0 Shaper et al, 199718 British men, age adjusted 22.0-23.9 Song and Sung, 200126 Korean men 24.0-25.0 Sorkin et al, 199415 Seventh Day Adventist men 24.3-25.7 Wannamethee et al, 199820 British men 22.0-23.9
Women Manson et al, 199516 U.S. nurses without cardiovascular disease or cancer 19-21.9 Folsom et al, 200025 Healthy Iowans 26.2-30.2 Laara and Rantakallio, 199617 Finnish women 25-28.9 Calle et al, 199923 Healthy nonsmoking U.S. white women 22-23.4 Calle et al, 199923 Healthy nonsmoking U.S. black women 25-26.4 Durazo-Arvizu et al, 199822 NHEFS white women, age adjusted 23.1-25.4 Durazo-Arvizu, et al, 199822 NHFES black women, age adjusted
26.6-28.8
*NHEFS: National Health and Nutrition Epidemiolic Survey-I (NHANES-1) epidemiologic follow-up study.
9
Chapter 1. B
ackground
9
Screening and Interventions for Overw
eight and Obesity in A
dults February 27, 2003
Figure 1. Cardiovascular Morbidity in Men
0
5
10
15
20
25
30
15 20 25 30 35Body Mass Index
Per 1
000
Pers
on Y
ears
○ Shaper et al18 � Major coronary event in British men ● Shaper et al18 � Diabetes in British men ▲ Kim et al27 � Coronary heart disease in Framingham heart participants □ Shaper et al18 � Major stroke event in British men ♦ Rosengren et al24 � Coronary disease in Swedish men
10
Chapter 1. B
ackground
10
Screening and Interventions for Overw
eight and Obesity in A
dults February 27, 2003
Figure 2. Cardiovascular Morbidity in Women
0
5
10
15
20
25
30
15 20 25 30 35 40Body Mass Index
Per 1
000
Pers
on Y
ears
■ Colditz et al48 � Incidence of diabetes in healthy Nurses� Health Study participants ▲ Willet et al49 � Onset of coronary heart disease in Nurses� Health Study participants (by BMI in 1976) ○ Kim et al27 � Incidence of coronary heart disease in Framingham heart participants ● Huang et al21 � Hypertension in Nurses� Health Study participants
11
Chapter 1. B
ackground
11
Screening and Interventions for Overw
eight and Obesity in A
dults February 27, 2003
Figure 3. All-cause Mortality in Men: Studies with Race Differentials
0
10
20
30
40
50
60
70
15 20 25 30 35 40 45Body Mass Index
Per 1
000
Pers
on Y
ears
� Durazo-Arvizu et al22 � White U.S. men, age adjusted ▲ Durazo-Arvizu et al22 � Black U.S. men, age adjusted ○ Calle et al23 � Healthy nonsmoking white U.S. men, age adjusted ● Calle et al23 � Healthy nonsmoking black U.S. men, age adjusted
12
Chapter 1. B
ackground
12
Screening and Interventions for Overw
eight and Obesity in A
dults February 27, 2003
Figure 4. All-cause Mortality in Women: Studies with Race Differentials
0
5
10
15
20
25
30
35
40
15 20 25 30 35 40 45Body Mass Index
Per 1
000
Pers
on Y
ears
� Durazo-Arvizu et al22 � White U.S. women, age adjusted ▲ Durazo-Arvizu et al22 � Black U.S. women, age adjusted ○ Calle et al23 � Healthy nonsmoking white U.S. women, age adjusted ● Calle et al23 � Healthy nonsmoking black U.S. women, age adjusted
Chapter 2. Methods
13
2. Methods Analytic Framework and Key Questions Analytic Framework
Using methods of the U.S. Preventive Services Task Force (USPSTF),50 we developed an
analytic framework (Figure 5) and 6 key questions (KQs) (Table 2) to guide the literature
searches and analyses for this systematic evidence review (SER). The analytic framework
begins with a population at risk (in this case, adults) and moves through screening to
identification of individuals as either obese or overweight. Those so defined may receive one or
more treatments that affect weight loss or maintenance of weight loss (the top intermediate
outcomes) or glucose tolerance, blood pressure, or lipids (the bottom set of intermediate
outcomes). The treatments include various counseling and behavioral interventions,
medications, and surgery. The intermediate outcomes in turn may be related not only to each
other but also to a set of health outcomes, here mortality and morbidity, mental health, physical
functioning, or various other outcomes. One overarching relationship concerns a direct
relationship between screening and health outcomes. In addition, the figure notes (the two ovals)
our concerns with harms of both screening and treatment. Numbers in parentheses refer to our
main key clinical questions.
Chapter 2. Methods
14
Key Questions
As noted in Table 2, the first KQ examined direct evidence connecting screening and
reduced morbidity or mortality or other outcomes (marked 1 as in Figure 1). KQs 2 through 5
dealt with indirect evidence of the various relationships depicted in the figure.
KQ 2 concerned the prevalence of overweight and obesity in the population and KQ 3
concerned the accuracy of screening tests. KQ 4 examined the efficacy of 3 treatments for
overweight and obesity (counseling and behavioral interventions, medications, and surgery) for
sustained weight reduction and for improved measures of glucose tolerance, blood pressure, and
lipid status; KQ 5 examined the impact of these interventions (perhaps mediated through weight
reduction or improvement in glucose intolerance, blood pressure, and lipid levels) on the 4 sets
of health outcomes. Finally, KQ 6 concerned the harms of screening and treatment.
Literature Search Strategy and Synthesis
Search Terms
We examined the critical literature reviewed in the 1996 Guide to Clinical Preventive
Services from the USPSTF.2 We also searched the MEDLINE database and Cochrane Library
for reviews and relevant studies published in the English language between January 1, 1994, and
February 2002, using search terms consistent with the inclusion criteria. All searches were
constrained to human populations and English language.
Chapter 2. Methods
15
Inclusion and Exclusion Criteria
We developed inclusion and exclusion criteria for selecting the evidence relevant to
answer the key questions. Table 3 documents the number of articles meeting these criteria for
each key question, except KQ 3; because all relevant studies measured weight directly or by
BMI, we did not conduct searches for KQ3. Articles were excluded that did not meet USPSTF
criteria for at least �fair� quality.50
Article Review and Data Abstraction
We found 3 well-conducted, recent systematic reviews relevant to the issue of screening
for obesity.3,46,47 A fourth systematic review of good quality examined pharmacotherapy for
obesity.51 These studies are presented in Table 4, along with a comparison to our review.
Inclusion criteria for prior reviews were based on USPSTF criteria for systematic review
methods.50 After checking studies from our searches against the studies in these reviews, we
reviewed in detail only those studies that had not been included in at least 1 of the systematic
reviews.
At least 2 authors reviewed abstracts and articles to find those that met inclusion criteria.
For these included studies, a primary reviewer then abstracted relevant information using
standardized abstraction forms. Key data appear in the evidence tables in Appendix B. We
graded the quality of all included articles according to USPSTF criteria.50

Chapter 2. Methods
16
Preparation of this Systematic Evidence Review
The authors worked with 3 members of the USPSTF throughout the review (see
Acknowledgments in Appendix A) and, during 2001 and early 2002, presented a work plan and
interim reports to the full USPSTF. After Task Force feedback and any necessary revisions, we
distributed a draft of this systematic review for broad-based external peer review, including
experts in the field and relevant professional organizations and federal agencies. Following peer
review, we revised the evidence report and presented it to the Task Force for it to use in making
final recommendations on this topic.
Chapter 2. Methods
17
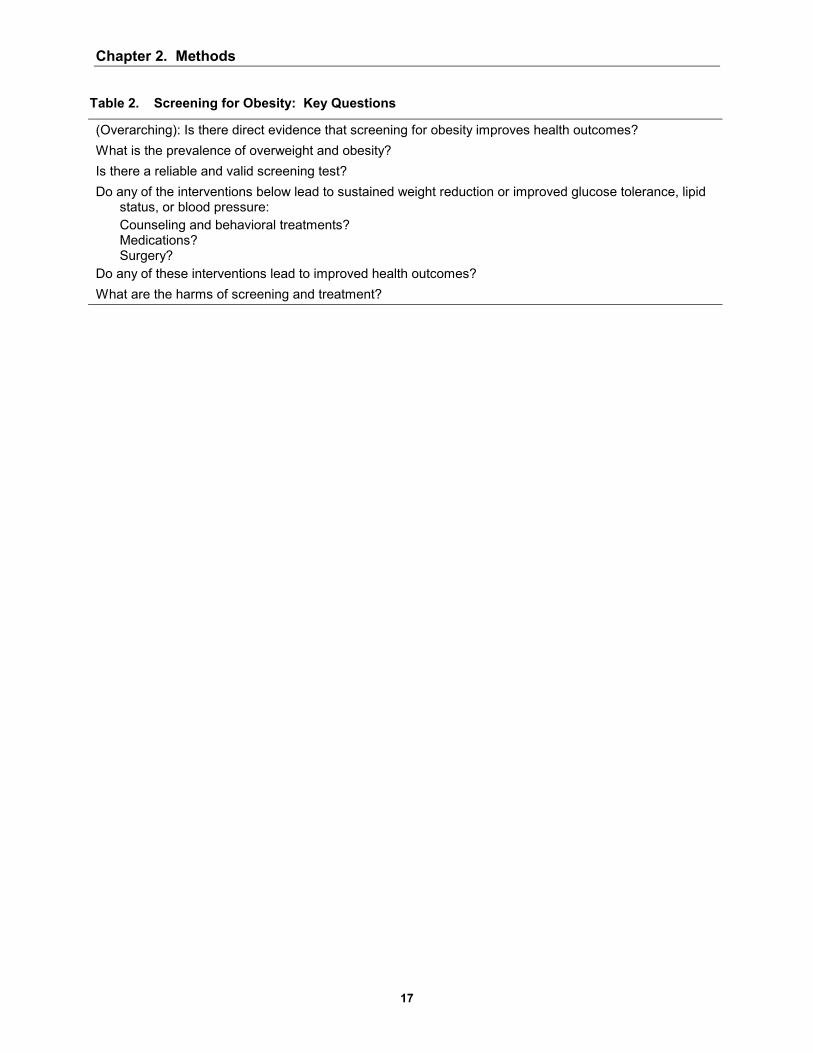
Table 2. Screening for Obesity: Key Questions
(Overarching): Is there direct evidence that screening for obesity improves health outcomes? What is the prevalence of overweight and obesity? Is there a reliable and valid screening test? Do any of the interventions below lead to sustained weight reduction or improved glucose tolerance, lipid
status, or blood pressure: Counseling and behavioral treatments? Medications? Surgery?
Do any of these interventions lead to improved health outcomes? What are the harms of screening and treatment?
Chapter 2. Methods
18
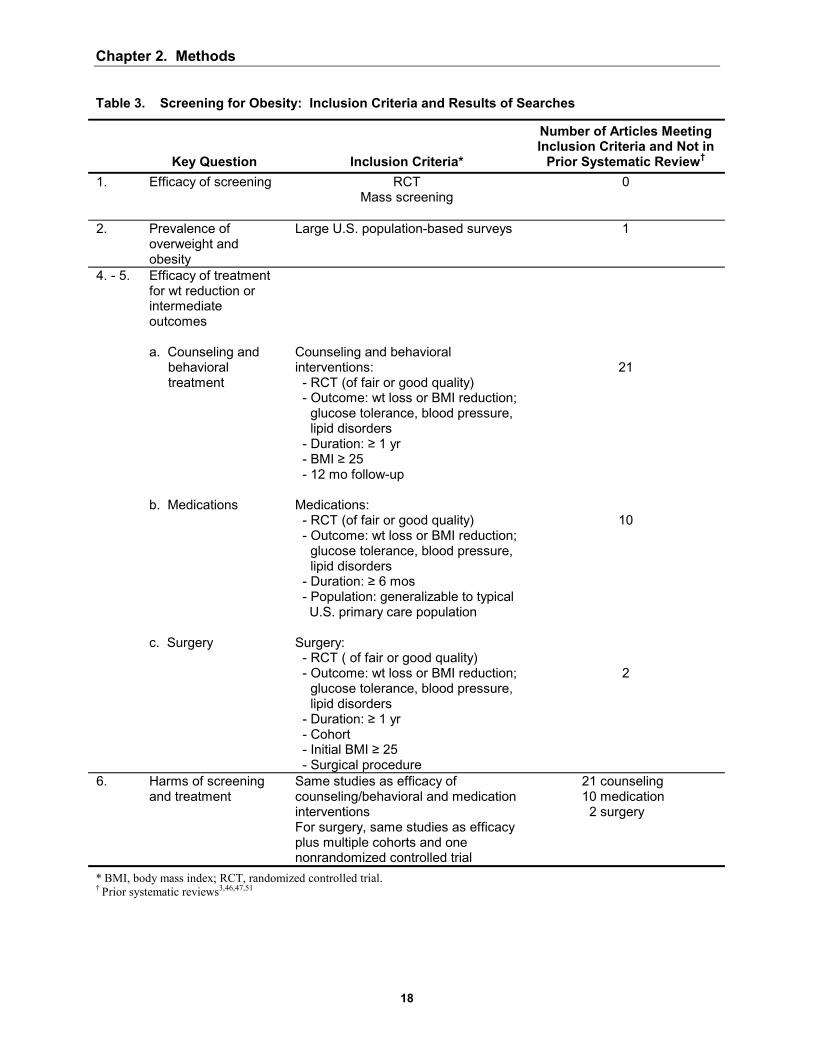
Table 3. Screening for Obesity: Inclusion Criteria and Results of Searches
Key Question Inclusion Criteria*
Number of Articles Meeting Inclusion Criteria and Not in
Prior Systematic Review� 1. Efficacy of screening RCT
Mass screening
0
2. Prevalence of overweight and obesity
Large U.S. population-based surveys 1
4. - 5. Efficacy of treatment for wt reduction or intermediate outcomes a. Counseling and
behavioral treatment
b. Medications c. Surgery
Counseling and behavioral interventions: - RCT (of fair or good quality) - Outcome: wt loss or BMI reduction;
glucose tolerance, blood pressure, lipid disorders
- Duration: ≥ 1 yr - BMI ≥ 25 - 12 mo follow-up Medications: - RCT (of fair or good quality) - Outcome: wt loss or BMI reduction;
glucose tolerance, blood pressure, lipid disorders
- Duration: ≥ 6 mos - Population: generalizable to typical
U.S. primary care population Surgery: - RCT ( of fair or good quality) - Outcome: wt loss or BMI reduction;
glucose tolerance, blood pressure, lipid disorders
- Duration: ≥ 1 yr - Cohort - Initial BMI ≥ 25 - Surgical procedure
21
10
2
6. Harms of screening and treatment
Same studies as efficacy of counseling/behavioral and medication interventions For surgery, same studies as efficacy plus multiple cohorts and one nonrandomized controlled trial
21 counseling 10 medication 2 surgery
* BMI, body mass index; RCT, randomized controlled trial. � Prior systematic reviews3,46,47,51
Chapter 2. M
ethods
19
Screening and Interventions for Overw
eight and Obesity in A
dults February 27, 2003
19
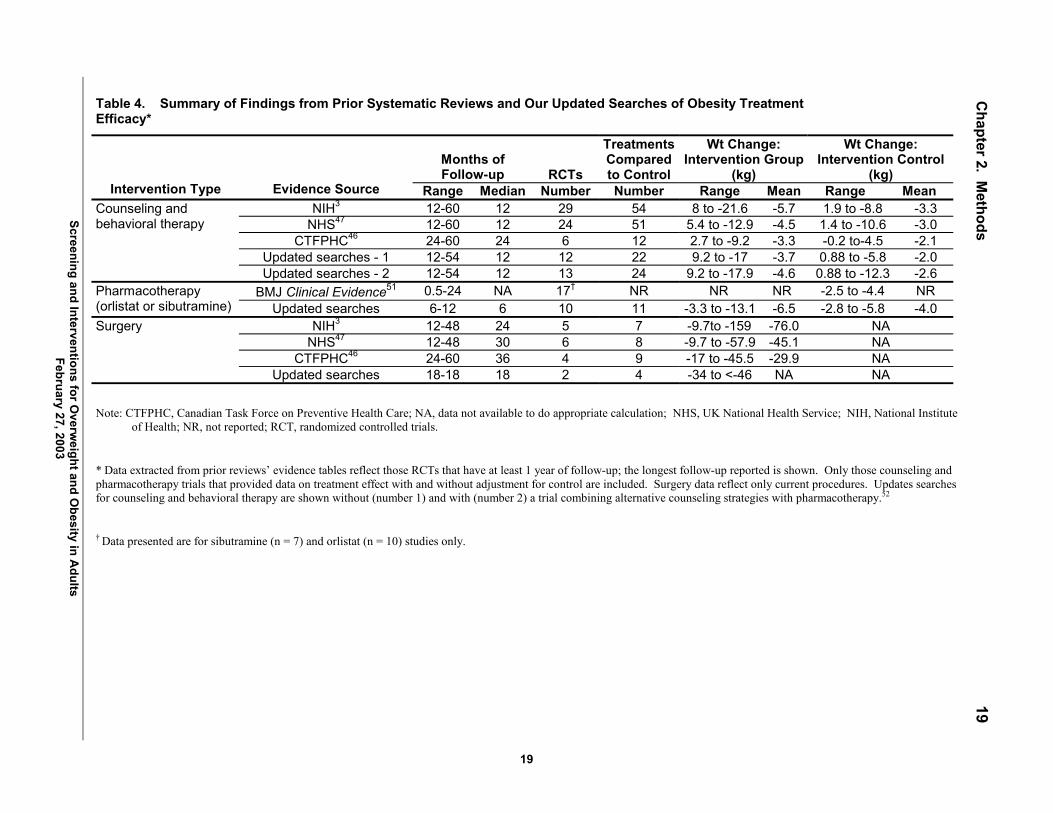
Table 4. Summary of Findings from Prior Systematic Reviews and Our Updated Searches of Obesity Treatment Efficacy*
Months of Follow-up RCTs
Treatments Compared to Control
Wt Change: Intervention Group
(kg)
Wt Change: Intervention Control
(kg) Intervention Type Evidence Source Range Median Number Number Range Mean Range Mean
NIH3 12-60 12 29 54 8 to -21.6 -5.7 1.9 to -8.8 -3.3 NHS47 12-60 12 24 51 5.4 to -12.9 -4.5 1.4 to -10.6 -3.0
CTFPHC46 24-60 24 6 12 2.7 to -9.2 -3.3 -0.2 to-4.5 -2.1 Updated searches - 1 12-54 12 12 22 9.2 to -17 -3.7 0.88 to -5.8 -2.0
Counseling and behavioral therapy
Updated searches - 2 12-54 12 13 24 9.2 to -17.9 -4.6 0.88 to -12.3 -2.6 BMJ Clinical Evidence51 0.5-24 NA 17� NR NR NR -2.5 to -4.4 NR Pharmacotherapy
(orlistat or sibutramine) Updated searches 6-12 6 10 11 -3.3 to -13.1 -6.5 -2.8 to -5.8 -4.0 NIH3 12-48 24 5 7 -9.7to -159 -76.0 NA
NHS47 12-48 30 6 8 -9.7 to -57.9 -45.1 NA CTFPHC46 24-60 36 4 9 -17 to -45.5 -29.9 NA
Surgery
Updated searches 18-18 18 2 4 -34 to <-46 NA NA
Note: CTFPHC, Canadian Task Force on Preventive Health Care; NA, data not available to do appropriate calculation; NHS, UK National Health Service; NIH, National Institute of Health; NR, not reported; RCT, randomized controlled trials.
* Data extracted from prior reviews� evidence tables reflect those RCTs that have at least 1 year of follow-up; the longest follow-up reported is shown. Only those counseling and pharmacotherapy trials that provided data on treatment effect with and without adjustment for control are included. Surgery data reflect only current procedures. Updates searches for counseling and behavioral therapy are shown without (number 1) and with (number 2) a trial combining alternative counseling strategies with pharmacotherapy.52
� Data presented are for sibutramine (n = 7) and orlistat (n = 10) studies only.

Chapter 2. M
ethods
20
Screening and Interventions for Overw
eight and Obesity in A
dults February 27, 2003
20
Figure 5. Analytic Framework: Screening and Interventions for Overweight and Obesity in Adults
(5)
*Treatments
4a. Counseling and Behavioral Interventions:--Diet--Physical activity--Diet and physical activity
4b. Medications
4c. Surgery
(5)
� Weight loss over6 months
� Maintenance ofweight reduction
Glucose tolerance---------------
Blood pressure---------------
Lipid disorders
Defined as obese
Defined asoverweight
(6)Harms
(2)(3)ScreeningPopulation
at risk
(6)Harms
(4*)Treatments
(1)
Mental health
Mortality/morbidity
Other
Functioning

Chapter 3. Results
21
3. Results
We present in this chapter the findings from our review according to each key question of
the analytic framework (Table 2 and Figure 5). Tables and figures called out for the first time in
this chapter can be found at the end of the chapter; evidence tables appear in Appendix B.
Key Question No. 1: Does Screening for Overweight and Obesity Affect Health Outcomes?
We found no randomized controlled trials (RCTs) evaluating the efficacy of obesity
screening programs (the overarching key question). Lacking direct evidence linking screening
and mortality, morbidity, mental health outcomes, or functioning, we turned to indirect evidence
on the components that a screening and intervention initiative would involve. These are the
internal linkages depicted in the analytic framework.
Key Question No. 2: What is the Prevalence of Overweight and Obesity?
Data from the National Center for Health Statistics show that, over the past 40 years,
obesity prevalence, estimated from measured height and weight, has increased from 13% to 27%
of the U.S. adult population.7,8 The prevalence of overweight, a less severe problem, rose from
31% to 34%. Thus, an estimated 61% of the U.S. population has a problem of excess weight or
body fat. Age, sex, and ethnic prevalence differentials exist, as discussed in Chapter 1.

Chapter 3. Results
22
Key Question No. 3: Is There a Reliable and Valid Screening Test?
The most commonly used screening test for obesity, and the one upon which the clinical
definition is based, is the body mass index (BMI, calculated as weight in kilograms divided by
height in meters squared). BMI is thus a measure of weight adjusted for height.
In 1996, the U.S. Preventive Services Task Force (USPSTF) reviewed literature showing
that BMI is easy to measure, highly reliable, and closely correlated (0.7-0.8) with body fat
content in adults and children.2 BMI is correlated with percentage of body fat (R2 = 0.68-0.7453
and R2 = 0.47-0.92, depending on age)54 and with body fat mass (R2 = 0.95, in men; R2 = 0.98, in
women).53 Validity may vary by characteristics of the population. For example, the degree of
body fat and BMI differ somewhat by ethnicity.55-57 The elderly generally show a higher
proportion of internal fat, and BMI correlates least strongly with body fat percentage in elderly
adults;54 however, estimates of body fat percentage from BMI for the elderly have shown an
error comparable to that for young adults (approximately 4%).58 The clinical relevance of BMI
measurement is clear from an established prospective link between BMI and multiple adverse
health outcomes.18,21-24,27,48,49
Some limitations of BMI do exist. For example, the correlation between body fat and
BMI is age dependent and does not incorporate body fat distribution, which is an independent
risk factor for health outcomes.59,60 In addition, BMI does not take into account �fitness� (the
weight of muscle vs the weight of fat in a heavily muscled individual), which is also associated
with mortality independent of BMI.61
Other measures of adiposity (eg, waist-to-hip ratio, waist circumference) have been
proposed to capture the increased cardiovascular risk seen with central adiposity. Central, or

Chapter 3. Results
23
abdominal, adiposity has been most closely linked with cardiovascular risk in several prospective
studies.
In the Atherosclerosis Risk in Communities (ARIC) study, either BMI >30 (odds ratio
[OR], 1.7; 95% confidence interval [CI], 1.4-2.0) or a waist-hip ratio >0.98 (OR,1.5; 95% CI,
1.3-1.8) was linked with increased risk of the multiple metabolic syndrome, adjusted for age,
sex, ethnicity, and center.62 Ten-year death rates from the Health Professional Follow-up Study
suggest that the relationship between central adiposity and mortality may be age dependent in
men. In this study, overall and cardiovascular mortality in men increased linearly with baseline
BMI in younger men (initially <65 years of age) and had no relationship with BMI in older men
(initially at least age 65); by contrast, waist circumference predicted risk of overall and
cardiovascular mortality in younger men and cardiovascular death among the older men.63 In a
cohort of Iowa women, the waist-hip ratio was a better predictor of total or coronary heart
disease mortality than BMI; hypertension incidence was more strongly linked with general
obesity than with abdominal obesity; and all measures of obesity were strongly linked with
diabetes incidence.25 Of particular note, even women in the lowest BMI quintile had marked
increased risk of diabetes if they also had a high waist-hip ratio.25 In another prospective study
of women, waist-hip ratio and waist circumference were independently associated with increased
risk of coronary heart disease, even among those with BMI < 25.64
As BMI has been linked with a wider range of health outcomes, entry criteria for most
studies are based on BMI. Obesity treatment trials typically reported either change in weight
(directly proportional to BMI) or BMI; they did not reliably report measures of fat distribution.
Because of these factors, we focused our analysis of screening tools on BMI.
Chapter 3. Results
24
Key Question No. 4a: Do Any Interventions Lead to Sustained Weight Reduction?
We identified 3 major forms of treatment for obesity that can be offered through various
health care settings: counseling and behavioral interventions aimed at lifestyle intervention,
pharmacotherapy, and surgery. We present results on these types of interventions below; details
of the main studies cited appear in the evidence tables in Appendix B. As reflected in the
analytic framework, our interest is both in intermediate outcomes such as sustained weight loss
and maintenance of weight loss or those related to glucose tolerance, blood pressure, and lipid
status, and in various health outcomes (discussed below).
Counseling and Behavioral Interventions
Counseling and behavioral interventions include a variety of approaches, all aimed at
promoting a change in diet or exercise. These treatments can be delivered with or without
behavioral intervention. The latter comprises strategies to help patients acquire the skills,
motivations, and supports to change their diet and exercise patterns.
Prior Systematic Reviews
The National Institutes of Health (NIH) panel reviewed 29 counseling-based trials, with
follow-up of at least 12 months, in which net weight loss (weight loss in intervention group
minus weight loss in control group) could be calculated from evidence table data (Table 4).
They found that average weight change in the intervention groups varied from a gain of 8 kg to a
loss of 21.6 kg; corrected for change in control groups, weight change was +1.9 kg to �8.8 kg. In
considering trials of ≥ 1 month duration, they found 38 in which counseling for low-calorie diets
Chapter 3. Results
25
(1,000-1,200 kilo-calorie [kcal] per day) could reduce body weight by an average of 8% over 3
to 12 months and decrease abdominal fat.3 While very-low-calorie diets produced greater initial
weight loss than low-calorie diets, effects were similar over follow-up beyond 1 year.
Counseling for physical activity (in 24 RCTs) led to modest weight loss (2% to 3% of weight)
and reduction in abdominal fat independent of the effect of caloric reduction. The combination
of counseling for a reduced calorie diet and increased physical activity produced greater weight
loss and reduction in abdominal fat than either approach alone. Review of 36 studies indicated
that behavior therapy was a useful adjunct to other weight loss approaches over 1 year and that
longer-term efficacy depended on continuing the intervention.
Upon review of 13 diet or behavioral therapy trials, the Canadian Task Force on
Preventive Health Care found that weight reduction was most effective during supervised dietary
treatment, with subsequent gradual weight regain. In 6 trials, with 24 to 60 months of follow-up,
net weight change was 0 kg to -4.5 kg.46
The UK National Health Service (NHS) likewise found that behavioral interventions,
combined with diet or exercise, appear to be effective and may be more so if of longer
duration.47 In 24 studies, net weight change was similar to that found in other reviews: +1.4 to
-10.6 kg over 12 to 60 months. The authors concluded that long-term follow-up and
maintenance strategies should be an integral part of a weight loss program.47
Studies of Efficacy of Counseling and Behavioral Interventions
We identified 17 randomized trials of fair or good quality in which interventions were
based on counseling (including diet, exercise, or some combination of the 2) and delivered with
or without behavioral therapy.52,65-80 In 1 additional trial, the intervention or control activity was
delivered by county of residence in a nonrandom fashion.81 Evidence Table 1, Appendix B,
Chapter 3. Results
26
records details of these 18 studies. Sustained weight loss was defined as a change in body
weight (in pounds, kilograms, or kilograms per meter squared of height [ie, BMI]) for at least 1
year.
We recorded the mode of intervention in Evidence Table 1 as well as the degree of
intensity of the intervention. We considered interventions to be of moderate intensity if they
involved monthly person-to-person contact with the participant, during the first 3 months of the
intervention. Those with more frequent contact were considered high intensity and those with
less frequent contact low intensity; cut-offs were driven by the distribution of program intensity
we found represented in the literature. The following discussion takes up trials of high, medium,
and low intensity in that order. We classified trials according to the type of intervention � ie,
type of behavior counseled (diet or exercise [D, E respectively in Evidence Table 1]) and
presence of a behavioral therapy component in the delivery of the intervention (B in Evidence
Table 1). More detail on counseling interventions is presented in Appendix C.
Trials often entailed both weight loss and maintenance phases. These were analyzed
separately from trials that involved either only a loss phase or only a maintenance phase
(following successful weight loss). We break out the 2 maintenance-only trials in the discussion
below.67,72
Comparison of effects is summarized in Figure 6. For this, we plotted the difference in
mean weight change between intervention and control groups, at end-points as close as possible
to 1 year, for all trials for which we could calculate the difference or the investigators could
report the difference. If variance data were available in the articles or we could calculate them,
we also depicted the 95% confidence intervals. Data are arrayed for high-, then moderate-, and
Chapter 3. Results
27
then low-intensity studies; those with good internal validity are listed ahead of those with fair
internal validity.
High-Intensity Interventions for Weight Loss. In all, 11 RCTs employed high-
intensity interventions at the group or individual level.52,65,66,68,69,71,73,74,76,79,80 Of these, 6 RCTs
compared high-intensity counseling intervention with a true control (no-intervention) group.
Four achieved significant reductions in weight in the treatment groups (average loss: 2.7-5.5 kg
improvement over controls at 12 months to more than 2 years of follow-up).65,66,69,79
Of these, a Finnish trial is of particular note: individual-based diet and exercise advice
with a behavioral component (7 sessions over the first year) led the intervention group to lose 3.4
kg more than controls over the first year.66 The investigators noted a high frequency of response
(where response was defined as 5% weight loss): 43% of the intervention group versus 5% of
the controls.66 Similar results were subsequently found for the participants in the Diabetes
Prevention Program in the United States: high-intensity counseling for diet and exercise, with
behavioral therapy, led to an average 5.5 kg loss in the intervention group versus controls over an
average of 2.8 years.79
Two trials with a true control were less successful. One, with a group-based approach,
showed borderline-significant reduction in weight in the treatment groups.74 Another combined
an intense individual and group approach; the treatment group had improved weight at 6 months,
but did not differ significantly from controls at 12 to 30 months of follow-up.68
Because prior studies have shown that combinations of diet, exercise, and behavioral
therapy tend to be more effective than a single treatment, we evaluated 5 additional trials in
which 1 combination of treatments was found to be superior to another, even in the setting of no
true control (ie, no treatment) arm.52,71,73,76,80 One study evaluating choice of behavioral
Chapter 3. Results
28
interventions found that a diet and exercise approach combined with behavioral choice treatment
led to, on average, 5.8 kg of additional weight loss compared with traditional behavioral
therapy.73 Another trial examined different exercise regimens in the setting of diet and
behavioral therapy: people who were supplied with treadmill machines for use at home, and
instructed to do short bouts of exercise, lost more weight (4.3 kg more) over 18 months than
those with similar instructions but no home equipment.71 A trial comparing various 1-year, 26-
session counseling programs found that combining meal replacements with a dietician-led group
intervention was more effective than such counseling alone; short counseling sessions (10 to 15
minutes) with a health care provider combined with meal replacements led to similar degrees of
weight loss as 1-hour dietician-led group sessions.80
A single trial examined the combination of counseling and behavioral therapy with
pharmacotherapy for obesity.52 Compared with sibutramine alone, the addition of a lifestyle
intervention (behavioral therapy) led to a 7.3 kg weight reduction, and the further addition of a
portion-controlled low-calorie diet led to weight loss of 12.8 kg over 1 year. Finally, Wing and
Anglin studied weight change by race, rather than weight loss per se. The data in Figure 6 thus
reflect differences between black and white populations estimated from their graph-based
results.76 Graphical data (significance not noted) suggest that weight loss was greater with
behavioral therapy and an intermittent very-low-calorie diet than with behavioral therapy with a
continuous low-calorie diet for white and black participants. However, over the 1-year follow-
up, weight loss was lower in blacks than whites, primarily from faster regain.
Three studies (1 with 2 different physical activity interventions) reported weight change
results first at 12 to 18 months, and then with prolonged follow-up.66,69,74 As seen in prior
reviews, subjects showed a tendency towards weight regain. However, in 3 of the 4
Chapter 3. Results
29
interventions, a modest statistically significant weight loss of at least 2 kg was maintained 24 to
36 months after initiation.65,66,74 Two programs specifically included long-term maintenance
interventions.65,74
Moderate-Intensity Interventions for Weight Loss. We identified 2 moderate-
intensity, counseling-based weight loss interventions, both with a behavioral component.70,77 A
1-year, group-focused intervention showed effectiveness similar to that of the
nonpharmacological high-intensity interventions (3.5 kg).70 A second intervention for multiple
issues related to cardiac risk showed no significant improvement in weight at 18 months.77
Low-Intensity Interventions for Weight Loss. The low-intensity weight loss
interventions that we reviewed were not effective. In 1 RCT, Jeffrey and French looked at the
difference in weight change between intervention and control groups; this study was designed for
weight gain prevention and showed no difference in men or in women of 2 socioeconomic strata
at the end of 1 year.75
Two other studies (not shown in Figure 6) also investigated low-intensity approaches.78,81
An RCT that did not measure baseline weight for controls found that, after 3 years, skilled
manual laborers who underwent either a single or an annual nurse-run preventive medicine
examination weighed 0.4 kg less than coworkers who received no health checks.78 Finally, a
group-based study, delivered according to nonrandomized intervention or control counties, was
likewise ineffective.81
Interventions for Weight Loss in the Overweight. Limited data address the efficacy of
counseling-based interventions in the overweight. A well-done high-intensity intervention on
participants with baseline mean BMI levels of 25 promoted weight loss in a range similar to that
found in trials including only obese participants.65 However, 1 low- and 1 moderate-intensity

Chapter 3. Results
30
intervention in which participants� baseline BMI was in the upper range of overweight were
ineffective.75,77
Interventions for Maintenance of Weight Loss. Two trials, neither with a true control
group, evaluated counseling and behavioral plans for weight maintenance only.67,72 In the high-
intensity trial, members of a weight-focused treatment arm regained 2.1 kg less over 18 months
than those receiving exercise-focused treatment.72 Weight-focused participants maintained, on
average, 90% of their weight loss over that time (compared with 54% in the exercise-focused
arm). A low-intensity weight maintenance intervention also found a significant difference
between treatments:67 among self-selected women who had already lost more than 20 pounds,
the prescription of pre-measured low-calorie liquid meal replacements led to an average of 5 kg
lower weight over 1 year.
Summary of the Effectiveness of Counseling and Behavioral Treatment
Data on effectiveness of counseling and behavioral interventions must be understood in
light of several caveats. Although several trials were of �good� quality (internal validity), most
were judged only �fair,� with limitations such as small sample size, potential selection bias (trials
often enrolled volunteers), and high drop-out rates. Studies tended to report mean group weight
change (eg, an average weight change of -5 kg in a group of 50 participants) and not frequency
of response to the interventions (eg, 15 [30%] of 50 participants achieved loss of 10% of their
initial body weight). We were not able to assess differences by sex or ethnic background in
response to counseling and behavioral interventions; most trials included only women and either
did not specify ethnicity or involved primarily white samples. One study did examine weight
loss in black and white participants; initial weight loss in the black groups was followed by rapid
weight regain, so that at the end of the study, sustained weight loss was considerably greater in

Chapter 3. Results
31
white participants.76 Finally, the vast majority of these trials enrolled either only obese
participants or samples in which average baseline BMI was in the high-overweight range. We
were not able to assess the effectiveness of interventions specifically for those who are
overweight but not obese.
Our findings agreed with those of the prior systematic reviews: generally, the counseling
and behavioral interventions showed small to moderate degrees of weight loss sustained over at
least 1 year. In the updated searches, higher-intensity trials and combinations of interventions
appeared to promote better outcomes. However, treating patients with individual- versus group-
based approaches did not appear to have a strong influence on success. As previous reviews
have noted, trials with follow-up beyond 1 year tended to show a loss of effect; several studies,
however, have shown modest weight loss maintained at 24 to 36 months. In addition, the
success of weight maintenance trials is encouraging. Weight loss methods may need to be paired
with longer-term maintenance interventions for sustained improvement.
Pharmacotherapy Interventions
Prior Systematic Reviews
Pharmacological treatment options for obesity are intended either to help promote or to
sustain weight loss, in coordination with lifestyle change. Drug options have changed markedly
since the major prior systematic reviews for obesity. The evidence concerning sibutramine (a
dopamine, norepinephrine, and serotonin re-uptake inhibitor) and orlistat (a gastrointestinal
lipase inhibitor) has increased. Both are approved by the U.S. Food and Drug Administration
(FDA) for weight loss and weight maintenance after prior weight loss, in persons with BMI > 30

Chapter 3. Results
32
or persons with BMI > 27 with other risk factors such as hypertension, diabetes, or dyslipidemia;
they should be used in conjunction with a reduced-calorie diet. FDA approval was based upon
studies of up to 2 years� duration. Because of safety concerns, dexfenfluramine, fenfluramine,
phenylpropanolamine, and the combination of fenfluramine/phentermine�previously central
players in the pharmacotherapy of obesity�are no longer available in the United States.
Because available medications have changed so substantially since the publication of the
3 earlier large comprehensive obesity reviews, we do not present their findings here, although we
did review relevant content. For example, we reviewed the 1996 National Task Force on the
Prevention and Treatment of Obesity systematic review of clinical trials up to 6 months of drugs
available at that time. Arterburn and Noel had also reviewed these same articles in 2001,82 so we
focused on the more recent review. In our data synthesis step, we included the findings of the
systematic reviews along with the additional studies that we reviewed in detail.
Arterburn and Noel concluded that limited evidence shows that sibutramine is more
effective than placebo in promoting modest weight loss (2.8-4.2 kg in 7 RCTs over 0.5-24
months) in healthy adults, and in those with controlled hypertension, but that subjects regain
weight after stopping treatment.51 Orlistat was found to have a modest effect on body weight (an
average of 3.5 kg loss in 10 RCTs). Both medications lacked long-term evidence of safety.
Phentermine (7.4 kg average loss in 1 RCT) and mazindol (3.8 kg average loss in 1 RCT) caused
modest weight loss in adults who were more than 15% overweight; again, these drugs lacked
long-term evidence on safety. Small RCTs found limited and inconsistent evidence for the
efficacy of diethylpropion (2 RCTs) and fluoxetine (2 RCTs) for weight loss compared with
placebo.
Chapter 3. Results
33
Pharmacotherapy Intervention Studies Reviewed
We identified 13 RCTs of the efficacy of pharmacotherapy for weight loss that had been
published since the 1996 USPSTF guidelines and that fit our inclusion criteria. Of these, 6 trials
evaluated sibutramine,83-88 6 covered orlistat,89-94 and 1 involved metformin.95 We did not re-
review any trials that Arterburn and Noel had covered.51 We added 1 medication, metformin, to
the list of drugs reviewed previously, as we had located several trials addressing its use
specifically for weight loss. Evidence Tables 2, 3, and 4 in Appendix B present details on trials
of sibutramine, orlistat, and metformin, respectively.
Inclusion criteria for our review included (a) fair or good quality, placebo-controlled
RCTs on humans; (b) body weight or BMI as a primary trial outcome; (c) trial duration of at
least 6 months; (d) trial population generalizable to a typical U.S. primary care population; (e)
English language; and (f) no review by Arterburn and Noel. We categorized studies as either
�weight loss� (minimum of 6-month follow-up) or �weight maintenance� (minimum of 1-year
follow-up after successful weight loss). Eight weight-loss trials and 3 weight-maintenance trials
were judged to be of fair or good quality (1 study had both a loss and a maintenance arm).
To depict the various findings from the trials focused on weight loss, we record in
Figures 7 and 8 the mean weight changes and the percentage frequency of response (10% weight
loss), respectively.
Pharmacotherapy Interventions for Weight Loss
Sibutramine. Of the 6 sibutramine trials (Evidence Table 2),83-88 5 concerned weight
loss and lasted 6 to 12 months.84-88 Sibutramine-treated participants achieved an average of 2.8
kg to 4.8 kg more weight loss than placebo (Figure 7). Four trials recorded frequency of
response; for example, 27% to 65% of sibutramine-treated patients achieved 5% weight loss and

Chapter 3. Results
34
6% to 38% of patients lost 10% of their initial body weight.84,86-88 Sibutramine-treated
participants achieved 5% of total body weight loss 19% to 37% more often than controls
(depending on drug dose). As shown in Figure 8, patients on sibutramine achieved a 10% weight
loss 5% to 27% more often than controls (Figure 8, right hand panel). Differences by dose of
drug or mode of use (Figure 8, left-hand panel) were also of interest; however, by and large
dosage did not materially affect outcomes. For instance, in 1 trial, weight loss obtained with
sibutramine therapy did not differ between people treated with continuous therapy and those
treated with intermittent therapy.87
Orlistat. Of the 6 orlistat trials (see Evidence Table 3),89-93,96 we reviewed 5 assessing
weight loss over 6 to 12 months duration; orlistat-treated participants treated in the normal
dosing range (120 mg 3 times a day [Figure 7]) lost significantly more weight than controls: on
average, 2.8 kg to 4.5 kg (or 1.2-1.5 kg/m2) more than control participants.89-93 In 1 small study
(n = 55), the average weight of orlistat treated patients dropped 5.8 kg more than that of controls,
but the difference was not statistically significant.94 Only 2 of the orlistat trials we reviewed
reported frequency of response.89,93 In these trials, a 10% weight loss response occurred in 23%
to 38% of orlistat-treated participants depending on dose (Figure 8, left-hand panel). Between
9% and 19% more of orlistat group members were able to achieve 10% loss of their body weight
than members of the control group (Figure 8, right-hand panel).
Metformin. Only 1 metformin trial met quality criteria (Evidence Table 4).95 It included
patients with diabetes who had inadequate blood glucose control despite oral therapy for at least
1 year. Metformin-treated patients did no better than controls in terms of weight loss.
Chapter 3. Results
35
Pharmacotherapy Interventions for Maintenance of Weight Loss
Sibutramine. James et al reported weight change from baseline through 6 months of
successful treatment with sibutramine, followed by an 18-month period of sibutramine
maintenance therapy.83 Over the 2 years, sibutramine-treated participants lost, on average, 4 kg
more than their placebo-treated counterparts. They were also more likely (41% of sibutramine
vs 14% of placebo participants) to maintain 80% of their initial weight loss.
Orlistat. In the trial conducted by Karhunen et al, participants received 2 years of
therapy: orlistat for 2 years, placebo for 2 years, or 1 year of each.91 The investigators did not
record orlistat versus placebo results. Patients who were treated with orlistat for 1 or 2 years
obtained �significantly more� weight loss over 2 years than participants treated with placebo.
During the second year of treatment, orlistat was no more effective than placebo, on average, and
discontinuing orlistat appeared to lead to excess weight regain. That is, those treated with
orlistat for the first year and then changed to placebo had a mean 6.3 kg weight gain during the
second year, whereas those treated with placebo throughout gained, on average, only 3 kg over
the second year of the study.
In another trial, initiated after 6 months of successful dieting, participants treated with an
orlistat dose of at least 60 mg 3- times a day lost more weight over 1 year and were less likely to
experience marked weight regain than placebo-treated patients.90 Those treated with 120 mg 3-
times daily also achieved a larger percentage of weight change and were more likely to maintain
75% of their initial weight loss than placebo-treated patients.
Summary of the Efficacy of Pharmacotherapy
Again, findings must be interpreted in light of several considerations. One is internal
validity: most trials were of fair quality, although a few were judged to be of good quality. A

Chapter 3. Results
36
second is the degree to which participants were overweight in the trials. These trials did not
assess drug effectiveness by degree of overweight. Some included participants with baseline
BMI in the high 20s, but average baseline weight was consistently in the obese range (ie, BMI >
30), and pharmacotherapy for weight loss is approved only for the obese. As with
pharmacotherapy trials, participants were primarily women of European origin. We evaluated
several pharmacotherapy trials with relatively short-term follow-up (less than 1 year); although
their findings were generally within the range seen for the longer studies, sustained weight loss
was not established in so short a time.
Finally, although most trials did employ a form of intention-to-treat analysis, typically the
investigators analyzed their data according to a �last observation carried forward� protocol�the
final weight outcome available was used as the final weight for those participants who dropped
out of the study. As weight loss tends to be maximal within the first 6 months of therapy, failure
to measure body weight at the endpoint of longer trials risks overestimating the tendency towards
sustained weight loss. We would prefer to review such results alongside analysis of trial
�completers,� but such an approach was infrequent.
Overall, fairly long-term data for sibutramine and orlistat suggested that these drugs have
modest but potentially prolonged effects. Although average weight loss was consistently
modest, the percentage of patients achieving clinically significant loss (5%-10% of body weight)
was frequently substantial. Weight maintenance trials suggested that prolonged drug therapy
confers some benefit but that discontinuation of pharmacotherapy may lead to rapid weight
regain.
Chapter 3. Results
37
Surgical Approaches
Bariatric surgical procedures are restrictive or malabsorptive in nature. The 3 techniques
most commonly used in randomized trials are primarily restrictive. Gastric bypass involves
complete gastric partitioning with anastomosis of the proximal gastric segment to a jejunal loop.
Adjustable gastric banding involves placing an inflatable band around the stomach that can be
adjusted to different diameters.97 Vertical banded gastroplasty entails partial gastric partitioning
at the proximal gastric segment with placement of a gastric outlet stoma of fixed diameter.46
Although this literature still reports on this technique, clinical practice patterns appear to be
shifting away from it. Gastric bypass, adjustable gastric banding, and vertical banded
gastroplasty can all be performed either laparoscopically or through an open technique.
The duodenal switch procedure is a relatively new malabsorptive technique; although
fairly common in clinical practice, we did not find any RCTs evaluating its effectiveness.
Another malabsorptive method, jejunoileal bypass, is no longer recommended because of
excessive malabsorption.47
Prior Systematic Reviews
The 3 previous obesity reviews all evaluated the impact of surgery on people with
obesity. Because of practical and ethical constraints to a true randomized, blinded, placebo-
controlled surgical obesity trial, high-quality evidence for obesity surgery is limited. Reviews
have relied primarily on randomized unblinded trials in which neither arm was a true control (eg,
comparisons between surgical techniques). Here, we summarize their findings for current
procedures with at least 1 year of follow-up. The Canadian Task Force on Preventive Health
Care analyzed 4 randomized trials and 1 prospective cohort study.46 In these studies, mean

Chapter 3. Results
38
weight loss following surgery was 17 kg to 46 kg after 2 to 5 years. Postoperative mortality and
morbidity rates were low; 1 surgery-related death occurred (0.002% of subjects), and post-
operative morbidity was less than 5%. The Centre for Reviews and Dissemination from the
University of York�s review of 6 trials showed weight loss of 9.7 kg to 57.9 kg.47 In the NIH
National Heart, Lung and Blood Institute review, 5 randomized surgical trials led to weight loss
of 10 kg to 159 kg over 12 to 48 months.3
Studies of the Effectiveness of Surgical Interventions for Weight Loss
Randomized Trials. Our review of randomized trials with comparison arms included
trials of fair to good quality with follow-up of at least 1 year and weight loss or BMI change as
an outcome. We identified 2 trials that had not been reported by the previous systematic
reviews.97,98 Details are in Evidence Table 5. One compares laparoscopic versus open banding
techniques,97 and the other, 2 laparoscopic banding techniques.98
In the de Wit et al study, 50 obese (BMI >40) patients were randomized to either open or
laparoscopic adjustable silicone gastric banding.97 Both groups showed large average weight
declines over 1 year: 35 kg in the laparoscopic and 34 kg in the open surgical group.
Accordingly, BMI dropped from 51.3 to 39.7 in the laparoscopic group and from 49.7 to 39.1 in
the open group. Complications included incisional hernias (14.3%), umbilical hernia (2%), and
infection (2%); no subject died.
Weiner et al randomized 101 consecutive patients to 1 of 2 groups of laparoscopic gastric
banding�retrogastric placement (RGP) or esophagogastric placement (EGP).98 Weight loss was
substantial in both groups: more than 40 kg in both groups at 18 months. Post-operative
complications included 3 band slippages (3%, which were subsequently corrected with additional
laparoscopic surgery), 1 pouch dilation (1%), vomiting in 6 patients (6%), and dysphagia in 6

Chapter 3. Results
39
patients (6%); no patient died. Of note, results from a quality-of-life questionnaire revealed that
more than 96% of participants reported excellent well-being at the 18-month follow-up.
Cohort Studies. We used well-designed cohort studies as a second form of evidence for
obesity surgery. RCTs are the preferable form of evidence, but because the constraints against a
large RCT for obesity surgery are extensive, this may be a situation in which carefully evaluated
cohort data are appropriate. We searched for controlled cohort studies with weight loss as a
primary outcome, in which the patient population was well described, and identified a single
large on-going study � the Swedish Obese Subjects (SOS) study.99,100 In addition, we examined
extensive uncontrolled cohort (case series) evidence to assess the safety of obesity surgical
techniques and their applicability to primary care populations.
The SOS study provides the best cohort evidence: a large ongoing multi-center trial with
nonrandomized matched controls involving volunteers at 750 primary health care centers and 26
county and university hospitals in Sweden. The surgical arm is divided equally among 3 surgical
techniques: gastric banding, vertical banded gastroplasty, and gastric bypass. Controls are
treated with �the best non-surgical options available� (p. S3).100
Two-year data revealed weight loss of 28 kg (23% of total weight) among the surgical
patients and 0.5 kg among controls. The percentages of weight reduction after gastric banding,
vertical banded gastroplasty, and gastric bypass were 21%, 23%, and 33%, respectively. Eight-
year follow-up data showed a 20-kg weight loss (16.5% of total weight) for 251 patients in the
surgical group; over this same period, the 232 control patients gained 0.7 kg.100 The reported
post-operative mortality rate was 0.2%. As in the randomized trials, morbidity was low; among
1,164 patients, complications included bleeding (0.9%), wound complications (1.8%), abdominal

Chapter 3. Results
40
infection (2.1%), thromboembolic events (0.8%), pulmonary symptoms (6.2%), and
miscellaneous events (4.8%).100
Summary of Effectiveness of Surgical Treatment
Overall, considering RCTs, controlled cohort studies, and uncontrolled cohort studies, the
degree of weight reduction obtained with surgical interventions is consistently dramatic. Cohort
evidence suggests that this weight loss may be prolonged and that it can be achieved in patient
populations with multiple comorbidities.
We must, however, note some limitations to this literature. Surgical data are limited by
the lack of placebo-controlled RCT evidence, and the internal validity of the trials we reviewed
was of only fair quality. Again, the investigators tended to report average treatment effect, rather
than frequency of response.
Finally, obesity surgery has been performed for only a select group of patients; the NIH
obesity panel recommends it only for those people with a BMI >40 or a BMI of 35 to 40 with at
least 1 obesity-related comorbidity.3 National data indicate that 5% to 6% of the general
population has a BMI in this range,12 so a substantial number of people may meet these criteria.
Key Question No. 4b: Do Interventions Improve Other Intermediate Health Outcomes?
Prior reviews have established that counseling-based weight loss can improve various
intermediate health outcomes (in the analytic framework in Chapter 2, Figure 5, these are
maintenance of weight loss, blood pressure, gylcemic control, and serum lipids). In this review,
we did not attempt to re-establish either this link or that between our intermediate health
outcomes and final health outcomes. The NIH review found that weight loss by lifestyle
Chapter 3. Results
41
modifications reduced blood pressure in overweight nonhypertensive patients.3 Likewise,
multiple trials of weight loss via lifestyle intervention in hypertensive patients � generally
achieving 5 kg to 10 kg weight loss � led to reductions in systolic and diastolic blood pressure
(3-7 mm Hg, and 3 mm Hg, respectively), less incident hypertension, and few antihypertensive
medications. Only 1 RCT producing weight loss in hypertensive patients reported no significant
change in blood pressure.
Trials reviewing weight loss in a similar range reduced serum triglycerides, increased
high-density lipoprotein (HDL) cholesterol, and reduced low-density lipoprotein (LDL)
cholesterol. In addition, weight loss from lifestyle modification lowered blood glucose levels in
overweight and obese persons without diabetes and reduced blood glucose and hemoglobin A1c
(HbA1c) in some subjects with diabetes.
Because pharmacotherapy can potentially alter body chemistry and thus affect physiology
differently from other means of weight loss, we did assess new data looking specifically at the
ability of drug-induced weight loss to affect intermediate health outcomes. Health outcomes for
pharmacotherapy are limited to data from trials lasting no more than 2 years. Three trials
assessed the effect of sibutramine treatment on HbA1c.83-85 Two, lasting 24 to 104 weeks, found
no significant drug versus placebo effect;83,84 the third found that sibutramine-treated
participants, over 24 weeks, had a 2.2% greater decline in HbA1c than placebo.85 Three trials
examined fasting or nonfasting serum glucose in relation to sibutramine therapy;83,84,86 none
found a significant difference compared with placebo.
Orlistat therapy was linked to slightly lower total cholesterol after 24 to 52 weeks: 8%
lower in 2 trials,90,93 and 2.7mg/dL to 8.5 mg/dL (0.07-0.22 mmol/L) lower in another.92

Chapter 3. Results
42
Sibutramine showed less consistent total cholesterol findings. Three trials found no significant
drug versus placebo effect;83,84,86 another found a 20.4 mg/dL improvement over 24 weeks.85
Sibutramine and orlistat showed inconsistent effects on triglycerides83,84,86,88,92 and on
HDL.85,88 One trial found a significant decrease in HDL cholesterol with orlistat therapy (1.5-1.9
mg/dL with >90 mg daily dose),90 and another a 3.49% increase in HDL cholesterol.92 Two
trials found a significant increase in HDL cholesterol (5 mg/dL in one and 2.1 mg/dL in the
other) with sibutramine,83,88 and 2 others reported no significant effect.84,85 Orlistat was
associated with reductions in LDL cholesterol (3.1-10 mg/dL reduction vs placebo) in 1 trial90
and a 10% reduction in another.93 Sibutramine, in 4 different trials, had no effect on LDL
cholesterol.83-85,88 Overall, we found mixed evidence of improvements of secondary health
outcomes among the relatively short-term pharmacotherapy trials reviewed here; this
inconsistency may be attributable to altered metabolism by medications or to inadequate length
of follow-up.
In surgical cohort data, substantial weight loss was linked with dramatic improvements of
intermediate health outcomes. In one cohort of 330 patients with baseline glucose abnormalities
(half with impaired glucose tolerance and half with type 2 diabetes), 90% complete postsurgical
follow-up revealed normal fasting blood glucose and glycosylated hemoglobin in 91% of
subjects.101 Long-term follow-up (>5 years) of a group of 109 surgical patients found the rate of
development of diabetes to be 0.15 cases per 100 person years; in 27 controls (patients who
qualified for surgery but subsequently declined the procedure), the rate was 2.72 cases per 100
person years.102 Marked improvements in lipid profiles have also been noted.103 In the SOS,104
participants were initially matched on age, sex, height, weight, waist, blood pressure, cholesterol
and triglyceride levels, and diabetes. In the 2-year follow-up, the investigators reported lower
Chapter 3. Results
43
odds of hypertension (odds ratio [OR], 0.38; CI, 0.22-0.65), diabetes (OR, 0.02; CI, 0.00-0.16),
hypertriglyceridemia (OR, 0.10; CI, 0.04-0.25), and low HDL cholesterol (OR, 0.28; CI, 0.16-
0.49) in the surgical patients compared with the controls. However, blood pressure slowly
returned to levels similar to the control group. Thus, they did not report a long-term
improvement in blood pressure.105
Key Question No. 5: Do Interventions Improve Final Health Outcomes
To examine the question of effects of sustained weight loss, we divided our analysis of
health effects into intermediate outcomes (discussed above) and final health outcomes. Even
moderate intentional weight loss (5%-10% of initial body weight) has been shown to reduce the
severity of comorbidities associated with obesity. Limited observational data suggest that
intentional weight loss in the obese can lead to reduced mortality.106,107
We looked for new evidence that weight loss can affect mortality, morbidity, mental
health, and daily functioning. Two recent trials provide strong evidence that behaviorally
mediated weight loss can prevent diabetes.66,79 We found very limited evidence evaluating other
outcomes in the setting of modest controlled weight loss: 1 trial evaluating 2 types of behavioral
therapy showed borderline improved self-esteem in both treatment groups.73 The National Task
Force on the Prevention and Treatment of Obesity found that dieting did not lead to problems in
psychological function or eating disorders.60 The health benefits of weight loss in overweight
patients are less clear.
Chapter 3. Results
44
Key Question No. 6: What are the Harms of Screening and Treatment?
Screening or Counseling and Behavioral Interventions
We did not find studies evaluating the harms of screening or of counseling and behavioral
interventions. Nonetheless, a potential risk does exist, particularly as the stigma of obesity is
well established.
Medications
In their review of sibutramine harms, Arterburn and Noel found that common adverse
effects occurred somewhat more frequently in drug than control arms (10%-30% vs 8%-19%),
but no serious adverse events were reported.51 They noted reports of mean increases in systolic
and diastolic blood pressure (1-3 mm Hg) and heart rate (4-5 beats per minute); in people with
controlled hypertension, the incidence of clinically significant increases in blood pressure was
similar in intervention and control participants. They also found a 3.9% dropout for
hypertension in the sibutramine trials they reviewed.
Among the sibutramine trials that we reviewed, several showed high dropout rates;
however, attrition was generally lower for sibutramine patients than for those on placebo.
Attrition attributable to an adverse event was almost identical in drug and placebo arms in 5
sibutramine trials;83,84,86-88 it was not noted in the sixth.85
Even though reports of adverse events were common, when rates were specified they
tended not to differ between drug and placebo participants. The most frequent side effects
included insomnia, nausea, hypertension, dry mouth, dizziness, and confusion; side effects were
Chapter 3. Results
45
usually not severe. The most concerning side effect is hypertension; the average increase in
blood pressure was small: 0 mm Hg to 3.5 mm Hg higher in drug-treated patients in 3
studies,86-88 2.1 mm Hg higher in a fourth,84 and 5% higher in a fifth.83 Two studies reported
dropout because of hypertension, but it did not differ between drug and placebo arms.84,88 One
study noted that an average increase of 6.7 beats per minute in pulse rate was associated with
sibutramine.88
Orlistat adverse effects are primarily gastrointestinal. Arterburn and Noel found that
22% to 27% of orlistat-treated participants reported oily spotting, flatulence, and fecal urgency
(vs 1%-7% of control participants).51 Of the RCTs they reviewed, 4 showed an increased
incidence of vitamin deficiency with orlistat treatment; 1 suggested reduced intestinal absorption
of contraceptive pills with this medication. In addition, in 1 RCT of participants with coronary
heart disease risk factors, more serious adverse events (10% vs 2.6%; unidentified in nature)
occurred with orlistat than placebo.
In the orlistat trials we reviewed, attrition rates were generally similar (within 5%)
between drug and placebo arms. Dropout because of an adverse event generally was slightly
more common (0%-7%) in orlistat-treated participants, although in 1 group it was an additional
12%.90
In the 3 trials that reported overall adverse event rates, 10% to 18% more of the drug-
treated participants reported problems than did those in the placebo groups.89,92,93 The most
common side effects were gastrointestinal (flatus, abdominal pain, fecal urgency): 14% to 37%
more orlistat patients than controls reported the problems in the 3 studies, but they were usually
mild. One trial reported the frequency of severe gastrointestinal events to be 1% to 9% more in
Chapter 3. Results
46
drug-treated participants versus placebo.89 Two studies noted that orlistat led to gastrointestinal
disturbance leading to attrition in 1% to 10% of participants.
Adverse effects of other obesity medications may be of concern. Arterburn and Noel�s
review of harms of pharmacotherapy found no evidence of serious adverse reactions for
phentermine, but unclear incidence rates of potentially serious side effects for mazindol and
diethylpropion (pulmonary hypertension [mazindol and diethylpropion] and psychosis
[mazindol]).51 They found that fluoxetine has been linked with gastrointestinal symptoms, sleep
disturbance, sweating, tremor, amnesia, and thirst, and systematic review evidence of 10% to
15% incidence of anxiety, diarrhea, dry mouth, headache, and nausea.51 The single metformin
trial we reviewed did not provide enough information to evaluate its profile of side effects.95
Surgical Approaches
We evaluated multiple surgical cohort studies, with follow-up of at least 1 year, to assess
adverse effects. Adverse outcome data included 2 series in which patients had substantial
comorbidity,108,109 and multiple studies in which a modest degree of comorbidity was present.
Generally, mortality rates were very low. In 12 cohorts treated with vertical banded gastroplasty,
mortality ranged from 0% to 1.5%; if these rates were pooled, this represents a total of 3 deaths
in 1,165 patients.108-119 Two of those studies included patients with substantial comorbid
conditions,108,109 as did 2 of the gastric bypass cohorts.109,120 Among 9 cohorts of gastric bypass
patients, mortality was 0% to 1.5% (10 deaths in 1,397 patients).101,113,120-126 Adjustable gastric
banding mortality was similarly low: 0% to 1.6% in 16 cohorts.119,127-141
Vertical banded gastroplasty was associated with several types of complications. Re-
operation rate was reported to be 20% to 25% over 3 to 5 years.112,115 Wound infection was
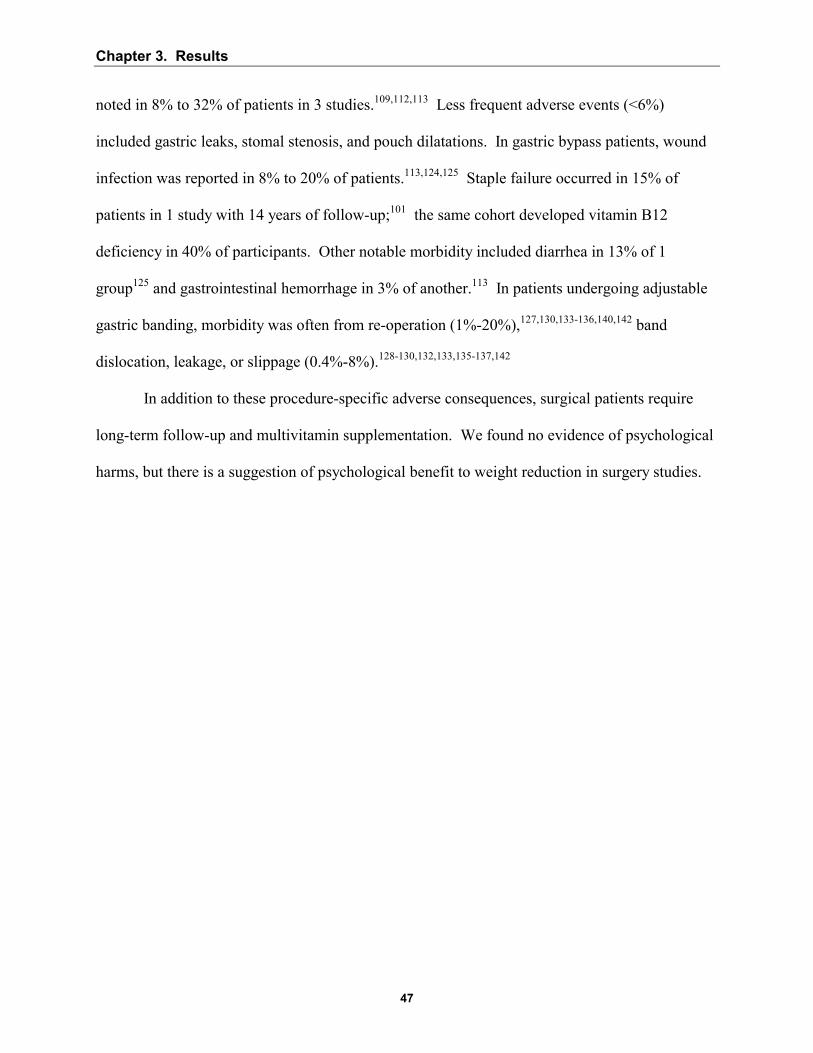
Chapter 3. Results
47
noted in 8% to 32% of patients in 3 studies.109,112,113 Less frequent adverse events (<6%)
included gastric leaks, stomal stenosis, and pouch dilatations. In gastric bypass patients, wound
infection was reported in 8% to 20% of patients.113,124,125 Staple failure occurred in 15% of
patients in 1 study with 14 years of follow-up;101 the same cohort developed vitamin B12
deficiency in 40% of participants. Other notable morbidity included diarrhea in 13% of 1
group125 and gastrointestinal hemorrhage in 3% of another.113 In patients undergoing adjustable
gastric banding, morbidity was often from re-operation (1%-20%),127,130,133-136,140,142 band
dislocation, leakage, or slippage (0.4%-8%).128-130,132,133,135-137,142
In addition to these procedure-specific adverse consequences, surgical patients require
long-term follow-up and multivitamin supplementation. We found no evidence of psychological
harms, but there is a suggestion of psychological benefit to weight reduction in surgery studies.
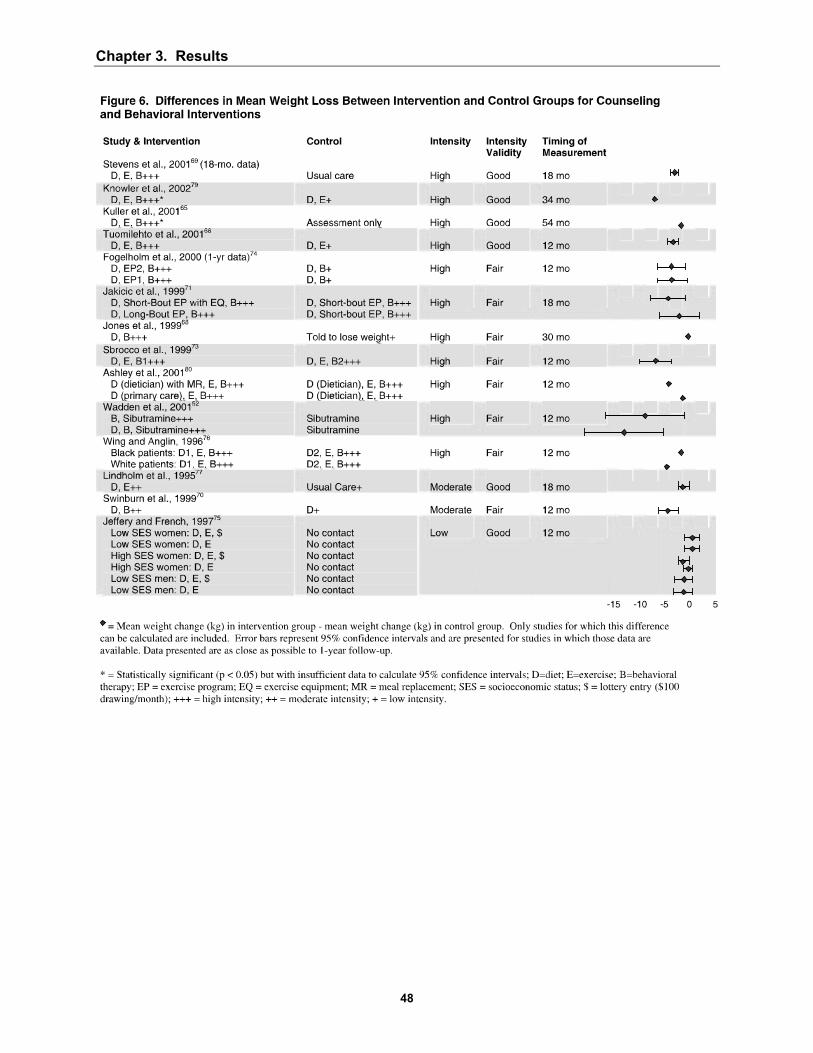
Chapter 3. Results
48
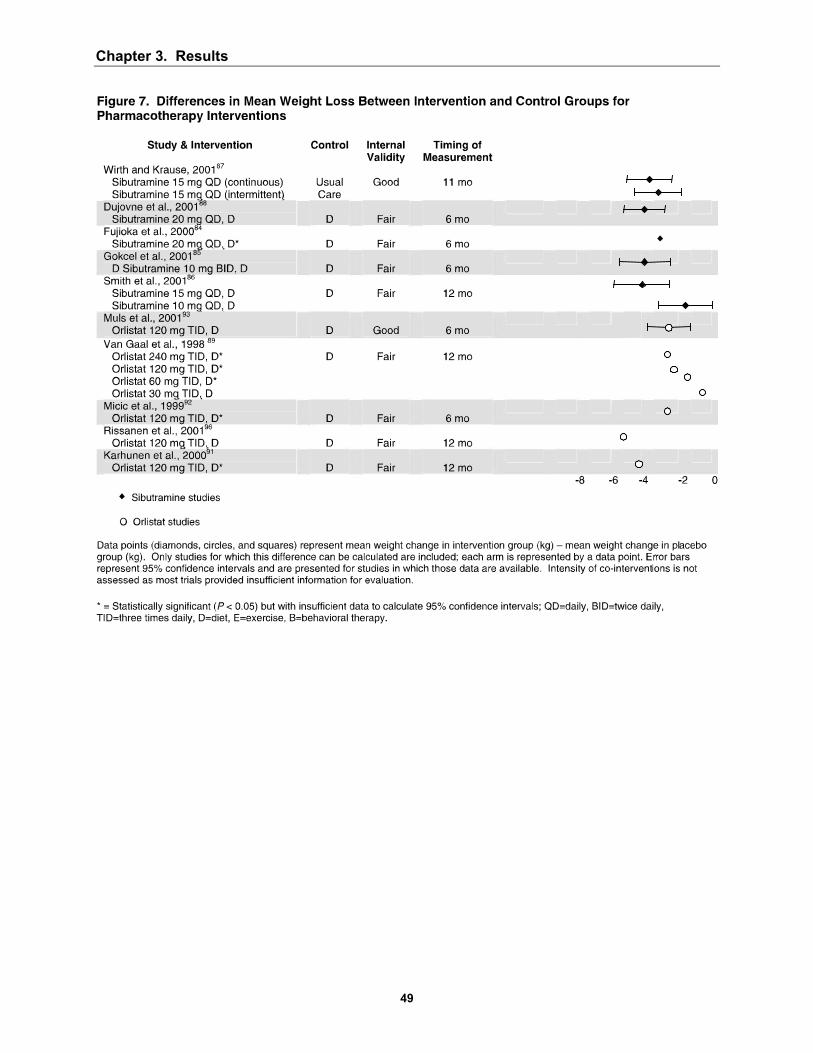
Chapter 3. Results
49
�
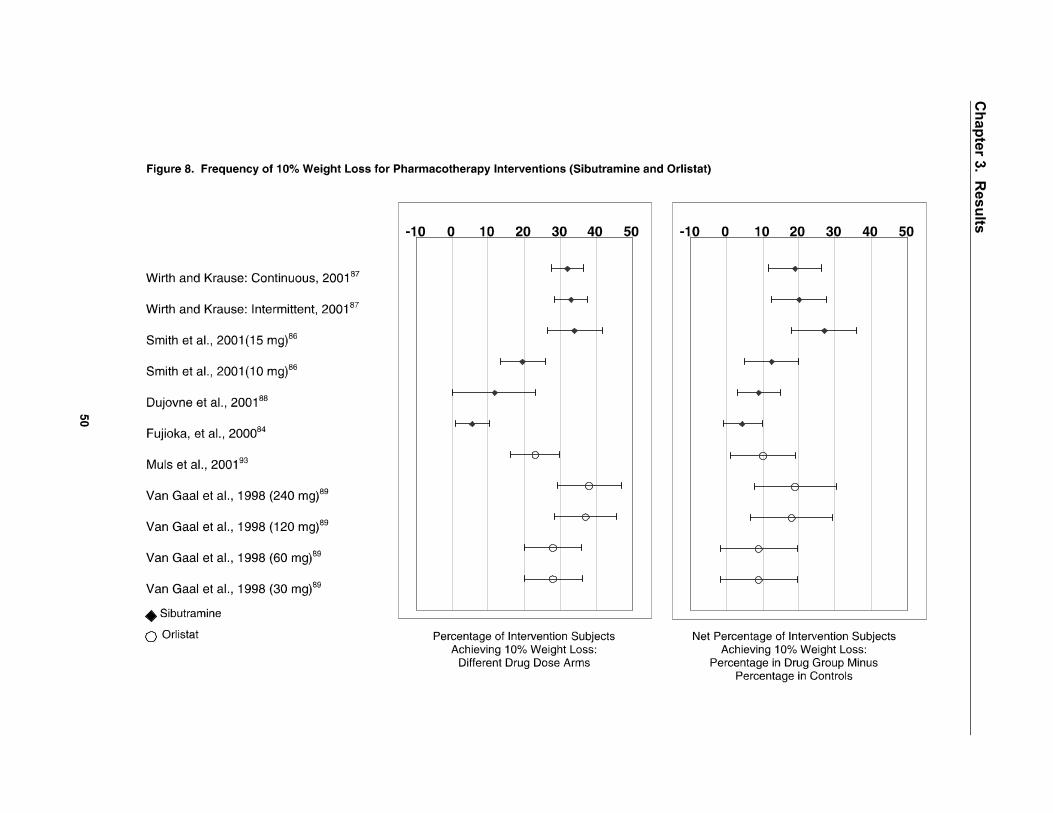
Chapter 3. R
esults
50

Chapter 4. Discussion
51
4. Discussion
General Conclusions
In this review, we found that obesity and overweight are common, are easy to screen for,
can potentially pose a substantial health burden in this country, and can be addressed with a
substantial array of therapies. These factors make this a significant clinical condition for
clinicians in primary care settings like those addressed by the U.S. Preventive Services Task
Force.
Data specific to the overweight population are very limited, but they suggest that
counseling interventions may promote modest weight loss in overweight people (those with body
mass index [BMI] of 25-29.9). Obese patients can achieve modest but clinically significant
weight loss with counseling, for either diet or exercise, or both, with or without additional
behavioral interventions to modify motivations, skills, and supports related to dietary or physical
activity patterns.
In prior systematic reviews, counseling-based interventions of at least 1 year duration led
to weight changes in the range of +1.9 kg to -10.6 kg.3,46,47 In our updated searches of
counseling efficacy, mean weight loss in counseled groups beyond that in control groups was as
follows, depending on the intensity of the intervention: high intensity, 0 kg to 5.4 kg; moderate
intensity, 0.25 kg to 3.5 kg; and low intensity, 0 kg to 2.7 kg. We defined intensity in terms of
numbers of face-to-face encounters in the first 3 months of an intervention; moderate intensity
was 3 such encounters and high (or low) was more (or fewer) than that. Importantly, these may
Chapter 4. Discussion
52
be conservative estimates of counseling-based weight loss, as �control� groups frequently did
receive some form of intervention.
Patients can achieve similar levels of weight loss with pharmacotherapy interventions.
Prior review has noted that patients treated with either sibutramine or orlistat lose 3 kg to 4 kg
beyond those treated with placebo.51 Limited data suggest that appetite suppressants may be
effective in the short term, but they have not been tested or approved for long-term use. In our
updated searches for pharmacotherapy efficacy, the mean loss beyond placebo was between 3.2
kg and 5.5 kg. From 5% to 27% more of those treated with drugs (sibutramine or orlistat)
achieved 10% weight loss than those treated with placebo, and 19% to 37% more of those with
sibutramine achieved at least a 5% weight loss. Again, these figures may be conservative
estimates of weight loss achieved with drugs because they do not reflect the effect of diet and
exercise. Behavioral interventions should accompany pharmacotherapy use.
Finally, in a select group of patients, surgical options promoted large amounts of average
weight loss (9.7-57.9 kg over 1-2 years). Generally, these are patients with extreme body mass
index (BMI >40) or marked obesity (BMI >35) with associated health complications and failure
to respond to other modalities in the past.
We arrived at all these findings through a variety of sources of evidence. Systematic
reviews of primary literature comprising randomized controlled trials (RCTs) found counseling,
behavioral, and pharmacotherapy efficacy similar to levels in more recent RCTs of fair to good
quality. Our conclusions about surgical therapy are based upon RCTs comparing different types
of banding techniques (open vs laparoscopic approaches, and different placements of
laparoscopic techniques), a well-conducted nonrandomized comparison study, and dramatic
results from cohort studies.
Chapter 4. Discussion
53
Cross-cutting Findings and Future Research Issues
The literature on which this systematic review is based yielded some insights into more,
or less, effective approaches, although some questions remain unanswered. Studies also had a
variety of limitations. We note here some important additional conclusions, together with our
assessment of significant future research that should be pursued.
Clarifying Benefits Over the Longer Term
Counseling-based interventions involving diet and exercise were consistently more
effective in the setting of a behavioral component. Treating patients on an individual basis, as
contrasted with using group interventions, appeared to be less important. Of note, many of the
interventions evaluated here were not carried out in the health providers� office, and high-
intensity programs may be difficult to incorporate into routine clinical practice. One option may
be referral to intensive counseling and behavioral therapy programs. Another is to evaluate
further the long-term efficacy of combining less intensive office-based counseling approaches
with different delivery approaches for behavioral therapy such as video or internet-delivered
adjuncts. Although evidence examining the role of behavioral interventions in coordination with
pharmacotherapeutical approaches is limited, 1 sibutramine trial suggested that such an approach
may provide substantial added benefit.
Thus, we would advocate for continued development and testing of counseling and
behavioral interventions with better, and longer, follow-up, whether independently or as part of a
multi-faceted approach that involved medications. Such multi-component studies might also add
social components to standard counseling or behavioral therapies. In addition, we emphasize the
need for investigators to invoke more conservative intention-to-treat analyses, rather than falling

Chapter 4. Discussion
54
back on methods involving last-observation-carried-forward approaches. Finally, the efficacy of
interventions to alter body fat distribution and clarification of health effects of purposeful
reduction of central adiposity deserve more attention.
For non-surgical options, weight loss was evaluated with relatively short-term follow-up
(at least 1 year for counseling trials and at least 6 months for drug trials). Longer follow-up
seems to be associated with lesser weight loss. Both prolonged counseling- and
pharmacotherapy-based interventions do appear to help maintain weight loss. Nonetheless,
studies of longer-term interventions (over several years) have not been done. A key area of
future research is to institute longer-term follow-up for benefits and harms, particularly for
pharmaceutical interventions. In addition, we note that work on weight maintenance
interventions (independent of investigations of weight loss) deserve attention (including long-
term follow-up as well).
Although evidence does not conclusively show that reducing weight extends life, we can
estimate the potential reduction in coronary heart disease (CHD) events from the effect of weight
reduction on risk factors. For example, studies of weight loss from counseling and behavioral
interventions find a reduction in systolic blood pressure of about 3 mm Hg and a reduction in
total cholesterol of about 5% from a 7% reduction in weight.3 Using the Framingham risk
equation, and assuming that these reductions in blood pressure and cholesterol would be
maintained for 10 years, we calculated that 1 CHD event would be avoided per 180 to 200 obese
people age 50 with mildly elevated blood pressure (140 mm Hg) and total cholesterol (220
mg/dl) who were treated according to the protocol of the Diabetes Prevention Program
intervention.79
Chapter 4. Discussion
55
For patients with higher levels of BMI, combinations of interventions may be more
effective than a single modality. Studies of long-term outcomes with ongoing counseling,
behavioral, and pharmacologic therapies are needed, as already suggested, but some research
emphasis needs to be directed at studies of multi-component interventions, especially those that
draw on recent conceptualizations of the behavioral elements of such approaches.
In addition, we found very limited data regarding efficacy of treatment options for
patients who are overweight but not obese (ie, BMI 25-29.9). In the interest of obesity
prevention, this patient population deserves further attention. Among the obese, studies of
surgery among patients with BMI levels lower than among patients who have been subjects of
recent trials may be warranted.
Clarifying Harms and Risks
All modes of treatment appear to be reasonably safe. We uncovered no evidence
documenting harms of the diet and/or exercise counseling or behavioral interventions. With
respect to medications, sibutramine is sometimes associated with increased blood pressure (mean
increase of up to 3.9 mm Hg), and orlistat causes gastrointestinal distress in 15% to 37% of
people taking the drug. However, safety has been assessed in trials lasting, at most, 1 to 2 years;
as noted, long-term adverse effects of pharmacotherapy are less well defined and ought to be
clarified through studies with longer follow-up periods. Useful future research would entail
developing and testing newer drugs that would pose even fewer side effects, especially
medications that do not increase blood pressure.
Surgical options clearly involve the highest risk, but current surgical approaches have
much lower complication rates than those of the past. Surgical procedures lead to mortality in
Chapter 4. Discussion
56
less than 1% of patients in pooled samples; in up to 25% of patients, however, re-operation is
necessary over 5 years.
Clarifying Benefits and Harms for Specific Populations
We were not able to assess the relative effectiveness of treatment options by sex or
ethnicity. Investigations have tended to focus on women; including more men in these studies is
desirable. In addition, most studies of health outcomes related to weight and of treatment
efficacy have been carried out in people of European origin. Because certain ethnic groups have
a disproportionate prevalence of obesity, including black populations, Mexican Americans,
American Indians, and Alaska Natives, this area needs further attention. Limited evidence
suggests that mortality risk is not as closely linked with body mass in African Americans as in
European Americans. However, the prevalence of diabetes, hypertension, and heart disease is
clearly disproportionate in black populations, suggesting that the elevated risk for these
conditions in the presence of obesity that has been established in white samples is not specific to
race. Further evaluation is needed to clarify these links.
Clarifying Costs and Cost-Effectiveness
At the outset of this work, we had intended to examine issues of costs and cost-
effectiveness of screening and treatment options, as a means of understanding the financial
ramifications of addressing this clinical problem in the face of its demonstrable financial impact
on patients, health budgets, and the economy. In the end, constraints of time and resources and
the paucity of new relevant literature meant that we did not pursue this question further.
Moreover, we doubt the utility of pursuing cost or cost-effectiveness with respect to use of BMI

Chapter 4. Discussion
57
as the screening tool; it is for all intents and purposes costless and is clearly the screening
measure of choice for both clinical and research applications.
We note, however, that significant questions ought to be subjected to economic
investigation, which could take several directions. First are questions of documenting better both
direct and indirect costs of treatment for specific interventions within the 3 broad types of
treatments we have dealt with in this review. Such data would enable researchers and
policymakers to determine better, for example, the cost-effectiveness of different approaches for
providing diet and exercise counseling, whether or not they are coupled with additional
behavioral interventions. Obviously, the same is true for pharmaceutical interventions and
surgical options. Second, and far more challenging, are questions of costs and relative cost-
effectiveness of options across these 3 categories. Finally, understanding better the costs and
cost-effectiveness of various options directed at special patient populations (eg, only overweight,
obese, or extremely obese; populations defined by ethnic and cultural background) will be of
important long-term benefit for policymaking at both the clinical and health plan levels.
References
58
References
1. U.S. Department of Health and Human Services, Public Health Service, Office of the Surgeon General. The Surgeon General's Call to Action to Prevent and Decrease Overweight and Obesity. Rockville, Md: U.S. Government Printing Office, Washington; 2001.
2. U.S. Preventive Services Task Force. Guide to Clinical Preventive Services. 2nd ed. Alexandria, Virginia: International Medical Publishing, Inc.;1996:219-229.
3. NHLBI Obesity Education Initiative. Clinical guidelines on the identification, evaluation, and treatment of overweight and obesity in adults: the Evidence Report. Bethesda, MD: U.S. Department of Health and Human Services, Public Health Service, National Institutes of Health, National Heart, Lung, and Blood Institute. 1998;NIH Publication No. 98-4083.
4. Lapidus L, Bengtsson C, Larsson B, Pennert K, Rybo E, Sjostrom L. Distribution of adipose tissue and risk of cardiovascular disease and death: a 12 year follow up of participants in the population study of women in Gothenburg, Sweden. BMJ (Clin Res Ed). 1984;289:1257-1261.
5. Lee IM, Manson JE, Hennekens CH, Paffenbarger RS Jr. Body weight and mortality. A 27-year follow-up of middle-aged men. J Am Med Assoc. 1993;270:2823-2828.
6. Despres JP, Moorjani S, Lupien PJ, Tremblay A, Nadeau A, Bouchard C. Regional distribution of body fat, plasma lipoproteins, and cardiovascular disease. Arteriosclerosis. 1990;10:497-511.
7. National Center for Health Statistics. Health, United States, 2001. With Urban and Rural Health Chartbook, Hyattsville, MD: National Center for Health Statistics; 2001.
8. National Center for Health Statistics. Prevalence of Overweight and Obesity Among Adults: United States, 1999. Available at: www.cdc.gov/nchs/products/pubs/pubd/hestats/obese/obese99.htm. Accessed June 15, 2002.
9. Dietz WH. Overweight and precursors of type 2 diabetes mellitus in children and adolescents. J Pediatr. 2001;138:453-454.
10. Strauss RS, Pollack HA. Epidemic increase in childhood overweight, 1986-1998. J Am Med Assoc. 2001;286:2845-1848.
11. Mokdad AH, Serdula MK, Dietz WH, Bowman BA, Marks JS, Koplan JP. The continuing epidemic of obesity in the United States. J Am Med Assoc. 2000;284:1650-1651.
12. Must A, Spadano J, Coakley EH, Field AE, Colditz G, Dietz WH . The disease burden associated with overweight and obesity. J Am Med Assoc. 1999;282:1523-1529.
13. Radimer KL, Subar AF, Thompson FE. Nonvitamin, nonmineral dietary supplements: issues and findings from NHANES III. J Am Diet Assoc. 2000;100:447-454.
14. Roe DA, Eickwort KR. Relationships between obesity and associated health factors with unemployment among low income women. J Am Med Womens Assoc. 1976;31:193-194, 198-199, 203-204.
15. Sorkin JD, Muller D, Andres R. Body mass index and mortality in Seventh-day Adventist men. A

References
59
critique and re-analysis. Int J Obes Relat Metab Disord. 1994;18:752-754.
16. Manson JE, Willett WC, Stampfer MJ, et al. Body weight and mortality among women. N Engl J Med. 1995;333:677-685.
17. Laara E, Rantakallio P. Body size and mortality in women: a 29 year follow up of 12,000 pregnant women in northern Finland. J Epidemiol Community Health. 1996;50:408-414.
18. Shaper AG, Wannamethee SG, Walker M. Body weight: implications for the prevention of coronary heart disease, stroke, and diabetes mellitus in a cohort study of middle aged men. BMJ. 1997;314:1311-1317.
19. Chyou PH, Burchfiel CM, Yano K, et al. Obesity, alcohol consumption, smoking, and mortality. Ann Epidemiol. 1997;7:311-317.
20. Wannamethee SG, Shaper AG, Walker M, Ebrahim S. Lifestyle and 15-year survival free of heart attack, stroke, and diabetes in middle-aged British men. Arch Intern Med. 1998;158:2433-2440.
21. Huang Z, Willett WC, Manson JE, et al. Body weight, weight change, and risk for hypertension in women. Ann Intern Med. 1998;128:81-88.
22. Durazo-Arvizu RA, McGee DL, Cooper RS, Liao Y, Luke A. Mortality and optimal body mass index in a sample of the US population. Am J Epidemiol. 1998;147:739-749.
23. Calle EE, Thun MJ, Petrelli JM, Rodriguez C, Heath CWJ. Body-mass index and mortality in a prospective cohort of U.S. adults. N Engl J Med. 1999;341:1097-1105.
24. Rosengren A, Wedel H, Wilhelmsen L. Body weight and weight gain during adult life in men in relation to coronary heart disease and mortality. A prospective population study. Eur Heart J. 1999;20:269-277.
25. Folsom AR, Kushi LH, Anderson KE, et al. Associations of general and abdominal obesity with multiple health outcomes in older women: the Iowa Women's Health Study. Arch Intern Med. 2000;160:2117-2128.
26. Song YM, Sung J. Body mass index and mortality: a twelve-year prospective study in Korea. Epidemiol. 2001;12:173-179.
27. Kim KS, Owen WL, Williams D, Adams-Campbell LL. A comparison between BMI and Conicity index on predicting coronary heart disease: the Framingham Heart Study. Ann Epidemiol. 2000;10:424-431.
28. Stevens J, Cai J, Pamuk ER, Williamson DF, Thun MJ, Wood JL. The effect of age on the association between body-mass index and mortality. N Engl J Med. 1998;338:1-7.
29. Heiat A, Vaccarino V, Krumholz HM. An evidence-based assessment of federal guidelines for overweight and obesity as they apply to elderly persons. Arch Intern Med. 2001;161:1194-1203.
30. Stevens J. Obesity and mortality in Africans-Americans. Nutr Rev. 2000;58:346-353.
31. Weight cycling. National Task Force on the Prevention and Treatment of Obesity. JAMA. 1994;272:1196-1202.
32. Williamson DF. "Weight cycling" and mortality: how do the epidemiologists explain the role of intentional weight loss? J Am Coll Nutr. 1996;15:6-13.
References
60
33. Reynolds MW, Fredman L, Langenberg P, Magaziner J. Weight, weight change, mortality in a random sample of older community-dwelling women. J Am Geriatr Soc. 1999;47:1409-1414.
34. Williamson DF, Pamuk ER. The association between weight loss and increased longevity. A review of the evidence. Ann Intern Med. 1993;119:731-736.
35. Olson MB, Kelsey SF, Bittner V, et al. Weight cycling and high-density lipoprotein cholesterol in women: evidence of an adverse effect: a report from the NHLBI-sponsored WISE study. Women's Ischemia Syndrome Evaluation Study Group. J Am Coll Cardiol. 2000;36:1565-1571.
36. Field AE, Wing RR, Manson JE, Spiegelman DL, Willett WC. Relationship of a large weight loss to long-term weight change among young and middle-aged US women. Int J Obes Relat Metab Disord. 2001;25:1113-1121.
37. Guagnano MT, Ballone E, Pace-Palitti V, et al. Risk factors for hypertension in obese women. The role of weight cycling. Eur J Clin Nutr. 2000;54:356-360.
38. Petersmarck KA, Teitelbaum HS, Bond JT, Bianchi L, Hoerr SM, Sowers MF. The effect of weight cycling on blood lipids and blood pressure in the Multiple Risk Factor Intervention Trial Special Intervention Group. Int J Obes Relat Metab Disord. 1999;23:1246-1255.
39. Carmody TP, Brunner RL, St Jeor ST. Hostility, dieting, and nutrition attitudes in overweight and weight- cycling men and women. Int J Eat Disord. 1999;26:37-42.
40. Simkin-Silverman LR, Wing RR, Plantinga P, Matthews KA , Kuller LH. Lifetime weight cycling and psychological health in normal-weight and overweight women. Int J Eat Disord. 1998;24:175-183.
41. Singh RB, Rastogi SS, Verma R, et al. Randomised controlled trial of cardioprotective diet in patients with recent acute myocardial infarction: results of one year follow up. BMJ. 1992;304:1015-1019.
42. Wolf AM, Colditz GA. Current estimates of the economic cost of obesity in the United States. Obes Res. 1998;6:97-106.
43. Birmingham CL, Muller JL, Palepu A, Spinelli JJ, Anis AH. The cost of obesity in Canada. Can Med Assoc J. 1999;160:483-488.
44. Thompson D, Edelsberg J, Colditz GA, Bird AP, Oster G. Lifetime health and economic consequences of obesity. Arch Intern Med. 1999;159:2177-2183.
45. Galuska DA, Will JC, Serdula MK, Ford ES. Are health care professionals advising obese patients to lose weight? JAMA. 1999;282:1576-1578.
46. Douketis JD, Feightner JW, Attia J, Feldman WF. Periodic health examination, 1999 update: 1. Detection, prevention and treatment of obesity. Canadian Task Force on Preventive Health Care. Can Med Assoc J. 1999;160:513-525.
47. NHS Centre for Reviews and Dissemination University of York. The prevention and treatment of obesity. Eff Health Care. 1997;3:1-12.
48. Colditz GA, Willett WC, Rotnitzky A, Manson JE. Weight gain as a risk factor for clinical diabetes mellitus in women. Ann Intern Med. 1995;122:481-486.
49. Willett WC, Manson JE, Stampfer MJ, et al. Weight, weight change, and coronary heart disease in
References
61
women. Risk within the 'normal' weight range. JAMA. 1995;273:461-465.
50. Harris RP, Helfand M, Woolf SH, et al. Current methods of the U.S. Preventive Services Task Force. A review of the process. Am J Prev Med. 2001;20:21-35.
51. Arterburn D, Noel PH. Effects of drug treatment for obesity in adults. BMJ Clin Evid. 2001;412-419.
52. Wadden TA, Berkowitz RI, Sarwer DB, Prus-Wisniewski R, Steinberg C. Benefits of lifestyle modification in the pharmacologic treatment of obesity: a randomized trial. Arch Intern Med. 2001;161:218-227.
53. Gray DS, Fujioka K. Use of relative weight and Body Mass Index for the determination of adiposity. J Clin Epidemiol. 1991;44:545-550.
54. Deurenberg P , Weststrate JA, Seidell JC. Body mass index as a measure of body fatness: age- and sex-specific prediction formulas. Br J Nutr. 1991;65:105-114.
55. Wang J, Thornton JC, Russell M, Burastero S, Heymsfield S, Pierson RN Jr. Asians have lower body mass index (BMI) but higher percent body fat than do whites: comparisons of anthropometric measurements. Am J Clin Nutr . 1994;60:23-28.
56. Deurenberg P, Yap M, van Staveren WA. Body mass index and percent body fat: a meta analysis among different ethnic groups. Int J Obes Relat Metab Disord. 1998;22:1164-1171.
57. Gurrici S, Hartriyanti Y, Hautvast JG, Deurenberg P. Relationship between body fat and body mass index: differences between Indonesians and Dutch Caucasians. Eur J Clin Nutr. 1998;52:779-783.
58. Deurenberg P, van der Kooy K, Hulshof T, Evers P. Body mass index as a measure of body fatness in the elderly. Eur J Clin Nutr. 1989;43:231-236.
59. Kramer H, Berkowitz RI, Hammer LD. Methodological difficulties in studies of obesity. I: Measurement Issues. Ann Behav Med. 1990;12:112-118.
60. National Task Force on the Prevention and Treatment of Obesity. Long-term Pharmacotherapy in the management of obesity. JAMA. 1996;276:1907-1915.
61. Lee CD, Blair SN, Jackson AS. Cardiorespiratory fitness, body composition, and all-cause and cardiovascular disease mortality in men. Am J Clin Nutr. 1999;69:373-380.
62. Liese AD, Mayer-Davis EJ, Tyroler HA, et al. Development of the multiple metabolic syndrome in the ARIC cohort: joint contribution of insulin, BMI, and WHR. Atherosclerosis risk in communities. Ann Epidemiol. 1997;7:407-416.
63. Baik I, Ascherio A, Rimm EB, et al. Adiposity and mortality in men. Am J Epidemiol. 2000;152:264-271.
64. Rexrode KM, Carey VJ, Hennekens CH, et al. Abdominal adiposity and coronary heart disease in women. JAMA. 1998;280:1843-1848.
65. Kuller LH, Simkin-Silverman LR, Wing RR, Meilahn EN, Ives DG. Women's Healthy Lifestyle Project: A randomized clinical trial: results at 54 months. Circ. 2001;103:32-37.
66. Tuomilehto J, Lindstrom J, Eriksson JG, et al. Prevention of type 2 diabetes mellitus by changes in
References
62
lifestyle among subjects with impaired glucose tolerance. N Engl J Med . 2001;344:1343-1350.
67. Rothacker DQ , Staniszewski BA, Ellis PK. Liquid meal replacement vs traditional food: a potential model for women who cannot maintain eating habit change. J Am Diet Assoc. 2001;101:345-347.
68. Jones DW, Miller ME, Wofford MR, et al. The effect of weight loss intervention on antihypertensive medication requirements in the Hypertension Optimal Treatment (HOT) study. Am J Hypertens. 1999;12:1175-1180.
69. Stevens VJ, Obarzanek E, Cook NR, et al. Long-term weight loss and changes in blood pressure: results of the Trials of Hypertension Prevention, phase II. Ann Intern Med. 2001;134:1-11.
70. Swinburn BA, Woollard GA, Chang EC, Wilson MR. Effects of reduced-fat diets consumed ad libitum on intake of nutrients, particularly antioxidant vitamins. J Am Diet Assoc. 1999;99:1400-1405.
71. Jakicic JM, Winters C, Lang W, Wing RR. Effects of intermittent exercise and use of home exercise equipment on adherence, weight loss, and fitness in overweight women: a randomized trial. JAMA. 1999;282:1554-1560.
72. Leermakers EA, Perri MG, Shigaki CL, Fuller PR. Effects of exercise-focused versus weight-focused maintenance programs on the management of obesity. Addict Behav. 1999;24:219-227.
73. Sbrocco T, Nedegaard RC, Stone JM, Lewis EL. Behavioral choice treatment promotes continuing weight loss: preliminary results of a cognitive-behavioral decision-based treatment for obesity. J Consult Clin Psychol. 1999;67:260-266.
74. Fogelholm M, Kukkonen-Harjula K, Nenonen A, Pasanen M. Effects of walking training on weight maintenance after a very-low-energy diet in premenopausal obese women: a randomized controlled trial. Arch Intern Med. 2000;160:2177-2184.
75. Jeffery RW, French SA. Preventing weight gain in adults: design, methods and one year results from the Pound of Prevention study. Int J Obes Relat Metab Disord. 1997;21:457-464.
76. Wing RR, Anglin K. Effectiveness of a behavioral weight control program for blacks and whites with NIDDM. Diabetes Care. 1996;19:409-413.
77. Lindholm LH, Ekbom T, Dash C, Eriksson M, Tibblin G, Schersten B. The impact of health care advice given in primary care on cardiovascular risk. CELL Study Group. BMJ. 1995;310:1105-1109.
78. Imperial Cancer Research Fund OXCHECK Study Group. Effectiveness of health checks conducted by nurses in primary care: final results of the OXCHECK study. BMJ. 1995;310:1099-1104.
79. Knowler WC, Barrett-Connor E, Fowler SE, et al. Diabetes Prevention Program Research Group. Reduction in the incidence of type 2 diabetes with lifestyle intervention or metformin. N Engl J Med. 2002;346(6):393-403.
80. Ashley JM, St Jeor ST, Schrage JP, et al. Weight control in the physician's office. Arch Int Med . 2001;161:1599-604.
81. Bemelmans WJ, Broer J, de Vries JH, Hulshof KF, May JF, Meyboom-De Jong B. Impact of Mediterranean diet education versus posted leaflet on dietary habits and serum cholesterol in a
References
63
high risk population for cardiovascular disease. Public Health Nutr. 2000;3:273-283.
82. Arterburn D, Noel PH. Extracts from 'Clinical Evidence'. Obesity. BMJ. 2001;322:1406-1409.
83. James WP, Astrup A, Finer N, et al. Effect of sibutramine on weight maintenance after weight loss: a randomised trial. STORM Study Group. Sibutramine Trial of Obesity Reduction and Maintenance. Lancet. 2000;356:2119-2125.
84. Fujioka K, Seaton TB, Rowe E, et al. Weight loss with sibutramine improves glycaemic control and other metabolic parameters in obese patients with type 2 diabetes mellitus. Diabetes Obes Metab. 2000;2:175-187.
85. Gokcel A, Karakose H, Ertorer EM, Tanaci N, Tutuncu NB, Guvener N. Effects of sibutramine in obese female subjects with type 2 diabetes and poor blood glucose control. Diabetes Care. 2001;24:1957-1960.
86. Smith IG, Goulder MA, On behalf of the Members of the Sibutramine Clinical Study 1047 T. Randomized placebo-controlled trial of long-term treatment with sibutramine in mild to moderate obesity. J Fam Pract. 2001;50:505-512.
87. Wirth A, Krause J. Long-term weight loss with sibutramine: a randomized controlled trial. JAMA. 2001;286:1331-1339.
88. Dujovne CA, Zavoral JH, Rowe E, Mendel CM, The Silbutramine Study G. Effects of sibutramine on body weight and serum lipids: a double-blind, randomized, placebo-controlled study in 322 overweight and obese patients with dyslipidemia. Am Heart J. 2001;142:489-497.
89. Van Gaal LF, Broom JI, Enzi G, Toplak H. Efficacy and tolerability of orlistat in the treatment of obesity: a 6-month dose-ranging study. Orlistat Dose-Ranging Study Group. Eur J Clin Pharmacol. 1998;54:125-132.
90. Hill JO, Hauptman J, Anderson JW, et al. Orlistat, a lipase inhibitor, for weight maintenance after conventional dieting: a 1-y study. Am J Clin Nutr. 1999;69:1108-1116.
91. Karhunen L, Franssila-Kallunki A, Rissanen P, et al. Effect of orlistat treatment on body composition and resting energy expenditure during a two-year weight-reduction programme in obese Finns. Int J Obes Relat Metab Disord. 2000;24:1567-1572.
92. Micic D, Ivkovic-Lazar T, Dragojevic R, Jorga J, Stokic E, Hajdukovic Z. Orlistat, a gastrointestinal lipase inhibitor, in therapy of obesity with concomitant hyperlipidemia. Med Pregl. 1999;52:323-333.
93. Muls E, Kolanowski J, Scheen A, Van Gaal L, ObelHyx Study G. The effects of orlistat on weight and on serum lipids in obese patients with hypercholesterolemia: a randomized, double-blind, placebo-controlled, multicentre study. Int J Obes. 2001;25:1713-1721.
94. Rissanen A. Pharmacological intervention: the antiobesity approach. Euro J Clin Invest. 1998;28 Suppl 2:27-30.
95. Giugliano D, Quatraro A, Consoli G, et al. Metformin for obese, insulin-treated diabetic patients: improvement in glycaemic control and reduction of metabolic risk factors. Eur J Clin Pharmacol. 1993;44:107-112.
96. Rissanen P, Vahtera E, Krusius T, Uusitupa M, Rissanen A. Weight change and blood coagulability and fibrinolysis in healthy obese women. Int J Obes. 2001;25:212-218.

References
64
97. de Wit LT, Mathus-Vliegen L, Hey C, Rademaker B, Gouma DJ, Obertop H. Open versus laparoscopic adjustable silicone gastric banding: a prospective randomized trial for treatment of morbid obesity. Ann Surg. 1999;230:800-805; discussion 805-807.
98. Weiner R, Bockhorn H, Rosenthal R, Wagner D. A prospective randomized trial of different laparoscopic gastric banding techniques for morbid obesity. Surg Endosc. 2001;15:63-68.
99. Sjostrom L, Larsson B, Backman L, et al. Swedish obese subjects (SOS). Recruitment for an intervention study and a selected description of the obese state. Int J Obes Relat Metab Disord. 1992;16:465-479.
100. Torgerson JS, Sjostrom L. The Swedish Obese Subjects (SOS) study--rationale and results. Int J Obes Relat Metab Disord. 2001;25 Suppl 1:S2-S4.
101. Pories WJ, Swanson MS, MacDonald KG, et al. Who would have thought it? An operation proves to be the most effective therapy for adult-onset diabetes mellitus. Ann Surg. 1995;222:339-350; discussion 350-352.
102. Long SD, O'Brien K, MacDonald KG, et al. Weight loss in severely obese subjects prevents the progression of impaired glucose tolerance to type II diabetes. A longitudinal interventional study. Diabetes Care. 1994;17:372-375.
103. Brolin RE, Bradley LJ, Wilson AC, Cody RP. Lipid risk profile and weight stability after gastric restrictive operations for morbid obesity. J Gastrointest Surg. 2000;4:464-469.
104. Sjostrom CD, Lissner L, Wedel H, Sjostrom L. Reduction in incidence of diabetes, hypertension and lipid disturbances after intentional weight loss induced by bariatric surgery: the SOS Intervention Study. Obes Res. 1999;7:477-484.
105. Sjostrom CD , Peltonen M, Sjostrom L. Blood pressure and pulse pressure during long-term weight loss in the obese: the Swedish Obese Subjects (SOS) Intervention Study. Obes Res. 2001;9:188-195.
106. Andres R, Muller DC, Sorkin JD. Long-term effects of change in body weight on all-cause mortality. A review. Ann Intern Med. 1993;119:737-743.
107. Williamson DF, Pamuk E, Thun M, Flanders D, Byers T, Heath C. Prospective study of intentional weight loss and mortality in never- smoking overweight US white women aged 40-64 years. Am J Epidemiol. 1995;141:1128-1141.
108. Melissas J, Christodoulakis M, Spyridakis M, et al. Disorders associated with clinically severe obesity: significant improvement after surgical weight reduction. South Med J. 1998;91:1143-1148.
109. Bloomston M, Zervos EE, Camps MA, Goode SE, Rosemurgy AS. Outcome following bariatric surgery in super versus morbidly obese patients: does weight matter?. Obes Surg. 1997;7:414-419.
110. Balsiger BM, Poggio JL, Mai J, Kelly KA, Sarr MG. Ten and more years after vertical banded gastroplasty as primary operation for morbid obesity. J Gastrointest Surg. 2000;4:598-605.
111. Davila-Cervantes A, Ganci-Cerrud G, Gamino R, Gallegos-Martinez J, Gonzalez-Barranco J, Herrera MF. Open vs. laparoscopic vertical banded gastroplasty: a case control study with a 1-year follow-up. Obes Surg. 2000;10:409-412.
112. Alper D, Ramadan E, Vishne T, et al. Silastic ring vertical gastroplasty- long-term results and

References
65
complications. Obes Surg. 2000;10:250-254.
113. Choi Y, Frizzi J, Foley A, Harkabus M. Patient satisfaction and results of vertical banded gastroplasty and gastric bypass. Obes Surg. 1999;9:33-35.
114. Papakonstantinou A, Alfaras P, Komessidou V, Hadjiyannakis E. Gastrointestinal complications after vertical banded gastroplasty. Obes Surg. 1998;8:215-217.
115. Baltasar A, Bou R, Arlandis F, et al. Vertical banded gastroplasty at more than 5 years. Obes Surg. 1998;8:29-34.
116. Stoner J, Stoner P, Sytsma J. 42-month preliminary follow-up of the silastic ring vertical banded gastroplasty. Obes Surg. 1997;7:513-515.
117. Yashkov YI, Timoshin AD, Oppel TA. Vertical banded gastroplasty: first experience in Russia. Obes Surg. 1997;7:317-320; discussion 321.
118. Goulding ST, Hovell BC. Anaesthetic experience of vertical banded gastroplasty. Br J Anaesth. 1995;75:301-306.
119. Lundell L, Ruth M, Olbe L. Vertical banded gastroplasty or gastric banding for morbid obesity: effects on gastro-oesophageal reflux. Eur J Surg. 1997;163:525-531.
120. Schauer PR, Ikramuddin S, Gourash W, Ramanathan R, Luketich J. Outcomes after laparoscopic Roux-en-Y gastric bypass for morbid obesity. Ann Surg. 2000;232:515-529.
121. Nguyen NT, Ho HS, Palmer LS, Wolfe BM. A comparison study of laparoscopic versus open gastric bypass for morbid obesity. J Am Coll Surg. 2000;191:149-155; discussion 155-157.
122. Choban PS, Onyejekwe J, Burge JC, Flancbaum L. A health status assessment of the impact of weight loss following Roux-en-Y gastric bypass for clinically severe obesity. J Am Coll Surg. 1999;188:491-497.
123. Jones KB. Roux-en-Y gastric bypass: an effective antireflux procedure in the less than morbidly obese. Obes Surg. 1998;8:35-38.
124. Crampton NA, Izvornikov V, Stubbs RS. Silastic ring gastric bypass: results in 64 patients. Obes Surg. 1997;7:489-494.
125. Freeman JB, Kotlarewsky M, Phoenix C. Weight loss after extended gastric bypass. Obes Surg. 1997;7:337-344.
126. Oh CH, Kim HJ, Oh S. Weight loss following transected gastric bypass with proximal Roux-en-Y. Obes Surg. 1997;7:142-147; discussion 148.
127. Abu-Abeid S, Szold A. Laparoscopic management of Lap-Band erosion. Obes Surg. 2001;11:87-89.
128. Nowara HA. Egyptian experience in laparoscopic adjustable gastric banding (technique, complications and intermediate results). Obes Surg. 2001;11:70-75.
129. De Luca M, de Werra C, Formato A, et al. Laparotomic vs laparoscopic lap-band: 4-year results with early and intermediate complications. Obes Surg. 2000;10:266-268.
130. Suter M, Bettschart V, Giusti V, Heraief E, Jayet A. A 3-year experience with laparoscopic gastric

References
66
banding for obesity. Surg Endosc. 2000;14:532-536.
131. Wiesner W, Schob O, Hauser RS, Hauser M. Adjustable laparoscopic gastric banding in patients with morbid obesity: radiographic management, results, and postoperative complications. Radiology. 2000;216:389-394.
132. Holeczy P, Novak P, Kralova A. Complications in the first year of laparoscopic gastric banding: is it acceptable? Obes Surg. 1999;9:453-455.
133. Dargent J. Laparoscopic adjustable gastric banding: lessons from the first 500 patients in a single institution. Obes Surg. 1999;9:446-452.
134. Suter M, Giusti V, Heraief E, Jayet C, Jayet A. Early results of laparoscopic gastric banding compared with open vertical banded gastroplasty. Obes Surg. 1999;9:374-380.
135. Abu-Abeid S, Szold A. Results and complications of laparoscopic adjustable gastric banding: an early and intermediate experience. Obes Surg. 1999;9:188-190.
136. Miller K, Hell E. Laparoscopic adjustable gastric banding: a prospective 4-year follow-up study. Obes Surg. 1999;9:183-187.
137. Forsell P, Hallerback B, Glise H, Hellers G. Complications following Swedish adjustable gastric banding: a long-term follow-up. Obes Surg. 1999;9:11-16.
138. Doherty C, Maher JW, Heitshusen DS. Prospective investigation of complications, reoperations, and sustained weight loss with an adjustable gastric banding device for treatment of morbid obesity. J Gastrointest Surg. 1998;2:102-108.
139. Forestieri P, Meucci L, De Luca M, Formato A, De Werra C, Chiacchio C. Two years of practice in adjustable silicone gastric banding (LAP-BAND): evaluation of variations of body mass index, percentage ideal body weight and percentage excess body weight. Obes Surg. 1998;8:49-52.
140. Forsell P, Hellers G. The Swedish Adjustable Gastric Banding (SAGB) for morbid obesity: 9 year experience and a 4-year follow-up of patients operated with a new adjustable band. Obes Surg. 1997;7:345-351.
141. Horchner R, Tuinebreijer W. Improvement of physical functioning of morbidly obese patients who have undergone a Lap-Band operation: one-year study. Obes Surg. 1999;9:399-402.
142. Doldi SB, Micheletto G, Lattuada E, Zappa MA, Bona D, Sonvico U. Adjustable gastric banding: 5-year experience. Obes Surg. 2000;10:171-173.

67

Appendix A
68
Appendix A Evidence Tables

69

Appendix A. Evidence Tables
70
Glossaries
Codes for Evidence Table 1
Code or Abbreviation Definition Intervention Mode: Group Group-based Intervention Mode: Individual Individual-based Intervention Intensity: Low <1 encounter/month (first 3 mos) Intervention Intensity: Moderate 1 encounter/month (first 3 mos) Intervention Intensity: High >1 encounter/month (first 3 mos) Trial Type Loss Weight loss Trial Type Main Maintenance of weight loss Intervention Type: D Diet Intervention Type: E Exercise Intervention Type: B Behavioral
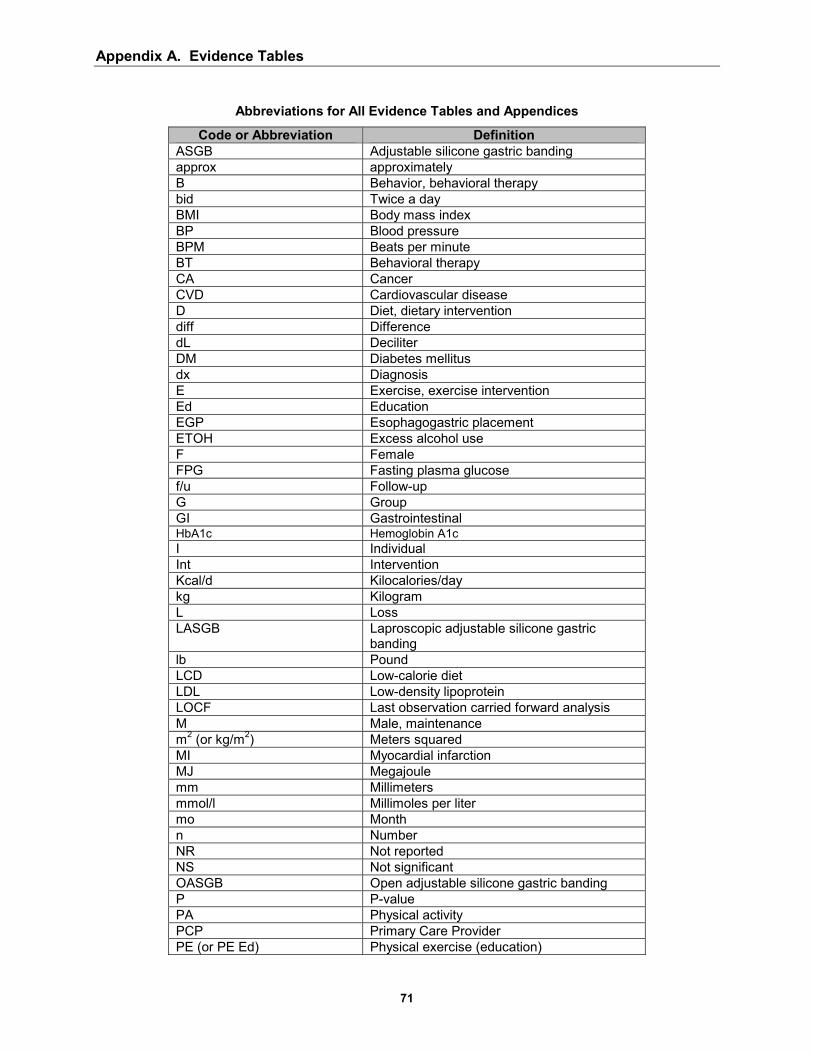
Appendix A. Evidence Tables
71
Abbreviations for All Evidence Tables and Appendices
Code or Abbreviation Definition ASGB Adjustable silicone gastric banding approx approximately B Behavior, behavioral therapy bid Twice a day BMI Body mass index BP Blood pressure BPM Beats per minute BT Behavioral therapy CA Cancer CVD Cardiovascular disease D Diet, dietary intervention diff Difference dL Deciliter DM Diabetes mellitus dx Diagnosis E Exercise, exercise intervention Ed Education EGP Esophagogastric placement ETOH Excess alcohol use F Female FPG Fasting plasma glucose f/u Follow-up G Group GI Gastrointestinal HbA1c Hemoglobin A1c I Individual Int Intervention Kcal/d Kilocalories/day kg Kilogram L Loss LASGB Laproscopic adjustable silicone gastric
banding lb Pound LCD Low-calorie diet LDL Low-density lipoprotein LOCF Last observation carried forward analysis M Male, maintenance m2 (or kg/m2) Meters squared MI Myocardial infarction MJ Megajoule mm Millimeters mmol/l Millimoles per liter mo Month n Number NR Not reported NS Not significant OASGB Open adjustable silicone gastric banding P P-value PA Physical activity PCP Primary Care Provider PE (or PE Ed) Physical exercise (education)

Appendix A. Evidence Tables
72
qd Once a day RGP Retrogastric placement SES Socio-economic status s.e. Standard error Signif Significant tid Three times a day tit Titrate tx Treatment VLCD Very-low-calorie diet vs Versus wk Week w/o Without Wt Weight Yr Year

Appendix A. Evidence Tables
73
Evidence Table 1. Randomized Controlled Trials of Counseling and Behavioral Interventions
Citation
Intervention Mode/
Intensity Trial Type Intervention Type Baseline Weight
Stevens et al, 200169
Group and individual/ high
Loss and main
D/E/B Mean BMI: Men: 31 Women: 31
Kuller et al, 200165
Group and individual/ high
Loss and main
D/E/B Mean BMI: 25
Tuomilehto et al, 200166
Group/ high
Loss D/E/B Mean BMI: 31
Fogelholm et al, 200074
Group/ high
Loss and main
D/E/B Mean BMI: 34
Diabetes Prevention Program, 200079
Group/individual high
Loss and main
D/E/B Mean BMI: 34
Jakicic et al, 199971 Group/ high (diet individualized)
Loss
D/E/B Wt: 20%-75% higher than ideal body wt
Jones et al, 199968 Group and individual/ High
Loss
D/B Mean BMI: 34
Sbrocco et al, 199973
Group/ high
Loss
D/E/B Mean BMI: 33
Wadden et al, 200152
Group/ high
Loss
D/E/B BMI: 36-39

Appendix A. Evidence Tables
74
Evidence Table 1. Randomized Controlled Trials of Counseling and Behavioral Interventions (cont)
Time Interval Delta (Vs Control
Unless Noted) P Value Loss to
Follow-up Quality
Comments 18 mos 36 mos
-2.7 kg -2.0 kg
P ≤ 0.001
8% at 36 mos Good
54 mos -5.4 lb P ≤ 0.001 Overall, 5% loss at 54 mos
Good
1 yr 2 yrs 1 yr
-3.4 kg -2.7 kg -30% with at least 5% wt reduction
P ≤ 0.001 P ≤ 0.001 P = 0.001
8% loss Good
1 yr (12 wks L, 40 wks M) 2 yrs
1st PA program: -2.7 kg 2nd PA program: -2.6 kg 1st PA program: -3.8 kg 2nd PA program: -0.5 kg
P = 0.06 (group diff) P = 0.07 (group diff)
Overall 10% loss Fair
2.8 yrs -2.1 kg (metformin) -5.6 kg (lifestyle) -0.1 kg (placebo)
P ≤ 0.001 Overall 7.5% dropout
Good minorities over-represented
18 mos -3.7 kg (BT and short bouts of PA with (vs w/o) home equipment lost more wt)
P ≤ 0.05 NS difference other PA groups
22% dropout overall (13%-29% each group)
Fair High dropout
6 mos 12, 18, 24, 30 mos
-1.4 kg not reported
P = 0.05 NS
Overall 9% dropout
Fair
12 mos -5.76 kg (behavioral choice tx led to more wt loss than traditional BT)
P ≤ 0.01 17% loss (n = 2) Fair
1 yr 1 yr
-7.3 kg: addition of lifestyle intervention to sibutramine -12.8 kg: addition of lifestyle intervention + diet to sibutramine
P ≤ 0.05 P ≤ 0.05
32% dropout (6/19)
Fair
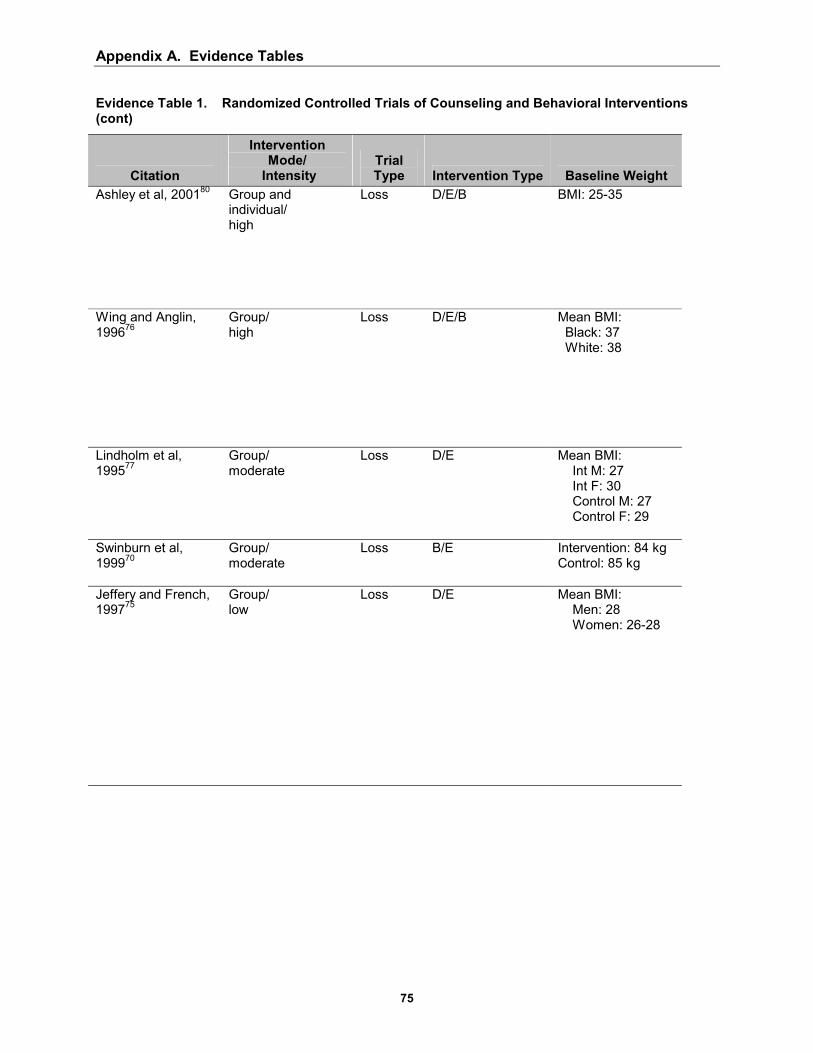
Appendix A. Evidence Tables
75
Evidence Table 1. Randomized Controlled Trials of Counseling and Behavioral Interventions (cont)
Citation
Intervention Mode/
Intensity Trial Type Intervention Type Baseline Weight
Ashley et al, 200180 Group and individual/ high
Loss D/E/B BMI: 25-35
Wing and Anglin, 199676
Group/ high
Loss
D/E/B Mean BMI: Black: 37 White: 38
Lindholm et al, 199577
Group/ moderate
Loss D/E Mean BMI: Int M: 27 Int F: 30 Control M: 27 Control F: 29
Swinburn et al, 199970
Group/ moderate
Loss B/E Intervention: 84 kg Control: 85 kg
Jeffery and French, 199775
Group/ low
Loss D/E Mean BMI: Men: 28 Women: 26-28
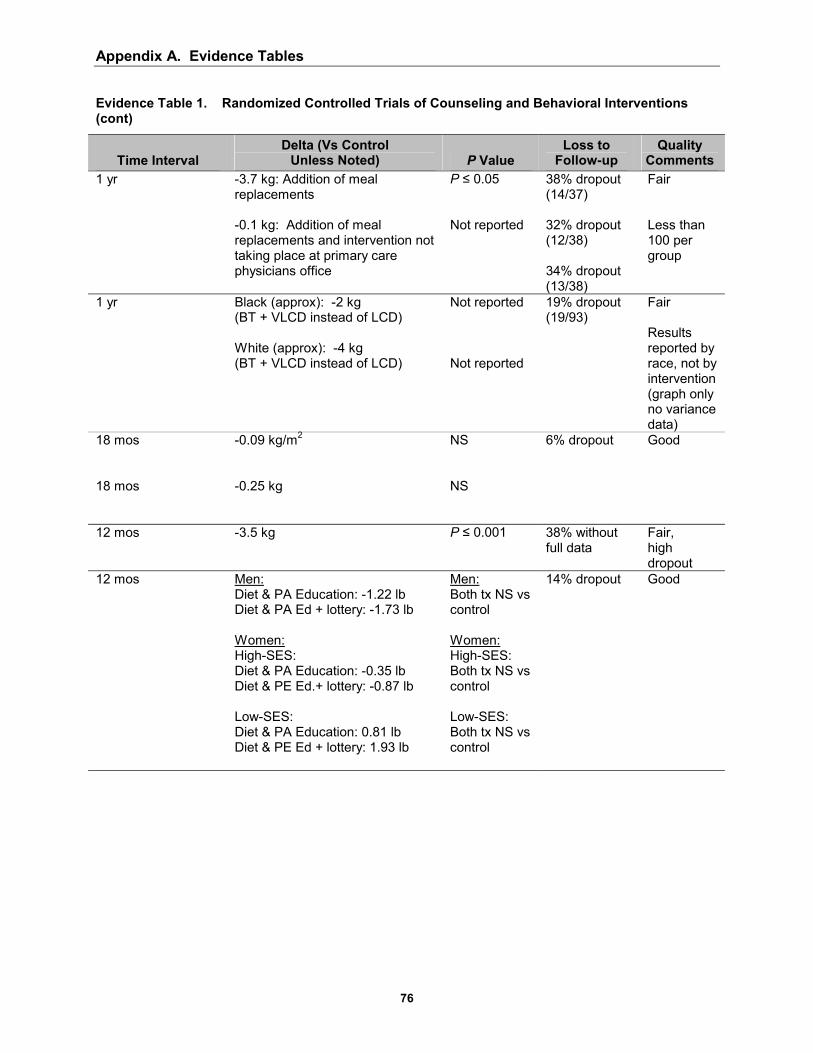
Appendix A. Evidence Tables
76
Evidence Table 1. Randomized Controlled Trials of Counseling and Behavioral Interventions (cont)
Time Interval Delta (Vs Control
Unless Noted) P Value Loss to
Follow-up Quality
Comments 1 yr -3.7 kg: Addition of meal
replacements -0.1 kg: Addition of meal replacements and intervention not taking place at primary care physicians office
P ≤ 0.05 Not reported
38% dropout (14/37) 32% dropout (12/38) 34% dropout (13/38)
Fair Less than 100 per group
1 yr Black (approx): -2 kg (BT + VLCD instead of LCD) White (approx): -4 kg (BT + VLCD instead of LCD)
Not reported Not reported
19% dropout (19/93)
Fair Results reported by race, not by intervention (graph only no variance data)
18 mos 18 mos
-0.09 kg/m2 -0.25 kg
NS NS
6% dropout Good
12 mos -3.5 kg
P ≤ 0.001 38% without full data
Fair, high dropout
12 mos Men: Diet & PA Education: -1.22 lb Diet & PA Ed + lottery: -1.73 lb Women: High-SES: Diet & PA Education: -0.35 lb Diet & PE Ed.+ lottery: -0.87 lb Low-SES: Diet & PA Education: 0.81 lb Diet & PE Ed + lottery: 1.93 lb
Men: Both tx NS vs control Women: High-SES: Both tx NS vs control Low-SES: Both tx NS vs control
14% dropout Good
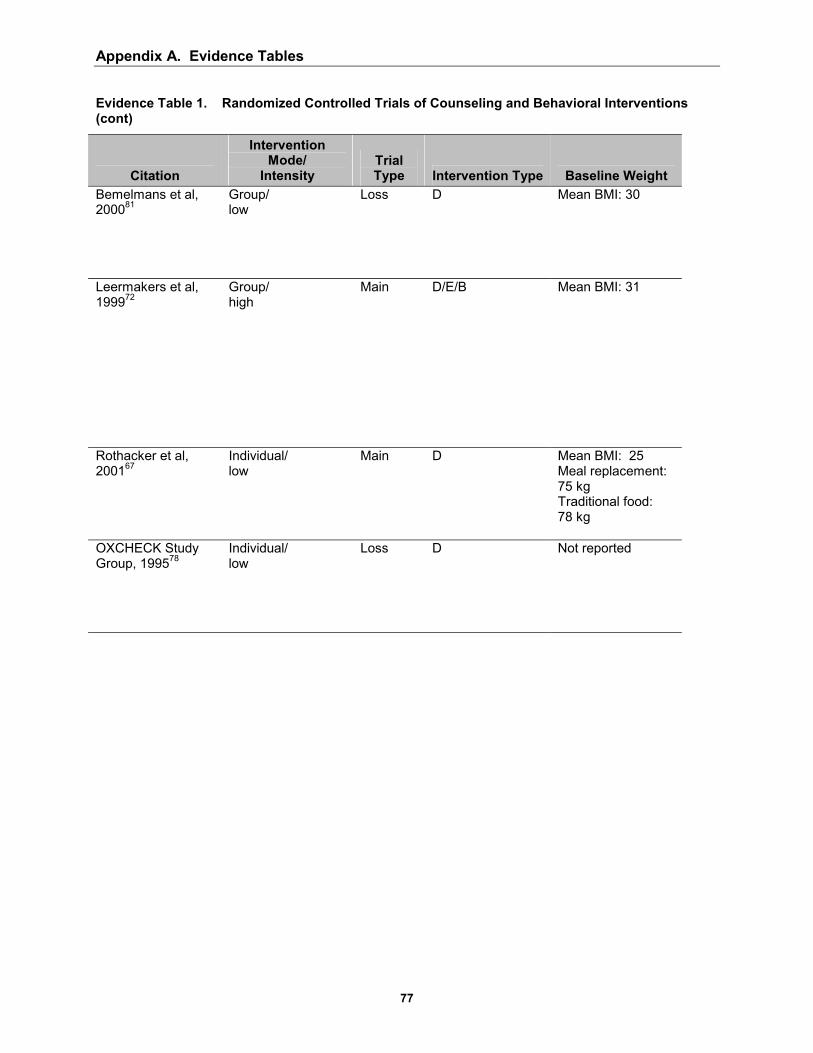
Appendix A. Evidence Tables
77
Evidence Table 1. Randomized Controlled Trials of Counseling and Behavioral Interventions (cont)
Citation
Intervention Mode/
Intensity Trial Type Intervention Type Baseline Weight
Bemelmans et al, 200081
Group/ low
Loss D Mean BMI: 30
Leermakers et al, 199972
Group/ high
Main D/E/B Mean BMI: 31
Rothacker et al, 200167
Individual/ low
Main D Mean BMI: 25 Meal replacement: 75 kg Traditional food: 78 kg
OXCHECK Study Group, 199578
Individual/ low
Loss
D Not reported

Appendix A. Evidence Tables
78
Evidence Table 1. Randomized Controlled Trials of Counseling and Behavioral Interventions (cont)
Time Interval Delta (Vs Control
Unless Noted) P Value Loss to
Follow-up Quality
Comments 52 wks Men: 0.1kg/m2
Women: 0 kg/m2
NS NS
Overall 8% dropout
Fair (but, non-randomized) Netherlands population
18 mos 18 mos
-2.1 kg (less wt regain with wt-focused vs PA-focused program) -36% (extra portion of wt loss maintained with wt-focused vs PA-focused program)
P ≤ 0.05 P ≤ 0.01
15% loss 1st 6 mos 28% did not complete 18 mos
Fair ITT used conservance assumptions that all dropouts returned to their baseline wt
1 yr
-5 kg P ≤ 0.001 17% loss Fair
3 yrs At f/u: those with health checks were 0.38 kg/m2 less than control patients
P ≤ 0.05 25% dropout Fair
*B, behavior; BMI, body mass index; BT, behavioral therapy; D, diet; E, exercise; F, female; f/u, follow-up; Int, Intervention; L, loss; LCD, low-calorie diet; M, maintenance, male; m2, meters squared; NS, not significant; PA, physical activity; PE (or PE Ed), physical exercise (education); SES, socio-economic status; tx, treatment; VLCD, very-low-calorie diet; w/o, without; HbA1C, Hemoglobin A1c.

Appendix A. Evidence Tables
Evidence Table 2. Randomized Controlled Trials of Pharmacotherapy for Weight Loss: Sibutramine
Participants Citation Number, Demographics How Recruited
Intervention Drug, Frequency, Time
Fujioka, et al, 200084
N: 175 Sibutramine: 89 Placebo: 86 Female: Sibutramine: 38 Placebo: 44 Male: Sibutramine: 51 Placebo: 42 Age: Sibutramine: 53.5 yrs Placebo: 55 yrs BMI: Sibutramine: 34.1 (mean) Placebo: 33.8 (mean)
Multi-center (16 centers in U.S.) Recruitment method: unspecified Included: Age: ≥ 18 BMI: ≥ 27-40 At least 1 unsuccessful attempt to lose wt by dieting Diabetes, with stable treatment by diet or a single oral agent Excluded: Patients with: serious cardiovascular disease, metabolic disease, history of drug or alcohol abuse, in need of anti-depressant agents Patients receiving medications to influence body wt
Sibutramine: tit up to 20 qd placebo 24 wks Co-interventions: 250-500 kcal/d caloric deficit diet Individual dietary counseling Interval clinical assessments and measurements of FPG performed
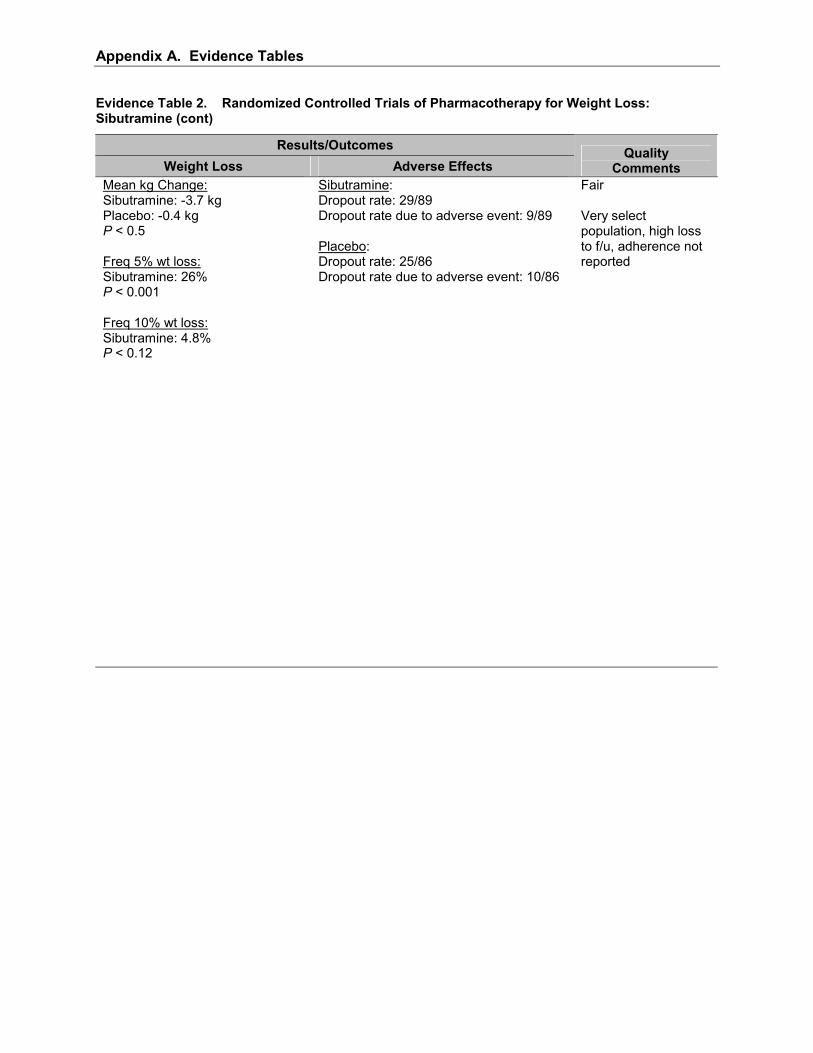
Appendix A. Evidence Tables
Evidence Table 2. Randomized Controlled Trials of Pharmacotherapy for Weight Loss: Sibutramine (cont)
Results/Outcomes Weight Loss Adverse Effects
Quality Comments
Mean kg Change: Sibutramine: -3.7 kg Placebo: -0.4 kg P < 0.5 Freq 5% wt loss: Sibutramine: 26% P < 0.001 Freq 10% wt loss: Sibutramine: 4.8% P < 0.12
Sibutramine: Dropout rate: 29/89 Dropout rate due to adverse event: 9/89 Placebo: Dropout rate: 25/86 Dropout rate due to adverse event: 10/86
Fair Very select population, high loss to f/u, adherence not reported
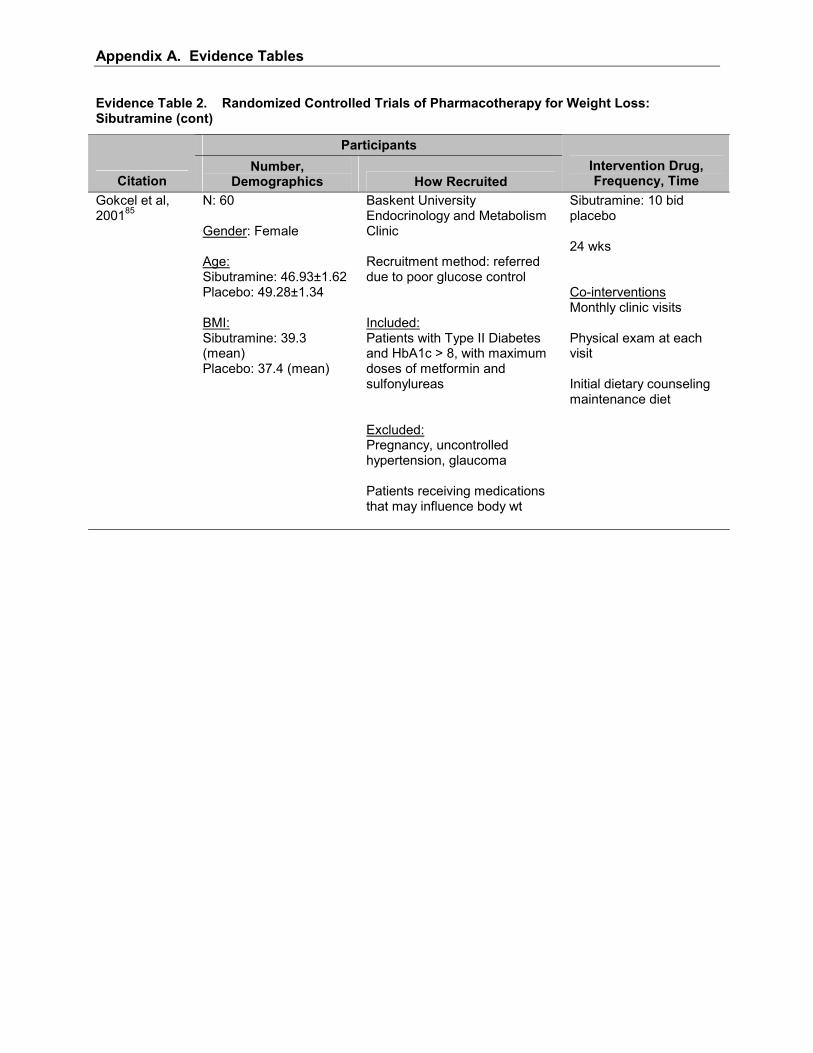
Appendix A. Evidence Tables
Evidence Table 2. Randomized Controlled Trials of Pharmacotherapy for Weight Loss: Sibutramine (cont)
Participants
Citation Number,
Demographics How Recruited Intervention Drug, Frequency, Time
Gokcel et al, 200185
N: 60 Gender: Female Age: Sibutramine: 46.93±1.62 Placebo: 49.28±1.34 BMI: Sibutramine: 39.3 (mean) Placebo: 37.4 (mean)
Baskent University Endocrinology and Metabolism Clinic Recruitment method: referred due to poor glucose control Included: Patients with Type II Diabetes and HbA1c > 8, with maximum doses of metformin and sulfonylureas Excluded: Pregnancy, uncontrolled hypertension, glaucoma Patients receiving medications that may influence body wt
Sibutramine: 10 bid placebo 24 wks Co-interventions Monthly clinic visits Physical exam at each visit Initial dietary counseling maintenance diet

Appendix A. Evidence Tables
Evidence Table 2. Randomized Controlled Trials of Pharmacotherapy for Weight Loss: Sibutramine (cont)
Results/Outcomes Weight Loss Adverse Effects
Quality Comments
Mean kg change: Sibutramine: -3.9 kg Placebo: 0.36 kg P < 0.0001
Sibutramine: Dropout rate: 1/30 Dropout rate due to adverse event: 1/30 Placebo: Dropout rate: 5/30 Dropout due to adverse event: not reported
Fair Group change only Incomplete side-effect or adherence information Small study set in Turkey
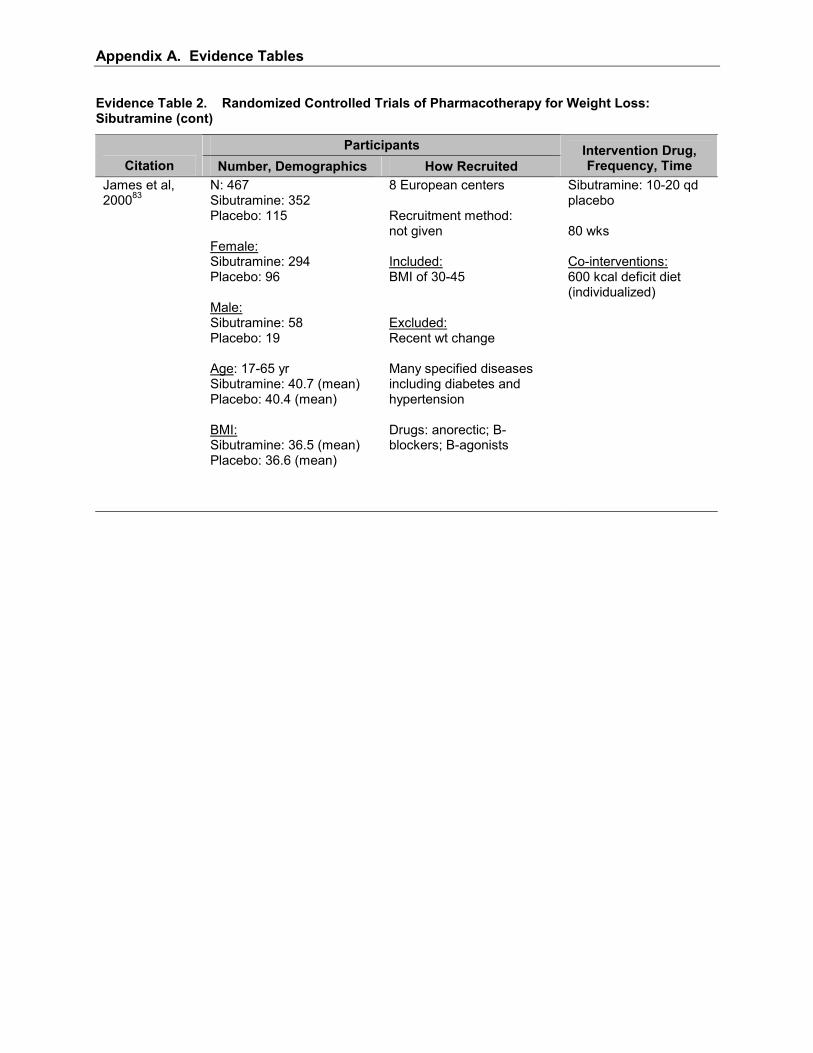
Appendix A. Evidence Tables
Evidence Table 2. Randomized Controlled Trials of Pharmacotherapy for Weight Loss: Sibutramine (cont)
Participants Citation Number, Demographics How Recruited
Intervention Drug, Frequency, Time
James et al, 200083
N: 467 Sibutramine: 352 Placebo: 115 Female: Sibutramine: 294 Placebo: 96 Male: Sibutramine: 58 Placebo: 19 Age: 17-65 yr Sibutramine: 40.7 (mean) Placebo: 40.4 (mean) BMI: Sibutramine: 36.5 (mean) Placebo: 36.6 (mean)
8 European centers Recruitment method: not given Included: BMI of 30-45 Excluded: Recent wt change Many specified diseases including diabetes and hypertension Drugs: anorectic; B-blockers; B-agonists
Sibutramine: 10-20 qd placebo 80 wks Co-interventions: 600 kcal deficit diet (individualized)
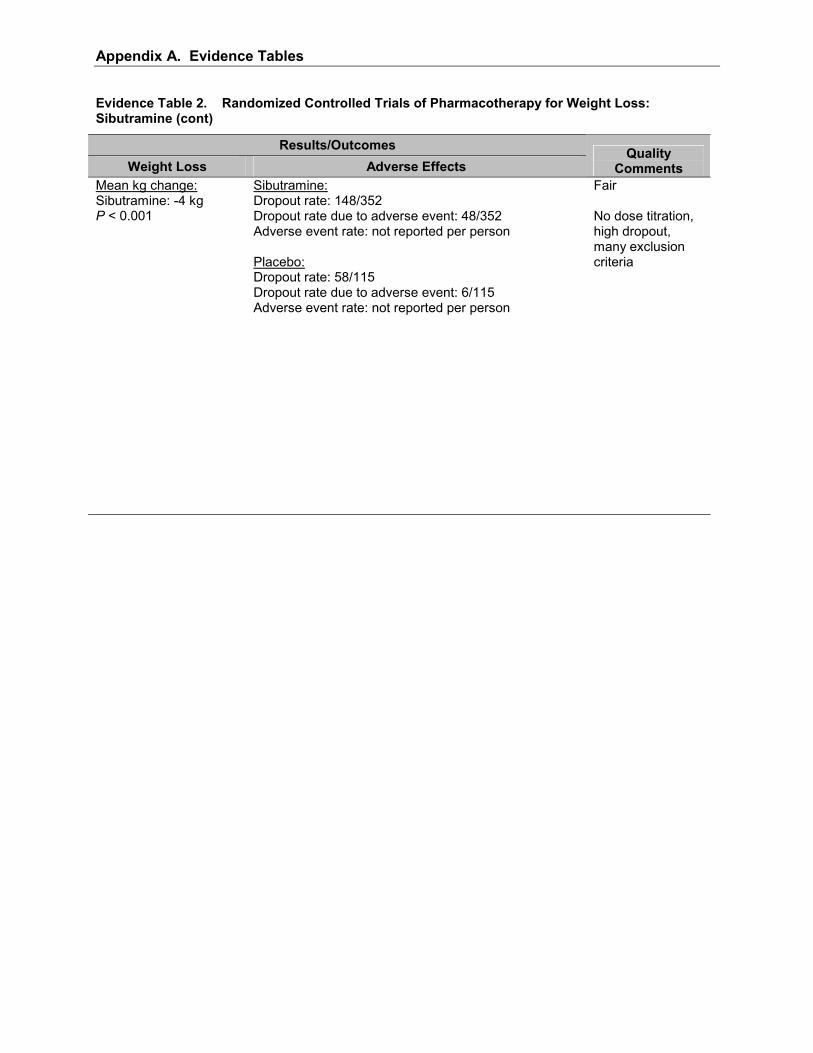
Appendix A. Evidence Tables
Evidence Table 2. Randomized Controlled Trials of Pharmacotherapy for Weight Loss: Sibutramine (cont)
Results/Outcomes Weight Loss Adverse Effects
Quality Comments
Mean kg change: Sibutramine: -4 kg P < 0.001
Sibutramine: Dropout rate: 148/352 Dropout rate due to adverse event: 48/352 Adverse event rate: not reported per person Placebo: Dropout rate: 58/115 Dropout rate due to adverse event: 6/115 Adverse event rate: not reported per person
Fair No dose titration, high dropout, many exclusion criteria

Appendix A. Evidence Tables
Evidence Table 2. Randomized Controlled Trials of Pharmacotherapy for Weight Loss: Sibutramine (cont)
Participants Citation Number, Demographics How Recruited
Intervention Drug, Frequency, Time
Smith and Goulder, 200186
N: 485 Female: Sibutramine 10 mg: 128 Sibutramine 15 mg: 131 Placebo: 131 Male: Sibutramine 10 mg: 33 Sibutramine 15 mg: 30 Placebo: 32 Age: 18-65 yr Sibutramine 10 mg: 41.0 (mean) Sibutramine 15 mg: 42.7 (mean) Placebo: 41.9 (mean) BMI: Sibutramine 10 mg: 32.9 (mean) Sibutramine 15 mg: 32.7 (mean) Placebo: 32.4 (mean)
Primary care setting Recruitment Method: via PCPs Included: Healthy people Age 18-65 BMI of 25-44 Excluded: Wt loss ≥ 3 kg last 3 mos Obesity of endocrine origin Diabetes mellitus Vital sign Abnormalities Patients receiving drugs altering body wt Inability to follow dietary advice
Sibutramine: 10 qd Sibutramine: 15 qd lacebo 52 wks Co-interventions: Dietary advice

Appendix A. Evidence Tables
Evidence Table 2. Randomized Controlled Trials of Pharmacotherapy for Weight Loss: Sibutramine (cont)
Results/Outcomes Weight Loss Adverse Effects
Quality Comments
Mean kg change: Sibutramine: 10 qd: -4.4 kg Placebo: -1.6 kg Sibutramine: 15 qd: -6.4 kg Placebo: -1.6 kg P < 0.01 Freq 5% wt loss: Sibutramine 10 qd: 19% Sibutramine 15 qd: 37% P < 0.01 Freq 10% wt loss: Sibutramine 10 qd: 12% Sibutramine 15 qd: 27% P < 0.01
Sibutramine 10 mg: Dropout rate: 67/161 Dropout rate due to adverse event: 2/161 Adverse event rate: 20/161 Sibutramine 15 mg: Dropout rate: 79/161 Dropout rate due to adverse event: 2/161 Adverse event rate: 18/161 Placebo: Dropout rate: 83/163 Dropout rate due to adverse event: 4/163 Adverse event rate: 24/163
Fair Very high attrition, generally healthy group, LOCF
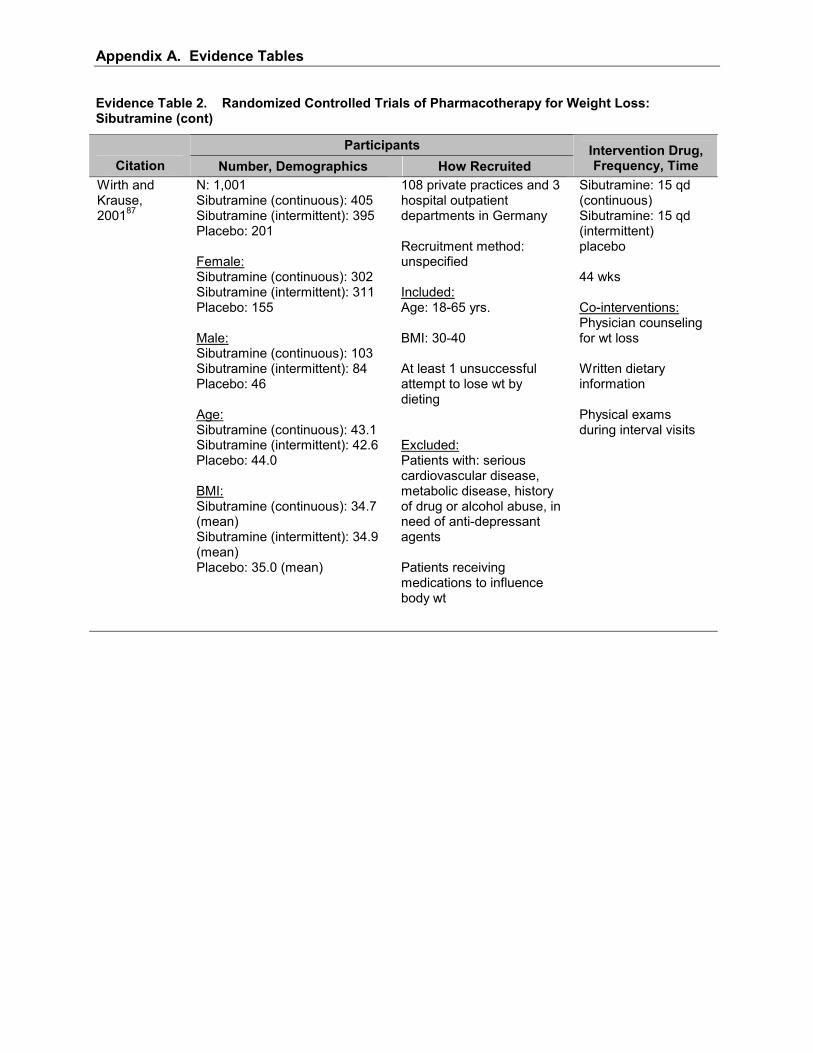
Appendix A. Evidence Tables
Evidence Table 2. Randomized Controlled Trials of Pharmacotherapy for Weight Loss: Sibutramine (cont)
Participants Citation Number, Demographics How Recruited
Intervention Drug, Frequency, Time
Wirth and Krause, 200187
N: 1,001 Sibutramine (continuous): 405 Sibutramine (intermittent): 395 Placebo: 201 Female: Sibutramine (continuous): 302 Sibutramine (intermittent): 311 Placebo: 155 Male: Sibutramine (continuous): 103 Sibutramine (intermittent): 84 Placebo: 46 Age: Sibutramine (continuous): 43.1 Sibutramine (intermittent): 42.6 Placebo: 44.0 BMI: Sibutramine (continuous): 34.7 (mean) Sibutramine (intermittent): 34.9 (mean) Placebo: 35.0 (mean)
108 private practices and 3 hospital outpatient departments in Germany Recruitment method: unspecified Included: Age: 18-65 yrs. BMI: 30-40 At least 1 unsuccessful attempt to lose wt by dieting Excluded: Patients with: serious cardiovascular disease, metabolic disease, history of drug or alcohol abuse, in need of anti-depressant agents Patients receiving medications to influence body wt
Sibutramine: 15 qd (continuous) Sibutramine: 15 qd (intermittent) placebo 44 wks Co-interventions: Physician counseling for wt loss Written dietary information Physical exams during interval visits
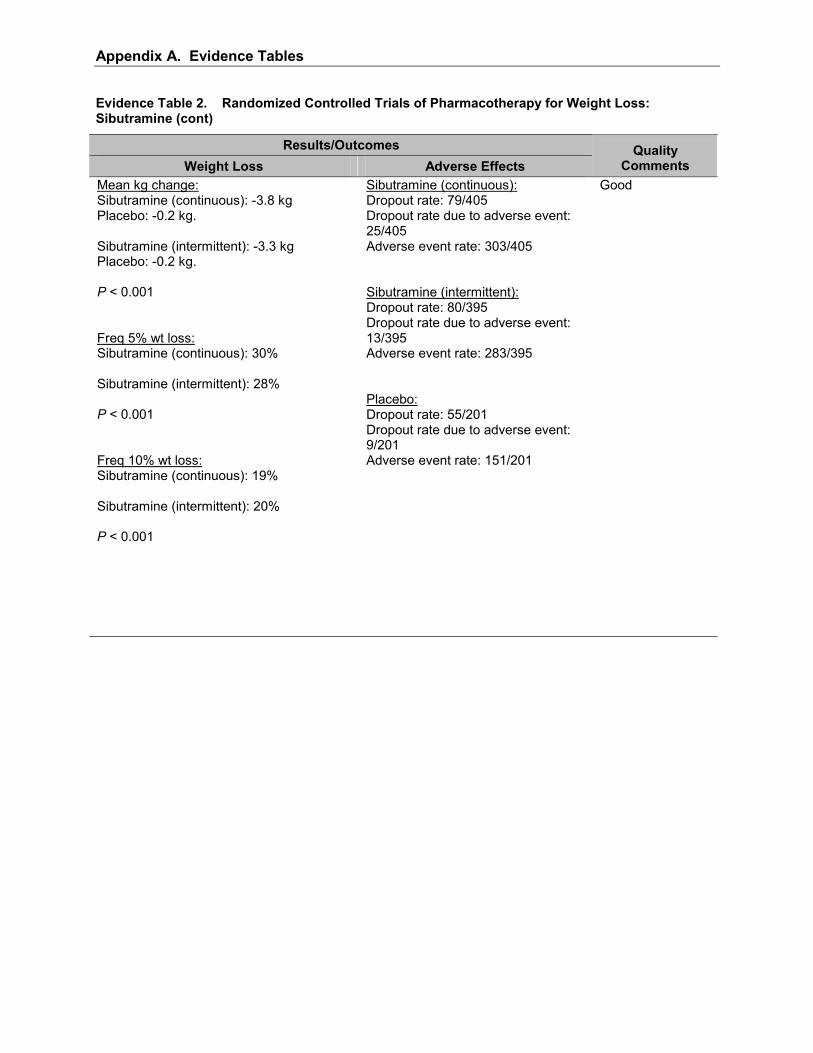
Appendix A. Evidence Tables
Evidence Table 2. Randomized Controlled Trials of Pharmacotherapy for Weight Loss: Sibutramine (cont)
Results/Outcomes Weight Loss Adverse Effects
Quality Comments
Mean kg change: Sibutramine (continuous): -3.8 kg Placebo: -0.2 kg. Sibutramine (intermittent): -3.3 kg Placebo: -0.2 kg. P < 0.001 Freq 5% wt loss: Sibutramine (continuous): 30% Sibutramine (intermittent): 28% P < 0.001 Freq 10% wt loss: Sibutramine (continuous): 19% Sibutramine (intermittent): 20% P < 0.001
Sibutramine (continuous): Dropout rate: 79/405 Dropout rate due to adverse event: 25/405 Adverse event rate: 303/405 Sibutramine (intermittent): Dropout rate: 80/395 Dropout rate due to adverse event: 13/395 Adverse event rate: 283/395 Placebo: Dropout rate: 55/201 Dropout rate due to adverse event: 9/201 Adverse event rate: 151/201
Good
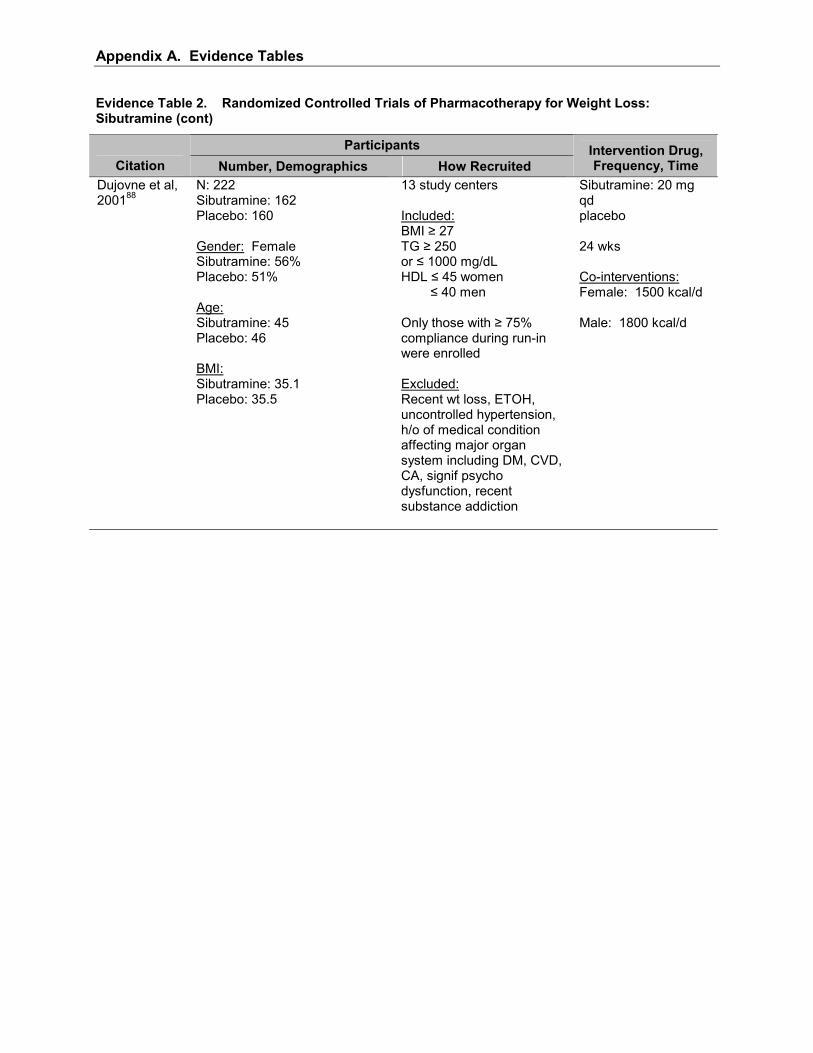
Appendix A. Evidence Tables
Evidence Table 2. Randomized Controlled Trials of Pharmacotherapy for Weight Loss: Sibutramine (cont)
Participants Citation Number, Demographics How Recruited
Intervention Drug, Frequency, Time
Dujovne et al, 200188
N: 222 Sibutramine: 162 Placebo: 160 Gender: Female Sibutramine: 56% Placebo: 51% Age: Sibutramine: 45 Placebo: 46 BMI: Sibutramine: 35.1 Placebo: 35.5
13 study centers Included: BMI ≥ 27 TG ≥ 250 or ≤ 1000 mg/dL HDL ≤ 45 women ≤ 40 men Only those with ≥ 75% compliance during run-in were enrolled Excluded: Recent wt loss, ETOH, uncontrolled hypertension, h/o of medical condition affecting major organ system including DM, CVD, CA, signif psycho dysfunction, recent substance addiction
Sibutramine: 20 mg qd placebo 24 wks Co-interventions: Female: 1500 kcal/d Male: 1800 kcal/d

Appendix A. Evidence Tables
Evidence Table 2. Randomized Controlled Trials of Pharmacotherapy for Weight Loss: Sibutramine (cont)
Results/Outcomes Weight Loss Adverse Effects
Quality Comments
Mean kg change: Sibutramine: -4.9 Placebo: -0.6 P ≤ 0.05 BMI change: Sibutramine: -1.7 Placebo: -0.2 P = not reported Freq 5% wt loss: Sibutramine: 42% Placebo: 8% P ≤ 0.05 Freq 10% wt loss: Sibutramine: 12% Placebo: 3% P ≤ 0.05
Sibutramine Dropout rate: 29.6% Dropout rate due to adverse event: 9.9% Dropout rate for hypertension: 0.6% Change in systolic blood pressure: +4 mm Change in diastolic blood pressure: 3.6 mm Change in pulse: +6.8 bpm Placebo: Dropout rate: 33.8% Dropout rate due to adverse event: 6.9% Dropout rate for hypertension: 1.9% Change in systolic blood pressure: +2 mm (NS different vs drug arm) Change in diastolic blood pressure: +1.0 mm (P < 0.05 vs drug arm) Change in pulse: +0.1 bpm (P < 0.05 vs drug arm)
Fair LOCF 30% dropout
*BMI, body mass index; bid, twice a day; bpm, beats per minute; CA, cancer; CVD, cardiovascular disease; dL, deciliter; DM, diabetes mellitus; ETOH, excess alcohol use; FPG, fasting plasma glucose; f/u, follow-up; HbA1c, Hemoglobin A1c; h/o, history of; Kcal/d, kilocalories/day; LOCF, Last observation carried forward analysis; mm, millimeters; N, number; PCP, primary care provider; qd, once a day; signif, significant; tit, titrate.
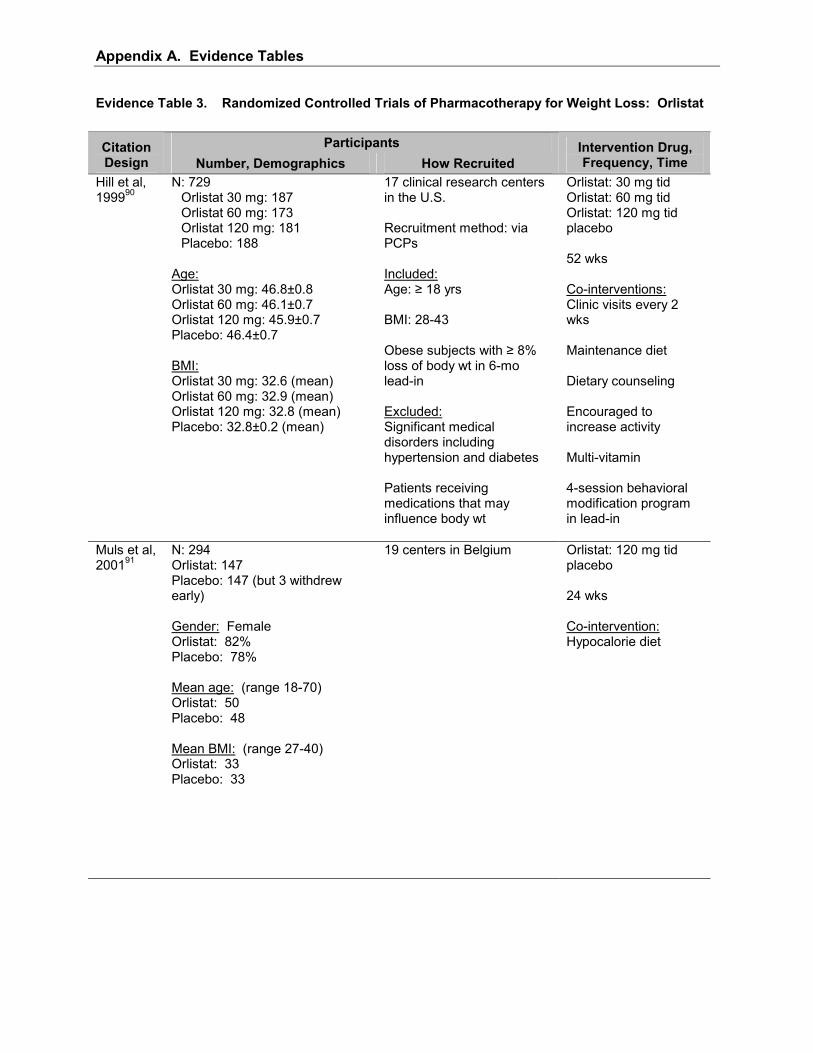
Appendix A. Evidence Tables
Evidence Table 3. Randomized Controlled Trials of Pharmacotherapy for Weight Loss: Orlistat
Participants Citation Design Number, Demographics How Recruited
Intervention Drug, Frequency, Time
Hill et al, 199990
N: 729 Orlistat 30 mg: 187 Orlistat 60 mg: 173 Orlistat 120 mg: 181 Placebo: 188
Age: Orlistat 30 mg: 46.8±0.8 Orlistat 60 mg: 46.1±0.7 Orlistat 120 mg: 45.9±0.7 Placebo: 46.4±0.7 BMI: Orlistat 30 mg: 32.6 (mean) Orlistat 60 mg: 32.9 (mean) Orlistat 120 mg: 32.8 (mean) Placebo: 32.8±0.2 (mean)
17 clinical research centers in the U.S. Recruitment method: via PCPs Included: Age: ≥ 18 yrs BMI: 28-43 Obese subjects with ≥ 8% loss of body wt in 6-mo lead-in Excluded: Significant medical disorders including hypertension and diabetes Patients receiving medications that may influence body wt
Orlistat: 30 mg tid Orlistat: 60 mg tid Orlistat: 120 mg tid placebo 52 wks Co-interventions: Clinic visits every 2 wks Maintenance diet Dietary counseling Encouraged to increase activity Multi-vitamin 4-session behavioral modification program in lead-in
Muls et al, 200191
N: 294 Orlistat: 147 Placebo: 147 (but 3 withdrew early) Gender: Female Orlistat: 82% Placebo: 78% Mean age: (range 18-70) Orlistat: 50 Placebo: 48 Mean BMI: (range 27-40) Orlistat: 33 Placebo: 33
19 centers in Belgium Orlistat: 120 mg tid placebo 24 wks Co-intervention: Hypocalorie diet
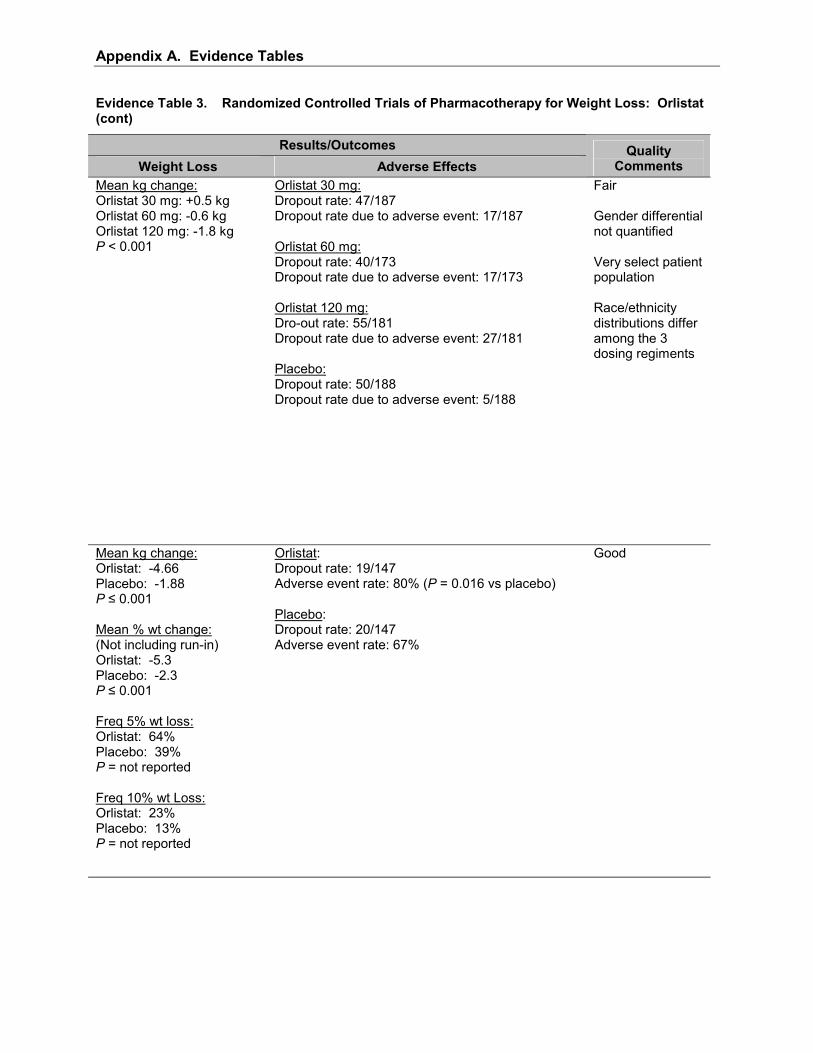
Appendix A. Evidence Tables
Evidence Table 3. Randomized Controlled Trials of Pharmacotherapy for Weight Loss: Orlistat (cont)
Results/Outcomes Weight Loss Adverse Effects
Quality Comments
Mean kg change: Orlistat 30 mg: +0.5 kg Orlistat 60 mg: -0.6 kg Orlistat 120 mg: -1.8 kg P < 0.001
Orlistat 30 mg: Dropout rate: 47/187 Dropout rate due to adverse event: 17/187 Orlistat 60 mg: Dropout rate: 40/173 Dropout rate due to adverse event: 17/173 Orlistat 120 mg: Dro-out rate: 55/181 Dropout rate due to adverse event: 27/181 Placebo: Dropout rate: 50/188 Dropout rate due to adverse event: 5/188
Fair Gender differential not quantified Very select patient population Race/ethnicity distributions differ among the 3 dosing regiments
Mean kg change: Orlistat: -4.66 Placebo: -1.88 P ≤ 0.001 Mean % wt change: (Not including run-in) Orlistat: -5.3 Placebo: -2.3 P ≤ 0.001 Freq 5% wt loss: Orlistat: 64% Placebo: 39% P = not reported Freq 10% wt Loss: Orlistat: 23% Placebo: 13% P = not reported
Orlistat: Dropout rate: 19/147 Adverse event rate: 80% (P = 0.016 vs placebo) Placebo: Dropout rate: 20/147 Adverse event rate: 67%
Good
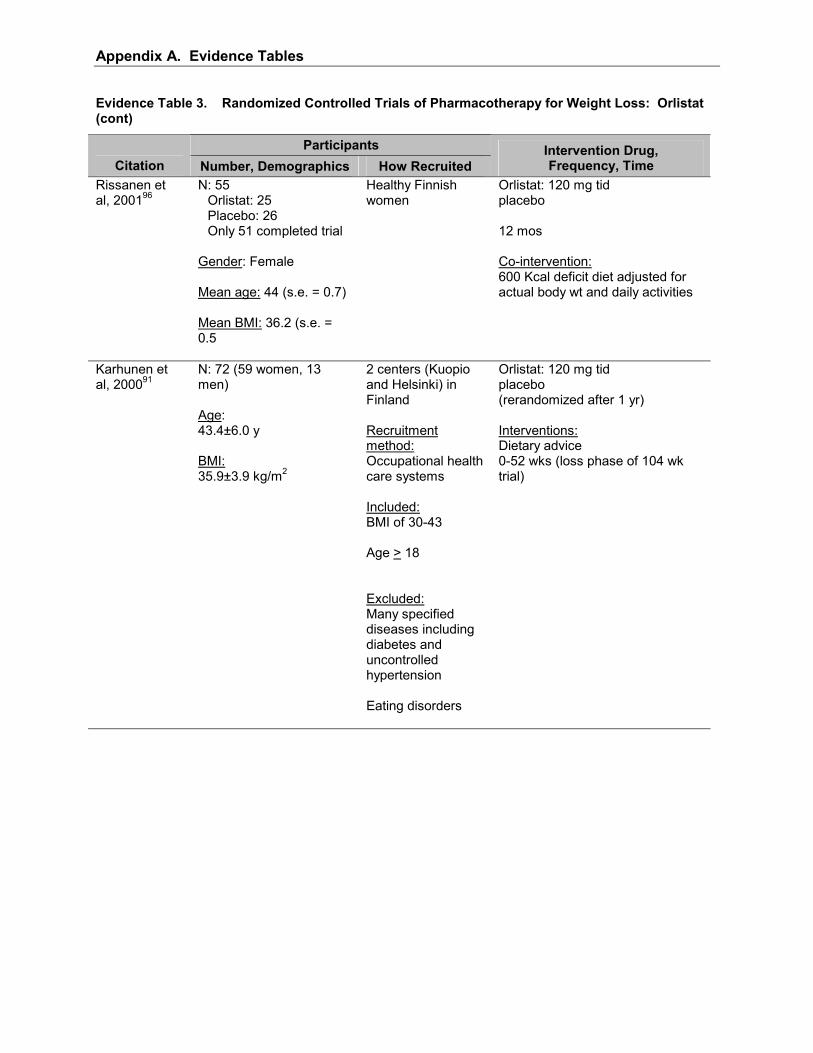
Appendix A. Evidence Tables
Evidence Table 3. Randomized Controlled Trials of Pharmacotherapy for Weight Loss: Orlistat (cont)
Participants Citation Number, Demographics How Recruited
Intervention Drug, Frequency, Time
Rissanen et al, 200196
N: 55 Orlistat: 25 Placebo: 26 Only 51 completed trial
Gender: Female Mean age: 44 (s.e. = 0.7) Mean BMI: 36.2 (s.e. = 0.5
Healthy Finnish women
Orlistat: 120 mg tid placebo 12 mos Co-intervention: 600 Kcal deficit diet adjusted for actual body wt and daily activities
Karhunen et al, 200091
N: 72 (59 women, 13 men) Age: 43.4±6.0 y BMI: 35.9±3.9 kg/m2
2 centers (Kuopio and Helsinki) in Finland Recruitment method: Occupational health care systems Included: BMI of 30-43 Age > 18 Excluded: Many specified diseases including diabetes and uncontrolled hypertension Eating disorders
Orlistat: 120 mg tid placebo (rerandomized after 1 yr) Interventions: Dietary advice 0-52 wks (loss phase of 104 wk trial)

Appendix A. Evidence Tables
Evidence Table 3. Randomized Controlled Trials of Pharmacotherapy for Weight Loss: Orlistat (cont)
Results/Outcomes Weight Loss, BP, Lipids Adverse Effects
Quality Comments
Mean kg change: Orlistat: -13 Placebo: -7.2 P = NS
Dropout rate: 4/55 Dropout and adverse event rates not reported by intervention status
Fair
Mean kg change: Orlistat: -13.1 kg Placebo: -8.6 kg P = 0.007
No data
Fair Group change only No data on adverse effects No gender-breakdown by group
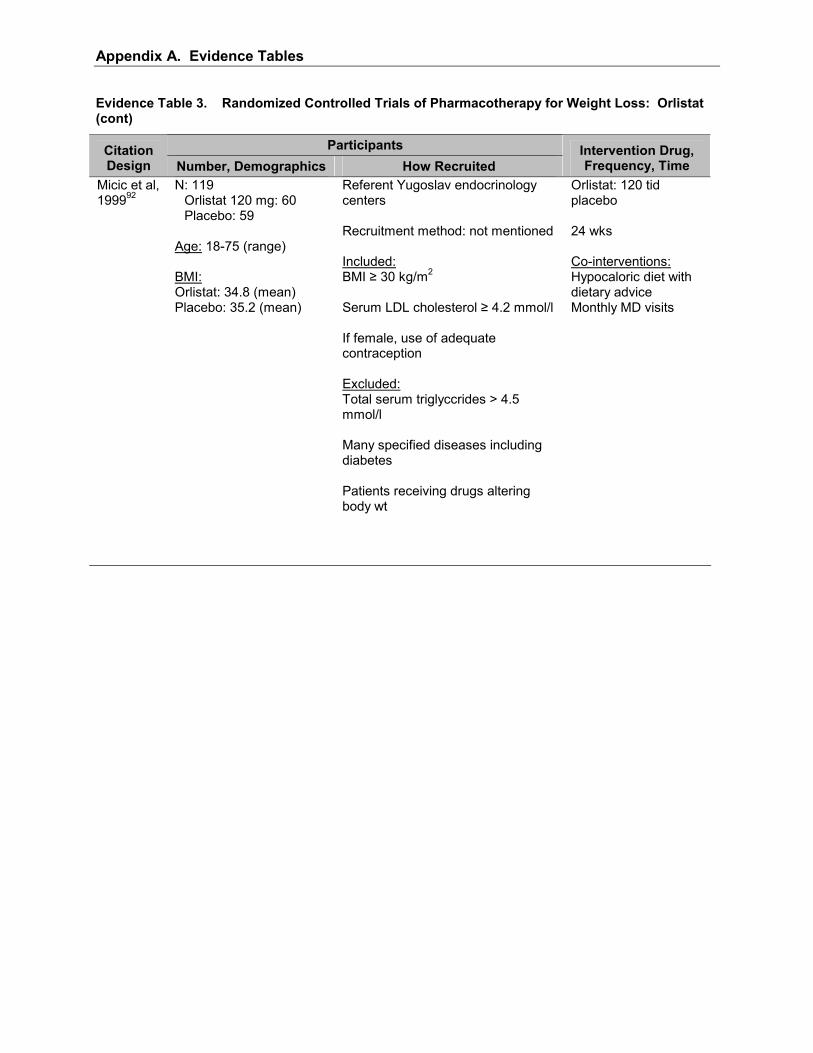
Appendix A. Evidence Tables
Evidence Table 3. Randomized Controlled Trials of Pharmacotherapy for Weight Loss: Orlistat (cont)
Participants Citation Design Number, Demographics How Recruited
Intervention Drug, Frequency, Time
Micic et al, 199992
N: 119 Orlistat 120 mg: 60 Placebo: 59
Age: 18-75 (range) BMI: Orlistat: 34.8 (mean) Placebo: 35.2 (mean)
Referent Yugoslav endocrinology centers Recruitment method: not mentioned Included: BMI ≥ 30 kg/m2 Serum LDL cholesterol ≥ 4.2 mmol/l If female, use of adequate contraception Excluded: Total serum triglyccrides > 4.5 mmol/l Many specified diseases including diabetes Patients receiving drugs altering body wt
Orlistat: 120 tid placebo 24 wks Co-interventions: Hypocaloric diet with dietary advice Monthly MD visits

Appendix A. Evidence Tables
Evidence Table 3. Randomized Controlled Trials of Pharmacotherapy for Weight Loss: Orlistat (cont)
Results/Outcomes
Weight Loss Adverse Effects Quality
Comments Mean kg change: Orlistat: -10.75 kg Placebo: -7.34 kg P = 0.001
Orlistat: Dropout rate: 10/60 Dropout rate due to adverse event: 1/60 Adverse event rate: 18/60 Placebo: Dropout rate: 10/59 Dropout rate due to adverse event: not reported Adverse event rate: 7/59
Fair Individual-based wt results only in terms of �gain� or �loss� Yugoslavian population Small study
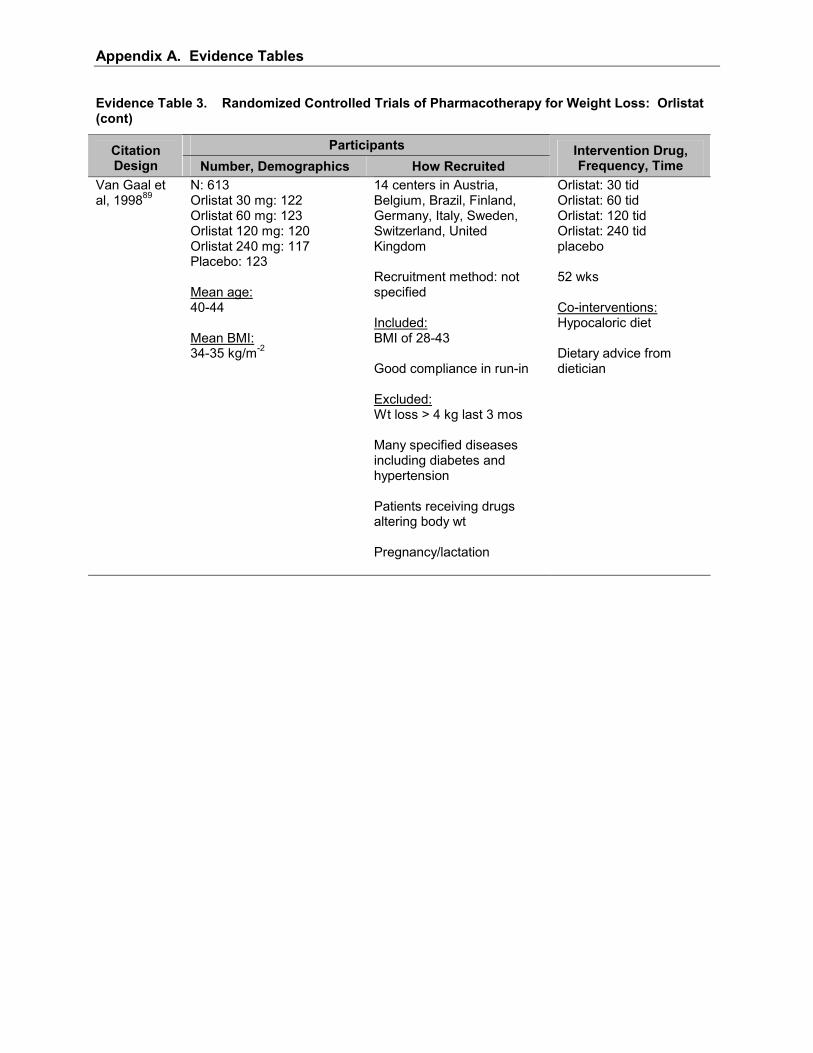
Appendix A. Evidence Tables
Evidence Table 3. Randomized Controlled Trials of Pharmacotherapy for Weight Loss: Orlistat (cont)
Participants Citation Design Number, Demographics How Recruited
Intervention Drug, Frequency, Time
Van Gaal et al, 199889
N: 613 Orlistat 30 mg: 122 Orlistat 60 mg: 123 Orlistat 120 mg: 120 Orlistat 240 mg: 117 Placebo: 123 Mean age: 40-44 Mean BMI: 34-35 kg/m-2
14 centers in Austria, Belgium, Brazil, Finland, Germany, Italy, Sweden, Switzerland, United Kingdom Recruitment method: not specified Included: BMI of 28-43 Good compliance in run-in Excluded: Wt loss > 4 kg last 3 mos Many specified diseases including diabetes and hypertension Patients receiving drugs altering body wt Pregnancy/lactation
Orlistat: 30 tid Orlistat: 60 tid Orlistat: 120 tid Orlistat: 240 tid placebo 52 wks Co-interventions: Hypocaloric diet Dietary advice from dietician

Appendix A. Evidence Tables
Evidence Table 3. Randomized Controlled Trials of Pharmacotherapy for Weight Loss: Orlistat (cont)
Results/Outcomes Weight Loss Adverse Effects
Quality Comments
Mean kg change: Orlistat 30: -2% Orlistat 60: -2.3% Orlistat 120: -3.3% Orlistat 240: -2.8% P ≤ 0.001 Frequency of 10% wt loss: Orlistat 30: 9% Orlistat 60: 9% Orlistat 120: 18% Orlistat 240: 19% P = not reported
Orlistat 30 mg: Dropout rate: 29/122 Dropout rate due to adverse event: 7/122 Adverse event rate: 79% Orlistat 60 mg: Dropout rate: 29/124 Dropout rate due to adverse event: 6/124 Adverse event rate: 83% Orlistat 120 mg: Dropout rate: 23/122 Dropout rate due to adverse event: 2/122 Adverse event rate: 84% Orlistat 240 mg: Dropout rate: 20/120 Dropout rate due to adverse event: 3/120 Adverse event rate: 87% Placebo: Dropout rate: 27/125 Dropout rate due to adverse event 3/125 Adverse event rate: 69%
Fair Multiple countries, adequate outcomes, but very select population, no race data
*BMI, body mass index; BP, blood pressure; Kcal, kilocalories; kg/m2, meters squared; mmol/l, millimoles per liter; N, number; P, P-value; PCP, primary care provider; s.e., standard error; tid, three times daily.

Appendix A. Evidence Tables
Evidence Table 4. Randomized Controlled Trials of Pharmacotherapy for Weight Loss: Metformin
Participants Citation Design
Number, Demographics How Recruited
Intervention Drug, Frequency, Time
Giugliano et al, 199395
N: 50 Metformin: 27 Placebo: 23 Female: Metformin: 17 Placebo: 14 Male: Metformin: 10 Placebo: 9 Age: Metformin: 60 (mean) Placebo: 60.8 (mean) BMI: Metformin: 33 (mean) Placebo: 32.7 (mean)
17 Clinical research centers in the U.S. Recruitment method: not reported Included: DM on insulin, dx after age 40 DM > 3 yrs Inadequate glucose control despite therapy oral > 1 yr Excluded: Age > 70 Creatinine > 1.2 Ischemic or wasting disease Acute severe disease
Metformin: 850 bid placebo 6 mos Co-interventions: Patients seen on outpatient basis 1 mo interval visits Body wt and BP

Appendix A. Evidence Tables
Evidence Table 4. Randomized Controlled Trials of Pharmacotherapy for Weight Loss: Metformin (cont)
Results/Outcomes
Weight Loss Adverse Effects Quality
Comments Data in graph form P = NS
Not reported
Fair/good No information on the population involved BMI results graphed, without actual numbers Small sample size
*bid, twice a day; BP, blood pressure; DM, diabetes mellitus; dx, diagnosis, N, number; NS, not significant; P, P-value.

Appendix A. Evidence Tables
Evidence Table 5. Randomized Controlled Trials of Surgical Therapies for Obesity
Participants Citation Design Number, Demographics How Recruited
Intervention Time, Surgical Procedure
de Wit et al, 199997 Open vs Laparoscopic Adjustable Silicone Gastric Banding (ASGB)
N: 50 Laparoscopic ASGB: 25 Open ASGB: 25 Sex ratio: (M/F) Laparoscopic ASGB: 8/17 Open ASGB: 8/17 Age: 18-55 yrs. Mean BMI: Laparoscopic ASGB: 51 Open ASGB: 50
Recruitment method: Gastroenterology Outpatient Clinic Included: Obesity > 5 yrs with documented prior wt loss attempts BMI > 40 kg/m2 Excluded: Previous gastric surgeries Large hiatal hernias Alcohol abuse Pregnancy Psychiatric disease/treatment Hormonal or genetic obesity-related diseases
18 mos Laparoscopic ASGB Open ASGB
Weiner et al, 200198 Open vs Laparoscopic Adjustable Silicone Gastric Banding (ASGB)
N: 101 RGP: 51 EGP: 50 Sex: (Female/Male) RGP: 42/8 EGP: 44/7 Mean Age: RGP: 35 (18-54) EGP: 35 (19-52) Mean BMI: (kg/m 2) RGP: 50 EGP: 49
Nordwest Hospital, Frankfurt, Germany Included: Patients who underwent a laproscopic ASGB between May 1996 and August 1999 at the Nordwest hospital
18 mos Retrogastric placement Esophagogastric placement
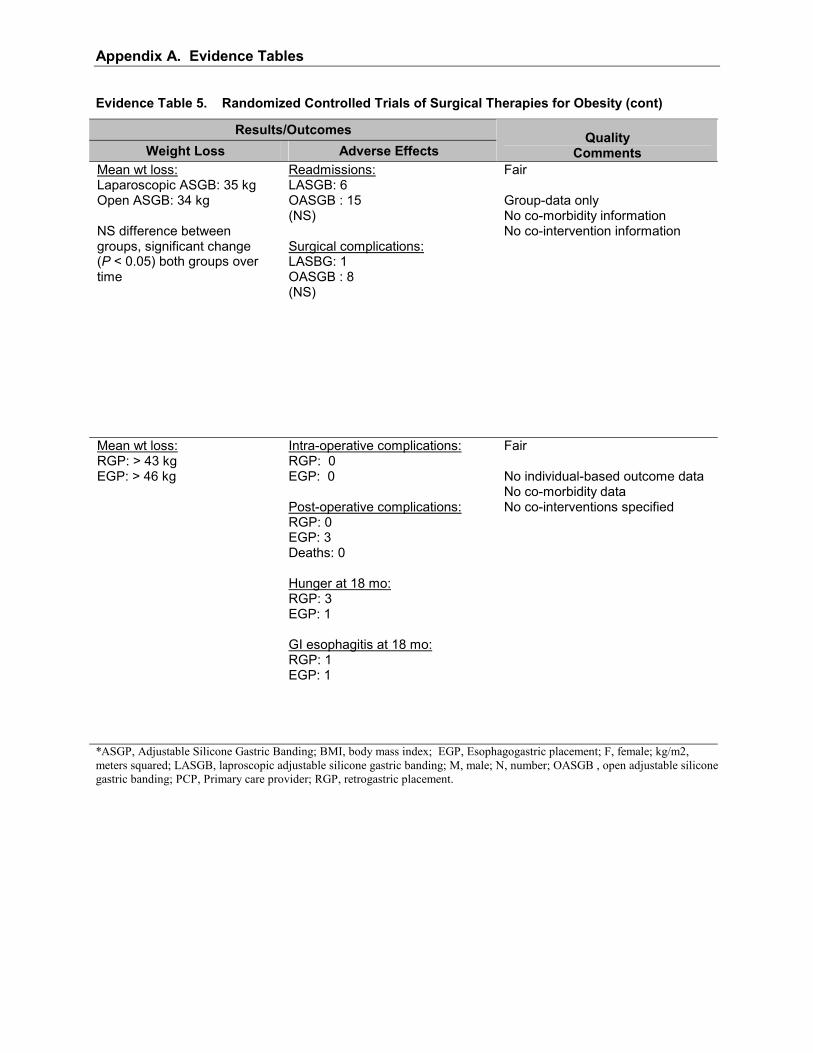
Appendix A. Evidence Tables
Evidence Table 5. Randomized Controlled Trials of Surgical Therapies for Obesity (cont)
Results/Outcomes Weight Loss Adverse Effects
Quality Comments
Mean wt loss: Laparoscopic ASGB: 35 kg Open ASGB: 34 kg NS difference between groups, significant change (P < 0.05) both groups over time
Readmissions: LASGB: 6 OASGB : 15 (NS) Surgical complications: LASBG: 1 OASGB : 8 (NS)
Fair Group-data only No co-morbidity information No co-intervention information
Mean wt loss: RGP: > 43 kg EGP: > 46 kg
Intra-operative complications: RGP: 0 EGP: 0 Post-operative complications: RGP: 0 EGP: 3 Deaths: 0 Hunger at 18 mo: RGP: 3 EGP: 1 GI esophagitis at 18 mo: RGP: 1 EGP: 1
Fair No individual-based outcome data No co-morbidity data No co-interventions specified
*ASGP, Adjustable Silicone Gastric Banding; BMI, body mass index; EGP, Esophagogastric placement; F, female; kg/m2, meters squared; LASGB, laproscopic adjustable silicone gastric banding; M, male; N, number; OASGB , open adjustable silicone gastric banding; PCP, Primary care provider; RGP, retrogastric placement.

Appendix A. Evidence Tables

106
Appendix B Counseling Intervention Descriptions

Screening and Interventions for Overw
eight and Obesity in A
dults February 27 2003
C: C
ounseling Intervention Descriptions
C-107
107
Appendix B: Counseling Intervention Descriptions
Author Population Description Intervention Description Stevens et al, 200169 N: 1191
79% white, 18% black 66% male
3 yr program for control vs intervention. Intervention: group meetings and individual counseling focused on dietary change, physical activity, and social support.
Jakicic et al, 199971 N: 148 Race NR 100% female
3 treatment arms with varying exercise regimens. All participants were prescribed the same amount of exercise, and instructed to reduce daily energy and fat intake. All groups with weekly group meetings in mos 1-6, biweekly in mos 7-12, and monthly in mos 13-18 focusing on behavioral strategies for modifying diet and exercise. LB: Long-bout exercise 5 d/wk: initially 20 min, up to 40 min/session by wk 9. SB: Short-Bout exercise 5 d/wk: same daily duration but divided into 10 min bouts. SBEQ: SB as above, but participants were provided with motorized treadmills.
Kuller et al, 200165 N: 535 92% white 100% female
5 yr cognitive-behavioral program: intervention vs control. Intensive group program x 6 mos then individual and group sessions from 6-54 mos. Intervention participants were asked to lower dietary fat intake, saturated fat intake, and dietary cholesterol, for a modest wt loss goal of 5-15 lb, and to increase physical activity to 1000-1500 kcal/wk.
Bemelmans et al, 200081
N: 42 Race NR Intervention group, 37% male; Control group 49% male
Intensive group education on the Mediterranean diet vs distribution of leaflet with Dutch nutritional guidelines. Intervention: 3 2 hr group meetings within the 1st 2-mos of the study, with a focus on education, establishment of a positive attitude, and improved skills in the preparation of Mediterranean diet food. Follow-up with an individualized letter about their adherence to Mediterranean nutritional guidelines.
Fogelholm et al, 200074
N: 82 Race NR 100% female
Diet alone vs diet plus 1 of 2 40-wk moderate-intensity walking training programs. Dietary component was a low-energy diet with weekly small-group meetings focusing on wt loss and maintenance strategies. All participants had weekly small group meetings throughout the maintenance programs. 1st PA Regimen: targeted to expend 4.2 MJ/wk. 2nd PA Regimen: targeted to expend 8.4 MJ/wk.
Jones et al, 199968 N: 102 Intervention group: 63% white, 37% black; Control group: 57% white, 43% black Intervention group: 45% male; Control group 51% male
Intervention vs control. Intervention: dietary counseling regarding food selection, preparation, and goals. No exercise advice. Counseling repeated once in 2-4 wks. Also twice monthly group support sessions x 3 mos then every 3-6 mos. Control: advised to lose wt -- no formal dietary counseling or group support.
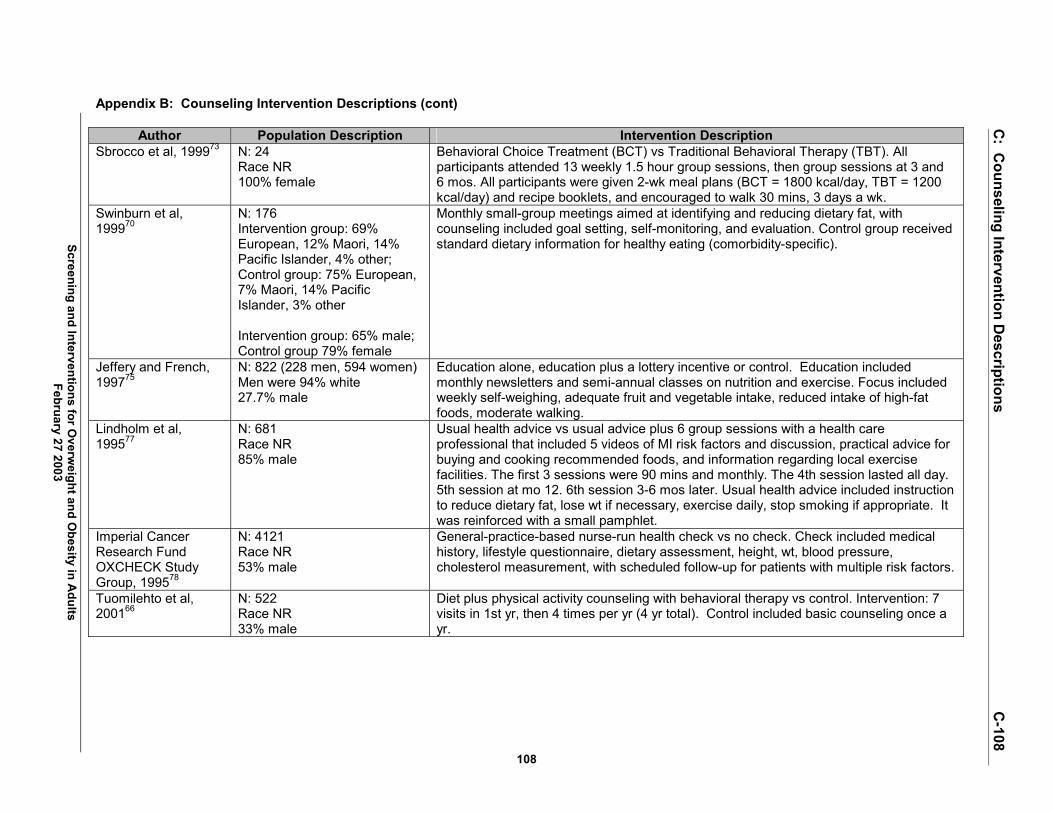
Screening and Interventions for Overw
eight and Obesity in A
dults February 27 2003
C: C
ounseling Intervention Descriptions
C-108
108
Appendix B: Counseling Intervention Descriptions (cont)
Author Population Description Intervention Description Sbrocco et al, 199973 N: 24
Race NR 100% female
Behavioral Choice Treatment (BCT) vs Traditional Behavioral Therapy (TBT). All participants attended 13 weekly 1.5 hour group sessions, then group sessions at 3 and 6 mos. All participants were given 2-wk meal plans (BCT = 1800 kcal/day, TBT = 1200 kcal/day) and recipe booklets, and encouraged to walk 30 mins, 3 days a wk.
Swinburn et al, 199970
N: 176 Intervention group: 69% European, 12% Maori, 14% Pacific Islander, 4% other; Control group: 75% European, 7% Maori, 14% Pacific Islander, 3% other Intervention group: 65% male; Control group 79% female
Monthly small-group meetings aimed at identifying and reducing dietary fat, with counseling included goal setting, self-monitoring, and evaluation. Control group received standard dietary information for healthy eating (comorbidity-specific).
Jeffery and French, 199775
N: 822 (228 men, 594 women) Men were 94% white 27.7% male
Education alone, education plus a lottery incentive or control. Education included monthly newsletters and semi-annual classes on nutrition and exercise. Focus included weekly self-weighing, adequate fruit and vegetable intake, reduced intake of high-fat foods, moderate walking.
Lindholm et al, 199577
N: 681 Race NR 85% male
Usual health advice vs usual advice plus 6 group sessions with a health care professional that included 5 videos of MI risk factors and discussion, practical advice for buying and cooking recommended foods, and information regarding local exercise facilities. The first 3 sessions were 90 mins and monthly. The 4th session lasted all day. 5th session at mo 12. 6th session 3-6 mos later. Usual health advice included instruction to reduce dietary fat, lose wt if necessary, exercise daily, stop smoking if appropriate. It was reinforced with a small pamphlet.
Imperial Cancer Research Fund OXCHECK Study Group, 199578
N: 4121 Race NR 53% male
General-practice-based nurse-run health check vs no check. Check included medical history, lifestyle questionnaire, dietary assessment, height, wt, blood pressure, cholesterol measurement, with scheduled follow-up for patients with multiple risk factors.
Tuomilehto et al, 200166
N: 522 Race NR 33% male
Diet plus physical activity counseling with behavioral therapy vs control. Intervention: 7 visits in 1st yr, then 4 times per yr (4 yr total). Control included basic counseling once a yr.
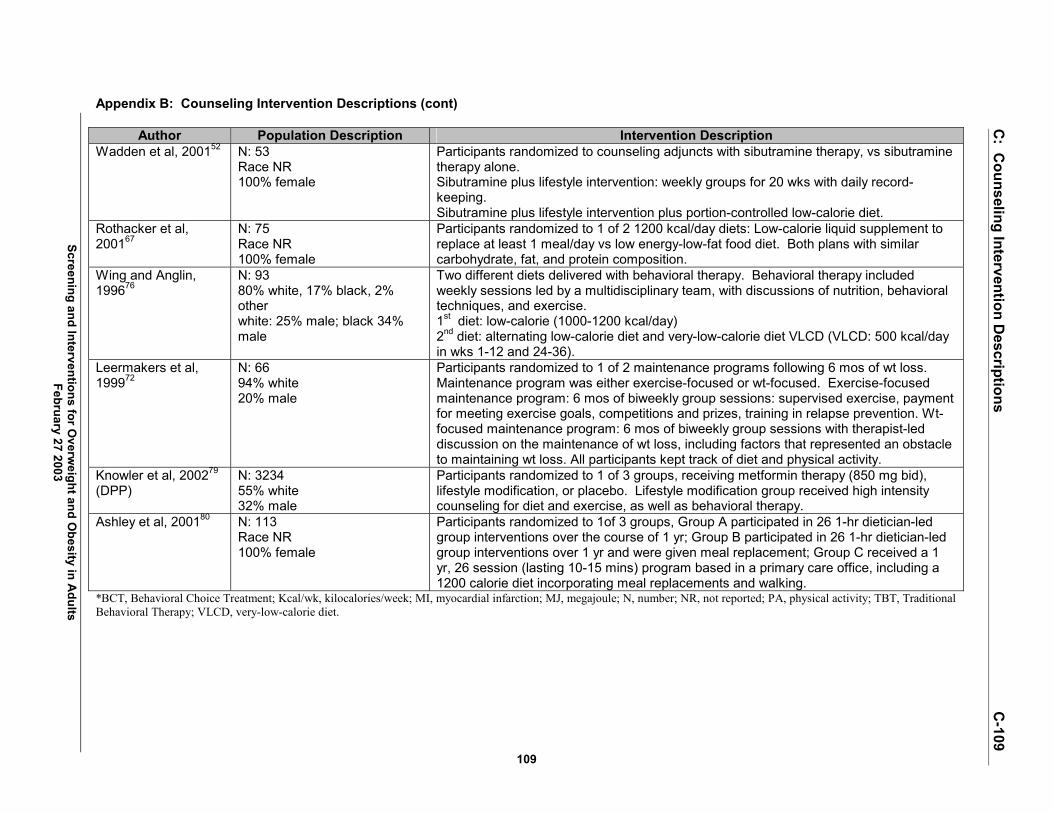
Screening and Interventions for Overw
eight and Obesity in A
dults February 27 2003
C: C
ounseling Intervention Descriptions
C-109
109
Appendix B: Counseling Intervention Descriptions (cont)
Author Population Description Intervention Description Wadden et al, 200152 N: 53
Race NR 100% female
Participants randomized to counseling adjuncts with sibutramine therapy, vs sibutramine therapy alone. Sibutramine plus lifestyle intervention: weekly groups for 20 wks with daily record-keeping. Sibutramine plus lifestyle intervention plus portion-controlled low-calorie diet.
Rothacker et al, 200167
N: 75 Race NR 100% female
Participants randomized to 1 of 2 1200 kcal/day diets: Low-calorie liquid supplement to replace at least 1 meal/day vs low energy-low-fat food diet. Both plans with similar carbohydrate, fat, and protein composition.
Wing and Anglin, 199676
N: 93 80% white, 17% black, 2% other white: 25% male; black 34% male
Two different diets delivered with behavioral therapy. Behavioral therapy included weekly sessions led by a multidisciplinary team, with discussions of nutrition, behavioral techniques, and exercise. 1st diet: low-calorie (1000-1200 kcal/day) 2nd diet: alternating low-calorie diet and very-low-calorie diet VLCD (VLCD: 500 kcal/day in wks 1-12 and 24-36).
Leermakers et al, 199972
N: 66 94% white 20% male
Participants randomized to 1 of 2 maintenance programs following 6 mos of wt loss. Maintenance program was either exercise-focused or wt-focused. Exercise-focused maintenance program: 6 mos of biweekly group sessions: supervised exercise, payment for meeting exercise goals, competitions and prizes, training in relapse prevention. Wt-focused maintenance program: 6 mos of biweekly group sessions with therapist-led discussion on the maintenance of wt loss, including factors that represented an obstacle to maintaining wt loss. All participants kept track of diet and physical activity.
Knowler et al, 200279 (DPP)
N: 3234 55% white 32% male
Participants randomized to 1 of 3 groups, receiving metformin therapy (850 mg bid), lifestyle modification, or placebo. Lifestyle modification group received high intensity counseling for diet and exercise, as well as behavioral therapy.
Ashley et al, 200180 N: 113 Race NR 100% female
Participants randomized to 1of 3 groups, Group A participated in 26 1-hr dietician-led group interventions over the course of 1 yr; Group B participated in 26 1-hr dietician-led group interventions over 1 yr and were given meal replacement; Group C received a 1 yr, 26 session (lasting 10-15 mins) program based in a primary care office, including a 1200 calorie diet incorporating meal replacements and walking.
*BCT, Behavioral Choice Treatment; Kcal/wk, kilocalories/week; MI, myocardial infarction; MJ, megajoule; N, number; NR, not reported; PA, physical activity; TBT, Traditional Behavioral Therapy; VLCD, very-low-calorie diet.
Screening and Interventions for Overw
eight and Obesity in A
dults February 27 2003
110
Appendix C Descriptions of Intensive Counseling and Behavioral Intervention Studies
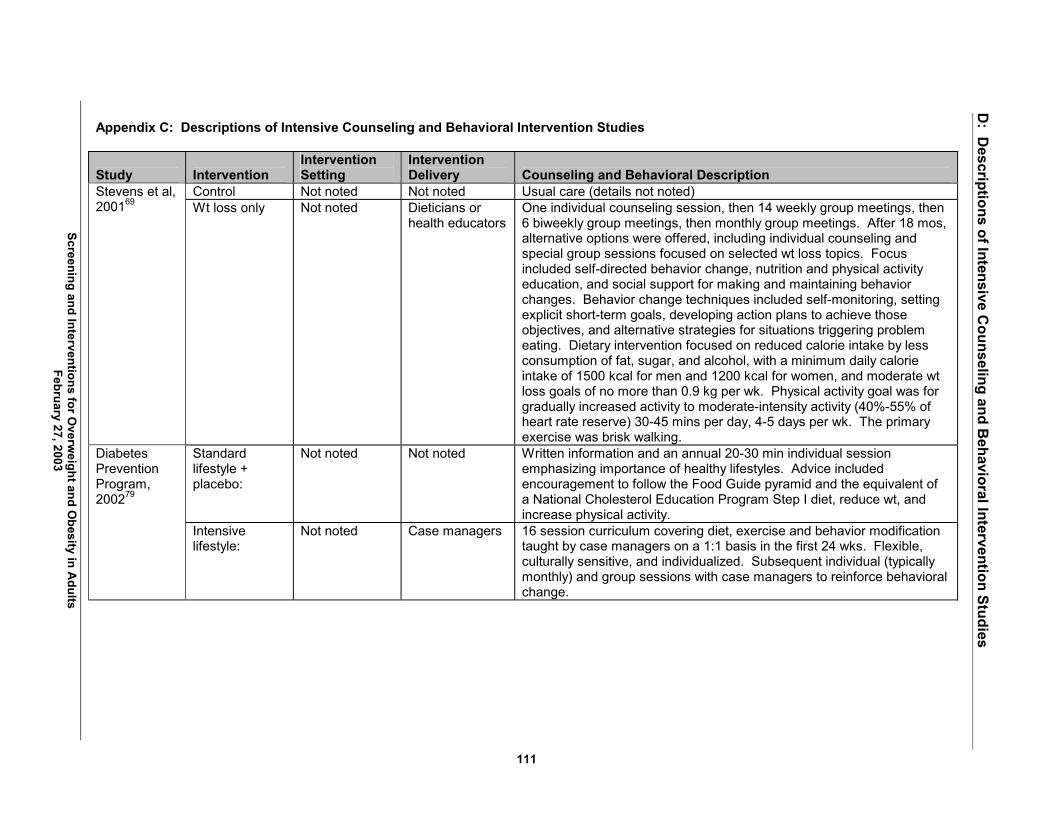
Screening and Interventions for Overw
eight and Obesity in A
dults February 27, 2003
D: D
escriptions of Intensive Counseling and B
ehavioral Intervention Studies
111
Appendix C: Descriptions of Intensive Counseling and Behavioral Intervention Studies
Study Intervention Intervention Setting
Intervention Delivery Counseling and Behavioral Description
Control Not noted Not noted Usual care (details not noted) Stevens et al, 200169
Wt loss only Not noted Dieticians or health educators
One individual counseling session, then 14 weekly group meetings, then 6 biweekly group meetings, then monthly group meetings. After 18 mos, alternative options were offered, including individual counseling and special group sessions focused on selected wt loss topics. Focus included self-directed behavior change, nutrition and physical activity education, and social support for making and maintaining behavior changes. Behavior change techniques included self-monitoring, setting explicit short-term goals, developing action plans to achieve those objectives, and alternative strategies for situations triggering problem eating. Dietary intervention focused on reduced calorie intake by less consumption of fat, sugar, and alcohol, with a minimum daily calorie intake of 1500 kcal for men and 1200 kcal for women, and moderate wt loss goals of no more than 0.9 kg per wk. Physical activity goal was for gradually increased activity to moderate-intensity activity (40%-55% of heart rate reserve) 30-45 mins per day, 4-5 days per wk. The primary exercise was brisk walking.
Standard lifestyle + placebo:
Not noted Not noted Written information and an annual 20-30 min individual session emphasizing importance of healthy lifestyles. Advice included encouragement to follow the Food Guide pyramid and the equivalent of a National Cholesterol Education Program Step I diet, reduce wt, and increase physical activity.
Diabetes Prevention Program, 200279
Intensive lifestyle:
Not noted Case managers 16 session curriculum covering diet, exercise and behavior modification taught by case managers on a 1:1 basis in the first 24 wks. Flexible, culturally sensitive, and individualized. Subsequent individual (typically monthly) and group sessions with case managers to reinforce behavioral change.

Screening and Interventions for Overw
eight and Obesity in A
dults February 27, 2003
D: D
escriptions of Intensive Counseling and B
ehavioral Intervention Studies
112
Appendix C: Descriptions of Intensive Counseling and Behavioral Intervention Studies (cont)
Study Intervention Intervention Setting
Intervention Delivery Counseling and Behavioral Description
Assessment only
Large research clinic
Psychologists (PhD level)
Clinical assessment, with baseline health education pamphlet on reducing cardiovascular risk factors, and advice to quit smoking.
Kuller et al, 200165
Lifestyle intervention
Large research clinic
Psychologists (PhD level), nutritionists, exercise physiologists
Cognitive-behavioral program aimed at preventing rises in LDL cholesterol and wt gain, and increasing leisure-time activity. Intensive group program in the first 6 mos, then follow-up individual and group sessions from mos 6-54. Wt loss goal was 5-15 lbs, depending on baseline wt. Participants were asked to lower dietary fat intake and daily caloric intake. Lifestyle approach to increasing physical activity to 1000-1500 kcal expenditure weekly.
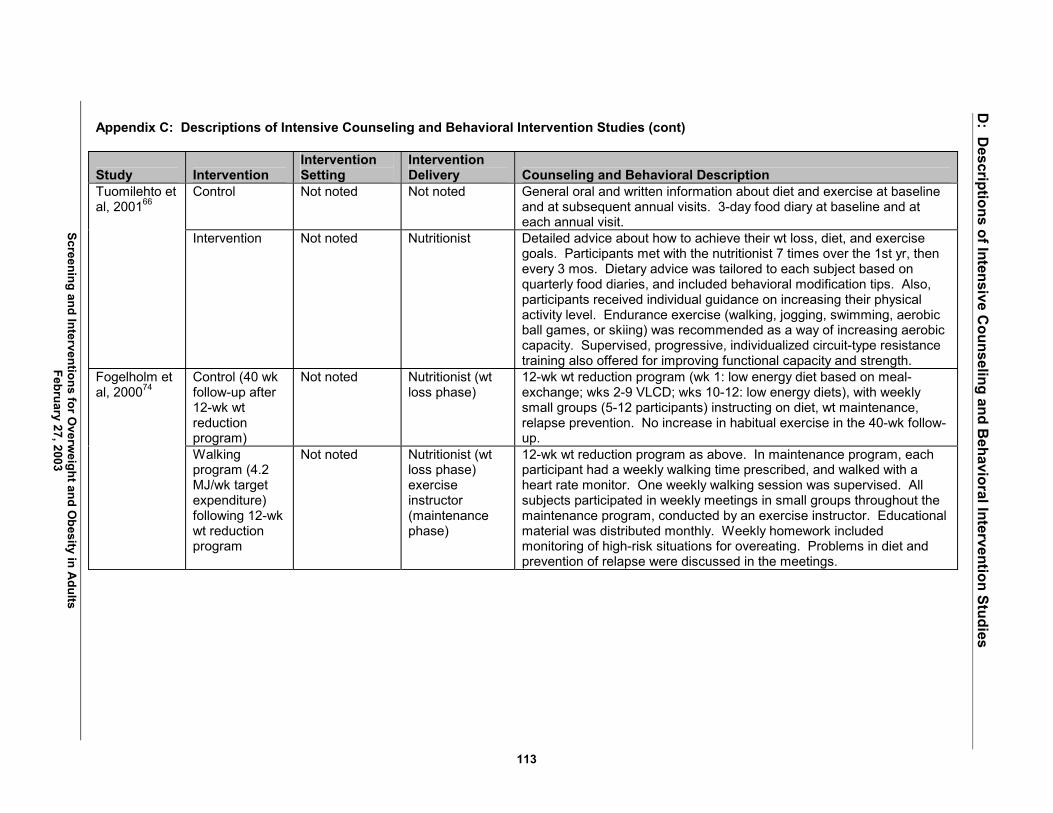
Screening and Interventions for Overw
eight and Obesity in A
dults February 27, 2003
D: D
escriptions of Intensive Counseling and B
ehavioral Intervention Studies
113
Appendix C: Descriptions of Intensive Counseling and Behavioral Intervention Studies (cont)
Study Intervention Intervention Setting
Intervention Delivery Counseling and Behavioral Description
Control Not noted Not noted General oral and written information about diet and exercise at baseline and at subsequent annual visits. 3-day food diary at baseline and at each annual visit.
Tuomilehto et al, 200166
Intervention Not noted Nutritionist Detailed advice about how to achieve their wt loss, diet, and exercise goals. Participants met with the nutritionist 7 times over the 1st yr, then every 3 mos. Dietary advice was tailored to each subject based on quarterly food diaries, and included behavioral modification tips. Also, participants received individual guidance on increasing their physical activity level. Endurance exercise (walking, jogging, swimming, aerobic ball games, or skiing) was recommended as a way of increasing aerobic capacity. Supervised, progressive, individualized circuit-type resistance training also offered for improving functional capacity and strength.
Control (40 wk follow-up after 12-wk wt reduction program)
Not noted Nutritionist (wt loss phase)
12-wk wt reduction program (wk 1: low energy diet based on meal-exchange; wks 2-9 VLCD; wks 10-12: low energy diets), with weekly small groups (5-12 participants) instructing on diet, wt maintenance, relapse prevention. No increase in habitual exercise in the 40-wk follow-up.
Fogelholm et al, 200074
Walking program (4.2 MJ/wk target expenditure) following 12-wk wt reduction program
Not noted Nutritionist (wt loss phase) exercise instructor (maintenance phase)
12-wk wt reduction program as above. In maintenance program, each participant had a weekly walking time prescribed, and walked with a heart rate monitor. One weekly walking session was supervised. All subjects participated in weekly meetings in small groups throughout the maintenance program, conducted by an exercise instructor. Educational material was distributed monthly. Weekly homework included monitoring of high-risk situations for overeating. Problems in diet and prevention of relapse were discussed in the meetings.
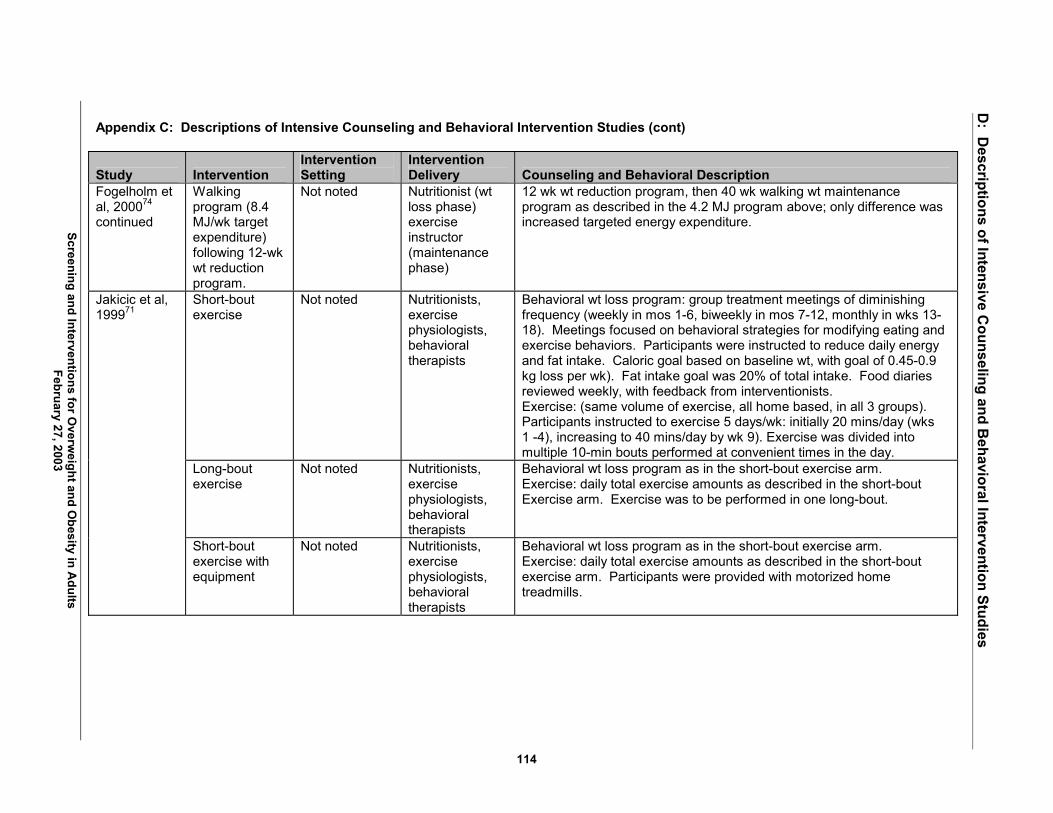
Screening and Interventions for Overw
eight and Obesity in A
dults February 27, 2003
D: D
escriptions of Intensive Counseling and B
ehavioral Intervention Studies
114
Appendix C: Descriptions of Intensive Counseling and Behavioral Intervention Studies (cont)
Study Intervention Intervention Setting
Intervention Delivery Counseling and Behavioral Description
Fogelholm et al, 200074 continued
Walking program (8.4 MJ/wk target expenditure) following 12-wk wt reduction program.
Not noted Nutritionist (wt loss phase) exercise instructor (maintenance phase)
12 wk wt reduction program, then 40 wk walking wt maintenance program as described in the 4.2 MJ program above; only difference was increased targeted energy expenditure.
Short-bout exercise
Not noted Nutritionists, exercise physiologists, behavioral therapists
Behavioral wt loss program: group treatment meetings of diminishing frequency (weekly in mos 1-6, biweekly in mos 7-12, monthly in wks 13-18). Meetings focused on behavioral strategies for modifying eating and exercise behaviors. Participants were instructed to reduce daily energy and fat intake. Caloric goal based on baseline wt, with goal of 0.45-0.9 kg loss per wk). Fat intake goal was 20% of total intake. Food diaries reviewed weekly, with feedback from interventionists. Exercise: (same volume of exercise, all home based, in all 3 groups). Participants instructed to exercise 5 days/wk: initially 20 mins/day (wks 1 -4), increasing to 40 mins/day by wk 9). Exercise was divided into multiple 10-min bouts performed at convenient times in the day.
Long-bout exercise
Not noted Nutritionists, exercise physiologists, behavioral therapists
Behavioral wt loss program as in the short-bout exercise arm. Exercise: daily total exercise amounts as described in the short-bout Exercise arm. Exercise was to be performed in one long-bout.
Jakicic et al, 199971
Short-bout exercise with equipment
Not noted Nutritionists, exercise physiologists, behavioral therapists
Behavioral wt loss program as in the short-bout exercise arm. Exercise: daily total exercise amounts as described in the short-bout exercise arm. Participants were provided with motorized home treadmills.
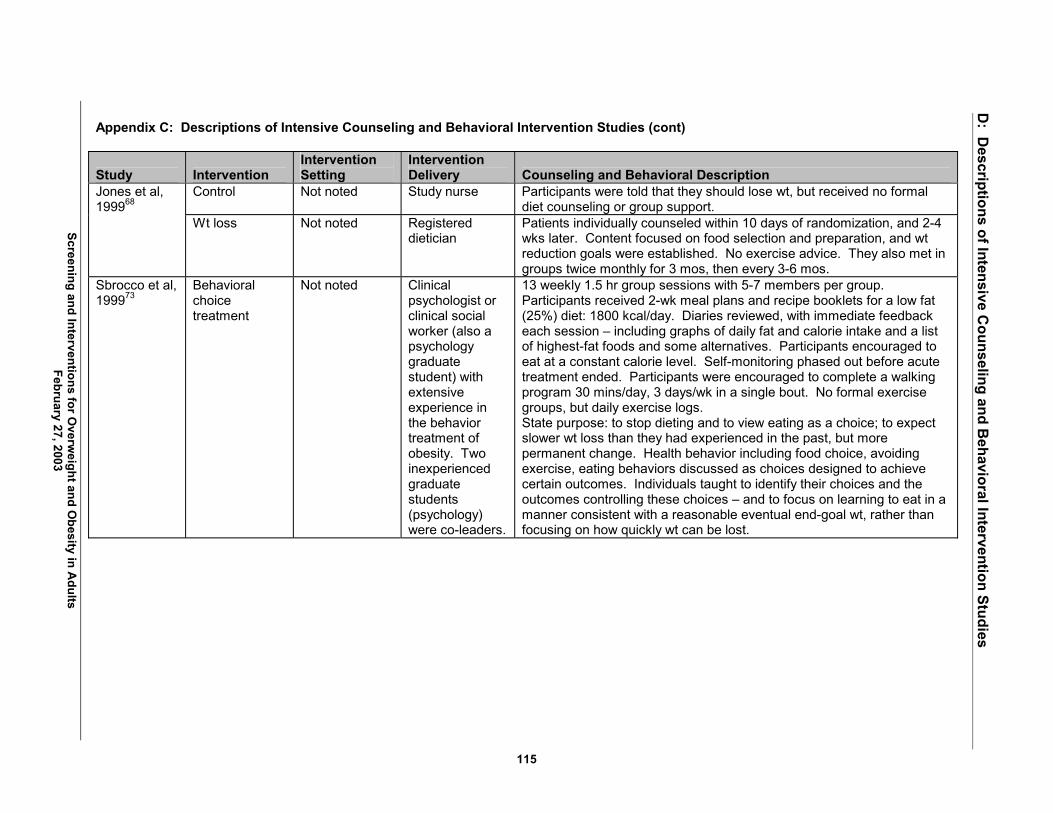
Screening and Interventions for Overw
eight and Obesity in A
dults February 27, 2003
D: D
escriptions of Intensive Counseling and B
ehavioral Intervention Studies
115
Appendix C: Descriptions of Intensive Counseling and Behavioral Intervention Studies (cont)
Study Intervention Intervention Setting
Intervention Delivery Counseling and Behavioral Description
Control Not noted Study nurse Participants were told that they should lose wt, but received no formal diet counseling or group support.
Jones et al, 199968
Wt loss Not noted Registered dietician
Patients individually counseled within 10 days of randomization, and 2-4 wks later. Content focused on food selection and preparation, and wt reduction goals were established. No exercise advice. They also met in groups twice monthly for 3 mos, then every 3-6 mos.
Sbrocco et al, 199973
Behavioral choice treatment
Not noted Clinical psychologist or clinical social worker (also a psychology graduate student) with extensive experience in the behavior treatment of obesity. Two inexperienced graduate students (psychology) were co-leaders.
13 weekly 1.5 hr group sessions with 5-7 members per group. Participants received 2-wk meal plans and recipe booklets for a low fat (25%) diet: 1800 kcal/day. Diaries reviewed, with immediate feedback each session � including graphs of daily fat and calorie intake and a list of highest-fat foods and some alternatives. Participants encouraged to eat at a constant calorie level. Self-monitoring phased out before acute treatment ended. Participants were encouraged to complete a walking program 30 mins/day, 3 days/wk in a single bout. No formal exercise groups, but daily exercise logs. State purpose: to stop dieting and to view eating as a choice; to expect slower wt loss than they had experienced in the past, but more permanent change. Health behavior including food choice, avoiding exercise, eating behaviors discussed as choices designed to achieve certain outcomes. Individuals taught to identify their choices and the outcomes controlling these choices � and to focus on learning to eat in a manner consistent with a reasonable eventual end-goal wt, rather than focusing on how quickly wt can be lost.

Screening and Interventions for Overw
eight and Obesity in A
dults February 27, 2003
D: D
escriptions of Intensive Counseling and B
ehavioral Intervention Studies
116
Appendix C: Descriptions of Intensive Counseling and Behavioral Intervention Studies (cont)
Study Intervention Intervention Setting
Intervention Delivery Counseling and Behavioral Description
Sbrocco et al, 199973, continued
Traditional behavioral treatment
Not noted Clinical psychologist or clinical social worker (also a psychology graduate student) with extensive experience in the behavior treatment of obesity. Two inexperienced graduate students (psych) were co-leaders
Weekly group sessions, meal plans, recipes, food diaries, and exercise as above, but with 1200 kcal/day diet. Stated purpose: to promote a substantial wt loss and to help develop habits and strategies to maintain this loss. Standard behavioral wt management techniques (eg self-monitoring, stimulus control, and behavioral substitution) were taught. Participants were encouraged to avoid eating and purchasing high-calorie foods, to lose wt so they could then maintain these changes; they were taught to understand their reasons for eating and to engage in problem solving to determine other methods to respond to stress.
Dietician-led lifestyle intervention
Not noted Registered dietician
26 1-hr sessions over 1 yr. Participants received instruction manuals that included lessons based on an established wt control program (LEARN). Diet included a low-calorie diet (1200 kcal/day, with < 30% of calories from fat), using standard recommendations for food groups and portion sizes. Activity instruction included walking up to 10,000 steps per day, measured by a supplied pedometer. Self-monitoring of food intake and energy expenditure in diaries. Specific to this group, participants attended small (8-10) people classes led by a registered dietician. Classes were weekly for 3 mos, then biweekly for 3 mos then monthly for 4 mos. Diet was made up of conventional food items.
Ashley et al, 200180
Dietician-led lifestyle intervention with meal replacements
Not noted Registered dietician
As in the traditional group above, instruction manuals for dieting, 1200 kcal/day diet, and exercise instructions with pedometer use and self-monitoring. Sessions with registered dietician as above. However, 2 of the 3 main meals were replaced with meal-replacement shakes or bars (reduced to 1 main meal if goal reached and maintained).
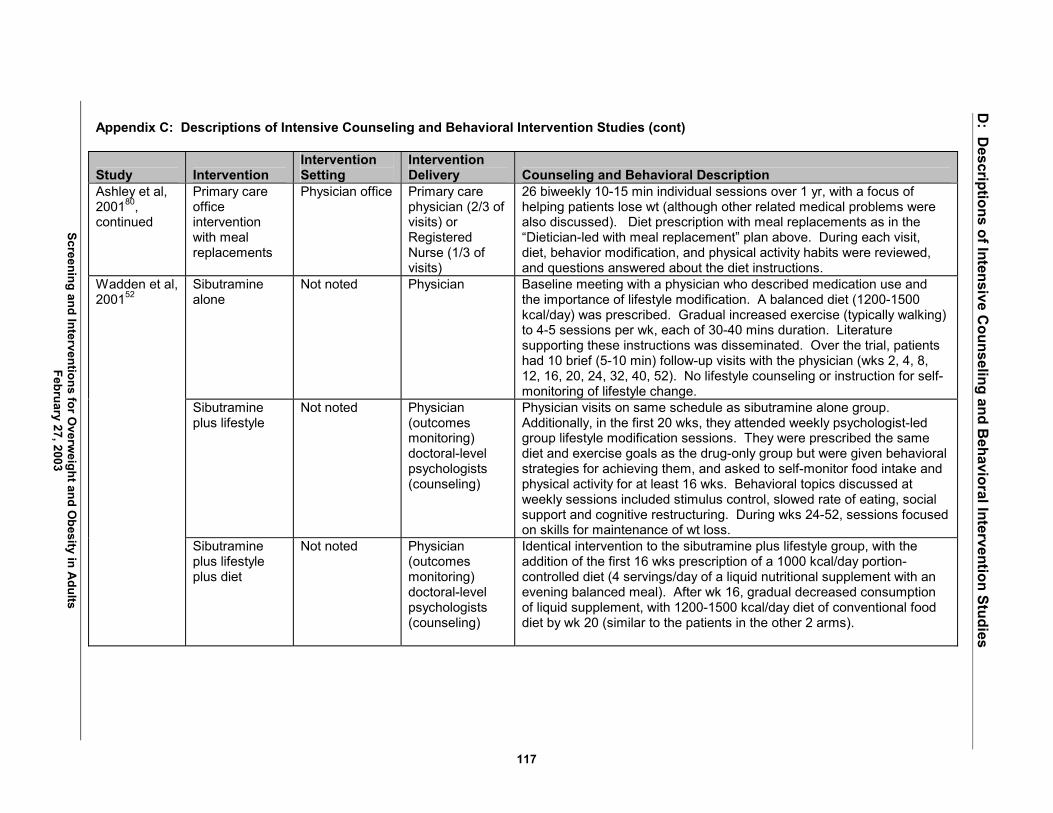
Screening and Interventions for Overw
eight and Obesity in A
dults February 27, 2003
D: D
escriptions of Intensive Counseling and B
ehavioral Intervention Studies
117
Appendix C: Descriptions of Intensive Counseling and Behavioral Intervention Studies (cont)
Study Intervention Intervention Setting
Intervention Delivery Counseling and Behavioral Description
Ashley et al, 200180, continued
Primary care office intervention with meal replacements
Physician office Primary care physician (2/3 of visits) or Registered Nurse (1/3 of visits)
26 biweekly 10-15 min individual sessions over 1 yr, with a focus of helping patients lose wt (although other related medical problems were also discussed). Diet prescription with meal replacements as in the �Dietician-led with meal replacement� plan above. During each visit, diet, behavior modification, and physical activity habits were reviewed, and questions answered about the diet instructions.
Sibutramine alone
Not noted Physician Baseline meeting with a physician who described medication use and the importance of lifestyle modification. A balanced diet (1200-1500 kcal/day) was prescribed. Gradual increased exercise (typically walking) to 4-5 sessions per wk, each of 30-40 mins duration. Literature supporting these instructions was disseminated. Over the trial, patients had 10 brief (5-10 min) follow-up visits with the physician (wks 2, 4, 8, 12, 16, 20, 24, 32, 40, 52). No lifestyle counseling or instruction for self-monitoring of lifestyle change.
Sibutramine plus lifestyle
Not noted Physician (outcomes monitoring) doctoral-level psychologists (counseling)
Physician visits on same schedule as sibutramine alone group. Additionally, in the first 20 wks, they attended weekly psychologist-led group lifestyle modification sessions. They were prescribed the same diet and exercise goals as the drug-only group but were given behavioral strategies for achieving them, and asked to self-monitor food intake and physical activity for at least 16 wks. Behavioral topics discussed at weekly sessions included stimulus control, slowed rate of eating, social support and cognitive restructuring. During wks 24-52, sessions focused on skills for maintenance of wt loss.
Wadden et al, 200152
Sibutramine plus lifestyle plus diet
Not noted Physician (outcomes monitoring) doctoral-level psychologists (counseling)
Identical intervention to the sibutramine plus lifestyle group, with the addition of the first 16 wks prescription of a 1000 kcal/day portion-controlled diet (4 servings/day of a liquid nutritional supplement with an evening balanced meal). After wk 16, gradual decreased consumption of liquid supplement, with 1200-1500 kcal/day diet of conventional food diet by wk 20 (similar to the patients in the other 2 arms).
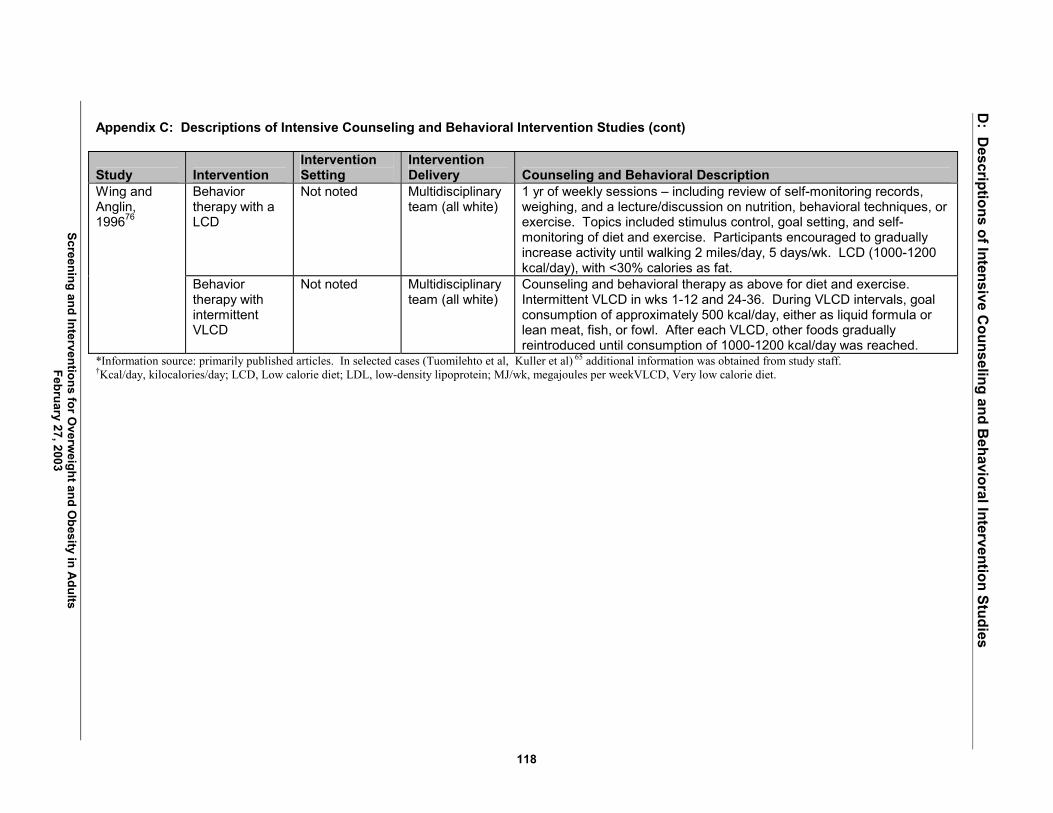
Screening and Interventions for Overw
eight and Obesity in A
dults February 27, 2003
D: D
escriptions of Intensive Counseling and B
ehavioral Intervention Studies
118
Appendix C: Descriptions of Intensive Counseling and Behavioral Intervention Studies (cont)
Study Intervention Intervention Setting
Intervention Delivery Counseling and Behavioral Description
Behavior therapy with a LCD
Not noted Multidisciplinary team (all white)
1 yr of weekly sessions � including review of self-monitoring records, weighing, and a lecture/discussion on nutrition, behavioral techniques, or exercise. Topics included stimulus control, goal setting, and self-monitoring of diet and exercise. Participants encouraged to gradually increase activity until walking 2 miles/day, 5 days/wk. LCD (1000-1200 kcal/day), with <30% calories as fat.
Wing and Anglin, 199676
Behavior therapy with intermittent VLCD
Not noted Multidisciplinary team (all white)
Counseling and behavioral therapy as above for diet and exercise. Intermittent VLCD in wks 1-12 and 24-36. During VLCD intervals, goal consumption of approximately 500 kcal/day, either as liquid formula or lean meat, fish, or fowl. After each VLCD, other foods gradually reintroduced until consumption of 1000-1200 kcal/day was reached.
*Information source: primarily published articles. In selected cases (Tuomilehto et al, Kuller et al) 65 additional information was obtained from study staff. �Kcal/day, kilocalories/day; LCD, Low calorie diet; LDL, low-density lipoprotein; MJ/wk, megajoules per weekVLCD, Very low calorie diet.


