Screen filtration in seawater pretreatment: A pilot trial...
65
1 Screen filtration in seawater pretreatment: A pilot trial of the Forsta Filter ENG460: Engineering Thesis Final Report Michael Ambrose A report submitted to the School of Environmental Science, Murdoch University in partial fulfilment of the requirements for the degree of Bachelor of Engineering Academic Supervisors: Dr Martin Anda Dr Linda Li
Transcript of Screen filtration in seawater pretreatment: A pilot trial...

1
Screen filtration in seawater
pretreatment: A pilot trial of
the Forsta Filter
ENG460: Engineering Thesis Final Report
Michael Ambrose
A report submitted to the School of Environmental Science, Murdoch University
in partial fulfilment of the requirements for the degree of Bachelor of Engineering
Academic Supervisors: Dr Martin Anda
Dr Linda Li

2
Table of Contents
Abstract .................................................................................................................................................. 4
Acknowledgments .................................................................................................................................. 5
Acronyms ............................................................................................................................................... 6
Units ....................................................................................................................................................... 6
List of Figures ........................................................................................................................................ 7
List of Tables .......................................................................................................................................... 8
Introduction ............................................................................................................................................ 9
Report problem ................................................................................................................................... 9
Previous work ................................................................................................................................. 9
Report Goals and Objectives ............................................................................................................ 10
Goals ............................................................................................................................................. 10
Objectives ..................................................................................................................................... 10
Report constraints ............................................................................................................................. 11
Report scope ..................................................................................................................................... 11
Background .......................................................................................................................................... 12
Seawater Composition ...................................................................................................................... 12
Desalination pretreatment ................................................................................................................. 12
Conventional pretreatment methods ............................................................................................. 13
Alternative pretreatment methods ................................................................................................ 17
Chemical dosing ........................................................................................................................... 19
Limits of current pretreatment technology ................................................................................... 20
Materials and Equipment ...................................................................................................................... 22
Location ............................................................................................................................................ 22
Plant Control ................................................................................................................................. 23
Materials ........................................................................................................................................... 24
Forsta Filter unit ........................................................................................................................... 24
Experimental Setup components .................................................................................................. 26
Data Logger: Campbell Scientific CR200X ................................................................................. 27
Methods ................................................................................................................................................ 28
Experimental Design ........................................................................................................................ 28
System Design .............................................................................................................................. 31
Forsta Filter: Mode of operation ................................................................................................... 34
Feed water: Polished Seawater .................................................................................................... 35
Sampling Parameters ........................................................................................................................ 36
Water quality parameters .............................................................................................................. 36

3
Temperature .................................................................................................................................. 37
Physical Deterioration .................................................................................................................. 37
Pressure ........................................................................................................................................ 37
Backwashing ................................................................................................................................ 38
Measurement and Logging ........................................................................................................... 38
Parameters to influence results ..................................................................................................... 39
Assumptions and Limitations of Trial .......................................................................................... 39
Implementation ..................................................................................................................................... 41
Results and Discussion ......................................................................................................................... 44
Preliminary Testing .......................................................................................................................... 44
Results .......................................................................................................................................... 44
Discussion .................................................................................................................................... 46
Evaluation of full-scale design (projected) ....................................................................................... 46
Sizing ............................................................................................................................................ 46
Footprint, Corrosion Potential and Filtration Area ....................................................................... 47
Recommendations and Future Works .................................................................................................. 49
Conclusion ............................................................................................................................................ 51
References ............................................................................................................................................ 52
Appendices ........................................................................................................................................... 54
Appendix A: Specifications of Experimental Setup Components .................................................... 54
Appendix B: Hydrogeological cross-section of the Rockingham Area ............................................ 57
Appendix C: Information on the three groundwater wells at the NCEDA, Rockingham ................ 57
Appendix D: Preliminary Testing .................................................................................................... 59
Appendix E: Job Safety Analysis for Project Implementation ......................................................... 62
Appendix F: Project Issues ............................................................................................................... 64

4
Abstract
This project set out to design, build and monitor a pilot trial of the self-cleaning ninety series
Forsta Screen filter using polished seawater as the feedwater. The trial’s task was to investigate if
a five micron self cleaning screen filter can be an effective technology when used near the end of
the seawater pretreatment stream found in a conventional seawater reverse osmosis desalination
plant. To assess the performance of the screen filter several key parameters were identified
including backwash frequency, silt density index testing, turbidity, and pressure. The project
originated from the desalination industry’s desire to look for alternative fine filtration
technologies away from the commonly used cartridge filters. This project also outlines the
scalability of the filter in an industrial setting with comparisons to the cartridge filters found at
the Perth Seawater Desalination Plant (PSDP).
The design required the filter to treat seawater from the Perth Seawater Desalination Plant, with
the testing to occur at the National Centre of Excellence in Desalination Australia (NCEDA) in
Rockingham, Western Australia. The trial was to last up to 6 weeks during the teaching period.
The project faced several unexpected issues in implementing the design over the semester and
unfortunately could not fulfill the requirement to conduct the pilot trial within this time.
However preliminary testing was completed which confirmed the effective operation of the filter
system. Primary objectives for the test were to see if the system design fulfilled its function and
verify if certain parameters were attainable in regards to pressure, flow rate, and backwash cycle.
The feedwater was brackish groundwater. Results showed: the filter system operated effectively;
attained a system flow rate of 5 kiloliters per hour; attained the minimum system back pressure
of 40 PSI; and successful automation of the backwash cycle and system.
Further work is anticipated to be carried out after the semester to gain closure on the project.

5
Acknowledgments
Acknowledgments must go to the NCEDA Staff, Neil Palmer, for introducing this opportunity
for me. Followed by George Horvath and Michael Blackwood for their continual support and
feedback on any questions I had - without them there would be no project.
Secondly my gratitude goes to Dr Martin Anda and Dr Linda Li for their advice and support
during the project and to Gareth Lee for letting this thesis come as far as it has.

6
Acronyms
SWRO Seawater Reverse Osmosis
RO Reverse Osmosis
NCEDA National Center of Excellence in Desalination Australia
PSDP Perth Seawater Desalination Plant (Synonymous with Kwinana Desalination
Plant)
UF Ultra-filtration
MF Micro-filtration
dP Differential Pressure
SDI Silt Density Index
Units
kL Kilolitres
L Litres
G Gallons
gpm Gallons per minute
lpm Litres per minute
psi Pounds per Square Inch
NTU Nephelometric Turbidity Units
Mg/L Milligrams per Litre

7
List of Figures
Figure 1: Streams in typical desalination processes (Water Corporation, 2004)
Figure 2: From ascending order: Melt Blown Cartridge, String wound Cartridge, Pleated Filter
Cartridge, and Media Cartridge filter (Cal Water)
Figure 3: Micron Cartridge filter assembly at a desalination plant in Israel (Science Photo Library)
Figure 4: Typical Conventional Pre-treatment versus Membrane Pre-treatment in a seawater RO
system (Voutchkov, 2010)
Figure5: (1) Wedge-wire screens formed by laying steel wires; (2) An example of a Dutch Weave
screen with discrete openings (Allhands, 2004)
Figure 6: Applications of the Amiad’s AMF2 model (Amiad, 2012)
Figure 7: Picture of Tank B and other tanks at NCEDA Facility
Figure 8: Pump for Tank B: Grundfos model CRT 16-4
Figure 9: Included parts with filter. From ascending order: Air Actuator; Solenoid valve; Backwash
Controller; Differential Pressure Gauge
Figure 10: Filter unit taken apart into its individual units
Figure 11: Control box of Backwash controller (Forsta Filter)
Figure 12: The Campbell Scientific CR200X Datalogger (Campbell Scientific)
Figure 13: Principle of Filter in Trial
Figure 14: Air compressor used in the trial’s Experimental Setup
Figure 15: Setup of Solenoid-Compressor Backwash system
Figure 16: PI&D of Experimental Setup
Figure 17: Predicted efficiency curve of Grundfos pump
Figure 18: System process for trial
Figure 19: The backwash cycle
Figure 20: 0-6 bar pressure transmitter used in the trial
Figure 21: Left to right – the piping measured and cut as required; the general setup for the filters
inlet and outlet points, note the pink-taped threaded fittings are reduced to 40mm
Figure 22: Comparison of the Manufacturers arrangement and the implemented design for the trial
(Forsta Filter)
Figure 23: The different stages of welding the skid and placing the filter setup onto it
Figure 24: The controller, solenoid valve, and different pressure gauge mounted on a wooden board
above the setup
Figure 25: The completed filter system setup with key features labeled
Figure 26: Conductivity recorded over a preliminary testing session
Figure 27: Differential pressure recorded at a preliminary testing session
Figure 28: Estimation of plant area for Cartridge filter Banks
Figure 29: Water Based Solenoid Valve (B.T. Best)
Figure 30: Possible testing configuration for two filter technologies in parallel
8
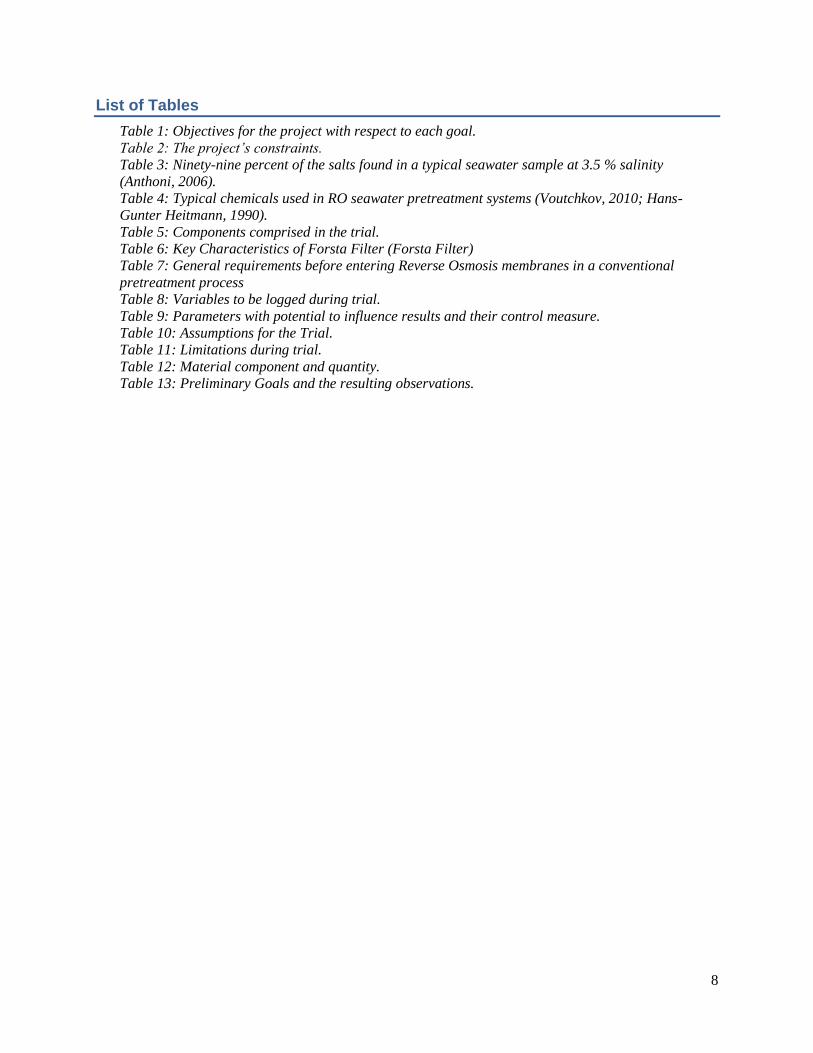
List of Tables
Table 1: Objectives for the project with respect to each goal.
Table 2: The project’s constraints.
Table 3: Ninety-nine percent of the salts found in a typical seawater sample at 3.5 % salinity
(Anthoni, 2006).
Table 4: Typical chemicals used in RO seawater pretreatment systems (Voutchkov, 2010; Hans-
Gunter Heitmann, 1990).
Table 5: Components comprised in the trial.
Table 6: Key Characteristics of Forsta Filter (Forsta Filter)
Table 7: General requirements before entering Reverse Osmosis membranes in a conventional
pretreatment process
Table 8: Variables to be logged during trial.
Table 9: Parameters with potential to influence results and their control measure.
Table 10: Assumptions for the Trial.
Table 11: Limitations during trial.
Table 12: Material component and quantity.
Table 13: Preliminary Goals and the resulting observations.

9
Introduction
Report problem
In recent years there has been an increasing disadvantage in using cartridge filtration for seawater
desalination pretreatment. The main driving force for this change comes from the raised awareness that
other filtration technologies exist which can often outperform the existing cartridge technology, and for a
cheaper cost (Hamilton, 1999). Some disadvantages recognized are included below:
Non-washable device
Low liquid capacity per unit
Filters incubate biofilm
Filter fouling increases energy demand
Self Cleaning Screen filters provide several advantages over cartridge filters including smaller
footprint, lower maintenance and reduced valve and piping complexity. With recent development in
manufacturing technology of woven stainless steel screens, these filters are able to filter even down to 1
micron. The automated backwashing also ensures that biofilm build up remains to a minimum.
This thesis aims to investigate this technology through a pilot trial of the Forsta Filter, a self cleaning
filter that contains a five micron mesh screen for fine particle filtration. The National Centre of
Excellence in Rockingham has offered to host the trial and provide assistance along the length of time
required to achieve results. The trial’s context is within seawater desalination pretreatment, with a focus
on low micron cartridge filters found in the conventional seawater pretreatment stream.
Previous work
The origin of this project began when a prominent figure in GHD was introduced to the Forsta Filter
in early 2011 at the G’Day USA event held in Los Angeles. This led to the suggestion of testing the filter
unit at the Perth Seawater Desalination Plant (PSDP) as an alternative to using the cartridge filters for
pretreatment. This soon led to a collaborative project being jointly undertaken by Forsta Filters, NCEDA,
GHD, and ProAlliance (Water Corporation and Degremont JV). A meeting ensued in November 2011
with an agreement on the general principles for conducting the testing. Following the meeting, the
NCEDA’s responsibilities were to build the skid and connect to suitable interface points in the
pretreatment system at the PSDP. Forsta Filter agreed to provide a trial 5 micron self cleaning unit along
with a basic control system. The filter was shipped and housed in the NCEDA workshop.
A second meeting in March 2012 prompted some revisions in delegations and responsibilities. These
included:
Scaled down version of the Forsta Filter trial to the NCEDA pilot plant
Primary testing and monitoring of unit delegated to NCEDA staff and a 4th year Murdoch
University Student
Shortening of monitoring period – to less than 6 months

10
Report Goals and Objectives
Goals
As a result of the project’s previous history, the goals were developed as follows:
1. To investigate the use of a five micron self cleaning Forsta Filter with polished seawater from
PSDP
2. To compare the performance and scalability of the Forsta Filter to cartridge filters used in the last
step of pre-treatment in a SWRO system
Objectives
The objectives for each project goal can be seen in Table 1. As the table points out the trial is given 6
weeks to collect, sequence, and analyse the data to assess the filters performance. The second goal is
dependent on the trials data but will also require available data on industrial cartridge filters used in
desalination plants.
Table 1: Objectives for the project with respect to each goal.
Goal Objective Expected Time allocated
Goal 1 Design, build, and test an experimental
setup to host the filter
Week 3 to Week 9
Conduct a pilot trial of the Forsta filter
with seawater from the Kwinana
desalination plant
Week 9 to Week 15
Use relevant sampling parameters Week 9 to Week 15
Goal 2 Use trial data to assess filter performance Week 9 to Week 15
Attain performance data of cartridge filters
in a real seawater desalination plant
Week 3 to Week 15

11
Report constraints
The constraints during the project are listed in Table 2. An immediate constraint will be the time to
build the setup given the thesis project had a late start and officially began in week 3. Another issue could
be data availability from desalination plants who may be reluctant to divulge certain information.
Table 2: The project’s constraints.
Report scope
The trial will focus exclusively on its own results and could not be considered a general analysis of
screen filters in seawater pretreatment. This could require further inclusion of other detailed studies and
direct comparisons of other fine filtration technologies used in parallel, such as the screen filter and a
cartridge filter tested in parallel in real time, or other case studies involving screen filters in water
treatment.
Constraint Comment
Time The project has less than 16 weeks to build and test the Forsta Filter.
While the trial’s aim was to achieve maximum contact time between
the filter and seawater
Knowledge Base As a 4th year student, I have a low level knowledge base on
wastewater treatment to work from
Supervisory
component
My industry supervisors had their time divided among several
commitments therefore this can limit the amount and depth of expert
advice and assistance received during the setup of the trial
Scale The trial was conducted as a pilot scale therefore there will
additional issues to consider when scaling up to a water plant
Materials The trial setup requires various materials. The time to attain all parts
to begin building could cause delays
Data Availability At this stage it’s been mentioned it might be difficult to obtain a
sufficient amount of data on the cartridge filters used in the
desalination industry.
Therefore this could restrict:
The scope of this thesis (exclusively to data on the trial)
The ability to make confident final judgments on the
experimental filters performance in a scaled up setting
The ability to adequately determine if there are other
variables that need to be considered
Segmented Trial For safety purposes the trial could not be operating on the weekends
(no supervision) or after hours with no personnel present. This limits
the contact time of the seawater in the filter

12
Background
Seawater Composition
Seawater contains a large diversity of dissolved gases, dissolved solid material, and various species of
biological matter. The main salts found in seawater are shown in the table below. The higher proportioned
ions, namely, chloride, sodium, sulphate, magnesium, calcium, and potassium could be considered
conservative elements (non-reactive) in seawater that is they have constant ratios to one another. Whereas
non-conservative elements, that are proportionally easy to alter in the water column, commonly include
carbon, phosphorous, nitrogen, iron and silicon which can lead to biological or chemical activity (Ocean
Health). Table 3 shows the characteristics of the commonly occurring salts.
Table 3: Ninety-nine percent of the salts found in a typical seawater sample at 3.5 % salinity
(Anthoni, 2006).
Chemical ion Concentration
ppm, mg/kg
Part of
salinity %
Molecular
weight
mmol/
kg
Chloride - Cl 19345 55.03 35.453 546
Sodium - Na 10752 30.59 22.990 468
Sulfate - SO4 2701 7.68 96.062 28.1
Magnesium - Mg 1295 3.68 24.305 53.3
Calcium - Ca 416 1.18 40.078 10.4
Potassium - K 390 1.11 39.098 9.97
Bicarbonate -
HCO3
145 0.41 61.016 2.34
Bromide - Br 66 0.19 79.904 0.83
Borate - BO3 27 0.08 58.808 0.46
Strontium - Sr 13 0.04 87.620 0.09
1
Fluoride - F 1 0.003 18.998 0.068
Desalination pretreatment
The basic function of having a pretreatment system in seawater desalination is to remove the
substances that will clog or shorten the life span of the RO membranes (Moreno and Pinilla, 2004). Many
of the compounds contained in the saline matrix of seawater have a tendency to foul RO membranes.
Prihasto et al. (2009) states feed water with consistent high quality is the key factor to a successful
operation, as poor feed quality can lead to short periods of operation, shortening of RO membrane life,
and high maintenance. Therefore undesirable materials need to be reduced or removed to bring the water
to acceptable levels. These undesirable materials can include oil, sand, clays, bacteria, dissolved organic
matter, and organic and inorganic suspended solids (Seah, 2005).
Contruvo et al. (2010) points out that prefiltration in SWRO is currently implemented by either
conventional water treatment or by membrane technology such as ultra and micro filtration, both of which
serve to protect the RO membranes, reduce particulates, to lengthen life, and improve efficiency of
operation.

13
Figure 1: Streams in typical desalination processes (Water Corporation, 2004).
Conventional pretreatment methods
Conventional treatment can be recognized as a series of solid to liquid separation processes which
utilize coarse filtration, coagulation, flocculation, sedimentation, and finer particulate filtration before
entering the RO membranes (seen in Figure 4). These processes are further discussed in the following
sections.
Seawater intake
There are currently two widely used seawater collection methods; they are open (surface water) and
subsurface intakes. The subsurface intakes tap into an on-shore saline aquifer or off-shore aquifer under
the sea floor. Intakes are typically either vertical or horizontal beach wells with the collected seawater
having been already pretreated via slow subsurface sand/seabed filtration.
Open intakes are commonly constructed for large scale seawater desalination plants and collect
seawater from the ocean via inlet structures then sending it to the plant through intake pipelines. Ocean
intake structures are typically located several hundred to several thousand meters off-shore, at depths of
30 meters or more (Voutchkov, 2010).
Once the seawater has enters the plant via the intakes, the first step is removal of coarse fragments
and large debris. This role traditionally goes to a series of screens often first with bar racks, followed by
automated fine bar or fine-mesh screens. At each successive screen the hole openings for debris decreases
(Voutchkov, 2010).
Coagulation and flocculation
The majority of incoming seawater particles and microorganisms entering the plant need their charge
neutralised from a slightly negative charge (Binnie and Kimber, 2009). This is achieved by coagulation
and is a requirement for effective granular media filtration downstream of conventional pretreatment
systems (Voutchkov, 2010). The primary function of coagulation is to achieve uniform mixing of the
added coagulant (usually ferric salts) with the source seawater and in producing efficient coagulation of
the contained particles. Often coagulation tanks will be mixed by either in-line static mixers or
mechanical flash mixers. Flocculation is further required to cause these neutralised particles to
agglomerate in larger flocs which allow them to be effectively removed in the media filter downstream
(Binnie and Kimber, 2009).

14
With the use of coagulation, overdosing needs to be watched for as it’s one of the main factors for
SWRO mineral fouling downstream. Coagulant dosing is pH dependent and should be adjusted to site
specific conditions.
Granular media filtration
Presently, granular media filtration is the most widely used seawater pretreatment technology to
remove coarse solids such as algae and organic particulates in suspended form. They can be further
classified as gravity or pressure filters, depending on the driving force for the source seawater filtration.
These filters are typically back washed every 24 to 48 hours using filtered seawater or concentrate from
the SWRO process. The waste backwash volume is often between two to five percent of seawater intake,
implying a high recovery rate of ninety five to ninety eight percent (Voutchkov, 2010). Well operated
filters can remove particles as little as 0.2 µm (micron).
Most of the existing pretreatment systems operating today run single-stage or dual granular media
filters and are designed to operate without pre-treatment processes such as dissolved air flotation (DAF)
or sedimentation prior to the media filtration.
Cartridge filtration
Cartridge filters are fine micro filters with a nominal size range of 1 to 25 µm, however
manufacturing breakthroughs have led to filtering particle diameters down to 0.006 micron (Williams and
Edyvean, 1995). Cartridges can be available to handle fluids with viscosities up to 100,000 cP, tolerate
temperatures from near zero to 400 Celsius, and reach pressures up to 200 bar. With such broad ranges
it’s no surprise the diverse range of industries these filters can be found in. There presently exist four
main types of cartridge filters in the market (Cal Water):
String Wound Filter Cartridges
Melt Blown Filter Cartridges
Pleated Filter Cartridges
Media Filter Cartridges
The cartridge filters typically uses materials like polypropylene and often employ replaceable filter
elements. While the Media Cartridges can be made of several materials including activated carbon,
alumina, and DI resin. Typically cartridges are made of generally accepted standard dimensions making
these filters interchangeable to source (Sutherland, 2008).
Figure 2: From ascending order: Melt Blown Cartridge, String wound Cartridge, Pleated Filter
Cartridge, and Media Cartridge filter (Cal Water).

15
In a SWRO plant, cartridge filters are typically installed downstream of the granular media filter to
capture silt, fine sand and particles that could still be contained in the pre-treated seawater following
granular media filtration (Voutchkov, 2010). The cartridges will be suited for high flow and pressure
conditions, and typically come in the form of a melt-blown or string wound cartridge, depending on the
product requirements. In addition, the outer body must be corrosion resistant to the seawater environment.
Clean cartridge filters usually have a pressure drop (differential pressure) as less than 0.2 bar. When
the differential pressure reaches 0.7 to 1 bar the filters are often scheduled for replacement. Operation
time until replacement depends on the level of pretreatment and the seawater quality, however typically
this happens once every 6 to 8 weeks (Voutchkov, 2010).
Figure 3: Micron Cartridge filter assembly at a desalination plant in Israel (Science Photo
Library).
Despite cartridge filters wide spread use, there are still problems reported with this proven technology
in desalination and wastewater treatment. Common issues include: incubation for microorganisms, non-
reusable elements, finite carrying capacity for solid material, and low liquid volumes per cartridge
(NCEDA, 2011). These problems also have led to excessive costs for general maintenance and operation,
for example the cost for labor to replace a pressure vessel each time, the production loss from cartridge
filter downtime, and high turn-over for cartridge element replacement.

16
Figure 4: Typical Conventional Pretreatment versus Membrane Pretreatment in a seawater RO system (Voutchkov, 2010;
WaterOnline, 2006

17
Alternative pretreatment methods
Membrane filtration
In recent years, micro- and ultra-filtration have gradually gained acceptance within the industry as
one of the preferred pretreatment systems of choice in SWRO systems. Ultra filtration (UF) can
removal all suspended particles and some dissolved organics with a typical removal capability of
0.01-0.02 micron. Whereas Microfiltration (MF) operates down to 0.1 to 0.2 micron, an order of
magnitude coarser than UF – giving UF a better disinfection barrier to bacteria and viruses (Pearce,
2007).Typically both systems can produce consistent filtered water with characteristics of turbidity
below 0.1 NTU, SDI levels below 3 over 90 percent of the time, and removal of a number of
pathogens (Prihasto et al., 2007).
All membrane systems have four operational modes: processing, backwash, cleaning, and
integrity testing. These four modes are usually monitored and controlled by a programmable logic
controller (PLC) (Voutchkov, 2010). The pretreatment for membrane systems also typically involves
three main components: coarse and fine screens similar to conventional pretreatment; micro-screens
to remove sharp objects and fine particulates; and finally the UF or MF membrane system. Cartridge
filters are not typically installed with these systems, but some designers still include them to safeguard
the ROs in case particulates are released from membrane fiber breakage. A typical membrane
pretreatment system can be seen in Figure 4.
From an economic stand point, the conventional pretreatment systems have a high operating cost
due to the excess use of chemicals, energy, and filtrate (Prihasto et al., 2009). However where these
systems make up for this loss are from the long lasting design life of the equipment and media, and its
low maintenance requirements. While membrane systems need to be replaced typically 5-10 years for
each unit, requiring a moderate running cost (Prihasto et al., 2009). It should be noted this ignores
other potential factors of MF/UF systems such as the approximate 33 percent space saved from these
systems, and the opportunity to increase RO flux and recovery (Pearce, 2007).
Screen filtration
Screen filters can be defined as filters utilizing rigid or flexible screens as a physical barrier to
particles larger than its openings (Allhands, 2004). Generally these filters are not used for filtering out
organic matter such as algae due to their nature to create spaghetti like strings allowing access through
the filter. Typical screen materials include polypropylene, nylon, polyester, and stainless steel (Mesh
Filtration). In the wastewater industry screen filters were often used to filter out coarser fragments
typically in the range of 100 micron up to 2 inch via mechanical action.
However within the last ten years there has been an advance in manufacturing technology of
woven stainless steel, allowing screen filters utilizing rigid metal elements to filter down to the 1-5
micron level. These metal screens are typically manufactured into either: (1) wedge-wire screens,
having trapezoidal shaped cross-sections parallel to one another. Their openings are long slots, with
the slot width being the nominal filtration degree; or (2) weave wire screens, commonly made as
square-weave or Dutch-weave wire both of which contrast to wedge by their discrete opening
structure. Most screens today use some form of Dutch weave screen, which give a warped three-
dimensional triangle structure and provide more open area (total pore area fluid can pass) at smaller
filtration degrees than a square-weave (Allhands, 2004). See Figure below for a visual comparison.

18
Figure 5: (1) Wedge-wire screens formed by laying steel wires; (2) An example of a Dutch
Weave screen with discrete openings (Allhands, 2004).
As screen filtration began to use smaller micron ratings, one problem became apparent quickly:
the tendency to rapidly clog at the lower filter sizes thus requiring frequent manual cleaning. This
problem was overcome with the increasing use of automatic and semi-automatic cleaning. Automatic
cleaning systems (self-cleaning) typically employ either direct flushing, back-flushing, or forced
back-flushing as their primary cleaning mechanisms (Allhands, 2004).
Automatic cleaning screen filters commonly operate by the following procedure. As water flows
from the inside to the outside of the screen, suspended material is collected on the inside screen
surface. As the silt builds up, this causes the differential pressure to rise. When a pressure of typically
7 psi is reached, the cleaning cycle is triggered and an exhaust valve opens removing filter cake from
the screen and carrying it out of the system. The cleaning cycle consists of a set of suction nozzles
that back flush on less than one square inch of the screen at a time. The nozzles rotate in a spiral
pattern and cover the entire screen in a cleaning cycle that’s typically in the range of 8-20 seconds
depending on the filter used.
Self cleaning screen filters are finding increasing applications in both domestic and industrial
scales. Domestic uses can include removal of sand, pipe scale, rust flakes, and other debris on a well
or municipal line. This can result in irrigation waste treatment, or even protection for faucet aerators,
water softeners, irrigation systems, or even dish washers. While industrial uses have included for the
pretreatment of surface water sources from organic and silt matter, storm water treatment, and
treatment of holding ponds from accumulated matter like bird feathers, algae, suspended solids, or
wind-blown debris.
An example of a recently successful self cleaning screen filter that can match the conventional
cartridge filters in quality is the AMF2 microfiber filter developed by Amiad - a leading screen filter
producer. Its main features include a 20 to 2 micron filtration range, less than 1 percent total flow for
cleaning, 320 m3 per hour maximum flow rate, and proven field history for water treatment (Amiad).
Some examples of its uses are shown below.
19
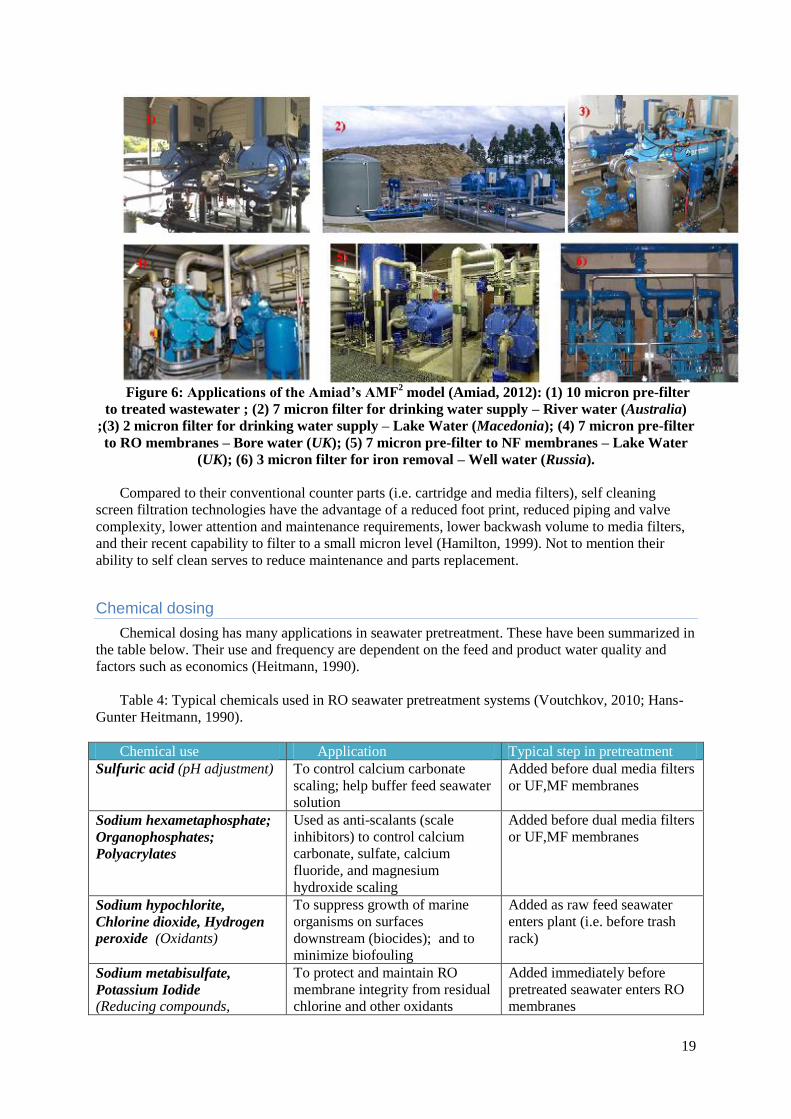
Figure 6: Applications of the Amiad’s AMF
2 model (Amiad, 2012): (1) 10 micron pre-filter
to treated wastewater ; (2) 7 micron filter for drinking water supply – River water (Australia)
;(3) 2 micron filter for drinking water supply – Lake Water (Macedonia); (4) 7 micron pre-filter
to RO membranes – Bore water (UK); (5) 7 micron pre-filter to NF membranes – Lake Water
(UK); (6) 3 micron filter for iron removal – Well water (Russia).
Compared to their conventional counter parts (i.e. cartridge and media filters), self cleaning
screen filtration technologies have the advantage of a reduced foot print, reduced piping and valve
complexity, lower attention and maintenance requirements, lower backwash volume to media filters,
and their recent capability to filter to a small micron level (Hamilton, 1999). Not to mention their
ability to self clean serves to reduce maintenance and parts replacement.
Chemical dosing
Chemical dosing has many applications in seawater pretreatment. These have been summarized in
the table below. Their use and frequency are dependent on the feed and product water quality and
factors such as economics (Heitmann, 1990).
Table 4: Typical chemicals used in RO seawater pretreatment systems (Voutchkov, 2010; Hans-
Gunter Heitmann, 1990).
Chemical use Application Typical step in pretreatment
Sulfuric acid (pH adjustment) To control calcium carbonate
scaling; help buffer feed seawater
solution
Added before dual media filters
or UF,MF membranes
Sodium hexametaphosphate;
Organophosphates;
Polyacrylates
Used as anti-scalants (scale
inhibitors) to control calcium
carbonate, sulfate, calcium
fluoride, and magnesium
hydroxide scaling
Added before dual media filters
or UF,MF membranes
Sodium hypochlorite,
Chlorine dioxide, Hydrogen
peroxide (Oxidants)
To suppress growth of marine
organisms on surfaces
downstream (biocides); and to
minimize biofouling
Added as raw feed seawater
enters plant (i.e. before trash
rack)
Sodium metabisulfate,
Potassium Iodide
(Reducing compounds,
To protect and maintain RO
membrane integrity from residual
chlorine and other oxidants
Added immediately before
pretreated seawater enters RO
membranes

20
Oxidant scavengers)
Coagulants
(Ferric salts)
To neutralize electric charges of
source seawater particles;
encourage agglomeration of
coagulated particles
Added prior to feed entering
the dual-media filters.
Found in conventional seawater
pretreatment systems.
Limits of current pretreatment technology
As Voutchkov (2010) points out, the majority of pre-treatment systems remove most but not all of
the insoluble solids contained in the source seawater and cannot completely prevent some of the
soluble solids from precipitating on the membrane surfaces. Additionally some of the natural organic
materials and silt could still be present in the seawater after pre-treatment and slowly accumulate on
the surface of the SWRO membranes causing loss of membrane productivity over time.
Even the increasingly widespread membrane technology of UF or MF has had its share of
problems. Despite their removal efficiency, they been noted to fall short of removing all the marine
microorganisms or dissolved organics contained in the source water which typically cause SWRO
membrane biofouling. This is most likely due to both the short seawater retention time in the system
rendering any meaningful biofiltration as well as its operating pressure level often above the pressure
threshold of the cell walls of certain microorganisms (Voutchkov 2010). A 2006 study (Kumar et al.
2006) showed the UF systems operating pressure will not rupture algal cell walls if the pressure is
limited down to the threshold of the algal cell rupture (i.e. 0.4 bars). The study also demonstrated that
membrane biofouling was reduced significantly after this procedure was in place.
But the problem also lies with the current technology offered by manufacturers, as Sutzkover-
Gutman and Hassan (2010) puts it, “The general pretreatment goals for various potential fouling
contaminants are partly defined by membrane manufacturers”, thus an effective pretreatment system
always incorporates the short comings of the RO membrane system.
Membrane fouling
While there have been advances in the development of membrane systems for desalination, a
major hurdle for the industry that still remains is the decline in productivity of RO membranes with
time (Kumar et al., 2006). Currently there exists two known mechanisms for this decline; they include
membrane fouling and membrane scaling.
Scaling occurs when in-organics precipitate out of solution in the concentrate stream (salt stream)
and eventually deposit on the RO membranes. Common low-solubility salts known to scale include
calcium carbonate, silica, strontium sulfate, and barium sulfate. Scaling can be controlled by: addition
of scale inhibitors, lowering pH, or by active removal of scalants by nanofiltration pretreatment or
softening (Heitmann, 1990). Whereas fouling can occur due to a number of processes, including:
Biological growth
Deposition of colloidal matter
Remaining suspended solids and silt on surface
Adsorption of organics on the membrane surface
Fouling is also dependent on the number of membrane defects that exist and their location
(Costruvo et al., 2010). According to Flemming et al. (1997), practically all membrane systems that
use water support biofilms, but not all systems will experience excessive formations.
Membrane biofouling is a particularly important problem for Reverse Osmosis systems, as the
attachment of bacteria to membrane surfaces and subsequent growth in RO membrane elements
strongly influence RO system performance and productivity (Vrouwenvelder, Kruithof, and
Loosdrecht, 2011). Additionally, unlike colloidal particles with rigid structures, microorganisms can
have the ability to transverse through pores which are rated to keep their particle diameters out. The
common control practice for biofouling is intermittent chlorine dosing as a biocide agent, however

21
some argue this increases the microorganisms’ resilience (Heitmann, 1990). Whichever method is
employed most agree that the area of biofouling is still largely up for debate. As Bereschenko et al.
(2008) puts it “microbiological and physical processes associated with biofilm formation and
biofouling in these dynamic and high-pressure environments are poorly understood”.

22
Materials and Equipment
Location
The trial will be conducted at the NCEDA pilot plant, located at the North Engineering Building,
Murdoch University Rockingham Campus. The NCEDA facility houses three main feed water tanks,
labeled from A to C, each with a capacity of 36 m3 as well as a service water tank (9 m
3) to allow for
external water carriers or to let mixing of constituent parts achieve a wide range of water
characteristics. All tanks are equipped with level transmitters for control feedback. The feed water is
distributed around the facility by three delivery mains, and a fourth main for service water. The
facility also hosts three groundwater bores readily available for research purposes. The bores include:
a brackish groundwater well at 40 - 46m, seawater well at 79 - 85 meters, and deep well at around 107
- 112 meters for reinjection from the product or brine water sumps (CH2MHILL, 2011). The location
of each well is seen in Appendix C.
For the trial we will use one Feed Tank for the feedwater, and another for the filtered water which
will subsequently be directed to a product sump at the end of each session.
Figure 7: Picture of Tank B and other tanks at NCEDA Facility.
Each of the three feed tanks have their own pressure pump, level gauge, and pressure gauge after
the pump. Each pressure pump is rated to 16 m3/hour flow and can run up to 1305 PSI (see Appendix
A for more of it features). A picture of Tank B’s pump is provided below. The pumps can be operated
either through the SCADA system or manually. Each feed tank is connected to both the fresh water
and seawater bore pumps and all three have a by-pass valve installed.
Figure 8: Feed Pump for Tank B - Grundfos model CRT 16-4.

23
Plant Control
The plant can be run manually or by automation. The plant uses a SCADA system by SAGE
Automation allowing either part manual or full automated control. The SCADA system can also allow
manual open/close of each actuating valve when the facility is set to manual. Measurable parameters
from the feed tanks available for the automation system to display include: conductivity, pressure, and
tank water level.
Our use of the SCADA system would be in regulating a set feed pressure, tank filling via the two
extraction bores, feed water transfer through the CRT pumps, brine/product water pumping into the
re-injection bore and having the option of using by-pass valves for tank recirculation.

24
Materials
Forsta Filter unit
The Forsta Filter was designed and manufactured by Forsta Filter™ in California, U.S.A and
shipped to the NCEDA in late 2011. Included with the filter was: Solenoid air valve, Air actuator
flush valve, Air lines, Differential Pressure Gauge and Backwash controller. These components are
shown below and are expanded upon in further sections.
Figure 9: Included parts with filter. From left-to-right: Air Actuator; Solenoid valve;
Backwash Controller; Differential Pressure Gauge.
The filter unit itself is composed of several elements. These are the filter housing, 5 micron mesh
screen, piston, Screen o-rings, suction nozzles, and housing seal. These can be seen in the following
figure. A detailed cross-section of the filter and its material is under Appendix A.
Figure 10: Filter unit taken apart into its individual units.
The Filter uses 2 inch fittings (50 mm) for its inlet and outlet points, therefore the pipes and
fittings used in the trial could follow this pipe size otherwise reducing fittings are needed.

25
Filter Fine Screen mesh: Monel 400
The filter screen shown in Figure 10 is made from the nickel copper alloy known as Monel 400.
The alloy contains around 60-70% Nickel, 20-29% Copper, and small amounts of iron, manganese,
silicon, and carbon (Special Metals Corporation).
Monel has already been used extensively in many applications such as chemical processing
equipment, gasoline and freshwater tanks, crude petroleum stills, propeller shafts, and marine fixtures
and fasteners.
Among its key characteristics, include (Mega Mex, 2010):
Excellent resistance to neutral and alkali salts
Low corrosion rate in fast flowing brackish or seawater
Good mechanical properties from sub-zero temperatures up to 543 °C
Good corrosion resistance to reducing environments, but poor in oxidising ones
In regards to its application in seawater, its strengths lie in a high resistance to alkali salts such as
magnesium and calcium and its copper content providing some protection against biofouling due to
coppers toxic properties. Its high nickel content is responsible for its corrosion resistance to fast
flowing seawater, however in stagnant conditions this is a different story. A comparative study on the
corrosion of Monel 400 in 3.5% Sodium Chloride solution showed the alloy under stagnant conditions
became susceptible to pitting and crevice corrosion attack (Sherif et al., 2012). In essence, Monel 400
offers about the same corrosion resistance as nickel but with a higher maximum working pressure and
temperature and at a lower cost due to the machining process (Mega Mex, 2010).
EC-2 Backwash Controller
The backwash controller used for the trial, provided by Forsta Filter, is designed to monitor and
activate a cleaning cycle for a single or dual filter configuration. The controller can: adjust the flush
duration, the dwell time between backwashes, choose to use either a differential pressure or periodic
timer to initiate backwash, and the option to connect an alarm when there are three consecutive
backwashes or more (Forsta Filter). Other features include the ability for a manual start, and to reset
either the counter or the alarm.
The conventional practice is for the backwash controller to be listening for an open/closed signal
via two terminals (labeled P and D) from the differential pressure gauge. Once a preset value is
reached, by default 7 PSID, the controller will send a signal to the solenoid valve which will initiate
the opening of the flush valve. This flush valve remains open for the length set on the flush duration
dial found on the controller. The preset differential pressure (dP) value needs to be registered by the
controller for 30 seconds before it sends the signal to the solenoid valve.
The solenoid valve is connected to the 1 and W terminal on the controller box (see Figure 11),
with the current sent from the controller to open/close the valve occurring via the 1 terminal. In this
way, the backwash sequence occurs by energizing terminal 1 for the set flush duration.

26
Figure 11: Control box of Backwash controller (Forsta Filter).
Experimental Setup components
The final components comprised in the set up are included in the table below. The table is divided
between components in the NCEDA facility, and the parts required for the setup.
Table 5: Components comprised in the trial.
Component
Experimental Setup
Components
Forsta Filter inc. 5 micron screen
Schedule 80 PVC pipe, fittings,
and various valves
EC-2 Backwash Controller
Solenoid valve
Flush valve (air actuator)
Air compressor
Campbell Scientific Data Logger
0-6 bar Pressure transmitters
0-800 kPa Pressure gauges
Metal Skid for structural support
NCEDA facility
components
SCADA automation system
50 mm feed, waste, product pipe
lines
Product Water and Brine waste
Sumps
Feed Tanks and service water
Tank
Grundfos CRT Feed pump
Freshwater and SW bores and
bore pumps
Other items include cam lock fittings to plug the inlet/outlet points for the experimental setup
when not in use, and when in use, two inch tubing was required to connect the experimental setup to
the facility’s pipe lines.

27
Data Logger: Campbell Scientific CR200X
The data logger will be a Campbell Scientific Logger model CR200X, known as the cost effective
solution in the Campbell Scientific series. Relevant features include a sealed rechargeable battery, a
scan rate to once per second, logging up to 8 tables, and the ability to record up to 128,000 data points
(or 512 kilobytes flash memory). Some of the Campbell CR200X model’s features are also included
in appendix A with a visual of the data logger seen in Figure 12.
Figure 12: The Campbell Scientific CR200X Datalogger (Campbell Scientific).
The data logger will be placed alongside the experimental setup, enclosed in a water proof case.
The logger has five available analog inputs for the filter setup. At the end of each session, the
procedure would be to connect up a laptop to obtain the day’s worth of data for analysis.

28
Methods
The goal of the project was to design an experimental setup to accurately assess the effectiveness
of the Forsta Filter - in particular, the filtration system needed to be assessed by its feed and product
water quality and its structural integrity over time.
Experimental Design
The Experimental setup had several key points in its design:
1. To allow feed water to flow through the filter producing filtered product water, and waste
water from the backwash (Figure 13)
2. To follow any manufacturers requirements that if left unchecked can influence the filters
performance or efficiency
3. To have the ability to sample water from inlet and outlet points
4. To take the Forsta Filter apart for physical inspection and maintenance
5. To log data from measurable parameters
6. To visually see the flow rate through the system
Figure 13: Principle of Filter in Trial.
Point 1
This meant our design needed to prevent any obstructions of flow and to avoid allowing stagnant
water areas to build up, thus maintain a high hydraulic efficiency. Stagnant areas can allow space for
biofilms to develop and give inaccurate representations of the true water quality throughout the
system. Turbulent flows were also considered as they help avoid this phenomenon. Turbulent flow is
when a certain critical velocity is exceeded causing the streamlines to break up and mixing of the fluid
occurs (Dunn).
Point 2
The second point lead to observing the significant points in the Forsta filters operation and
installation manual which are key to its effective operation. The manufacturer’s specific requirements
that needed to be met were:
Minimum system backpressure of 40 PSI (280 kPa)
No backpressure on flush line: includes preventing elevation
Use of differential pressure gauge to initiate backwash
By-pass valve installed for maintenance of filter
The Filters rated specifications are shown below.

29
Table 6: Key Characteristics of Forsta Filter (Forsta Filter)
Characteristic Output
Maximum flow rate 378 L/min; 22kL/h
Minimum system pressure 40 psi 278 kPa
Maximum system pressure 150 psi 1050 kPa
Weight 20 lbs
Screen area 0.4 sq ft 0.04 sq m
Backwash volume 8 to 12 litres per wash
Filter Screen 5 µm Dutch wedge-wire
(Monel 400)
The air actuator flush valve and air based solenoid valve included with the Filter from California,
suggested the manufacturer wanted our trial to use these components within the experimental set up,
therefore our system for opening the air flush valve would be a pneumatic run system. This resulted in
obtaining an air compressor (see below) that can run at the air flush valves required pressure.
Figure 14: Air compressor used in the trial’s Experimental Setup.
The solenoid valve and air flush valve are exclusively for the filters backwash system. The system
works by having the air compressor connected to a pressure regulator that’s connected to the solenoid
valve. This allows a stream of air available for use for the solenoid input at the required flush valve
pressure. The Solenoid output air line is connected to the air flush valve. Once current is sent to the
solenoid valve from the backwash controller, this opens the solenoid valve output, allowing air
pressure to reach the air flush valve, thus initiating the filters backwash system by opening the flush
line. See figure below.

30
Figure 15: Setup of Solenoid-Compressor Backwash system.
The air compressor maintains a working pressure of 115 PSI, while the air flush valve needs a
working pressure of 50-80 PSI to release the spring from closed position. This necessitated in the use
of a pressure regulator installed on the compressor, set to 50 PSI.
Point 3
The ability to have sample points is important to obtain composite water samples. The fittings for
the sample points should reduce the flow at intake and to avoid wastage of water. Where possible, the
sample points should be positioned to prevent stagnant water areas to build up.
Point 4
The filter housing consists of a top and bottom half that are held together by a tightly wound
clamp. To look inside the filter one simply needs to only take off the clamp. However to completely
remove the filter from the system meant our setup needed union fittings at the inlet and outlet points.
Point 5
The data will be logged by a Campbell Scientific logger. Its measurable parameters will be
discussed in further sections.
Point 6
To visually see the systems flow rate resulted in including a Rotameter in the design. Rotameters
are devices which measure the flow rate of a liquid or gas, and use a shaped weight (or ‘float’) that’s
pushed up by the drag force which is a function of flow speed. Rotameters were used instead of
electronic flow sensors to show the water behavior as it enters the system, for example to visually
assess if there are air bubbles coming through or not.
These points lead to the final design seen in the next Figure.

31
Figure 16: P&ID of Experimental Setup.
The design above shows several key features:
The backwash system is a compressor-solenoid-air flush valve system activated solely by the
controllers input and run by air pressure
There is one feed line, and two product lines. One product line is the ongoing filtered water
while the other is the backwash water which comes out intermittently
The by-pass system is there as standard practice. Its use will be for flushing and when
starting up the system
There are two sample valves, one for influent and the other for the filtered effluent
The differential pressure gauge, and both sample valves have the potential for data logging
At this point in the design, the sizing of the setup was not considered. Instead the setup above was
used as a guideline for the implementation stage further on when system pipe size and sizing is
implemented.
System Design
The system design is about how the trial runs as a complete system at the NCEDA pilot plant
facility. This includes in relation to the product and feed lines, pump efficiency, system pressure, and
design flow rate.
Feed water
The feed water will be hosted by Tank A which has a capacity to hold 36 m3 of water. The system
can be configured for recirculation and each tank can be in connected in series for further capacity.
The feed water from the PSDP will be transported via a water carrier which will deliver around 12
cubic meters and will be fed into Tank A via its external feed pipe line.

32
System Pressure
The system backpressure needs to maintain at least 278 kPa (40 PSI) for proper filter operation.
To attain this pressure requires both adjusting the speed of the Grundfos CRT Feed pump (via
SCADA system) and manually manipulating valves between the feed tank and product water valves
in the setup. The two major valves to help regulate the backpressure are the Tank A recirculation
valve and the filtered water valve fitted in the filter setup prior to entering the product sump pipelines.
The idea will be to partially close one and/or other to increase the pressure until the pressure gauges
on the filter setup show the desired reading. The use of manual valves also assist to reduce the load on
the feed pump. Natural pressure losses from pipelines and fittings should also be accounted for in the
process.
Feed Pump
The Grundfos Feed pump is rated up to 1305 PSI pressure and 16,000 m3/hour flow. But like all
pumps, they have an optimal efficiency point. A pump efficiency curve of the Grundfos pump was
prepared from the manufacturer’s software package, as shown below.
Figure 17: Predicted efficiency curve of Grundfos pump.
The curve shows the pump runs best at around 60 percent, which consumes roughly 2.3 kilowatts.
This means running past 60 percent you’re likely to get a decreasing output rate as the efficiency
decreases. Therefore during the trial the pump should be run within this range of efficiency.
Product water
The product water will be sent to the product water sump where it will be re-injected into the
ground at the end of each day. The pressure from Tank A’s feed pump will have sufficient force to
move the product water from the filter to the product sump provided the correct valves and pipe lines
are opened.
The Service tank may be used for flushing the system of seawater after each session or optionally
the filter screen is manually removed and cleaned in distilled water. The service tank is connected to
the mains water supply and flushing will most likely only need to occur for several minutes.

33
System design flow rate
The design flow rate for the system was worked out to be 4.5 kL/hour, while the filter system
back pressure must remain at 40 PSI (278 kPa) or above. The figure below gives an idea how the
system should operate.
Figure 18: System process for trial.

34
Forsta Filter: Mode of operation
The Forsta filter setup can be classified into normal operation of filtering water, and its backwash
cycle when the screen begins to plug. Their explanations are displayed below.
Normal operation: Dirty water will enter through the inlet, then travel through the center of the
filter where it’s strained across the fine mesh screen from inside to outside of the screen. As this
occurs, suspended particles become trapped and continue to build up. This build up creates a pressure
drop at the outlet of the filter, and increasing the resistance for the inlet water. Eventually this
difference in pressure steadily rises until it reaches a preset value of 7 psi that is registered on the
differential pressure gauge. This then sends a signal to the backwash controller to initiate a backwash
cycle.
Backwash cycle: The controller sends a signal to the solenoid valve, which opens after receiving
an electrical current from the controller. This electrical signal from controller-to-solenoid lasts for the
preset flush duration found on the controller. The solenoid valve is connected to the air flush valve
which relies on the solenoid valves output of 50 psi air to open from a normally closed position. The
open solenoid results in an opened air flush valve. With the flush valve open, this causes a drop in
pressure in the hydraulic motor chamber. The pressure drop causes a low pressure path inside the
particle remover which acts as a vacuum at the end of its suction nozzles, removing the built up
suspended particles from inside the fine screen. The hydraulic motor rotates the suction nozzles
allowing each suction nozzle to cover a radial strip of the screen. During the backwash cycle the
piston moves upwards and expels the volume of water from its chamber. Once the piston reaches the
end of its stroke, the controller should align its flush duration for this length of time. Once the flush
duration is reached, the electrical signal to the solenoid ceases, thus closing the flush valve. As the
cycle finishes the pressure inside the hydraulic motor chamber normalizes with the piston pushing the
particle remover back down to its original position during normal operation. Once the piston and
particle remover are back in their original positions then the filter returns to its normal operation. The
backwash process can be shown in Figure 19 below.
Note: During the backwash cycle the main flow through the filter is never disrupted.

35
Figure 19: The backwash cycle: 1) A signal is sent from controller to open the solenoid
valve; 2) The solenoid valve opens allowing air pressure to open the flush valve; 3) The opened
flush valve lets backwash water flow through the line. A suction force from the low pressure
raises the piston thus initiates the particle remover; 4) After the flush duration, the controller
ceases the signal to the solenoid valve thus the backwash cycle finishes.
Feed water: Polished Seawater
The feed water used for the trial will be from the Perth Seawater Desalination Plant (PSDP) in
Kwinana, Western Australia. The PSDP runs a conventional pretreatment system for seawater found
at Cockburn Sound (see ‘Background’). The water quality can be regarded as fairly high, given the
effluent is from industrial dual media filters. Dual media filters are known for product water
containing between 1 to 0.5 NTU turbidity and low level suspended solids. The feedwater amount
received is expected to be around 12-15 m3, around half the volume for one NCEDA feed tank.
During the trial the feed water needs to be sampled soon after arriving at the NCEDA to get a
valid representative sample from the Perth desalination plant. It’s expected over time that the
chemical and biological composition of the water will naturally change due to the different conditions
it will experience in a tank, rather than in a fast flowing water treatment facility. However given the
relatively small length of time for the trial, seawater degradation should not be an immediate issue.
To avoid contamination, the tank to host the seawater needs to be thoroughly flushed from any
residue from previous uses (unless higher fouled water is desired). Additionally, during the beginning
of each session the seawater should be thoroughly mixed to put particles back in suspension that
would settle over night. This could be achieved through tank recirculation.
Seawater feed that has been kept greater than a month might lead to fairly different chemical and
biological compositions forming in the tank from its original state on arrival, but this will need to be
further judged at the time.

36
Sampling Parameters
The Sampling parameters in the trial were divided into: water quality, backwash frequency,
temperature and measurable pressures in the system. These are discussed in the coming parts.
Water quality parameters
Water quality parameters included in the trial were: Turbidity, Conductivity, and Silt Density
Index (SDI). The desired effluent water quality from the Screen filter is shown in Table 7. This could
be considered a goal to attain for water quality. The values represent a general requirement expected
before entering the Reverse Osmosis Membranes in seawater desalination.
Table 7: General requirements before entering Reverse Osmosis membranes
Parameter General requirement
Turbidity < 1 NTU
Total Organic Carbon
(TOC)
< 5 mg/l
Particle size > 5 micron
Silt Density Index
(SDI)
< 5
Total Dissolved Solids < 50,000 mg/l
The water sampling will occur from the two sample valves to assess the influent and effluent
quality. Water Sampling will be done by local measurement and from expert analysis from a third
party source for any parameters unable to be measured on site. Onsite testing includes turbidity,
conductivity, and SDI testing at a frequency of every 30 minutes. The third party testing will occur
once at the beginning of the trial and once near the end. This will only occur twice partly from cost,
and to signify if any changes have occurred to water quality over the course of the trial. Expert
analysis will include further water quality parameters such as Total dissolved solids (TDS), Hardness,
Total Organic Carbon (TOC) and Total suspended solids (TSS).
Turbidity
Turbidity is a measurement of the amount of scattered light absorbed by particles and is a good
indicator of RO fouling potential (CSM). It’s measurement requires the use of either a nephelometer
or Jackson turbidimeter and is typically read in nephelometric turbidity units, NTU. Values greater
than 1 tend to foul membranes, however this value is only a general indicator. There have been some
membranes foulants reported which do not scatter light to register a turbidity reading, such as
surfactants and soluble polymers (CSM). A Turbidity meter will be provided by the NCEDA for this
trial.
Silt Density Index
The Silt Density Index (SDI), also known as the Fouling Index, is a good measure of water
quality and of particular importance in determining the colloidal fouling potential of RO feed water.
The SDI test measures the rate at which a 0.45 micron filter is plugged when subjected to a constant
pressure of 30 psi. An SDI less than 5 is considered acceptable for many reverse osmosis systems and
indicates the membranes should foul at very low rates. A SDI kit will be provided by the NCEDA for
this trial.
Conductivity
Conductivity is a measure of the ability of an aqueous solution to hold an electric current. Its
measure is dependent on the presence of ions, their concentrations, mobility and valence (American

37
Water Works Association, 2003). The feed seawater is expected to have a high conductivity and
should not change drastically during the course of the trial. Its function will be as a monitoring tool
for any significant changes caused by environmental or internal factors.
Temperature
Temperature will be recorded manually with the conductivity meter. Hence its frequency will be
with each conductivity sample. Temperature plays a significant role in influencing water quality
however we anticipate its rate of change to be quite low considering the high volume of water used
and the feed tank’s insulation capacity from the external environment.
Physical Deterioration
Fouling
Foulants can be divided into non-living (i.e. inorganic or organic) and living (i.e. biofouling).
Seawater naturally contains many ions and constituents available for fouling on exposed surfaces.
Fouling will be visually expected in the filter after each session. This will involve manually taking
apart the filter housing to visually assess if there has been any biofilm accumulation. To avoid further
biofouling in the feed tank or anaerobic conditions to occur, before each session the tank should be
aerated prior to entering the filter.
Other parameters mentioned can help assess the level of fouling during the trial. These are SDI
and turbidity as both are known as fouling indicators. Turbidity greater than one and an SDI greater
than five would indicate there’s an increased rate of fouling on the screen, signifying more particles
available for chemical reaction or for providing additional food sources for microorganisms.
Corrosion
Corrosion is the response of metallic material interacting with its environment, and in most cases
is of an electro chemical nature (Aquafit4life, 2010). The type of corrosion expected to be found in
the trial will be electrochemical and chemical corrosion. Electrochemical corrosion involves the flow
of electrons between cathodic and anodic areas of the metallic surface and will always appear when a
metal comes in contact with electrically conductive fluid, such as seawater. Whereas chemical
corrosion is the chemical modification of metals due to acids, alkalis, gases and salt solutions
(Aquafit4life, 2010). Thus both types of corrosion are commonly found in seawater environments.
Corrosion will be assessed via the same method as fouling – visual inspection. Areas to look for
may include threads, surface deposits, and around clamps. Inspection should also include looking for
any crevices or pits forming to any surfaces. The inspection will be constricted to the filter screen and
filter housing. All other fittings are PVC-u, making them irrelevant to forms of corrosion.
Corrosion is conventionally measured by parameters such as corrosion potential and polarization
resistance (Sherif et al., 2012), however the equipment available for these parameters is not readily
available for use at NCEDA, therefore we have limited corrosion measurements by visual assessment.
Pressure
The three main pressures we’re interested in are the inlet, outlet, and differential pressure in the
filter system. The purpose of measuring pressure is look for any patterns in the headloss as the filter
begins to plug between each backwash. A clean filter should result in similar pressures for the inlet
and outlet whereas a plugged filter will have a greater difference between them, i.e. high differential
pressure. This will be most noticeable for example straight before and after each backwash.
Flow rate is also related to pressure. An increased headloss should also signify a changed flow
rate from the filtered water. This could be verified from the outlet and inlet sample valves by
measuring their flow rate with a bucket and stopwatch.
Pressure will be recorded by visually reading the pressure gauges and by electronic pressure
transmitters sending signals to the data logger. The transmitters used are WIKA Type 10 pressure
sensors, running between 0 to 6 bar (0 to 600 kPa) and will need 4 - 20 milliamps of current.

38
Figure 20: Wika 0-6 bar pressure transmitter used in the trial.
Backwashing
Each time a backwash commences for the filter, this is added to the controller counter. We are
interested in the frequency of this occurring. The frequency is important in helping to determine the
effectiveness and versatility of the filter screens performance over time. During the trial the frequency
will decrease, increase or stay static. Each case says something different about the filters performance.
If for example, the frequency increases this could show the screen is being continually plugged by the
change in water quality or the differential pressure after each backwash is beginning to increase,
shortening the time for each backwash. Thus the water quality will also have a relationship between
the frequency.
Measurement and Logging
The sampling parameters will be measured either manually (analog) or automatically logged by a
defined frequency. The data logger will record the differential pressure, inlet and outlet pressures, and
frequency of backwashes. At the end of each session, the data will be collected and analysed. The
table below shows how each parameter is likely to be measured and their intervals for recording.
Table 8: Variables to be logged during trial.
Variable Frequency Function of being
logged
Input
Frequency of
backwashing
Every backwash
initiated by controller
To show any change
from normal operation
Digital: Logged via
controller
Inlet and outlet
pressure
Every minute To show any change
from normal operation
Digital: Logged via
pressure sensors
Differential pressure Every minute To show any change
from normal operation
Digital: Logged via
controller
Temperature Every 30 minutes Important variable -
related to fouling and
water quality. But not
likely to change
dramatically.
Analog: With
every conductivity
sample
Water Quality
(on site) Turbidity
Conductivity
SDI
Every 30 minutes To show any change
from normal operation
Analog: With water
sampling equipment
Water Quality
(3rd
party) TDS, TSS, Hardness,
TOC, common ions
Twice over trial -
Beginning and end
To show any change
from normal operation
Analysed in lab
Fouling and Corrosion
rate
At the end of each
trial day
To show fouling
and corrosion events
Analog: Visual
assessment

39
Parameters to influence results
During the trial we were also aware of areas which could lessen consistency. The desire was to
eliminate conditions that can skew results. The four main parameters that could be influencing factors
are temperature, stagnant water, system pressure and most importantly human error in measurement.
These points and their control measures are shown in Table 9.
Table 9: Parameters with potential to influence results and their control measure.
Parameter Rationale Control Measure
Water Temperature
Temperature influences
conductivity, biological
activity, corrosion, and
general chemical constituents
in water
Ensure the tank in use is full of
water (lessens variation) and
properly insulated from the
environment
Filter’s exposure to stagnant
seawater
The filters screen’s steel alloy
(Monel 400) is susceptible to
corrosion attack in stagnant
seawater
Ensure flushing of filter after
each session with clean water
Consistent system pressure Variable pressures influences
the differential pressure and
thus influences trial
performance
Maintain controller and pilot
plant SCADA are operating
properly and configured to set
parameters
Human error in measurements Two different participants
could go about measuring in
two different ways; not
consistent in method
Digitally log as many parameters
as available ; write or make
aware set procedures in
measuring human measured
parameters
Assumptions and Limitations of Trial
The assumptions for the trial were derived from the corrosion resistance of Monel 400 in the
filter’s fine screen, and the composition of seawater.
As mentioned in materials, the Monel 400 is a nickel alloy that is known for its low corrosion
resistance to stagnant seawater and in oxidation environments. Depending on how the Monel 400
screen corrodes and at what rate, this could result in several outcomes including a lower water quality
as the fine wedge wire mesh corrodes away (enabling more suspended solids through), but also to
develop a new surface area for the biofilms to establish in the corroded areas, which could lead to
permanently higher differential pressures after each backwash.
Table 10: Assumptions for the Trial.
Trial Assumptions Comment
Increased backwash frequency over time As corrosion and fouling occurs, differential
pressure after backwashing will gradually
increase – thus increasing times to backwash per
unit time
Differential pressure immediately after
backwash will increase over time
As stated above. Degradation of the Monel
material is expected to decrease outlet pressure
and clog screen
Lower and/or variable quality filtered product
water over time
As the screen begins to corrode and accumulate
bio-solids this allows the screen to serve as a
chemical and biological reactor. Influencing
effluent water quality

40
The Monel 400 Filter Screen will corrode over
time
Given Monel’s material composition and past
history. The rate of corrosion is expected to
increase but by how much is unknown
Fouling will occur over time (assisted by
corrosion)
As stated above, the corrosion rate could assist in
creating new areas for microorganisms to
incubate
The limitations in the trial are seen in the table below. However the most significant limitation
was time. The trial was expected to run over the assessment period at least for several weeks to gain
some credible data on filter performance. The parts for building the filter setup came weeks later than
expected. Therefore our trial is expected to only begin official testing close to the end of the
university assessment period, if at all. Like most trials, there is never enough resources to record the
all the parameters you want. This trial is no exception, with a constriction on the frequency for a
detailed water analysis, and other parameters which could provide useful. According to Hamilton,
(1998), particle counters are an excellent source on monitoring a screen filters performance. Particle
counters detect and count particles from both the inlet and outlet points and would have been a
valuable tool for filter performance.
Table 11: Limitations during trial.
Trial Limitations Comment
Time Will influence reliability of results obtained
Parameters to be sampled Other useful parameters could be: (as mentioned)
particle counters; material studies: i.e. setup
independent Monel metal strip exposed to feed
No parallel trials for direct comparable studies Includes setting up another type of filter run in
parallel to the Forsta Filter using same feed.
Compare output e.g. fouling, water quality, and
so on
Frequency of comprehensive Water Analysis
Testing
Detailed analysis of the water quality is limited to
two samples. This gives a less accurate picture
with gaps of what has occurred in between

41
Implementation
Building the design included the procurement of parts from several trusted manufacturers for the
NCEDA, then connecting the pieces together. While constructing the filter system, proper safe work
practices needed to be kept in mind which led to the creation of a Job Safety Analysis (JSA) seen in
Appendix E. The implementation consisted of three stages.
The First stage was first finding the right pipe size for the setup then constructing the setup
including its fittings, pipes and valves. The material list in the setup is included below, with more
detailed table seen in the appendices. The system pipe size chosen was 1 ½” (40mm), and
subsequently required some reducer fittings given the filters outlets were of 2” (50mm). Once the
piping matched the required lengths, pipes and fittings were primed then glued together. The
experimental setup dimensions measured to be around 1.3m length, and 0.4m high.
At this point the controller and backwash system was not included; the primary focus was finding
the right distances between each element in the design.
Figure 21: Left to right – the piping measured and cut as required; the general setup for the
filters inlet and outlet points, note the pink-taped threaded fittings are reduced to 40mm.
Table 12: Material component and quantity.
Material part Quantity
90 series Forsta Filter unit 1
Schedule 80 PVC fittings
(¼” – 2”)
>20
Schedule 80 PVC pipe (1 ½”) ≤ 7 meters
Rotameter (0 – 10kL) 1
Pressure gauges (0 – 800 kPa) 2
Differential pressure gauge
(0 – 20 PSID)
1
Wika 0-6 bar pressure
transmitters
2
Valves
Globe valve
1
Sample valve 2
By-pass valve 1
Solenoid valve 1
Standard ball valve 2
Air flush valve 1

42
Figure 22: Comparison of the Manufacturers arrangement and the implemented design for
the trial (Forsta Filter).
The second stage was constructing the skid for supporting the filter system. This included welding
the cut pieces of metal together then zinc coating them to prevent corrosion. The next step was
clamping the freshly built filter setup onto the skid. As seen in the following figures.
Figure 23: The different stages of welding the skid and placing the filter setup onto it.
The final stage was finding a suitable method of localising the backwash controller, solenoid
valve, and differential pressure gauge altogether. The final result was using a cut piece of plywood
and securing each element with drilled holes, bolts and cable ties. The electrical wiring was taped and
put in insulation tubing to prevent exposure to water and as good practice.

43
Figure 24: The controller, solenoid valve, and different pressure gauge mounted on a
wooden board above the setup.
Once all the parts were mounted, the next step was testing the setup for leaks and checking its
structural integrity. This step is expanded upon in preliminary testing, under results and discussion.
Figure 25: The completed filter system setup with key features labeled.

44
Results and Discussion
The trial was unable to go ahead in the time allocated in the university semester period, therefore
there were no results able to be recorded. However included in this section is the preliminary testing
of the system which was conducted soon after the end of construction. A detailed section on issues
found in the project leading to an inability to conduct testing is seen in Appendix F.
Preliminary Testing
Results
The preliminary testing had several goals in mind. These were:
1. Test physical integrity of system for first feed run
2. Determine if there is turbulent flow through the system
3. Attain a minimum system back pressure of 40 PSI (278 kPa)
4. Achieve Filters design function of filtering particulates greater than 5 micron
5. Use of the automated backwash system and determine its backwash volume
6. Determine the length of time a backwash cycle occurs (for a raised piston)
The testing does not however assess the effectiveness of the screen filter, instead the results will
indicate whether the system works as a whole and if the filter can provide its basic function. A
detailed commentary on the preliminary testing implementation and the results is in appendix D.
A Summary of how these goals progressed is shown below.
Table 13: Preliminary goals and findings.
Goal 1 The system performed its function, with some minor leaks observed. Feed
water entered, product water exited, and backwashing occurred
Goal 2 The final flow rate was 5 kL/h, following the equation in appendix D, the
velocity in the 40 mm pipe was 1.1 m/s which is less than 1.5 m/s - thus the
flow is not turbulent. It’s flow rate is expected to be less than its rated output
given the 5 micron screen resistance
Goal 3 The system pressure was roughly 280 kPA (43 psi) according to the pressure
gauges
Goal 4 Backwash cycles occurred during the trial – hence filtration of particles > 5
micron occurred
Goal 5 The automated backwash system performed well. Its backwash volume was
estimated at 5.5 L/per wash (see appendix D for calculation)
Goal 6 The length of time for a raised piston was 4 seconds - one backwash cycle
The Testing also had several sampling parameters to record for one session. In 15 minute
intervals were; conductivity, temperature, inlet and outlet pressures, and the differential pressure. At
the time of testing neither a turbidity meter nor an SDI kit was available for use. The time for each
backwash was recorded on an individual basis to find its frequency. Each sample was logged
manually by hand which for the purposes for preliminary testing was not a significant factor. At this
stage the data logger was not yet ready for use. The entire session lasted for around 4 hours and the
initial manual recording occurred soon after the system was running.
The results showed the temperature stayed consistent, but the differential pressure and
conductivity over the 15 minute intervals showed some interesting trends. Both figures below show
the sampled parameter against time, the length of the testing session.
The conductivity shown below in Figure 26 kept increasing but gradually evened out after around
2 hours of logging. The conductivity was measured in milli-Siemens (mS).

45
Figure 26: Conductivity recorded over a preliminary testing session.
Whereas the differential pressure showed a decreasing trend in frequency over the trialing period.
As the figure shows below, from around half way the recorded points are not as sharp increases
compared to the first two hours of sampling.
Figure 27: Differential pressure recorded at a preliminary testing session.
0.00
0.50
1.00
1.50
2.00
2.50
3.00
3.50
4.00
4.50
Co
nd
uct
ivit
y (
mS
/m)
0
1
2
3
4
5
6
7
8
dP
(P
SID
)

46
Discussion
The conductivity was rising but began to gradually level off. Because both tanks were connected,
the feed and the product water, it’s inevitable the constituents in the water will be mixed up, and
coupled with the recirculation system there would be a high level of mixing occurring in the system.
But the leveling off suggests at that point the majority of each tank has been thoroughly mixed
containing similar concentrations of dissolved solids.
The differential pressure immediately backwashing early on in the session suggests a potential
build up of solid residue or biofouling has occurred in the feed tank or piping, with those particulates
being the first through the filter. The decrease in frequency is also another inevitable outcome from
having two tanks connected in series, because the feed water is allowed to be continually cleaner after
each filter run. However the outcome in this test was not exclusively to test the filter alone therefore
the results were not considered a problem, if anything it shows the filtration screen is effective.
On the whole the preliminary testing achieved its goals, and proved the design works well
provided all parts are used correctly. Points to work on for the official trial testing include achieving
turbulent flow through the system, fully functional data logging, and ensuring each fitting is free from
leaks.
Evaluation of full-scale design (projected)
The evaluation of the full scale design was required as part of the project’s second goal, to assess
the scalability of the Forsta Filter in a seawater desalination plant environment. With the absence of
performance data, this evaluation is highly constricted but what follows is the general guideline in
how to go about assessing the Forsta Filter’s scalability and in how it stacks up against its cartridge
counter parts. To evaluate for a full scale design, three main factors were considered:
Footprint in plant
Corrosion potential
Filtration area for required flow rate
Cost was another factor to be considered but was decided not to be included due to the lack of
data. The Footprint in the plant refers to how much space the filter(s) would take up in an industrial
plant to achieve the plant’s required system flow and pressure. To work out the foot print a knowledge
of the filters dimensions and extra piping used for its influent/waste is required. The footprint is
naturally related to the filtration area of the filter, as the filtration area determines roughly how many
filters are required for plant production. While the corrosion potential is a more tricky issue to tackle,
and refers to what material the filter screen and housing are using and their positioning in the system.
For example a certain steel alloy might work well on its own, but installed next to another less noble
metal (e.g. the alloy in a newly installed valve), galvanic corrosion might occur at rapid rates.
The evaluation will specifically compare the Forsta filter used in this report, with Melt blown
cartridge filters used at the Perth Seawater Desalination Plant (PSDP). The PSDP has kindly sent
some data on cartridge filter performance in its conventional pretreatment process. This evaluation
guide does not account for other variations of the Forsta Filter series, which may output different
results.
Sizing
To size the Forsta filter, the first step would be to directly compare its output at the small scale as
the scaled up version should be using the same principle in its technology. The following will
compare with an individual melt blown cartridge filter from the PSDP.
Cartridge Filters
At the PSDP there are 14 cartridge filter vessels divided into two banks of 7. Each vessel contains
360 cartridge elements, and produces around 1000-1150 m3 per hour. Therefore an individual

47
cartridge element was worked out to be 1/360th of this volume. Provided one vessel produces 1100
m3/hour, then one element would output 3.05 m
3/hour, or 3055 litres per hour.
According to PSDP, one vessel has a back pressure of around 278 kPa (40 psi), and once its
differential pressure reaches around 80 kPa (11.6 psi), the vessel will stop production to change
cartridges. The Cartridge elements are not designed for cleaning, and are disposed of once the vessel
reaches this pressure.
The Forsta Filter
The Forsta Filter has a maximum rating at 19.7 kL/hour (6000 gallon per hour provided 100
gallon per minute). Its pressure can range from 278 to 1050 kPa. Whereas its backwash volume is 8-
12 litres per backwash. At 5 micron, it would be expected its maximum output will be closer to 40
gallons per minute, or 131.2 litres per minute. As an hourly output this translates to 7872 litres/hour,
or 7.8 m3/hour. To expand on this, the Forsta Filter unit in this trial uses a filter area of 25 gpm/0.4 sq
ft , or 83 Lpm/0.04 sq metres. An individual cartridge used at the plant can produce 3,055
Lph/cartridge area, or 51 Lpm/cartridge. Thus when comparing on an individual basis, the Forsta filter
unit produces slightly more volume.
However footprint and corrosion potential have not yet been determined.
Footprint, Corrosion Potential and Filtration Area
The PSDP intakes roughly 300,000 m3 of seawater each day, or 12,500 m
3/hour (PSDP, 2012).
The pretreatment system, in particular the cartridge filters, are an ongoing system, with no storage
tanks between its effluent and the Reverse Osmosis membranes to ease the production requirement.
As stated above, there are 14 cartridge vessels, each one producing roughly 1000 m3/hour, hence
14,000 m3/hour of cartridge filtered effluent. This matches with the production requirement.
According to cartridge vessel schematics, each vessel is approximately 6 metres high, and close to 2
metres in length (PSDP, 2012). The vessels are arranged not to be stacked upon one another, therefore
must be in series. The following is an estimated footprint of the PSDP cartridge filters with data
available to us.
If we allow 0.5 metres spacing between each vessel, we need around 20 metres length for each bank.
Working is shown below.
Dimensions of One Bank: Given one unit is 6 metres high, ~2 metres wide, and 0.5 metres spaced
out:
(2 x 7)m + (0.5 X 7)m = 14 m + 3.5m = 17.5m
Two banks requires: 17.5m in parallel. Assuming 2metre spacing between each bank implies
the figure below. Area = 200 m2
Figure 28: Estimation of required plant area for both cartridge filter banks.
To get an idea of the Forsta filter’s footprint, you first need to compare both filter areas. As stated
previously, the Forsta Filter unit in the trial uses 83 Lpm/0.04 sq metres, while an individual cartridge
used at the plant can produce 3,055 Lph/cartridge area, or 51 Lpm/cartridge. But the problem is that
these cartridges are designed to be used in vessels. A vessel would produce a filter area of 360 x 51
Lpm/cartridge = 18360 Lpm/vessel.

48
To get the equivalent amount of Forsta filters would necessitate in the following:
18360 Lpm / [Forsta filter unit flow] = 18360 Lpm / 83 Lpm = 221 units
Hence you would need 221 Forsta Filter units stacked up upon each other to achieve the same
flow as only one cartridge vessel!
Of course a scaled up version of the Forsta Filter (not available from Manufacturer at this time of
the report) would have a higher filter area and rated flow rate for 5 microns, but this example is meant
to show comparatively speaking one cartridge vessel has both a smaller footprint and higher flow
output. While in this respect the inherent design of the screen filter restricts its filter area and flow
output.
The corrosion potential between both technologies also shows the Screen filters limits. Cartridge
filters are typically made from polypropylene, while the vessel housings often use fiberglass
reinforced plastic (Pall, 2011). In contrast, screen filters often use metallic screens and filter housings
which opens themselves up to galvanic corrosion if plant operators unknowingly fit bolts and valves
which are either more or less noble than the screen filters metallic components.
In summary, it appears screen filters will always be at a disadvantage in design to match the
footprint-to-flow rate in a large scale setting, but this analysis is in no right a comprehensive one and
other screen filter technologies do exist which can rival the established cartridge filter industry
however this is not within the scope of this report.

49
Recommendations and Future Works
Over the course of this project, issues naturally sprung up after each stage. Recommendations
stem from these problems encountered and ideas to better improve the quality of this trial for future
students inclined to research this area.
Material Corrosion: While Monel 400 provides some corrosion resistance, when testing in
seawater it should be noted that much of the seawater industry is going towards steel alloys
such as Cupro-nickel and super duplex alloys. The use of high density plastics is another
option.
Another step is to check what other metal pipes or fittings will be installed close to the filter,
to gauge whether galvanic corrosion could be an issue.
Collect adequate data from the Filter manufacturers in respect to scaling its models
All pressure devices use the same pressure units to avoid confusion. This includes the
pressure gauge, differential pressure gauge, and pressure transmitter.
To gain further accuracy – use of more a suitable pressure range for the pressure gauges. That
means in our case a gauge that goes from 0 to 400 kPa, not 0 to 800 kPa.
Use of a solenoid valve-ball valve to avoid using a pneumatic run flush valve with the added
compressor. An example of a water based solenoid is shown below.
Figure 29: Water Based Solenoid Valve (B.T. Best).
While future studies could include any of the following:
Complimentary trials of competing technologies to the screen filter. For example a
comparative study on the fouling rates between an industrial cartridge filter element and
screen filter with the same feed water (see Figure 30)
To add to above (parallel trials): inclusion of a small RO membrane after each filter and
measuring the level of membrane fouling
Research other alternative fine filtration technologies to both screen and cartridge filters. This
could include hybrid media filters utilising smaller footprints, disk filtration systems, and
membrane technology just as examples
Inclusion of additional sampling parameters. For example particle counters, frequent readings
of Total Suspended Solids, Dissolved Organic Matter, Total Organic Carbon, etc

50
Figure 30: Possible testing configuration for two filter technologies in parallel.

51
Conclusion
The project set out to design, build and pilot trial a filter system which could determine the
performance of the Forsta Screen filter with polished seawater from the Perth Desalination Plant. The
secondary aim was to attain information on five micron cartridge filters in a seawater desalination
plant, and coupled with the Screen filters data, assess the screen filters scalability and its comparable
performance to cartridge filters. By the end of the project, it was clear the pilot trial could not go
ahead by the end of the semester period due largely from a lack of materials readily available;
however the commissioning of the system was completed. The results showed the setup performs its
designed objective using brackish groundwater as its feedwater. However seawater was not able to be
used in the time of this report.
There are plans for further work to be carried out after the semester to continue the trial and gain
closure. If this will go ahead, there is likely to be further preliminary results with the NCEDA
seawater bore and a change in system conditions such as flow and pressure to get a better view of the
systems thresholds and cleaning efficiency. Once the trial begins, the focus will be on the rates of
corrosion and fouling from the filter screen.

52
References
Abdulmajeed, A. A. 1997. “Pretreatment plant design – Key to a successful reverse osmosis
desalination plant.” Desalination 110(1997): 1-10.
Anthoni, J. 2006. The chemical composition of seawater.
http://www.seafriends.org.nz/oceano/seawater.htm (Accessed 28th of April, 2012).
Bereschenko et al. 2008. Molecular Characterization of the Bacterial Communities in the Different
Compartments of a Full-Scale Reverse-Osmosis Water Purification Plant.
http://aem.asm.org/content/74/17/5297.full (Accessed 21st May, 2012).
Binnie, C. and Kimber, M. 2009. Basic water treatment: Fourth Edition. London, U.K.: IWA
Publishing.
Dunn, D. J. Fluid Power Equipment: Tutorial - Directional Control Valves.
Hamilton, T. E. 1999. “Screen filtration technology as applied to pretreatment of RO and UF
systems”. Filtration & Separation (July/August): 24-28.
Hamilton, T. “SCREEN FILTRATION TECHNOLOGY AS APPLIED TO PRETREATMENT OF
REVERSE OSMOSIS AND ULTRA-FILTRATION SYSTEMS.” Paper presented at IWC,
Battleground WA, U.S.A, 1998.
Heitmann, H. 1990. Saline water processing : desalination and treatment of seawater, brackish water,
and industrial waste water. NY, USA: VCH Publishers.
Pearce, G.K. 2007. “The case for UF/MF pretreatment to RO in seawater applications” Desalination
203 (2007): 286-295.
Prihasto, N., Liu, Q.F., Kim, S.H. “Pre-treatment strategies for seawater desalination by reverse
osmosis system” Desalination 249 (2009): 308-316.
Seah Ek Shen, S. 2005. Comparing the Functionality of the Kwinana Desalination Plant with the
South West Yarragadee Groundwater Development. Perth, W.A.: University of UWA.
Sherif, E. M. et al. 2012. “A comparative Study on the Corrosion of Monel-400 in Aerated and
Deaerated Arabian Gulf Water and 3.5% Sodium Chloride Solutions” International Journal of
ELECTROCHEMICAL SCIENCE 7(2012): 2796-2810.
Sutherland, K. 2008. “Water filtration: bulk water filtration techniques.” Filtration and Separation
(December): 17-19.
Sutzkover-Gutman, I. , Hassan,D. 2010. “Feed water pretreatment for desalination plants.”
Desalination 264(2010): 289-296.
Voutchkov, N. 2010. Seawater Pretreatment. Bangkok, Thailand: Water Treatment Academy.
Vrouwenvelder, J. S., Kruithof, J., and Loosdrecht, M. 2011. Biofouling of Spiral Wound Membrane
Systems. London, U.K.: IWA Publishing.
Williams, C.J., Edyvean, R.G.J. 1995. “Testing Cartridge Filters in Aqueous Media: Interpreting the
results – The pitfalls and problems; Part 1: Evaluating Performance Methods” Filtration & Separation
(February): 157-161.

53
2012. B.T. Best. http://www.btbairvalve.com/solenoid-valve/848407.html (Accessed 7th of
May,2012)
2012. Perth Seawater Desalination Plant (P.S.D.P.).
2011. Groundwater Well Construction & Hydrogeological Assessment. NSW, Australia: CH2MHILL.
2011. RO Guard Filters, GRP Series Housings and Modular Racks. Pall.
2010. Monel® Alloy 400. Mega Mex. http://megamex.com/monel-400-nickel-alloy.htm (Accessed
13th of April, 2012).
2010. Summary report (generic + industrial data) on scaling, fouling and corrosion
parameters.UCM, HOL, PTS, VITO: European Union, Seventh Framework Programme.
2006. ZeeWeed UF Membranes Offer Lower Lifecycle Costs For Seawater Desalination. Water
Online. http://www.wateronline.com/doc.mvc/ZeeWeed-UF-Membranes-Offer-Lower-Lifecycle-Co-
0001 (Accessed 28th of March, 2012).
2005. Monel alloy 400. Special Metals Corporation.
2004. Metropolitan Desalination Proposal: Section 46 Review. Perth, W.A.: Prepared for Water
Corporation by Strategen.
90 Series. Los Angeles, U.S.A: Forsta Filter.
90 Series Self Cleaning Water Filter Operation & Maintenance Manual. Los Angeles, U.S.A: Forsta
Filter.
Chemistry of Seawater. Ocean Health. http://oceanplasma.org/documents/chemistry.html (Accessed
28th of April, 2012).
Cartridge Filter Application Notes. Cal Water. www.cal-
water.com/pdf/CartridgeFilterApplicationNotes.pdf (Accessed 22nd of May, 2012)
Desalination Plant, Israel. SciencephotoLibrary. http://www.sciencephoto.com/media/418788/enlarge
(Accessed 15th of May, 2012).
EC-2 Backwash Controller Operation & Maintenance Manual. http://forstafilters.com/media/pdf/EC-
2-Manual.pdf (Accessed 15th of April, 2012).
Mesh Filtration. http://www.meshfiltration.com. (Accessed 8th of June, 2012)
NCEDA. http://desalination.edu.au/wp-content/uploads/2010/02/NCEDA-RDRF-fact-sheet-2012-
01.pdf (Accessed 20th of March, 2012).
Open Channel flow - Velocity flow. Davenport flow technology.
http://www.flowtechnology.co.uk/freevelocityarea.htm (Accessed 3rd of June, 2012).
Replacement of Cartridge Filters with Self Cleaning Screen Filters – Trial at Perth Seawater
Desalination Plant. Murdoch University, Rockingham, W.A: National Center of Excellence in
Desalination Australia (NCEDA).
Selected Worldwide Applications: AMF2 Filter Series. Amiad.

54
Appendices
Appendix A: Specifications of Experimental Setup Components
A1: Campbell Scientific Data Logger: CX200X Series
Table A1: Specifications of Campbell Scientific model CR200X
Specification Detail
Main features Optimal for measuring one or two simple sensors
Max scan rate of once per second
12-bit analog to digital conversions
Supports only direct connections (i.e. not wireless)
Differential measurements not supported
Data format Table-based DAT format: 8 tables available
Pulse count channel 2 channels
Memory 512 kilobytes of flash memory or 128,000 data points
Current usage Current drain: ~0.2 mA quiescent
~ 3 mA active
Inputs/Outputs Five single-ended analog inputs or digital I/O
Input voltage: 0 - 2500mV
Resolution: 0.6 mV resolution
Battery Sealed 7-Ahr rechargeable battery
Voltage range: 7 to 16 Vdc
Charger input voltage: 16 to 22 Vdc
Table A2: Main features of Grundfos Pressure Pump (Grundfos 2011)
Feature Output
Rated flow 16 m3/h
Rated head 46.1 m
Rated pressure range (at 25
deg)
-20 bar to 90 bar
-290 PSI to 1305 PSI
Liquid temperature range -20 to 90 degrees
Rated Power output 4 kW
Full load motor efficiency 89 %
The materials for the Forsta filter are seen in the following table with each number corresponding
with the cross-section which follows.
Table A3: Component in Filter and its material (Forsta Filter)
Component Name Material
1. Filter Housing Nickel Plated 304L
2. Filter screen Monel 400
3. Particle remover (nozzles) Nickel Plated 304L
4. Bushing Nickel Plated 304L
5. Housing Seal Silicone
6. Screen O-ring Silicone
7. Spacer Nickel Plated 304L
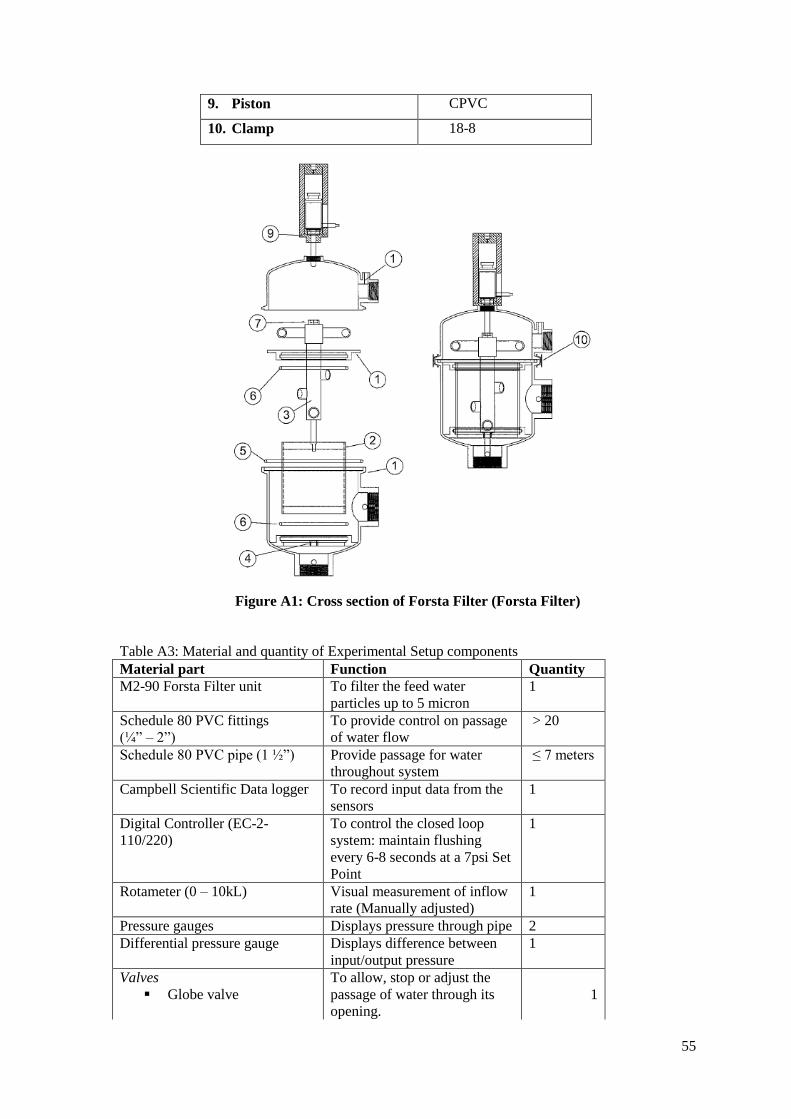
55
9. Piston CPVC
10. Clamp 18-8
Figure A1: Cross section of Forsta Filter (Forsta Filter)
Table A3: Material and quantity of Experimental Setup components
Material part Function Quantity
M2-90 Forsta Filter unit To filter the feed water
particles up to 5 micron
1
Schedule 80 PVC fittings
(¼” – 2”)
To provide control on passage
of water flow
> 20
Schedule 80 PVC pipe (1 ½”) Provide passage for water
throughout system
≤ 7 meters
Campbell Scientific Data logger To record input data from the
sensors
1
Digital Controller (EC-2-
110/220)
To control the closed loop
system: maintain flushing
every 6-8 seconds at a 7psi Set
Point
1
Rotameter (0 – 10kL) Visual measurement of inflow
rate (Manually adjusted)
1
Pressure gauges Displays pressure through pipe 2
Differential pressure gauge Displays difference between
input/output pressure
1
Valves
Globe valve
To allow, stop or adjust the
passage of water through its
opening.
1

56
Sample valve 2
By-pass valve 1
Solenoid valve 1
Standard ball valve 2
Air Flush Valve 1

57
Appendix B: Hydrogeological cross-section of the Rockingham Area
(NCEDA, 2012)
Appendix C: Information on the three groundwater wells at the NCEDA, Rockingham
Figure C1: Location of Groundwater bores at NCEDA, Murdoch Rockingham Campus
(CH2MHILL, 2011)

58
Figure C2: Comprehensive Water Analysis of the Seawater and Groundwater well at
NCEDA, provided from Chem Centre, 2011.

59
Appendix D: Preliminary Testing
Tabulated Results from the 31st of May, 2012
Table D1: Preliminary Testing: By Hand
Conductivity (uS) Date Time Inlet Outlet Temp. Diff. P Inlet P Out P
31-5-12 12:45 PM 2890 2891 19.8 5 298 260
31-5-12 1:00 PM 2887 2887 19.8 6.7 201 256
31-5-12 1:15 PM 2979 2973 19.8 2.5 298 279
31-5-12 1:30 PM 3159 3165 19.8 3 299 278
31-5-12 1:55 PM 3458 3462 19.8 5.1 300 264
31-5-12 2:10 PM 3576 3574 19.8 6.1 301 259
31-5-12 2:30 PM 3751 3743 19.8 2.4 295 283
31-5-12 2:45 PM 3821 3818 19.9 2.55 297 279
31-5-12 3:00 PM 3896 3893 19.9 3.5 298 278
31-5-12 3:15 PM 3971 3971 19.9 3.75 299 272
31-5-12 3:30 PM 4027 4027 19.9 5 299 267
31-5-12 3:45 PM 4074 4074 19.9 5.5 299 262
31-5-12 4:00 PM 4119 4119 20 6 302 261
31-5-12 4:15 PM 4145 4146 20 6.5 303 255
31-5-12 4:30 PM 4168 4168 - 6.9 305 253
Table D2: Backwash (B/W) Log: Manual recording
Date Time dP after B/W
Conductivity (uS) Comment
31-5-12 1:06 PM 2.5 2888 Inlet pressure gauge reduce to ~160kPa
as flush line opened
31-5-12 2.29 PM 2.4 -
31-5-12 4.38 PM 2.3 4187
Preliminary Testing Setup and Implementation:
The preliminary testing had several goals in mind. These were:
1. Test physical integrity of system for first feed run
2. Determine if there is turbulent flow through the system
3. Attain a minimum system back pressure of 40 PSI (278 kPa)
4. Achieve Filters design function of filtering particulates greater than 5 micron
5. Use of the automated backwash system and determine its backwash volume
6. Determine the length of time a backwash cycle occurs (for a raised piston)
The testing does not however assess the effectiveness of the screen filter, instead the results will
indicate whether the system works as a whole and if the filter can provide its basic function.

60
The feed water used in the testing was brackish ground water extracted from the NCEDA
groundwater well. The bore pump was signaled by the SCADA system to input the water into feed
tank A. While Tank B was used as the product tank. The Brackish ground water quality is relatively
high, as indicated by the table below. Its high quality should not impact the filter screen by way of
corrosion or fouling. A more comprehensive analysis of both the groundwater and seawater wells are
shown in appendix C.
Table D3: Water quality of Brackish groundwater well (CH2MHILL, 2011)
Water Quality Parameter Value
pH 7.7
Conductivity 78.2 mS/m
Total Organic Carbon
(TOC)
< 1 mg/l
Hardness 210 mg/l
Total dissolved solids (TDS) 400 mg/l
Turbidity < 0.5 NTU
Total Suspended Solids 2 mg/l
Chloride 108 mg/l
The system was setup for recirculation of Tank A, and a common pipe connecting both Tanks was
open to allow mixing of Tanks contents. Initially both tanks were filled individually by brackish
ground water to 50 percent. The idea was to make both tanks be used as one singular collective tank.
As shown by the diagram in the figure. Service water was intended to be used after each session to
flush any residue solids from the feed water.
Figure D1: The system setup for preliminary testing
Some of the Filters key features to watch for during our preliminary testing are in the table below.
Of those the maximum flow rate is 40 Gal/min or 378 L/min. As stated in other sections, the
minimum backpressure needed is 40 PSI, with its backwash volume stated from the manufacturer to
be around 8 to 12 litres per backwash.

61
Table D4: Key Characteristics of Forsta Filter (Forsta Filter)
Characteristic Output
Maximum flow rate 378 L/min; 22kL/h
Minimum system
pressure
40 psi 278 kPa
Maximum system
pressure
150 psi 1050 kPa
Weight 20 lbs
Screen area 0.4 sq ft
Backwash volume 8 to 12 litres per wash
Filter Screen 5 µm Dutch wedge-wire
(Monel 400)
The Parameters recorded in 15 minute intervals were, conductivity, temperature, the inlet and
outlet pressures, and the differential pressure. While the time for each backwash was recorded to find
its frequency.
In Summary, the preliminary testing resulted in:
Fully functional filter setup including the automated backwash system
A pressure less than 40 psi (278 kPa) will result in a only partial backwash (piston not fully
raised)
The natural flow rate for our system was 5 kL/hour. This was the result after achieving the
system back pressure minimum of 40 psi
Turbulent flow was not achieved (< 1.5m/s velocity) with flow rate above. The equation to
determine the flow velocity was: Q = VπD2 / 4
Where: Q = Flow rate (m3/hour); V = Velocity (m/s); D = Diameter of piping
A recirculation system inevitably lead to a decrease in backwash frequency as the mixed feed
water became cleaner each filter run
Conductivity was rising but gradually leveling off – both tanks were closed to fully mixed
was the assumption
It takes around 4 seconds for the piston to raise fully upward (one backwash cycle) –
therefore it takes roughly 5.5 Litres for each backwash ([83 Lpm / 60] * 4 = 5.53 L/per
backwash)

62
Appendix E: Job Safety Analysis for Project Implementation
Installing and Commissioning Forsta Filter
Activity Hazards Risk Control Measures Person Responsible
Workplace and working environment Access, slips, trips, and falls Maintain high standard of house
keeping
Walkways free of obstructions
Storage and work areas kept separate
Mike Ambrose, George Horvath
Apply Primer Fluid to and Cement to PVC-
U pipe
Prolonged inhalation period could
irritate eyes, respiratory tract, cause
headaches, other nervous system
disorders
Work in well ventilated area, if task is
expected to have long duration then
have frequent breaks
Use approved respiratory protection –
air supply mask (P2 breather)
Place paper used for cleaning or
removal of surplus cement into closed
containers to minimize solvent fumes
into the air
Mike Ambrose, George Horvath
Prolonged or repeated skin contact may
irritate or cause dermatitis
Wear appropriate P.P.E – i.e. gloves,
long sleeved clothing, boots, goggles
Use of handheld/portable power tools Electric shocks/burns/fire Tools maintained and kept in good
condition; Emergency stops fitted to all
relevant devices
Mike Ambrose, George Horvath
Cuts and abrasions during operation Work pieces securely held by suitable
fixtures/clamps and regularly
inspected; Wear appropriate PPE;
Machinery correctly adjusted
Dust exposure from selected material Use approved respiratory protection –
air supply mask (P2 breather)
Noise emissions exceeds work decibal
threshold
Wear suitable ear protection
Connect assembled filter to pilot plant Cutting and Abrasions from work
pieces/tools during assemblage
Safe and easy access to work item;
Correct handling of selected tools;
Wear suitable PPE; Work pieces
securely held by suitable
fixtures/clamps and regularly inspected
Mike Ambrose, George Horvath

63
Commission test run of filter process Electric shocks due to water flooding /
burst (due to Incorrect installation)
Correct installation procedure; Safety
switch fitted to Electrical power and
equipment (regularly inspected); Wear
suitable PPE – i.e. insulated footwear;
Work area barricaded off to prevent
unauthorized access; Plant stopping
capability utilised and inspected
Mike Ambrose, George Horvath
Falls, slips and trips on floors made
wet during handling of water
Wear suitable non-skid footwear
Provide signage to signify wet area
Testing & Monitoring
Activity Hazards Risk Control Measures Person Responsible
Dis-assemble Forsta filter for integrity
inspection
Exposure to buildup of unwanted
substances – repeated skin contact
could cause irritation
Wear suitable PPE to reduce skin
contact
Mike Ambrose, George Horvath
Conduct water sampling Skin and eye contact with feed water -
repeated contact could cause irritation
Apply safety chemical rules – read
MSDS of added compounds
(coagulants, acids) present and consult
safety supervisor on specific chemicals
Wear suitable PPE to minimize skin
contact
Mike Ambrose, George Horvath
Falls, slips and trips on floors made
wet during handling of water
Wear suitable non-skid footwear
Provide signage to signify wet area

64
Appendix F: Project Issues
The Project faced several issues during the course of the trial, influencing the level of achievement for
some of the objectives. However the prominent ones are explained further below.
The main problem was with procuring of parts. The normal suppliers of the NCEDA’s piping parts
were unable to supply the required items needed in the pilot trial, making the NCEDA Staff rely on other
suppliers from interstate. The delay for enough parts to come to begin building was up to 6 weeks. This
left the NCEDA staff designated in helping with the project and myself unable to continue until the major
components arrived. In the mean time this left me restricted to research until implementation could begin.
The second issue was attaining enough data of fine micron cartridge filters in a live seawater
desalination environment. By the end of the project, a meeting was arranged with PSDP who kindly
invited us to come down and get a familiarity with the pretreatment system and answer any questions to
the best of their knowledge. But by this stage the semester was close to finished, therefore there was not
enough time to warrant a comprehensive analysis of cartridge filters in reference to the Forsta Screen
Filter.
The figure below is from the Project Gantt Chart which gives an indication of when different project
milestones were meant to be achieved, and when they actually were. Following the figure is the Gantt
chart for the project.
Figure F1: Milestones from the Project Gantt Chart and the predicted versus actual times of
achieving each milestone.