
Screen early - fail early: Rapid analytical screens for ... · analytical screens for protein...
25
Screen early - fail early: Rapid analytical screens for protein formulation Paul Dalby Dept. Biochemical Engineering, UCL
Transcript of Screen early - fail early: Rapid analytical screens for ... · analytical screens for protein...

Screen early - fail early: Rapidanalytical screens for protein formulation
Paul Dalby
Dept. Biochemical Engineering, UCL
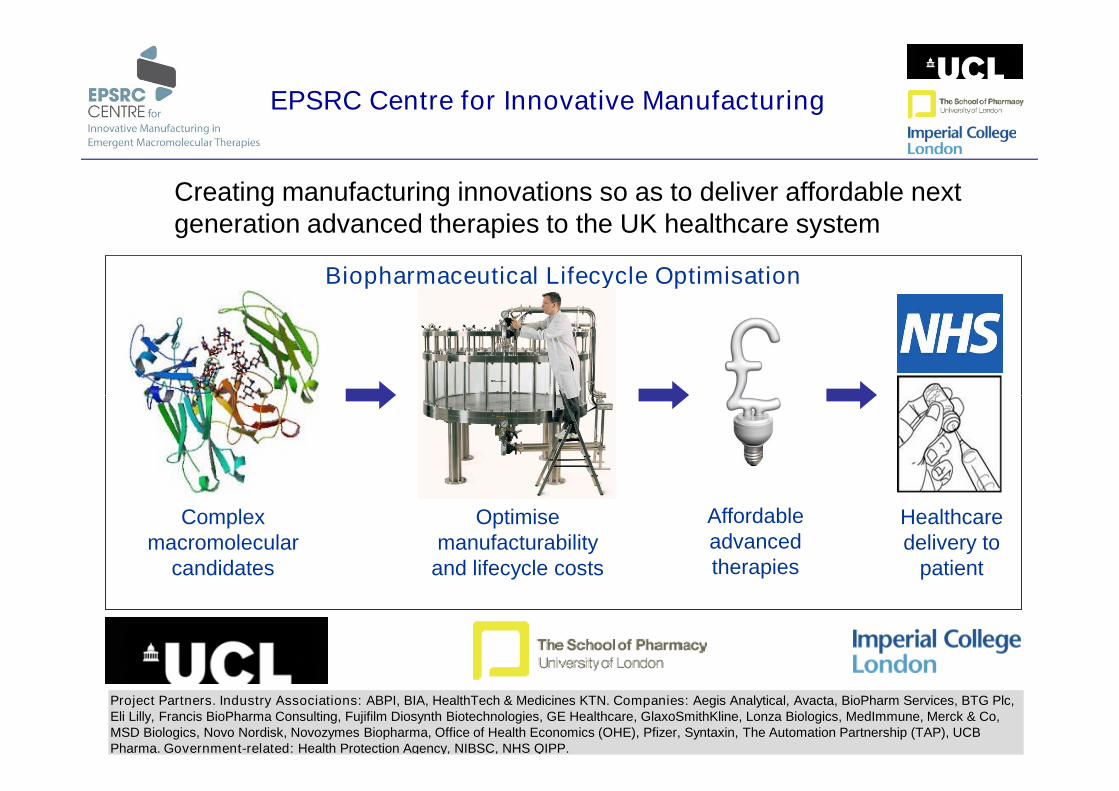
EPSRC Centre for Innovative Manufacturing
Creating manufacturing innovations so as to deliver affordable nextgeneration advanced therapies to the UK healthcare system
Biopharmaceutical Lifecycle Optimisation
2
2
Optimisemanufacturability
and lifecycle costs
Complexmacromolecular
candidates
Healthcaredelivery to
patient
Affordableadvancedtherapies
Project Partners. Industry Associations: ABPI, BIA, HealthTech & Medicines KTN. Companies: Aegis Analytical, Avacta, BioPharm Services, BTG Plc,Eli Lilly, Francis BioPharma Consulting, Fujifilm Diosynth Biotechnologies, GE Healthcare, GlaxoSmithKline, Lonza Biologics, MedImmune, Merck & Co,MSD Biologics, Novo Nordisk, Novozymes Biopharma, Office of Health Economics (OHE), Pfizer, Syntaxin, The Automation Partnership (TAP), UCBPharma. Government-related: Health Protection Agency, NIBSC, NHS QIPP.

EPSRC Centre for Innovative Manufacturing
• Collaboration initiated by an academic core:-
UCL – Biochemical Engineering (Lead)
Chemical Engineering
Health Economics
Centre Team & Consortium
3
Health Economics
LSoP – Formulation Engineering
ICL – Chemical Engineering
• Supported by a group of:-
25 industrial users including SMEs,
7 NGOs / Industry Associations
• Extended by a network of:-
23 national & international academics

When does formulation start?
Fermentation
Secondaryoperation
RecoveryBiomaterialparameters
Operationalparameters
Purification
Formulation
Product

Paradigms to improve “formulatability”
1. “Screen early: fail early”
• Find "troublemaker" proteins earlier
• Provide appropriate “stress tests" for formulation engineers
2. “Better by design”2. “Better by design”
• Develop robustly manufacturable protein scaffolds
• Establish predictive protein design evaluation tools
• Understand protein aggregation better

Formulation development
Design of Experiment (DoE) - Stress and analyse
Protein variants [Protein] pH
[Buffer] & type Ionic strength GRAS excipients
Design space
“Optimum” formulation
High T, low t? Freeze-thaw? Tm or Tagg? Agitation?
Shelf-life study
High end biophysics

Biophysical analysis of proteins
•Size•Structure content•Composition•Folding extent
•Chemical modifications•Local structure content•Shape and conformation•Folding dynamics
•Atomic structure•Bond formation•Molecular interactions•Structural dynamics
N N*
CDFluorescence spectroscopyDLS / particle imagingSize exclusion chromatographyAnalytical Ultracentrifugation
Low resolution Medium resolution High resolution
LCMSSmall angle X-ray scattering
NMR
•Folding extent •Folding dynamics •Structural dynamics

Challenges and possible solutions
• Too little material available at early bioprocess development stages
• Design space is very large for new entities
• Formulations are at high concentration (10-200 mg/ml)
• Many biophysical analyses use 0.1-2ml, 0.01-1 mg/ml
• Forced degradation is not the same as unforced degradation• Forced degradation is not the same as unforced degradation- which degradation species are a problem?
• Predict outside of measurement range
• Create lower volume analytics
• Higher throughput with high accuracy and high sensitivity
• Improve predictability of shelf-life and degradation pathways

Lyophilization Cycle
-50
-40
-30
-20
-10
0
10
20
30
Te
mp
era
ture
(ce
lciu
s)
0
100
200
300
400
500
0 120 240 360 480 600 720 840 960 1080 1200
Time (mins)
Pre
ss
ure
(mT
orr
)Shelf TemperatureVacuum
Freeze-drying in microplates
Rate of sublimation in microplate Thermal imaging of microplate freezing
1 2 3 4 5 6 7 8 9 10 11 12A
B
C
D
E
F
G
H
Rate of sublimation in microplate
135-145
125-135
115-125
105-115
95-105
85-95
Thermal imaging of microplate freezing
Grant Y, Matejtschuk P, Dalby PA (2009) Biotech. Bioeng. 104:957-964. Rapid optimisation of protein freeze-drying formulationsusing ultra scale-down and factorial design of experiment in microplates.

Freeze-drying optimisation - GCSF
0.1 ug/ml GCSF, pH 7
- stimulates white blood cell production- improves recovery post-chemotherapy- assayed by cell count after growth stimulation
Scott Grant & Paul Matejtschuk (NIBSC)

TrehaloseHSA
MannitolSucrose
HSAMannitol
Tween 20
0.33% Tween
3% HSA
Freeze-drying optimisation - GCSF
• Took two weeks and used 370 ng GCSF!
SucroseTween 20Arginine
Phenylalanine
Tween 20100% Activityretention
Scott Grant & Paul Matejtschuk (NIBSC)

GCSF forced degradation studies
0
50
100
-1 1 3 5 7
No. Days Incubated
Re
lati
ve
Ac
tiv
ity Initial comparison to
unformulated GCSF
♦ lyophilized formulation■ unlyophilized formulation▲ PBS
Resuspended lyophilisates in vials: after 6 month storage at various T
-7.5
-7
-6.5
-6
-5.5
-5
-4.5
-4
-3.5
-3
0.003 0.0032 0.0034 0.0036
1/T (K-1)
ln(k
/T)
0
20
40
60
80
100
120
-100 -50 0 50 100
T (degC)
%G
CS
Fac
tiv
ity
reta
ine
d
Resuspended lyophilisates in vials: after 6 month storage at various T
Scott Grant & Paul Matejtschuk (NIBSC)

Equilibrium denaturation:
• Capillary DSC (eg. MicroCal)
• Autotitrating fluorimeter/circular dichroism
Some thermostability methods
X
Flu
ore
sc
en
ce
• ANS/SYPRO binding (eg. ThermoFluor / DSF)
Equilibrium exchange kinetics:
• MALDI-TOF• NMR H/D exchange

Early microplate-based screens
Protein precipitation / solubility
Wild typeY440AD381A
Protein stability
Ahmad SS, Dalby PA (2011) Biotechnol. Bioeng. 108:322-332.Thermodynamic parameters for salt-induced reversible proteinprecipitation from automated microscale experiments.
Aucamp, J. P. (2005) Biotech Bioeng. 89 599-607
Aucamp, J. P. (2008) Biotech Bioeng. 99, 1303-1310
280 nm 340 nm
Denaturantin
autotitrator
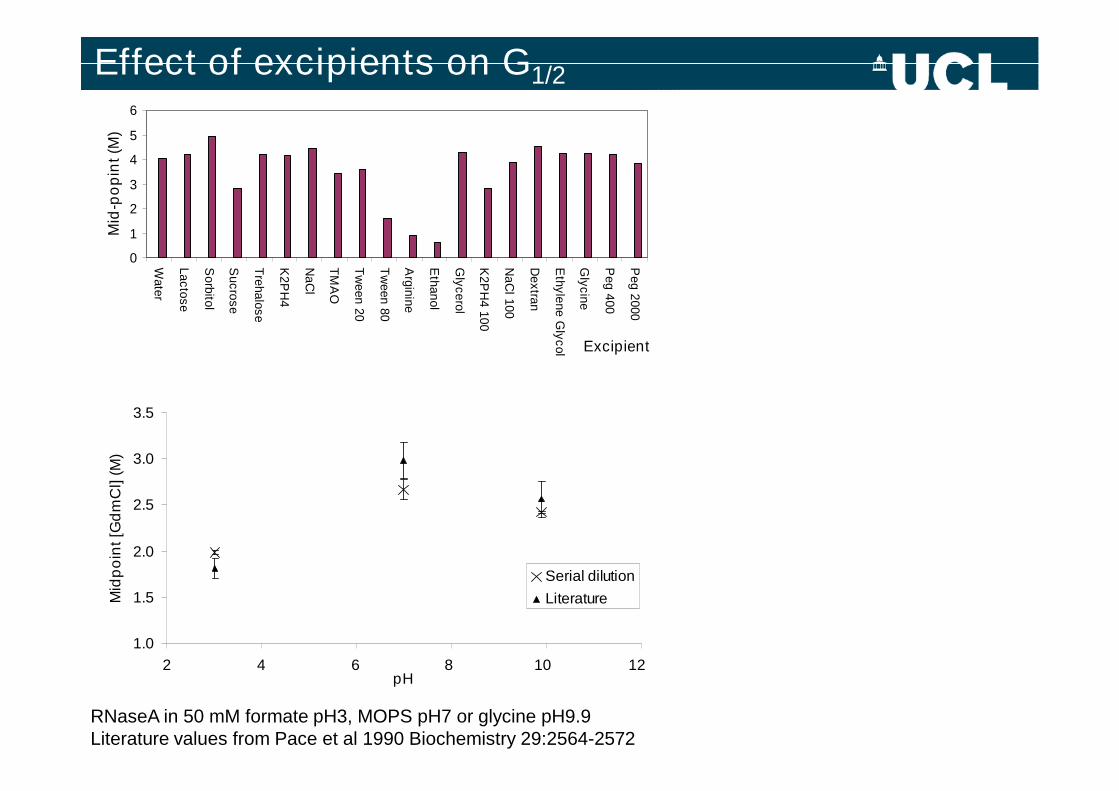
Effect of excipients on G1/2
0
1
2
3
4
5
6
Wate
r
La
cto
se
So
rbito
l
Su
cro
se
Tre
ha
lose
K2
PH
4
Na
Cl
TM
AO
Tw
een
20
Tw
een
80
Arg
inin
e
Eth
an
ol
Gly
ce
rol
K2
PH
410
0
Na
Cl
100
De
xtra
n
Eth
yle
ne
Gly
col
Gly
cin
e
Pe
g4
00
Pe
g2
000
Excipient
Mid
-po
pin
t(M
)
1.0
1.5
2.0
2.5
3.0
3.5
2 4 6 8 10 12pH
Mid
po
int
[Gd
mC
l](M
)
Serial dilution
Literature
RNaseA in 50 mM formate pH3, MOPS pH7 or glycine pH9.9Literature values from Pace et al 1990 Biochemistry 29:2564-2572

Protein stability in microfluidics
100mm I.D.
10mL/min
Gaudet M, Remtulla N, Jackson SE, Main ERG, Bracewell DG, Aeppli G, Dalby PA (2010) Protein Science. 19: 1544-1554.Protein denaturation and protein:drug interactions from intrinsic protein fluorescence measurements at the nanolitre scale.
• 266 nm, 5 mW, 1 kHz pulsed UV laser
• fused-silica glass micro-capillary (ID=100 mm, OD=300 mm)
• Emission filtered by 320-400 nm dichroic mirror
• Measurement volume of 1.5 nL minimum

PMTMeasurements
Signal processing
PDMeasurements
ProcessedDataset
• Beam splitter and photodiodemeasurement used as a reference

Measurement stability and cleaning

Sample flow removes optical bleaching
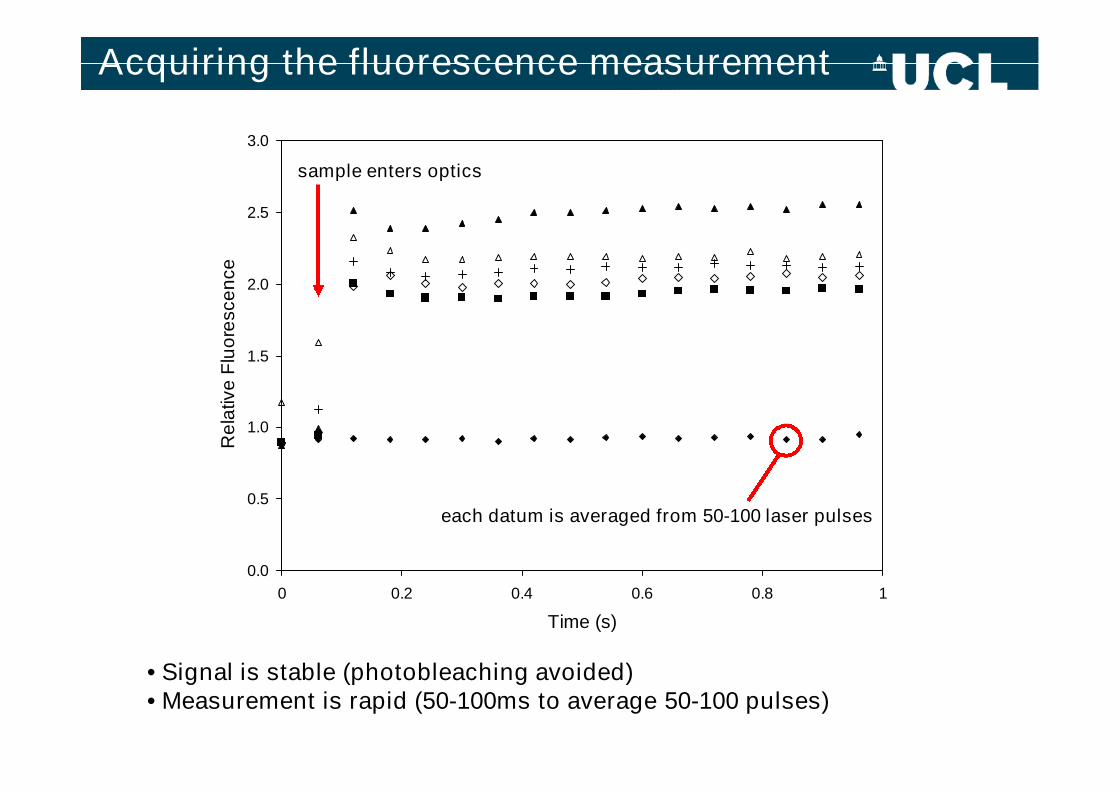
Acquiring the fluorescence measurement
1.5
2.0
2.5
3.0
Re
lativ
eF
luo
resce
nce
sample enters optics
• Signal is stable (photobleaching avoided)• Measurement is rapid (50-100ms to average 50-100 pulses)
0.0
0.5
1.0
0 0.2 0.4 0.6 0.8 1
Time (s)
Re
lativ
eF
luo
resce
nce
each datum is averaged from 50-100 laser pulses

Sensitivity of fluorescence measurement
• Signal response is linear: 0.15 mM to 1.5 mM (0.01-100 mg/ml) BSA
Matthieu Gaudet

Comparison to microplates
Method Limit ofdetection(mg/ml)
Minimum[Protein]
(uM)
Volume
(L)
Number ofProteins
Microplate
BSA 0.005 0.076 2.6x10⁻⁴ 1.16 x 10¹³
RNaseA 0.0001 0.007 2.6x10⁻⁴ 1.14 x 10¹²
Microfluidics
BSA 0.01 0.15 1.5x10⁻⁹ 1.4 x 10⁸
• 2x greater minimum concentration required• 80,000x less protein required• concentration range: 0.15 uM to 1.5 mM (0.01-100 mg/ml)
Matthieu Gaudet

Nanolitre stability & ligand affinity screening
100mm I.D.
10mL/min
[GdnHCl] (M)
0 1 2 3 4 5 6
Norm
alis
ed
fluo
resce
nce
0.0
0.2
0.4
0.6
0.8
1.0
+ Rapamycin
No Rapamycin
CFKBP=10uM; Crap= 15uM
open : capillary
full: microplate
Gaudet M, Remtulla N, Jackson SE, Main ERG, Bracewell DG, Aeppli G, Dalby PA (2010) Protein Science. 19: 1544-1554.
• 80,000x less protein than 96-well• 0.15 uM to 1.5 mM (0.01-100 mg/ml)• accurate ΔGD-N, C1/2, Kd

Optical control of heat in microfluidics
Acknowledgements
PhD/PDRA:Stability Jean Aucamp, Julio Martinez-Torres, Michael RosePrecipitation Shahina AmhadFreeze-drying Scott GrantMicrofluidics Matthieu Gaudet, Sagar Dodderi, Samir Aoudjane
Collaborators:Microfluidics Gabriel Aeppli (LCN)
Dan Bracewell (UCL)FKBP-12 Ewan Main (QMUL)FKBP-12 Ewan Main (QMUL)
Sophie Jackson (Cambridge)Freeze-drying Paul Matejtschuk (NIBSC/ HPA)
Funding & material donors:EPSRC (IMRC and EngD)BBSRC (BRIC, FOF and studentships)British Council (BC)Association of Commonwealth Universities (ACU)NIBSC (Health Protection Agency)