Screen Australia Drama Report
44
The Drama Report 2019/20 | Screen Australia Screen Australia Drama Report Production of feature films, TV and online drama in Australia in 2019/20
Transcript of Screen Australia Drama Report

The Drama Report 2019/20 | Screen Australia
Screen Australia Drama Report Production of feature films, TV and online drama in Australia in 2019/20
2
© Screen Australia 2020 ISBN: 978-1-920998-34-9
The text in this report is released subject to a Creative Commons BY licence (Licence). This means, in summary, that you may reproduce, transmit and distribute the text, provided that you do not do so for commercial purposes, and provided that you attribute the text as extracted from Screen Australia’s Drama Report 2019/20. You must not alter, transform or build upon the text in this report. Your rights under the Licence are in addition to any fair dealing rights which you have under the Copyright Act 1968 (Cwlth). For further terms of the Licence, please see http://creativecommons.org/licenses/by-nc-nd/3.0/
Screen Australia is grateful to all those who contributed data to the compilation of this report. The data provided has been drawn from a number of sources. While Screen Australia has undertaken all reasonable measures to ensure its accuracy, we cannot accept responsibility for inaccuracies and omissions.Cover: Mystery Road series 2
Inside Cover: Penguin Bloom
3
The Drama Report 2019/20 | Screen Australia
Contents
ABOUT THE REPORT 4
KEY TERMS 5
OVERVIEW 6
ALL DRAMA PRODUCTION 8
AUSTRALIAN FEATURE SLATE 10
Feature budget ranges 11
Sources of finance for Australian features 12
AUSTRALIAN GENERAL TV DRAMA SLATE 15
AUSTRALIAN CHILDREN’S TV DRAMA SLATE 20
AUSTRALIAN ONLINE DRAMA SLATE 22
SOURCES OF FINANCE FOR AUSTRALIAN TV AND ONLINE DRAMA 23
TV/ONLINE DRAMA FINANCE BY FIRST RELEASE PLATFORM 27
FOREIGN PRODUCTION 28
DRAMA PRODUCTION BY LOCATION 30
PDV SERVICES – FEATURES, TV DRAMA AND ONLINE PRODUCTION 31
All PDV 32
PDV expenditure by state 32
Focus on foreign PDV-only expenditure 33
Showcases 35
TITLES IN THE 2019/20 SLATE 38
METHODOLOGY 42

4
ABOUT THE REPORTThis year marks the thirtieth anniversary of the Drama Report. First produced by the Australian Film Commission and, since 2008, Screen Australia, it initially covered feature films and TV drama including mini-series, telemovies and series/serials. New technology saw the emergence of online dramas and from 2016/17, as the number of titles grew, a separate category was created to accommodate them.
Each year has presented unique challenges, but none quite like 2019/20, when the world was hit by a pandemic that, among other devastating consequences, saw the screen sector grind to a halt for a period of time. In Australia, the vast majority of drama productions ceased work in March 2020. Some were able to return to work before 30 June, but most did not restart until the second half of 2020. Many titles that were scheduled to begin shooting were either postponed to 2020/21 or potentially
cancelled altogether as finance fell through or unique, time-sensitive conditions were lost.
In this year’s report, Screen Australia has attempted to capture the effects of COVID-19 on drama production, but we acknowledge the difficulty of effectively capturing the full scale of the pandemic’s impact. The data we have captured does not adequately reflect the personal cost to cast and crew, and it is doubtful that it illustrates the full economic cost, which may take years to be realised. Please note that a substantial amount of expenditure for projects that began work in 2019/20 will occur in subsequent years, but to remain consistent we will continue with our methodology (see page 42) of thirty years.
The report incorporates data gathered through surveys and publicly available sources to give a comprehensive view of drama production activity in Australia. Data is presented for the past five years, 2015/16 to 2019/20. Foreign titles are included if they
are shot (or substantially shot) in Australia, or have post, digital or visual effects (PDV) work carried out in Australia without shooting here.
See page 5 for definitions of ‘Australian’, ‘domestic’, ‘Co-production’ and ‘foreign’.
Feature films and TV dramas represent about 30% of all audiovisual production spend in Australia (excluding online productions).1 Other areas of activity include documentaries, web-series, light entertainment, commercials, music videos, corporate videos and TV productions such as sport, news and current affairs. See the statistics section of the Screen Australia website for details, www.screenaustralia.gov.au/fact-finders/production-trends, and the relevant archives for pre-2013/14 data.
1Australian Bureau of Statistics (ABS), Film, Television and Digital Games, 2015/16, (cat. no. 8679.0).
In this year’s report, various breakout boxes explore the known impacts of the Coronavirus (COVID-19) pandemic.
The Bureau of Magical Things series 2
5
The Drama Report 2019/20 | Screen Australia
KEY TERMS
Drama includes: Features: a film made for cinema which is 60 minutes or longer TV drama: a ‘drama’ program according to the Australian Content Standard guidelines (see ACMA website). Includes series/serials, mini-series and telemovies. See page 17 for definitions. Online drama: encompasses single-episode or series programs with total durations of 30 minutes or more that have their first Australian release online. General drama: drama made for adult, teen and/or family audiences. It does not include Children’s drama, which is made specifically for child audiences.
Total budgets: reports on how much it actually costs to make projects. It is reported for all projects that started shooting during the financial year, with the full budget allocated to the date principal photography started; budgets are not apportioned across the duration of the project.
Total spend/expenditure: reports on how much of the total budgets were spent in Australia. This measure is particularly relevant for Co-productions and foreign productions. Again, all expenditure is allocated to the date principal photography or PDV work in Australia began rather than to the actual date of spending. Note: this is not the same as ‘qualifying Australian production expenditure’ (QAPE) for the purpose of the Producer Offset. Some expenditure in Australia is not QAPE, and QAPE can include some expenditure on Australian elements outside of Australia. QAPE is not reported here.
Australian productions include: ‘Domestic productions’: Projects other than Co-productions under Australian creative control (ie where the key elements are predominantly Australian and the project was originated and developed by Australians). This includes projects under Australian creative control that are 100% foreign-financed. ‘Co-productions’ are Official Co-productions (ie projects made pursuant to an agreement between the Australian Government and the government of another country). As Official Co-productions don’t have to pass the ‘significant Australian content’ test for eligibility for the Producer Offset, and may be classified as ‘Australian’ for the purposes of Australian content regulations applying to broadcasters, the report mainly focuses on domestic and Co-production projects as a combined ‘Australian’ slate.
‘Foreign productions’ are defined as those under foreign creative control, originated and developed by non-Australians. This includes foreign projects with an Australian production company operating in a service capacity.
‘In-house productions’ are projects by Australian TV networks, where no independent production company is credited as producer or co-producer.
‘PDV’ (post, digital and visual effects) refers to those activities that create audio and visual elements for film or TV drama other than by principal photography, pick ups or physical elements such as sets and props, and includes animation. It also refers to the manipulation of those elements and includes sound and visual editing, digital effects, creation of computer-generated images (CGI), film laboratory work and duplication services. As such, it includes a variety of activities that not only take place after the shoot but also during the earlier stages of a project’s overall production.
The following abbreviations are used throughout the report: Subscription video-on-demand (SVOD), Broadcaster video-on-demand (BVOD), Advertising or Ad-based video-on-demand (AVOD) and Transactional video-on-demand (TVOD).
See also Methodology on page 42.
The 2019/20 slate includes many titles affected by the COVID-19 pandemic, including:
• Interrupted titles: which were in production at the time of the pandemic, and had their production interrupted. Many of these titles had not finalised production or financing at time of data collection, and estimations have been made as needed.
As per the existing methodology, budgets and expenditure for titles that commenced production during 2019/20, including titles with production interrupted by COVID-19, are allocated to the 2019/20 financial year and are not apportioned across the duration of the project.
• Postponed titles, which were scheduled to commence shooting in 2019/20, but postponed their production to a later date. These titles are not included in data for 2019/20. Observations on those titles can be found in various breakout boxes.
6
Overview
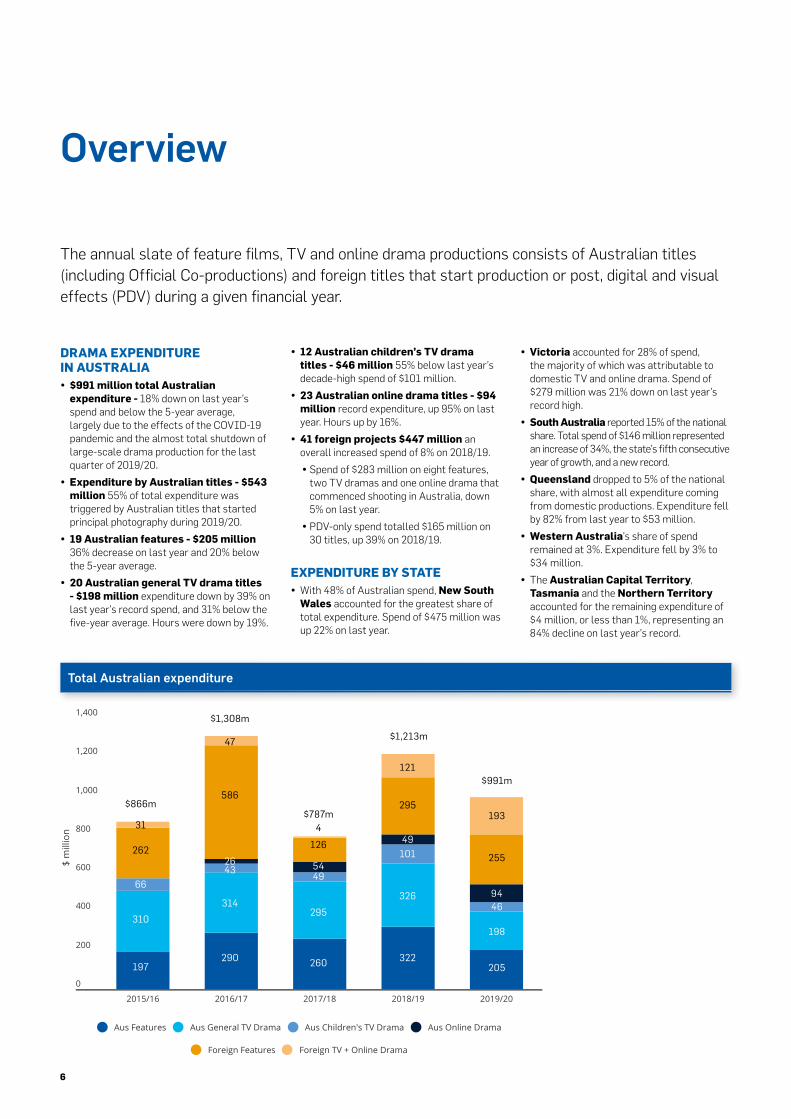
DRAMA EXPENDITURE IN AUSTRALIA y $991 million total Australian expenditure - 18% down on last year’s spend and below the 5-year average, largely due to the effects of the COVID-19 pandemic and the almost total shutdown of large-scale drama production for the last quarter of 2019/20.
y Expenditure by Australian titles - $543 million 55% of total expenditure was triggered by Australian titles that started principal photography during 2019/20.
y 19 Australian features - $205 million 36% decrease on last year and 20% below the 5-year average.
y 20 Australian general TV drama titles - $198 million expenditure down by 39% on last year’s record spend, and 31% below the five-year average. Hours were down by 19%.
The annual slate of feature films, TV and online drama productions consists of Australian titles (including Official Co-productions) and foreign titles that start production or post, digital and visual effects (PDV) during a given financial year.
y 12 Australian children’s TV drama titles - $46 million 55% below last year’s decade-high spend of $101 million.
y 23 Australian online drama titles - $94 million record expenditure, up 95% on last year. Hours up by 16%.
y 41 foreign projects $447 million an overall increased spend of 8% on 2018/19.
y Spend of $283 million on eight features, two TV dramas and one online drama that commenced shooting in Australia, down 5% on last year.
y PDV-only spend totalled $165 million on 30 titles, up 39% on 2018/19.
EXPENDITURE BY STATE y With 48% of Australian spend, New South Wales accounted for the greatest share of total expenditure. Spend of $475 million was up 22% on last year.
Total Australian expenditure
y Victoria accounted for 28% of spend, the majority of which was attributable to domestic TV and online drama. Spend of $279 million was 21% down on last year’s record high.
y South Australia reported 15% of the national share. Total spend of $146 million represented an increase of 34%, the state’s fifth consecutive year of growth, and a new record.
y Queensland dropped to 5% of the national share, with almost all expenditure coming from domestic productions. Expenditure fell by 82% from last year to $53 million.
y Western Australia’s share of spend remained at 3%. Expenditure fell by 3% to $34 million.
y The Australian Capital Territory, Tasmania and the Northern Territory accounted for the remaining expenditure of $4 million, or less than 1%, representing an 84% decline on last year’s record.
$1,179m
TOTAL AUSTRALIAN EXPENDITURE
1,400
1,200
1,000
800
600
400
200
0
2015/16 2016/17 2017/18 2018/19 2019/20
$ m
illio
n
Aus Features Aus General TV Drama Aus Children's TV Drama Aus Online Drama
Foreign Features Foreign TV + Online Drama
$866m
$1,308m
$787m
$1,213m
$991m
193
255
9446
198
205
121
295
49
101
326
322260
295
495426
43
314
290197
310
66
126
4
47
586
31
262

7
The Drama Report 2019/20 | Screen Australia
Impact of the COVID-19 pandemic
• In March 2020, the COVID-19 pandemic halted large-scale drama production.
• Titles that had their production or post-production interrupted by the pandemic reported increases in costs. For most titles, these costs were yet to be fully realised at time of reporting. Surveyed producers of titles with budgets over $1 million reported cost increases ranging from marginal increases, to increases of around 15% of the pre-COVID budget.
• The pandemic is estimated to have postponed around 26 Australian drama titles with total budgets exceeding $325 million. Several of these titles are now slated to enter production in 2020/21, which is affecting the scheduling of other titles.
• Following the introduction of Australian Screen Production Industry COVID-Safe Guidelines in late May 2020, large-scale production began to resume in some locations, assisted in several cases by additional Government funding, and the new Temporary Interruption Fund. The pandemic continues to seriously affect the development, production, and release of drama throughout Australia.
• The 2019/20 slate includes a significant number of titles affected by the COVID-19 pandemic that were yet to finalise production and extra costs at time of publication. Estimations have been made when necessary.
Bloom series 2

8
All drama production
Australian1 Foreign2 Total
No. titles Spend $m No. titles Spend $m No. titles Spend $m
Features
2015/16 39 197 22 262 61 459
2016/17 52 290 26 586 78 876
2017/18 42 260 31 126 73 386
2018/19 43 322 29 295 72 617
2019/20 19 205 23 255 42 459
5-yr av 39 255 26 305 65 560
General TV drama
2015/16 44 310 8 31 52 341
2016/17 44 314 7 44 51 358
2017/18 36 295 2 4 38 299
2018/19 36 326 8 113 44 439
2019/20 20 198 3 1 23 199
5-yr av 36 289 6 38 42 327
Children’s TV drama
2015/16 14 66 0 0 14 66
2016/17 12 43 1 4 13 47
2017/18 10 49 0 0 10 49
2018/19 17 101 4 7 21 108
2019/20 12 46 3 6 15 52
5-yr av 13 61 2 3 15 64
Online drama
2016/17 29 26 0 0 29 26
2017/18 22 54 0 0 22 54
2018/19 30 49 2 <1 32 49
2019/20 23 94 12 186 35 280
Total annual drama slate3
2015/16 97 573 30 292 127 866
2016/17 137 674 34 634 171 1308
2017/18 110 658 33 129 143 787
2018/19 126 797 43 416 169 1213
2019/20 74 543 41 447 115 991
5-yr av 109 649 36 384 145 1033
Total drama expenditure in Australia in 2019/20 was $991 million. Expenditure triggered by Australian titles fell 32% to $543 million. Foreign spend of $447 million exceeded the 5-year average.
Notes: Figures may not total exactly due to rounding.n.p. Not for publication due to confidentiality reasons.1. See page 5 for definitions. 2. Includes both productions that started principal photography during the year and foreign productions undertaking only PDV work in Australia.3. The annual slate is defined as productions that started principal photography during the year.
9
The Drama Report 2019/20 | Screen Australia
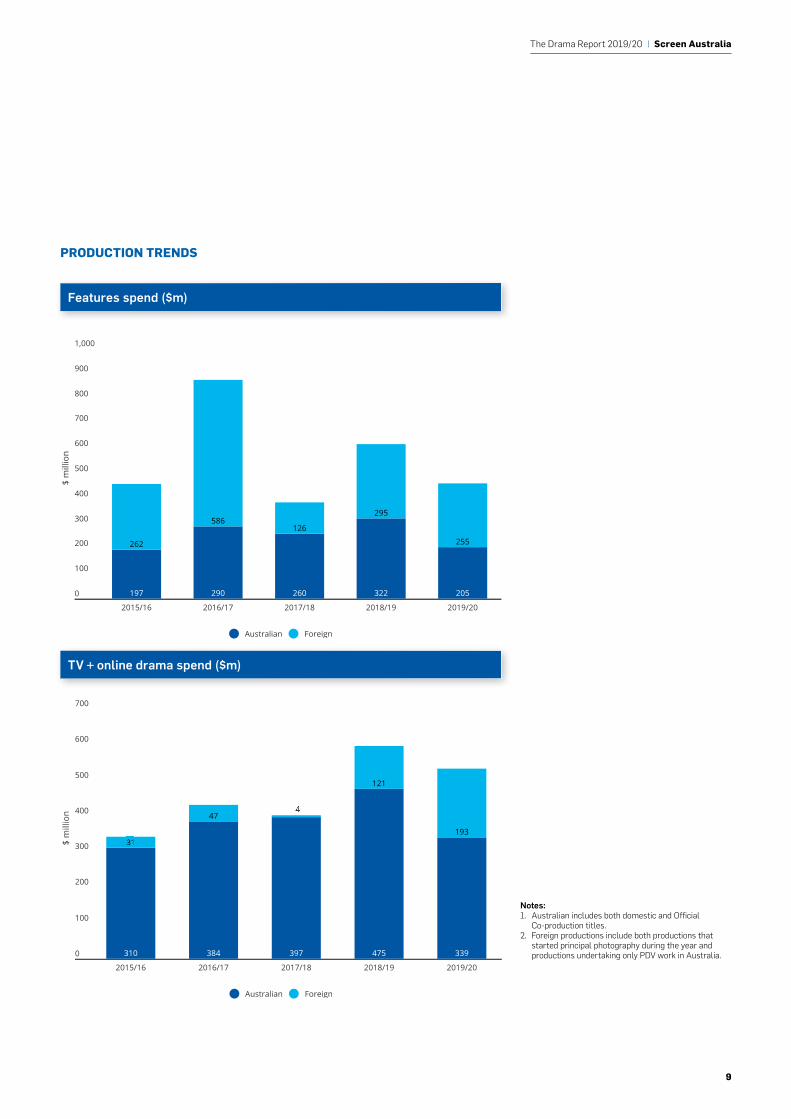
PRODUCTION TRENDS
Notes: 1. Australian includes both domestic and Official
Co-production titles.2. Foreign productions include both productions that
started principal photography during the year and productions undertaking only PDV work in Australia.
TV + online drama spend ($m)
Features spend ($m)
PRODUCTION TRENDSFEATURES SPEND ($M)
1,000
900
800
700
600
500
400
300
200
100
0
2015/16 2016/17 2017/18 2018/19 2019/20
197
262
290
586
260
126
322
295
205
255
$ m
illio
n
Australian Foreign
TV + ONLINE DRAMA SPEND ($M)
700
600
500
400
300
200
100
0
2015/16 2016/17 2017/18 2018/19 2019/20
310 384
47
397 475
121
339
193
$ m
illio
n
Australian Foreign

10
Australian feature slate
In 2019/20, total expenditure on Australian features was $205 million – 36% below the previous year and 20% below the 5-year average. Domestic expenditure was down by 31% on 2018/19. Two Co-productions started principal photography in 2019/20 – Falling for Figaro and The Power of the Dog.
Domestic features1 Co-production features1 Total
No.
titlesSpend
$mNo.
titlesSpend
$mNo.
titlesSpend
$m
2015/16 38 n.p. 1 n.p. 39 197
2016/17 49 266 3 24 52 290
2017/18 38 180 4 80 42 260
2018/19 39 288 4 34 43 322
2019/20 17 199 2 6 19 205
5-yr av 36 222 3 33 39 255
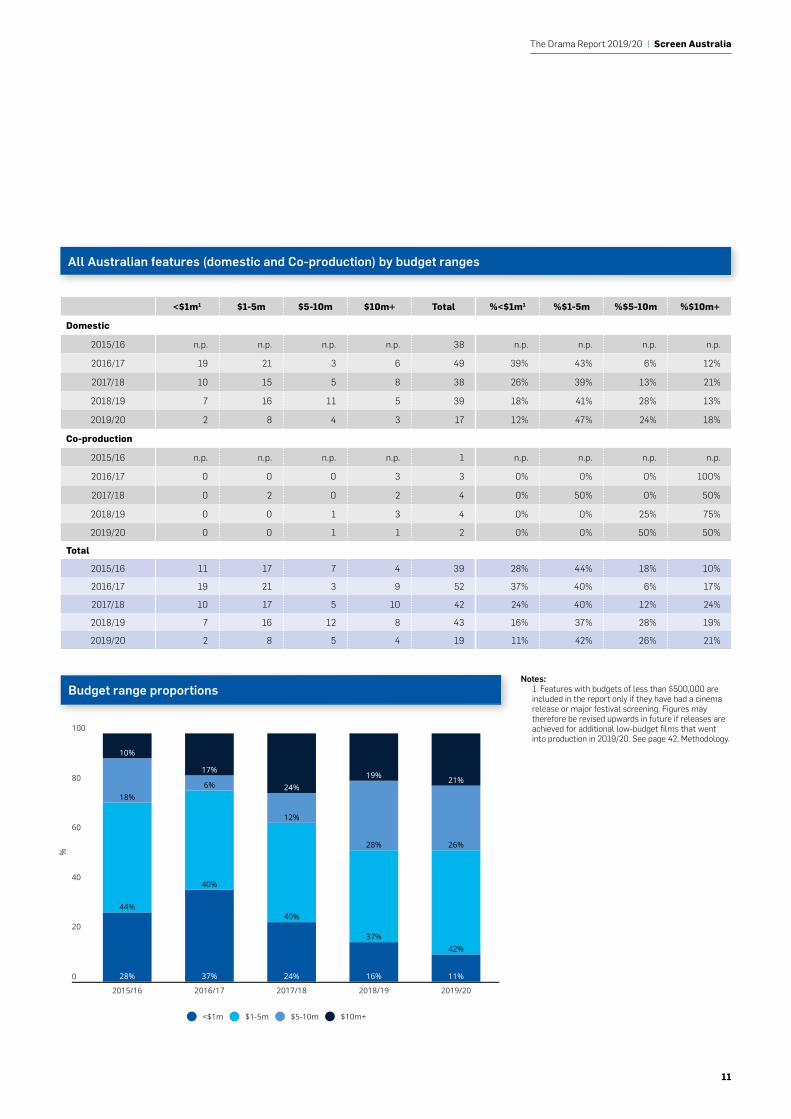
All Australian featuresThe 19 features that started production in 2019/20 had total budgets of $259 million, with the largest proportion (79%) being made for under $10 million. The proportion of features being made in the sub-$1 million range has declined steadily over the last four years, while production in the $1-5 million range has remained relatively consistent. Despite the effects of the COVID-19 pandemic, there was little change in the proportion of titles in each budget range.
Australian feature films - impact of COVID-19
• Eight features that entered production in 19/20 had their shoot interrupted due to COVID-19.
• Principal photography of nine features was reported to have been postponed due to COVID-19. Total budgets of these titles is estimated to approach $250 million.
The Drover’s Wife: The Legend of Molly Johnson
Notes: Figures may not total exactly due to rounding.n.p. Not for publication due to confidentiality reasons.1. See page 5 for definitions.
11
The Drama Report 2019/20 | Screen Australia
All Australian features (domestic and Co-production) by budget ranges
Budget range proportions
<$1m1 $1-5m $5-10m $10m+ Total %<$1m1 %$1-5m %$5-10m %$10m+
Domestic
2015/16 n.p. n.p. n.p. n.p. 38 n.p. n.p. n.p. n.p.
2016/17 19 21 3 6 49 39% 43% 6% 12%
2017/18 10 15 5 8 38 26% 39% 13% 21%
2018/19 7 16 11 5 39 18% 41% 28% 13%
2019/20 2 8 4 3 17 12% 47% 24% 18%
Co-production
2015/16 n.p. n.p. n.p. n.p. 1 n.p. n.p. n.p. n.p.
2016/17 0 0 0 3 3 0% 0% 0% 100%
2017/18 0 2 0 2 4 0% 50% 0% 50%
2018/19 0 0 1 3 4 0% 0% 25% 75%
2019/20 0 0 1 1 2 0% 0% 50% 50%
Total
2015/16 11 17 7 4 39 28% 44% 18% 10%
2016/17 19 21 3 9 52 37% 40% 6% 17%
2017/18 10 17 5 10 42 24% 40% 12% 24%
2018/19 7 16 12 8 43 16% 37% 28% 19%
2019/20 2 8 5 4 19 11% 42% 26% 21%
Notes: 1. Features with budgets of less than $500,000 are included in the report only if they have had a cinema release or major festival screening. Figures may therefore be revised upwards in future if releases are achieved for additional low-budget films that went into production in 2019/20. See page 42, Methodology.
BUDGET RANGE PROPORTIONS
100
80
60
40
20
0
2015/16 2016/17 2017/18 2018/19 2019/20
28%
44%
18%
10%
37%
40%
6%
17%
24%
40%
12%
24%
16%
37%
28%
19%
11%
42%
26%
21%
%
<$1m $1-5m $5-10m $10m+

12
Contributions to the annual Australian feature slate (domestic and Co-production)
No. of titles Amount $m % of total finance
Australian direct government sources (does not include the Producer Offset)1
2015/16 22 32 15%
2016/17 28 29 8%
2017/18 31 44 16%
2018/19 29 47 13%
2019/20 13 12 5%
5-yr av 25 33 11%
Australian Producer Offset2
2015/16 n.p. 66 31%
2016/17 n.p. 102 29%
2017/18 n.p. 92 33%
2018/19 n.p. 112 32%
2019/20 n.p. 73 28%
5-yr av 32 89 31%
Australian private investors
2015/16 27 12 6%
2016/17 34 25 7%
2017/18 25 20 7%
2018/19 25 15 4%
2019/20 11 8 3%
5-yr av 24 16 5%
Australian screen industry3
2015/16 32 31 15%
2016/17 37 32 9%
2017/18 38 38 14%
2018/19 38 49 14%
2019/20 13 20 8%
5-yr av 32 34 12%
Foreign investors
2015/16 18 69 33%
2016/17 25 163 47%
2017/18 24 83 30%
2018/19 19 128 36%
2019/20 14 146 56%
5-yr av 20 118 41%
SOURCES OF FINANCE FOR AUSTRALIAN FEATURESThe sources of finance for Australian features can vary significantly from one year to the next. High-budget, principally foreign-financed titles cause large fluctuations. In 2019/20, with the exception of foreign investors, all contributions fell below the 5-year average.
Foreign investors provided the majority of finance: $146 million to 14 titles (56% of total finance).
The Producer Offset contributed $73 million to projects, accounting for 28% of total finance.
Funding from Australian direct government sources fell to $12 million (5% of total finance) for 13 titles. Screen Australia contributed $6 million to six features with the state agencies providing $6 million to 12 titles. One local council provided funding for a feature film shooting in its community.
The Australian screen industry (mainly distribution and production companies) contributed $20 million to 13 features (8% of total finance).
Australian private investment was $8 million for 11 titles (3% of total finance).
Notes: Figures may not total exactly due to rounding. Please note that finance sources reflect data available at time of data collection and are subject to possible revision.n.p. Not for publication due to confidentiality reasons.1. Includes direct funding from Australian state and
federal agencies and funding bodies for titles that commenced principal photography during a given financial year (see page 13). Equity investments and grants only – distribution guarantees, loans and underwriting are not included.
2. The Producer Offset amount is taken from the finance plan of each title. For Screen Australia funded projects – the agency only requires 90% of the anticipated Offset to be included in the finance plan for drama features and television projects. A producer is entitled to retain the difference for their own purposes, but many producers still include it in the finance plan. For this reason, the Producer Offset amounts listed above may be lower than what is eventually received from the Australian Taxation Office for each project.
3. Finance provided by Australian-based producers and production companies, distribution companies, free-to-air broadcasters (commercial and public), subscription TV channels and VOD platforms. The Producer Offset, cashflowed in various ways, is listed separately.
13
The Drama Report 2019/20 | Screen Australia
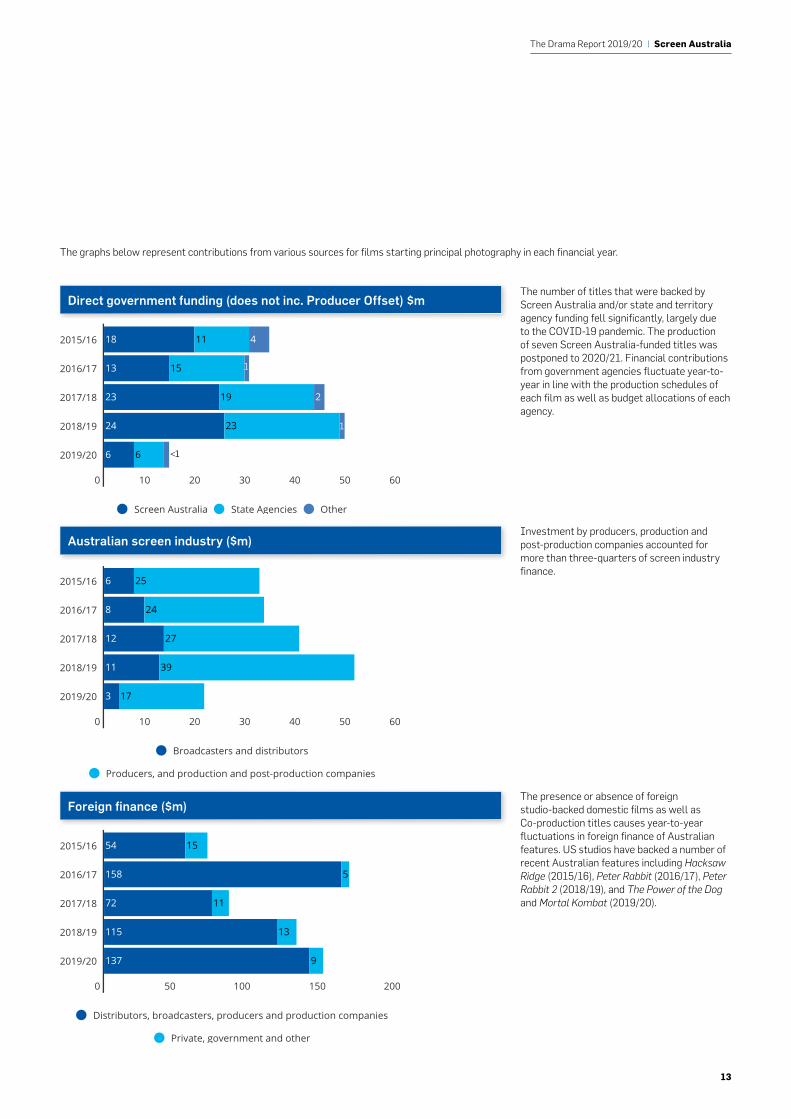
The number of titles that were backed by Screen Australia and/or state and territory agency funding fell significantly, largely due to the COVID-19 pandemic. The production of seven Screen Australia-funded titles was postponed to 2020/21. Financial contributions from government agencies fluctuate year-to-year in line with the production schedules of each film as well as budget allocations of each agency.
Investment by producers, production and post-production companies accounted for more than three-quarters of screen industry finance.
The presence or absence of foreign studio-backed domestic films as well as Co-production titles causes year-to-year fluctuations in foreign finance of Australian features. US studios have backed a number of recent Australian features including Hacksaw Ridge (2015/16), Peter Rabbit (2016/17), Peter Rabbit 2 (2018/19), and The Power of the Dog and Mortal Kombat (2019/20).
The graphs below represent contributions from various sources for films starting principal photography in each financial year.
Direct government funding (does not inc. Producer Offset) $m
Australian screen industry ($m)
Foreign finance ($m)
Direct Government funding (does not inc. ProducerOset) $m
2015/16
2016/17
2017/18
2018/19
2019/20
0 10 20 30 40 50 60
18 11 4
13 15
23 19 2
24 23
6 6
Screen Australia State Agencies Other
Australian screen industry ($m)
2015/16
2016/17
2017/18
2018/19
2019/20
0 10 20 30 40 50 60
6 25
8 24
12 27
11 39
3 17
Broadcasters and distributors
Producers, and production and post-production companies
Foreign nance ($m)
2015/16
2016/17
2017/18
2018/19
2019/20
0 50 100 150 200
54 15
158 5
72 11
115 13
137 9
Distributors, broadcasters, producers and production companies
Private, government and other
1
1
<1
Direct Government funding (does not inc. ProducerOset) $m
2015/16
2016/17
2017/18
2018/19
2019/20
0 10 20 30 40 50 60
18 11 4
13 15
23 19 2
24 23
6 6
Screen Australia State Agencies Other
Australian screen industry ($m)
2015/16
2016/17
2017/18
2018/19
2019/20
0 10 20 30 40 50 60
6 25
8 24
12 27
11 39
3 17
Broadcasters and distributors
Producers, and production and post-production companies
Foreign nance ($m)
2015/16
2016/17
2017/18
2018/19
2019/20
0 50 100 150 200
54 15
158 5
72 11
115 13
137 9
Distributors, broadcasters, producers and production companies
Private, government and other

14
Feature film financing - impact of COVID-19
• Many features reported increased costs related to COVID-safe work practices, insurance, scheduling changes, travel restrictions, and remote working through production and post-production. Some titles used improvised home studios and green screen setups for pickups and ADR.
• Some titles reported losing key cast and crew, as the pandemic disrupted production schedules and access to locations.
• One title reported it was forced to stand down all cast and crew and put the entire production on hold, as the story is based on social activities that cannot take place under current COVID-related safety measures.
• Several titles received increased funding from Screen Australia and state and territory agencies to assist with additional costs. Some titles sought increased reinvestments, while others saw the producer/ production company taking on all additional costs at time of survey.
• Titles which shifted production to 2020/21 reported various disruptions to their financing: one title lost access to international actors which forced finance changes and pushed the budget down, while others sought out additional finance to cover projected budget increases of 10-15%.
Long Story Short
15
The Drama Report 2019/20 | Screen Australia
Australian general TV drama slate
General TV drama is drama made for adult, teen and/or family audiences. It does not include children’s drama, which is reported separately. This section of the report was previously labelled “Australian TV drama” – the change in name is intended to clarify meaning only, and does not include any further change to methodology.
Expenditure on Australian general TV drama was down 39% on 2018/19’s record spend. $198 million was spent on 20 general TV drama titles that commenced production and generated 351 hours of content. These titles had total budgets of $198 million. Across the total general TV drama slate, hours, budgets, spend, and average cost per hour were the lowest in over ten years.
Australian general TV drama - impact of COVID-19
• Five general TV dramas that entered production in 2019/20 had their shoot interrupted due to COVID.
• Evidence suggests that seven general TV drama titles, with combined budgets of more than $45 million, were postponed due to COVID-19.
• The COVID-19 pandemic inspired or influenced the creation of several general TV dramas, including At Home Alone Together, Housos vs Virus: The Lockdown and Retrograde.
• Commercial free-to-air broadcasters have Australian drama broadcast quota obligations, and subscription television licensees have minimum Australian drama spend obligations. Due to the effect of COVID-19 on the production pipeline, in April, the Australian Communications and Media Authority (ACMA) announced it would not take action against broadcasters and licensees that did not comply with these Australian drama obligations for 2020. In September 2020, the Australian Government announced changes to these obligations: from January 2021, commercial free-to-air broadcasters must broadcast 250 points of content, which may include adults and children’s drama, acquired feature films, and documentaries. The Government also announced it would move to halve the subscription television drama spend obligation from July 1, 2021.
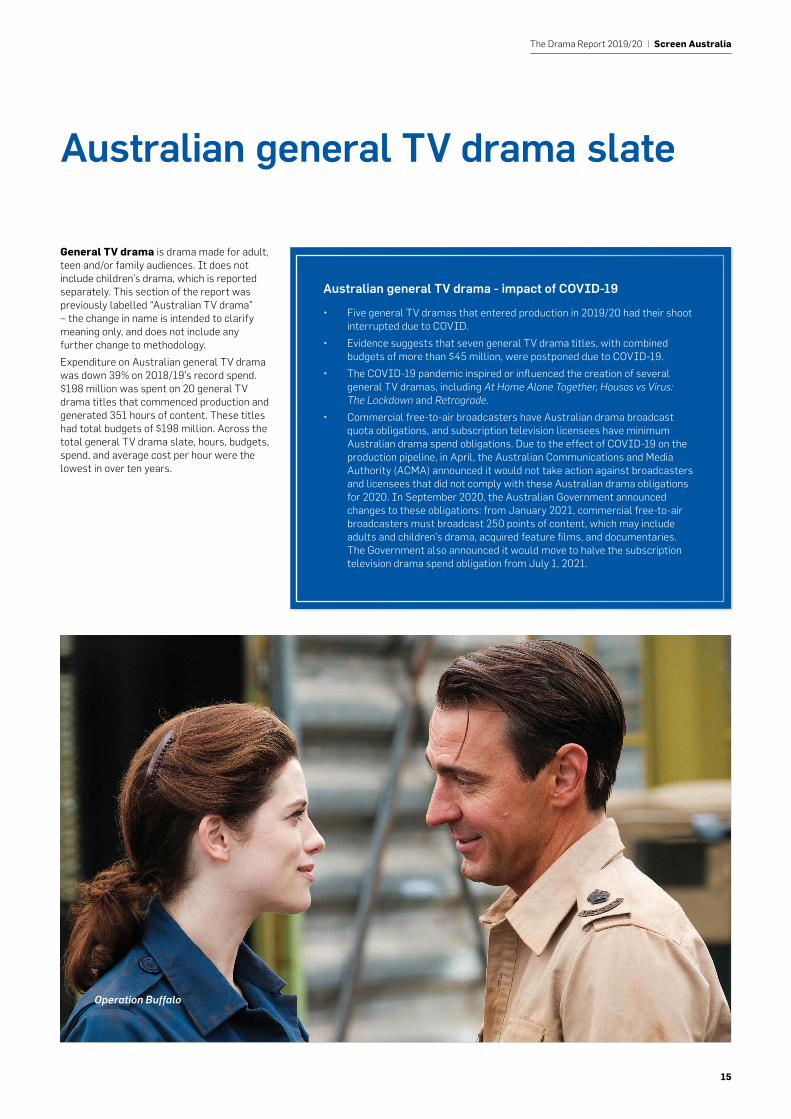
Operation Buffalo

16
Domestic1 Co-production1 Total Australian1
No. titles Hours2 Spend $m3 No. titles Hours2 Spend $m3 No. titles Hours2 Spend $m3
2015/16 44 446 310 0 0 0 44 446 310
2016/17 43 447 n.p. 1 6 n.p. 44 453 314
2017/18 36 423 295 0 0 0 36 423 295
2018/19* 36 435 326 0 0 0 36 435 326
2019/20* 20 351 198 0 0 0 20 351 198
5-yr av 36 420 287 0 1 2 36 421 289
Notes: Figures may not total exactly due to rounding. The annual slate is defined as productions starting principal photography during the year.Since 2016/17, titles produced for subscription video-on-demand and broadcaster-affiliated services have been classified as online drama. In previous years, these were captured as TV drama. Time-series analysis should be done with caution, and account for online drama production data, which is detailed later in this report. * Excludes general TV drama titles that were released online before TV broadcast:2018/19: The Secret She Keeps (4.5 hours, 10play and 10) 2019/20: How to Stay Married series 2 (3 hours, 10play and 10), Drunk History Australia (4.5 hours, 10play and 10) From 2019/20, TV drama, made for family or adult audiences, was re-labelled General TV drama. The methodology remains unchanged.1. See page 5 for definitions2. Commercial broadcast hours rather than actual running time. Individual program duration has been rounded to 15, 30 or 60 minutes as appropriate (including commercial breaks)3. Amount of total budgets spent in Australia
Australian general TV drama slate
Hours produced Spend ($m)AUSTRALIAN TV DRAMA: HOURS PRODUCED
2015/16
2016/17
2017/18
2018/19
2019/20
0 100 200 300 400 500
274 162
295 153
296 122
296 138
293 58
Series/serials Mini-series Telemovies
AUSTRALIAN TV DRAMA: SPEND $M
2015/16
2016/17
2017/18
2018/19
2019/20
0 50 100 150 200 250 300 350
78 220
105 202
98 186
122 202
102 96
Series/serials Mini-series Telemovies
10 11
11
85
5
1 1
0 0
17
The Drama Report 2019/20 | Screen Australia
BY FORMATFormat definitions according to this report:
• Series/serials – unlimited number of episodes (more than 13 in total) as well as multi-part programs with episode durations less than one commercial broadcast hour.
• Mini-series – a limited series of drama normally 13 hours or less in length and each episode is usually a commercial hour in duration.
• Telemovies – single-episode drama made for television that is a commercial hour or more in length. Series of, or related telemovies are counted as individual titles, as set out in a broadcaster’s licence agreement.
Just 11 series/serials entered production in 2019/20. Expenditure, budgets and cost per hour were all down by around 15%. Hours were stable, largely due to the presence of perennial serials Home and Away (Seven) and Neighbours (10).
Other returning titles included The Heights (ABC), Housos vs Virus: The Lockdown (Seven), Rosehaven (ABC) and Kinne Tonight (10). New series in production included Regular Old Bogan (Seven), Retrograde (ABC) and Metro Sexual (9Go!). See page 39 for full list.
Mini-series production was heavily impacted by the COVID-19 pandemic: expenditure, on just nine titles, fell by 53% on 2018/19. Budgets also fell by 53% and hours by 58%. Cost per hour rose by 12%.
Season returns included Five Bedrooms (10), Harrow (ABC), and Mystery Road (ABC), while Fat Pizza: Back in Business (Seven) and Halifax: Retribution (Nine) saw the return of well-known characters. New mini-series titles included Informer 3838 (Nine), Operation Buffalo (ABC), Wakefield (ABC) and With Intent (the UK’s Channel 5, and 10). See pages 39-40 for full list.
No telemovies for general audiences commenced production in 2019/20.
Five Bedrooms
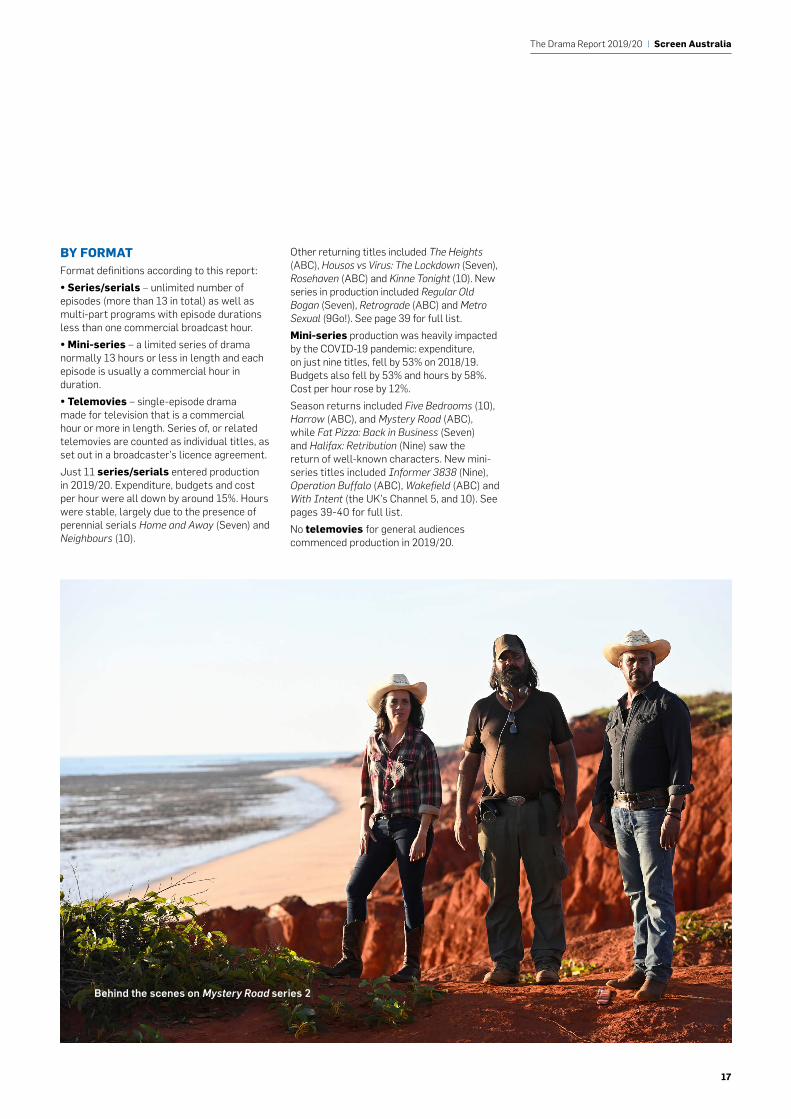
Behind the scenes on Mystery Road series 2

18
No. Hours1 Budgets
($m)2
Total spend ($m)3
Avg. cost/hr4
Series/serials (in-house productions in brackets)
2015/16 15 (1) 274 78 78 0.286
2016/17 21 (1) 295 105 105 0.355
2017/18 14 (1) 296 98 98 0.333
2018/19 17 (1) 296 123 122 0.414
2019/20 11 (3) 293 102 102 0.350
5-yr av 16 (1) 291 101 101 0.348
Mini-series (in-house productions in brackets)
2015/16 23 162 222 220 1.368
2016/17 20 153 205 202 1.339
2017/18 19 122 191 186 1.567
2018/19 18 (2) 138 203 202 1.470
2019/20 9 58 96 96 1.653
5-yr av 18 127 183 181 1.479
Telemovies (in-house productions in brackets)
2015/16 6 10 15 11 1.534
2016/17 3 5 8 8 1.738
2017/18 3 5 11 11 2.296
2018/19 1 1 1 1 1.011
2019/20 0 0 0 0 0.000
5-yr av 3 4 7 6 1.316
Total (in-house productions in brackets)
2015/16 44 (1) 446 315 310 0.706
2016/17 44 (1) 453 318 314 0.702
2017/18 36 (1) 423 301 295 0.711
2018/19 36 (3) 435 327 326 0.751
2019/20 20 (3) 351 198 198 0.566
5-yr av 36 (2) 421 292 289 0.687
Notes: Figures may not total exactly due to rounding.1. Commercial broadcast hours rather than actual running time. Individual program duration has been
rounded to 15, 30 or 60 minutes as appropriate (including commercial breaks) 2. Total cost of productions3. Amount of total budgets spent in Australia4. Total budgets divided by total hours
Australian general TV drama slate
At Home Alone Together
Halifax: Retribution

19
The Drama Report 2019/20 | Screen Australia
BlueyFive Bedrooms series 2
20
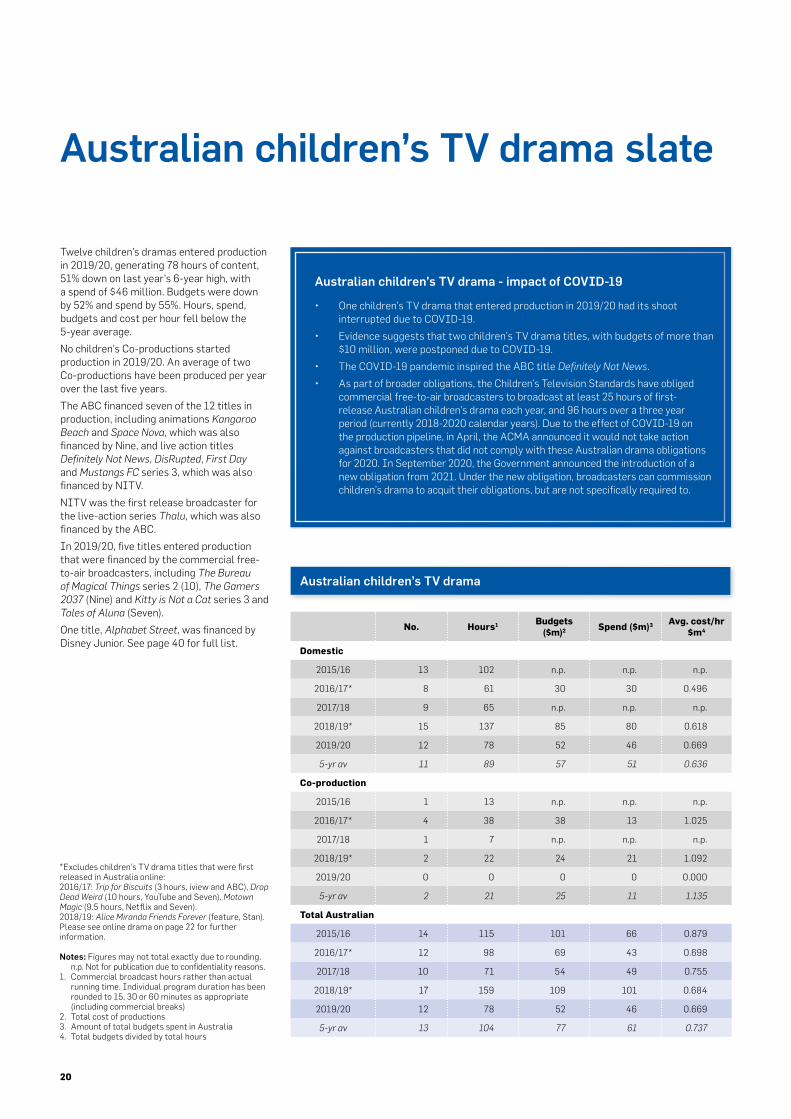
Twelve children’s dramas entered production in 2019/20, generating 78 hours of content, 51% down on last year’s 6-year high, with a spend of $46 million. Budgets were down by 52% and spend by 55%. Hours, spend, budgets and cost per hour fell below the 5-year average.
No children’s Co-productions started production in 2019/20. An average of two Co-productions have been produced per year over the last five years.
The ABC financed seven of the 12 titles in production, including animations Kangaroo Beach and Space Nova, which was also financed by Nine, and live action titles Definitely Not News, DisRupted, First Day and Mustangs FC series 3, which was also financed by NITV.
NITV was the first release broadcaster for the live-action series Thalu, which was also financed by the ABC.
In 2019/20, five titles entered production that were financed by the commercial free-to-air broadcasters, including The Bureau of Magical Things series 2 (10), The Gamers 2037 (Nine) and Kitty is Not a Cat series 3 and Tales of Aluna (Seven).
One title, Alphabet Street, was financed by Disney Junior. See page 40 for full list.
Australian children’s TV drama slate
*Excludes children’s TV drama titles that were first released in Australia online:2016/17: Trip for Biscuits (3 hours, iview and ABC), Drop Dead Weird (10 hours, YouTube and Seven), Motown Magic (9.5 hours, Netflix and Seven).2018/19: Alice Miranda Friends Forever (feature, Stan).Please see online drama on page 22 for further information.
Notes: Figures may not total exactly due to rounding. n.p. Not for publication due to confidentiality reasons.
1. Commercial broadcast hours rather than actual running time. Individual program duration has been rounded to 15, 30 or 60 minutes as appropriate (including commercial breaks)
2. Total cost of productions3. Amount of total budgets spent in Australia4. Total budgets divided by total hours
No. Hours1 Budgets ($m)2 Spend ($m)3 Avg. cost/hr
$m4
Domestic
2015/16 13 102 n.p. n.p. n.p.
2016/17* 8 61 30 30 0.496
2017/18 9 65 n.p. n.p. n.p.
2018/19* 15 137 85 80 0.618
2019/20 12 78 52 46 0.669
5-yr av 11 89 57 51 0.636
Co-production
2015/16 1 13 n.p. n.p. n.p.
2016/17* 4 38 38 13 1.025
2017/18 1 7 n.p. n.p. n.p.
2018/19* 2 22 24 21 1.092
2019/20 0 0 0 0 0.000
5-yr av 2 21 25 11 1.135
Total Australian
2015/16 14 115 101 66 0.879
2016/17* 12 98 69 43 0.698
2017/18 10 71 54 49 0.755
2018/19* 17 159 109 101 0.684
2019/20 12 78 52 46 0.669
5-yr av 13 104 77 61 0.737
Australian children’s TV drama - impact of COVID-19
• One children’s TV drama that entered production in 2019/20 had its shoot interrupted due to COVID-19.
• Evidence suggests that two children’s TV drama titles, with budgets of more than $10 million, were postponed due to COVID-19.
• The COVID-19 pandemic inspired the ABC title Definitely Not News.
• As part of broader obligations, the Children’s Television Standards have obliged commercial free-to-air broadcasters to broadcast at least 25 hours of first-release Australian children’s drama each year, and 96 hours over a three year period (currently 2018-2020 calendar years). Due to the effect of COVID-19 on the production pipeline, in April, the ACMA announced it would not take action against broadcasters that did not comply with these Australian drama obligations for 2020. In September 2020, the Government announced the introduction of a new obligation from 2021. Under the new obligation, broadcasters can commission children’s drama to acquit their obligations, but are not specifically required to.
Australian children’s TV drama

21
The Drama Report 2019/20 | Screen Australia
The proportion of animated titles produced has declined over the last five years, with live-action titles accounting for around half of the yearly slate in the last two years. Live action and animated titles have contributed relatively equal amounts of budget and spend in the last three years.
*Excludes children’s TV drama titles that were first released in Australia online:2016/17: Trip for Biscuits (3 hours, iview and ABC), Drop Dead Weird (10 hours, YouTube and Seven), Motown Magic (9.5 hours, Netflix and Seven).2018/19: Alice Miranda Friends Forever (feature, Stan).Please see online drama for further information.
Notes: Figures may not total exactly due to rounding. n.p. Not for publication due to confidentiality reasons.1. Commercial broadcast hours rather than actual
running time. Individual program duration has been rounded to 15, 30 or 60 minutes as appropriate (including commercial breaks)
2. Total cost of productions3. Amount of total budgets spent in Australia4. Total budgets divided by total hours5. Includes one hybrid animation/live action title
No. Hours1 Budgets ($m)2 Spend ($m)3 Avg. cost/hr
$m4
Live action
2015/16 4 20 20 20 0.983
2016/17* 5 26 24 16 0.946
2017/18 4 24 23 23 0.974
2018/19* 9 80 49 46 0.612
2019/20 6 32 24 24 0.760
5-yr av 6 36 28 26 0.855
Animation
2015/16 10 95 81 47 0.856
2016/175* 7 73 44 27 0.609
2017/185 6 48 31 26 0.647
2018/195* 8 79 60 54 0.757
2019/205 6 46 28 21 0.607
5-yr av 7 68 49 35 0.695
Total children’s
2015/16 14 115 101 66 0.879
2016/17* 12 98 69 43 0.698
2017/18 10 71 54 49 0.755
2018/19* 17 159 109 101 0.684
2019/20 12 78 52 46 0.669
5-yr av 13 104 77 61 0.737
Australian children’s TV drama
Thalu

22
Australian online drama slate
Notes: Figures may not total exactly due to rounding. n.p. Not for publication due to confidentiality reasons.1. Actual running time 2. Total cost of productions3. Amount of total budgets spent in Australia4. Total budgets divided by total hours
Please note that titles that have simultaneous TV broadcast and online releases have been classified as ‘TV drama’.
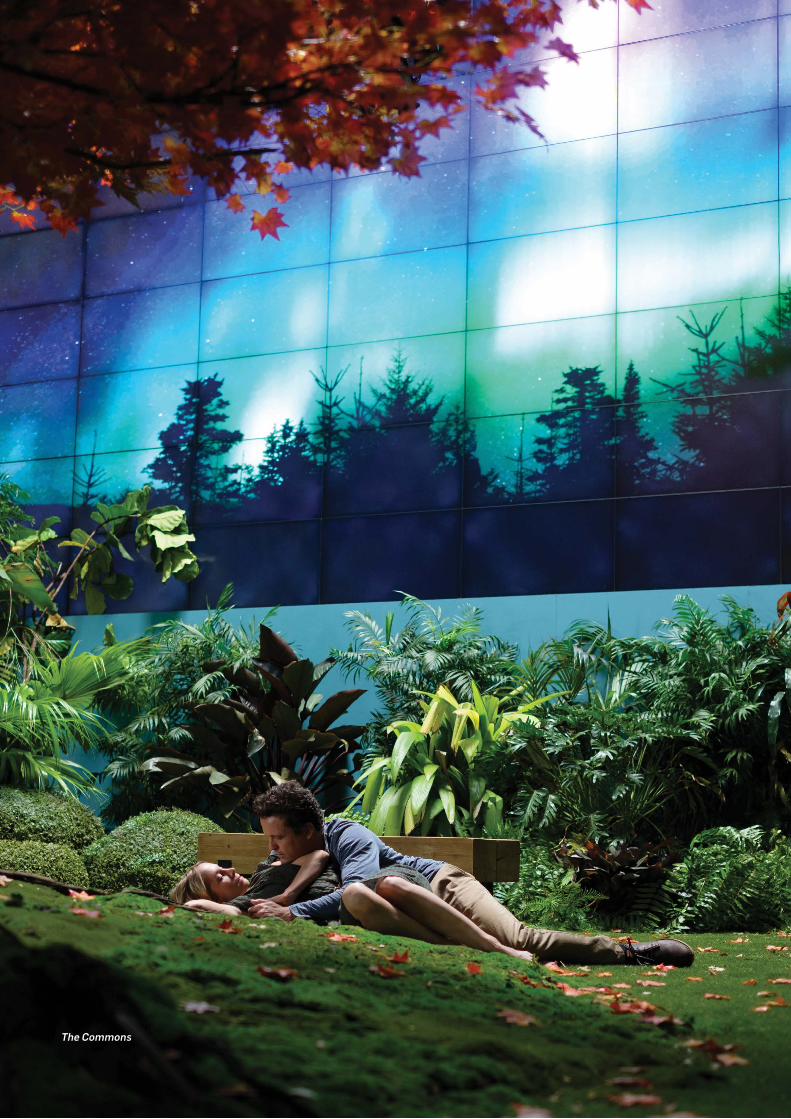
In 2019/20, 23 titles were first released online, all of which were series. While fewer titles were produced in 2019/20 compared to last year, hours increased by 16%. Considerable increases in budgets and spend can largely be attributed to two larger-budget titles for SVOD platforms. A much greater proportion of budgets was spent in Australia this year, with total spend rising 95%.
Returning titles included Bloom (Stan) and Meta Runner (YouTube). New titles included Back to the Rafters (Amazon Prime), Clickbait (Netflix), The Commons and Dom and Adrian: 2020 (Stan), Drunk History Australia and Neighbours: Erinsborough High (10play) and Why Are You Like This? (ABC iview). Series two of How to Stay Married was released on 10play in March ahead of its free-to-air broadcast in May, and is included as online drama. Series two of How to Stay Married was released on 10play in March ahead of its free-to-air broadcast in May, and is included as online drama. Please see page 40 for full list.
No. Hours1 Budgets ($m)2 Spend ($m)3Avg. cost/hr
$m4
Single-episode
2016/17 6 5 2 2 0.501
2017/18 1 2 n.p. n.p. n.p.
2018/19 3 3 3 1 0.942
2019/20 0 0 0 0 0.000
Series
2016/17 23 53 53 24 1.009
2017/18 21 42 n.p. n.p. n.p.
2018/19 27 45 60 47 1.336
2019/20 23 56 97 94 1.742
Total
2016/17 29 57 55 26 0.967
2017/18 22 43 54 54 1.243
2018/19 30 48 63 49 1.310
2019/20 23 56 97 94 1.742
This report classifies ‘online drama’ as single episode or series titles with total durations of 30 minutes or more that have premiered in Australia online. Broadly speaking, online titles are titles released via: SVOD (e.g. Stan), BVOD (e.g. ABC iview), AVOD (e.g. YouTube) and TVOD (e.g. iTunes).
Australian online drama
Australian online drama - impact of COVID-19
• Two online dramas that entered production in 2019/20 had their shoot halted or interrupted due to COVID-19.
• Evidence suggests that eight online drama titles, with budgets approaching $20 million, were postponed due to COVID-19.
• Online dramas Cancelled, Dom and Adrian: 2020 and Loving Captivity were created in response to the COVID-19 pandemic.

23
The Drama Report 2019/20 | Screen Australia
The Australian screen industry provided 42% of the finance to this year’s Australian TV and online drama titles – one per cent higher than last year’s share, and made up of $144 million to 48 titles.
The Producer Offset provided $32 million and made up 9% of total finance, below the 5-year average of 11%.
The Location and PDV Offsets have been combined to ensure data confidentiality. Seven titles accessed either the Location or PDV Offset, and the Offsets contributed a combined $10 million in finance.
Direct government sources provided $44 million for 41 titles, or 13% of total finance. Screen Australia provided $18 million to 30 TV and online drama titles that commenced principal photography during the year (55% of all titles in the Australian TV and online drama slate).
Collectively, funding from the state and territory agencies remained healthy - $21 million for 33 titles. A higher than average number of titles received larger amounts of funding in order to undertake production in a particular state. Screen NSW, Film Victoria and Screenwest provided the majority of the funds (82%).
The Australian Government provided direct funding via the Location Incentive to one title, Clickbait.
Foreign investment in Australian TV and online drama fell by 27%, to $117 million, but was still close to the 5-year average, and as a proportion of total finance, was the highest since 2001/02.
Australian private investment was below $1 million - the lowest contributor to overall finance.
No. of titles Amount $m % of total finance
Australian direct government sources (does not include the Producer Offset)1
2015/16 47 44 11%
2016/17 63 39 9%
2017/18 61 47 12%
2018/19 74 64 13%
2019/20 41 44 13%
5-yr av 57 48 11%
Australian Producer Offset2
2015/16 n.p. 46 11%
2016/17 n.p. 53 12%
2017/18 n.p. 54 13%
2018/19 n.p. 65 13%
2019/20 n.p. 32 9%
5-yr av 41 50 11%
Location/PDV Offset
2015/16 12 11 3%
2016/17 5 4 1%
2017/18 4 5 1%
2018/19 9 8 2%
2019/20 7 10 3%
5-yr av 7 8 2%
Australian private investors
2015/16 5 2 1%
2016/17 7 6 1%
2017/18 11 1 <1%
2018/19 5 <1 <1%
2019/20 4 1 <1%
5-yr av 6 2 <1%
Australian screen industry3
2015/16 57 200 48%
2016/17 80 234 53%
2017/18 63 188 46%
2018/19 76 203 41%
2019/20 48 144 42%
5-yr av 65 194 44%
Foreign investors
2015/16 34 111 27%
2016/17 39 106 24%
2017/18 37 113 28%
2018/19 38 159 32%
2019/20 23 117 34%
5-yr av 34 121 27%
Notes: Figures may not total exactly due to rounding. Please note that finance sources reflect data available at time of data collection and are subject to possible revision.1. Includes direct funding from federal, state, and
territory agencies, funding bodies and government departments for titles that commenced principal photography during a given financial year (see page 25). Equity investments and grants only – distribution guarantees, loans and underwriting are not included. Does not include the Producer Offset.
2. The Producer Offset amount is taken from the finance plan of each title. For Screen Australia funded projects – the agency only requires 90% of the anticipated Offset to be included in the finance plan for features and television projects. A producer is entitled to retain the difference for their own purposes, but many producers still include it in the finance plan. For this reason, the Producer Offset amounts listed above may be lower than what is eventually received from the Australian Taxation Office for each project.
3. Finance provided by Australian-based producers and production companies, distribution companies, free-to-air broadcasters (commercial and public), subscription TV channels and VOD services. The Producer Offset, cashflowed in various ways, is listed separately.
Contributions to the annual Australian TV/online slate
Sources of finance for Australian TV and online drama
24
The Commons

25
The Drama Report 2019/20 | Screen Australia
The number of titles that were backed by Screen Australia and/or state and territory agency funding fell significantly, largely due to the COVID-19 pandemic. The production of 15 Screen Australia funded titles was postponed to 2020/21.
The graphs below represent contributions from various sources for TV and online drama titles starting principal photography in each financial year.
2016/17 marked a record year for TV drama production and Australian screen industry finance. 2019/20 broadcaster finance accounted for 87% of all screen industry finance, but was well below the 5-year average.
Australian drama has attracted increased foreign finance in recent years, with 2018/19 marking a significant increase including contributions from a diversity of foreign distributors, broadcasters and production companies. Despite the crisis presented by the global pandemic, foreign investment in titles that entered production in 2019/20 was the second-highest since 2001/02.
Direct government funding (does not inc. Producer Offset) $m
Australian screen industry ($m)
Foreign finance ($m)
Direct Government funding (does not inc. ProducerOset) $m
2015/16
2016/17
2017/18
2018/19
2019/20
0 10 20 30 40 50 60 70
27 12 4
24 14
25 22
37 25 2
18 21 5
Screen Australia State Agencies Other
Australian screen industry ($m)
2015/16
2016/17
2017/18
2018/19
2019/20
0 20 40 60 80 100 120 140 160 180 200 220 240
194
213 20
178
189 14
130 15
Broadcasters and distributors
Producers, and production and post-production companies
Foreign nance ($m)
2015/16
2016/17
2017/18
2018/19
2019/20
0 20 40 60 80 100 120 140 160 180
100 12
91 16
107 6
150 8
112 5
Distributors, broadcasters, producers and production companies
Private, government and other
<1
<1

26
Australian TV and online drama financing – impact of COVID-19
• Many titles reported increased costs due to COVID-19, including costs related to COVID-safe work practices, insurance, scheduling changes, national and international travel restrictions, and remote working.
• Several titles received increased funding from Screen Australia and state and territory agencies to assist with additional costs. Some titles sought increased reinvestments, while others saw the producer/production company taking on all additional costs at time of survey.
• Titles which shifted production to 2020/21 have had their finance plans disrupted in various ways, with contributions from screen industry and other sources fluctuating. Some titles have secured additional finance to deal with increased costs, while others were working to replace investors who changed their contributions after they were impacted by the pandemic.
• Titles which shifted production to 2020/21 reported various disruptions to their financing: one title lost access to international actors which forced finance changes and pushed the budget down, while others sought out additional finance to cover projected budget increases of 10-15%.
Cancelled

27
The Drama Report 2019/20 | Screen Australia
TV/online drama finance by first release platform
No. of titles Investment $m* Hours Budgets $m
ABC (includes iview)
2015/16 21 53 100 106
2016/17 34 55 120 130
2017/18 23 53 112 144
2018/19 28 52 128 157
2019/20 14 33 84 95
5-yr av 24 49 109 126
SBS/NITV (includes SBS On Demand)
2015/16 3 3 9 9
2016/17 3 6 11 14
2017/18 6 8 20 21
2018/19 4 5 12 16
2019/20 1 n.p. 3 n.p.
5-yr av 3 5 11 13
Commercial free-to-air TV (includes on-demand platforms)
2015/16 23 98 393 218
2016/17 23 98 396 211
2017/18 16 73 330 135
2018/19 25 107 430 211
2019/20 18 61 336 136
5-yr av 21 87 377 182
Subscription television broadcasters
2015/16 6 30 46 67
2016/17 7 50 58 75
2017/18 5 31 33 50
2018/19 3 12 22 33
2019/20 2 17 11 24
5-yr av 5 28 34 50
Australian and foreign online streaming services**
2015/16 3 6 10 12
2016/17 7 3 9 5
2017/18 6 30 24 48
2018/19 8 19 23 47
2019/20 6 46 30 84
5-yr av 6 21 19 39
This section of the report shows production activity by first release platform, i.e. first release broadcaster or online streaming service. Financial contributions provided outside finance plans, or for subsequent release rights, are not accounted for here.
The commercial free-to-air networks provided the largest collective contribution to this year’s slate - $61 million for 18 titles, representing a 43% drop from last year. The commercial free-to-air networks also produced the lion’s share of total hours, largely thanks to long-running serials, Home and Away and Neighbours for the Seven and 10 networks respectively.
Australian and foreign online streaming services were the second-largest collective financiers with a combined contribution of $46 million in six titles – three by Stan, and one each by Amazon Prime, Netflix and Adult Swim. This is the first time this group of investors has contributed more than the public broadcasters.
The ABC invested $33 million in 14 titles, representing a 37% drop from last year. The ABC provided the most finance of any single network. While production outputs for SBS and NITV were growing prior to 2019/20, only one NITV title entered production during the financial year. This year’s drop in numbers across broadcasters is unsurprising given the number of postponed productions.
Finance from subscription television broadcasters was up by 45% on last year’s low, though still below the 5-year average.
Notes: Figures may not total exactly due to rounding. n.p. Not for publication due to confidentiality reasons. *investment includes contributions to the initial finance plan, including licence fees, presales, equity investments etc. Financial contributions provided by a broadcaster or online streaming service for subsequent release rights are not accounted for here. **combined due to confidentiality reasons.
28
Foreign production
Notes: Figures may not total exactly due to rounding.n.p. Not for publication due to confidentiality reasons.1. Amount of total budgets spent in Australia.2. Combined due to confidentiality reasons.
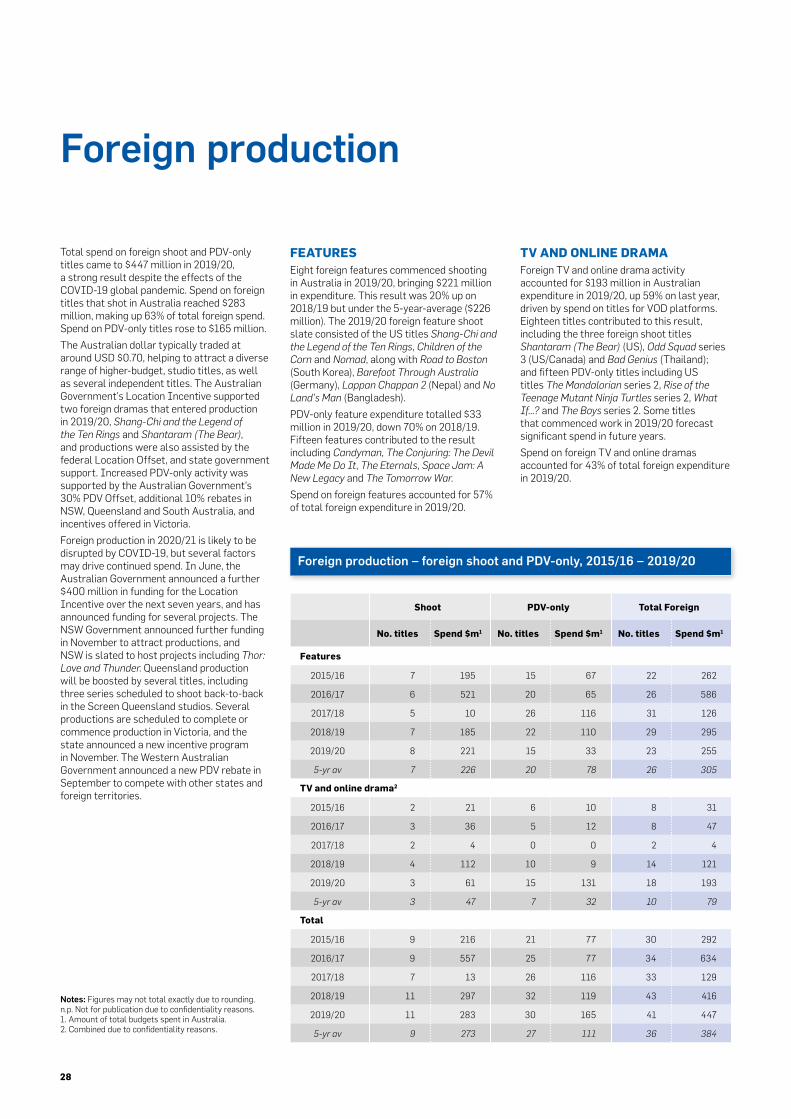
Total spend on foreign shoot and PDV-only titles came to $447 million in 2019/20, a strong result despite the effects of the COVID-19 global pandemic. Spend on foreign titles that shot in Australia reached $283 million, making up 63% of total foreign spend. Spend on PDV-only titles rose to $165 million.
The Australian dollar typically traded at around USD $0.70, helping to attract a diverse range of higher-budget, studio titles, as well as several independent titles. The Australian Government’s Location Incentive supported two foreign dramas that entered production in 2019/20, Shang-Chi and the Legend of the Ten Rings and Shantaram (The Bear), and productions were also assisted by the federal Location Offset, and state government support. Increased PDV-only activity was supported by the Australian Government’s 30% PDV Offset, additional 10% rebates in NSW, Queensland and South Australia, and incentives offered in Victoria.
Foreign production in 2020/21 is likely to be disrupted by COVID-19, but several factors may drive continued spend. In June, the Australian Government announced a further $400 million in funding for the Location Incentive over the next seven years, and has announced funding for several projects. The NSW Government announced further funding in November to attract productions, and NSW is slated to host projects including Thor: Love and Thunder. Queensland production will be boosted by several titles, including three series scheduled to shoot back-to-back in the Screen Queensland studios. Several productions are scheduled to complete or commence production in Victoria, and the state announced a new incentive program in November. The Western Australian Government announced a new PDV rebate in September to compete with other states and foreign territories.
Shoot PDV-only Total Foreign
No. titles Spend $m1 No. titles Spend $m1 No. titles Spend $m1
Features
2015/16 7 195 15 67 22 262
2016/17 6 521 20 65 26 586
2017/18 5 10 26 116 31 126
2018/19 7 185 22 110 29 295
2019/20 8 221 15 33 23 255
5-yr av 7 226 20 78 26 305
TV and online drama2
2015/16 2 21 6 10 8 31
2016/17 3 36 5 12 8 47
2017/18 2 4 0 0 2 4
2018/19 4 112 10 9 14 121
2019/20 3 61 15 131 18 193
5-yr av 3 47 7 32 10 79
Total
2015/16 9 216 21 77 30 292
2016/17 9 557 25 77 34 634
2017/18 7 13 26 116 33 129
2018/19 11 297 32 119 43 416
2019/20 11 283 30 165 41 447
5-yr av 9 273 27 111 36 384
TV AND ONLINE DRAMAForeign TV and online drama activity accounted for $193 million in Australian expenditure in 2019/20, up 59% on last year, driven by spend on titles for VOD platforms. Eighteen titles contributed to this result, including the three foreign shoot titles Shantaram (The Bear) (US), Odd Squad series 3 (US/Canada) and Bad Genius (Thailand); and fifteen PDV-only titles including US titles The Mandalorian series 2, Rise of the Teenage Mutant Ninja Turtles series 2, What If...? and The Boys series 2. Some titles that commenced work in 2019/20 forecast significant spend in future years.
Spend on foreign TV and online dramas accounted for 43% of total foreign expenditure in 2019/20.
Foreign production – foreign shoot and PDV-only, 2015/16 – 2019/20
FEATURESEight foreign features commenced shooting in Australia in 2019/20, bringing $221 million in expenditure. This result was 20% up on 2018/19 but under the 5-year-average ($226 million). The 2019/20 foreign feature shoot slate consisted of the US titles Shang-Chi and the Legend of the Ten Rings, Children of the Corn and Nomad, along with Road to Boston (South Korea), Barefoot Through Australia (Germany), Lappan Chappan 2 (Nepal) and No Land’s Man (Bangladesh).
PDV-only feature expenditure totalled $33 million in 2019/20, down 70% on 2018/19. Fifteen features contributed to the result including Candyman, The Conjuring: The Devil Made Me Do It, The Eternals, Space Jam: A New Legacy and The Tomorrow War.
Spend on foreign features accounted for 57% of total foreign expenditure in 2019/20.

29
The Drama Report 2019/20 | Screen Australia
Foreign shoot production – impact of COVID-19
• Four foreign features, all from Southern Asia and with relatively low planned spend, reported that they cancelled plans to shoot in Australia following the beginning of the pandemic.
• Two US titles shooting in NSW experienced contrasting impacts: Shang-Chi and the Legend of the Ten Rings paused production for several months, while Children of the Corn altered production plans and resumed work.
• For more on the impact of COVID-19 on PDV service providers, see page 31.
Rise of The Teenage Mutant Ninja Turtles (Nickelodeon)

30
NSW QLD VIC
Shoot PDV Total Shoot PDV Total Shoot PDV Total
$m
2015/16 390 91 481 89 10 99 160 58 217
2016/17 328 144 472 416 13 429 239 88 327
2017/18 173 108 281 103 18 122 184 68 251
2018/19 237 152 389 269 31 300 233 119 352
2019/20 293 182 475 45 8 53 214 65 279
%
2015/16 56% 52% 56% 13% 5% 11% 23% 33% 25%
2016/17 32% 53% 36% 40% 5% 33% 23% 32% 25%
2017/18 32% 45% 36% 19% 8% 15% 34% 28% 32%
2018/19 28% 41% 32% 32% 8% 25% 28% 32% 29%
2019/20 43% 58% 48% 7% 3% 5% 32% 21% 28%
SA WA Tas/NT/ACT
Shoot PDV Total Shoot PDV Total Shoot PDV Total
$m
2015/16 15 14 29 26 2 28 12 1 12
2016/17 22 25 47 7 3 10 22 1 23
2017/18 41 44 85 33 4 37 11 <1 11
2018/19 44 65 109 33 3 35 26 1 28
2019/20 90 56 146 32 3 34 4 <1 4
%
2015/16 2% 8% 3% 4% 1% 3% 2% <1% 1%
2016/17 2% 9% 4% 1% 1% 1% 2% <1% 2%
2017/18 8% 18% 11% 6% 2% 5% 2% <1% 1%
2018/19 5% 17% 9% 4% 1% 3% 3% <1% 2%
2019/20 13% 18% 15% 5% 1% 3% 1% <1% <1%
Drama production by location
In 2019/20, expenditure grew in New South Wales and South Australia, and was stable in Western Australia, but fell in other states and territories.
New South Wales $475m 48%: accounted for the largest share of total expenditure in Australia. Australian features The Invisible Man and Penguin Bloom, and US features, Shang-Chi and the Legend of the Ten Rings and Children of the Corn, were shot in NSW. TV dramas included Fat Pizza: Back in Business, The Gamers 2037, Operation Buffalo and returning series of Home and Away. Online dramas included The Commons and Drunk History Australia. Foreign feature titles that undertook PDV-only work included Fantasy Island, Halloween Kills and The Tomorrow War, while foreign PDV-only TV and online dramas included The Mandalorian series 2, Rise of The Teenage Mutant Ninja Turtles series 2, and What If…? .
Victoria $279m 28%: spend fell from last year’s all-time high. Foreign online drama Shantaram (The Bear) began production, and the Co-production (Australia/UK) feature Falling for Figaro was post-produced in the state. TV dramas included new titles Halifax: Retribution, Regular Old Bogan, Definitely Not News and With Intent, as well as returning seasons of Five Bedrooms, Kinne Tonight, Mustangs FC, Neighbours and Wentworth. Online dramas included Clickbait, Why Are You Like This? and the second series of How to Stay Married. Foreign PDV-only titles included Candyman, The Eternals, Space Jam: A New Legacy and The Witches.
Queensland $53m 5%: with no foreign production commencing in 2019/20, and the delay of production of Baz Luhrmann’s Untitled Elvis project, expenditure dropped significantly to just 5% of national expenditure, the lowest share since 2012/13. Local features included Daisy Quokka, Great White, Streamline, Swimming for Gold and This Little Love of Mine. Returning TV dramas The Bureau of Magical Things and Harrow started production. Online dramas Deadhouse Dark and Nice Shorts were partially shot in Queensland.
South Australia $146m 15%: an all-time high in 2019/20 for South Australia, with Australian features, Mortal Kombat and Moon Rock for Monday and German feature Barefoot Through Australia, all in production. Australian TV dramas with South Australian spend included First Day and Operation Buffalo, joining online dramas Fracketty Frack: It’s the Frackpocalypse, Love, Guns and Level Ups and YOLO: Crystal Fantasy. A
significant proportion of the state’s 2019/20 expenditure came from PDV work on titles such as Black Widow, The Boys series 2 and Cowboy Bebop.
Western Australia $34m 3%: remained relatively steady in terms of titles and expenditure. Australian feature film The Furnace, local TV dramas The Heights series 2, Mystery Road series 2 and Thalu, and online drama, Rain Dance, all undertook production activities in the state, while PDV work was completed on Clouds.
Tas/NT/ACT $4m <1%: local TV and online dramas included Rosehaven series 4, Fracketty Frack: It’s the Frackpocalypse and Moments of Clarity. There was no production or PDV-only activity reported in the Australian Capital Territory.
Note: Expenditure has been attributed to the year in which principal photography commenced for Australian and foreign titles shot in Australia, but based on the year PDV work commenced for foreign PDV-only titles.
Drama production by location

31
The Drama Report 2019/20 | Screen Australia
PDV services for features, TV drama and online production
This section looks at Australian expenditure from post, digital and visual effects (PDV) services for domestic, foreign shoot and foreign PDV-only feature film, TV drama and online titles.
To provide a sense of the ongoing business activity of PDV companies in a given financial year, a project’s total PDV spend has been spread across each year in which it occurred rather than the whole amount attributed to the year in which work commenced. The results for each year will therefore include expenditure from projects that began work in previous financial years and only relevant spend for projects that continue work into future financial years. As a result, this data cannot be compared to that presented in previous sections of the Drama Report.
PDV EXPENDITURE IN AUSTRALIA y $337 million in total PDV expenditure Up 26% on last year and 24% above the 5-year average.
y $130 million in PDV expenditure on 55 foreign PDV-only projects Up 34% on 2018/19 and 16% above the 5-year average.
y $38 million in PDV expenditure on 23 foreign PDV-only TV and online dramas A significant increase on 2018/19 spend of $4 million, driven by the expansion of work on online titles.
y $91 million in PDV expenditure on 32 foreign PDV-only features Down less than 1% on 2018/19, and 8% below the 5-year average.
y $172 million in PDV expenditure on Australian productions Up 11% on 2018/19, and 22% above the 5-year average.
PDV industry – impact of COVID-19
• PDV service providers reported COVID-19 was causing a range of impacts. Some companies experienced immediate losses from studio closures and the loss of projects. Other companies reported continuing work in the short-term.
• Almost all respondents were concerned about their future pipeline of work: some predicted large gaps between projects, and heavy potential losses, due to the worldwide disruption of production.
• Company estimates of the total impact of COVID-19 ranged from $1 million to more than $5 million. Many companies cautioned it was too early to predict or understand the impact of the pandemic.
• Some companies have focused on other work, including work related to the games industry.
• Some companies reported difficulties importing key crew into the country. Others mentioned difficulties in coordinating work with companies in other COVID-affected countries.
Terminator: Dark Fate

32
TOTAL PDV EXPENDITUREPDV expenditure on Australian and foreign drama titles in 2019/20 totalled $337 million, up 26% on 2018/19, and 24% above the 5-year average ($272 million). Driving the result was PDV spend of $172 million on Australian titles, up by 11% on 2018/19, and 22% above the 5-year average. Expenditure on foreign titles undertaking PDV without shooting here totalled $130 million in 2019/20, up 34% on 2018/19 ($96 million) and 16% above the 5-year average. PDV expenditure on foreign shoot titles for 2019/20 totalled a very healthy $36 million, up 120% on 2018/19 and 93% above the 5-year-average.
Services to Australian productions averaged 52% of all PDV spend over the last 5 years. Australian titles generating PDV expenditure in 2019/20 include Mortal Kombat, The Power of the Dog and Penguin Bloom.
PDV EXPENDITURE BY STATENew South Wales accounted for the majority (50%) of PDV expenditure in the five years from 2015/16 to 2019/20, representing an average of $137 million annually. Across the five years, businesses in the state provided PDV services to local and international titles such as Peter Rabbit, Peter Rabbit 2, Captain Marvel, DC Super Pets, Judy and Punch, I Am Woman, Outlaw King, Skyscraper, Spider-Man: Homecoming, Guardians of the Galaxy: Vol 2, The LEGO® Movie 2: The Second Part and Occupation: Rainfall.
Victorian businesses accounted for 29% of total PDV expenditure over the last five years, representing an average of $80 million annually. PDV projects undertaken in the state in the last five years include FengShen Trilogy, Men in Black: International, Spider-Man: Far From Home, It: Chapter Two, Ride Like a Girl, The True History of the Kelly Gang, Tomb Raider, Mary Magdalene, Christopher Robin, Spider-Man: Homecoming, Thor: Ragnarok, The Dry, Jumanji: Welcome to the Jungle, Jumanji: The Next Level and Penguin Bloom.
The remainder of PDV work over the period was spread across South Australia (14%; $37 million), Queensland (6%; $15 million) and the remaining states and territories (1%; $3 million). Titles undertaking PDV in South Australia since 2015/16 include The Eight Hundred, Captain Marvel, Cats, Ford v Ferrari, Storm Boy, Pine Gap, I Am Mother, Animal World, Tomb Raider, X-Men: Dark Phoenix, The Nightingale, Hotel Mumbai, Logan, X-Men: Apocalypse, Candyman and Mortal Kombat. Queensland projects include the Australian titles Danger Close, Harrow series 2, In Like Flynn, Bluey series 1
Australian Foreign
Total
Domestic
Co-
production
Total
Australian
Shot in
AustraliaPDV only
Features ($m)
2015/16 58 2 61 1 94 156
2016/17 47 5 52 29 119 200
2017/18 106 7 113 6 101 221
2018/19 75 7 82 12 92 186
2019/20 107 5 111 34 91 237
5-yr av 79 5 84 17 100 200
TV drama* ($m) *NB: online titles included from 2016/17
2015/16 38 9 48 1 10 59
2016/17 44 2 46 3 7 56
2017/18 59 2 61 0 3 64
2018/19 71 2 73 4 4 82
2019/20 60 0 61 1 38 100
5-yr av 55 3 58 2 12 72
Total ($m)
2015/16 97 12 108 2 104 215
2016/17 91 7 98 32 125 256
2017/18 165 9 174 6 104 285
2018/19 145 9 155 16 96 267
2019/20 167 5 172 36 130 337
5-yr av 133 8 141 19 112 272
% share 49% 3% 52% 7% 41% 100%
NSW VIC QLD SA WA, ACT, NT, TAS
Total
2015/16 123 61 9 19 2 215
2016/17 149 77 9 16 4 256
2017/18 159 70 19 35 2 285
2018/19 109 95 18 40 5 267
2019/20 142 95 21 75 4 337
5-yr av 137 80 15 37 3 272
% share 50% 29% 6% 14% 1% 100%
Notes: Figures may not total exactly due to rounding.
Australian PDV expenditure on features, TV and online drama ($m)
Expenditure from Australian PDV work on features, TV and online drama by state ($m)

33
The Drama Report 2019/20 | Screen Australia
0
20
40
60
80
100
120
140
160
180
200
0
6
12
18
24
30
36
42
48
54
60
2015/16 2016/17 2017/18 2018/19 2019/20 5-yr av
Spen
d ($
m)
No.
of t
itles
Spend ($m) No. of titles
130104 96104
29
39
125
41
49
55
1 Expenditure has been apportioned across the year or years in which it was spent.
Apportioned expenditure on foreign PDV-only titles ($m)1
and 2, Winchester, the US features Heavens: The Boy and His Robot, A.X.L, Underworld: Blood Wars and US series Philip K Dick’s Electric Dreams, Powers series 2 and Underground series 2.
FOCUS ON FOREIGN PDV-ONLY EXPENDITUREExpenditure on foreign titles undertaking PDV without shooting here totalled $130 million in 2019/20, up 34% on 2018/19 ($96 million) and 16% above the 5-year average. 55 titles contributed to this result, including 23 TV and online dramas with combined spend of $38 million.
Amongst the titles undertaking PDV-only work in 2019/20, Australian PDV companies contributed to Black Widow, The Boys series 2, The Mandalorian series 2, Candyman, and Space Jam: A New Legacy. Work also continued or was completed on projects commencing in previous years such as BIOS, Chaos Walking, DC Super Pets and Cats.
The disruptive effects of the COVID-19 pandemic are expected to grow in 2020/21, but 2019/20 was a strong year, with several contributing factors. The Australian dollar typically traded at around USD $0.70 prior to the onset of the COVID-19 pandemic, helping companies to bid for work. PDV activity was supported by the Australian Government’s 30% PDV Offset, 10% rebates in NSW, Queensland, and South Australia, and incentives offered in Victoria.
Industrial Light and Magic (ILM), a division of Lucasfilm Ltd., announced the opening of its Sydney studio in July 2019. ILM is headquartered in San Francisco and also has operations in Singapore, Vancouver and London. ILM will offer global talent development through the company’s long-standing Jedi Academy training program. French global entertainment company Technicolor announced in May 2020 that MR. X and Adelaide’s Mill Film would merge under the MR. X name: the newly combined, expanded studio will service clients across both film and episodic content. Also in Adelaide, Rising Sun Pictures (RSP) celebrated its 25th anniversary on May 11, 2020. Over their 25 years, RSP’s work has been honoured with Visual Effects Society (VES) and Australian Academy of Cinema & Television Arts (AACTA) awards, and the studio has contributed to Oscar® and BAFTA® winning films. Method Studios’ work on Ford v Ferrari was nominated for Outstanding Supporting Visual Effects in a Photoreal
Feature at the Visual Effects Society (VES) Awards in January 2020. Method partnered with Film Victoria, along with Melbourne’s Luma Pictures, on a VFX Placements Program for recent graduates that launched in August 2019. Animal Logic Entertainment was nominated for Outstanding Visual Effects in an Animated Feature at the VES Awards, for their work on The LEGO® Movie 2: The Second Part.
43
112

34
FOREIGN PDV-ONLY BY REGION, 2010/11 – 2019/20US productions represent the largest proportion of international PDV work undertaken by Australian businesses on feature, TV and online drama projects, accounting for 78% of titles and 84% of expenditure since 2010/11. PDV services to Asian productions represent 11% of titles but only around 5% of total spend.
PDV SERVICES: ABOUT THE PDV DATACompanies identified by Screen Australia as providing PDV services to feature film and TV drama projects report income earned on individual projects to Screen Australia through an online survey, with data aggregated for publication.
Total PDV expenditure is determined by adding foreign PDV-only income to PDV expenditure for domestic and shoot titles. To allow for easier referencing in this report, income from PDV-only projects has been referred to as expenditure.
PDV is defined as a set of activities rather than a stage in the production process (see ‘Key terms’ on page 5).
To provide a sense of the ongoing business activity of PDV companies in a given financial year (rather than according to an annual slate of productions or titles), expenditure has been assigned to the year it was spent rather than allocated to the start of the shoot or PDV work in Australia. As a result, the figures in this section may include projects that commenced shooting or PDV work in previous financial years and cannot be compared with figures in previous sections of the report, which are based on principal photography or PDV start date.
PDV expenditure figures include predicted spend on titles still undertaking work and are therefore subject to revision in subsequent years as final figures are made available.
This data relates only to feature film, TV drama and online drama titles and therefore does not cover all PDV activity in Australia. The most recent data from the Australian Bureau of Statistics indicates that Australian companies received income of $428.4 million in 2015/16 from the provision of PDV services across all audiovisual production, with 58% accounted for by feature films and TV drama. Other areas of PDV activity include commercials and other TV productions.
Spend by Region ($m) 2010/11 - 2019/20
100
80
60
40
20
0
% of titles by region % of expenditure by region
78%
8%
11%
84%
10%
US US/Other Asia Other
5%3%
1%
No. of titles % of titles % of expenditure1
US 156 78% 84%
Asia 22 11% 5%
US/Other 15 8% 10%
Other 6 3% 1%
Total 199 100% 100%
Notes: 1. A project’s total spend in Australia.
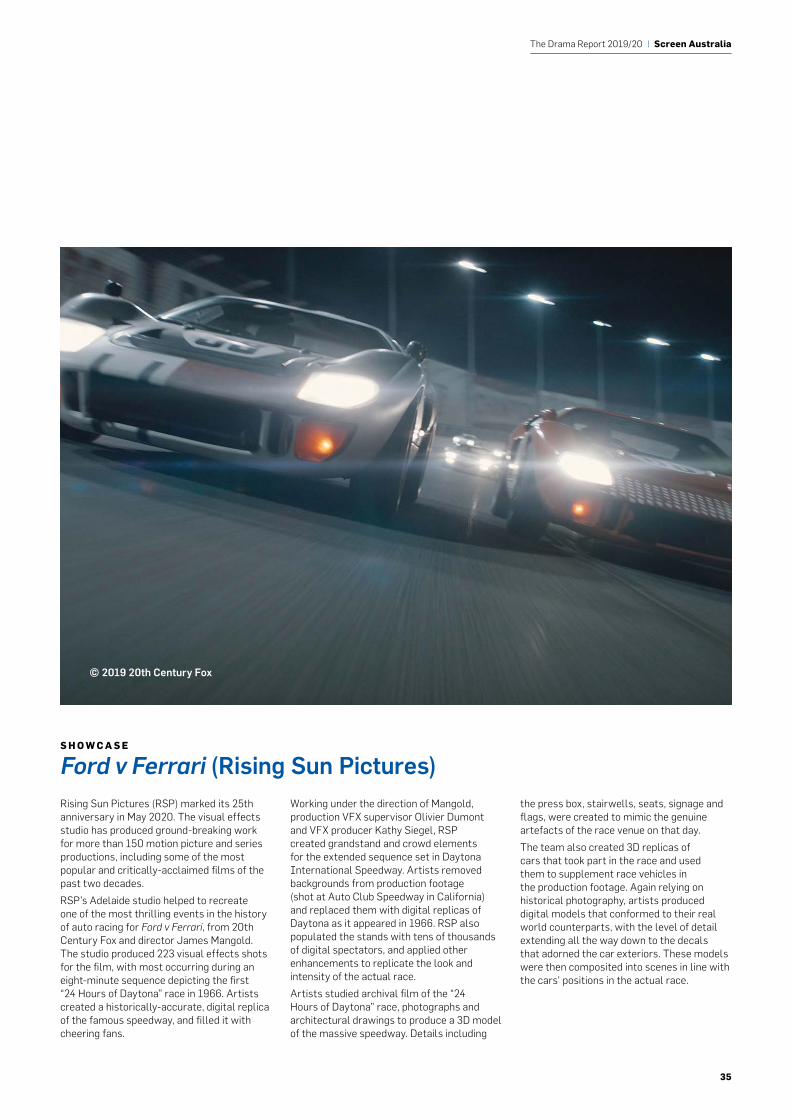
35
The Drama Report 2019/20 | Screen Australia
S H O W C A S E
Ford v Ferrari (Rising Sun Pictures)Rising Sun Pictures (RSP) marked its 25th anniversary in May 2020. The visual effects studio has produced ground-breaking work for more than 150 motion picture and series productions, including some of the most popular and critically-acclaimed films of the past two decades.
RSP’s Adelaide studio helped to recreate one of the most thrilling events in the history of auto racing for Ford v Ferrari, from 20th Century Fox and director James Mangold. The studio produced 223 visual effects shots for the film, with most occurring during an eight-minute sequence depicting the first “24 Hours of Daytona” race in 1966. Artists created a historically-accurate, digital replica of the famous speedway, and filled it with cheering fans.
Working under the direction of Mangold, production VFX supervisor Olivier Dumont and VFX producer Kathy Siegel, RSP created grandstand and crowd elements for the extended sequence set in Daytona International Speedway. Artists removed backgrounds from production footage (shot at Auto Club Speedway in California) and replaced them with digital replicas of Daytona as it appeared in 1966. RSP also populated the stands with tens of thousands of digital spectators, and applied other enhancements to replicate the look and intensity of the actual race.
Artists studied archival film of the “24 Hours of Daytona” race, photographs and architectural drawings to produce a 3D model of the massive speedway. Details including
the press box, stairwells, seats, signage and flags, were created to mimic the genuine artefacts of the race venue on that day.
The team also created 3D replicas of cars that took part in the race and used them to supplement race vehicles in the production footage. Again relying on historical photography, artists produced digital models that conformed to their real world counterparts, with the level of detail extending all the way down to the decals that adorned the car exteriors. These models were then composited into scenes in line with the cars’ positions in the actual race.
© 2019 20th Century Fox
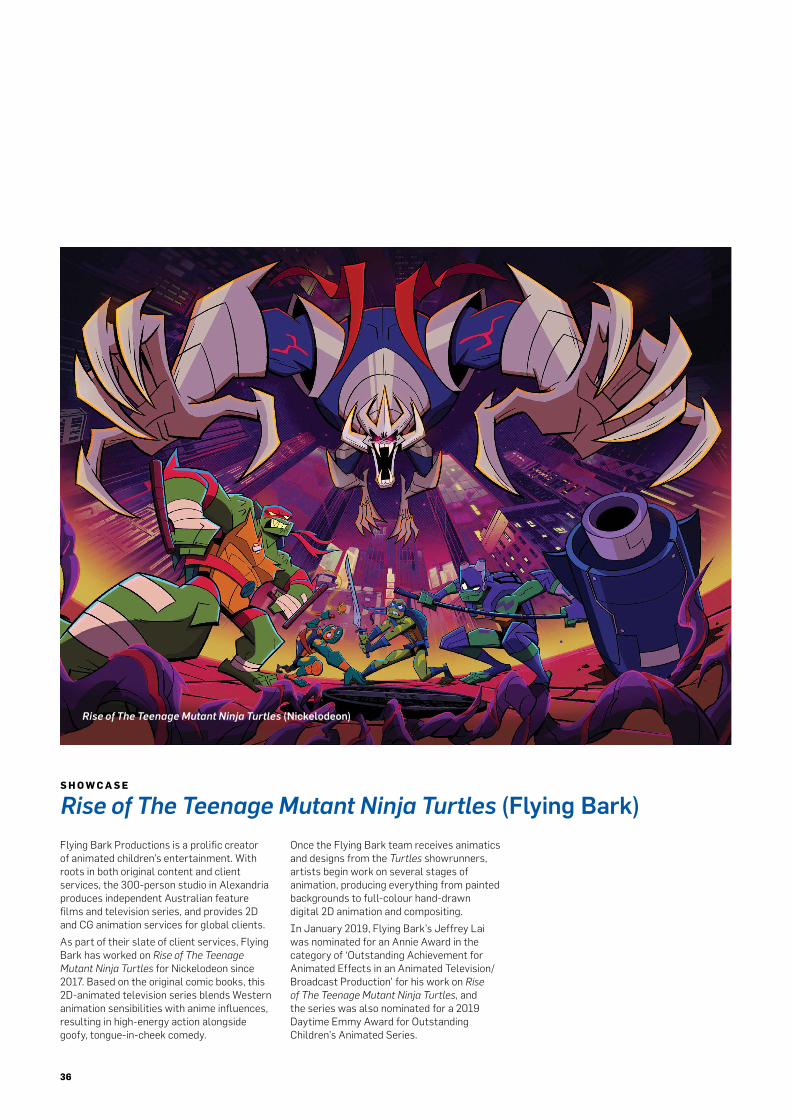
36
S H O W C A S E
Rise of The Teenage Mutant Ninja Turtles (Flying Bark)
Flying Bark Productions is a prolific creator of animated children’s entertainment. With roots in both original content and client services, the 300-person studio in Alexandria produces independent Australian feature films and television series, and provides 2D and CG animation services for global clients.
As part of their slate of client services, Flying Bark has worked on Rise of The Teenage Mutant Ninja Turtles for Nickelodeon since 2017. Based on the original comic books, this 2D-animated television series blends Western animation sensibilities with anime influences, resulting in high-energy action alongside goofy, tongue-in-cheek comedy.
Once the Flying Bark team receives animatics and designs from the Turtles showrunners, artists begin work on several stages of animation, producing everything from painted backgrounds to full-colour hand-drawn digital 2D animation and compositing.
In January 2019, Flying Bark’s Jeffrey Lai was nominated for an Annie Award in the category of ‘Outstanding Achievement for Animated Effects in an Animated Television/Broadcast Production’ for his work on Rise of The Teenage Mutant Ninja Turtles, and the series was also nominated for a 2019 Daytime Emmy Award for Outstanding Children’s Animated Series.
Rise of The Teenage Mutant Ninja Turtles (Nickelodeon)

37
The Drama Report 2019/20 | Screen Australia
S H O W C A S E
Jumanji: The Next Level (Method Studios)
Method Studios transformed bluescreen sets into complex digital environments for Jumanji: The Next Level. Led by VFX Supervisor Glenn Melenhorst, Method created 300 VFX shots on the film, including action-packed elements of the ending.
The film climaxes with several action sequences set during a building snowstorm and around a massive fortress and an elaborate blimp. Method’s team worked with the production to develop original designs into the complex final sequences. The environments were almost entirely built digitally, which had some advantages. A fight sequence took place inside the blimp as it
collided with the fortress: the blimp then skewed out of control and began to break open. Having built the blimp digitally, Method adjusted their approach to destroy it piece by piece.
Method also created the climactic sequence where Ming rides the horse Cyclone off a great height – they plunge towards the ground, and then the characters discover that Cyclone can fly. The scene was captured by Ming (played by Awkwafina) riding a mechanical buck against bluescreen. Method adjusted Ming’s riding motion and rebuilt her arms and legs in CG. Cyclone’s leathery wings were partially based on a bat’s wings,
and Method ensured the wing membrane billowed and fluttered. During flight, Method tested various options for how Cyclone would use his legs: ultimately Cyclone ‘dug for height’ with his legs, and used them less when coasting, and barely at all while gliding.
Jumanji: The Next Level

38
Titles in the 2019/20 slate
AUSTRALIAN FEATURES - DOMESTIC
Title Production companyPremiered as of Oct 2020?
SA Funded1
Daisy Quokka Like A Photon Creative Pty Ltd N N
Dark Noise Main Course Films N N
The Drover's Wife: The Legend of Molly Johnson
The Drovers Wife: The Legend Of Molly Johnson Productions Pty Ltd N Y
The Furnace Hoover's Gold Pty Ltd N Y
Great White Cornerstone Pictures Pty Ltd N N
The Invisible Man Goalpost Pictures Australia Pty Ltd, Blumhouse Productions Y N
Long Story Short See Pictures Pty Limited N Y
Love You Like That Glasshouse Productions N N
Moon Rock For Monday Lunar Pictures Pty Ltd N N
Mortal Kombat New Line Cinema Corporation N N
Penguin Bloom Made Up Stories Pty Ltd N Y
Rising Wolf Daydream Films International N N
Streamline Bronte Pictures Pty. Ltd. N Y
Swimming For Gold The Steve Jaggi Company, Swimming For Gold Film Pty Ltd Y N
This Little Love of Mine The Steve Jaggi Company, This Little Love Of Mine Pty Ltd N N
Water Horse Far From Everything Films Pty. Ltd. N N
When Pomegranates Howl Parvenu Productions N N
AUSTRALIAN FEATURES - OFFICIAL CO-PRODUCTIONS
Title Production companyPremiered as of Oct 2020?
SA Funded1
Falling for Figaro (Australia/UK) 5 Name Films Pty Ltd N Y
The Power of the Dog (Australia/NZ)See-Saw Productions Pty Ltd, Big Shell Films Pty Ltd, Max Films Productions, Brightstar Films Ltd
N N
FOREIGN FEATURES*
Title Production company
Barefoot Through Australia (working title) (Germany)
57 Films, Schiwago Film Gmbh
Children of the Corn (US) ANVL Entertainment
Lappan Chappan 2 (Nepal) Golden Hill Pictures
No Land's Man (Bangladesh) Chabial
Nomad (US) TXL Films
Road to Boston (South Korea) BA Entertainment
Shang-Chi and the Legend of the Ten Rings (US)
Marvel Comics Group Incorporating Marvel Studios & Marvel Entertainment
* 1 title is not for publication due to confidentiality reasons

39
The Drama Report 2019/20 | Screen Australia
FOREIGN FEATURES: PDV-ONLY
Title Production company
Black Widow Marvel Comics Group Incorporating Marvel Studios & Marvel Entertainment
Brahms: The Boy II STX Films, Lakeshore Entertainment
Bureau 749 Tencent Pictures
Candyman Metro Goldwyn Mayer
The Conjuring: The Devil Made Me Do It New Line Cinema Corporation
The Eternals Marvel Comics Group Incorporating Marvel Studios & Marvel Entertainment
Halloween Kills Blumhouse Productions
Initiation Shatterproof Films
The King's Man 20th Century Fox Film Corporation (USA), Marv Films
The Rescue China Modern Film And Television Development, Film Fireworks
Sonic the Hedgehog Paramount Pictures
Space Jam: A New Legacy Warner Bros Pictures, a Warner Bros Entertainment Company
Star Wars: The Rise of Skywalker Walt Disney Productions, Lucasfilm Limited
Those Who Wish Me Dead BRON Studios
The Tomorrow War Skydance Media
AUSTRALIAN GENERAL TV DRAMA – DOMESTIC: SERIES/SERIALS
Title Production companyFirst release broadcaster
Premiered as of Oct 2020?
SA Funded1
At Home Alone Together Australian Broadcasting Corporation ABC Y Y
The Heights series 2 Matchbox Productions Pty Ltd ABC Y Y
Home and Away series 33 Seven Network Operations Limited Seven Y N
Housos vs Virus: The Lockdown Antichocko Productions Pty Ltd Seven Y N
Kinne Tonight series 2 Big Yellow Taxi Productions Pty Ltd 10 Y N
Metro Sexual Humdrum Comedy Pty Ltd 9Go! Y Y
Neighbours series 37 Fremantlemedia Australia Pty Ltd 10 Y N
Regular Old Bogan Stepmates Studios Seven Y N
Retrograde Orange Entertainment Pty Ltd ABC1 Y Y
Rosehaven series 4 Guesswork Television Pty. Ltd. ABC Y N
Wentworth series 8 Fremantlemedia Australia Pty Ltd Foxtel Y N
AUSTRALIAN GENERAL TV DRAMA – DOMESTIC: MINI-SERIES
Title Production companyFirst release broadcaster
Premiered as of Oct 2020?
SA Funded1
Fat Pizza: Back in Business series 1 Antichocko Productions Pty Ltd Seven N N
Five Bedrooms series 2Hoodlum Entertainment and Hoodlum Active Pty Ltd
10 N Y
Halifax: Retribution Beyond Lonehand Pty Ltd Nine Y Y
Harrow series 3Hoodlum Entertainment and Hoodlum Active Pty Ltd
ABC N N
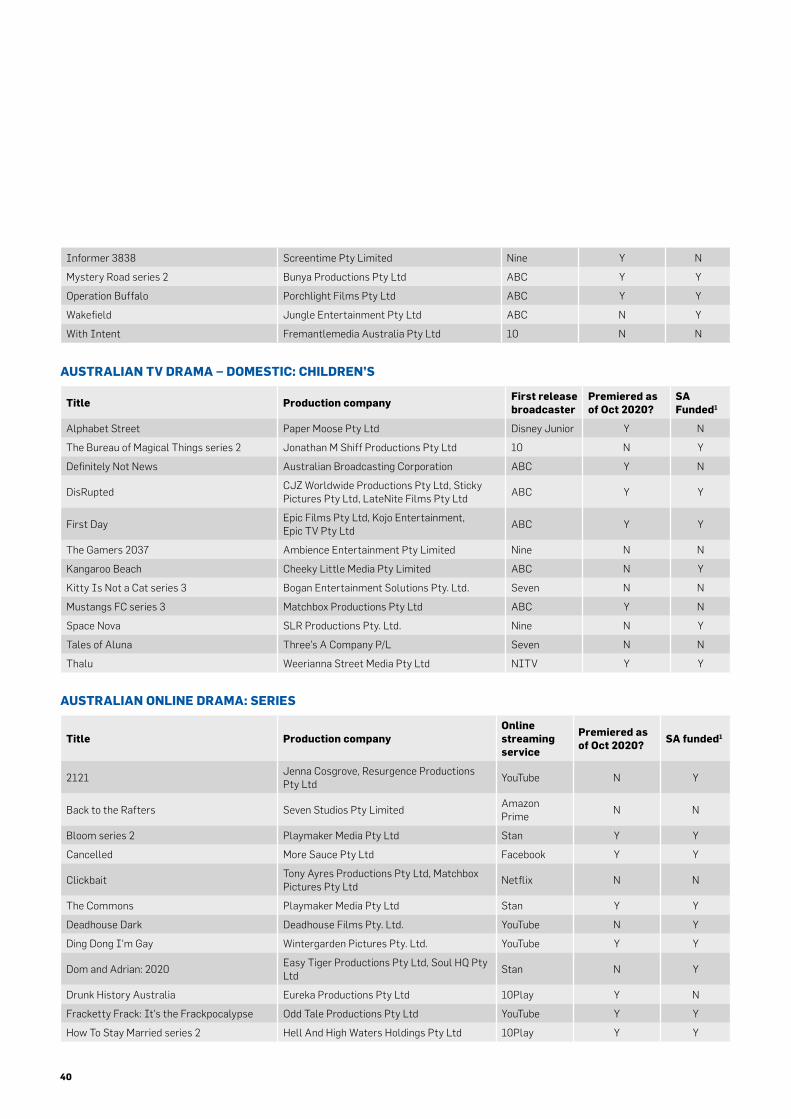
40
AUSTRALIAN TV DRAMA – DOMESTIC: MINI-SERIES
Title Production CompanyFirst release broadcaster
Premiered as of Oct 2020?
SA Funded1
Fat Pizza: Back in Business series 1 Antichocko Productions Pty Ltd Seven N N
Five Bedrooms series 2Hoodlum Entertainment and Hoodlum Active Pty Ltd
10 N Y
Halifax Retribution Beyond Lonehand Pty Ltd Nine Y Y
Harrow series 3Hoodlum Entertainment and Hoodlum Active Pty Ltd
ABC N N
Informer 3838 Screentime Pty Limited Nine Y N
Mystery Road series 2 Bunya Productions Pty Ltd ABC Y Y
Operation Buffalo Porchlight Films Pty Ltd ABC Y Y
Wakefield Jungle Entertainment Pty Ltd ABC N Y
With Intent Fremantlemedia Australia Pty Ltd 10 N N
AUSTRALIAN TV DRAMA – DOMESTIC: CHILDREN’S
Title Production companyFirst release broadcaster
Premiered as of Oct 2020?
SA Funded1
Alphabet Street Paper Moose Pty Ltd Disney Junior Y N
The Bureau of Magical Things series 2 Jonathan M Shiff Productions Pty Ltd 10 N Y
Definitely Not News Australian Broadcasting Corporation ABC Y N
DisRuptedCJZ Worldwide Productions Pty Ltd, Sticky Pictures Pty Ltd, LateNite Films Pty Ltd
ABC Y Y
First DayEpic Films Pty Ltd, Kojo Entertainment, Epic TV Pty Ltd
ABC Y Y
The Gamers 2037 Ambience Entertainment Pty Limited Nine N N
Kangaroo Beach Cheeky Little Media Pty Limited ABC N Y
Kitty Is Not a Cat series 3 Bogan Entertainment Solutions Pty. Ltd. Seven N N
Mustangs FC series 3 Matchbox Productions Pty Ltd ABC Y N
Space Nova SLR Productions Pty. Ltd. Nine N Y
Tales of Aluna Three's A Company P/L Seven N N
Thalu Weerianna Street Media Pty Ltd NITV Y Y
AUSTRALIAN ONLINE DRAMA: SERIES
Title Production companyOnline streaming service
Premiered as of Oct 2020?
SA funded1
2121Jenna Cosgrove, Resurgence Productions Pty Ltd
YouTube N Y
Back to the Rafters Seven Studios Pty LimitedAmazon Prime
N N
Bloom series 2 Playmaker Media Pty Ltd Stan Y Y
Cancelled More Sauce Pty Ltd Facebook Y Y
ClickbaitTony Ayres Productions Pty Ltd, Matchbox Pictures Pty Ltd
Netflix N N
The Commons Playmaker Media Pty Ltd Stan Y Y
Deadhouse Dark Deadhouse Films Pty. Ltd. YouTube N Y
Ding Dong I'm Gay Wintergarden Pictures Pty. Ltd. YouTube Y Y
Dom and Adrian: 2020Easy Tiger Productions Pty Ltd, Soul HQ Pty Ltd
Stan N Y
Drunk History Australia Eureka Productions Pty Ltd 10Play Y N
Fracketty Frack: It's the Frackpocalypse Odd Tale Productions Pty Ltd YouTube Y Y
How To Stay Married series 2 Hell And High Waters Holdings Pty Ltd 10Play Y Y

41
The Drama Report 2019/20 | Screen Australia
AUSTRALIAN ONLINE DRAMA SERIES
Title Production companyOnline streaming service
Premiered as of Oct 2020
SA funded1
2121Jenna Cosgrove, Resurgence Productions Pty Ltd
YouTube N Y
Back to the Rafters Seven Studios Pty LimitedAmazon Prime
N N
Bloom series 2 Playmaker Media Pty Ltd Stan N Y
Cancelled More Sauce Pty Ltd Facebook Y Y
ClickbaitTony Ayres Productions Pty Ltd, Matchbox Pictures Pty Ltd
Netflix N N
The Commons Playmaker Media Pty Ltd Stan Y Y
Deadhouse Dark Deadhouse Films Pty. Ltd. YouTube N Y
Ding Dong I'm Gay Wintergarden Pictures Pty. Ltd. YouTube Y Y
Dom and Adrian: 2020Easy Tiger Productions Pty Ltd, Soul HQ Pty Ltd
Stan N Y
Drunk History Australia Eureka Productions Pty Ltd 10Play Y N
Fracketty Frack: It's the Frackpocalypse Odd Tale Productions Pty Ltd YouTube N Y
How To Stay Married series 2 Hell And High Waters Holdings Pty Ltd 10Play N Y
Love, Guns and Level Ups Fury Fingers Films YouTube Y Y
Loving Captivity Heroine Productions Facebook Y Y
Meta Runner series 2 Glitch Productions Pty Ltd YouTube N Y
Mint Condition Boilermaker Pty Ltd Vimeo Y N
Moments of Clarity Electric Yak Pty Ltd YouTube N Y
Neighbours: Erinsborough High Fremantlemedia Australia Pty Ltd 10Play Y N
Nice Shorts Bunya Productions Pty Ltd YouTube Y Y
Rain Dance Cockatoo Colab Pty Ltd TBD N N
The Unboxing Seven Studios Pty Limited Facebook Y N
Why Are You Like This (series) WAYLT S1 Pty Ltd, C-KOL Pty Ltd ABC N Y
YOLO: Crystal Fantasy Princess Pictures Pty Ltd Adult Swim N N
FOREIGN TV & ONLINE DRAMA
Title Production company
Bad Genius (Thailand) Let's Play Productions
Odd Squad series 3 (Canada/US) Fredbird CDK Pty Limited
Shantaram (The Bear) (US) Anonymous Content, Paramount Television Ltd
Notes: 1. Titles marked Y received Screen Australia production funding.
FOREIGN TV & ONLINE DRAMA: PDV ONLY*
Title Production company
Archibald's Next Big Thing series 2
Dreamworks Television
Battle Kitty Netflix (US)
The Boys series 2 Amazon Studios
Clouds Warner Bros Pictures, a Warner Bros Entertainment Company, Mad Chance, Wayfarer Productions
Cowboy Bebop Netflix (US), Midnight Radio
Feel the Beat Resonate Entertainment, Deluxe, Bitter Boy Productions Ltd
For China, From China series 2 The Lego Group
Lost in Russia Huanxi Media Group
The Mandalorian series 2 Lucasfilm Limited, Walt Disney Studios Motion Pictures
Rise of the Teenage Mutant Ninja Turtles series 2
Nickelodeon Animation Studios, Mirage Studios, Flying Bark Productions
The Thing About Harry Full Paige Productions
The Undoing Blossom Films, David E. Kelly Productions, Made Up Stories Pty Ltd
What If...? Flying Bark Productions, Marvel Comics Group Incorporating Marvel Studios & Marvel Entertainment
The Witches Warner Bros Pictures, a Warner Bros Entertainment Company
* 1 title is not for publication due to confidentiality reasons
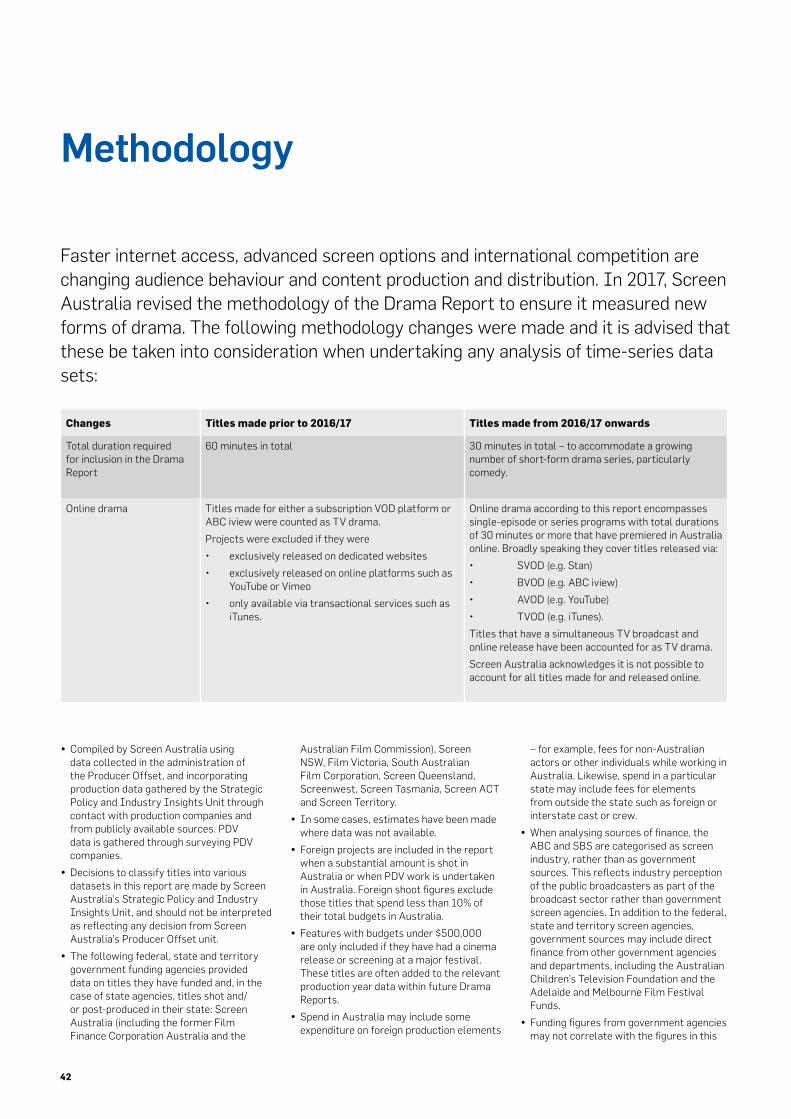
42
Changes Titles made prior to 2016/17 Titles made from 2016/17 onwards
Total duration required for inclusion in the Drama Report
60 minutes in total 30 minutes in total – to accommodate a growing number of short-form drama series, particularly comedy.
Online drama Titles made for either a subscription VOD platform or ABC iview were counted as TV drama.
Projects were excluded if they were
• exclusively released on dedicated websites
• exclusively released on online platforms such as YouTube or Vimeo
• only available via transactional services such as iTunes.
Online drama according to this report encompasses single-episode or series programs with total durations of 30 minutes or more that have premiered in Australia online. Broadly speaking they cover titles released via:
• SVOD (e.g. Stan)
• BVOD (e.g. ABC iview)
• AVOD (e.g. YouTube)
• TVOD (e.g. iTunes).
Titles that have a simultaneous TV broadcast and online release have been accounted for as TV drama.
Screen Australia acknowledges it is not possible to account for all titles made for and released online.
Methodology
Faster internet access, advanced screen options and international competition are changing audience behaviour and content production and distribution. In 2017, Screen Australia revised the methodology of the Drama Report to ensure it measured new forms of drama. The following methodology changes were made and it is advised that these be taken into consideration when undertaking any analysis of time-series data sets:
y Compiled by Screen Australia using data collected in the administration of the Producer Offset, and incorporating production data gathered by the Strategic Policy and Industry Insights Unit through contact with production companies and from publicly available sources. PDV data is gathered through surveying PDV companies.
y Decisions to classify titles into various datasets in this report are made by Screen Australia’s Strategic Policy and Industry Insights Unit, and should not be interpreted as reflecting any decision from Screen Australia’s Producer Offset unit.
y The following federal, state and territory government funding agencies provided data on titles they have funded and, in the case of state agencies, titles shot and/or post-produced in their state: Screen Australia (including the former Film Finance Corporation Australia and the
Australian Film Commission), Screen NSW, Film Victoria, South Australian Film Corporation, Screen Queensland, Screenwest, Screen Tasmania, Screen ACT and Screen Territory.
y In some cases, estimates have been made where data was not available.
y Foreign projects are included in the report when a substantial amount is shot in Australia or when PDV work is undertaken in Australia. Foreign shoot figures exclude those titles that spend less than 10% of their total budgets in Australia.
y Features with budgets under $500,000 are only included if they have had a cinema release or screening at a major festival. These titles are often added to the relevant production year data within future Drama Reports.
y Spend in Australia may include some expenditure on foreign production elements
– for example, fees for non-Australian actors or other individuals while working in Australia. Likewise, spend in a particular state may include fees for elements from outside the state such as foreign or interstate cast or crew.
y When analysing sources of finance, the ABC and SBS are categorised as screen industry, rather than as government sources. This reflects industry perception of the public broadcasters as part of the broadcast sector rather than government screen agencies. In addition to the federal, state and territory screen agencies, government sources may include direct finance from other government agencies and departments, including the Australian Children’s Television Foundation and the Adelaide and Melbourne Film Festival Funds.
y Funding figures from government agencies may not correlate with the figures in this

43
The Drama Report 2019/20 | Screen Australia
report because this report includes projects according to the start date of principal photography rather than contract dates.
y Contributions to TV drama by broadcasters in this report do not correlate with expenditure reported by the Australian Communications and Media Authority (ACMA) in the Program Expenditure Information (PEI) or Broadcasting Financial Results (BFR). This report analyses finance sources in place at the start of production while the PEI reports expenditure by the commercial free-to-air broadcasters on screened programs during the year, and includes amortisation costs for programs purchased in previous years and programs purchased after completion. For subscription television, ACMA reports annual expenditure by drama channels on ‘eligible Australian drama’, including licence fees, production expenses and limited pre-
production costs. Expenditure on features may be apportioned across financial years. For both free-to-air and subscription television, the ACMA figures can include expenditure on New Zealand programs, following the ‘Australian content’ definition.
y Sketch comedy programs are included in line with ACMA’s definition of TV drama under the Australian Content Standard.
y In categorising titles as either mini-series or series, Screen Australia has followed the definitions set out in Division 10BA of the Income Tax Assessment Act 1936.
y Series of, or related, telemovies are counted as individual titles, as set out in a broadcaster’s licence agreement.
y Data is updated on an ongoing basis, with the result that some discrepancies with previously published reports may appear. The discrepancies reflect new information
or adjustments to methodology. A number of projects in the 2019/20 dataset were yet to finalise production and post-production, due to delays caused by COVID-19, and updates to 2019/20 data should be expected in future years.
y Total budgets, amount spent in Australia and finance sources reflect data available at the time of production and may change as titles near completion.
y Figures may not total exactly due to rounding.
y Release strategies for titles reflect information available to Screen Australia at the time of publication.
y Screen Australia funded titles reflect information as at October 2020.
First Day

44