Screen 1 of 25 Markets Assessment and Analysis Market Indicators LEARNING OBJECTIVES Understand what...
25
Screen 1 of 25 Markets Assessment and Analysis Market Indicators LEARNING OBJECTIVES Understand what typical market indicators are. Understand the role of prices as market indicators. Select appropriate market indicators in different food security contexts.
-
Upload
cody-knight -
Category
Documents
-
view
213 -
download
0
Transcript of Screen 1 of 25 Markets Assessment and Analysis Market Indicators LEARNING OBJECTIVES Understand what...
Screen 1 of 25
Markets Assessment and AnalysisMarket Indicators
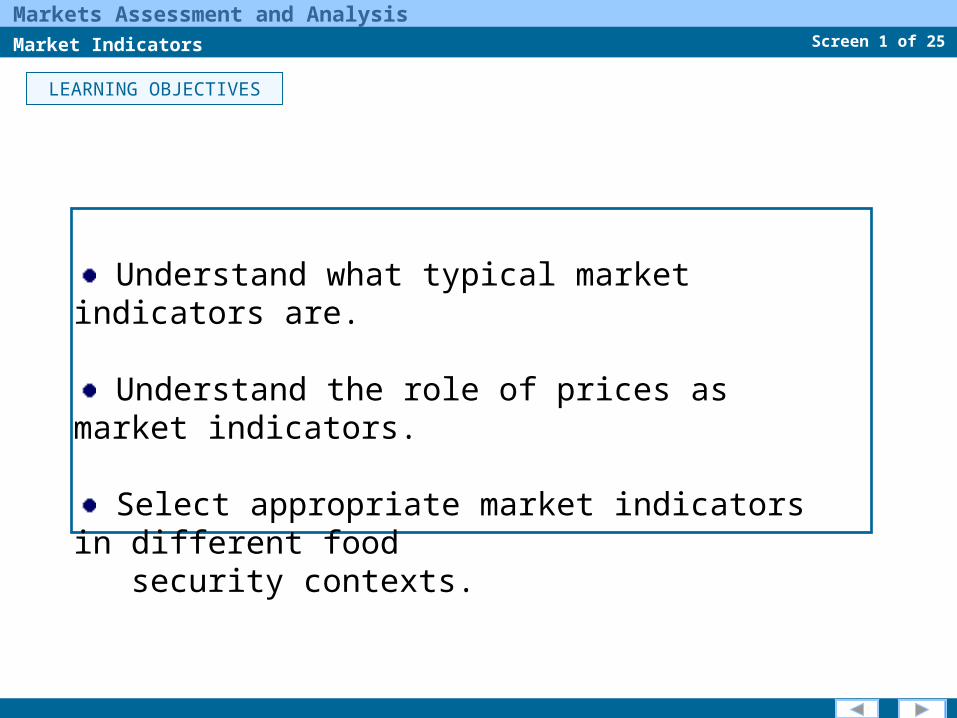
LEARNING OBJECTIVES
Understand what typical market indicators are.
Understand the role of prices as market indicators.
Select appropriate market indicators in different food security contexts.

Screen 2 of 25
Markets Assessment and AnalysisMarket Indicators
INTRODUCTION
What are the indicators which allow you to create a market profile or baseline?
Which are the indicators used to assess markets in different food security contexts?

Screen 3 of 25
Markets Assessment and AnalysisMarket Indicators
INDICATORS AND MARKETS ANALYSIS
Indicators that describe the market system and provide context.
Indicators that track day to day market dynamics.
Some indicators can be directly observed, but others must be calculated from observed information.

Screen 4 of 25
Markets Assessment and AnalysisMarket Indicators
The selection of market indicators should collectively:
INDICATORS AND MARKETS ANALYSIS
• describe market system dynamics;
• capture trends and anomalies;• evaluate incentives to trade ;• anticipate response and market
outcomes;• link market phenomena to
households and household food security;
• measure impact; and• triangulate information and
verify findings.

Screen 5 of 25
Markets Assessment and AnalysisMarket Indicators
POLICY ENVIRONMENTS
Indicators of macroeconomic and policy environment (e.g. inflation, unemployment and exchange rates) help you understand:
the economic activities of market
participants
the supply response
A very useful exercise for food security analysts is to make an inventory of policies that relate to:
• food crops; • cash crops; • livestock; • basic consumer goods; and • labour markets.

Screen 6 of 25
Markets Assessment and AnalysisMarket Indicators
ANALYSIS OF DEMAND
Information on the structure, conduct and performance of the market helps you understand
how the different components of the market system are related.
Structure indicatorsThey describe relatively stable features of the market that influence the rivalry among the buyers and sellers. Conduct indicatorsThey describe patterns of behaviour that traders and other market participants adopt to affect or adjust to the markets in which they sell or buy.
Performance indicatorsThey describe how well the market fulfills certain social and private objectives, e.g. supply and price stability over the season.

Screen 7 of 25
Markets Assessment and AnalysisMarket Indicators
SELECTING PRICES
Prices are probably the indicator most often used, analyzed and reported
Regular monthly or weekly collection of price data for a set of key commodities is a standard component of most food security monitoring systems.

Screen 8 of 25
Markets Assessment and AnalysisMarket Indicators
SUPPLY AND THE MARKET SYSTEM
Prices are signals of both food availability and food access:
Producer or farm gate prices tell us how much producers will receive for their products.
Consumer or retail prices tell us how much consumers have to pay for their food.
The difference in a commodity price over the season or calendar can tell us whether it is economical to buy, store and sell a commodity later in the season.
The difference between prices at different market locations can tell us if there is an incentive for sellers to sell, and for commodities to move from one location to another.

Screen 9 of 25
Markets Assessment and AnalysisMarket Indicators
Changes in prices can help us determine whether a commodity is becoming scarcer or more abundant.
SELECTING PRICES
As the amount of a commodity available in the market decreases relative to the demand for that commodity, the price normally rises. In this case, the commodity is said to be becoming scarcer.
As the volume available increases relative to the demand, the price tends to fall. In this case, the commodity is becoming more abundant.
Screen 10 of 25
Markets Assessment and AnalysisMarket Indicators
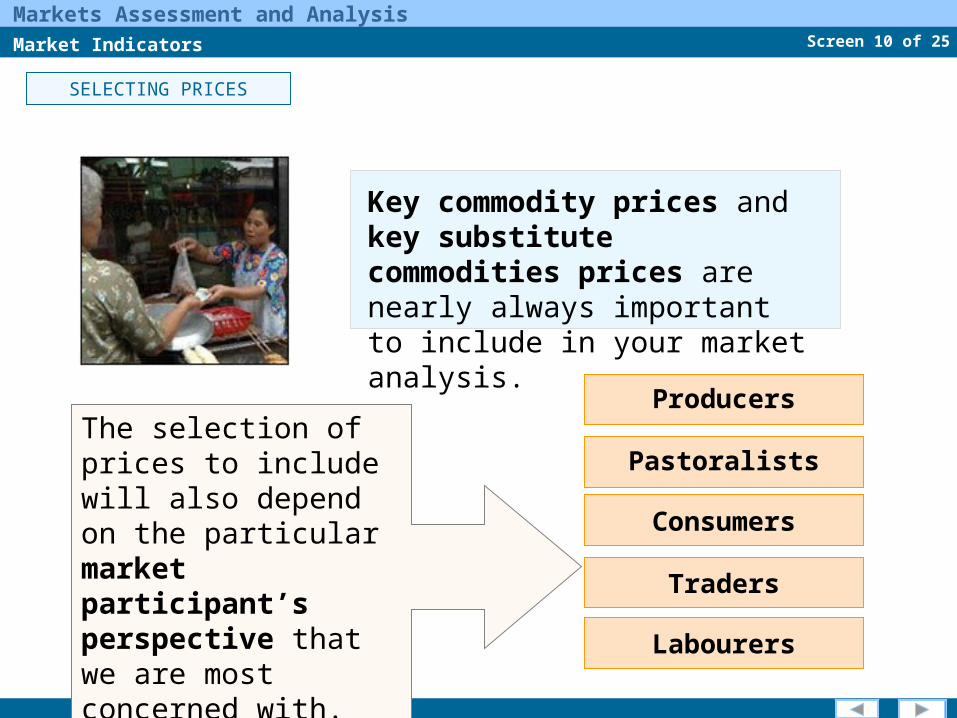
Key commodity prices and key substitute commodities prices are nearly always important to include in your market analysis.
SELECTING PRICES
The selection of prices to include will also depend on the particular market participant’s perspective that we are most concerned with.
Consumers
Pastoralists
Producers
Traders
Labourers

Screen 11 of 25
Markets Assessment and AnalysisMarket Indicators
MEASURING PRICES
• CFA Franc 120.00/kg of sorghum• $US dollars 80/50 kg bag of rice• Afghanis 130/day• 8000 Kenyan Shillings/head of cattle
Prices are measured as a ratio of an amount of a particular currency to a unit of a selected commodity, for example:
Typically a local currency is used when the users of the information are local and will be working and thinking in terms of the local currency.
If the users of the information work on different countries, the US dollar, Euro or some other convertible, often quoted currency will be used.

Screen 12 of 25
Markets Assessment and AnalysisMarket Indicators
Usually one market information system (MIS) operates within a country.
COLLECTING PRICE INFORMATION
The MIS tends to track prices of a few key agricultural commodities and livestock in local markets throughout the country.
An MIS can be limited to markets in provincial centers, but often some districts markets are also regularly monitored.
In addition, there are a few regional systems.

Screen 13 of 25
Markets Assessment and AnalysisMarket Indicators
ANALYSING PRICES
Analysts are not interested in the price itself but more on relationships among prices of different commodities.
Viewing the price of a commodity in relation to incomes and prices of other goods allows us to measure the exchange value that determines access to food and incentives to market or trade.
Particularly, it is useful to compare the prices of a good with those of substitute and complementary commodities.

Screen 14 of 25
Markets Assessment and AnalysisMarket Indicators
If the difference in prices between locations is large enough to cover transport, handling and all other costs, there is an incentive to move commodities from surplus areas to areas of scarcity.
Price differences between different areas may cause movement of commodities from one area to
another.
ANALYSING PRICES
Typically, this leads to a reduction in the price
difference.

Screen 15 of 25
Markets Assessment and AnalysisMarket Indicators
Seasonal trends must be taken into account to understand whether there is any anomaly in price
behaviour.
ANALYSING PRICES
Comparisons can be made to the average price for the same period or to another significant period (e.g. a year of a drought), which is called “reference period”.

Screen 16 of 25
Markets Assessment and AnalysisMarket Indicators
Inflation is an overall rise in the prices of goods and services in an economy, due to the decrease of the
value of money.
When there is little or no inflation, the comparison of prices over time is relatively straight forward.
But, if there is inflation, this needs to be considered in order to correctly interpret price behaviour.
ANALYSING PRICES

Screen 17 of 25
Markets Assessment and AnalysisMarket Indicators
ANALYSING PRICES
One way to account for inflation is to take current prices found in the market (nominal prices) and adjust them for inflation in order to derive real prices.
Nominal prices are the actual prices that you observe in the market.
Real prices are prices that have been adjusted for inflation.

Screen 18 of 25
Markets Assessment and AnalysisMarket Indicators
ANALYSING PRICES
Prices need to be seen in context
• WHEN the prices were observed.
• WHERE the prices were observed.
• WHAT TYPE of market, at what level of the market were these prices observed.
• WHY the price is relevant to the analysis and to food security.
• HOW do these commodity prices relate to other prices.
• IF the prices are the actual observed prices or have been adjusted for inflation.

Screen 19 of 25
Markets Assessment and AnalysisMarket Indicators
USE OF MARKET INDICATORS
How are markets indicators used for different purposes in different food security contexts?
MARKET INDICATORS FOR EARLY WARNING
MARKET INDICATORS FOR EMERGENCY IMPACT ASSESSMENT
MARKET INDICATORS FOR RECOVERY AND TRANSITION
1
2
3

Screen 20 of 25
Markets Assessment and AnalysisMarket Indicators
MARKET FOOD SECURITY MONITORING AND EARLY WARNING
1
USE OF MARKET INDICATORS
For early warning purposes, you want your market indicators to collectively be able to:
• describe trends;• identify anomalies;• account for and anticipate both supply
and demand response;• disaggregate and pinpoint impacts over
populations and space;• provide a perspective on future events;
and • help clarify policy and program options.

Screen 21 of 25
Markets Assessment and AnalysisMarket Indicators
MARKET INDICATORS FOR EMERGENCY IMPACT ASSESSMENT
2
USE OF MARKET INDICATORS
For emergency impact assessments, market indicators should:
• verify current conditions on the ground;• provide a clear measure of impact on
markets and market related infrastructure;
• provide indications of whether the situation is improving or continuing to decline;
• disaggregate and pinpoint impacts over populations and space; and
• help clarify and prioritize policy and program options.
Screen 22 of 25
Markets Assessment and AnalysisMarket Indicators
MARKET INDICATORS FOR RECOVERY AND TRANSITION3
USE OF MARKET INDICATORS
For recovery and transition monitoring and analysis, market indicators should:
• measure diversity and magnitude or volume of activities;
• account of changes in quality;• measure change and make comparisons over time;• disaggregate and pinpoint impacts and indicators of
progress over populations and space;• incorporate perceptions of market participants on
constraints, character and speed of transition and expectations for the near future; and
• help clarify when policies and programs need to be updated and modified to reflect recovery and transition, including exit strategies.

Screen 23 of 25
Markets Assessment and AnalysisMarket Indicators
These signs given by market centers can be translated into indicators and incorporated into regular monitoring plans or assessment tools.
MARKET CENTER FOOD SECURITY INDICATORS
Market centers can serve as barometers of the current economic and food security conditions of the surrounding population.

Screen 24 of 25
Markets Assessment and AnalysisMarket Indicators
MARKET CENTER FOOD SECURITY INDICATORS
Typical behaviours that could serve as relevant market centre food security indicators:
• sales of indicator commodities;
• early sales;
• rise in the number of people selling certain goods;
• smaller or altered units of measure;
• more farmers acting as petty traders;
• new ethnic groups appearing in the market;
• increased number of children working in the market;
• larger number of idle casual day labourers.

Screen 25 of 25
Markets Assessment and AnalysisMarket Indicators
SUMMARY
A range of typical market indicators are used to create a market profile or baseline.
Prices are probably the indicator most often used, analyzed and reported.
The selection of prices depends on the particular market participants’ perspective that we are most concerned with.
Prices need to be analysed in relation to seasonal trends in order to determine whether there is any anomaly in price behaviour.
Inflation is a common phenomenon which must be taken into account when analysing prices.
Different market indicators are used for different purposes in different food security contexts: early warning, emergency, impact assessment and recovery/transition.
Market centres can serve as barometers of the current economic and food security conditions of the surrounding population.