Scrap Tire Weight and Characteristics Study...5 Purpose of Study The purpose of the Scrap Tire...
25
Prepared for: 2013 Prepared by: Cornelia Andreea Badila Email: [email protected] Scrap Tire Weight and Characteristics Study Passenger Light Truck (PLT)
Transcript of Scrap Tire Weight and Characteristics Study...5 Purpose of Study The purpose of the Scrap Tire...
0
Prepared for:
2013
Prepared by:
Cornelia Andreea Badila
Email: [email protected]
Scrap Tire Weight and Characteristics Study
Passenger Light Truck (PLT)
1
Table of Contents
Purpose of Study ....................................................................................................................................... 5
Average Temperature, Precipitation and Snow during the Study Period .................................................... 5
Table1.Average temperature, precipitation and snow ................................................................................ 5
Data Collection Methodology .................................................................................................................... 6
Image1. Example of tire labelling(A2.2). ................................................................................................... 6
Image 2.Example of tire labelling (B2.2). .................................................................................................. 7
Information about Original Sample Size .................................................................................................... 7
Table 2. Average weights for all 932 PLT, P and LT tires with all types of contamination, clean and
debris in Winnipeg and rural areas ............................................................................................................ 8
Table 3. Average weights for all 932 PLT, P and LT tires with different types of contamination. .............. 9
Table 4. Percentages for different types of rim sizes: ................................................................................. 9
Figure 1. Percentages for different types of tread depth ........................................................................... 10
Method of Study ...................................................................................................................................... 11
Table 5. Load numbers, dates and number of tires per load from Winnipeg and Rural areas ................... 11
Table 6. Average weights for all 441 PLT, P and LT tires with all types of contamination, clean and
debris in Winnipeg and rural areas ........................................................................................................... 12
Table 7. Average weights between different types of contamination ........................................................ 13
Figure 2. Percentage for different type of contamination in Winnipeg area .............................................. 13
Figure 3. Percentage for different type of contamination in rural areas. .................................................. 14
Figure 4. Tread depth differences between Winnipeg and rural areas. ...................................................... 14
Table 8. Rim size differences between Winnipeg and rural areas: ............................................................ 15
Table 9. Load numbers, dates and number of tires per load from Winnipeg and rural areas .................... 16
Table 10. Average weights for all 491 PLT, P and LT tires with all types of contamination, clean and
debris in Winnipeg and rural areas .......................................................................................................... 16
Figure 5. Percentage for different type of contamination (regardless of which area). ............................... 17

2
Figure 6. Percentage for different type of tread depth ............................................................................. 17
Table 11. Percentage for different types of rim sizes ................................................................................ 18
Differences between New and Scrap Tires ............................................................................................... 18
Table 12. Comparison of Weight and Tread Depth of new and scrap tires and how much is lost in service
(600 tires) ................................................................................................................................................ 19
Table 13. Percentage of scrap PLT tires tread wear compared to new PLT tire tread depth average equal
to 11.33/32". ............................................................................................................................................ 20
PLT Age in Manitoba .............................................................................................................................. 20
Image 3. Example of serial number DOT code. ....................................................................................... 20
Tire Inflation ........................................................................................................................................... 21
Figure 7.Tire inflation differences between Winnipeg and Rural areas shown as a number of tires. ......... 21
Figure 8. Percentage of tire inflation pressure for Winnipeg and rural areas. ........................................... 22
Summary and Findings: ........................................................................................................................... 22

3
Nomenclature
TSM Tire Stewardship Manitoba
RTR Reliable Tire Recycling
P Passenger tire
LT Light Truck tire
PLT Passenger Light Truck tire
DOT Department of Transportation code
M+S Mud and Snow

4
Acknowledgements
I would like to thank Brett Eckstein (Executive Director, Tire Stewardship Manitoba) for giving
me the opportunity to perform the study and providing me with the necessary information and an
excellent office space.
I would like to thank the following individuals for sharing their thoughts and quickly responding
to my information requests.
Ashley Leibl (Reliable Tire Recycling)
Brandi Wermie (Reliable Tire Recycling)
Chris Middelton (Reliable Tire Recycling)
Dave Seifert (Curtis Tire Service)
Carolyn Thorvaldson (Tire Stewardship Manitoba)
Michael Solkoski (Tire Stewardship Manitoba)
I would also like to extend my thanks to the drivers and workers of Reliable Tire Recycling for
their help.
5
Purpose of Study
The purpose of the Scrap Tire Weight and Characteristics Study is to determine an accurate
average tire weight in the passenger light truck (PLT) category and determine differences in
average weights between Winnipeg and rural areas. The study will also assess the two data
collection methods for replicating the study in future years. The second part of the study is to
obtain information about the manufacturer, rim size, tire weights and tread depth, and find out
differences between new and scrap tires and how much is lost in service. The last part of the
study is to determine the average age of PLT tires, and also to find out if people across Manitoba
are educated to inflate tires properly, and what differences are between Winnipeg and rural areas.
Average Temperature, Precipitation and Snow during the Study Period
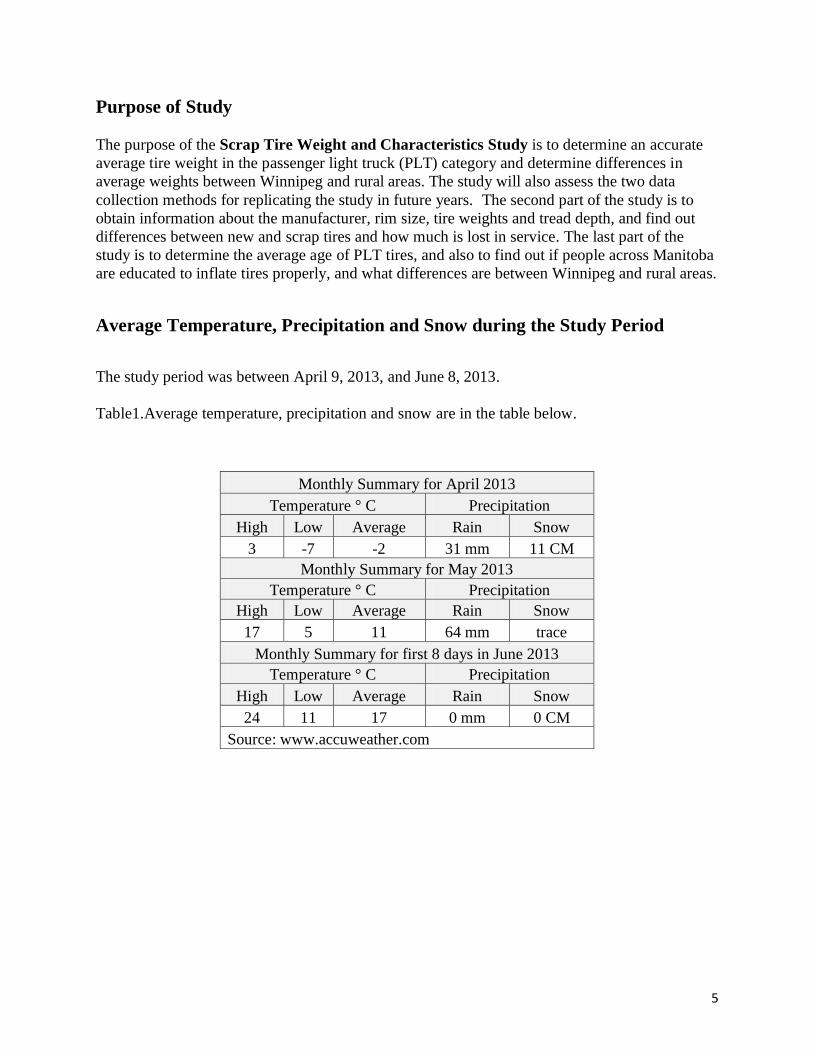
The study period was between April 9, 2013, and June 8, 2013.
Table1.Average temperature, precipitation and snow are in the table below.
Monthly Summary for April 2013
Temperature ° C Precipitation
High Low Average Rain Snow
3 -7 -2 31 mm 11 CM
Monthly Summary for May 2013
Temperature ° C Precipitation
High Low Average Rain Snow
17 5 11 64 mm trace
Monthly Summary for first 8 days in June 2013
Temperature ° C Precipitation
High Low Average Rain Snow
24 11 17 0 mm 0 CM
Source: www.accuweather.com

6
Data Collection Methodology
The research was done at Reliable Tire Recycling using 1000 PLT tire samples and 21 loads.
First load was a pilot load using a scale with a margin of error equal to 500 g. From the first 50
tires of the other 20 loads a different scale was used with a margin of error equal to 20 g. Each
load was weighed at Reliable Tire Recycling on the yard scale. The yard scale is calibrated twice
per year and increments of the scale are 10 kg.
Each tire was labeled with two numbers as in the example: A 2.2 and B 2.2. A means the
sidewall of the tire with half DOT code and B means the sidewall of the tire with full DOT code.
The first 2 is the number of the load and the second one is the number of the tire from first 50.
Digital photos were taken of each tire’s sidewall summing 2000 photos.
Image1. Shows how each tire was labeled (A2.2).
Photo: Cornelia Andreea Badila, 2013
7
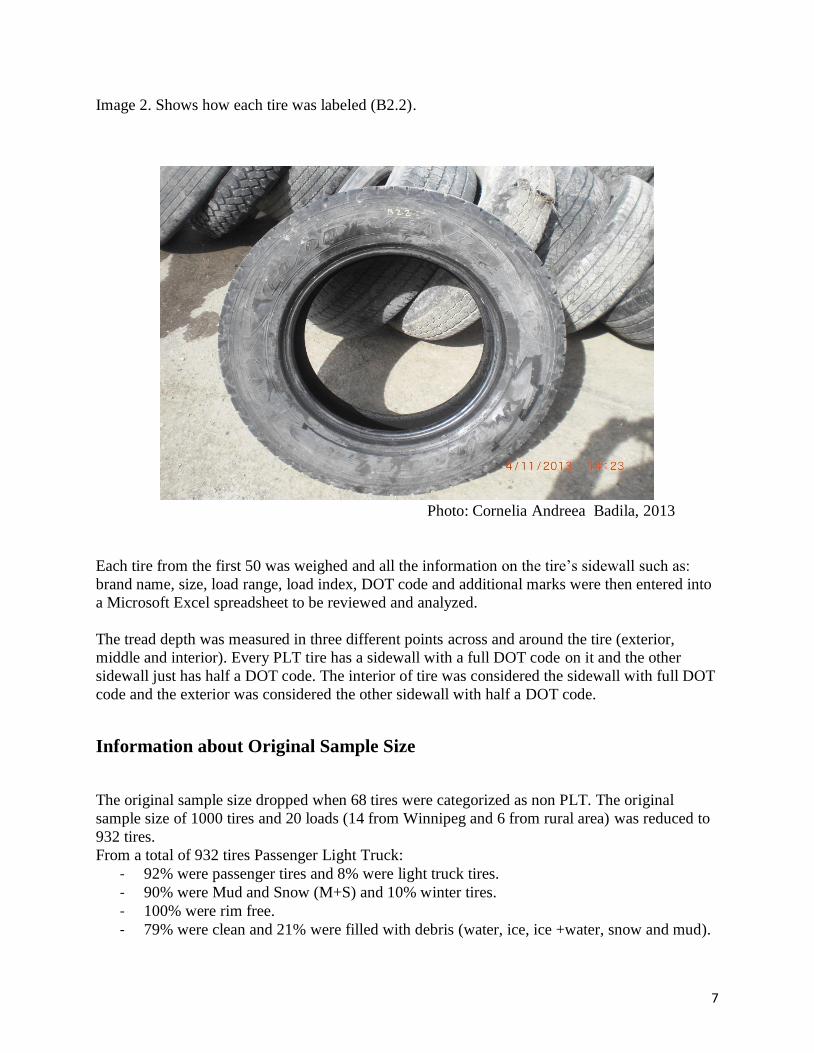
Image 2. Shows how each tire was labeled (B2.2).
Photo: Cornelia Andreea Badila, 2013
Each tire from the first 50 was weighed and all the information on the tire’s sidewall such as:
brand name, size, load range, load index, DOT code and additional marks were then entered into
a Microsoft Excel spreadsheet to be reviewed and analyzed.
The tread depth was measured in three different points across and around the tire (exterior,
middle and interior). Every PLT tire has a sidewall with a full DOT code on it and the other
sidewall just has half a DOT code. The interior of tire was considered the sidewall with full DOT
code and the exterior was considered the other sidewall with half a DOT code.
Information about Original Sample Size
The original sample size dropped when 68 tires were categorized as non PLT. The original
sample size of 1000 tires and 20 loads (14 from Winnipeg and 6 from rural area) was reduced to
932 tires.
From a total of 932 tires Passenger Light Truck:
- 92% were passenger tires and 8% were light truck tires.
- 90% were Mud and Snow (M+S) and 10% winter tires.
- 100% were rim free.
- 79% were clean and 21% were filled with debris (water, ice, ice +water, snow and mud).
8
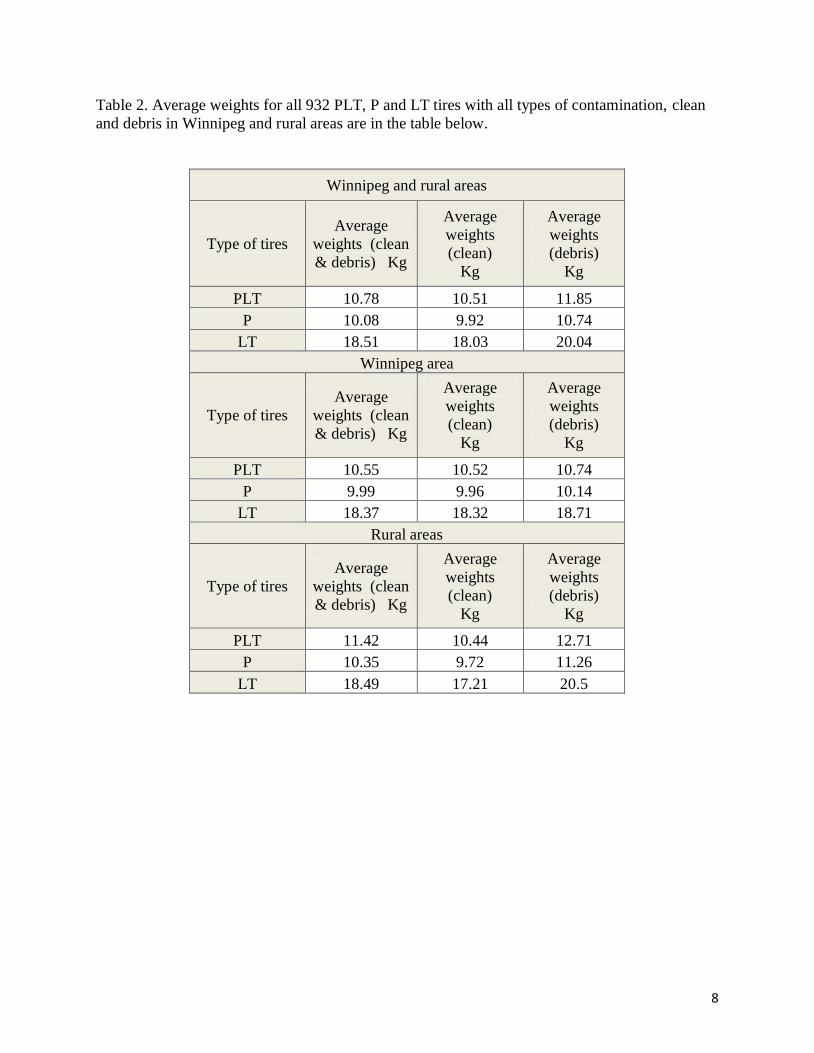
Table 2. Average weights for all 932 PLT, P and LT tires with all types of contamination, clean
and debris in Winnipeg and rural areas are in the table below.
Winnipeg and rural areas
Type of tires
Average
weights (clean
& debris) Kg
Average
weights
(clean)
Kg
Average
weights
(debris)
Kg
PLT 10.78 10.51 11.85
P 10.08 9.92 10.74
LT 18.51 18.03 20.04
Winnipeg area
Type of tires
Average
weights (clean
& debris) Kg
Average
weights
(clean)
Kg
Average
weights
(debris)
Kg
PLT 10.55 10.52 10.74
P 9.99 9.96 10.14
LT 18.37 18.32 18.71
Rural areas
Type of tires
Average
weights (clean
& debris) Kg
Average
weights
(clean)
Kg
Average
weights
(debris)
Kg
PLT 11.42 10.44 12.71
P 10.35 9.72 11.26
LT 18.49 17.21 20.5
9
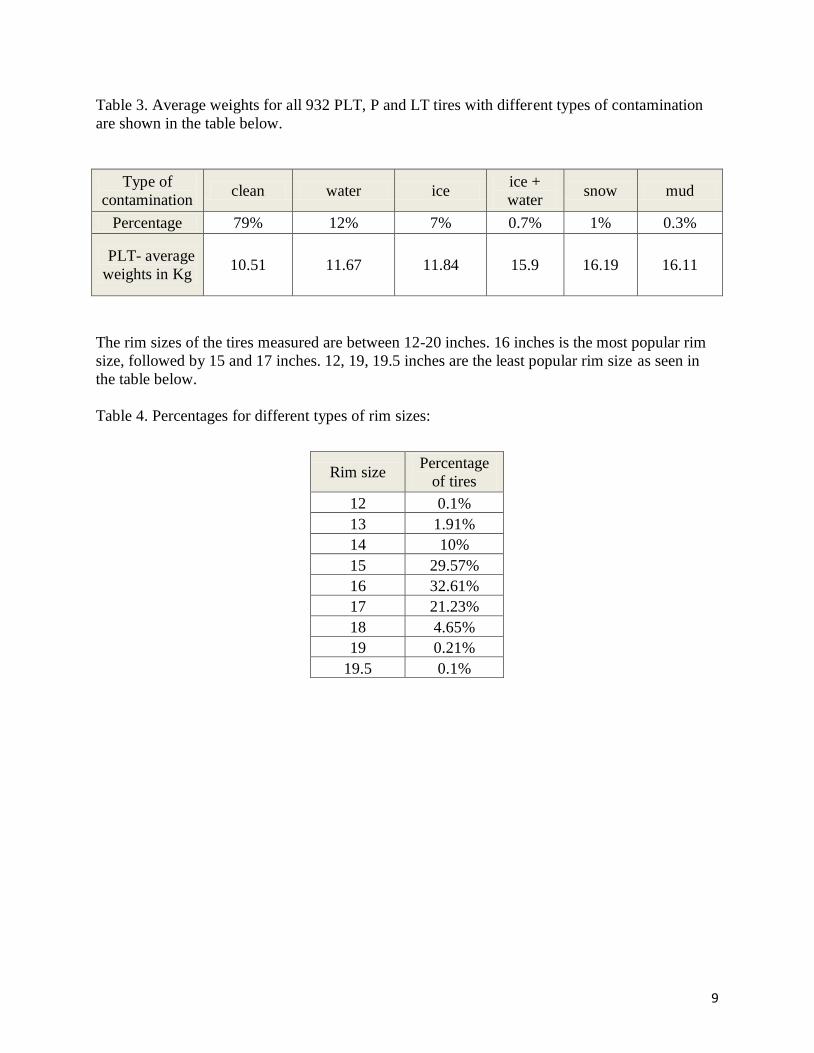
Table 3. Average weights for all 932 PLT, P and LT tires with different types of contamination
are shown in the table below.
Type of
contamination clean water ice
ice +
water snow mud
Percentage 79% 12% 7% 0.7% 1% 0.3%
PLT- average
weights in Kg 10.51 11.67 11.84 15.9 16.19 16.11
The rim sizes of the tires measured are between 12-20 inches. 16 inches is the most popular rim
size, followed by 15 and 17 inches. 12, 19, 19.5 inches are the least popular rim size as seen in
the table below.
Table 4. Percentages for different types of rim sizes:
Rim size Percentage
of tires
12 0.1%
13 1.91%
14 10%
15 29.57%
16 32.61%
17 21.23%
18 4.65%
19 0.21%
19.5 0.1%

10
Tires in Canada are considered "worn out" when they reach 2/32" of remaining tread depth.
Between 2/32"- 4/32" the manufacturer recommends tires be changed and more than 4/32" are
considered to be suitable for service. In the figure below the percentage of the wear rate of the
three categories explained above can be seen.
Figure 1. Percentages for different types of tread depth are shown in the figure below.
Nearly half of scrap tires in Manitoba arrive at the recycler’s yard when they are still considered
suitable for service.
The first part of the study is to determine a more accurate average tire weight in the passenger
light truck (PLT) category and determine differences in average weights between Winnipeg and
rural areas. The study will also assess the two data collection methods for replicating the study in
future years.
< 2/32" 9.97%
2/32"- 4/32" 41.20%
> 4/32" 48.83%
Tread wear by percentage
11
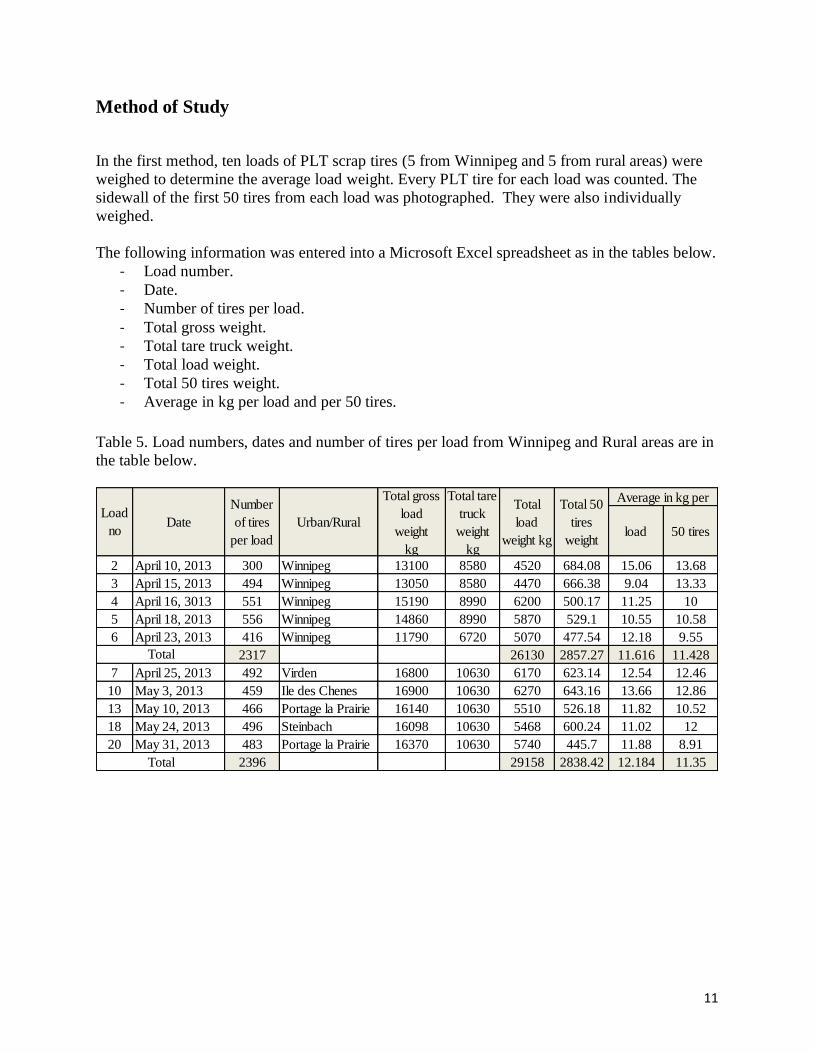
Method of Study
In the first method, ten loads of PLT scrap tires (5 from Winnipeg and 5 from rural areas) were
weighed to determine the average load weight. Every PLT tire for each load was counted. The
sidewall of the first 50 tires from each load was photographed. They were also individually
weighed.
The following information was entered into a Microsoft Excel spreadsheet as in the tables below.
- Load number.
- Date.
- Number of tires per load.
- Total gross weight.
- Total tare truck weight.
- Total load weight.
- Total 50 tires weight.
- Average in kg per load and per 50 tires.
Table 5. Load numbers, dates and number of tires per load from Winnipeg and Rural areas are in
the table below.
load 50 tires
2 April 10, 2013 300 Winnipeg 13100 8580 4520 684.08 15.06 13.68
3 April 15, 2013 494 Winnipeg 13050 8580 4470 666.38 9.04 13.33
4 April 16, 3013 551 Winnipeg 15190 8990 6200 500.17 11.25 10
5 April 18, 2013 556 Winnipeg 14860 8990 5870 529.1 10.55 10.58
6 April 23, 2013 416 Winnipeg 11790 6720 5070 477.54 12.18 9.55
2317 26130 2857.27 11.616 11.428
7 April 25, 2013 492 Virden 16800 10630 6170 623.14 12.54 12.46
10 May 3, 2013 459 Ile des Chenes 16900 10630 6270 643.16 13.66 12.86
13 May 10, 2013 466 Portage la Prairie 16140 10630 5510 526.18 11.82 10.52
18 May 24, 2013 496 Steinbach 16098 10630 5468 600.24 11.02 12
20 May 31, 2013 483 Portage la Prairie 16370 10630 5740 445.7 11.88 8.91
2396 29158 2838.42 12.184 11.35
Number
of tires
per load
Average in kg per
Total
Total
Urban/Rural
Total gross
load
weight
kg
Total tare
truck
weight
kg
Total
load
weight kg
Total 50
tires
weight
Load
noDate

12
The original sample size was 500 tires: 250 tires from Winnipeg and 250 tires from rural areas.
A total of 250 tires from Winnipeg 6.8% were not Passenger Light Truck. From a total of 233
tires Passenger Light Truck:
- 91.5% were passenger tires and 8.5% were light truck tires.
- 92% were Mud and Snow (M+S) and 8 % were winter.
- 100% were rim free.
- 84.5% were clean and 15.5% were filled with debris (water, ice and snow).
A total of 250 tires from rural areas 16.8% were not PLT. From a total of 208 tires Passenger
Light Truck:
- 86% were passenger tires and 14% were light truck tires.
- 85.5% were Mud and Snow (M+S) and 14.5% winter.
- 100% were rim free.
- 57.6% were clean and 42.4% were filled with debris (water, ice, ice + water and mud).
Table 6. Average weights for all 441 PLT, P and LT tires with all types of contamination, clean
and debris in Winnipeg and rural areas are in the table below.
Winnipeg area
Type
of tires
Average
weights
(clean
&
debris)
Kg
Average
weights
(clean)
Kg
Average
weights
(debris)
Kg
PLT 11.2 11.06 11.92
P 10.6 10.55 10.93
LT 17.58 17.48 17.88
Rural areas
Type
of tires
Average
weights
(clean
&
debris)
Kg
Average
weights
(clean)
Kg
Average
weights
(debris)
Kg
PLT 11.67 10.32 13.5
P 10.52 9.68 11.79
LT 18.7 16.14 20.5

13
Table 7. Average weights between different types of contamination are in the tables below.
Winnipeg
Type of contamination Clean Water Snow Ice Ice +Water Mud
Percentage of tire 84.5% 3.5% 3.5% 8.5% 0.0% 0.0%
Rural areas
Percentage of tire 57.6% 29.8% 0.0% 7.2% 4.3% 0.9%
As shown below tires from the Winnipeg area are cleaner than tires from rural areas and the
percentage of debris in rural areas is higher than in the Winnipeg area.
Figure 2. Shows percentage for different type of contamination in Winnipeg area
clean 84%
water 3%
snow 4%
ice 9%
Percentage for different type of contamination
in Winnpeg area
clean
water
snow
ice

14
Figure 3. Shows percentage for different type of contamination in rural areas.
Figure 4. Shows tread depth differences between Winnipeg and rural areas.
clean 58%
water 30%
ice 7%
ice+water 4% mud
1%
Percentage for different type of contamination
in rural areas
clean
water
ice
ice+water
mud
0%
10%
20%
30%
40%
50%
< 2/32" 2/32"- 4/32" > 4/32"
Winnipeg 6.94% 48% 45.06%
Rural areas 12.98% 37.02% 50%
Tread depth differences between Winnipeg and rural areas
shown as percentage
15
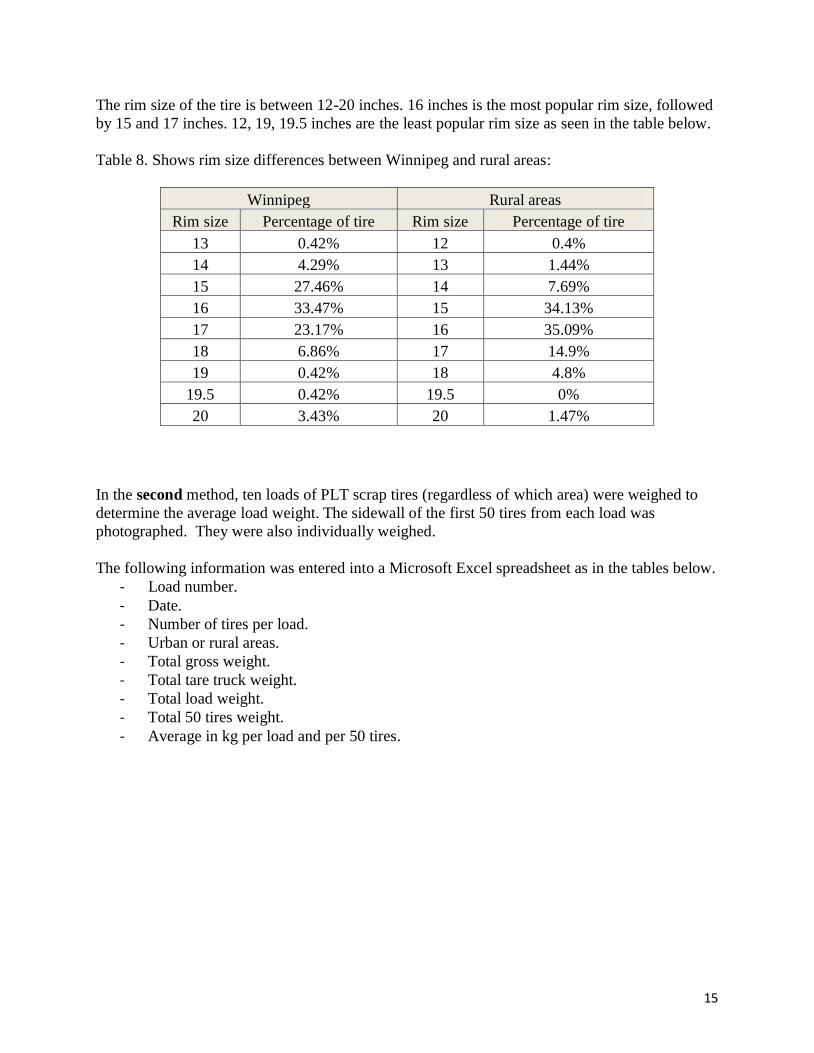
The rim size of the tire is between 12-20 inches. 16 inches is the most popular rim size, followed
by 15 and 17 inches. 12, 19, 19.5 inches are the least popular rim size as seen in the table below.
Table 8. Shows rim size differences between Winnipeg and rural areas:
Winnipeg Rural areas
Rim size Percentage of tire Rim size Percentage of tire
13 0.42% 12 0.4%
14 4.29% 13 1.44%
15 27.46% 14 7.69%
16 33.47% 15 34.13%
17 23.17% 16 35.09%
18 6.86% 17 14.9%
19 0.42% 18 4.8%
19.5 0.42% 19.5 0%
20 3.43% 20 1.47%
In the second method, ten loads of PLT scrap tires (regardless of which area) were weighed to
determine the average load weight. The sidewall of the first 50 tires from each load was
photographed. They were also individually weighed.
The following information was entered into a Microsoft Excel spreadsheet as in the tables below.
- Load number.
- Date.
- Number of tires per load.
- Urban or rural areas.
- Total gross weight.
- Total tare truck weight.
- Total load weight.
- Total 50 tires weight.
- Average in kg per load and per 50 tires.

16
Table 9. Load numbers, dates and number of tires per load from Winnipeg and rural areas are in
the table below.
The original sample size was 500 tires (regardless of which area), 1.8% were not PLT. From a
total of 491 tires Passenger Light Truck:
- 94% were passenger tires and 6 % were light truck tires.
- 91% were Mud and Snow (M+S) and 9% winter.
- 100% were rim free.
- 98.2% were clean and 1.2 % was filled with debris (water, ice and mud).
Table 10. Average weights for all 491 PLT, P and LT tires with all types of contamination, clean
and debris in Winnipeg and rural areas are shown in the table below.
Types of
tires
Average
weights (clean
& debris) Kg
Average
weights
(clean)
Kg
Average
weights
(debris)
Kg
PLT 10.32 10.30 10.76
P 9.67 9.65 9.75
LT 18.98 18.84 22.9
Average
in kg per
50 tires
8 April 30, 2013 Winnipeg 15130 9010 6120 431.72 8.63
9 May 1, 2013 Winnipeg 15240 9010 6230 502.88 10.06
11 May 8, 2013 Winnipeg 15200 9010 6190 440.06 8.8
12 May 9, 2013 Winnipeg 15380 9010 6370 465.72 9.31
14 May 14, 2013 Winnipeg 14840 9010 5830 436.28 8.37
15 May 15, 2013 Winnipeg 15000 9010 5990 578.28 11.57
16 May 16, 2013 Winnipeg 15180 9010 6170 567.56 11.35
17 May 17, 2013 Selkirk 14470 10630 2840 504.56 10.09
19 May 28, 2013 Winnipeg 15343.28 9010 6333.28 613.18 12.26
21 June 8, 2013 Winnipeg 16040 9010 7030 579.51 11.59
59103.28 5119.75 10.203
Total tare
truck weight
kg
Total load
weight kg
Total 50
tires weightLoad no Date Urban/Rural
Total gross
load
weight
kg

17
Figure 5. Shows percentage for different type of contamination (regardless of which area).
Tires in Canada are considered "worn out" when they reach 2/32" of remaining tread depth.
Between 2/32" - 4/32" the manufacturers recommends tires be changed and more then 4/32" are
considered suitable for service. The table below shows the wear rate of the three categories
explained above.
Figure 6. Percentage for different type of tread depth is in the figure below.
clean 86%
water 6% ice
8%
mud 0%
Percentage for different type of contamination
clean
water
ice
mud
0%
10%
20%
30%
40%
50%
60%
< 2/32" 2/32"-4/32"
> 4/32"
Random loads 10.18% 39.71% 50.11%
Method 2. Percentage for different tread depth ( regardless of
which area)
18
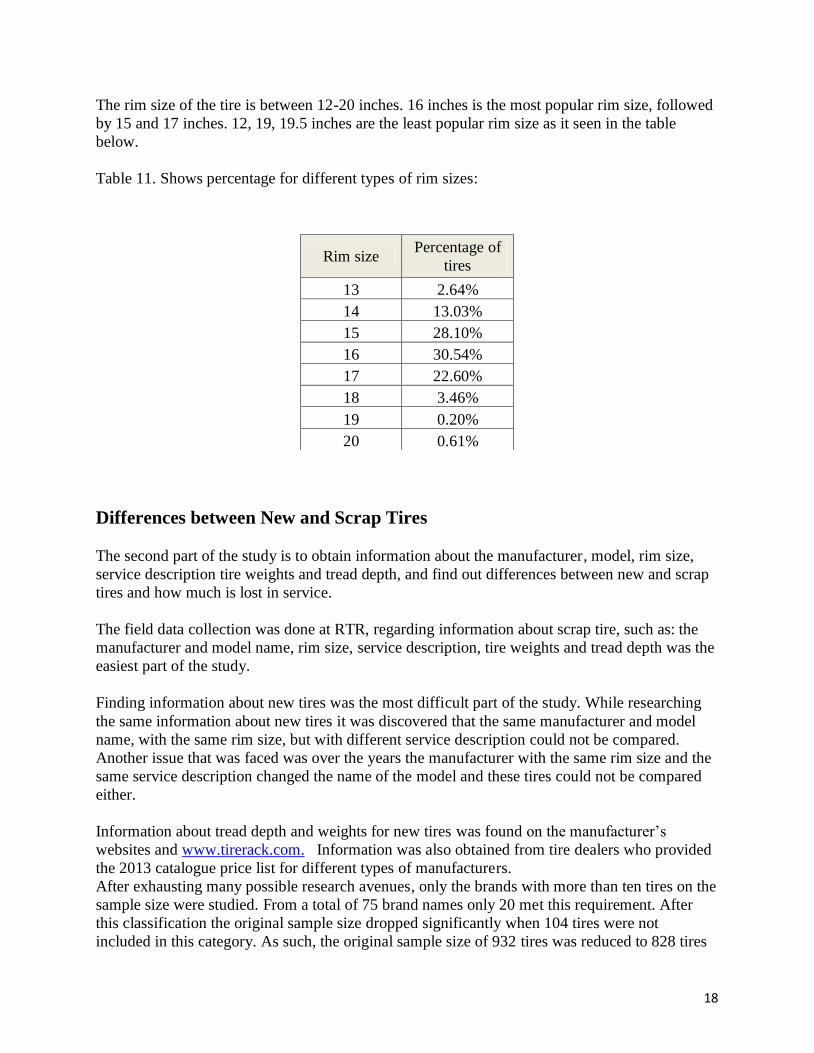
The rim size of the tire is between 12-20 inches. 16 inches is the most popular rim size, followed
by 15 and 17 inches. 12, 19, 19.5 inches are the least popular rim size as it seen in the table
below.
Table 11. Shows percentage for different types of rim sizes:
Differences between New and Scrap Tires
The second part of the study is to obtain information about the manufacturer, model, rim size,
service description tire weights and tread depth, and find out differences between new and scrap
tires and how much is lost in service.
The field data collection was done at RTR, regarding information about scrap tire, such as: the
manufacturer and model name, rim size, service description, tire weights and tread depth was the
easiest part of the study.
Finding information about new tires was the most difficult part of the study. While researching
the same information about new tires it was discovered that the same manufacturer and model
name, with the same rim size, but with different service description could not be compared.
Another issue that was faced was over the years the manufacturer with the same rim size and the
same service description changed the name of the model and these tires could not be compared
either.
Information about tread depth and weights for new tires was found on the manufacturer’s
websites and www.tirerack.com. Information was also obtained from tire dealers who provided
the 2013 catalogue price list for different types of manufacturers.
After exhausting many possible research avenues, only the brands with more than ten tires on the
sample size were studied. From a total of 75 brand names only 20 met this requirement. After
this classification the original sample size dropped significantly when 104 tires were not
included in this category. As such, the original sample size of 932 tires was reduced to 828 tires
Rim size Percentage of
tires
13 2.64%
14 13.03%
15 28.10%
16 30.54%
17 22.60%
18 3.46%
19 0.20%
20 0.61%

19
and only 600 tires could be appropriately compared for this study with the same manufacturer
and model name, the same rim size and the same service description.
From a total of 20 brand names only 17 provided information about tread depth and weights.
Brand names such as: Kelly, Nexen and Uniroyal no information was found regarding weights.
For Motomaster no information regarding tread depth and weights was found. A Canadian Tire
store manager contacted did not have information or a catalogue for Motomaster tires.
From a total of 932 scrap tires only 600 tires were found to be equivalent to new tires and could
be compared. The average weight of PLT clean scrap tires is 10.86 kg and for PLT new tires is
11.98 kg. Differences between the two of them are 1.12 kg and represent the amount of rubber
lost in service. The average of tread depth of PLT scrap tires is 4.6/32" and for PLT new tires is
11.33/32". Differences between the two of them are 6.7/32" and represent tread wear lost in
service.
Table 12. Shows comparison of Weight and Tread Depth of new and scrap tires and how much is
lost in service (600 tires)
Average
tire weight
clean and
debris
(Kg)
Average
tire
weight
clean
(Kg)
Average
tire weight
debris
(Kg)
Average
tread
depth
32nds
Average
tire
weight
(Kg)
Average
tread
depth
32nds
Average
tire
weight
(Kg)
Average
tread
depth
32nds
BFGoodrich 55 6 49 14.10 12.98 16.65 4.64 15.62 12.79 2.64 8.15
BRIDGESTONE 81 13 69 10.85 10.71 11.50 4.33 12.08 10.79 1.37 6.46
CHAMPIRO 10 0 10 10.16 9.94 12.08 3.40 12.07 12.40 2.13 9.00
CONTINENTAL 42 0 42 9.63 9.43 10.69 4.89 10.61 10.65 1.18 5.76
COOPER 45 3 42 10.97 10.64 12.04 5.06 12.45 11.94 1.81 6.88
DUNLOP 22 8 14 8.23 8.72 7.37 4.00 9.71 8.95 0.99 4.95
FIRESTONE 27 0 27 9.09 9.29 8.39 5.00 11.76 11.44 2.47 6.44
GENERAL 15 4 11 10.29 9.03 12.49 5.25 11.40 11.63 2.37 6.38
GOODYEAR 231 46 185 11.53 11.29 12.74 4.87 13.07 11.26 1.78 6.39
HANKOOK 35 0 35 9.52 9.75 8.75 3.91 11.12 10.90 1.37 6.99
KUMHO 13 2 11 8.66 8.31 12.22 3.63 9.93 10.50 1.62 6.87
MICHELIN 98 40 58 11.94 11.63 13.11 4.24 13.02 11.01 1.39 6.77
NOKIAN 14 0 14 11.54 11.76 8.68 5.07 12.16 12.75 0.40 7.68
PIRELLI 12 0 12 11.84 4.58 13.13 11.50 1.29 6.92
TOYO 10 0 10 11.41 9.57 15.73 3.30 13.74 11.61 4.17 8.31
YOKOHAMA 11 0 11 9.98 10.03 9.64 3.36 11.47 11.00 1.44 7.64
600 11.14 10.86 12.28 4.60 11.98 11.33 1.12 6.70
Table 12. Shows that the differences between new and scrap tires and how much is lost in service
BrandTotal Number
of tires
Total number
of tires
unfound
Total number
of tires found
Scrap tires New tires Lost in service
20
Table 13. Shows the percentage of scrap PLT tires tread wear compared to new PLT tire tread
depth average equal to 11.33/32".
Tread Depth Description Tread Depth As Percentage of 11.33/32"
Legal Minimum 2/32" 12.66%
Manufactures
Recommended 4/32" 34.30%
Average New 11.33/32" 100.00%
Tread Depth Description Tread Wear As Percentage of 11.33/32"
Manitoba Average 6.7/32" 59.13%
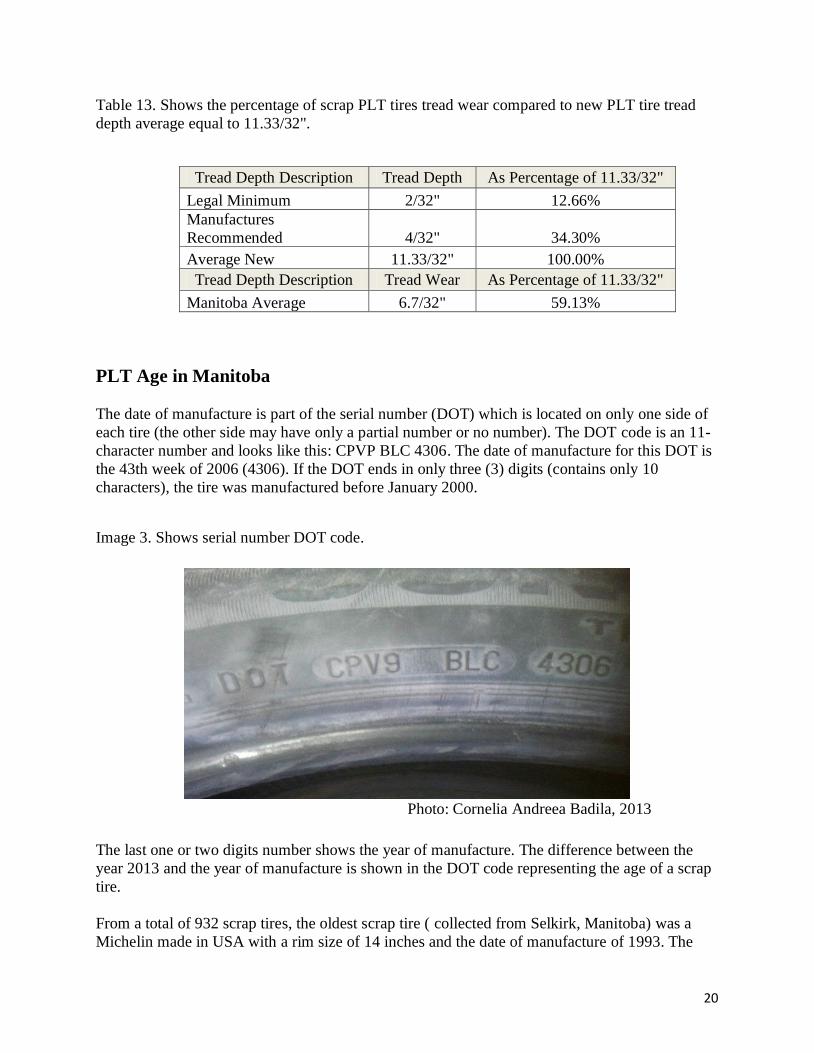
PLT Age in Manitoba
The date of manufacture is part of the serial number (DOT) which is located on only one side of
each tire (the other side may have only a partial number or no number). The DOT code is an 11-
character number and looks like this: CPVP BLC 4306. The date of manufacture for this DOT is
the 43th week of 2006 (4306). If the DOT ends in only three (3) digits (contains only 10
characters), the tire was manufactured before January 2000.
Image 3. Shows serial number DOT code.
Photo: Cornelia Andreea Badila, 2013
The last one or two digits number shows the year of manufacture. The difference between the
year 2013 and the year of manufacture is shown in the DOT code representing the age of a scrap
tire.
From a total of 932 scrap tires, the oldest scrap tire ( collected from Selkirk, Manitoba) was a
Michelin made in USA with a rim size of 14 inches and the date of manufacture of 1993. The
21
newest scrap tire (collected from Winnipeg, Manitoba) was a Motomaster made in China with a
rim size of 13 inches and the date of manufacture of 2013.
The average age of all 932 tires is 6.33 years.
The average age of the tires in Winnipeg area is 6.21years compared with 6.70 years in rural
areas.
Tire Inflation
Because the tread depth was measured in three different points of the tire (exterior, middle and
interior), the research lead to finding out if people across Manitoba are educated to inflate tires
properly, and what differences there are between Winnipeg and rural areas. The tire inflation
pressure for a vehicle is very important in providing people with safe driving and a fuel efficient
vehicle, as well as waste reduction. The best place to find the correct inflation pressure is on the
driver’s door sticker or owner’s manual.
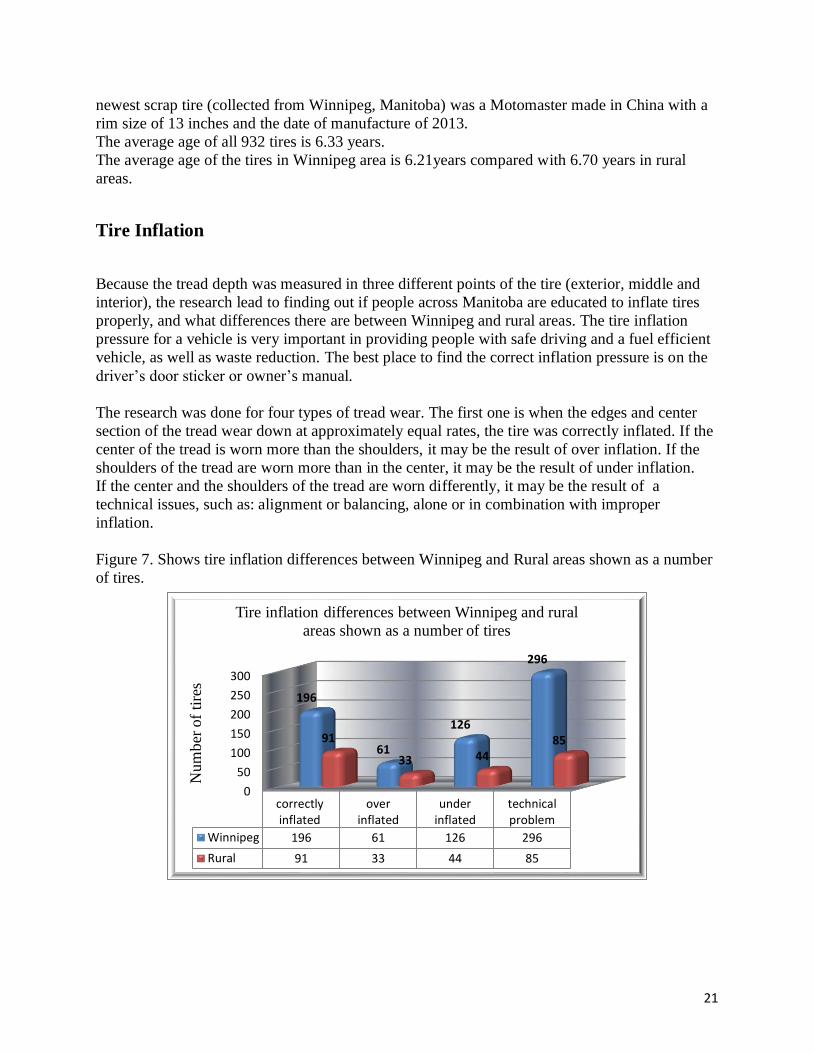
The research was done for four types of tread wear. The first one is when the edges and center
section of the tread wear down at approximately equal rates, the tire was correctly inflated. If the
center of the tread is worn more than the shoulders, it may be the result of over inflation. If the
shoulders of the tread are worn more than in the center, it may be the result of under inflation.
If the center and the shoulders of the tread are worn differently, it may be the result of a
technical issues, such as: alignment or balancing, alone or in combination with improper
inflation.
Figure 7. Shows tire inflation differences between Winnipeg and Rural areas shown as a number
of tires.
0
50
100
150
200
250
300
correctlyinflated
overinflated
underinflated
technicalproblem
Winnipeg 196 61 126 296
Rural 91 33 44 85
196
61
126
296
91
33 44 85
Nu
mb
er o
f ti
res
Tire inflation differences between Winnipeg and rural
areas shown as a number of tires

22
Figure 8. Shows percentage of tire inflation pressure for Winnipeg and rural areas.
Summary and Findings:
Average weight of a PLT scrap tire in Manitoba is 10.78 kg.
Average weight of contamination (debris) is 0.27 kg (2.5% of a scrap tire).
Average weight of rubber lost in service is 1.12 kg (9.3% of a new tire).
Average tread depth of new tires is 11.33/32".
Average tread depth of PLT scrap tires is 4.6/32".
Average tread wear is 6.7/32"(40% of tread wear from new).
Average age of all PLT tires is 6.33 years.
Average age of the tires: Winnipeg area is 6.21 years; rural is 6.70 years.
42.4% of tires from rural areas are contaminated compared with 15.5% of tires from
Winnipeg area.
About 50% of scrap tires are suitable for service (tread depth > 4/32“), but only 31% are
correctly inflated, the remainder show some abnormal wear.
23
It can be seen then that differences do exist between Winnipeg and rural areas.
In the first method, one of the most important factors in determining the correct average weight
was the weather conditions. Five loads from Winnipeg were taken in April when the weather was
cold with precipitation as light snow. The second five loads from different rural areas were taken
in May when the weather was warm with precipitation as heavy rain.
84.5% of tires were clean and 15.5% were filled with debris (water, ice and snow) in the
Winnipeg area compared with 57.6% of tires were clean and 42.4% were filled with debris
(water, ice, ice + water and mud) in the rural areas.
For these reasons average weight/ load/tire in Winnipeg is 11.61 kg compared to 12.18kg in the
rural area and the average weight per load is 5226 kg in the Winnipeg area compared with
5831.6kg in the rural areas. The average number of tires per load is 463 tires in Winnipeg
compared to 479.2 in the rural areas.
6.8 % of Passenger Light Truck tires in Winnipeg area are considered "worn out" when they
reach 2/32" of remaining tread depth compared to 12.98% in the rural areas. Almost half of scrap
tires in the Winnipeg and rural areas, on the basis of tread wear, are still considered to be suitable
for service when arrived at the recycler’s yard.
6% of non-Passenger Light Truck tires were found in first five loads in the Winnipeg area
compared with 16.8% in the rural areas.
In the second method the average weight for the first 50 tires was 10.20 kg. One of the reasons
why the average weight was so low compared with first method was because 90% of loads were
from Winnipeg and 98.2% of the tires were clean.
10.18 % of Passenger Light Truck tires from random areas are considered "worn out" when they
reach 2/32" of remaining and the same as the first method almost half of scrap tires in the
Winnipeg and rural areas are still considered to be suitable for service when arriving at the
recycler’s yard.
For replicating study in the future years, the best method to use from two describe above is
method 2 and the number of loads from the Winnipeg area must be equal with number of loads
from rural areas.

24
References
BFGoodrich - Base Price Book Effective 01.04 2009.
Bridgestone - Catalogue Price List Effective May 1st, 2013.
GTRadial - Winter Tire Product Guide 2012-2013.
Cooper Tires - 2013 Canadian Product Manual.
Dunlop - Manufacturers Suggested Retail Price Effective January 1st, 2013.
Firestone - Catalogue Price List Effective May 1st, 2013.
GeneralTire - 2008-2009 Price List Passenger and Light Truck Effective November 1st.
Goodyear - Auto and Light Truck Base Price List B400 Effective July 1st, 2007.
Goodyear Dunlop - Winter Price Book Manufacturers Suggested Retail Price Effective,
March 1st, 2012.
Goodyear Dunlop - Consumer Price Book Manufacturers Suggested Retail Price Effective,
January 1st, 2012.
Hankook - 2013 Price List Effective March 1st, 2013.
Michelin - ase Price Book Effective July 1st, 2007.
Michelin - Base Price Book Effective January 15, 2013.
Michelin - Base Price Book Effective April, 1st, 2013.
Yokohama -Product Catalogue Effective January 1st, 2013.
http://www.goodyear.ca/en-CA/tires-home. Accessed on June, July and August, 2013.
http://www.pirelli.com/tire/ca/en/homepage.html. Accessed on June, July and August, 2013.
http://www.tirerack.com/. Accessed on June, July and August, 2013.