SCOTTISH RAPTOR MONITORING...
52
Scottish Raptor Monitoring Scheme Report 2013 Amy Challis, Mark Holling, Andrew Stevenson, Staffan Roos, Patrick Stirling-Aird & Mark Wilson November 2014
Transcript of SCOTTISH RAPTOR MONITORING...

Scottish Raptor Monitoring Scheme
Report 2013
Amy Challis, Mark Holling, Andrew Stevenson, Staffan Roos,
Patrick Stirling-Aird & Mark Wilson
November 2014

Contents
Foreword.................................................................................................................................................................. i
1 Introduction ....................................................................................................................................................... 1
1.1 Scottish Raptor Monitoring Scheme (SRMS) ............................................................................................ 1
1.2 Scottish Raptor Monitoring Group (SRMG) .............................................................................................. 1
1.3 Scottish Raptor Study Group (SRSG) ........................................................................................................ 2
2 Data management .............................................................................................................................................. 3
2.1 Data contributors ........................................................................................................................................ 3
2.2 Observer coverage ...................................................................................................................................... 3
2.3 Data analysis and reporting ........................................................................................................................ 4
3 Raptor monitoring .............................................................................................................................................. 6
3.1 Occupation of home ranges ........................................................................................................................ 6
3.2 Monitoring of occupancy and breeding outcome ....................................................................................... 6
3.3 Estimating breeding success: a note of warning ......................................................................................... 8
3.4 Factors limiting raptor populations ............................................................................................................ 8
4 Species accounts .............................................................................................................................................. 11
4.1 European Honey-buzzard Pernis apivorus ............................................................................................... 11
4.2 Red Kite Milvus milvus (Tables 2 & 3) .................................................................................................... 12
4.3 White-tailed Eagle Haliaeetus albicilla (Tables 4 & 5) ........................................................................... 12
4.4 Marsh Harrier Circus aeruginosus (Table 6) ........................................................................................... 12
4.5 Hen Harrier Circus cyaneus (Tables 7 & 8) ............................................................................................. 13
4.6 Northern Goshawk Accipiter gentilis (Tables 9 & 10) ............................................................................. 13
4.7 Eurasian Sparrowhawk Accipiter nisus (Tables 11 & 12) ........................................................................ 14
4.8 Common Buzzard Buteo buteo (Tables 13 & 14) .................................................................................... 14
4.9 Golden Eagle Aquila chrysaetos (Tables 15 & 16) .................................................................................. 14
4.10 Osprey Pandion haliaetus (Tables 17 & 18) .......................................................................................... 15
4.11 Barn Owl Tyto alba (Tables 19 & 20) .................................................................................................... 16
4.12 Little Owl Athene noctua ....................................................................................................................... 16
4.13 Tawny Owl Strix aluco (Tables 21 & 22) .............................................................................................. 16
4.14 Long-eared Owl Asio otus (Table 23) .................................................................................................... 16
4.15 Short-eared Owl Asio flammeus (Table 24) ........................................................................................... 17
4.16 Common Kestrel Falco tinnunculus (Tables 25 & 26) .......................................................................... 17
4.17 Merlin Falco columbarius (Tables 27 & 28).......................................................................................... 17
4.18 Eurasian Hobby Falco subbuteo ............................................................................................................ 18
4.19 Peregrine Falcon Falco peregrinus (Tables 29 & 30) ............................................................................ 18
4.20 Northern Raven Corvus corax (Tables 31 & 32) ................................................................................... 19
5 Acknowledgements ......................................................................................................................................... 19
6 References ....................................................................................................................................................... 20
7 Tables .............................................................................................................................................................. 23
Annex 1 ................................................................................................................................................................ 46
Annex 2 ................................................................................................................................................................ 47
Terminology ......................................................................................................................................................... 48
Front cover photo. 7-8 week old Golden Eagle chick, Foinavon SPA, Highland (Derek Spencer).
Back cover photo. Osprey brood, Perthshire (Keith Brockie).

i
Foreword
The last year has been one that has presented challenges for the Scottish Raptor Monitoring Scheme
and the overseeing Scottish Raptor Monitoring Group. Having had a green light to proceed with
revising and improving the Scheme we hit some difficulties in securing the increased funding
required. Effectively this stalled the Scheme and employing a replacement for Brian Etheridge after
his retiral. Brian kindly stepped back into the role to help cover co-ordination of 2013 data
submission, and we thank him for that.
Originally we had a three year plan to improve the Scheme, however we have effectively lost a year
due to the hiatus over funding. We will now have to make great strides to get the Scheme back on
track. We will need everyone involved with the Scheme to help us to do this.
We are already underway with the appointment in June of Amy Challis as the new full-time Scheme
coordinator. Amy has had a lot to get up to speed with but has had to hit the ground running, so
welcome Amy! We’ve circulated a Scottish Raptor Newsletter recently, and whilst it has been seen by
some as ‘bureaucratic’ we felt it was important to update people on where we are at. If you want a
more varied Newsletter in future please submit articles and ideas to Amy. One key task is to catch up
on the annual reporting and this 2013 gets the ball rolling and we are planning to have 2014 ready for
the Scottish Raptor Study Group Conference in February 2015.
It is very pleasing to see an increase yet again in records submitted, and whilst it may be seen as
banging the same drum we do need to encourage people to take more of an interest in the ‘commoner’
and more widespread species. These are ideal species to get people started on and increase a wider
interest in raptors and raptor monitoring. It was refreshing to see the uptake of new technologies and
even social media being put to good use with the various projects presented at the Conference by
members of the Central Scotland branch.
Raptors continue to have a high profile in conservation and political terms and continued support of
the Scheme is of critical importance in providing objective information on what is happening to our
raptors. We are taking steps to ensure that data are managed sensibly and responsibly and whilst Data
Sharing Protocols aren’t the most exciting topic they are crucial in ensuring data are managed and
shared appropriately.
I would like to thank the following for all their work on behalf of the Scheme: David Stroud (Joint
Nature Conservation Committee), Patrick Stirling-Aird, Wendy Mattingley and Alan Heavisides
(Scottish Raptor Study Group), Chris Wernham, Mark Wilson and Anne Cotton (British Trust for
Ornithology, Scotland), Gordon Patterson and Kenny Kortland (Forestry Commission Scotland),
Mark Holling (Rare Breeding Birds Panel), Staffan Roos, Duncan Orr-Ewing and Jeremy Wilson
(Royal Society for the Protection of Birds, Scotland), Gordon Riddle (Scottish Ornithologists’ Club),
Roddy Fairley and Des Thompson (SNH) and Amy Challis (SRMS).
Andrew Stevenson
Chair of the Scottish Raptor Monitoring Group

1
1 Introduction
This is the eleventh report of the Scottish Raptor Monitoring Scheme covering the year 2013. It
follows the previous annual reports in the series (Etheridge 2005; Etheridge et al. 2006, 2007, 2008,
2010, 2011, 2012 a & b, 2013). The aim of the report is to provide clear and factual information on
territory occupation and breeding success of birds of prey in Scotland.
1.1 Scottish Raptor Monitoring Scheme (SRMS)
The SRMS was established on 24 June 2002 with the signing of an Agreement by the following
parties: Scottish Natural Heritage (SNH), Joint Nature Conservation Committee (JNCC), Scottish
Raptor Study Groups (SRSGs), British Trust for Ornithology, Scotland (BTO), Rare Breeding Birds
Panel (RBBP), Royal Society for the Protection of Birds, Scotland (RSPB), and Scottish
Ornithologists’ Club (SOC) (Anon. 2002). In 2012, Forestry Commission Scotland was invited to join
the Scheme. During 2014 the partnership will sign a revised Agreement which secures the addition of
Forestry Commission Scotland to the SRMS, and makes updates and some amendments to the
original Agreement.
The SRMS currently focuses primarily on the annual monitoring of the abundance, distribution and
breeding success of diurnal birds of prey (Accipitriformes and Falconiformes) and owls (Strigiformes)
native to Scotland. Because of its ecological similarity to raptors, Northern Raven (henceforth Raven)
is given honorary status as a bird of prey and is included in the Scheme. The SRMS is currently
exploring the potential for broadening its remit to consider the monitoring of winter roosts of species
such as Hen Harrier, Red Kite and Raven as, particularly in the case of the former two species, such
data can give useful information of age and sex structure of the population.
1.2 Scottish Raptor Monitoring Group (SRMG)
The SRMG consists of representatives of the
eight partner organisations of the SRMS. They
meet regularly and oversee the work of the
Scheme. Until his retirement from the post at
the end of March 2013, Brian Etheridge was
employed as part-time Raptor Monitoring
Officer. The primary responsibilities of this
role were to collect and collate annual
breeding records on all raptor and owl species,
and to report this and other relevant
information concerning the Scheme to the
SRMG.
In June 2014, Amy Challis took up the role of
Figure 1. The new Scottish Raptor Monitoring
Coordinator (SRMC), Amy Challis.

2
Scottish Raptor Monitoring Coordinator (SRMC; Figure 1). This is a full time post with funding for
the next two years to help take the work of the SRMS forward. Amy is based at BTO Scotland in
Stirling University.
The SRMG has secured funding for the next two years to:
continue to collect and collate data, and report annually on breeding populations of SRMS
species (currently all raptors, owls and Raven) within Scotland, including updating trends
information.
increase the geographical monitoring coverage of SRMS species within Scotland.
provide information to support the evidence base in respect of human interference with
breeding populations of target species.
promote monitoring of target species within Scotland by increasing awareness of the SRMS
and developing an entry level recording project to encourage new volunteers into raptor
monitoring.
1.3 Scottish Raptor Study Group (SRSG)
The Scottish Raptor Study Group (SRSG) now
comprises twelve regional branches (Figure
2). The recent addition of Shetland now means
that the whole of Scotland will be receiving
coordinated monitoring effort.
The SRSG has a combined membership of
more than 300, mostly voluntary,
ornithologists. Members have extensive
expertise in the field study of breeding birds of
prey and conduct these studies largely in their
own time.
Figure 2. Scottish Raptor Study Group branch
areas in 2013.

3
2 Data management
2.1 Data contributors
The SRSG members have provided the bulk of the data collected in this report on raptor numbers,
distribution and productivity. Following the 2013 season, data were received from the original eleven
regional raptor study group branches, so these are the only areas reported on in the present report. We
hope that the next report (for 2014) will also include information on the breeding success of Scheme
species in Shetland.
Important data were also supplied by species officers employed by RSPB Scotland, primarily to
monitor the reintroduced populations of Red Kite and White-tailed Eagle. Rare Breeding Birds Panel
data were extracted from the annual returns to the relevant licensing bodies (SNH and BTO) made by
the small number of Schedule 1 licence holders who were not members of the SRSG. A number of
ecological consultancies also supplied data.
2.2 Observer coverage
For some of the scarcer species covered by the Scheme, such as Red Kite, Marsh Harrier, White-tailed
Eagle and perhaps Osprey, a high proportion of the breeding population (90-100% for some species)
is monitored each year, mainly by RSPB personnel and specialist groups of volunteers.
Amongst volunteer fieldworkers, the appeal of carrying out fieldwork on open moorland and
mountain habitats is strong. Combined with the fact that raptors nesting in open habitats are, by and
large, easier to survey compared to those nesting in woodlands, three widely but thinly spread upland
species, Hen Harrier, Golden Eagle, and Peregrine Falcon, receive excellent coverage. The Scottish
breeding populations for these species are in the range of 400–800 pairs, with up to 50% of the
breeding population monitored annually. In years leading up to and including national surveys effort
is often increased leading to an even greater proportion of the population being monitored.
Two lowland owl species, Barn and Tawny Owl, readily adapt to nest boxes and their relative ease of
study means they are monitored by quite a number of raptor workers. Wider geographic coverage,
however, is poor in terms of being able to determine estimates of population size, annual productivity
and long-term trends. Common Buzzard (henceforth Buzzard) and Raven attract interest from a
growing number of raptor enthusiasts.
A few species in Scotland present challenges as far as monitoring is concerned. European Honey-
buzzard (henceforth Honey-buzzard) and Hobby are extremely scarce and Short-eared and Long-
eared Owl exhibit cyclic occurrence related to vole abundance (Korpimäki & Norrdahl 1991) and/or
secretive behaviour. However, two widespread species attract little attention from the majority of
field workers, coverage of Eurasian Sparrowhawk (henceforth Sparrowhawk) and Common Kestrel
(henceforth Kestrel) needs to increase if we are to achieve effective monitoring to determine estimates
4
of population size, annual productivity and long-term trends. This requirement is becoming ever more
urgent as the declining status of these two species, in particular the Kestrel (Risely et al. 2012), is now
causing concern.
2.3 Data analysis and reporting
The majority of data submitted to the SRMS are sent in electronically, using the custom-designed MS
Excel recording spreadsheet. This spreadsheet is currently the best means of ensuring that the majority
of submitted data are in a consistent format. This greatly reduces the need for manual correction and
re-formatting of data, ensuring that the tables and other summary outputs required for the annual
report can be generated quickly and efficiently.
Although the spreadsheet helps to standardise SRMS data, records still need to be carefully checked.
It is important to make sure that data are entered into the correct fields, and are consistently reported.
Making sure that observer, species, site names and codes, and location information are all comparable
between different records makes the data in the Scheme a much more powerful and valuable tool for
raptor conservation. Even slight variations between records in the way that data are reported, such as
the same observer being listed as both “Joe Bloggs” and “J Bloggs”, could lead to confusion when
calculating the area covered by long-term studies, which are among the most valuable datasets held by
the Scheme. Your help in checking data are greatly appreciated. Although we carry out thorough
checks on all data, we cannot always spot errors so the checking before data are submitted is
important, and potentially saves us having to correct future reports.
Another important step in preparing SRMS records for summary and analysis is to identify duplicate
records submitted to the scheme. These typically arise when data for one nest comes in from multiple
sources. In 2013, over 100 duplicate records were identified and removed from the dataset before the
summary tables were generated. Reporting of nest locations to a resolution of 100 m (i.e. six-figure
grid references) greatly facilitates this process, and also makes it easier to identify and correct typos in
grid references. Providing data at greater resolution will not make records less secure. The purposes
for which nest location data can be used, and the spatial resolution it is made available at, will be
strictly governed by rules agreed by all Scheme partners.
Readers may notice some differences between this report and earlier annual reports in the way that
data have been reported for each species. In addition to reporting at the level of RSG regions, we have
also reported data at county level, with a few regional exceptions (Figure 3). These include the
following: (i) some counties have been amalgamated (e.g. North, East and South Ayrshire combined
into Ayrshire - note this area includes the Clyde islands of Arran and Cumbrae which are part of
North Ayrshire Council Area); (ii) Moray has been split into West Moray and East Moray following
the boundary between Highland RSG and North-east Scotland RSG; and (iii) due to its large area
Highland has been divided into smaller areas reflecting a combination of old counties (e.g. Inverness-
shire) and Highland Council wards (e.g. Badenoch & Strathspey). Data for White-tailed Eagle
continue to be reported at a broader geographic scale.

5
We are looking to further improve data submission and handling in the near future. The next couple of
years will see the development of an on-line option for secure data submission to further enhance the
SRMS. As well as decreasing the potential for recording errors and inconsistencies, the development
of such a system will allow more flexible reporting. This means that, with appropriate permissions,
individuals or groups of individuals (e.g. all raptor workers working on the same species within a
particular long-term study area) might be able to explore and view summaries of their data in the
context of other local, regional and national data. We are hoping to have a prototype of this on-line
system ready for testing in the second half of 2015.
Figure 3. The regions according to which we have classified the data for the summary tables. Red labels
are displaced in order to aid clarity, with the red lines indicating the regions to which they refer. N.B.
Totals in the summary tables may not tally exactly with the numbers submitted by regional SRSG
branches, due to the fact that in some regions records were submitted by two or more groups.

6
3 Raptor monitoring
3.1 Occupation of home ranges
In many species of raptors and owls, breeding pairs are faithful to a home range. In some resident
species such as Red Kite, Buzzard, Golden Eagle and Raven, pairs can remain together throughout the
year and for at least part of the day will be on their home range. In migratory species such as Honey-
buzzard, Marsh Harrier and Osprey, pairs break up at the end of the breeding season. If they survive
the rigours of migration, the majority of adults will return to the same location the following year and
might pair up again. In long-lived species, the same pair of birds will typically occupy the same home
range, and use the same nesting locations, over many years. For relatively short-lived species such as
Hen Harrier, Sparrowhawk and Merlin, if the habitat remains unchanged, home ranges may be
occupied by a succession of breeding pairs, with some individuals breeding with several partners over
the course of their lives.
Not all home ranges will be occupied by a breeding pair and there are a variety of reasons why a pair
of raptors may not breed in a given year. For example, one or both birds may be immature (not yet of
breeding age) or food may be in short supply. In some years, only a single bird may be present,
caused by the death of or separation from a mate, or recruitment to a vacant territory, particularly if
the population is undergoing expansion. Some home ranges may be occupied only when the
population reaches a certain level and others stay vacant for long periods, sometimes because of
human interference. Others may suffer irreversible habitat changes, or be subjected to increased
unintentional human disturbance, e.g. through a change in land use activities, and may never become
regularly occupied again.
Cyclic changes in the annual and seasonal abundance of voles can have a profound effect on the
number of pairs in an area as well as the breeding success of a number of raptor and owl species (e.g.
see Petty et al. 2000; Lambin et al. 2000), particularly Kestrel, Barn Owl and Short-eared Owl
(Village 1990; Korpimäki & Norrdahl 1991, Taylor 1994). If vole populations reach a peak during the
spring, these predators can respond with an increase in the number of pairs settling to breed and a
corresponding increase in brood size, nesting success and productivity. Conversely, when vole
numbers are low, the reverse can occur.
3.2 Monitoring of occupancy and breeding outcome
In general, raptor workers try to visit known home ranges and other suitable habitat several times
before and during the breeding season with the aim to establish whether they are occupied or not.
Here we describe some of the most important features of the best practice of monitoring raptors. For
more detailed species-specific information we refer to Hardey et al. (2013).
For many species, a special licence (Schedule 1 licence, issued by SNH) is needed to visit the nest
sites. This licence should be granted before any visit to a home range takes place.
7
For forest-dwelling species such as Buzzard, Goshawk and Sparrowhawk, winter visits to known and
suitable habitat might be useful, as the lack of leaves makes it easier to find nests in deciduous trees.
For some early-nesting species, such as Golden Eagle and Raven, visits to home ranges can start
already in January, whereas for other species, especially migratory species such as Osprey, Marsh
Harrier and Hobby, the first visit might occur in spring or even early summer. The most common way
of establishing whether a territory is occupied is to watch from a distance whether suitable habitat is
used by hunting, displaying and nest-building raptors. This can be done from a vantage point or from
a vehicle. However, raptor workers also use indirect evidence to give indications of whether a home
range is occupied. This is best collected by walking through the suitable habitat looking for new and
old prey remains (pluckings), moulted feathers, pellets (regurgitated fur, feathers and bones from prey
animals) and faeces (normally seen as white splashes). Once the occupancy status of the home range
is established, the raptor worker normally tries to identify whether the home range is occupied by a
single bird or a pair (and for a small number of species, e.g. hen harrier, whether a male might have
more than one female) and the age of the birds in the home range. The age structure of the breeding
birds in a population may give useful insights into survival of the various age groups and might act as
an early signal if survival has declined for adult or sub-adult birds.
Data collected during this phase could also include habitat monitoring and thorough recording of visit
dates. For reasons described above, many raptor home ranges are likely to be unoccupied in a given
year. It is important that the presence of unoccupied ranges within a study area is recorded accurately,
as it will give indications of changes in the number of breeding pairs, survey effort and habitat-
specific changes of occupancy.
Once the nest has been located, the raptor worker monitors the breeding attempt. For this phase, it is
of utmost importance that the timing of visits to the nest is undertaken according to best practice, i.e.
at times when the risk of disturbing the adult birds is minimal. Visits should not be undertaken in
adverse weather conditions (i.e. cold, wet or excessively hot). For some species, it is even
recommended that no visits should be done during the egg stage of the breeding season (Hardey et al.
2013). The raptor worker tries to establish clutch size, brood size and fledging success (see
“Terminology” on inside back cover), using the minimum number of visits required to establish these
parameters. Often a visit during the chick stage is combined with the ringing of the chicks. For this,
the person must be a licensed ringer (ringing permits issued by BTO on behalf of SNH), again
following best practice described in Hardey et al. (2013) and BTO's "Ringers' Manual" (Redfearn and
Clarke 2001). Finally, a visit around or just after the chicks are expected to fledge will reveal the
number of fledglings from each nest. This visit should involve a nest inspection to check if any chicks
might have died at the later stages of the breeding attempt. This is an important part of the monitoring,
as it will give the final piece of information of the outcome of the breeding attempt.
Data collected during the nest monitoring phase includes, apart from clutch size, brood size and
fledgling numbers, the type of nest (e.g. nest box, tree or cliff), nest site (e.g. species of tree) and if
ringing occurs, the age, sex and size (e.g. wing and tarsus length as well as body mass) of the chicks.

8
Thorough recording of visit dates is also essential, as it will indicate stages and even specific dates
when a potential nest failure might have happened.
3.3 Estimating breeding success: a note of warning
Ideally, all breeding attempts should be monitored from the start of pair formation to either breeding
failure or the successful fledging of young. In a national scheme of this size, using data from a wide
range of field workers, this ideal is typically not achievable. For example, the timing of survey visits
may bias estimates of raptor breeding success. Individual fieldworkers often cover large geographical
areas, so first visits to different parts of the study area must necessarily be staggered. First visits to an
area that occur later in the season may miss breeding attempts that failed early and overestimate
nesting success. Non-breeding territorial pairs are common in raptor populations and can be easily
overlooked, exacerbating the problem. Therefore, there is a bias in favour of detection of nesting
attempts that have a longer period of survival. In particular, nests are most likely to be found and
examined at the chick stage, placing a strong positive slant on estimations of breeding success, as
failure is more likely to occur at the pre-lay stage or during incubation. In the early years of the
SRMS, it was not always possible to determine from data submitted at what stage in the breeding
cycle individual nests received their first visit, nor in many cases of nest failure, what caused this to
happen. The nest recording spreadsheet, introduced at the start of 2005 (updated in 2009), and now
widely adopted by raptor workers, is helping to address these issues, and raptor observers are
encouraged to submit information on the dates that they carry out every monitoring visit.
3.4 Factors limiting raptor populations
Many factors influence the distribution, numbers, and productivity of birds of prey in Scotland. For
example, there is good evidence that raptors are limited in their distribution by the extent of suitable
habitat (Anderson et al. 2009, Evans et al. 2010) and climate conditions (e.g. Taylor 1994).
The number of individuals in a population can be limited not only by the availability of suitable
habitat, but also by a number of other factors. For example, both prey abundance and predation by
larger raptors and mammals might influence raptor numbers at local and even national scales. For
instance, the lack of voles on some Scottish islands (notably Shetland, Lewis and Harris) is associated
with the absence of or very low densities of breeding vole eating owls and raptors. This has been used
to explain the absence/low density of e.g. Short-eared Owl and Kestrels in these areas. Predation can
have both direct (i.e. increased mortality; Newton 1998) and indirect (i.e. avoidance of perceived
risky areas; Sergio & Hiraldo 2008) effects on the number of breeding raptors in an area. For
example, Petty et al. (2003) showed that Kestrel numbers in Kielder Forest in Northern England
declined when numbers of Goshawks in the forest increased. The causal link seems to have been
predation of Kestrels by Goshawks, as many Kestrel remains were found near active goshawk nests
(Petty et al. 2003). Locally, Red Fox predation is likely to limit breeding populations of Hen Harriers
(Baines & Richardson 2013, McMillan 2014). Other natural factors constraining raptor numbers and
breeding success include weather events such as cold, wet springs (Amar et al. 2011) and harsh
winters (Taylor 1994).
9
Population size and breeding success of raptors are also affected by several anthropogenic factors. For
example, forestry and agriculture operations can influence availability of nesting habitat and prey, and
can cause failure of breeding attempts.
Non-deliberate disturbance by hillwalkers, climbers and mountain bikers have also been implicated in
causing nesting failure, but there is little evidence that recreational disturbance has a measurable
effect on national raptor populations (e.g. Whitfield et al. 2007). Another way in which human
activities can impact raptor populations is secondary poisoning. This has had drastic effects on raptor
populations in the recent past. For example, secondary poisoning by agricultural pesticides during the
1950s-1980s brought many raptor species close to extinction in the UK (e.g. Newton 1998). More
recently, Second Generation Anticoagulant Rodenticides (SGARs) have been implicated in deaths of
several species of owls and raptors (e.g. Hughes et al. 2013), but their effects on the national trends is
so far unknown.
Deliberate killing has also had measurable impacts on bird of prey populations in Scotland, despite
the fact that it is illegal. Several studies have shown that illegal killing is often associated with
(though not restricted to) areas managed for Red Grouse (Etheridge et al. 1997; Hardey et al. 2003;
Whitfield et al. 2004a & b, 2008; Redpath et al. 2010; Fielding et al. 2011; Amar et al. 2012). As the
illegal killing of birds of prey repeatedly has been shown to be an important limiting factor for several
raptor species, we summarise these studies here.
In Scotland, a large proportion of the uplands, particularly in the south and east of Scotland, is
managed for driven grouse shooting, with a full-time gamekeeper and often one or more under-
keepers. The keepers’ primary aim is to manage the heather through regular burning and cutting to
maximise the number of Red Grouse available for shooting and to legally control common and
widespread predators such as crows, stoats, weasels and foxes. Historically gamekeepers also
controlled birds of prey, but this practice became illegal country-wide in 1954. However, even after
nearly 60 years of legal protection, birds of prey are still killed illegally in Scotland (Anon. 2013).
Recent research has shown that these illegal activities, including nest destruction and the killing of
sub-adults and adults, are adversely affecting the conservation status of several species. On many
driven grouse-moors certain raptor species are scarce or absent and attempts to breed frequently fail
due to human interference (Etheridge et al. 1997; Hardey et al. 2003; Whitfield et al. 2004a & b,
2008; Redpath et al. 2010; Fielding et al. 2011; Amar et al. 2012). This can have a severe effect on
populations at a local or regional level by reducing the number and success of breeding pairs. It can
also impact negatively on surrounding populations, by drawing dispersing birds into areas of
apparently suitable habitat which are unoccupied because previous inhabitants have been removed.
This phenomenon has been referred to as a “black hole”, a "sink" or an “ecological trap” effect
(Whitfield et al. 2004a & b). Population modelling has indicated that persecution, mainly in the form
of poisoning, is responsible for an estimated 3–5% of annual deaths of adult Golden Eagles, and that
in the absence of this mortality the Scottish population would increase (Whitfield et al., 2004b, 2008).
Illegal poisoning is a cause of poor population growth of re-introduced Red Kites in north Scotland,

10
compared with similar populations in elsewhere in the UK (Smart et al. 2010). A negative correlation
has been found between recorded incidents of Hen Harrier persecution in different areas of Scotland
and the proportion of successful nests. There is strong evidence that illegal persecution is causing the
majority of breeding attempts on grouse moors to fail (Fielding et al. 2011) and is driving the current
population decline on mainland Scotland (Hayhow et al. 2013). Furthermore, in northern England, the
productivity of Peregrine Falcons breeding on grouse moors was found to be 50% lower than in non-
grouse moor habitat, despite similar clutch and brood size (suggesting little difference in prey
availability) between habitat types (Amar et al. 2012). Population modelling indicated that the grouse
moor population of this raptor species was unsustainable and reliant on immigration (Amar et al.
2012).
Such illegal interference can also diminish the enthusiasm of volunteer raptor fieldworkers for
monitoring raptors in what they perceive to be a hostile environment. The consequential impact of this
shift of effort away from some grouse-moors, particularly where this form of land management is
dominant at the regional scale, is that:
(i) data collected on some raptor breeding populations may not be an accurate reflection of the species
status and breeding success in the region. Some upland breeding species such as Hen Harrier, Golden
Eagle or Peregrine may appear to have considerably higher occupancy of home ranges, breeding
success and productivity than is actually the case nationally across all habitats. This is because, in
areas not being surveyed, occupancy may be low and mortality high compared with other habitats;
and
(ii) persecution of birds of prey may be under-recorded.
Ongoing SRMS work to more thoroughly assess annual changes in monitoring coverage, to
objectively identify the causes of breeding failure and in particular cases of suspected persecution, and
to collect related habitat data to characterise nesting attempts, will help to determine the degree to
which these issues could be biasing the data collected.
The Scheme also aims to provide intelligence and evidence for illegal persecution wherever possible,
in the form of objective information that can be passed to the National Wildlife Crime Unit. This will
enable Scheme data to add to and complement other sources of information on the persecution of
birds of prey, such as annual reviews published by the RSPB (e.g. Anon. 2012, 2013) and National
PAW persecution maps (PAW, 2014).

11
4 Species accounts
Annex 1 provides a regional breakdown, based on Scottish Raptor Study Group boundaries (Figure
2), of the raptor home ranges that received at least one visit in the spring of 2013 to check on
occupancy. A total of 5,896 home ranges were visited at least once in 2013. This is higher than the
previous "record" from 2012, when 5,736 home ranges were checked. Thus, the organised raptor
monitoring in Scotland continues to increase (Table 1). Not all of these home ranges held pairs: some
had only single birds and others were apparently vacant.
Equally important are follow up visits to confirm the findings of the first visit and to monitor the
nesting success of pairs present. The nesting success, normally expressed as the percentage of
monitored breeding pairs producing fledged young, together with the mean brood size, can also
provide an indication of the health of the population. Table 1 also shows that 2,929 potential breeding
pairs received further visits in 2013, enabling their nesting success to be determined. This constitutes
a 3.8% decrease on the previous year (Table 1 & Figure 4). A regional summary of these monitored
home ranges is provided in Annex 2.
Figure 4. The number of raptor, owl and Raven home ranges checked for
occupation and monitored for breeding outcome, and subsequently submitted to
the Scottish Raptor Monitoring Scheme between 2003 and 2013.
4.1 European Honey-buzzard Pernis apivorus
In Scotland Honey-buzzards are known to occur regularly in four regions; Highland, Moray, Tayside
and Dumfries & Galloway. In 2013 two pairs were located in Dumfries & Galloway. Only one pair
laid eggs and went on to be successful fledging two young. No breeding records were received from
any other region.
0
1000
2000
3000
4000
5000
6000
7000
2003 2005 2007 2009 2011 2013
Nu
mb
er o
f h
om
e ra
nge
s
Year
Home ranges checked Occupied home ranges monitored

12
4.2 Red Kite Milvus milvus (Tables 2 & 3)
With effect from 2013 the Rare Breeding Birds Panel is no longer reporting on Red Kite as the UK
population now exceeds 2000 breeding pairs. Since the reintroduction of Red Kites began in 1988
(through a partnership between RSPB Scotland and SNH), the increasing population in Scotland has
been closely monitored by RSPB Scotland and annual coverage has been close to 100% (Table 2).
Following the Scottish breeding population exceeding 200 pairs in 2012, SNH and RSPB Scotland
decided to reduce the programme for monitoring this species in Central Scotland, Dumfries &
Galloway and Tayside. It is fantastic to see that ongoing monitoring in these regions has been taken
up by SRSG members, ensuring that an almost complete coverage of the expanding population was
maintained in 2013.
The number of pairs laying eggs has risen
year on year since 1995. This upward trend
continued in 2013, with a 7% increase in
number of pairs laying (Table 3). In 2013,
244 pairs were located, 226 of which were
confirmed to lay eggs (Table 3). A total of
334 young fledged. Productivity and
fledging success was similar to that in 2012,
at 1.5 young per laying pair (Table 2). The
slow geographical spread of Red Kites into
some seemingly suitable habitat is puzzling,
and is the topic of an ongoing PhD study at
the University of Aberdeen.
4.3 White-tailed Eagle Haliaeetus albicilla (Tables 4 & 5)
Up to 2013, RSPB Scotland has been largely responsible for the coordination of monitoring of White-
tailed Eagles as part of a re-introduction programme between RSPB Scotland, Forestry Commission
Scotland and SNH. Overall in Scotland, the species continues to increase both numerically and
geographically as well as maintaining a high breeding success (Table 4).
Following the release of 85 birds from Norway between 2007 and 2012 as part of the East Scotland
Sea Eagles Project, the first breeding attempt in East Scotland occurred in 2013 (Table 5). A pair,
both released in 2009, raised a healthy male chick in Fife marking the first successful breeding
attempt by White-tailed Eagles breeding in East Scotland for nearly 200 years.
4.4 Marsh Harrier Circus aeruginosus (Table 6)
Marsh Harrier continues to be a scarce breeder and passage migrant in Scotland. In 2013, there were
nine pairs located in Scotland; six at the important River Tay reed beds (the most extensive of this
Figure 5. Brood of four Red Kite chicks in
Aberdeenshire (Ewan Weston).

13
habitat type in the UK), whilst two further pairs were found elsewhere in Tayside and a single pair
was located in Aberdeenshire (Table 6).
Five of the six pairs at the River Tay reed beds were known to lay eggs and went on to fledge a
minimum of 16 young from three broods of four and two broods of two. The sixth pair failed at the
nest building stage or just after. The two pairs elsewhere in Tayside did not receive repeat visits and
the Aberdeenshire pair did not stay around long enough to breed.
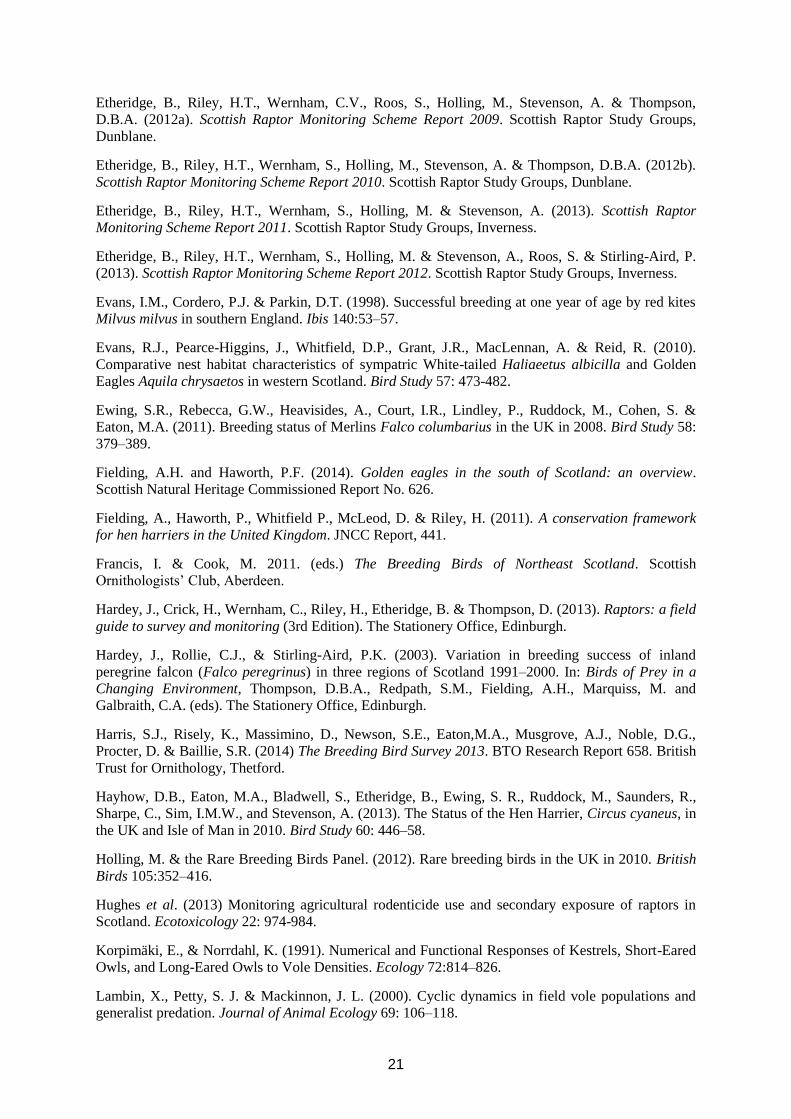
4.5 Hen Harrier Circus cyaneus (Tables 7 & 8)
Visits were made to a record high of 624 home ranges in 2013 (Table 7), all of them locations where
Hen Harriers have bred regularly in the past 20 years. Pairs were found at 278 (45%) and of these 234
received follow-up visits.
The number of confirmed egg-laying pairs was 195, the highest number recorded since 2008 (Table
7). There were 107 successful nesting pairs and 286 young fledged. The productivity was low in 2013,
with the mean brood size per monitored occupied home range of just 1.2 young (Table 7), and the
mean brood size of 1.5 young per pair laying eggs, equalling the lowest recorded by the Scheme so far
(Table 7).
However, the productivity varied across
Scotland. For example, in South West
Scotland, Hen Harriers had their best year
for a decade or so with a minimum of 28
fledging from each of Dumfries &
Galloway RSG and South Strathclyde RSG
areas, respectively (Table 8).
When published later this year, the updated
Hen Harrier Conservation Framework
(update of Fielding et al., 2011) will guide
conservation and management for this
species.
4.6 Northern Goshawk Accipiter gentilis (Tables 9 & 10)
In 2013, 174 home ranges were checked. There was evidence of pairs in 124 home ranges (Table 9),
with signs suggesting at least one bird in a further 15 ranges (Table 10). In total, 116 nests were
monitored, 114 where eggs were laid and 86% of these produced young. The brood size was up
slightly from the previous year, with 1.9 young per nesting pair (Table 9).
North-east Scotland continues to hold the highest number of home ranges checked (Table 10). In this
region, 81% of previously known nesting woods were occupied, and there were three additional
Figure 6. Hen Harrier chick, Perthshire (Keith
Brockie).

14
newly established nesting places (Mick Marquiss, pers. comm.). The late snow and subsequent cold
weather certainly impacted on breeding behaviour, with two nests abandoned before egg laying and
other birds abandoning early refurbished nests to lay elsewhere within the same wood. The effects of
the long cold spring were also seen further south in Scotland with several early nesting attempts
failing in Lothian & Borders (Malcolm Henderson, pers. comm.). This was noticeable during early
site visits to confirm occupancy. Follow up visits later showed that several of these sites had been
deserted at the nest building stage or the early stages of egg laying and incubation. Those birds that
did go on to incubate and were subsequently successful, laid about 2 weeks later than in previous
years.
4.7 Eurasian Sparrowhawk Accipiter nisus (Tables 11 & 12)
In 2013, 116 home ranges were visited (Table 11) and only 60 were occupied (52%). Fifty-one home
ranges received follow up visits, and eggs were laid at each of these sites but young fledged from only
38 of these.
Fewer home ranges were checked than in recent years (Table 11), which can be accounted for largely
by decrease in monitoring effort for this species in South Strathclyde in this year (Table 12).
It is striking that the SRMS for a number of years receives more data on the scarce Goshawk than the
more common Sparrowhawk (cf. Tables 9 and 11). Sparrowhawks are far more widespread than their
larger cousin and knowledge of their abundance and breeding success is important in assessing the
health of the wider environment. The Sparrowhawk is a priority species and we urge all raptor study
groups to consider setting up long-term study areas to monitor them. The Raptor Monitoring
Coordinator can provide advice on setting up such studies.
4.8 Common Buzzard Buteo buteo (Tables 13 & 14)
In 2013, 1030 home ranges were checked, 696 of which were occupied by pairs. Five hundred and
sixty-two occupied home ranges received follow-up visits. Five hundred and six pairs were confirmed
to lay eggs, but only 446 of these went on to fledge young. A mean productivity of 1.3 young per
monitored pair was recorded (Table 13).
The minimum number of young fledged per laying pair showed lots of regional variation which might
be at least partly attributable to differences in prey density, though it could also be affected by
regional differences in the proportion of failed nests that were found (see section 2.6 above).
4.9 Golden Eagle Aquila chrysaetos (Tables 15 & 16)
In 2013, 364 home ranges were checked for occupation, an increase on the previous year (Table 15).
Golden Eagle pairs were present in 296 home ranges (81% of those visited) and there were signs of
occupation at an additional 32 home ranges. There were follow up visits to 245 pairs, but 53 (22%) of

15
these failed early. The 114 successful pairs reared 128 young to fledging, a mean brood size per
monitored pair of 0.5 young (Table 15).
Sadly, a regular breeding pair of Golden
Eagles in Dumfries & Galloway was
reduced to a single adult female, who
displayed and built up eyries, but who was
not seen with a new young male until mid-
May – too late to breed (Chris Rollie, pers.
comm.). Meanwhile, hopes for Golden
Eagles in the Borders were raised by a
breeding attempt, albeit unsuccessful,
involving an adult male and an immature
female (Alan Heavisides, pers. comm.;
Table 16).
Recent work has shown that Southern
Scotland could support 11-16 pairs. This
would be a significant contribution to the
Scottish population, with potentially
positive implications for the species in the
north of England (Fielding & Haworth
2014).
The next national survey for Golden Eagles
will take place in 2015, being coordinated by RSPB as part of the Statutory Conservation
Agency/RSPB Annual Breeding Bird Scheme (SCARABBS) programme. In the last national survey
carried out in 2003, information was collected from 698 territories (Eaton et al. 2007). In 2015, SRSG
will be hoping to increase its coverage of known home ranges to help to provide as complete a census
of the population as is possible.
4.10 Osprey Pandion haliaetus
(Tables 17 & 18)
The occupancy rate of checked sites of in the
spring was the lowest recorded by the SRMS
to date, with only 68% of known sites
occupied by pairs (Table 17). This may, in
part, be explained by the April weather in
northern Morocco, Spain, Portugal and the
Bay of Biscay, on the migration routes of
many Ospreys, being very poor with heavy
Figure 7. Female (foreground) and male
(background) Golden Eagle nestlings fitted with
GPS satellite tags on Lewis (Ewan Weston).
Figure 8. Brood of three Ospreys in Aberdeenshire
(Ewan Wetson).

16
rains, cloudy conditions and strong winds, causing higher mortality than usual (Roy Dennis, pers.
comm.).
Single birds were present at an additional 13 sites (Table 18). Of the 180 monitored pairs, 166 were
confirmed to lay eggs and 129 succeeded in rearing young.
4.11 Barn Owl Tyto alba (Tables 19 & 20)
The breeding season of 2013 was poor for Barn Owls, both nationally (Table 19) and regionally
(Table 26). Of the 622 sites checked, only 215 (35%) were occupied by pairs. This is the lowest
occupancy rate reported by the Scheme to date (Table 19). Of the 196 pairs which received follow up
visits, 189 (96%) went on to lay eggs but of these only 100 (53%) successfully fledged young. The
mean brood size per laying pair was just 1.7, for a second consecutive year having previously been at
least 2.0 since 2003 (Table 19).
4.12 Little Owl Athene noctua
Little Owl is a scarce breeding bird in Scotland. For the second consecutive year, a successful
breeding attempt was reported from a site in Berwickshire where two young fledged. No reports were
received from elsewhere in Scotland.
4.13 Tawny Owl Strix aluco (Tables 21 & 22)
Tawny Owls are the most abundant owl species in Scotland. They are widespread on the Scottish
mainland, except in more mountainous areas, and also occupy some islands, notably those close to the
mainland (Petty 2007). The number of pairs monitored annually has ranged from 67 to 130 (Table
21). In 2013, a total of 218 nest sites were checked (mainly nest boxes) and 93 pairs were located.
Ninety-two of these received follow up visits, of which 89 pairs laid eggs and 71 hatched young. A
minimum number of 87 young fledged with a mean breeding success of 0.9 young per monitored pair,
the lowest ever recorded by the Scheme (Table 21). Nesting data were submitted from Argyll,
Central, Dumfries & Galloway, Highland, Lothian & Borders and Tayside (Table 22).
4.14 Long-eared Owl Asio otus (Table 23)
Although Long-eared Owls regularly breed in all regions of Scotland, apart from the Northern Isles,
this is a secretive and overlooked species and is therefore under-recorded throughout its range.
In 2013, 27 of the 29 known territories that were checked showed signs of occupation (Table 23).
Eighteen pairs were known to lay eggs and 16 pairs succeeded in fledging a minimum of 28 young.
The mean brood size was 1.6 per laying pair (Table 23).

17
4.15 Short-eared Owl Asio flammeus (Table 24)
A total of 166 known sites were checked in 2013 of which 71 (43%) were found to hold pairs and 58
held single birds (Table 24). Thirty-seven nests were found and monitored, but only 21 (57%) fledged
young. The mean brood size of 2.4 was the highest since 2010. However, any count of fledged young
will always be conservative as they disperse away from the nest long before they are capable of
flying. This is a species for which the SRMS is very keen to see expansion of monitoring coverage,
but which is a challenging bird to survey systematically. Uist, for example, regularly has many more
Short-eared Owls than the records suggest, with those records that are submitted generally limited to
incidental records of confirmed breeding. To expand monitoring coverage of this species here
presents a challenge for the existing raptor monitoring community as it would mean reducing effort on
other species.
4.16 Common Kestrel Falco tinnunculus (Tables 25 & 26)
In 2013, visits were made to 241 home ranges with signs of occupation at 117, the lowest occupancy
(49%) recorded by the SRMS (Table 26). This may partly reflect the recent erection of new nest
boxes, particularly in Lothian & Borders that had not been taken up by Kestrels in 2013. This raises
the question of how occupancy should be measured for boxes which have yet to be occupied or,
indeed, boxes which have been occupied in previous years by several species. The SRMG
recommends that the first year the species nests in a box be considered the start year for that
box/territory.
Of the 93 pairs that were monitored, 80 pairs laid eggs (86%), the lowest ever recorded by the SRMS
(Table 25). Of these, 70 pairs went on to successfully fledge a minimum of 211 young.
The Breeding Bird Survey (BBS) has reported a decline of 65% for Kestrels in Scotland between
1995 and 2012 (Harris et al. 2014), and the status of Kestrels is now of considerable concern. The
establishment of more long-term study areas would be a welcome development for the Scheme.
Increased coverage of more BBS squares across Scotland (see www.bto.org/volunteer-surveys/bbs)
would also provide valuable information about contribution to monitoring the fortunes of this and
other widespread raptors in Scotland. Where long-term study data for any species are available, it is
possible to start to investigate the causes of population changes. An excellent example of such a
study is an ongoing collaboration between Gordon Riddle (South Strathclyde RSG) and RSPB
Scotland Conservation Scientists to look at trends in an Ayrshire population of Kestrels that has been
monitored since 1972.
4.17 Merlin Falco columbarius (Tables 27 & 28)
The Scottish breeding population of Merlins was estimated at 733 pairs in 2008 (Ewing et al. 2011),
which suggested little change from the 800 pairs estimated in the 1993-94 survey (Rebecca &
Bainbridge, 1998). Monitoring of breeding Merlins has remained almost unchanged over the last ten
years (the national survey year excepted; Table 27) and is a reflection of the enduring popularity of

18
this small falcon. Table 28 indicates that whilst coverage of breeding pairs is strong in some areas
(Orkney, Northeast Scotland and parts of Tayside and Lothian & Borders), in others, important
populations get poor or limited coverage (Lewis and much of the Highlands).
In 2013, visits were made to 389 home
ranges and 205 (53%) had signs of
occupation, though only 165 (42%) by
breeding pairs (Table 27). A total of 137
pairs received follow up visits, of which
134 laid eggs, 112 reached the hatching
stage and 105 fledged a minimum of 296
young – the second lowest number of
fledglings recorded by the SRMS to date.
This low number of fledgings may be a
reflection of territories not being followed
through to fledging as often Merlins are
recorded secondary to other species being
monitored (Wendy Mattingley, pers comm). Mean brood size recorded was slightly higher than in
2012, at 2.2 young per laying pair. This figure is low compared to the average of 2.6 young per
laying pair over the period 2005-2011 (Table 28).
4.18 Eurasian Hobby Falco subbuteo
Three nesting pairs were located for the second year running, one in Badenoch & Strathspey and two
in Angus. The Badenoch & Strathspey pair fledged a minimum of four young and the two Angus
pairs fledged one and two young, respectively.
4.19 Peregrine Falcon Falco peregrinus (Tables 29 & 30)
After recovery from the detrimental effects
of organochlorine pesticides on
productivity and survival in the 1950s &
1960s, Scottish Peregrine numbers from
the periodic national surveys peaked at 639
occupied territories in 1991 (Crick &
Ratcliffe 1995). However, the numbers
have subsequently shown signs of decline
in some parts of Scotland, which is also
captured in the annual SRMS data (Table
29). The last national survey in 2002
estimated 624 occupied territories (Banks
et al. 2010) and the results of the 2014
Figure 9. Merlin chick, Perthshire (Keith Brockie).
Figure 10. Peregrine Falcon in Ayrshire (Angus
Hogg).

19
survey are eagerly awaited by many.
In 2013, 648 home ranges were checked (Table 30. This is a historically high number (Table 29), and
could probably be explained by the fact that many raptor workers increased their survey effort in the
year prior to the national survey in 2014. There were signs of occupation at 354 (55%) of these; 314
by pairs and 40 by single birds. Follow up monitoring visits were made to 265 pairs. Of these, 18
either failed at an early stage or were not breeding, 35 pairs failed during incubation and a further 18
pairs failed with young. In total, 194 pairs successfully reared a minimum of 423 young, giving a
mean brood size per monitored pair of 1.6 young.
4.20 Northern Raven Corvus corax (Tables 31 & 32)
The 2007-2011 Atlas showed that the breeding range and abundance of Ravens is increasing in many
areas of Scotland (Balmer et al. 2013). Breeding adults are strongly site-faithful (Mearns, 2007). The
number of Raven pairs monitored under the Scheme has increased from less than 200 in 2003 to more
than 300 annually since 2008 (Table 31). In 2013, 539 home ranges were checked, 443 were found
occupied and 374 pairs were monitored (Table 31). Of these, 343 (92%) were confirmed to lay eggs
and 259 pairs (76%) reared young. With a minimum of 709 fledged young recorded, the mean
breeding success was 1.9 fledged young per monitored pair and 2.1 per pair laying eggs (Table 31).
5 Acknowledgements
The Scottish Raptor Monitoring Scheme is supported by funding from Scottish Natural Heritage, for
which we are extremely grateful. Much of the data were supplied by members of the Scottish Raptor
Study Group regional branches to whom we extend our special thanks. RSPB Scotland kindly
supplied full details of their long-term monitoring of reintroduced populations of White-tailed Eagles
and Red Kites. Further data were supplied by the RPS Group and the Rare Breeding Birds Panel,
which we appreciatively acknowledge.
For this 2013 report, we are extremely indebted to Brian Etheridge for handling the initial collation of
the 2013 data before Amy came into post. We also thank Keith Brockie, Angus Hogg, Derek Spencer
and Ewan Weston for contributing the photographs which feature throughout the report.
This publication should be cited as follows:
Challis, A., Holling, M., Stevenson, A., Roos, S., Stirling-Aird, P. & Wilson, M.W. (2014). Scottish
Raptor Monitoring Scheme Report 2013. BTO Scotland, Stirling.
Please send breeding records for raptors, owls and Raven for 2014 to the
Scottish Raptor Monitoring Coordinator, Amy Challis at:

20
6 References
Amar, A., Davies, J., Meek, E., Williams, J., Knight, A. & Redpath, S. (2010). Long-term impact of
changes in sheep densities Ovis aries on the breeding output of the Hen Harrier Circus cyaneus on the
Orkney Islands, Scotland. Journal of Applied Ecology 48: 220–227.
Amar, A., Court, I.R., Davison, M., Downing, S., Grimshaw, T., Pickford, T. and Raw, D. (2012).
Linking nest histories, remotely sensed land use data and wildlife crime records to explore the impact
of grouse moor management on peregrine falcon populations. Biological Conservation 145: 86–94.
Amar et al. (2011) Long-term impact of changes in sheep Ovis aries densities on the breeding output
of the hen harrier Circus cyaneus. Journal of Applied Ecology 48: 220-227
Anderson et al. 2009. Using distribution models to test alternative hypotheses about a species'
environmental limits and recovery prospects. Biological Conservation 142: 488-499.
Anon. (1990) Breeding biology of goshawks in lowland Britain. British Birds 83: 527-540.
Anon. (2002). Scottish Raptor Monitoring Scheme Agreement. Scottish Natural Heritage, Perth.
Anon. (2012). Birdcrime 2011. Offences against wild bird legislation in 2011. RSPB, Sandy, Beds.
Anon. (2013). The illegal killing of Birds of Prey in Scotland in 2011. RSPB Scotland, Edinburgh.
Balmer, D.E., Gillings, S., Caffrey, B.J., Swann, R.L., Downie, I.S. & Fuller R.J. 2013. Bird Atlas
2007–11: the Breeding and Wintering Birds of Britain and Ireland. BTO, Thetford.
Banks, A.N., Crick, H.Q.P., Coombs, R., Benn, S., Ratcliffe, D.A., & Humphreys, E.M. (2010). The
breeding status of Peregrine Falcons Falco peregrinus in the UK and Isle of Man in 2002. Bird Study
57: 421–436.
Crick, H.Q.P. & Ratcliffe, D.A. (1995). The peregrine (Falco peregrinus) breeding population of the
United Kingdom in 1991. Bird study 42: 1-19.
Eaton, M. A., Dillon, I.A.. Stirling-Aird, P.K. & Whitfield, D.P. (2007). Status of Golden Eagle
Aquila chrysaetos in Britain in 2003. Bird Study 54: 212–220.
Etheridge, B, Summers, R.W. & Green, R.E. (1997). The effects of illegal killing and destruction of
nests by humans on the population dynamics of the hen harrier Circus cyaneus in Scotland. Journal of
Applied Ecology 34: 1081–1105.
Etheridge, B. (2005). Scottish Raptor Monitoring Report 2003. Scottish Ornithologists’ Club,
Aberlady.
Etheridge, B., Holling, M., Thompson, D.B.A., & Riley, H.T. (eds.) (2006). Scottish Raptor
Monitoring Scheme Report 2004. Scottish Ornithologists’ Club, Aberlady.
Etheridge, B., Holling, M., Riley, H.T., Wernham, C.V. & Thompson, D.B.A. (2007). Scottish Raptor
Monitoring Scheme Report 2005. Scottish Ornithologists’ Club, Aberlady.
Etheridge, B., Holling, M., Riley, H.T., Wernham, C.V. & Thompson, D.B.A. (2008). Scottish Raptor
Monitoring Scheme Report 2006. Scottish Ornithologists’ Club, Aberlady.
Etheridge, B., Holling, M., Riley, H.T., Wernham, C.V. & Thompson, D.B.A. (2010). Scottish Raptor
Monitoring Scheme Report 2007. Scottish Raptor Study Groups, Dunblane.
Etheridge, B., Riley, H.T., Wernham, C.V., Holling, M. & Thompson, D.B.A. (2011). Scottish Raptor
Monitoring Scheme Report 2008. Scottish Raptor Study Groups, Dunblane.
21
Etheridge, B., Riley, H.T., Wernham, C.V., Roos, S., Holling, M., Stevenson, A. & Thompson,
D.B.A. (2012a). Scottish Raptor Monitoring Scheme Report 2009. Scottish Raptor Study Groups,
Dunblane.
Etheridge, B., Riley, H.T., Wernham, S., Holling, M., Stevenson, A. & Thompson, D.B.A. (2012b).
Scottish Raptor Monitoring Scheme Report 2010. Scottish Raptor Study Groups, Dunblane.
Etheridge, B., Riley, H.T., Wernham, S., Holling, M. & Stevenson, A. (2013). Scottish Raptor
Monitoring Scheme Report 2011. Scottish Raptor Study Groups, Inverness.
Etheridge, B., Riley, H.T., Wernham, S., Holling, M. & Stevenson, A., Roos, S. & Stirling-Aird, P.
(2013). Scottish Raptor Monitoring Scheme Report 2012. Scottish Raptor Study Groups, Inverness.
Evans, I.M., Cordero, P.J. & Parkin, D.T. (1998). Successful breeding at one year of age by red kites
Milvus milvus in southern England. Ibis 140:53–57.
Evans, R.J., Pearce-Higgins, J., Whitfield, D.P., Grant, J.R., MacLennan, A. & Reid, R. (2010).
Comparative nest habitat characteristics of sympatric White-tailed Haliaeetus albicilla and Golden
Eagles Aquila chrysaetos in western Scotland. Bird Study 57: 473-482.
Ewing, S.R., Rebecca, G.W., Heavisides, A., Court, I.R., Lindley, P., Ruddock, M., Cohen, S. &
Eaton, M.A. (2011). Breeding status of Merlins Falco columbarius in the UK in 2008. Bird Study 58:
379–389.
Fielding, A.H. and Haworth, P.F. (2014). Golden eagles in the south of Scotland: an overview.
Scottish Natural Heritage Commissioned Report No. 626.
Fielding, A., Haworth, P., Whitfield P., McLeod, D. & Riley, H. (2011). A conservation framework
for hen harriers in the United Kingdom. JNCC Report, 441.
Francis, I. & Cook, M. 2011. (eds.) The Breeding Birds of Northeast Scotland. Scottish
Ornithologists’ Club, Aberdeen.
Hardey, J., Crick, H., Wernham, C., Riley, H., Etheridge, B. & Thompson, D. (2013). Raptors: a field
guide to survey and monitoring (3rd Edition). The Stationery Office, Edinburgh.
Hardey, J., Rollie, C.J., & Stirling-Aird, P.K. (2003). Variation in breeding success of inland
peregrine falcon (Falco peregrinus) in three regions of Scotland 1991–2000. In: Birds of Prey in a
Changing Environment, Thompson, D.B.A., Redpath, S.M., Fielding, A.H., Marquiss, M. and
Galbraith, C.A. (eds). The Stationery Office, Edinburgh.
Harris, S.J., Risely, K., Massimino, D., Newson, S.E., Eaton,M.A., Musgrove, A.J., Noble, D.G.,
Procter, D. & Baillie, S.R. (2014) The Breeding Bird Survey 2013. BTO Research Report 658. British
Trust for Ornithology, Thetford.
Hayhow, D.B., Eaton, M.A., Bladwell, S., Etheridge, B., Ewing, S. R., Ruddock, M., Saunders, R.,
Sharpe, C., Sim, I.M.W., and Stevenson, A. (2013). The Status of the Hen Harrier, Circus cyaneus, in
the UK and Isle of Man in 2010. Bird Study 60: 446–58.
Holling, M. & the Rare Breeding Birds Panel. (2012). Rare breeding birds in the UK in 2010. British
Birds 105:352–416.
Hughes et al. (2013) Monitoring agricultural rodenticide use and secondary exposure of raptors in
Scotland. Ecotoxicology 22: 974-984.
Korpimäki, E., & Norrdahl, K. (1991). Numerical and Functional Responses of Kestrels, Short-Eared
Owls, and Long-Eared Owls to Vole Densities. Ecology 72:814–826.
Lambin, X., Petty, S. J. & Mackinnon, J. L. (2000). Cyclic dynamics in field vole populations and
generalist predation. Journal of Animal Ecology 69: 106–118.

22
Marquiss, M. & Newton, I. (1982) The Goshawk in Britain. British Birds 75: 243-260.
Mearns, R. (2007) Common raven. In: The Birds of Scotland, Forrester, R.W, Andrews, I.J.,
McInerny, C.J., Murray, R.D., McGowan, R.Y., Zonfrillo, B., Betts, M.W., Jardine, D.C., and
Grundy, D.S. (eds). The Scottish Ornithologists’ Club, Aberlady. pp 1364–1366.
PAW (2014) PAW Scotland Bird of Prey Crime Hotspot Maps 2009-2013.
Petty, S. J. (2007) Tawny Owl. In: The Birds of Scotland, Forrester, R.W, Andrews, I.J., McInerny,
C.J., Murray, R.D., McGowan, R.Y., Zonfrillo, B., Betts, M.W., Jardine, D.C., and Grundy, D.S.
(eds). The Scottish Ornithologists’ Club, Aberlady. pp 917–920.
Petty, S. J., Lambin, X., Sheratt, T.N., Thomas, C. J., Mackinnon, J. L., Coles, C. F., Davison, M. &
Little, B. (2000). Spatial synchrony in field vole Microtus agrestis abundance in a coniferous forest in
northern England: the role of vole-eating raptors. Journal of Applied Ecology 37 (Suppl.1): 136–147.
Rebecca, G.W. & Bainbridge, I.P. (1998) The breeding status of the Merlin Falco columbarius in
Britain in 1993–94. Bird Study, 45:2, 172-187.
Redpath, S., Amar, A., Smith, A., Thompson, D. B. A. & Thirgood, S. (2010). People and nature in
conflict: can we reconcile hen harrier conservation and game management. In: Species Management:
Challenges and Solutions for the 21st Century, Baxter, J. M. & Galbraith, C. A. (eds). TSO,
Edinburgh.
Redfern, C.P.F. & Clark, J.A. 2001. Ringers’ Manual. BTO, Thetford.
Sergio & Hiraldo. 2008. Intraguild predation in raptor assemblages: a review. Ibis 150: 132-145.
Smart, J., Amar, A., Sim, I.M.W., Etheridge, B., Cameron, D., Christie, G. & Wilson, J.D. (2010).
Illegal killing slows population recovery of a reintroduced raptor of high conservation concern - The
red kite Milvus milvus. Biological Conservation 143: 1278–1286.
Taylor, I. R. (1994). Barn Owls: Predator-Prey Relationships and Conservation. Cambridge
University Press, Cambridge.
Village, A. (1990). The Kestrel. T. & A.D. Poyser, London.
Watson, J. (2010). The Golden Eagle (Second Edition). T&AD Poyser, London.
Whitfield, D.P., Fielding, A.H., Mcleod, D.R.A. & Haworth, P.F. (2004a). The effects of persecution
on age of breeding and territory occupation in Golden Eagles in Scotland. Biological Conservation
118: 249–259.
Whitfield, D.P., Fielding, A.H., Mcleod, D.R.A. & Haworth, P.F. (2004b). Modelling the effects of
persecution on the population dynamics of golden eagles in Scotland. Biological Conservation 119:
319–333.
Whitfield et al. (2007). Factors constraining the distribution of Golden Eagles Aquila chrysaetos in
Scotland. Bird Study 54: 199-211.
Whitfield, D.P., Fielding, A.H., Mcleod, D.R.A. & Haworth, P.F. (2008). A conservation framework
for the golden eagle: implications for the conservation and management of golden eagles in Scotland.
Scottish Natural Heritage Commissioned Report No. 193, Perth.

23
7 Tables
N.B. Data in the following tables present the data submitted to the SRMS in 2013. It is important to
recognise that, for the majority of species, not all breeding individuals were monitored. Thus, the
numbers in these tables do not represent entire populations or provide a complete picture of breeding
productivity, at either regional or national scales. For more detail on completeness of coverage for
these species by the SRMS please see section 2.2.
Table 1. Scottish Raptor Monitoring Scheme: The number and inter-annual percentage change of home ranges
checked and monitored between 2003 and 2013.
Year Home ranges checked Annual change Occupied home ranges monitored Annual change
2003 3483 2406
2004 3488 0.1 2277 -5.4
2005 3618 3.7 2289 0.5
2006 4006 10.7 2525 10.3
2007 4284 6.9 2614 3.5
2008 4606 7.5 2800 7.1
2009 4472 -2.9 2592 -7.4
2010 4811 7.6 2824 9.0
2011 5246 9.0 3011 6.6
2012 5736 9.0 3042 1.0
2013 5896 2.8 2929 -3.8

24
Table 2. Number of pairs laying eggs and breeding success of Red Kites in Scotland, 1992-2013.
Year Pairs laying
eggs Pairs fledging
young Total young
fledged % of pairs that fledged young
Productivity (young per laying pair)
1992 1 1 1 100.0 1.0
1993 5 3 7 60.0 1.4
1994 8 7 13 87.5 1.6
1995 15 11 26 73.3 1.7
1996 17 16 39 94.1 2.3
1997 23 19 39 82.6 1.7
1998 25 22 49 88.0 2.0
1999 34 27 59 79.4 1.7
2000 39 35 86 89.7 2.2
2001 43 38 95 88.4 2.2
2002 50 43 112 86.0 2.2
2003 54 48 106 88.9 2.0
2004 60 49 115 81.7 1.9
2005 76 61 131 80.3 1.7
2006 84 69 151 82.1 1.8
2007 93 73 162 78.5 1.7
2008 121 97 210 80.0 1.7
2009 152 113 235 74.3 1.6
2010 162 134 293 82.7 1.8
2011 185 155 313 83.8 1.7
2012 212 170 312 80.2 1.5
2013 226 179 334 79.2 1.5
TOTAL: 1685 1370 2888 81.3 1.8
N.B. Breeding in North Scotland started in 1992, in Central Scotland in 1998, in Dumfries & Galloway in 2003,
and in Aberdeen in 2008. The mean values given for the final columns are the unweighted means, i.e. the
sample sizes for each year have not been taken into consideration.
Table 3. Breeding success of Red Kites in Scotland in 2013.
Reintroduced populations
Home ranges
checked
Pairs located
Pairs monitored
Pairs failing
early or non-
breeding
Pairs laying eggs
Pairs hatching
eggs
Pairs fledging
young
Minimum number of
young fledged
North Scotland 93 61 56 0 56 50 50 108
- Inverness-shire 11 5 5 0 5 4 4 9
- Lochaber 2 2 0 0 0 0 0 0
- Ross-shire 78 52 49 0 49 44 44 94
- Sutherland 2 2 2 0 2 2 2 5
Aberdeenshire 31 19 18 0 18 15 15 40
- Aberdeenshire 29 18 17 0 17 15 15 40
- Angus 2 1 1 0 1 0 – –
Central Scotland 132 87 82 7 75 56 51 95
- Perth & Kinross 77 55 53 4 49 36 34 64
- Stirling 55 32 29 3 26 20 17 31
Dumfries & Galloway 84 77 77 0 77 65 63 91
TOTAL: 340 244 233 7 226 186 179 334

25
Table 4. The number of White-tailed Eagle pairs monitored, their breeding success and productivity in
Scotland, 1996-2013.
Year Territorial
pairs monitored
Pairs laying eggs
Pairs hatching
eggs
Pairs fledging
young
Total young
fledged
Young fledged per laying pair
Young fledged per territorial
pair
1996 12 12 8 7 9 0.8 0.8
1997 14 11 6 5 9 0.8 0.6
1998 19 16 9 9 13 0.8 0.7
1999 20 16 9 6 11 0.7 0.6
2000 22 19 12 8 12 0.6 0.6
2001 23 17 10 7 11 0.7 0.5
2002 25 22 14 8 12 0.6 0.5
2003 31 25 20 16 26 1.0 0.8
2004 32 28 19 15 19 0.7 0.6
2005 33 28 21 17 24 0.9 0.7
2006 36 31 25 21 29 0.9 0.8
2007 42 35 31 24 34 1.0 0.8
2008 44 35 21 20 28 0.8 0.6
2009 46 39 31 24 36 0.9 0.8
2010 52 47 34 33 46 1.0 0.9
2011 57 49 38 33 43 0.9 0.8
2012 67 59 46 41 60 1.0 0.9
2013 82 74 55 86 99 1.3 1.2
TOTAL: 657 563 409 380 521 0.9 0.7
Table 5. Breeding success of White-tailed Eagles in Scotland in 2013. The majority of these data were
provided by RSPB as summaries in the White-tailed Eagle Project newsletter available at:
http://www.rspb.org.uk/Images/WTE_newsletter_2013_tcm9-369335.pdf. There are minor deviations from
these figures where a small number of additional records have become available.
Study area Confirmed
occupied by pairs
Incubation confirmed
Pairs hatching eggs
Pairs fledging young
Minimum number of
young fledged
Argyll Islands 22 22 17 25 29
Isle of Skye, Lochalsh & the Small Isles
17 13 10 19 26
Orkney 1 0 – – – North Scotland mainland 1 1 0 – – Tayside 1 1 1 1 1
Western Isles 24 22 18 26 38
West Scotland mainland 15 13 10 21 24
TOTAL: 80 71 55 85 109
Table 6. The number of pairs of Marsh Harriers located and their breeding success in Scotland, 2003-2013.
Year Pairs located Pairs laying eggs Pairs fledging young Minimum number of young fledged
2003 6 6 5 17
2004 8 5 5 15
2005 9 6 5 17
2006 9 7 7 20
2007 8 5 2 3
2008 4 4 2 3
2009 6 3 3 10
2010 4* 4* 4* 11
2011 5 5 4 10
2012 9 9? 5 12
2013 9 5 5 16
* One male in 2010 was polygamous.

26
Table 7. Home range occupancy and breeding success of Hen Harriers in Scotland, 2003-2013.
Year Home
ranges checked
Home ranges occupied by
pairs %
Monitored pair occupied home
ranges
Pairs known to lay eggs
% Pairs known
to fledge young
% Minimum
number of young fledged
Mean brood size per successful
nest
Mean brood size per pair
laying
Mean brood size per monitored occupied
home range
2003 379 335 88 303 271 89 171 56 529 3.1 2.0 1.7
2004 457 417 91 359 236 91 219 61 630 2.9 1.9 1.8
2005 395 342 87 310 268 86 175 56 466 2.7 1.7 1.5
2006 428 355 83 278 223 80 144 52 381 2.6 1.5 1.4
2007 415 298 72 253 213 84 147 58 432 2.9 2.0 1.7
2008 422 311 74 311 232 75 128 41 370 2.9 1.6 1.2
2009 365 232 64 208 162 78 108 52 326 3.0 2.0 1.6
2010 383 240 63 222 182 82 108 49 303 2.8 1.7 1.4
2011 490 267 54 246 186 76 111 45 291 2.6 1.6 1.2
2012 558 259 46 217 160 74 107 49 275 2.6 1.7 1.3
2013 624 278 45 234 195 83 107 46 286 2.7 1.5 1.2
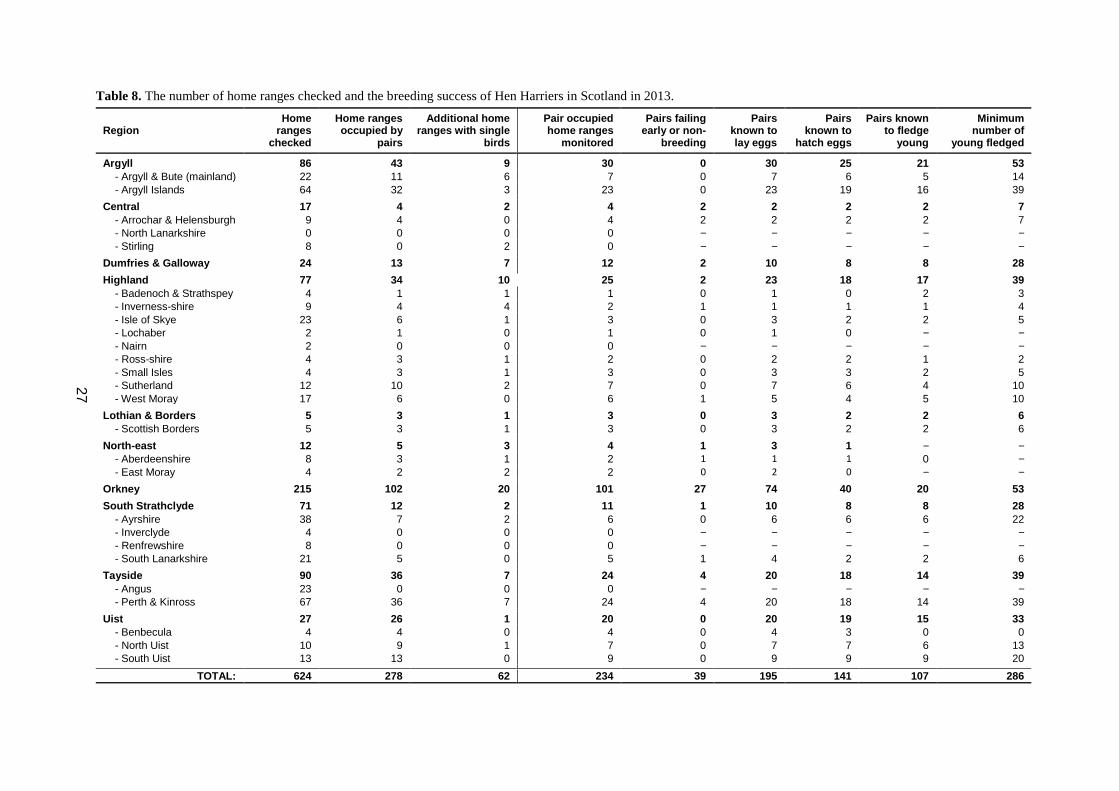
27
Table 8. The number of home ranges checked and the breeding success of Hen Harriers in Scotland in 2013.
Region Home
ranges checked
Home ranges occupied by
pairs
Additional home ranges with single
birds
Pair occupied home ranges
monitored
Pairs failing early or non-
breeding
Pairs known to lay eggs
Pairs known to
hatch eggs
Pairs known to fledge
young
Minimum number of
young fledged
Argyll 86 43 9 30 0 30 25 21 53
- Argyll & Bute (mainland) 22 11 6 7 0 7 6 5 14
- Argyll Islands 64 32 3 23 0 23 19 16 39
Central 17 4 2 4 2 2 2 2 7
- Arrochar & Helensburgh 9 4 0 4 2 2 2 2 7
- North Lanarkshire 0 0 0 0 – – – – –
- Stirling 8 0 2 0 – – – – –
Dumfries & Galloway 24 13 7 12 2 10 8 8 28
Highland 77 34 10 25 2 23 18 17 39
- Badenoch & Strathspey 4 1 1 1 0 1 0 2 3
- Inverness-shire 9 4 4 2 1 1 1 1 4
- Isle of Skye 23 6 1 3 0 3 2 2 5
- Lochaber 2 1 0 1 0 1 0 – –
- Nairn 2 0 0 0 – – – – –
- Ross-shire 4 3 1 2 0 2 2 1 2
- Small Isles 4 3 1 3 0 3 3 2 5
- Sutherland 12 10 2 7 0 7 6 4 10
- West Moray 17 6 0 6 1 5 4 5 10
Lothian & Borders 5 3 1 3 0 3 2 2 6
- Scottish Borders 5 3 1 3 0 3 2 2 6
North-east 12 5 3 4 1 3 1 – –
- Aberdeenshire 8 3 1 2 1 1 1 0 –
- East Moray 4 2 2 2 0 2 0 – –
Orkney 215 102 20 101 27 74 40 20 53
South Strathclyde 71 12 2 11 1 10 8 8 28
- Ayrshire 38 7 2 6 0 6 6 6 22
- Inverclyde 4 0 0 0 – – – – –
- Renfrewshire 8 0 0 0 – – – – –
- South Lanarkshire 21 5 0 5 1 4 2 2 6
Tayside 90 36 7 24 4 20 18 14 39
- Angus 23 0 0 0 – – – – –
- Perth & Kinross 67 36 7 24 4 20 18 14 39
Uist 27 26 1 20 0 20 19 15 33
- Benbecula 4 4 0 4 0 4 3 0 0
- North Uist 10 9 1 7 0 7 7 6 13
- South Uist 13 13 0 9 0 9 9 9 20
TOTAL: 624 278 62 234 39 195 141 107 286
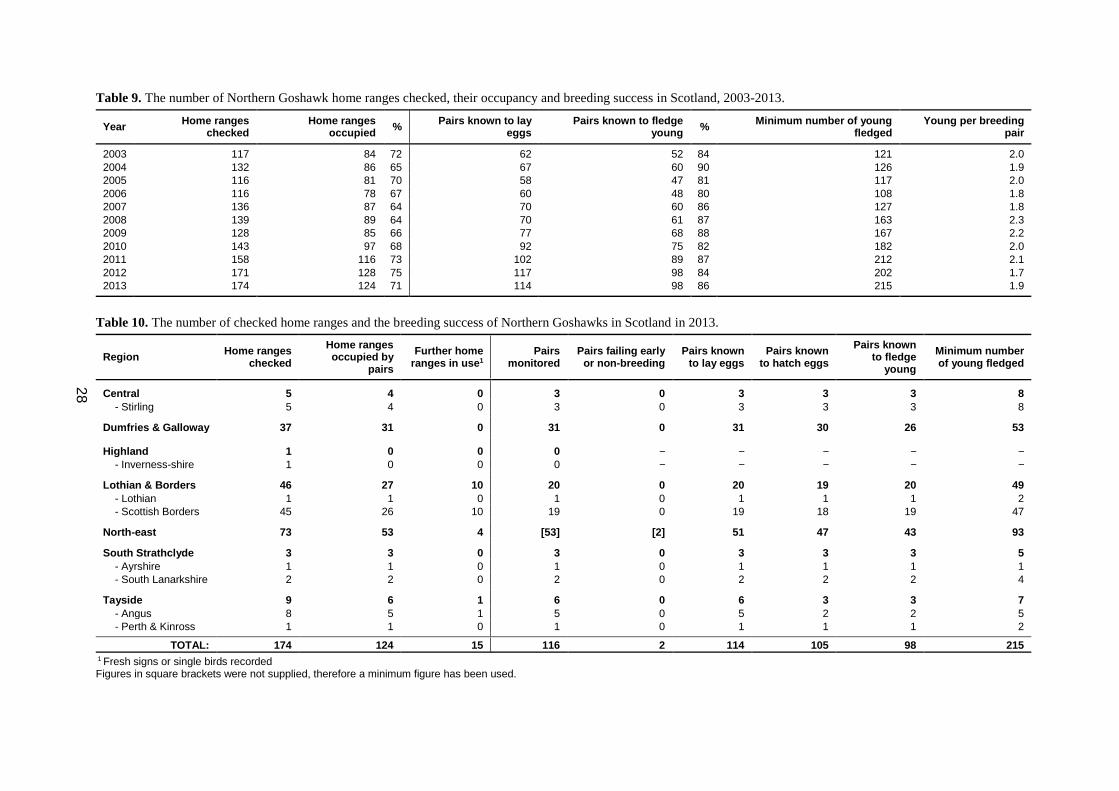
28
Table 9. The number of Northern Goshawk home ranges checked, their occupancy and breeding success in Scotland, 2003-2013.
Year Home ranges
checked Home ranges
occupied %
Pairs known to lay eggs
Pairs known to fledge young
% Minimum number of young
fledged Young per breeding
pair
2003 117 84 72 62 52 84 121 2.0
2004 132 86 65 67 60 90 126 1.9
2005 116 81 70 58 47 81 117 2.0
2006 116 78 67 60 48 80 108 1.8
2007 136 87 64 70 60 86 127 1.8
2008 139 89 64 70 61 87 163 2.3
2009 128 85 66 77 68 88 167 2.2
2010 143 97 68 92 75 82 182 2.0
2011 158 116 73 102 89 87 212 2.1
2012 171 128 75 117 98 84 202 1.7
2013 174 124 71 114 98 86 215 1.9
Table 10. The number of checked home ranges and the breeding success of Northern Goshawks in Scotland in 2013.
Region Home ranges
checked
Home ranges occupied by
pairs
Further home ranges in use1
Pairs monitored
Pairs failing early or non-breeding
Pairs known to lay eggs
Pairs known to hatch eggs
Pairs known to fledge
young
Minimum number of young fledged
Central 5 4 0 3 0 3 3 3 8
- Stirling 5 4 0 3 0 3 3 3 8
Dumfries & Galloway 37 31 0 31 0 31 30 26 53
Highland 1 0 0 0 – – – – –
- Inverness-shire 1 0 0 0 – – – – –
Lothian & Borders 46 27 10 20 0 20 19 20 49
- Lothian 1 1 0 1 0 1 1 1 2
- Scottish Borders 45 26 10 19 0 19 18 19 47
North-east 73 53 4 [53] [2] 51 47 43 93
South Strathclyde 3 3 0 3 0 3 3 3 5
- Ayrshire 1 1 0 1 0 1 1 1 1
- South Lanarkshire 2 2 0 2 0 2 2 2 4
Tayside 9 6 1 6 0 6 3 3 7
- Angus 8 5 1 5 0 5 2 2 5
- Perth & Kinross 1 1 0 1 0 1 1 1 2
TOTAL: 174 124 15 116 2 114 105 98 215
1 Fresh signs or single birds recorded Figures in square brackets were not supplied, therefore a minimum figure has been used.

29
Table 11. Home range occupancy and breeding success of Eurasian Sparrowhawks in Scotland, 2003-2013.
Year Home ranges
checked
Home ranges occupied by
pairs %
Pair occupied home ranges monitored
Pairs known to lay eggs
% Pairs
fledging young
% Minimum number of young fledged
Mean brood size per laying
pair
Mean brood size per monitored occupied
home range
2003 63 45 71 43 39 91 33 77 114 2.9 2.7
2004 72 58 81 44 44 100 35 80 97 2.2 2.2
2005 98 69 70 59 55 93 47 80 150 2.7 2.5
2006 84 51 61 39 36 92 31 79 112 3.1 2.9
2007 104 67 64 55 52 95 42 76 135 2.6 2.5
2008 98 64 65 54 52 96 45 83 123 2.4 2.3
2009 176 97 55 89 87 98 78 88 182 2.1 2.0
2010 128 71 55 61 58 95 53 87 157 2.7 2.6
2011 128 97 76 89 76 85 72 81 177 2.3 2.0
2012 140 79 56 69 59 86 50 72 134 2.3 1.9
2013 116 60 52 51 51 100 38 75 120 2.4 2.4
Table 12. Breeding success of Eurasian Sparrowhawks in Scotland in 2013.
Region Home ranges
checked Home ranges
occupied by pairs Home ranges
monitored Pairs failing early
or non-breeding Pairs known
to lay eggs Pairs known to
hatch eggs Pairs known to
fledge young Minimum number of young fledged
Argyll 15 9 7 0 7 6 4 9
- Argyll & Bute (mainland) 9 5 4 0 4 3 3 8
- Argyll Islands 6 4 3 0 3 3 1 1
Central 26 11 10 0 10 10 9 32
- Falkirk 1 1 1 0 1 1 1 5
- North Lanarkshire 2 2 2 0 2 2 2 9
- Stirling 23 8 7 0 7 7 6 18
Dumfries & Galloway 7 5 5 0 5 5 1 3
Highland 8 5 5 0 5 5 5 15
- Caithness 2 1 1 0 1 1 1 1
- Inverness-shire 1 0 0 – – – – –
- Ross-shire 4 4 4 0 4 4 4 14
- Small Isles 1 0 0 – – – – –
Lewis & Harris 1 1 1 0 1 1 1 7
- Lewis 1 1 1 0 1 1 1 7
Lothian & Borders 36 15 11 0 11 9 9 34
- Lothian 36 15 11 0 11 9 9 34
North-east 1 1 1 0 1 1 1 1
Orkney 19 10 9 0 9 8 6 15
Uist 3 3 2 0 2 2 2 4
- North Uist 2 2 2 0 2 2 2 4
- South Uist 1 1 0 – – – – –
TOTAL: 116 60 51
0 51 47 38 120
30
Table 13. Home range occupancy and breeding success of Common Buzzards in Scotland, 2003-2013.
Year Home
ranges checked
Home ranges
occupied by pairs
%
Pair occupied
home ranges
monitored
Pairs known to lay eggs
% Pairs
fledging young
%
Minimum number of
young fledged
Mean brood size per
pair laying
Mean brood size per
monitored occupied
home range
2003 342 298 87 270 246 91 209 77 435 1.8 1.6
2004 388 338 87 285 279 98 240 84 505 1.8 1.8
2005 418 349 83 273 261 96 218 80 377 1.4 1.4
2006 499 416 83 337 300 89 251 74 475 1.6 1.4
2007 652 528 81 410 360 88 307 75 590 1.6 1.4
2008 742 627 85 409 346 85 311 76 546 1.6 1.3
2009 660 491 74 382 325 85 275 72 476 1.5 1.2
2010 913 672 74 495 443 89 400 81 674 1.5 1.4
2011 989 747 76 539 490 91 398 74 699 1.4 1.3
2012 931 669 72 536 464 87 394 74 640 1.4 1.2
2013 1030 696 68 562 506 90 446 79 736 1.5 1.3

31
Table 14. The number of Common Buzzard home ranges checked and their breeding success in Scotland in 2013.
Region Home
ranges checked
Home ranges occupied by
pairs
Home ranges occupied by single birds
Pairs monitored
Pairs failing early or non-
breeding
Pairs known to lay eggs
Pairs known to hatch
eggs
Pairs known to fledge
young
Minimum number of
young fledged
Argyll 156 69 12 40 1 41 39 37 60
- Argyll & Bute (mainland) 78 42 6 27 0 29 28 29 49
- Argyll Islands 78 27 6 13 1 12 11 8 11
Central 277 225 9 164 37 128 114 107 154
- Falkirk 20 16 4 4 0 4 4 4 7
- Glasgow 3 3 0 3 1 2 2 2 3
- North Lanarkshire 33 26 2 18 2 16 14 14 21
- Stirling 221 180 3 139 34 106 94 87 123
Dumfries & Galloway 68 58 2 57 0 58 51 76 139
Highland 122 97 1 84 2 82 73 70 133
- Badenoch & Strathspey 12 12 0 12 0 12 12 12 27
- Caithness 5 4 0 3 1 2 2 2 3
- Inverness-shire 7 6 1 4 0 4 4 4 6
- Isle of Skye 1 1 0 1 0 1 1 1 2
- Lochaber 3 3 0 2 0 2 2 2 5
- Ross-shire 82 59 0 51 0 51 43 41 74
- Small Isles 5 5 0 4 1 3 2 2 3
- Sutherland 7 7 0 7 0 7 7 6 13
Lewis & Harris 8 8 0 8 1 7 7 4 7
- Harris 3 3 0 3 0 3 3 3 5
- Lewis 5 5 0 5 1 4 4 1 2
Lothian & Borders 61 56 1 56 1 55 52 41 90
- Lothian 31 31 0 31 0 31 28 28 66
- Scottish Borders 30 25 1 25 1 24 24 13 24
North-east 185 87 0 76 25 59 50 48 61
Orkney 13 8 1 8 1 7 6 4 10
South Strathclyde
- Ayrshire 1 1 0 1 0 2 2 2 2
Tayside 122 70 10 52 0 54 52 48 66
- Angus 9 9 0 8 0 8 7 7 9
- Fife 13 12 0 12 0 12 12 11 11
- Perth & Kinross 100 49 10 32 0 34 33 30 46
Uist 17 17 0 16 3 13 12 9 14
- Benbecula 6 6 0 6 2 4 3 3 5
- North Uist 6 6 0 6 1 5 5 2 3
- South Uist 5 5 0 4 0 4 4 4 6
TOTAL: 1030 696 36 562 71 506 458 446 736

32
Table 15. Home range occupancy and breeding success of Golden Eagles in Scotland, 2004-2013.
Year Home ranges
checked Home ranges
occupied by pairs %
Further home ranges in use1
Pairs monitored
Pairs known to fledge young
% Minimum number of
young fledged Mean brood size per
successful pair Mean brood size per
monitored pair
2004 232 175 75 19 151 81 54 97 1.2 0.6
2005 264 220 83 19 207 72 35 88 1.2 0.4
2006 290 233 80 27 218 78 36 84 1.1 0.4
2007 291 227 78 26 216 92 43 104 1.1 0.5
2008 310 242 78 28 224 111 50 123 1.1 0.6
2009 307 242 79 28 232 95 41 111 1.2 0.5
2010 344 264 77 36 247 111 45 134 1.2 0.5
2011 345 280 81 26 247 91 37 108 1.2 0.4
2012 356 306 86 14 280 95 34 109 1.2 0.4
2013 365 297 81 32 246 114 46 128 1.1 0.5 1 Additional home ranges occupied by single birds or showing signs of occupation but no pair seen.
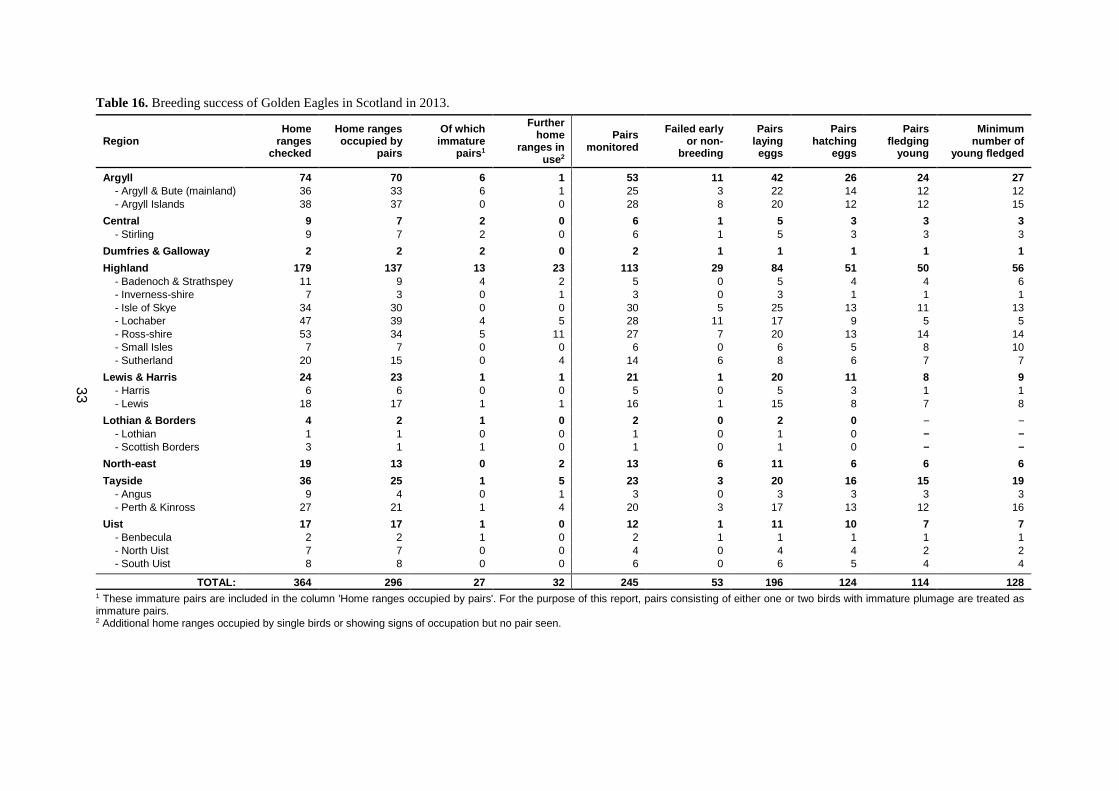
33
Table 16. Breeding success of Golden Eagles in Scotland in 2013.
Region Home
ranges checked
Home ranges occupied by
pairs
Of which immature
pairs1
Further home
ranges in use2
Pairs monitored
Failed early or non-
breeding
Pairs laying eggs
Pairs hatching
eggs
Pairs fledging
young
Minimum number of
young fledged
Argyll 74 70 6 1 53 11 42 26 24 27
- Argyll & Bute (mainland) 36 33 6 1 25 3 22 14 12 12
- Argyll Islands 38 37 0 0 28 8 20 12 12 15
Central 9 7 2 0 6 1 5 3 3 3
- Stirling 9 7 2 0 6 1 5 3 3 3
Dumfries & Galloway 2 2 2 0 2 1 1 1 1 1
Highland 179 137 13 23 113 29 84 51 50 56
- Badenoch & Strathspey 11 9 4 2 5 0 5 4 4 6
- Inverness-shire 7 3 0 1 3 0 3 1 1 1
- Isle of Skye 34 30 0 0 30 5 25 13 11 13
- Lochaber 47 39 4 5 28 11 17 9 5 5
- Ross-shire 53 34 5 11 27 7 20 13 14 14
- Small Isles 7 7 0 0 6 0 6 5 8 10
- Sutherland 20 15 0 4 14 6 8 6 7 7
Lewis & Harris 24 23 1 1 21 1 20 11 8 9
- Harris 6 6 0 0 5 0 5 3 1 1
- Lewis 18 17 1 1 16 1 15 8 7 8
Lothian & Borders 4 2 1 0 2 0 2 0 – –
- Lothian 1 1 0 0 1 0 1 0 – –
- Scottish Borders 3 1 1 0 1 0 1 0 – –
North-east 19 13 0 2 13 6 11 6 6 6
1 1 0 0 1 0 1 0 – – Tayside 36 25 1 5 23 3 20 16 15 19
- Angus 9 4 0 1 3 0 3 3 3 3
- Perth & Kinross 27 21 1 4 20 3 17 13 12 16
Uist 17 17 1 0 12 1 11 10 7 7
- Benbecula 2 2 1 0 2 1 1 1 1 1
- North Uist 7 7 0 0 4 0 4 4 2 2
- South Uist 8 8 0 0 6 0 6 5 4 4
TOTAL: 364 296 27 32 245 53 196 124 114 128
1 These immature pairs are included in the column 'Home ranges occupied by pairs'. For the purpose of this report, pairs consisting of either one or two birds with immature plumage are treated as immature pairs. 2 Additional home ranges occupied by single birds or showing signs of occupation but no pair seen.

34
Table 17. Breeding site occupancy and breeding success of Ospreys in Scotland, 2003-2013.
Year Breeding
sites checked
Breeding sites occupied by
pairs %
Pairs monitored
Pairs failing early or non-
breeding
Pairs laying eggs
Pairs known to fledge young
% Minimum number of young fledged
Mean brood size per successful
nest
Mean brood size per monitored pair
2003 232 162 70 [162] [22] 140 109 67 229 2.1 1.4
2004 230 182 79 [182] [27] 155 114 63 233 2.0 1.3
2005 239 180 75 [180] [22] 158 124 69 242 2.0 1.3
2006 206 155 75 [155] [12] 143 111 72 225 2.0 1.5
2007 198 140 71 138 19 119 92 67 182 2.0 1.3
2008 >211 208–211 – 204 31 173 148–149 73 303 2.0 1.5
2009 209 168 80 166 10 156 130 78 259 2.0 1.6
2010 229 193 84 190 24 166 144 76 306 2.1 1.6
2011 260 202 78 201 28 173 104 52 210 2.0 1.0
2012 276 195 71 194 14 180 142 73 278 2.0 1.4
2013 290 197 68 180 14 166 129 72 259 2.0 1.4 Figures in square brackets were not supplied, therefore the maximum possible figure was used.
Table 18. Breeding success of Ospreys in Scotland in 2013.
Region Breeding sites
checked Pairs
present Single
birds Pairs
monitored Pairs failing early or
non-breeding
Pairs laying eggs
Pairs hatching
eggs
Pairs fledging young
Minimum number of young fledged
Argyll 31 18 0 18 2 16 13 6 13
- Argyll & Bute (mainland) 31 18 0 18 2 16 13 6 13
Central 37 26 2 22 4 18 16 13 24
- Stirling 37 26 2 22 4 18 16 13 24
Dumfries & Galloway 13 7 0 7 2 5 5 5 10
Highland 88 66 5 58 3 55 49 44 92
- Baddenoch & Strathspey 10 9 0 9 0 9 8 8 16
- Inverness-shire 13 11 1 10 0 10 10 6 12
- Ross-shire 35 21 2 15 0 15 12 11 22
- Sutherland 15 13 0 12 1 11 9 9 19
- Sutherland & Caithness 4 4 0 4 2 2 2 2 6
- West Moray & Nairn 11 8 2 8 0 8 8 8 17
Lothian & Borders 14 12 0 10 0 10 8 9 18
- Lothian 1 1 0 1 0 1 0 0 0
- Scottish Borders 13 11 0 9 0 9 8 9 18
North-east 36 23 0 23 0 23 19 19 43
- Aberdeenshire 30 18 0 18 0 18 15 15 33
- East Moray 6 5 0 5 0 5 4 4 10
South Strathclyde 4 4 0 4 3 1 1 1 3
- Ayrshire 2 2 0 2 2 0 – – –
- South Lanarkshire 2 2 0 2 1 1 1 1 3
Tayside 67 41 6 38 0 38 33 32 56
- Angus 9 9 0 8 0 8 8 7 11
- Perth & Kinross 58 32 6 30 0 30 25 25 45
TOTAL: 290 197 13 180 14 166 144 129 259
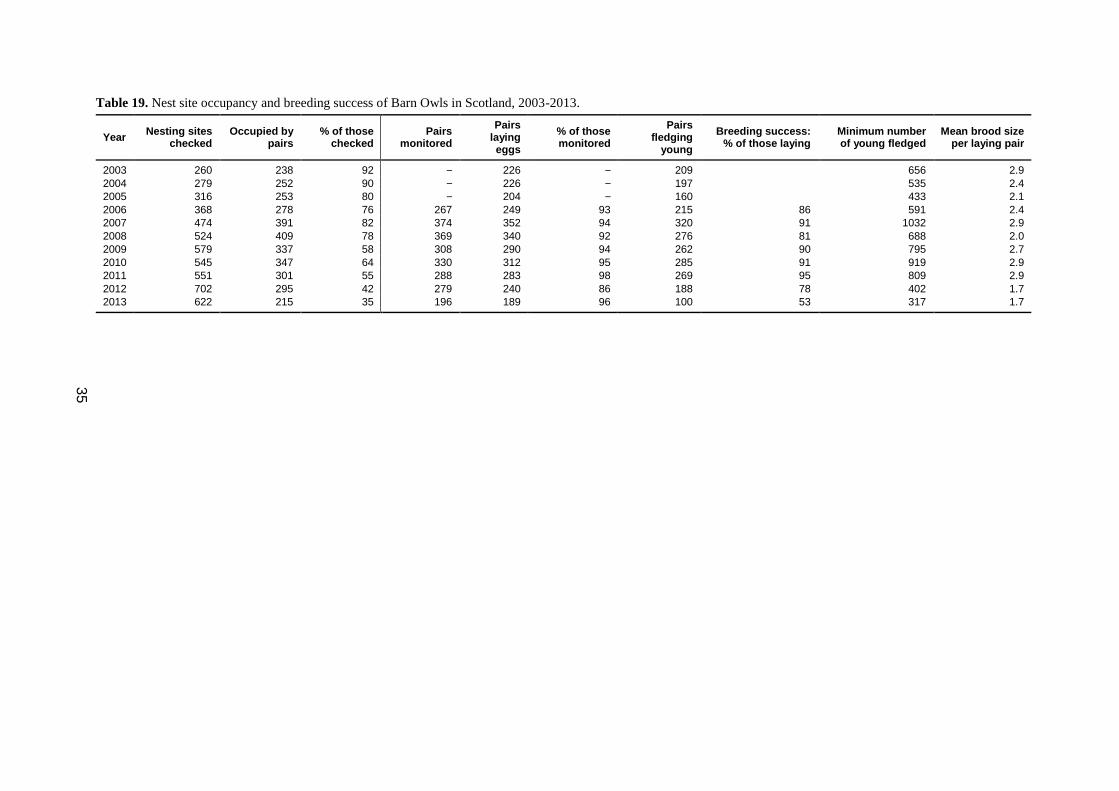
35
Table 19. Nest site occupancy and breeding success of Barn Owls in Scotland, 2003-2013.
Year Nesting sites
checked Occupied by
pairs % of those
checked Pairs
monitored
Pairs laying eggs
% of those monitored
Pairs fledging
young
Breeding success: % of those laying
Minimum number of young fledged
Mean brood size per laying pair
2003 260 238 92 – 226 – 209
656 2.9
2004 279 252 90 – 226 – 197
535 2.4
2005 316 253 80 – 204 – 160
433 2.1
2006 368 278 76 267 249 93 215 86 591 2.4
2007 474 391 82 374 352 94 320 91 1032 2.9
2008 524 409 78 369 340 92 276 81 688 2.0
2009 579 337 58 308 290 94 262 90 795 2.7
2010 545 347 64 330 312 95 285 91 919 2.9
2011 551 301 55 288 283 98 269 95 809 2.9
2012 702 295 42 279 240 86 188 78 402 1.7
2013 622 215 35 196 189 96 100 53 317 1.7
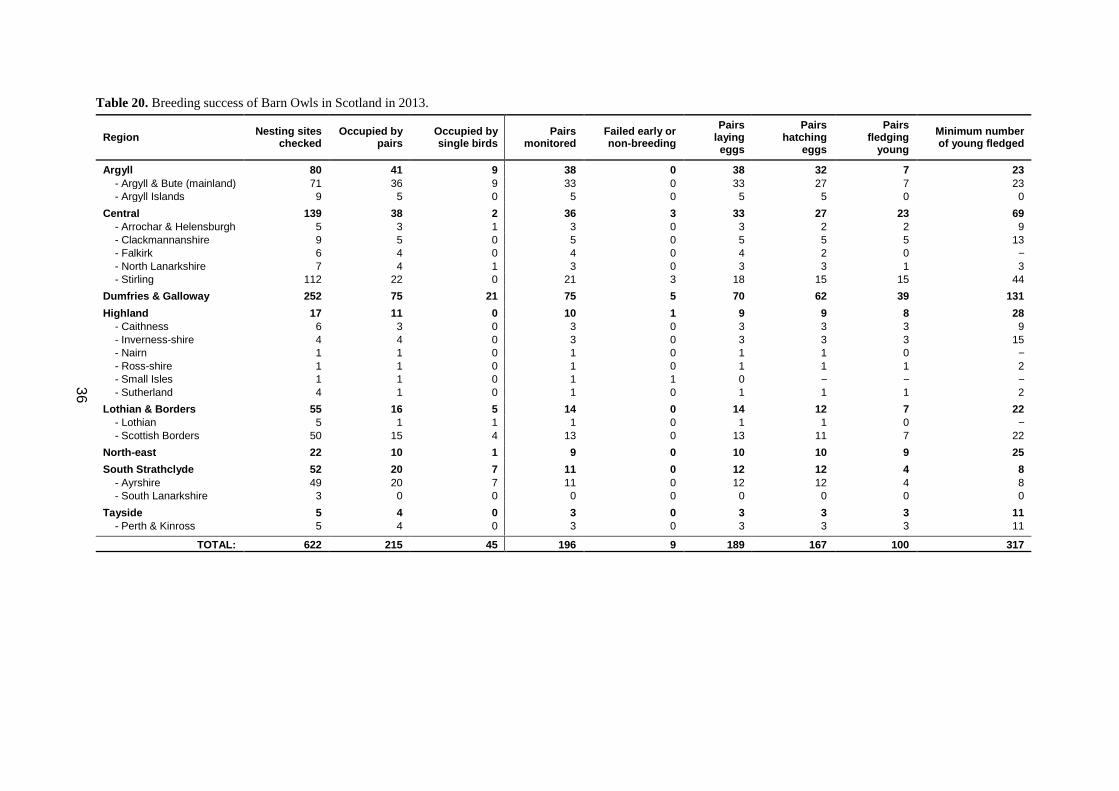
36
Table 20. Breeding success of Barn Owls in Scotland in 2013.
Region Nesting sites
checked Occupied by
pairs Occupied by single birds
Pairs monitored
Failed early or non-breeding
Pairs laying eggs
Pairs hatching
eggs
Pairs fledging
young
Minimum number of young fledged
Argyll 80 41 9 38 0 38 32 7 23
- Argyll & Bute (mainland) 71 36 9 33 0 33 27 7 23
- Argyll Islands 9 5 0 5 0 5 5 0 0
Central 139 38 2 36 3 33 27 23 69
- Arrochar & Helensburgh 5 3 1 3 0 3 2 2 9
- Clackmannanshire 9 5 0 5 0 5 5 5 13
- Falkirk 6 4 0 4 0 4 2 0 –
- North Lanarkshire 7 4 1 3 0 3 3 1 3
- Stirling 112 22 0 21 3 18 15 15 44
Dumfries & Galloway 252 75 21 75 5 70 62 39 131
Highland 17 11 0 10 1 9 9 8 28
- Caithness 6 3 0 3 0 3 3 3 9
- Inverness-shire 4 4 0 3 0 3 3 3 15
- Nairn 1 1 0 1 0 1 1 0 –
- Ross-shire 1 1 0 1 0 1 1 1 2
- Small Isles 1 1 0 1 1 0 – – –
- Sutherland 4 1 0 1 0 1 1 1 2
Lothian & Borders 55 16 5 14 0 14 12 7 22
- Lothian 5 1 1 1 0 1 1 0 –
- Scottish Borders 50 15 4 13 0 13 11 7 22
North-east 22 10 1 9 0 10 10 9 25
South Strathclyde 52 20 7 11 0 12 12 4 8
- Ayrshire 49 20 7 11 0 12 12 4 8
- South Lanarkshire 3 0 0 0 0 0 0 0 0
Tayside 5 4 0 3 0 3 3 3 11
- Perth & Kinross 5 4 0 3 0 3 3 3 11
TOTAL: 622 215 45 196 9 189 167 100 317

37
Table 21. Annual breeding success and productivity of Tawny Owls in Scotland, 2003-2013.
Year Pairs
monitored Pairs fledging
young %
Minimum number of young fledged
Mean brood size per pair
monitored 2003 70 60 86 131 1.9
2004 67 57 85 108 1.6
2005 92 63 68 103 1.1
2006 123 88 72 173 1.4
2007 101 78 77 142 1.4
2008 77 62 81 111 1.4
2009 91 64 70 93 1.0
2010 86 66 77 122 1.4
2011 130 104 80 193 1.5
2012 124 98 79 179 1.4
2013 92 51 55 87 0.9
Table 22. Breeding success of Tawny Owls in Scotland in 2013.
Region Nest sites
checked Pairs
present Pairs
monitored
Pairs laying eggs
Pairs hatching
eggs
Pairs fledging
young
Minimum number of
young fledged Argyll 3 2 2 1 1 0 0
- Argyll & Bute (mainland) 2 1 1 0 0 0 0
- Argyll Islands 1 1 1 1 1 0 0
Central 84 33 32 30 21 19 33
- Stirling 84 33 32 30 21 19 33
Dumfries & Galloway 38 8 8 8 8 8 10
Highland 38 19 19 19 12 11 17
- Badenoch & Strathspey 3 3 3 3 1 1 3
- Inverness-shire 1 1 1 1 1 0 0
- Ross-shire 24 14 14 14 10 10 14
- Sutherland 10 1 1 1 0 – –
Lothian & Borders 44 21 21 21 21 6 13
- Lothian 1 1 1 1 1 1 1
- Scottish Borders 43 20 20 20 20 5 12
Tayside 11 10 10 10 8 7 14
- Perth & Kinross 11 10 10 10 8 7 14
TOTAL: 218 93 92 89 71 51 87
Table 23. Breeding success of Long-eared Owls in Scotland in 2013.
Region Known territories
checked for occupation
Territories with signs of
occupation
Pairs laying eggs
Pairs fledging
young
Minimum number of
fledged young
Argyll 5 4 2 1 2
- Argyll & Bute (mainland) 1 1 1 1 2
- Argyll Islands 4 3 1 0 0
Highland 5 5 4 4 8
- Badenoch & Strathspey 2 2 0 – –
- Inverness-shire 1 1 2 2 5
- Small Isles 2 2 2 2 3
Lothian & Borders 9 9 5 5 7
- Lothian 3 3 2 2 6
- Scottish Borders 6 6 3 3 1
North-east 2 0 1 1 3
Tayside 6 6 6 5 8
- Angus 3 3 3 3 5
- Perth & Kinross 3 3 3 2 3
Uist 2 2 – – –
- North Uist 2 2 0 – –
TOTAL: 29 27 18 16 28

38
Table 24. The number of sites checked and the breeding success of Short-eared Owls in Scotland in 2013.
Region Sites checked Pairs found Additional single birds recorded Nests monitored Pairs fledging young Minimum number of young fledged
Argyll 7 0 2 0 0 0
- Argyll & Bute (mainland) 2 0 0 0 0 0
- Argyll Islands 5 0 2 0 – –
Central 16 4 3 2 1 3
' - Arrochar & Helensburgh 5 2 3 1 1 3 - Stirling 11 2 0 1 0 –
Dumfries & Galloway 4 2 2 2 3
Highland 8 7 1 2 2 7
- Badenoch & Strathspey 1 1 0 0 – –
- Caithness 0 0 0 0 – –
- Lochaber 6 5 1 1 1 5
- Small Isles 1 1 0 1 1 2
Lothian & Borders 14 2 4 1 1 1
- Lothian 1 0 1 0 – –
- Scottish Borders 13 2 3 1 1 1
Orkney 95 41 44 18 3 5
Tayside 14 7 4 5 5 15
- Angus 2 1 0 0 – –
- Perth & Kinross 12 6 4 5 5 15
Uist 8 8 0 7 7 16
- Benbecula 3 3 0 2 2 7
- South Uist 5 5 0 5 5 9
TOTAL: 166 71 58 37 21 50
Table 25. Home range occupancy and breeding success of Common Kestrels in Scotland, 2003-2013.
Year Home
ranges checked
Home ranges with signs of
occupation %
Pair occupied home ranges
monitored
Pairs known to lay eggs
% of pair occupied home
ranges monitored
Pairs fledging
young
% of pair occupied home
ranges monitored
Minimum number of
young fledged
Mean brood size
per pair laying
Mean brood size per pair
occupied home range
2003 74 64 86 57 54 95 50 88 184 3.4 3.2
2004 – 127 – 110 106 96 87 79 338 3.2 3.1
2005 151 112 74 92 83 90 64 70 231 2.8 2.5
2006 113 94 83 74 66 89 63 85 211 3.2 2.9
2007 90 52 58 39 36 92 35 90 139 3.9 3.6
2008 115 90 78 68 63 93 59 87 206 3.3 3.0
2009 105 58 55 52 48 92 45 87 140 2.9 2.7
2010 123 98 80 77 74 96 71 92 222 3.0 2.9
2011 212 140 66 95 89 94 86 91 274 3.1 2.9
2012 298 172 58 134 128 96 111 83 320 2.5 2.4
2013 241 117 49 93 80 86 70 75 211 2.6 2.3

39
Table 26. Breeding success of Common Kestrels in Scotland in 2013.
Region Nest sites
checked Pairs
present Pairs
monitored Pairs failing early or
non-breeding Pairs laying
eggs Pairs hatching
eggs Pairs fledging
young Minimum number of
young fledged
Argyll 13 5 3 0 3 2 2 7
- Argyll & Bute (mainland) 3 2 2 0 2 2 2 7
- Argyll Islands 10 3 1 0 1 0 – –
Central 55 21 17 4 13 12 12 47
- Arrochar & Helensburgh 9 4 4 2 2 2 2 8
- Falkirk 4 3 3 0 3 3 3 11
- North Lanarkshire 8 5 2 0 2 2 2 8
- Stirling 34 9 8 2 6 5 5 20
Dumfries & Galloway 29 10 8 0 8 7 7 25
Highland 15 10 10 0 10 10 10 19
- Caithness 1 1 1 0 1 1 1 3
- Inverness-shire 3 1 1 0 1 1 1 5
- Isle of Skye 1 1 1 0 1 1 1 1
- Lochaber 2 0 0 – – – – –
- Nairn 1 1 1 0 1 1 1 3
- Ross-shire 3 2 2 0 2 2 2 2
- Small Isles 3 3 3 0 3 3 3 4
- Sutherland 1 1 1 0 1 1 1 1
Lothian & Borders 7 7 7 3 4 4 4 15
- Lothian 6 6 6 3 3 3 3 10
- Scottish Borders 1 1 1 0 1 1 1 5
North-east 9 5 5 1 4 4 4 16
Orkney 30 13 12 5 7 5 4 12
South Strathclyde 36 16 9 0 9 9 9 30
- Ayrshire 33 14 7 0 7 7 7 25
- Renfrewshire 3 2 2 0 2 2 2 5
Tayside 34 18 12 0 12 11 8 20
- Angus 8 3 2 0 2 1 0 –
- Fife 1 0 0 – – – – –
- Perth & Kinross 25 15 10 0 10 10 8 20
Uist 13 12 10 0 10 10 10 20
- Benbecula 1 1 0 – – – – –
- North Uist 3 2 2 0 2 2 2 3
- South Uist 9 9 8 0 8 8 8 17
TOTAL: 241 117 93 13 80 74 70 211

40
Table 27. Breeding range occupancy and breeding success of Merlin in Scotland, 2003-2013.
Year Home
ranges checked
Home ranges with signs of
occupation %
Pair occupied monitored
home ranges
Pairs known to lay eggs
% of pair occupied
monitored home range
Pairs fledging
young
% of pair occupied
monitored home range
Minimum number of
young fledged
Mean brood size
per pair laying
Mean brood size per pair occupied monitored home
range
2003 387 242 1 63 [190] 190 – 141 – 476 2.5 –
2004 403 254 1 63 [175] 175 – 115 – 319 1.8 –
2005 409 290 71 [189] 189 – 156 – 500 2.6 –
2006 462 285 62 189 171 90 133 70 402 2.4 2.1
2007 397 262 66 168 157 93 128 76 403 2.6 2.4
20082 513 314 61 209 187 89 142 68 433 2.3 2.1
2009 318 204 64 145 3 126 87 112 77 353 2.8 2.4
2010 400 201 50 133 127 95 113 85 335 2.6 2.5
2011 362 202 56 137 121 88 108 79 324 2.7 2.4
2012 369 211 57 145 135 93 100 69 287 2.1 2.0
2013 389 205 53 137 134 98 105 77 296 2.2 2.2 1 Figures refer to home ranges occupied by pairs, a slightly lower figure than those showing signs of occupation.
2 2008 was the year of a National Merlin Survey, resulting in improved coverage. 3 Corrected figure from 2009 report.
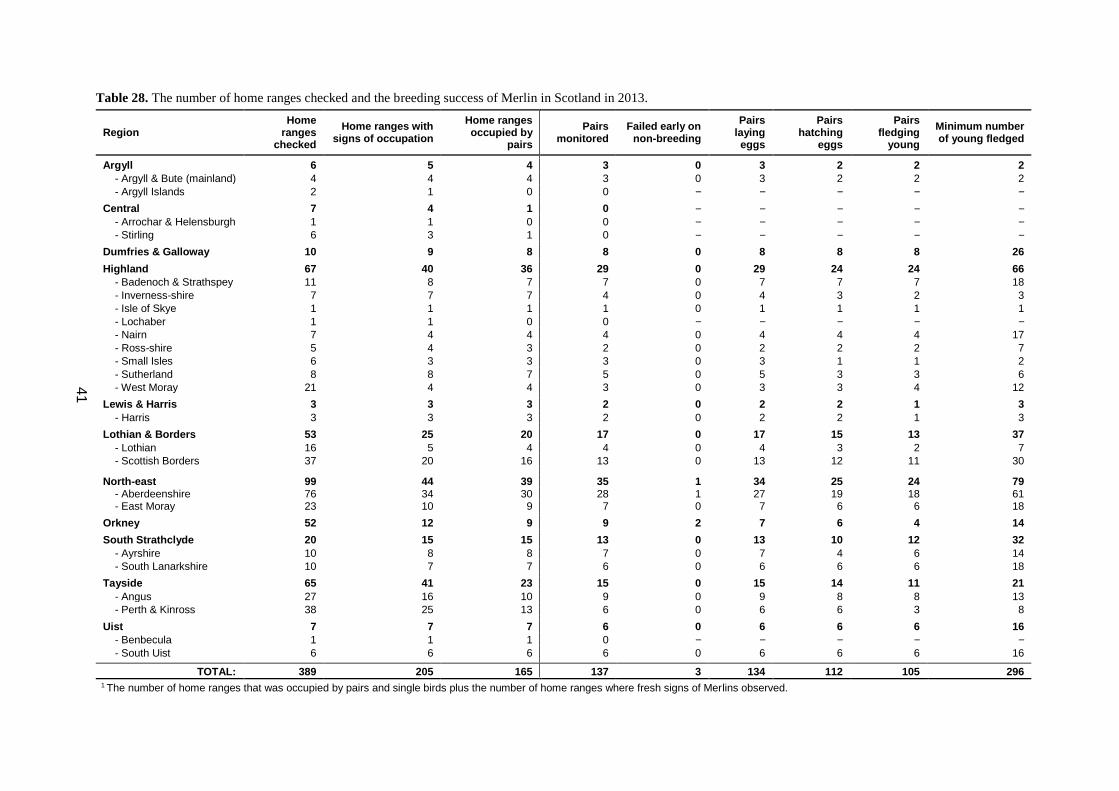
41
Table 28. The number of home ranges checked and the breeding success of Merlin in Scotland in 2013.
Region Home
ranges checked
Home ranges with signs of occupation
Home ranges occupied by
pairs
Pairs monitored
Failed early on non-breeding
Pairs laying eggs
Pairs hatching
eggs
Pairs fledging
young
Minimum number of young fledged
Argyll 6 5 4 3 0 3 2 2 2
- Argyll & Bute (mainland) 4 4 4 3 0 3 2 2 2
- Argyll Islands 2 1 0 0 – – – – –
Central 7 4 1 0 – – – – –
- Arrochar & Helensburgh 1 1 0 0 – – – – –
- Stirling 6 3 1 0 – – – – –
Dumfries & Galloway 10 9 8 8 0 8 8 8 26
Highland 67 40 36 29 0 29 24 24 66
- Badenoch & Strathspey 11 8 7 7 0 7 7 7 18
- Inverness-shire 7 7 7 4 0 4 3 2 3
- Isle of Skye 1 1 1 1 0 1 1 1 1
- Lochaber 1 1 0 0 – – – – –
- Nairn 7 4 4 4 0 4 4 4 17
- Ross-shire 5 4 3 2 0 2 2 2 7
- Small Isles 6 3 3 3 0 3 1 1 2
- Sutherland 8 8 7 5 0 5 3 3 6
- West Moray 21 4 4 3 0 3 3 4 12
Lewis & Harris 3 3 3 2 0 2 2 1 3
- Harris 3 3 3 2 0 2 2 1 3
Lothian & Borders 53 25 20 17 0 17 15 13 37
- Lothian 16 5 4 4 0 4 3 2 7
- Scottish Borders 37 20 16 13 0 13 12 11 30
North-east 99 44 39 35 1 34 25 24 79 - Aberdeenshire 76 34 30 28 1 27 19 18 61 - East Moray 23 10 9 7 0 7 6 6 18
Orkney 52 12 9 9 2 7 6 4 14
South Strathclyde 20 15 15 13 0 13 10 12 32
- Ayrshire 10 8 8 7 0 7 4 6 14
- South Lanarkshire 10 7 7 6 0 6 6 6 18
Tayside 65 41 23 15 0 15 14 11 21
- Angus 27 16 10 9 0 9 8 8 13
- Perth & Kinross 38 25 13 6 0 6 6 3 8
Uist 7 7 7 6 0 6 6 6 16
- Benbecula 1 1 1 0 – – – – –
- South Uist 6 6 6 6 0 6 6 6 16
TOTAL: 389 205 165 137 3 134 112 105 296
1 The number of home ranges that was occupied by pairs and single birds plus the number of home ranges where fresh signs of Merlins observed.

42
Table 29. Occupancy of Peregrine Falcon home ranges in Scotland, 2003-2013.
Year Home ranges checked Number occupied % Pairs recorded % Single birds recorded %
2003 595 402 68 – – – –
2004 579 406 70 375 65 31 5
2005 572 384 67 353 62 31 5
2006 595 391 66 352 59 39 7
2007 633 385 61 338 53 47 7
2008 597 344 58 317 53 27 5
2009 529 303 57 272 51 31 6
2010 554 313 57 280 51 33 6
2011* 524 318 61 291 56 27 5
2012 618 361 58 315 51 46 7
2013 648 354 55 314 48 40 6 * Northeast Scotland totals for 2011 are not included as the 'home ranges checked' figure was not supplied.

43
Table 30. Breeding success of Peregrine Falcons in Scotland in 2013.
Region Home
ranges checked
Home ranges occupied by single birds
Home ranges occupied by
pairs
Pairs monitored
Pairs failing early or non-
breeding
Pairs laying eggs
Pairs hatching
young
Pairs fledging
young
Minimum number of young fledged
Argyll 37 4 19 14 0 14 10 5 9
- Argyll & Bute (mainland) 22 3 8 7 0 7 4 2 3
- Argyll Islands 15 1 11 7 0 7 6 3 6 Central 35 2 24 22 3 19 15 15 34
- Clackmannanshire 2 0 2 2 0 2 1 1 2
- Falkirk 5 0 5 4 1 3 3 3 7
- North Lanarkshire 8 1 4 4 0 4 4 4 10
- Stirling 20 1 13 12 2 10 7 7 15
Dumfries & Galloway 112 9 50 44 2 42 37 37 73
Highland 34 1 24 19 0 19 16 13 30
- Badenoch & Strathspey 1 0 1 1 0 1 1 1 2
- Caithness 4 1 3 1 0 1 1 1 2
- Inverness-shire 11 0 8 7 0 7 6 4 9
- Isle of Skye 3 0 0 0 – – – – –
- Lochaber 1 0 1 0 – – – – –
- Nairn 2 0 2 2 0 2 2 1 2
- Ross-shire 2 0 1 1 0 1 0 – –
- Sutherland 5 0 4 3 0 3 3 3 8
- West Moray 5 0 4 4 0 4 3 3 7
Lewis & Harris 1 0 1 1 0 1 1 1 2
- Lewis 1 0 1 1 0 1 1 1 2
Lothian & Borders 141 5 55 54 11 43 37 36 102
- Lothian 37 2 20 20 5 15 13 13 34
- Scottish Borders 104 3 35 34 6 28 24 23 68
North-east 83 4 46 30 1 29 25 23 45
- Aberdeenshire 72 3 41 27 1 26 22 20 38
- East Moray 11 1 5 3 0 3 3 3 7
Orkney 33 6 10 7 1 6 6 5 8
South Strathclyde 70 6 33 31 0 31 26 25 52
- Ayrshire 49 5 24 22 0 22 19 18 34
- Renfrewshire 7 0 3 3 0 3 2 2 4
- South Lanarkshire 14 1 6 6 0 6 5 5 14
Tayside 97 3 47 39 0 39 35 34 68
- Angus 33 0 17 13 0 13 11 9 14
- Fife 21 1 11 11 0 11 9 10 21
- Perth & Kinross 43 2 19 15 0 15 15 15 33
Uist 5 0 5 4 0 4 4 0 0
- Benbecula 1 0 1 1 0 1 1 0 –
- North Uist 2 0 2 2 0 2 2 0 0
- South Uist 2 0 2 1 0 1 1 0 0
TOTAL: 648 40 314 265 18 247 212 194 423

44
Table 31. Home range occupancy and breeding success of Northern Ravens in Scotland, 2003-2013.
Year Nesting sites
checked Occupied by
pairs % of those
checked Pairs
monitored
Pairs laying eggs
% of those monitored
Pairs fledging young
Breeding success: % of those laying
Minimum number of young fledged
Mean brood size per laying pair
2003 – – – 168 148 88 127 86 363 2.5
2004 221 208 94 – 164 – 154 94 417 2.5
2005 289 257 89 – 177 – 139 79 371 2.1
2006 360 324 90 289 249 86 217 87 603 2.4
2007 408 352 86 299 261 87 237 91 636 2.4
2008 404 353 87 317 296 93 219 74 632 2.1
2009 463 394 85 330 316 96 271 86 707 2.2
2010 503 436 87 343 299 87 279 93 731 2.4
2011 465 393 85 321 288 90 264 92 725 2.5
2012 450 371 82 324 297 92 265 89 725 2.4
2013 539 443 82 374 343 92 259 76 709 2.1
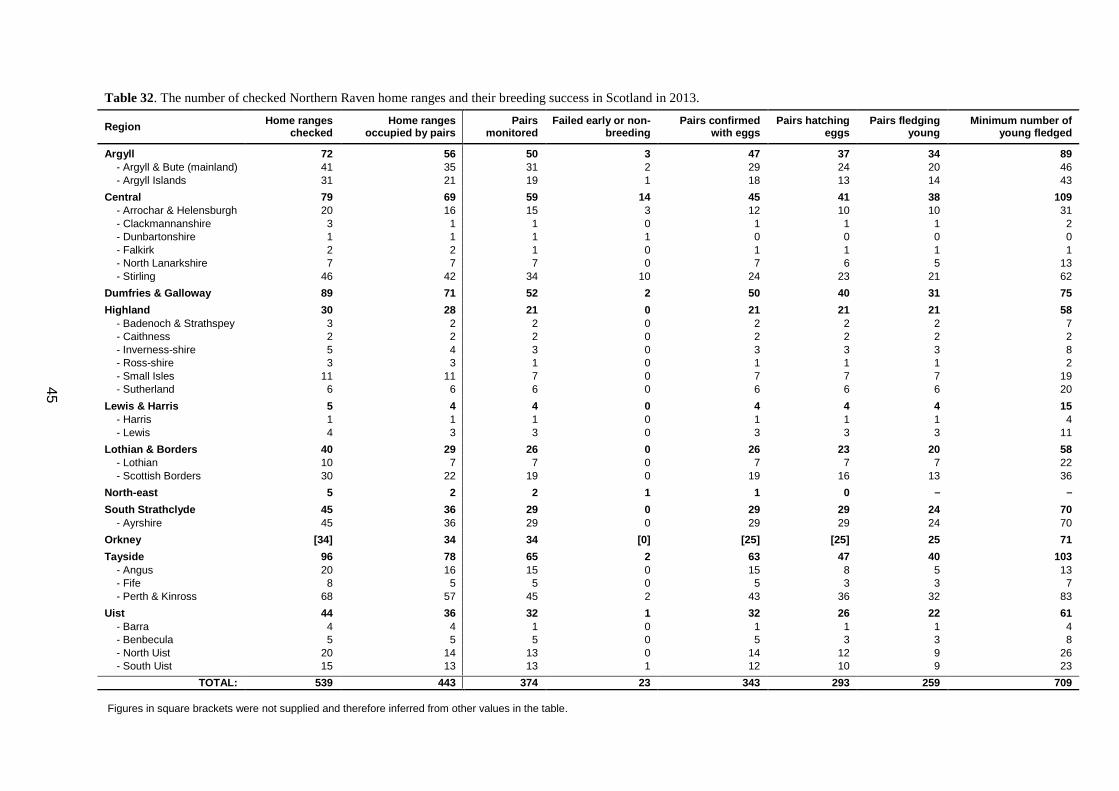
45
Table 32. The number of checked Northern Raven home ranges and their breeding success in Scotland in 2013.
Region Home ranges
checked Home ranges
occupied by pairs Pairs
monitored Failed early or non-
breeding Pairs confirmed
with eggs Pairs hatching
eggs Pairs fledging
young Minimum number of
young fledged
Argyll 72 56 50 3 47 37 34 89
- Argyll & Bute (mainland) 41 35 31 2 29 24 20 46
- Argyll Islands 31 21 19 1 18 13 14 43
Central 79 69 59 14 45 41 38 109
- Arrochar & Helensburgh 20 16 15 3 12 10 10 31
- Clackmannanshire 3 1 1 0 1 1 1 2
- Dunbartonshire 1 1 1 1 0 0 0 0
- Falkirk 2 2 1 0 1 1 1 1
- North Lanarkshire 7 7 7 0 7 6 5 13
- Stirling 46 42 34 10 24 23 21 62
Dumfries & Galloway 89 71 52 2 50 40 31 75
Highland 30 28 21 0 21 21 21 58
- Badenoch & Strathspey 3 2 2 0 2 2 2 7
- Caithness 2 2 2 0 2 2 2 2
- Inverness-shire 5 4 3 0 3 3 3 8
- Ross-shire 3 3 1 0 1 1 1 2
- Small Isles 11 11 7 0 7 7 7 19
- Sutherland 6 6 6 0 6 6 6 20
Lewis & Harris 5 4 4 0 4 4 4 15
- Harris 1 1 1 0 1 1 1 4
- Lewis 4 3 3 0 3 3 3 11
Lothian & Borders 40 29 26 0 26 23 20 58
- Lothian 10 7 7 0 7 7 7 22
- Scottish Borders 30 22 19 0 19 16 13 36
North-east 5 2 2 1 1 0 – –
South Strathclyde 45 36 29 0 29 29 24 70
- Ayrshire 45 36 29 0 29 29 24 70
Orkney [34] 34 34 [0] [25] [25] 25 71
Tayside 96 78 65 2 63 47 40 103
- Angus 20 16 15 0 15 8 5 13
- Fife 8 5 5 0 5 3 3 7
- Perth & Kinross 68 57 45 2 43 36 32 83
Uist 44 36 32 1 32 26 22 61
- Barra 4 4 1 0 1 1 1 4
- Benbecula 5 5 5 0 5 3 3 8
- North Uist 20 14 13 0 14 12 9 26
- South Uist 15 13 13 1 12 10 9 23
TOTAL: 539 443 374 23 343 293 259 709
Figures in square brackets were not supplied and therefore inferred from other values in the table.

46
Annex 1
Raptor, owl and Northern Raven nest site and home range data submitted under the Scottish Raptor Monitoring Scheme in 2013.
Species Argyll Central
Scotland Dumfries & Galloway
Highland Lewis & Harris
Lothian & Borders
North-east Scotland
Orkney South
Strathclyde Tayside Uist TOTAL
European Honey-buzzard 0 0 5 0 0 0 0 0 0 0 0 5
Red Kite 0 55 84 93 0 0 29 0 0 79 0 340
White-tailed Eagle
84
Marsh Harrier 0 0 0 0 0 0 2 0 0 8 0 10
Hen Harrier 86 17 24 81 0 5 8 215 71 90 27 624
Northern Goshawk 0 5 37 1 0 46 73 0 3 9 0 174
Eurasian Sparrowhawk 15 26 7 8 1 36 1 19 0 0 3 116
Common Buzzard 156 277 68 122 8 61 185 13 1 122 17 1030
Golden Eagle 74 9 2 179 24 4 20 0 0 36 17 365
Osprey 31 37 13 94 0 14 30 0 4 67 0 290
Barn Owl 80 139 252 17 0 55 22 0 52 5 0 622
Tawny Owl 3 84 38 38 0 44 0 0 0 11 0 218
Long-eared Owl 5 0 0 5 0 9 2 0 0 6 2 29
Short-eared Owl 7 16 4 8 0 14 0 95 0 14 8 166
Common Kestrel 13 55 29 15 0 7 9 30 36 34 13 241
Merlin 6 7 10 90 3 53 76 52 20 65 7 389
Eurasian Hobby 0 0 0 1 0 0 0 0 0 5 0 6
Peregrine Falcon Falcon 37 35 112 45 1 141 72 33 70 97 5 648
Northern Raven 72 78 89 30 5 40 5 34 46 96 44 539
TOTAL: 585 840 774 830 42 529 534 492 303 745 143 5896

47
Annex 2
Raptor, owl and Northern Raven breeding attempts monitored under the Scottish Raptor Monitoring Scheme in 2013.
Species Argyll Central
Scotland Dumfries & Galloway
Highland Lewis & Harris
Lothian & Borders
North-east Scotland
Orkney South
Strathclyde Tayside Uist TOTAL
European Honey-buzzard 0 0 2 0 0 0 0 0 0 0 0 2
Red Kite 0 29 77 56 0 0 17 0 0 54 0 233
White-tailed Eagle
82
Marsh Harrier 0 0 0 0 0 0 1 0 0 5 0 10
Hen Harrier 30 4 12 27 0 3 2 101 11 24 20 234
Northern Goshawk 0 3 31 0 0 20 53 0 3 6 0 116
Eurasian Sparrowhawk 7 10 5 5 1 11 1 9 0 0 2 51
Common Buzzard 40 164 57 84 8 56 76 8 1 52 16 562
Golden Eagle 53 6 2 113 21 2 14 0 0 23 12 246
Osprey 18 22 7 63 0 10 18 0 4 38 0 180
Barn Owl 38 36 75 10 0 14 9 0 11 3 0 196
Tawny Owl 2 32 8 19 0 21 0 0 0 10 0 92
Long-eared Owl 2 0 0 3 0 0 0 0 0 6 0 11
Short-eared Owl 0 2 2 2 0 1 0 18 0 5 7 37
Common Kestrel 3 17 8 10 0 7 5 12 9 12 10 93
Merlin 3 0 8 36 2 17 28 9 13 15 6 137
Eurasian Hobby 0 0 0 1 0 0 0 0 0 2 0 3
Peregrine Falcon Falcon 14 22 44 22 1 54 27 7 31 39 4 265
Northern Raven 50 58 52 21 4 26 2 34 30 65 32 340
TOTAL: 260 405 390 473 37 251 253 199 113 360 109 2929

Terminology
The terminologies used in this report have the following definitions and are based on Hardey et al.
(2009):
Breeding range - the geographical area within which the species occurs and breeds.
Home range - the immediate area around the nest site and the area over which a raptor or a pair of
raptors forage. Some raptor species, such as Golden Eagle and Tawny Owl, defend more-or-less the
entire home range, whereas others, including Goshawks and Kestrels, defend only a core area of the
home range around the nest site and have extensive home ranges for hunting which can overlap with
those of neighbouring pairs.
Nesting range - the locality within a home range that includes all the alternative nests used in
successive years by a pair of birds.
Nesting territory - an area around an active nest that is defended by the resident pair of birds against
intrusions by other raptors of the same species, or against potential predators.
Occupancy - a nesting range is occupied if a single bird or pair of birds is recorded during the
breeding season, usually on more than one occasion, or if there is strong evidence that birds are
present (moulted feathers, pellets, plucks, faecal splash).
Territorial bird or pair - a pair or single bird that defends a territory against intrusions by other
raptors of the same species or against potential predators. For some species, notably Buzzard, this
territorial behaviour can occur throughout the year and not just during the breeding season.
Breeding pair - a pair that (a) defends a nesting territory in the spring; (b) repairs or builds a nest, or
prepares a nest scrape; or (c) lays at least one egg.
Nest site - the nest and its immediate surrounds (e.g. the tree or ledge on which the nest is placed).
Nesting or breeding success - the proportion of breeding pairs that successfully rear at least one
chick to fledging.
Breeding failure - once occupancy by a breeding pair is established, failure occurs if no young fledge
successfully. A broader definition might also include territorial pairs that appear capable of breeding
but fail to lay eggs, but such criteria are often difficult to prove without careful and very regular
observations.
Productivity - the number of young produced annually, can be expressed in one of three ways: (i) as
the mean or average number of young fledged per occupied home range; (ii) the mean number of
young fledged per breeding pair, territorial pair or female laying eggs; or (iii) the mean number of
young fledged per successful pair or female.
Monitored home range - a home range occupied by a pair that receives sufficient repeat visits to
establish the outcome of a breeding attempt.

Published by BTO Scotland on behalf of the
Scottish Raptor Monitoring Scheme
Published by BTO Scotland on behalf of the
Scottish Raptor Monitoring Scheme