
Scottish Natural Heritage Visual Representation of Wind Farms - Visual representation of... ·...
53
1 f Scottish Natural Heritage Visual Representation of Wind Farms Guidance Version 2.2 February 2017
Transcript of Scottish Natural Heritage Visual Representation of Wind Farms - Visual representation of... ·...

1
f
Scottish Natural Heritage
Visual Representation of Wind Farms Guidance
Version 2.2 February 2017

2
CONTENTS
Page
1 Introduction 3 2 Zone of Theoretical Visibility maps 7 3 Viewpoints 16 4 Visualisations 22 5 Offshore wind farms 42 6 Repowering 45 Annexes Annex A: Information on limitations of visualisations
Annex B: Standard requirements which all visualisations should comply with Annex C: Summary of visualisation requirements
Annex D: Earth Curvature and Refraction of Light Annex E: Verification of images Annex F: Taking good photographs

3
1 Introduction
1 ‘Pictures speak louder than words’. Images are a powerful way of conveying information,
illustrating options and capturing our imagination. They also form an important part of
planning applications and Environmental Statements. The landscape and visual assessment
of wind farms, however, involves much more than just looking at visualisations.
2 This guidance is aimed at landscape practitioners, those involved in producing visual
representations of wind farms and at planning officers or decision makers involved in the
planning process. A condensed version aimed at members of the public is also available on
our website. The visualisations described are designed for use by all stakeholders within the
planning process.
3 Visualisations are very useful in communicating information, but they can never tell the whole
story. They cannot replicate the experience of seeing a wind farm in the landscape, whether
they are photographs, maps, sketches or computer-generated visualisations, prepared using
the highest specification and skill possible. They are an aid to decision making which must
be considered alongside further information.
4 Experience gained since this guidance was first published in 2006 has led to a better
understanding of how to represent proposed wind farm developments in a more accessible
and realistic way. The revised methodology provides visualisations which are easier for both
the public and decision makers to use. New sections on offshore wind farms and repowering
have also been included, and there are additional points on turbine lighting.
5 Nonetheless, anyone using visualisations should be aware of their limitations, and these are
explained throughout the text and in Annex A. It is recommended that the standard text in
Annex A should be inserted into the Environmental Statement and made available at
public exhibitions.
6 All wind farm applications requiring a Landscape and Visual Impact Assessment as
part of an Environmental Impact Assessment should conform with the requirements set
out within this document. Applications which do not require an EIA should follow a
proportionate approach agreed with the determining authority. Different landscapes, types of
wind farms and conditions in other countries may require different approaches. SNH cannot
offer advice on applications outside Scotland.
7 Smaller scale wind farm proposals (up to 3 turbines) and single turbine applications do not
usually require the same level of visual representation. A tailored, proportionate approach is
required which is likely to include fewer viewpoints (2-3 will generally be sufficient) and fewer
visualisations per viewpoint. This should be determined on a case-by-case basis. Wirelines
may be relatively unhelpful in flat landscapes for example, other than during the design stage
or in conjunction with other, photographic, visualisations. However, we recommend that the
same methodology (camera, lens, image presentation) is used for small scale applications for
consistency and ease of understanding by decision makers and members of the public.
Viewpoints immediately adjacent to small scale proposals tend to less useful than those a few

4
kilometres away which show more context. Our guidance on assessing small scale wind
farms should be referred to.
8 Some aspects of this guidance are prescriptive and must be complied with. A summary of
these requirements is provided in Annex B. Other aspects include options, and it is for the
landscape assessor to choose the most appropriate approach for the site in question, agree it
with relevant consultees, and justify these choices in the ES.
9 Some planning authorities have also produced specific guidance for wind farms and single
turbines. Early engagement with authorities is encouraged to establish their information
requirements. SNH will require visualisations which meet the requirements of this guidance
for all applications we are consulted on.
Landscape and Visual impact assessment
10 Landscape and visual impact assessment (LVIA) is the method used to identify and assess
the effects of, and the significance of, change resulting from development on both the
landscape and on people’s views and visual amenity (see Guidelines for Landscape and
Visual Impact Assessment, 3rd edition, 2013 (GLVIA)). Visual analysis forms just one part of a
Visual Impact Assessment (VIA), the process by which the potential significant effects of a
proposed development on the visual resource are methodically assessed. In turn, VIA forms
just one part of a Landscape and Visual Impact Assessment (LVIA) and the wider process of
Environmental Impact Assessment (EIA).
11 It is essential that a wind farm proposal is assessed within its wider landscape and visual
context. For those who visit the viewpoints described, the context will be visible in the field.
However, many people, including members of planning committees and other decision
makers, may not be able to visit all of the viewpoints for themselves. It is therefore essential
that visualisations which demonstrate the wider landscape and visual context are provided to
all audiences throughout the development process. The combination of images in this
guidance seeks to achieve this.
Stages in the planning process
12 Different types of visualisations (plans, maps, wirelines, photographs, photomontages) will be
used at different stages in the process. Flexibility is required to provide the right information to
the right audiences at each stage in the process. An indication of likely requirements is
provided below.
Pre application
13 Prior to the application being submitted, draft wirelines and Zone of Theoretical Visibility (ZTV)
maps will be most useful for the designer, assessor, planning authority and consultees such
as SNH. Draft photomontages, which comply with the standards set out in section 4, may also
be useful for public exhibition. It is important that draft images are clearly labelled as such so
that it is clear to everyone that the design of the wind farm is likely to change prior to the
submission of the application.

5
Submission of the planning application
14 A combination of images will be required to support the planning application, and these are
described in more detail in section 4. All images submitted alongside the application should
conform with this guidance and be as accurate as possible in terms of turbine height and
turbine locations, noting that these may alter through the decision-making process.
Decision making
15 Whether the application is determined by the planning authority, or by an appeal or inquiry, or
by Scottish Ministers, it is for the decision-maker to determine which images to use to inform
their decision. In some cases a detailed examination of all the images may be required,
including visits to viewpoints. In others it may be possible to reach a determination on the
basis of a selection of images. Either way, the purpose of this guidance is to generate a suite
of images that all decision makers, consultees and members of the public can use to inform
their judgement. Each individual image serves a different purpose and it is important decision
makers use the correct image for the correct purpose. Annex C provides a summary of when
each of the images should be used.
16 In all cases it is important that decision makers consider the proposal within the wider
landscape and visual context, ideally by visiting the viewpoint or by viewing suitable
panoramas. Zone of Theoretical Visibility maps should also be referred to.
Visiting viewpoints
17 It is important that key viewpoints are visited in order to assess likely effects. To facilitate
this, we now recommend that all visualisations are folded to A3 and provided in a ring
binder for ease of use.
Cumulative Landscape and Visual Impact Assessment (CLVIA)
18 As the number of proposed wind farms increases, cumulative impacts become more
prevalent. Separate guidance from SNH describes how to assess cumulative impacts. The
methodology in this guidance takes account of the need to illustrate cumulative effects and
recommends the use of additional tools to do so.
Scope of this guidance
19 This guidance is focussed on the production of visualisation-related materials to be included
within an Environmental Statement (ES) LVIA, made available to the public and to inform
decision making. Other methods of visualisation using computer animation and video
montage are not covered in this guidance. These methods may be helpful to illustrate the
effects of the proposal, in some situations adding value to the decision making process,
although the outputs are difficult to verify. These methods are not currently considered
appropriate as a replacement for hard copy visualisations in the ES, although advances in
technology may facilitate this in the future. This guidance applies to both onshore and
offshore wind farms. Slight differences in the methodology apply to offshore wind farms and
these are described in Section 5.

6
Glossary of key terms
Cylindrical projection A method used to map a panorama onto a curved surface using software.
The arc of curvature in degrees is equal to the overall horizontal field of view.
DTM Digital Terrain Model. A 3D model of the topography within the study area. Environmental Impact Assessment (EIA) The evaluation of likely significant effects on the environment of development proposals.
Focal Length Refers to the focal length of the lens used to take the photograph(s).
Landscape and Visual Impact Assessment (LVIA) This is the professional and methodical process by which assessment of the effects of a proposed development on the landscape and visual resource is undertaken. It comprises two separate but related parts - Landscape Impact Assessment and Visual Impact Assessment. Landscape Impact Assessment This is the process by which assessment is undertaken of the effects of a proposed development on the landscape as a resource, including its character and quality; and the significance of the likely effects.
Panorama An image covering a horizontal field of view wider than a single 50mm frame. Wirelines and photomontages may also be produced as panoramas. Photomontage A visualisation which superimposes an image of a proposed development upon a photograph or series of photographs.
Planar projection A method used to map a panorama onto a flat surface using computer
software. The result is the same as the way in which a camera lens creates an image on the flat film or sensor.
Principal distance The perpendicular distance from a printed image at which the exact
perspective ‘as seen by the camera’ is reconstructed.
Scoping The process of identifying the likely significant effects of a development on the environment which are to be the subject of assessment.
Visual impact assessment The professional and methodological process used to identify and asses the visual effects, and their likely significance, of a proposed development. Visual effects are effects on specific views and on the general visual amenity experienced by people.
Visualisation A computer simulation, photomontage or other technique to illustrate the predicted appearance of a development. This includes photographs, wirelines and photomontages, but not Zone of Theoretical Visibility (ZTV) maps. Wirelines These are also known as wireframes and computer generated line drawings. These are line diagrams that are based on DTM data and illustrate the three-dimensional shape of the landscape in combination with additional elements such as the components of a proposed wind farm. Zone of Theoretical Visibility (ZTV) Previously known as Zone of Visual Influence (ZVI). This represents the area over which a development could theoretically be seen, based on a DTM. The ZTV usually presents a ‘bare ground’ scenario – i.e. a landscape without screening structures or vegetation.

7
2 Zone of Theoretical Visibility Maps
20 The term ‘Zone of Theoretical Visibility’ (ZTV) is used to describe the area over which a
development can theoretically be seen, based on a Digital Terrain Model (DTM) and overlaid
on a map base. This was previously known as a Zone of Visual Influence (ZVI), however the
term ZTV is preferred for its emphasis of two key
factors:
the maps indicate theoretical visibility only -
that is, the areas within which there may be
a line of sight, but the proposal may not
actually be visible in reality due to localised
screening which is not represented by the
DTM; and
they do not convey the nature or
magnitude of visual effects, for example
whether visibility will result in positive or
negative effects, and whether these are
likely to be significant or not.
21 Production of ZTVs is usually one of the first steps in LVIA, helping to inform the selection of
the study area in which impacts will be considered in more detail. ZTVs provide the following
information:
from where wind turbines are most likely to be visible;
how many of the wind turbines are likely to be visible;
how much of the wind turbines is theoretically visible (if separate ZTVs are produced
showing theoretical visibility to blade tip height, and also theoretical visibility of the hub
or nacelle); and
a means of identifying the extent and pattern of theoretical visibility.
ZTV maps are a powerful tool, but require careful interpretation. The number of ZTV maps
should be kept to the minimum required to enable proper assessment of the proposal.
22 In combination with a site visit, possibly with initial wireline diagrams, this information enables
the landscape architect or experienced specialist assessor to identify a provisional list of
viewpoints (see Section 3). It also allows the determining authority and consultees to judge
how representative these are of the range of likely landscape and visual receptors and
whether they include particularly sensitive vantage points. Information such as designated
landscapes and popular walking / scenic routes can also be included.
23 Importantly, ZTVs indicate areas from where a wind farm is theoretically visible within
the study area, but they cannot show what it would look like, nor indicate the nature or
magnitude of landscape or visual impacts.

8
USES OF ZTVs
LIMITATIONS
A ZTV gives a good indication of the broad
areas from where wind turbines might be seen
and can help identify the LVIA study area
The ZTV can be used to help identify
viewpoints from where turbines may be visible,
enabling an assessment of these with the aid of
visualisations
A ZTV is a useful tool for comparing the relative
theoretical visibility patterns of different wind
farms or different wind turbine layouts and
heights
A ZTV is only as accurate as the data on which it
is based and the algorithm used in its calculation
A ZTV alone cannot indicate the potential
visual impacts of a development, nor show the
likely significance of impacts. It shows
theoretical visibility only
It is not easy to test the accuracy of a ZTV in the
field, although some verification will occur during
the assessment from viewpoints
ZTV preparation
ZTV height and/or terrain data
24 A ZTV is produced using a specialised software package. Several of
these are commercially available and most wind farm design packages,
and many Geographical Information System (GIS) packages, have this
facility. However, operation of even the most user-friendly package
requires a high level of expertise and understanding of all the specific
features and assumptions applied by the software. The name and
details of software used should be noted in the ES and on the ZTV itself,
including the version and the date of the data used.
25 ZTV production begins with a DTM that represents the ground surface
as a mesh of points. This may form a regular grid of squares when seen
on plan, known as a Square Grid DTM; or an irregular network of
triangles, known as a TIN (Triangulated Irregular Network).
26 A Square Grid DTM cannot represent terrain features smaller than the cell size, for example a
small knoll or outcrop. Such features are either lost between grid points or represented by
one point only. A TIN can, in principle, illustrate finer detail than a Square Grid DTM, as it can
represent all the detail shown by contours. However, in practice, a Square Grid DTM with a
suitably chosen cell size will represent almost as much detail, and it may also interpolate
better between contours on less steeply sloped land.
27 Both formats are acceptable. The choice between them is most likely to depend on the
software being used, and the source of the data. It is common practice for a Square Grid
DTM to be chosen if OS data is to be used, while a TIN is used when based on independent
and/or detailed survey data, enabling high and low points to be better represented.

9
28 The Ordnance Survey (OS) supplies data in two formats - gridded, which has already been
interpolated into a Square Grid DTM, and as contours, which is the usual starting point for
constructing a TIN. The OS Square Grid DTM product, ‘Terrain 5’, uses a 5m cell size and is
interpolated from a TIN maintained by Ordnance Survey. ‘Terrain 50’ (which is part of the
OpenData initiative and therefore free) uses a 50m cell size and is derived from the same TIN.
29 The Terrain 5 DTM provides a more precise representation of topography than its Terrain 50
counterpart. Although they are interpolated from the same TIN, the smaller cell size of Terrain
5 allows smaller features of landform to be represented.
30 The recommended preference is for OS Terrain 5 data especially on ridge crests or in "rough"
terrain where small-scale undulations have a significant effect on visibility. However, OS
Terrain 50 is considered acceptable, especially if the terrain comprises hills or mountains with
well-defined slopes. Legacy datasets, such as Landform Profile or Landform Panorama, may
also be appropriate depending on the characteristics of the site and the availability of data.
31 Although considered adequate for the purposes of LVIA (given that ZTVs are just one part of
the process), the accuracy of most DTMs is limited and they do not include accurate
representation of minor topographic features and may not represent areas of recent
topographic change, such as opencast coal mines, spoil heaps and road cuttings. Known
significant discrepancies between the DTM and the actual landform should be noted in the ES
text. If survey information on recent topographic change is available, together with the
necessary software to amend the DTM, it may be useful to include it. Any changes to the DTM
should also be noted in the text.
32 The OS provides accuracy figures for each of its data products (expressed statistically as root-
mean-square error in metres). Where the DTM is obtained from another source, the accuracy
can also usually be obtained from the data supplier. These accuracy figures should be stated
within the ES.
33 ZTV production also requires accurate data on the locations and heights of the proposed wind
turbines. For the purposes of ZTV calculation, it is sufficient to represent each proposed
turbine as a single point in space, located directly above the centre of the proposed base of
the turbine. The height specified is usually that at either hub or nacelle height, or at a blade tip
pointing straight up, but can be at any other point on the turbine depending on the ZTV
analysis required.
34 It is recommended that separate ZTV calculations are run for the overall height (to blade tip)
and for the height of the turbine to its hub (representing the nacelle that houses the generator
on top of the tower). This is a useful comparison that helps to identify areas where turbine
blades may be visible, but not the tower. These separate ZTVs will also be helpful for
proposals involving turbine lighting, as lights are usually sited on the nacelle.
35 In some cases it may be useful to provide alternative ZTVs showing different turbine heights to
enable comparison of the effects on wind farm design. Creating a draft ZTV for different

10
portions of the wind farm can also aid wind farm design, particularly for large applications on
complex terrain.
ZTV calculation
36 Some software packages offer both a standard and 'fast' option for ZTV calculation. 'Fast'
implies the use of mathematically approximate methods in order to speed up the computation,
which tends to result in a more generalised pattern of visibility. It is recommended that this is
only used to obtain a provisional result which will be later superseded by a more
comprehensive calculation for presentation in the ES. It is also important that users of ZTV
software are clear about the technical limitations inherent in their chosen package.
37 Visibility is affected by earth curvature and the refraction (bending) of light through the
atmosphere, particularly at greater distances. The effect of earth curvature should be included
in the ZTV calculation as its absence will tend to overestimate visibility. Annex D describes
this issue in more detail and includes a table of the vertical difference introduced by earth
curvature and refraction with distance. At 10km, the vertical difference is enough to hide a
single storey house and it increases thereafter.
38 These limitations, inherent in the data and in the method of calculation, should always be
acknowledged and, if possible, quantified. Note that these limitations may either over or
under-represent visibility. As a general rule, ZTVs should be generated to err on the side
of caution, over-representing visibility.
39 A ZTV usually represents visibility as if the ground surface were bare. It takes no account of
the screening effects of intervening elements such as trees, hedgerows or buildings, or small
scale landform or ground surface features. In this way, the ZTV can be said to represent a
‘worst case scenario’; that is, where the wind farm could potentially be seen given no
intervening obstructions, and in favourable weather conditions (while accepting that the DTM
data can sometimes understate visibility at the very local level). To assess how this might be
affected by typical visibility conditions within a particular area, Meteorological Office data on
visibility conditions can be obtained.
Taking account of surface screening
40 Some software allows the use of more sophisticated datasets, enabling some screening
effects to be taken into account. One example is the application of different "thicknesses” to
various land uses such as forestry and urban areas. When doing this the results will be closely
tied to the specifications used, for example the height of trees; as a consequence, these
should be noted within the ES. Another example is the use of digital surface data obtained
from laser-based aerial surveys which represent the tops of vegetation and buildings.
41 For most projects these datasets do not make a significant difference to the pattern of visibility
and they tend to be quite expensive (though some datasets such as VectorMap are free);
therefore, their use should be limited to specific projects and viewpoints where the benefits will
be notable. For example, it may be used to examine visibility in detail within a property listed in

11
the Inventory of Gardens and Designed Landscapes, or other key natural or cultural heritage
assets.
42 Care needs to be taken when assessing ZTVs which take screening into account, as their
accuracy is limited by data availability and the constant change in landscape
conditions. Particular care is required when representing forestry, which will be felled and
replanted on varying timescales, and should not be considered a permanent screening
feature. If these techniques are used too simplistically they can lead to turbines being
indicated as visible from the roofs of buildings, and the top of woodland canopy, which may be
correct but is unrealistic for the person on the ground.
43 In some situations, it might be useful to map other characteristics such as the number of wind
turbines seen against the skyline, or what proportion of the horizontal field of view is likely to
be occupied by the visible part of a wind farm - known as the ‘horizontal array angle’ or
‘horizontal subtended angle’. This information is particularly useful for considering the impact
of a very large wind farm, or several wind farms where they would be seen together within
panoramic views. However, for most wind farms the width of view can usually be more simply
judged by considering the distance to the development in combination with wireline diagrams
from specific viewpoints.
44 Any analyses that calculate characteristics other than simple visibility over bare ground should
be produced in addition to bare ground visibility, not as an alternative to it. Although these
currently have various limitations, improvement and development of these kinds of datasets is
likely to occur in the future.
Viewer height
45 Viewer height in a ZTV map is generally set at 2m above ground level. This is higher than the
camera height recommended for photographic visualisations (1.5m) to compensate for
potential inaccuracies in digital terrain data and to ensure that the ‘worst case’ is represented.
There may, however, be specific circumstances when an alternative viewer height is more
appropriate (such as a very extensive flat landscape). Where this is the case it should be
explained in the ES.
Extent of ZTV
46 A ZTV map illustrates locations within a study area from where a development would
potentially be visible. However, just because a development can be seen, it does not
automatically follow that this will result in likely significant landscape and visual impacts. This
creates a circular process of decision-making. The final distance of a ZTV should extend far
enough to include all those areas within which significant visual impacts of a wind farm are
likely to occur (LVIA “study area”); yet the significance of these landscape and visual impacts
will not be established until the VIA has been completed; and the LVIA process needs to be
informed by the ZTV. As part of this cycle of assessment, the distance recommendations
given within the table below act as a starting point.

12
47 The extent of ZTV required may need to be adjusted inwards or outwards according to the
specific characteristics of a landscape and/or proposed development. The extent of the final
ZTV should be discussed and agreed with the determining authority and consultees. In some
situations where cumulative effects are being assessed the ZTV may not be circular in shape,
but may be extended to include a specific transport route, for example.
48 The table below recommends the initial ZTV distance for defining the study area based on
turbine height. Greater distances may need to be considered for the larger turbines used
offshore.
49 If a wind farm is very small and concentrated in layout, typically 5 wind turbines or fewer, it
may be reasonable to measure the extent of the ZTV from the centre of the site. However
this should always be agreed with the determining authority and consultees.
50 The purpose of the ZTV is to illustrate theoretical visibility (within reasonable limits), not
significant effects. Wind turbines can be visible at considerably greater distances than 30km
and, regardless of likely significance, potential visibility should be illustrated on the ZTV to an
agreed radius. The reasons for establishing the eventual radius of a wind farm ZTV for use in
an ES should be clearly documented.
Cumulative ZTVs
51 Representing cumulative ZTVs can be difficult when there are large numbers of wind farms
involved. A sensible and pragmatic approach is required to focus on the wind farms with
which significant cumulative effects are likely to occur and which are likely to affect
decision making. Reproducing very large numbers of overlapping cumulative ZTVs does little
to assist decision making. The selection of ZTVs should therefore be discussed and agreed
with the planning authority and consultees at an early stage.
52 Presenting cumulative ZTVs in a sequence of pairs or trios can help avoid confusion. A
maximum of three sites per ZTV is recommended. Where there are large numbers of
combinations of ZTV it may be helpful to present the various iterations in digital format,
enabling users to switch on and switch off the various layers of visibility on screen. It may also
be helpful in some locations to treat multiple wind farms which are closely clustered together
1 See Assessing the impact of small scale wind farms on the natural heritage (2016)
Height of turbines
including rotors (m)
Recommended initial ZTV distance from nearest
turbine or outer circle of wind farm (km)
up to 501 15
51-70 20
71-85 25
86-100 30
101-130 35
131-150 40
150+ 45

13
as a single wind farm to reduce the number iterations. If this approach is taken only the main
ZTVs need to be provided in hard copy within the ES.
Presentation of ZTV information
Base map
53 A ZTV should be presented on a single piece of A1 paper folded within the ES, using OS
1:50,000 as the base map. For a ZTV to be clear and legible when overlain with colour
shading the base map needs to be in greyscale. This is to prevent confusion of overlays: for
example a yellow overlay upon blue coloured lochs will appear green, and this could be
confused with woodland. To maximise legibility it is also important that the base map is of a
high quality resolution and not too light or dark.
54 Feedback suggests that some users find it useful to see the ZTV data beyond the agreed
maximum radius shown on the ZTV. We therefore recommend that the ZTV layer is shown on
the full A1 page and is not clipped to the agreed radius shown on the map.
55 Each individual wind turbine should be clearly marked upon the ZTV, usually shown as a small
circle or dot, depending on the base map against which it has to be distinguished. It is
recommended that the ES includes a map that shows individual turbine numbers and their grid
coordinates, and that the ZTV should include reference to this map. However, it is better not
to include this information on the ZTV itself to keep this map as clear as possible.
56 Numbered viewpoint locations should also be shown on the main ZTV and it is important to
label these carefully to avoid obscuring vital ZTV information.
57 For ease of legibility it is recommended that the ZTV shows concentric rings to indicate
different distances from the proposed development, for example 10, 20 and 30 km. The areas
encircled by these rings should not be shaded or coloured as this may imply a direct
relationship between distance and relative visibility or visual impact that would be misleading.
To maintain legibility, the number of rings should also be limited.
58 Comparing two ZTVs that separately show visibility at blade tip and hub height will indicate
where only the turbine blades, or part-blades, may be visible from. Where this is required, the
ZTVs should be clearly labelled:
Blade tip ZTV; and
Hub height (or nacelle) ZTV.
Colour Overlays
59 Areas of potential visibility should be illustrated by a colour overlay. This should be
transparent so that the detail of the underlying map can be seen clearly. The level of overlay
transparency chosen should ensure that the detail of the base map remains clearly discernible
and no single colour appears more prominent than another.

14
60 If a range of colours is to be used, the shades and tones should be chosen carefully. Darker
colours tend to read as portraying greater visibility than lighter colours, whilst several colours
of similar tone tend to convey information of equal importance. Using different shades of only
one colour should generally be avoided, as the distinctions between bandings usually appear
merged and this can also imply a gradation of impacts represented by the decreasing shades
that is misleading. Legibility of a ZTV map tends to decrease with greater numbers of colours.
Seven colours should typically be the maximum used on any one map, and it is recommended
that these are bright and strongly contrasting.
61 When choosing a colour palette, it is also important to consider colour blindness. It is
estimated that around 7-8% of males and 0.4-1% of females in Britain have some form of
colour blindness. To them, legibility of maps depends on the type of colour blindness they
have, the shade and brightness of the colour, and on the contrast and combinations of colours
used. This requires careful consideration and is not just about avoiding the juxtaposition of
red and green.
62 While it would be useful to specify a standard range of colours consistently legible to colour
blind people, it is impossible to develop this without also standardising computer screens and
colour printer reproduction. It is recommended that individual maps shown within each ES are
checked for colour blind legibility using a quick clarification tool such as Vischeck.
63 One of the most important considerations is how the same colour will be represented
differently according to the specification of different computer screens and/or printers. It is
recommended that practitioners always print out draft copies to check that any discrepancy
between these still produces a clearly legible map, and then print out all the final copies on the
same printer.
Visibility bands
64 The theoretical visibility of different numbers of wind turbines (within a single development, or
between different wind farms within a cumulative ZTV) is usually distinguished upon a ZTV as
different coloured bands. These bands only differentiate between the visibility of different
numbers of wind turbines. They are not intended to imply that greater numbers of turbines will
necessarily result in higher levels of visual impact. These bands are particularly useful for
identifying potential viewpoints where the visibility of the wind farm varies considerably within
an area.
65 The number of visibility bands should be high enough for each band to represent just a small
range of turbine numbers, but low enough to avoid the need for too many colours which can
appear confusing. For example, with 30 turbines, it is better to have 6 bands each covering 5
turbines (1-5, 6-10, etc) rather than 3 bands of 10 turbines which would provide limited
resolution, or 10 bands of 3 turbines which would appear confusing. It is recommended that
no more than 7 colour bands should be used upon a ZTV.

15
66 Where equal banding is impossible (for example 11 turbines), then the widest band size
chosen should apply to the lower end of the scale – for example 1-3, 4-5, 6-7, 8-9, 10-11, as
greatest resolution is then retained where proximity is greatest. In cumulative assessments a
single set of bands should be applied consistently to all maps to allow comparison if this is
possible.
Recording ZTV information
67 It is vital to include information on all the key assumptions made in ZTV production, and to
summarise these within the LVIA. This should include the following information:
1 The DTM data from which the ZTV has been calculated, including date, original cell size and
whether this has been “down sampled” (note down sampling is not acceptable for 50m
resolution data)
2 Confirmation that it is based on a bare-ground survey; where additional non-bare-ground
ZTV(s) are included, provide information on the specifications of further land-use data if this
has been incorporated
3 The viewer height used for the ZTV (generally 2m)
4 Confirmation that earth curvature and light refraction has been included
5 The extent of the ZTV overlay as a minimum distance from the development, in addition to the
frequency of any distance rings shown
6 The numbers of wind turbines represented for each colour band
7 The height used for the turbine and whether this is to hub or blade tip
8 Confirmation that the ZTV software does not use mathematically approximate methods

16
3 Viewpoints 68 The term ‘viewpoint’ is used within VIA to define a place from where a view is gained, and that
represents specific conditions or viewers (visual receptors). A number of representative
viewpoints are chosen in order to assess:
the existing visual resource
the sensitivity of this resource and visual receptors to wind farm development
the proposed design (incorporating mitigation measures to minimise any adverse
impacts); and
the predicted appearance of the proposed development
This section addresses the selection of viewpoints and the information that should be
provided for them.
69 It is important to stress that viewpoint assessment forms just one part of LVIA. Because
of the powerful nature of viewpoint images and the widespread recognition of some of the
locations from where these are taken, there is often over-emphasis of their role. However,
LVIA also includes assessment of the following:
the extent and pattern of visibility throughout the study area (considering those areas
from where a wind farm would not be seen, as well as those areas from where it may);
views of the proposed wind farm from areas of potential visibility other than the selected
viewpoints; and
sequential views.
70 Separate assessment of impacts on residential properties is increasingly common. The
production of visual materials for individual properties may be appropriate to assist this, but
they will not normally form part of the LVIA.
USES OF VIEWPOINTS
LIMITATIONS
Carefully chosen viewpoints enable
representation of a range of views within a study
area
Carefully chosen viewpoints enable
representation of a range of viewers who
experience the landscape in different ways
Viewpoints enable consultees to assess specific
views from important viewpoints, for example
settlements, tourist attractions and mountain tops
By considering a range of views at different
viewpoints, the designer can consider how the
wind farm would vary in appearance, informing
design development
Whilst the choice of viewpoints is very important, the LVIA
should also be based on other aspects. Over-emphasis
on viewpoint assessment may create the erroneous
assumption that this is the only aspect of LVIA
There may be a tendency to focus on the particular
characteristics of specific viewpoints, rather than
considering these as being broadly representative of a
wider area. It is inappropriate to make design
modifications to change the visual effects of the proposed
wind farm from a single viewpoint because this may have
negative 'knock-on' effects from other viewpoints. A more
holistic approach considers the wind farm from a range of
viewpoints in relation to the design objectives.

17
Views from several viewpoints can be assessed
to determine sequential effects that occur as one
moves through the landscape
By assessing viewpoints in combination with ZTV
maps, it is possible to consider the potential
pattern of visibility for a wind farm in 3 dimensions
Viewpoints which show no actual visibility of the
proposal should not be shown in the ES (unless
there is good reason to do so) – the rationale for
this should be given in the supporting text of the
ES
A viewpoint is by its very nature static whilst views tend to
be experienced on the move as well as when stationary
Some viewpoints are difficult to access and some people
might not be able to assess the viewpoint on site. They
will therefore rely on the landscape architect or
experienced specialist assessor’s assessment and
visualisations to indicate predicted visual effects. It is
therefore essential that sufficient landscape and visual
context is provided on visualisations
Due to the limitations of DTM data several provisional
viewpoints may need to be visited to find a suitable
location
The exact location and conditions of individual viewpoints
are required to be able to create accurate visualisations
Some requested viewpoints might be judged inappropriate
for formal visualisations due to unacceptable health and
safety risks
Selection of viewpoints
71 Viewpoint selection is informed by the ZTV and other maps, fieldwork observations, and
information on relevant issues such as access, landscape character, designations and popular
views (see GLVIA 3 for more detail). These datasets enable a provisional list of viewpoints
that can be later refined through further assessment, consideration of provisional wireline
diagrams and discussions with the determining authority and consultees. Interested members
of the public, and in particular Community Councils, can also advise on sensitive local vantage
points at public meetings and/or exhibitions held by the applicant.
72 Feedback suggests that members of the public do not feel sufficiently engaged in the
viewpoint selection process. Applicants should increase their efforts to engage the public,
bearing in mind the need to limit the list of viewpoints to a reasonable number. Alternative
methods of illustrating the effects at individual properties (where these are required) should be
considered to ensure that all local residents feel informed about the impact from their property.
These would be for illustrative purposes only and they would not be assessed within the LVIA.
73 A ZTV is very useful in focussing upon those areas with potential visibility of a proposed
development, but the ZTV is only one source of information used to inform the selection of
viewpoints. Over-reliance on a ZTV to identify viewpoints can result in concentration on open
locations with the greatest visibility of a site, which may be far from the proposed
development. This may be at the expense of potential viewpoints where visibility is less
extensive, but from where views of the site are more typical.
74 During early consultations regarding the provisional list of viewpoints it is essential that the
determining authority and consultees are provided with a copy of the draft ZTV at the

18
appropriate scale and A1 size. A selection of provisional wireline diagrams may also be
helpful to give an impression of possible effects from viewpoints.
75 Wirelines are used to inform the design development of the proposed wind farm during the
initial stages of the LVIA. Some of the viewpoints will be described and assessed within the
main ES report; however, others may ultimately be omitted, for example because they show
very similar results to another viewpoint. Details regarding these original viewpoints should be
included within the ES appendices if they have informed the design process. Likewise, during
the LVIA process, it may be found that some of the original viewpoints will not have a view of
the wind farm due to local screening or changes to the wind farm design. These should also
be documented within the ES.
76 The range of issues that influence the selection of viewpoints is listed in the table below. The
aim is to choose a range of viewpoints from where there are likely to be significant
effects and those which are representative of views within the study area. Local
knowledge will greatly assist this process. It is desirable to choose viewpoints which
represent several of the issues described below from the same location as this will reduce the
overall number of viewpoints. These issues are discussed in more detail in the GLVIA 3
paragraphs 6.16-23. It is preferable not to include too many viewpoints as this can distract
attention from the key significant effects.
77 The assessment of viewpoints should not involve unacceptable risks to health and safety.
Examples of these situations include viewpoints from motorways, railway lines, scree slopes or
cliffs.
View type Settlements and visual amenity
Various landscape character types and areas (separate and in combination)
Areas of high landscape, scenic or recreational value – for example views to
and from designated areas; wild land; long distance routes; view points; tourist routes, local amenity spaces
Various distances from the proposed development
Various directions and aspects (viewpoints from all around the development
should be considered; views to the north will result in a different effect to those facing south; for design in particular)
Various elevations
Various extents of wind farm being visible, including places where all the wind
turbines will be visible as well as places where partial views of turbines occur
Sequential along specific routes
Cultural heritage including the wider setting of the heritage asset
Viewer type Various activities, for example those at home, work, travelling in various modes or
involved in recreation
Various modes of transport, for example those moving through the landscape by
road, train, ferry, bicycle or on foot (note, in some cases it may be desirable to choose an alternative camera height to represent typical views. If so, this should be noted in the ES)

19
78 Viewpoints within the local area surrounding the wind farm are particularly useful in
understanding and developing the wind farm layout and design. They also represent the likely
effects on residents living, travelling and working within the nearest area. Local residents will
experience the wind farm on a regular basis (often daily) in different weather, lighting and
seasonal conditions. It is important that these effects are considered and that the assessment
recognises the varying conditions in which residents will experience the wind farm.
79 When identifying viewpoints it is important to consider whether a CLVIA is also required as
part of the ES. If it is, the choice of all viewpoints should be informed by the cumulative ZTV
as well as the individual ZTV. In most parts of Scotland many of the viewpoints chosen will be
used to represent cumulative effects. Although it is possible to add supplementary viewpoints
as part of a cumulative LVIA, it is preferable to use the same viewpoints for both the individual
and cumulative LVIA to enable direct comparisons to be made.
80 Likewise, it is also useful to choose viewpoints already used for other wind farm LVIAs in the
surrounding area. This allows direct comparison and also assists the determining authority,
consultees and the general public who are already familiar with these viewpoints. Some
planning authorities have standard viewpoint lists and these should be referred to at an early
stage.
81 The reasons for selection or omission of viewpoints recommended by consultees should be
clearly justified and documented within the ES. It is essential that a final list is agreed with
the determining authority. Not all viewpoints will require a photomontage. Distant
viewpoints and those where there are no significant effects may be better illustrated by
wirelines only.
Number of viewpoints
82 The number of viewpoints for different projects will vary depending on the scale of the
proposal, the sensitivity of the receiving landscape and / or visual receptors, and how many
are required to represent likely significant effects from the range of views and viewers of a
development. The initial list of provisional viewpoints will probably be high. This is necessary
to enable identification of the required viewpoints during the early stages of the LVIA, and to
ensure that no key viewpoints have been omitted.
83 This process will involve the production of wirelines, as one will need to be produced for each
layout and design option, including alternative turbine heights where these are being
considered. However, these iterations are only likely to be helpful from several ‘design
viewpoints’ and it is not necessary to provide these from all of the viewpoints agreed, or to
include them in the ES.
84 After reducing the number of viewpoints to those that are required to illustrate the ES, it is
common for there to be around 10-25 viewpoints within a LVIA in Scotland. However, this
number will vary depending on the specific circumstances of a proposal. Over-provision of
viewpoints can be as unhelpful as under-provision. This is because an excessive number of

20
viewpoints may distract attention from the smaller number of viewpoints where impacts may
be significant. An appropriate balance must be struck through the LVIA consultation
process to agree a proportionate number of viewpoints.
85 Feedback gathered by our research project and steering group suggests that there are still too
many viewpoints being represented in applications. We therefore encourage all applicants
and consultees to further scrutinise the list of viewpoints selected and reduce these
where possible. A final list of agreed viewpoints to be illustrated in the ES should be agreed
pre submission with the planning authority. Some viewpoints may be dropped during the
assessment process if the effects are assessed as not significant, or if two viewpoints illustrate
similar effects, with the agreement of the planning authority.
86 Statutory consultees should provide a brief rationale for each viewpoint requested. A
summary of the viewpoints considered throughout the process, with the reasoning behind the
final viewpoint list, should be included within the ES.
Viewpoint siting
87 Following agreement on the general location of viewpoints through consultation, the selection
of the precise viewpoint site should be considered carefully. If, on visiting a potential
viewpoint, it is apparent that there will be no view of the proposed development, for example
due to localised screening, this location should be amended or withdrawn and the reason
recorded in the ES.
88 The siting of viewpoints needs to balance two key factors:
the likely significance of impacts; and
how typical or representative the view is.
For example, in choosing a viewpoint along a stretch of main road it may be difficult to choose
one location to represent the range of views experienced. It may also be difficult to find a
safe location for the viewpoint. Laybys and junctions are often used but may not always
represent the ‘worst case’ views, or the first sight gained of the wind farm. Where this is the
case it should be noted in the ES. In all cases, judgement needs to balance these factors, and
the decision-making process must be documented.
89 Most importantly, the location chosen must avoid the view of the wind farm being
misrepresented by the inclusion of atypical local features, such as a single tree in the
foreground. Where this has mistakenly occurred, the viewpoint location should be revised
and the photographs retaken. Conversely, it is also unacceptable to move too far from the
most prominent viewpoint in order to avoid typical foreground objects, for example moving into
a neighbouring field when the view is intended to be from a road, in order to avoid typical
foreground objects, unless these would obscure views to the wind farm. An alternative
location may be required.

21
90 Viewpoints should be free from any avoidable foreground objects and other obstructions such
as fences, walls, gates, roadways, road furniture, summit cairns and unnecessary foreground,
trees, shrubs or foliage unless these are typical of the view. It is also important that
viewpoints are publicly accessible, for example not within private property.
Recording viewpoint information
91 It is important to record the field conditions in which a viewpoint is photographed, as well as
the camera details including the information listed in the table below.
92 This information is essential to allow others to visit precisely the same viewpoint and make on-
site checks or assessment. It also helps others to understand the conditions under which
professional judgements have been made.
93 All viewpoints should be numbered and their location shown upon separate maps as follows:
detailed ZTV map(s) based upon a greyscale 1:50,000 OS base and printed at A1.
Viewpoints should be marked using symbols and numbering that avoid obscuring or
confusing the ZTV information.
Each visualisation should include a short description to make it easy for members of
the public to find the exact viewpoint location.
94 It is recommended that the original viewpoint numbers are retained until all the viewpoints are
finalised and agreed and the LVIA has been completed, to keep track of which viewpoints have
been added or withdrawn during the LVIA process. At this point they can be re-numbered in a
continuous and logical manner. Where material developed during the early stages of the LVIA
process information is included this should show both the original and new numbering so these
can be easily cross-referenced. If an extension is proposed, using the same numbering of
viewpoints as in the original application will allow consultees to compare the impacts of the
new proposal more easily. The same applies if different wind farms are proposed concurrently
within a district. Viewpoint numbering needs to be clear.
Viewpoint Specification required
Precise location 12 figure OS grid reference, measured in the field, ideally using GPS or a large-scale map and a photograph of the tripod location.
Viewpoint altitude Viewpoint altitude in metres Above Ordnance Datum (m AOD) (usually better interpolated from map or DTM than relying on GPS height).
Field of view Horizontal field of view (in degrees).
Distance to wind farm Approximate distance (in km) to the nearest turbine
Compass bearings to distinctive elements in the view that will assist with the placement of the turbines in some circumstances (plus optional sketch of the view with these elements marked if appropriate).
Conditions: Date
Time
Weather conditions and visual range
Camera: Camera type, Lens focal length and make
Spacing between the frames

22
4 Visualisations
95 Visualisations are illustrations that aim to represent the appearance of a proposed
development. Visualisations of wind farms most commonly comprise photographs, wireline
diagrams, photomontages, sketches and diagrams. However, it is important to stress that
visualisations represent just one source of information that informs a LVIA.
96 Considerable debate on visualisations in the past has revolved around making them ‘true to
life’. Visualisations, whether they are hand drawn sketches, photographs or
photomontages can never exactly match what is experienced in reality. They should,
however, provide a representation of the proposal that is accurate enough for the potential
impacts to be fully understood.
97 The assessor, consultees, decision-makers and any interested parties or members of the
public should ideally visit the viewpoint(s) where visualisations can be compared to the
‘real life’ view. It is acknowledged this is not always possible – time, weather and accessibility
will restrict the number of viewpoints which can be visited.
98 Interpretation of visualisations must take account of additional information specific to the
proposal, viewpoint and landscape which cannot be shown on a single 2-dimensional image.
Factors include variable lighting, movement of turbine blades, seasonal differences and
movement of the viewer through the landscape. Visualisations in themselves can never
provide the full picture in terms of potential impacts; they only inform the assessment
process by which judgements are made.
Key issues affecting visualisations
99 In order to see sufficient detail the photograph must have high resolution. Contrast also has a
great influence on how well detail can be seen. Against a white background a black line is
easier to see than a grey one. A key limitation of photographs in replicating the visual
experience is that it is generally impossible to reproduce the full contrast range visible to the
human eye.
100 On a bright day outdoors we may experience a brightness ratio of 1000:1 between the
brightest and darkest shades, whereas a good quality computer monitor is only likely to
achieve a ratio of about 100:1, and a printed image is only likely to manage 10:1. This is one
reason why holiday snaps of mountain ranges often look disappointing when viewed on
screen or as printed photographs – neither the screen nor the printed image can capture the
contrast or depth you see in real life.
101 This has an effect on the representation of both the detail in the scene and the way in which
contrast usually decreases with distance (‘aerial perspective’). This has been a challenge
since the beginning of photography. The methodology set out below seeks to ameliorate the
lack of contrast and depth in printed images to ensure that they provide the best
representation of the wind farm proposal – but it can never replicate the real life view.

23
Viewing distance
102 In the previous (2006) version of this guidance it was recommended that images should be
viewed at a correct “viewing distance” to recreate the correct perspective geometry of the
view. However, viewing printed images at a ‘correct viewing distance’ is not easy, especially
when provided as a cylindrical projection (which should be viewed curved). More importantly,
experience has shown that geometrically correct printed images, viewed at a theoretical
viewing distance, do not necessarily portray the view as experienced by people in reality2 .
103 The method described below results in significantly larger images, for which an accurate
viewing distance is less important. The images are enlarged and this provides a better
representation of the real view, at a comfortable viewing distance.
104 As a result, it is recommended that photomontages are simply viewed at a comfortable
arm’s length. This will vary depending on the length of the viewer’s arms and their eyesight.
However, the difference in viewing distance which results will have little impact on the
impression of scale / depth in the image due to the increased size of the images. An
instruction to view images at a ‘comfortable arm’s length’ should be included on all
visualisations produced. They should also be viewed flat as they are in planar projection.
105 Planar projection has been chosen for the photomontages as it is easier to use both in print
and on screen (a computer screen cannot be curved to view a cylindrical image). Both planar
and cylindrical projections have limitations. The main limitation of planar projection is that, if
viewed incorrectly, it can slightly increase the scale of turbines at the edge of the image3.
Ideally the viewer should view the image with their eyes in the centre – however, in
practice the difference in scale in most images will be difficult to perceive.
106 Some technical users of the visualisations may still wish to know the principal distance of the
image. This should be included on all images to allow technical comparison if required. It is
not necessary, however, for members of the public or decision makers to view the images at
this distance and it should not be referred to as the viewing distance.
Making visualisations more accessible to the public
107 It is essential that decision-makers and consultees are provided with, and that members of the
public have access to, a colour paper copy of the visualisations, printed at the correct size.
Using all the tools available
108 Visualisations are complementary to ZTVs and vice versa, and neither can be interpreted
satisfactorily without the other. A visualisation simulates a photograph of the wind farm from a
particular location, but gives no indication of whether this is characteristic of views over a
2 For a detailed discussion of this issue see ‘Windfarm visualisation: Perspective or Perception ?’ by Alan
Macdonald (2012), Whittles Publishing. 3 Conversely, if a cylindrical projection image is viewed incorrectly the turbines at the edges will appear too
small

24
wider area or is peculiar to a specific location. Used carefully together, a ZTV and a set of
visualisations can provide information on all of these aspects.
USES OF VISUALISATIONS
LIMITATIONS
Visualisations give an impression of a
proposed wind farm
Used carefully in the field, a visualisation
can be used to inform assessment
Visualisations can aid development and
appraisal of the wind farm layout and
design
Visualisations can help illustrate the
location and nature of a proposed wind
farm
Visualisations provide a tool for assessment that can be
compared with an actual view in the field; they should never
be considered as a substitute to visiting a viewpoint in the field
Neither photographs nor visualisations can replicate a view as
seen in reality by the human eye.
Visualisations are only as accurate as the data used to
construct them
Visualisations can only represent the view from a single
location at a particular time and in particular weather
conditions
Static visualisations cannot convey the effect of turbine blade
movement
Photography
Objectives
109 Undertaking photography for visualisations requires high quality specification and skill. This is
because the perspective geometry of the resulting photographic image must be known in
order to use software to generate an image with exactly matching perspective. This requires
considerable care in the selection and use of appropriate photographic equipment.
110 Representing landscape conditions through photography (and thus photomontages) has
limitations and, while some of these effects can be ameliorated and/or compensated for by
using presentation techniques discussed in the following section, other effects are less easy to
counteract. One of the most significant difficulties of photographing wind farms, in contrast to
other types of development, is that they often appear on the skyline where there can be little
contrast between the light-coloured turbines and a light-coloured sky. It is therefore
essential that all baseline photographs are taken in good visibility.
111 This will generally mean clear skies, in suitably clear air to allow sufficient contrast between
the different elements within the landscape. This is particularly important for long-range views
where poor light and atmospheric conditions such as haze or cloud can reduce the clarity of
the view, or for views where the turbines are predominantly viewed against the sky. In most
circumstances, clear skies are preferred. However, in some locations, especially where the
turbines will be predominantly backclothed, photographs taken in cloudy conditions can also
be used to illustrate the effects. The key requirement is that the turbines are rendered with
sufficient contrast against the backdrop (whether this is the sky or the landform).

25
Field of view
112 The term ‘field of view’ is used to describe the width and height of a view as represented by an
image. These constitute the horizontal field of view and vertical field of view and are
expressed as angles in degrees (the terms 'angle of view', 'included angle' and 'view cone
angle' are all equivalent, but they can be ambiguous in some contexts).
113 The photomontages to be included in the ES (described further below) have a horizontal field
of view of 53.5 degrees and a vertical field of view of 18.2 degrees4. In most situations this
will capture the whole wind farm and provide sufficient landscape and visual context. In some
situations, however, it may be necessary to provide a wider horizontal field of view. These
include:
Viewpoints which are very close to the wind farm;
Very large wind farms
Locations where cumulative effects require detailed representation (e.g. two wind farms
on the same ridge).
Where these necessitate the use of a wider horizontal field of view which will not fit on an A1
width page, it may be necessary to print on slightly longer paper (folded in the ES), or to print
several panoramas on separate sheets (with the wind farm shown on the central sheet) if the
paper length becomes unwieldy, or distortion affects the edges of the image. Where separate
sheets of paper are required to cover an exceptionally large angle of view, each section should
be re-stiched from the baseline photography to avoid distortion effects as the horizontal field of
view increases.
114 To ensure that the photographs (which may be taken by someone other than the landscape
architect or experienced specialist assessor) can accommodate the required horizontal field of
view to assess cumulative effects, a series of photographs should be taken from each
viewpoint to include the entire width of view. It is recommended to take 360° at each
viewpoint to ensure this can be achieved.
115 Photographs should generally be taken in landscape format. However, in some
circumstances, such as a steep sided valley or viewpoints which are very close to the
proposal, it may be necessary to use portrait format to capture the full vertical extent of the
wind turbines and/or landscape. Where this is necessary an alternative format of image will
be required and this should be agreed with consultees.
116 There may be circumstances where it is necessary to illustrate the full 360° view on the
baseline panorama. If an obstruction (such as a summit cairn) makes it difficult to capture the
full 360° view, it is acceptable to move the camera tripod to an alternative location to capture
4 NB – this applies to the photomontage, not the baseline panorama which will have a horizontal field of view
of 90º, 180º, 270º or 360º as required

26
the obscured view. This will make the production process more complex, but will result in
clear, unobstructed views. Ideally, the alternative tripod location should only be used for one
of the 90° segments of the view, with this noted on the visualisations.
Verification
117 In some cases the determining authority may wish to verify the accuracy of the image
produced. This is possible using the original image data recorded by the camera (to check
camera format and lens used) and a simple template (to check that the image dimensions
have been correctly adjusted (by cropping and then enlarging)). This process is described in
annex E. Camera metadata should be provided by the applicant on request.
Choice of camera and camera height
118 A high quality digital camera with a full frame sensor is required to produce satisfactory
results for ES purposes. Note that full frame sensors can also vary slightly in size – this is
discussed in more detail in Annexes E and F.
119 A 50mm fixed focal length camera lens is required. Note – even fixed focal length lenses
can vary slightly in their geometry; this and various other technical considerations are
discussed in more detail in Annex F. Lenses need to be of high quality both in terms of
resolving power (the ability to capture detail) and in freedom from excessive distortion.
120 The use of a fixed focal length reduces the scope for error in establishing the perspective
geometry of the photographic image and reduces variables in the method used. Such lenses
have less distortion than alternatives and are currently used as standard by most practitioners.
It also facilitates the verification process set out in Annex E.
121 In some circumstances it may be necessary, or beneficial to use an alternative lens or
camera. Where this is the case it should be agreed with the determining authority and a
clear justification should be included in the ES.
122 The camera should be 1.5m above ground level, unless there are good reasons to adjust this
(such as a hedge, tree, summit cairn or similar obstruction). If an alternative camera height is
used this should be marked on the visualisation and explained in the ES.
Post-photographic processing
Turbine image
123 The turbines shown on a visualisation should represent reasonably faithfully the shape of the
intended turbines for a project. They should, at least, have the correct hub height and rotor
diameter. This will allow the proportions of the turbines to be appreciated from the
visualisation.

27
124 Some practitioners prefer to depict all turbines with the rotors set with one blade pointing
straight up; whereas others prefer these set at random angles, helping to simulate more
realistically the fact that the turbine blades will be moving. The disadvantage of setting blades
at random angles is the risk of ‘losing’ turbines behind the landform because the blade angle
happens not to place a tip high enough in its arc to be seen. On the other hand, having all the
blades at the same angle can produce a very ‘regimented’ effect that appears less realistic.
125 It is recommended that, for all wireline diagrams (especially those used by the assessor),
turbines are always shown with one blade positioned straight upwards, while photomontages,
as illustrations, can show turbines at random positions. All the wind turbines that could
potentially be seen from a viewpoint must be shown within the photomontage, even if their
highest blades are on the diagonal. The rotors of every turbine in the proposed development
should face the same direction, forwards towards the viewpoint (note this may not be
necessary on photomontages, see paragraph 162).
Image enhancement
126 Enhancement of images is an inherent part of photographic production. Photographic
processing involves judgements - there is no process by which a ‘pure’ photograph can be
produced without the application of human decision-making, from exposure timing to the
specification of the camera, and whether this is applied manually or automatically.
127 Although enhancement, for example to maximise clarity, has traditionally occurred within the
photographic darkroom, this practice has often raised concern with regards to producing
photomontages. This may be because it is difficult to quantify the level of enhancement in a
way that is easy to understand, raising the suspicion that an image has been ‘enhanced’, and
is consequently misleading. In reality there is no way to avoid a photograph being enhanced
as this is an integral part of photography and photomontage production.
128 Enhancement must be done to acceptable standards and this requires extreme care by a
suitably experienced professional. The extent of enhancement must be limited to that which
would conventionally occur in a darkroom to improve the clarity of an image, not change its
essential character. For example, it is important that any enhancement, such as sharpening
elements within a view, is carefully balanced throughout an image, not just the wind turbines,
otherwise other features may seem less prominent in comparison.
129 Sharpening an image slightly can also help to make fine details, visible in the field, also be
visible on printing. This operation works by identifying areas of high contrast in the image,
which correspond to the detail we see, and locally further increasing the contrast so that the
detail becomes more apparent. However, this operation must be applied carefully as over-
sharpened images can result in a hard dark line that appears at the skyline, with a
corresponding light edge to the sky above it, while miniscule details can appear unrealistically
prominent. Overall, there should be a minimum of post-processing image enhancement.

28
Other considerations
Information to provide on the visualisations
130 Information provided on the visualisation should be sufficient for the user to understand the
basis of the visualisation, but not so much as to be overwhelming. Each image should also
include a small thumbnail location map, either located beneath the image or on a fold out at
the right hand side of the page. The information provided on the visualisation should include:
Viewing instructions, including standard text in Annex A
Figure number and viewpoint number
Information on viewpoint location, altitude and both vertical and horizontal fields of
view
Direction to centre of photograph as a bearing
Distance to nearest visible turbine in kilometres
Principal distance (mm), Camera make, Lens, Camera height
Date and time of photograph
Paper and printing
131 There is an extremely wide variety of printers and paper types available. To obtain the best
results in relation to the size and type of visualisation, it is recommended that advice is sought
from specialist providers.
132 The quality of a printed visualisation will depend significantly on the printing process and set-
up. Colour inkjet printers tend to show more detail than other machines because of their
higher colour range and resolution. However, it is generally difficult to produce large numbers
of pages in this way so colour laser printing may be necessary. Whichever method is used a
good quality, photo equivalent finish is essential. A matt finish is preferable and good quality
paper should be used.
Constructing the visualisations required in the ES
133 Three visualisations are required as standard within the ES and these are described in turn
below:
1) Baseline panorama and matching wireline
Construction of baseline panorama
134 The first image required from each viewpoint is a baseline panorama. This shows the
existing view and captures the overall landscape and visual context. This information is
essential to underpin the LVIA and to provide those who cannot visit the viewpoint with an
understanding of the wider context within which the wind farm would sit.
135 In most cases 180° should be sufficient. In some cases (such as a popular Munro summit or
viewpoint, or to illustrate cumulative effects) it may be necessary to provide a 360° baseline

29
panorama. In a few cases (such as a narrow view down a glen) a reduced field of view of 90°
may be adequate.
136 To construct the panorama a series of frames should be taken which cover the full 360° from
each viewpoint. The decision whether to present 90°, 180°, 270° or 360° can be taken later
by the assessor.
137 The images should be stitched together by a competent professional using suitable software.
Each 90° image should be presented on a single A1 width page as shown in figure 1 below.
The size of the image will be 820mm by 130mm. To accommodate 90° horizontal field of view
the vertical field of view will be 14.2°. Additional images (up to 4 for 360°) should be provided
on separate A1 sheets as required.
138 To present images with this wide field of view cylindrical projection is required – however, it
is not important to view this image in a curve, as they are provided to illustrate the wider
landscape and visual context only. The wind farm proposal should not be represented on
this image, in order to avoid confusion.
139 To facilitate the verification process described in annex E, the horizontal extent of the central
50mm frame should be indicated on the image, along with the extent of the 53.5° panorama.
An example of these markings is provided in the pdf version of the image available on our
website. The following text should be included: “This image provides landscape and visual
context only.” More detailed guidance on wireline production is provided below.
140 In some locations it may be useful to annotate key features (such as hilltops, key routes and
popular destinations) on the baseline panorama where these are not easily identifiable.
Construction of matching wireline
141 A wireline with matching dimensions and geometry should be constructed for either 90°, 180°,
270° or 360° horizontal field of view as required. The resulting vertical field of view will be
14.2°. The image will be 820mm by 130mm. The wireline will be particularly helpful to show
cumulative effects, which cannot be captured in the illustration described below. It should also
be provided in cylindrical projection, to match the baseline panorama. The wind farm
proposal and all other wind farms included in the cumulative assessment (including
existing wind farms) should be illustrated on the wireline – but not the baseline panorama
which is an illustration of the current landscape.
142 Turbines at different stages in the planning process (i.e. existing, consented, proposed) should
be shown in different colours to make it clear what the baseline is and what is proposed.
Potential scenarios of development, depending on which applications receive approval and
are constructed, can therefore be assessed.
143 It can also be helpful to show the horizontal extent of each wind farm with a small bar at the
top of the image, particularly when there are multiple wind farms in the same angle of view. In

30
some cases it will be difficult to annotate the wind farm(s) on the wireline, especially if the
viewpoint is close to the proposal and the turbines fill the vertical field of view. In these
circumstances, labelling should be included on a separate wireline image or the individual
wind farms (or turbines) identified on a key.
2) Wirelines
Use of wirelines
144 Wirelines are computer generated line drawings, based on a Digital Terrain Model, that
indicate the three-dimensional shape of the landscape in combination with additional
elements. They are a valuable tool in the wind farm LVIA process as they allow the assessor
to compare the position and scale of the turbines to the existing view of a landscape.
145 Wirelines are particularly useful to the landscape architect or experienced specialist assessor
as they portray objective data. This means that, by comparing wirelines with the views on site,
the assessor can make judgements on the likely visual impacts in a variety of environmental
conditions, safe in the knowledge that the wirelines have not been subject to manipulation that
cannot be quantified. They can also reveal what would be visible if an existing screening
element, for example vegetation or a building, were removed.
Data
146 The accuracy of a wireline depends on the accuracy of the data used to create it. In general,
this data will be the same as that used for calculation of the ZTVs, commonly the OS Terrain
50 or Terrain 5 DTM products, or the older ‘Landform’ products.
147 It is important that sufficient DTM data is used to enable the full landform background to the
turbines to be appreciated and thus easily matched to a view on site or photographs of the
Figure 1 90º Baseline panorama and matching wireline

31
existing landscape. For some views, DTM data may need to extend further than the LVIA
study area because the distant horizon extends beyond this.
148 In some locations, such as very flat landscapes with few features, achieving a good fit with the
digital terrain model will be difficult. The use of artificial features such as a meteorological
mast or other infrastructure may be required to position the image.
Geometrical properties
149 To allow direct comparison (and reduce confusion) wirelines should be provided using the
same perspective geometry and image height as the photomontage. They should also be
presented in planar projection to provide a consistent representation of the wind farm.
Drawing style
150 Wirelines consist of little more than simple line-drawings of the DTM and the wind farm.
However, there are a range of graphic styles used to depict these which can affect the clarity
and legibility of the finished image. A number of options are acceptable; however it is
important that the same format is used throughout a single ES.
151 The DTM is most commonly drawn as a mesh seen in perspective. While this is a faithful
depiction of the landform as represented by the DTM, it can often result in the more distant
parts of the scene becoming unreadable as the grid lines get closer together, eventually
merging into solid colour. This is not helpful and in these circumstances grid lines should, if
possible5, be removed to maintain a simple image. Only the outline of the topographic
features in the scene, approximating to the lines one might draw as a sketch of the scene,
should be shown.
152 Colour is useful to highlight the wind turbines in contrast to the landform lines, especially in
distant views where the effect of merging lines noted above often occurs, and where some
turbines may only just be visible against the landform. There are a number of options, such as
those listed below:
Green turbines on a black DTM
Red turbines on a black DTM
Black turbines on a grey DTM
Blue turbines on a grey DTM
Grey turbines on a green DTM
The use of pale colours, such as yellow, is not recommended as these have insufficient
contrast with the white paper background and cannot be seen clearly.
153 Using the same colour and/or shade for the turbines and DTM is not recommended due to the
lack of distinction between them. All the other options listed above are acceptable with the
5 It is noted that some wind farm visualisation software does not have this function at present, hopefully this will rectified in due course. In the meantime it is accepted that some practitioners may not have the ability to easily remove all grid lines.

32
caveat that care must be taken to ensure that the type of colouring does not produce an
illusion that the turbines are closer (or further away) than the landform on which they are sited.
154 Varying colours of turbines should be used to distinguish different wind farms within a view or
existing turbines from proposed turbines planned as an extension.
155 Turbines should be numbered so that the individual turbines can be directly referred to a
layout plan also showing the turbines numbered6. Unless the wind farm comprises a small
number of turbines, however, this information will usually take up a large amount of space
upon the wireline image and, similar to any other labelling, may distract from the wireline
image itself. It is preferable to label duplicate wirelines within an appendix (a selection of key
viewpoints may suffice, if agreed during consultation). For cumulative wirelines, only the
turbines relating to the proposal need to be numbered.
156 Features other than wind turbines can also be modelled into the wireline, depending on the
software being used. Existing landscape features can be shown, such as pylons or distinctive
buildings, which will help direct comparison with the photograph of the existing view (as long
as these do not obscure the wind turbines). This can be particularly helpful for offshore sites
where platforms and other existing infrastructure can be useful. Other elements of the wind
farm development can also be shown, such as access tracks and other permanent ancillary
infrastructure.
Construction of wireline
157 The production of wireline images is well understood, using standard software, so detailed
guidance is not provided here. The key objective is to provide a wireline of the same
geometry and image height as described for the photomontage below. Planar projection is
required. The wireline should be 260mm by 820mm wide. The horizontal field of view should
be 53.5° and the vertical field of view should be 18.2°.
Figure 2: Example wireline
6 NB, not for offshore wind farms as this is likely to be impractical

33
3) Photomontages
The use of photomontages
158 The basic concept of photomontage is simple: it combines a photograph of an existing view
with a computer-rendered image of a proposed development. In this way, photomontages
are used to illustrate the likely view of a proposed development as it would be seen in a
photograph (not as it would appear to the human eye in the field).
159 Although photomontages are based on a photograph of the existing landscape, it is
important to stress that they are not a substitute to visiting a viewpoint in the field.
They are only one tool to aid assessment. They provide a two-dimensional image that can be
compared with an actual view of the landscape to provide information, such as the scale and
potential appearance of a proposed development; but they cannot show other qualities of the
landscape experience that can only be appreciated in the field.
160 Given the limitations of depicting turbines in photomontages, their production will usually be of
most value for views within 20km of a wind farm site, for turbines up to 150 metres high to
blade tip7. At distances greater than this it can be difficult to represent the turbines well on a
photomontage. However, this will depend on issues such as the specific wind farm design and
environmental conditions, so this parameter, and which viewpoints require
photomontage, should be discussed and agreed with the determining authority and
consultees.
Rendering of photomontages
161 In order to address the difficulty of representing wind farms clearly within photos, it is common
practice to exaggerate the prominence of the turbines to ensure that they stand out in the
finished photomontage. When done poorly, this results in a level of predicted visibility
unwarranted by the conditions seen in the photograph. However, where done sensitively, this
can improve the clarity of an illustration, comparable to the conventional processing of
photographs within a darkroom. It is recommended that the rendering of photomontages is
carried out extremely carefully by a suitably experienced professional. The nature of any
enhancement should also be noted within the ES.
162 Where a project involves an extension to an existing wind farm it is important that the existing
wind farm appears clearly in the photographs. If this is not achievable the existing turbines
have sometimes been ‘painted out’ in the baseline photograph and re-montaged back in, so
that the images of both existing and proposed turbines match. An accurate representation of
the baseline conditions is important and we therefore prefer good photographs of the existing
development. However, in some conditions it may be necessary to enhance the depiction of
existing turbines if they are not clear in the photographs taken (for example due to weather
conditions, or because the rotors are oriented perpendicular to the viewpoint).
7 For turbines larger than 150m the distances should be discussed with SNH

34
163 Enhancement and rendering cannot compensate for photographs that have been taken
in poor light or weather conditions. In these circumstances, the photographs should be
retaken.
164 It is important to use turbine locations, dimensions and heights which are as accurate as
possible. The location and height of turbines in visualisations can be verified using the
process set out in Annex E. The production process should be documented within the ES to
enable this.
Accuracy of match to photography
165 In order to create a photomontage, the geometry of the overlain rendered image of the wind
farm must match as exactly as possible that of the base photography. The viewpoint location,
height and direction of the view must be identical, as must the horizontal field of view. Both
the resulting panoramic photograph and the rendered image must be planar projections. In
some cases, to achieve an accurate match, the images will need to be produced in cylindrical
projection, thus allowing a much wider horizontal field of view and providing more features to
achieve a match. Once a good match is achieved, the image should then be converted to
planar projection for presentation in the ES.
166 The most reliable method of obtaining an accurate match is to generate a wireline image that
matches the photograph. If the wireline can be accurately overlaid onto the photograph, then
the fit is good. However, where there are few landform features, this process may require the
matching of specific structures identified and mapped on site. A transparency copy of the
image can also be used to check this on site.
167 An accurate GPS position, taken when the photography was carried out, is almost always
sufficient for wind farm applications. Viewpoint location errors usually manifest as a mismatch
in the horizontal position of elements in the photograph and wireline and are always more
apparent in closer objects or landscape elements. If it is impossible to obtain a simultaneous
match on both near and distant landform features, then the viewpoint position is incorrect and
will need to be either re-measured on site or identified through iteration.
168 In certain landscapes, where there are few distinctive topographic features, it is necessary to
use man-made features such as masts, pylons or buildings. Even when these types of
features are clearly visible in photographs, it is often difficult to identify them accurately on the
map. Where there is no view of a distant skyline a hand-level or, better, a surveyor’s level,
can assist in setting the correct vertical alignment of panorama and wireframe. Without this
one may be reliant solely on the leveling of the camera.
169 Adjustments should be made until a satisfactory match between topographic features in the
wireline and the photograph are achieved across the whole width of the panorama, to ensure
that there are no errors of scale. If this cannot be achieved, then the fields of view do not
exactly match and the parameters must be adjusted further. It is often the case that a small
rotation needs to be applied to the panorama to compensate for residual errors in levelling the
camera.

35
170 Once a satisfactory match has been achieved, it is possible to use the parameters for the
wireline as perspective parameters for rendering the turbines for photomontage. Many
packages combine wireline and rendering and some also include the facility to overlay the
wireline on the photograph while adjusting parameters. However, the best quality is usually
obtained using a separate computer program designed for high-quality rendering. Most
rendering programs do not include the effect of the earth’s curvature, so it may be necessary
to make vertical adjustments to the turbine positions before rendering. The rendered wind
farm should be overlaid on the photograph using a matched wireline for reference, to ensure
that the position is correct.
Accuracy of lighting
171 The lighting model used to render wind farm images for photomontages should be a
reasonably faithful match to the lighting visible in the base photograph. Consequently, the
date and time that the photographs were taken should be recorded by the photographer or
assessor to enable an exact sun direction to be calculated. In practice, however, as long as
the direction of light is correct to within about 10 degrees, a convincing match can be
obtained. The effect of light and shade on wind turbines is an important aspect of their visual
character and should be represented well.
Associated infrastructure and land use change
172 Wind farm proposals include elements other than wind turbines, such as access tracks;
borrow pits, crane pads, site compounds, cabling, and a substation. A wind farm development
may also be both directly and indirectly responsible for vegetation and land use change. If
these elements are likely to result in permanent significant impacts (for the duration of the
consent), either individually and/or collectively, they should be included in photomontages
where this is practical.
173 Some of these components may be difficult to model well, particularly changes in vegetation.
In these circumstances it may be necessary to “paint” them directly onto the photomontage,
guided by a wireline or other computer generated image to ensure that the positioning,
perspective and scale of these elements is represented as accurately as possible.
Turbine lighting
174 In some circumstances it may be necessary to provide lighting on turbines if this is required to
address military and/or civil aviation requirements. We recommend that where turbines are
proposed in excess of 150m SNH are consulted on the requirement for night time
visualisations. It is difficult to illustrate turbine lighting well in visualisations, although some
recent examples which use photographs taken in low light conditions (just before or after
sunrise / sunset) have been more useful. We encourage applicants to explore new
techniques to do this, and emphasise the importance of early dialogue.
175 Where an illustration of lighting is required, a basic visualisation showing the existing view
alongside an approximation of how the wind farm might look at night with aviation lighting may
be useful. This is only likely to be required in particular situations where the wind farm is likely
to be regularly viewed at night (eg from a settlement, transport route) or where there is a

36
particular sensitivity to lighting (eg in or near a Dark Sky Park or Wild Land Area). Not all
viewpoints will need to be illustrated in this way. The visualisation should use
photographs taken in low light conditions8, preferably when other artificial lighting (such as
street lights and lights on buildings) are on, to show how the wind farm lighting will look
compared to the existing baseline at night. It is only necessary to illustrate visible lighting, not
infrared or other alternative lighting requirements.
176 We have found that approximately 30 minutes after sunset provides a reasonable balance
between visibility of the landform and the apparent brightness of artificial lights, as both should
be visible in the image. It is important that the photographs represent the levels of darkness
as seen by the naked eye at the time and the camera exposure does not make the image
appear artificially brighter than it is in reality. It can also be helpful to note the intensity of
other lights in the area to enable comparison (e.g. television transmitters) as this can aid the
assessment process. SNH may prepare further guidance on assessment of lighting in due
course.
177 The developer should attempt to formally agree the lighting requirements with the aviation
authorities in advance of the application. Where this is not possible the visualisations should
illustrate the lighting as described in the current legislation.
Image requirements
178 Production of the photomontage requires care to ensure that an accurate image is created.
The section on constructing visualisations is prescriptive and images must comply
with these requirements. This will avoid concerns over the ‘accuracy’ of images or the
method by which they have been produced.
Construction of photomontages
179 The photomontage should be formed from several 50mm photographs stitched together by a
competent professional using suitable software. The information that should be included on
the photomontage is described in paragraph 130.
180 The panorama should be printed on A1 width paper9 10 in planar projection. The image size
should be 260mm high by 820mm wide. The horizontal field of view should be 53.5° and the
vertical field of view should be 18.2° in the centre of the image. The image will have a
principle distance of 812.5mm.
181 A clear viewing instruction should be included on the photomontage as follows: “View flat at a
comfortable arm’s length. If viewing this image on a screen, enlarge to full screen height”.
To address concerns about the viewing instruction not being clear enough, this should be
printed in larger font than the example below.
8 The health and safety considerations of low light photography should be taken in to account but should not,
in themselves, be used as a reason to avoid the production of night time visualisations. 9 Unless a wider Horizontal Field of View is required
10 Folded to A3, see paragraph 184

37
Figure 3: Panoramic photomontage
Presentation of visualisations
182 It will usually be appropriate to present the photograph, wireline and photomontage such that
the proposed wind turbines are centred in the horizontal field of view. However, at certain
viewpoints it may be appropriate to centre the view on an alternative feature, or part way
between two or more foci. These additional foci may or may not be wind farms. In these
circumstances, it is important that the proposed wind farm does not appear at the far edge of
the image. This is because sufficient context or horizontal field of view needs to be provided
for each of the foci.
183 Paper and electronic copies of all ES materials will be required by the Planning Authority and
SNH. Where possible, images from each viewpoint should be saved in to one pdf for ease of
use, and be clearly named. The number of copies should be agreed for each application.
Additional loan copies for members of the public will also need to be provided, and these
should be made available at accessible locations throughout the study area. Typical locations
include local libraries, Council offices and village halls. The number of loan copies should be
agreed with the Planning Authority.
184 The A1 length visualisations should be folded to A3 size in the ES. This is to allow ease of
use and transport. The visualisations should be provided in a ring binder so that users can
remove individual sheets easily and we recommend these are limited to 10 viewpoints per
binder to make this easier to transport.
Public Exhibition display
185 Stakeholder engagement is extremely important and exhibitions provide an important
opportunity to present visualisations to the public. It is recommended that the same
visualisations, printed at the same size, should be used for public exhibitions. The limitations
of visualisations should be clearly marked on all of the material, and the information in Annex
A clearly displayed at the exhibition.

38
Presentation to council planning committee
186 It is for the Planning Authority to determine which images are presented to the committee –
but it is important that those who are unable to visit viewpoints are provided with a suitable
panorama to provide landscape and visual context. All hard copy images should be printed in
colour at the correct size.
187 Projection of a selection of the visualisations on PowerPoint slides, or similar, may be helpful
to the planning officer and committee members. However, it is essential that members are
also provided with hard copies of the images, printed at the right size to aid their
decision-making and that they read the supporting text assessment in the ES. Visualisations
on their own cannot substitute for the assessment of likely effects.
188 Committee members should ideally visit a representative selection of viewpoints as part of
the decision-making process, especially where there are differing opinions on the likely
effects.
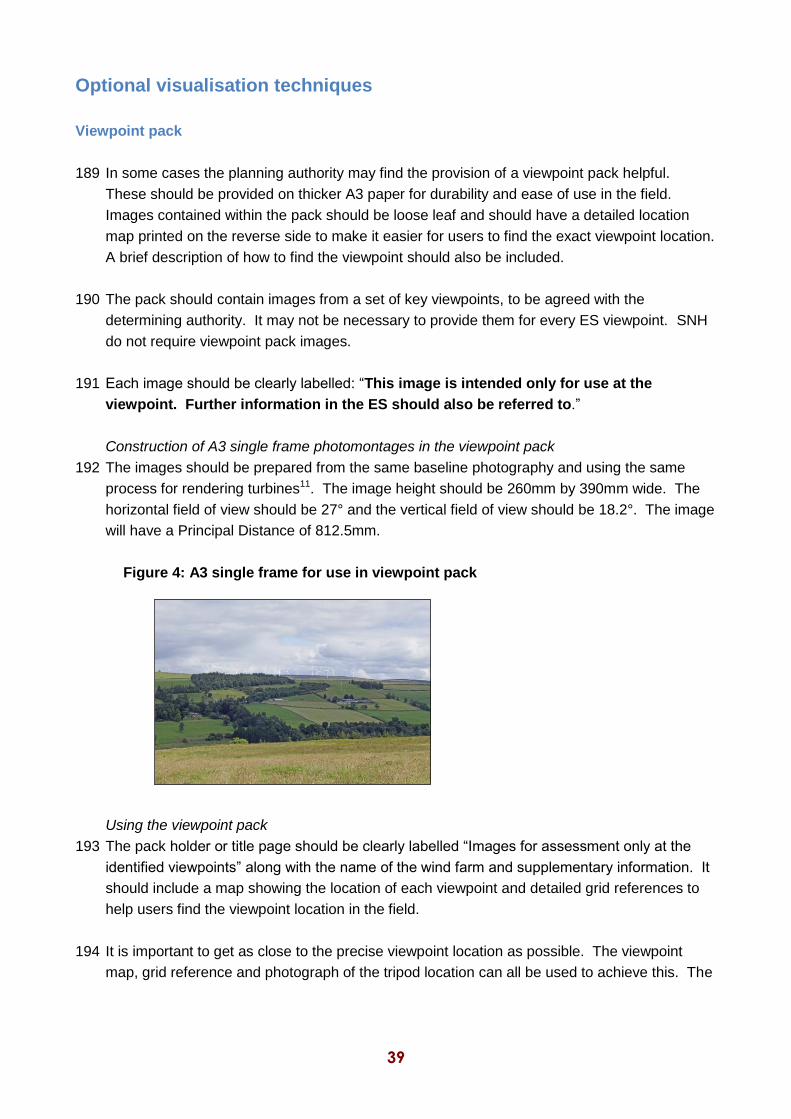
39
Optional visualisation techniques
Viewpoint pack
189 In some cases the planning authority may find the provision of a viewpoint pack helpful.
These should be provided on thicker A3 paper for durability and ease of use in the field.
Images contained within the pack should be loose leaf and should have a detailed location
map printed on the reverse side to make it easier for users to find the exact viewpoint location.
A brief description of how to find the viewpoint should also be included.
190 The pack should contain images from a set of key viewpoints, to be agreed with the
determining authority. It may not be necessary to provide them for every ES viewpoint. SNH
do not require viewpoint pack images.
191 Each image should be clearly labelled: “This image is intended only for use at the
viewpoint. Further information in the ES should also be referred to.”
Construction of A3 single frame photomontages in the viewpoint pack
192 The images should be prepared from the same baseline photography and using the same
process for rendering turbines11. The image height should be 260mm by 390mm wide. The
horizontal field of view should be 27° and the vertical field of view should be 18.2°. The image
will have a Principal Distance of 812.5mm.
Figure 4: A3 single frame for use in viewpoint pack
Using the viewpoint pack
193 The pack holder or title page should be clearly labelled “Images for assessment only at the
identified viewpoints” along with the name of the wind farm and supplementary information. It
should include a map showing the location of each viewpoint and detailed grid references to
help users find the viewpoint location in the field.
194 It is important to get as close to the precise viewpoint location as possible. The viewpoint
map, grid reference and photograph of the tripod location can all be used to achieve this. The

40
viewpoint map should be easy to find and use, showing recognised landmarks, roads or
buildings, for example, for the user to identify the viewpoint. A short description of the
viewpoint may also be helpful.
195 In poor weather the use of an A3 Perspex holder, or document wallet, can help keep the
images dry and reduce the effect of wind. Planning officers and other users who visit
viewpoints regularly should consider purchasing a holder for this purpose and in particular for
presenting images to the planning committee in the field (when it is often not possible to
choose optimal weather conditions). These are widely available at low cost and can also be
used to hold folded A1 length images.
196 The Viewpoint Pack should only be used at the viewpoint location, or by those who have
previously visited the viewpoint (such as on a Committee site visit). At viewpoints which are
very close to the wind farm it may be necessary to take the larger panoramas or wireframes
as it is unlikely that the whole wind farm will be captured on the single frame. It is not
necessary to produce multiple single frames to cater for this situation – though if turbines are
missing this should be clearly noted on the single frame image.
Hand-drawn illustrations
197 Drawings and paintings have been used for centuries to illustrate proposed landscape or
architectural changes. However, digital photography has resulted in radical changes to the
way images are conventionally presented, with an associated demand for these to be based
on technical data for which accuracy can be measured.
198 There are instances when hand-drawn illustrations remain an invaluable tool in the process of
visual analysis and the illustration of impacts within an ES. This is because they can offer:
clarity of image, by omitting some of the distracting details that might be prominent
within a photograph but which are overlooked on site;
an element of interpretation by highlighting prominent focal features; and,
their limitations are obvious – they are clearly not trying to replicate an exact view as it
would be seen.
199 However, for these same reasons, hand-drawn illustrations also have disadvantages, chiefly
that their quality is closely linked to the abilities of the illustrator and they may be distrusted for
incorporating 'artistic licence'.
Diagrammatic sketches and annotated visualisations
200 Diagrammatic sketches allow the key elements of the composition to be drawn out and
highlighted. This may be in relation to the landscape or the wind farm development,
highlighting the main characteristics and principles of design. The advantage of using this
medium is that important points can be stressed without them being clouded by insignificant
details.
11
The single frame can be extracted from the panoramic photomontage, as long as it is cropped from the centre of the panorama.
41
Animation
201 Wind turbines are intrinsically dynamic objects, with large moving parts and variable
orientation, so static images are in many ways a poor illustration. Computer animation,
videomontage and virtual-reality techniques are being used to some extent to address this
issue.
202 To date, most animation and videomontage has been used principally as a means of
conveying a general impression of a development to the determining authority and the public,
rather than as a tool for carrying out VIA or as part of an ES. However, considerable scope
exists for their use in the future as various techniques are developed and presented, and then
tested against wind farms once these have been built (similar to the scrutiny applied in the
past to wirelines and photomontages). At present, the application of these techniques
requires specialist contractors.
203 The provision of animation may assist in the decision making process. However, it cannot
replace the need for professionally produced photomontages and wirelines from selected
viewpoints. SNH will conduct further research on the use of digital visualisations in 2017-18.
Additional techniques for cumulative assessment
204 Additional guidance on further techniques to illustrate cumulative effects is provided in our
guidance on Assessing the Cumulative Impacts of Wind Farms. The presentation of
sequential effects as bar charts or on coloured maps is increasingly common. Video and
virtual reality simulations of journeys have also been used with varying success. All such
approaches should be carefully considered and discussed with the determining authority.
Care is required not to use technology for technology’s sake, nor to overburden the ES and
decision-makers with additional information.

42
5 Offshore wind farms
205 Offshore wind farm visualisation presents different challenges to onshore situations. As well
as having different environmental factors to consider, developments may be significantly
larger in turbine size and number.
206 In general terms, given good meteorological conditions, visibility is higher on the coast than
inland; periods of exceptional visibility occur in north and west Scotland. However, in the
coastal and marine environment, light quality and weather conditions change more rapidly and
are more variable than onshore, so it is difficult to represent these varying conditions in a
single image. Practitioners should aim to prepare visualisations representing the specific time
of day and season when there is optimum visibility and clarity. The reasoning and background
to choosing this seasonal or diurnal ‘window’ should be explained, for example by supporting
Meteorological Office data. Note that there may be some additional requirements for
visualisations to illustrate other light conditions such as sunrise or sunset.
Specific photographic requirements
207 It is difficult to judge the distance of an object when it is out at sea. It can also be difficult to
judge the scale of a single turbine, or of a wind farm, where there is no scale indicator giving a
familiar, comparative size. Thus, it is essential to include local landmarks or familiar features
within a photograph where at all possible12. Where existing offshore features, such as oil
platforms, existing turbines or lighthouses are present, they may aid in estimating the scale of
the turbines, as well as the overall size and extent of the wind farm.
208 Most requirements will be for visualisations from onshore viewpoints looking out to sea but in
some instances there may be a need for photography at sea to illustrate views back to shore,
for example from ferry routes. Such photography can be difficult to undertake because of
wave action, so in some instances relaxation of photographic standards to reflect this may be
appropriate, provided they are supported by wirelines. In some locations, especially those
which are difficult to access, wirelines may be the only feasible approach.
209 Scotland’s east and west coasts differ in terms of their light, aspect, weather and coastal
character. This needs to be considered when planning photography and visualisations. The
direction of sunset and sunrise are also a key consideration from sensitive viewpoints and
should be illustrated in some circumstances.
210 There is limited evidence to support an alternative ‘focal length’ for offshore wind farms. A
report by the DTI13 recommended using a 70 or 80mm ‘focal length’. To maintain
consistency with the approach used onshore, the same methodology and image
specification is recommended for offshore wind visualisations. Note – as for the images
described in section 4 above, this should be cropped and enlarged from a photograph taken
12
Longer than A1 paper lengths may be required 13
Guidance on the assessment of the impact of offshore wind farms: Seascape and Visual Impact Report, DTI, (2005)

43
with a 50mm fixed focal length lens. This will be kept under review and determining
authorities may chose an alternative focal length if circumstances support this.
Use of design envelopes
211 To date, most offshore wind farm applications have been submitted on the basis of a design
(or “Rochdale”) envelope, with assessment carried out on the basis of a realistic “worst case”
scenario, with the final design not confirmed until after consent. SNH has provided guidance
on the landscape and visual aspects of this process14.
Viewpoint choice for offshore wind farms
212 Viewpoint selection will depend on factors including the size and scale of the wind farm, its
distance from shore, proximity to other development or projects, and the extent of visibility
(particularly on land). Viewpoints will be agreed between Marine Scotland, the relevant
planning authority and SNH. If a design envelope is used, key “design viewpoints” will also be
identified, from which a range of design options will need to be illustrated.
213 Factors affecting viewpoint choice include, but are not limited to:
Choosing key viewpoints to illustrate design options and evolution adequately
Use of inland viewpoints to see offshore proposals in the context of onshore foreground
Inclusion of appropriate features or foreground to help the location and scale of the wind
farm to be appreciated
Choosing viewpoints that represent recognised circulation routes, such as ferry routes
(reflecting the type of boat and therefore viewing height from which the view will be seen),
beaches, onshore roads and footpaths, cruising routes, popular sailing competition areas
and other sea users, even if these may not be the most easily accessible points
Including a range of elevations of viewpoints, where relevant
Importance of representing land to sea, sea to land, and sea to sea views, including the
coastal, sea and land interfaces
Representing a variety of lighting conditions, e.g. side-lit, back-lit and front-lit
There may also be a need to choose viewpoints to show tidal differences if inshore
locations are proposed for development.
In all cases it remains essential that the number of viewpoints remains proportionate to the
assessment.
Elevation of viewpoint
214 The horizon is the most distant point seen on the sea surface – this distance increases with
the elevation of the viewpoint, and decreases the lower your position (because of the
curvature of the earth). Under special weather conditions, on many days of the year from high
14
Offshore Renewables – guidance on assessing the impact on coastal landscape and seascape; please refer to Annexe 2
44
points, it is possible to see the horizon up to 80+km distance15. On a clear day, viewed from a
beach, the horizon is of the order of three nautical miles (approximately six km) distant. This
means that the nature of views of offshore wind farms will vary significantly according to the
elevation of the viewer, and any visual assessment should examine a range of viewpoints
from different elevations.
Photomontage for offshore wind farms
215 In the production of offshore wind farm photomontages:
It is important to recognise that the greater distances involved are a technical challenge.
There may be a need to ‘zoom in’ for detailed design assessment.
It is often difficult to represent turbines on the horizon in photomontages as this zone is
generally hazy. The horizon may need to be rendered back in to the image in such
situations, and wireframes will be particularly helpful.
A key factor is achieving sufficient contrast between the sky and the sea so that the
horizon is clear.
It may be necessary to prepare images wider than 180o to capture landscape and visual
context.
It will be necessary to show the visual impacts of any ancillary infrastructure (including
offsite implications), such as offshore substation platforms, on-shore grid connections,
converter stations, associated tracks, access routes or buildings, fencing, car parks,
lighting, borrow pits and service platforms. Additional colouring on the turbines (such as
coloured foundation jackets) should be represented on the photomontage where possible.
Wirelines for offshore wind farms
216 The use of wirelines is especially useful in offshore visualisation where producing
photomontages may be very difficult, and these will replace photomontages in some
instances.
Turbine lighting
217 All offshore and inshore wind energy development will require lights for marine navigation and
aviation safety. It is often one of the major visual issues relating to this type of development.
Generally, the turbines are proposed in areas currently characterised by their darkness.
Reflection of lights on the water surface can also increase the effects of lighting in some
conditions.
218 Precise lighting requirements are not known at pre-application stage and are only agreed
post-consent via a “Lighting and Marking Plan”. This is due to the wide spectrum of different
design variations (the use of the ‘Rochdale Envelope’ in planning schemes) which make it
difficult to finalise CAA, MoD and Northern Lighthouse Board requirements. Nevertheless, it is
important to assess and illustrate likely lighting effects. Paragraphs 174-177 provide further
guidance on this.
15
An assessment of the sensitivity and capacity of the Scottish seascape in relation to wind farms. SNH Commissioned Report 103 (2005), p 12

45
6 Repowering
219 Repowering involves the replacement of the old turbines with new ones and a new planning
application. In most cases this will require a new LVIA and new visualisations.
220 Our guidance on assessing repowering applications is in preparation and we will consult on
this later in 2017. In the meantime, we are scoping the assessment of repowering
applications on a case by case basis. As a starting point we advise that visualisations for
repowering schemes are prepared as follows:
The baseline panorama should show the baseline landscape with the existing wind
turbines removed
An additional visualisation which compares the existing wind farm with the proposed
new one should be provided. This should follow the same format as recommended for
the baseline panorama, with the existing wind farm at the top of the image and the new
proposal below.

46
Annex A Information on limitations of visualisations.
Visualisations of wind farms have a number of limitations which you should be aware of when
using them to form a judgement on a wind farm proposal. These include:
A visualisation can never show exactly what the wind farm will look like in reality due
to factors such as: different lighting, weather and seasonal conditions which vary
through time and the resolution of the image;
The images provided give a reasonable impression of the scale of the turbines and the
distance to the turbines, but can never be 100% accurate;
A static image cannot convey turbine movement, or flicker or reflection from the sun on
the turbine blades as they move;
The viewpoints illustrated are representative of views in the area, but cannot represent
visibility at all locations;
To form the best impression of the impacts of the wind farm proposal these images are
best viewed at the viewpoint location shown;
The images must be printed at the right size to be viewed properly (260mm by
820mm);
You should hold the images flat at a comfortable arm’s length. If viewing these
images on a wall or board at an exhibition, you should stand at arm’s length from the
image presented to gain the best impression.
It is preferable to view printed images rather than view images on screen. If you do
view images on screen you should do so using a normal PC screen with the image
enlarged to the full screen height to give a realistic impression. Do not use a tablet or
other device with a smaller screen to view the visualisations described in this guidance.
Viewing instruction to be provided on every image
To minimise the risk of images being viewed incorrectly on screen, every photomontage should
contain the following instruction: “View flat at a comfortable arm’s length. If viewing this image
on a screen, enlarge to full screen height”. The correct paper size and image size should also
be provided.

47
Annex B Standard requirements which all visualisations should comply with
Checklist
Photography Camera Full Frame Sensor Size
Lens 50mm fixed focal length
Camera
height
1.5m (unless alternative height can be
justified, in agreement with planning
authority)
Location Grid reference, relevant location map, and
photograph of tripod location provided
Photomontage Image Clear of foreground objects
Conditions Visibility sufficiently good
Baseline
panorama and
wireline
Cylindrical projection 90, 180, 270 or 360
degrees printed on A1 length sheet(s).
Image size for both the baseline panorama
and wireline should be 820mm by 130mm
Wireline Planar projection, image size 260 by 820mm
on A1 sheet. HFOV 53.5° and VFOV 18.2°
Panorama Planar projection, image size 260 by 820mm
on A1 sheet. HFOV 53.5° and VFOV 18.2°
Principal
Distance
Printed on visualisations
Maps Viewpoint
map
To include overall viewpoint location map
(combined with ZTV). Thumbnail location
map provided on each panorama
Methodology Statement of methodologies used to
produce visualisations including ZTVs and
software used
HFOV = Horizontal field of view
VFOV = Vertical field of view

48
Annex C Summary of visualisation requirements16. Baseline panorama and wireline The purpose of the baseline panorama and wireline is to provide wider landscape and visual context to help the viewer understand where development sits within the wider landscape. The wireline also illustrates cumulative effects and provides the viewer with the full cumulative context. The baseline panorama is not intended to represent how large or small the turbines will appear in reality or how close they will appear to the viewer. Wireline Wirelines are very useful in the design stages and can used to illustrated changes to the proposal quickly and effectively. They illustrate ‘bare ground’ visibility and a provide a clear view of the wind farm to inform the assessment.
A1 Panorama The A1 panorama is intended to provide the best impression of the apparent size of the turbines and the distance to the development from the viewpoint location. Only images at this scale17, held at a comfortable arms length, should be used when trying to understand the size of the development and its distance from the viewpoint.
16
Note – it is not always necessary to produce all 3 images. In some cases a wireline may suffice, for example, if agreed by the determining authority and consultees 17
The horizontal and vertical fields of view define the scale of this image which is equivalent to the image which would be captured with camera lens of a focal length of 75mm on a full frame camera. Images produced which have an equivalent focal length of less than 75mm will make the development appear smaller and further away than it would in reality, regardless of viewing distance.

49
Annex D Earth Curvature and Refraction of Light
Ordnance Survey co-ordinates are not fully 3-dimensional. The northing and easting define a point on a plane corresponding to the OS transverse Mercator map projection, and the altitude above OS datum is measured above an equipotential surface passing through the OS datum point at Newlyn. In reality, the earth is curved so a correction has to be made in order to position geographical features correctly in three dimensions for ZTV calculation and for visualisations. If it were not for the presence of the Earth's atmosphere, a simple allowance for curvature would be sufficient. The formula for this can be worked out quite easily from Pythagoras' theorem:
h is very small in comparison with r, so the formula can be approximated with:
Rearranging for h, we get: In practice, rays of light representing sightlines over long distances are also curved downwards as a result of refraction of light through the atmosphere, allowing one to see slightly beyond the expected horizon. (The atmosphere reduces the vertical correction due to curvature alone by about 15%.) The standard formula used in surveying work is modified from the one derived above as follows:
Where: h is the height correction in metres c is the distance to the object in metres k is the refraction coefficient
r is the radius of the Earth in metres The parameter k is not constant but varies with temperature and barometric pressure (and therefore also with altitude). For precise geodetic surveying work both these quantities would have to be measured at both ends of a line of sight. Visualisation and visibility analysis do not require such precision; therefore a representative value may be used. 0.075 is a reasonable average for inland upland observations, but very slightly different values may be found quoted in surveying or navigation textbooks. (k is a numerical coefficient and therefore has no units.) Taking k = 0.075 and r = 6,367,000m (a representative radius for the UK), the following example values are obtained:
Distance c Vertical correction for Earth curvature and atmospheric refraction h
5 km 1.7m
10 km 6.7m
15 km 15.0m
20 km 26.7m
25 km 41.7m
30 km 60.1m
hhrc
hhr
hrhc
hrhrrc
hrrc
)(2
)(2
2
2
)(
22
2222
222
rhc 2
r
ch
crh
crh
2
2
2
2
2
r
kch
2
)21(2

50
Annex E Verification of images Some users of visualisations may wish to ‘verify’ the images provided. The following methods can be used. The first is provided to check that the photographs have been taken on the correct camera and lens and then enlarged appropriately. The second is to test that the turbines have been placed in the correct locations and at the correct size. There are two ways to check the A1 panorama, both are described below. The verification of single frame images (for the optional viewpoint pack) is described separately on page 51.
Checking photography Checking turbine heights and/or locations
Source original single frame
and metadata
Check single frame provided corresponds with marked extent on
baseline panorama
Check that 50mm fixed focal
length lens was used
Check that camera used has a full frame sensor
Check description of rendering in the ES has followed process
described in para 165 - 170
If further verification is required overlay the wireframe with the
panorama and check fit
Alternatively, mark reference points on panorama and
measure angles, comparing these to plan view and/or
turbine height specified using simple trigonometry**
Check that marked extent is approx 360mm on baseline panorama (some camera
configurations may result in a slightly smaller dimension*)
Check single frame (using process
described below)
Copy single frame on to transparency and check match with centre of the
panorama (the two should
be identical)
Check that the extent of the 53.3 planar panorama corresponds to
the markings on baseline
panorama (487mm)
or

51
Single frame images
The single frame image provided in the viewpoint pack (if this is requested by the Planning Authority) can be verified using a similar process. A simple template can be used to check that the correct portion of the 50mm image has been cropped and then enlarged*. To check this:
Obtain original 50mm photograph with metadata. Check full frame sensor camera and 50mm fixed focal length lens used
print the original 50mm photograph on A3 at 390mm wide by 260mm in height
overlay a template to check that the correct proportion of the image has been cropped (an example is available on our website). The template should include two rectangles, one at 390mm by 260mm, and one at 260mm by 174mm as shown on the example.
the cropped area should then be printed at 390mm wide by 260mm in height and this can be measured on the image submitted.
* Note – not all full frame sensors are exactly the same size. Very slight variations in sensor size and lens focal length may affect this measurement / comparison by a few mm. However, the difference is small enough that the horizontal field of view can be verified with sufficient confidence.
** Note – if measuring turbines on the image, make sure that you measure the full height of the turbine – i.e. check that the base of the turbine is not obscured either by vegetation, screening or topography.

52
Annex F Taking Good Photographs
This appendix is not intended to be a general manual of photography, there are plenty of good books available on that subject. It sets out briefly the main issues relating to photography aimed at constructing panoramas suitable for photomontages and ES work. Camera and lens A good quality camera is essential. A digital camera with full frame sensor is required to capture sufficient information and produce a verifiable image. A fixed focal length 50mm lens should be used to produce photomontages. A fixed focal length a) reduces the risk of inaccuracies and b) enables easy verification of the image should this be required. A full frame sensor also provides a verifiable reference point and a higher resolution than most alternative sensor sizes (depending on the camera). Note, however, that sensor size varies slightly on most ‘full frame sensor’ cameras and that even high quality fixed focal length lenses can vary in their geometry. The precise sensor size and geometry of the lens should be recorded, where available. Any significant variation from 36x24mm sensor size or 50mm focal length should be recorded and, if significant, corrected for. Tripod A stable tripod is essential. As a minimum, a head with independent tilt adjustments for both pitch and roll should be used (ball-head tripods are more difficult to level satisfactorily). A panoramic head should be used, allowing a single adjustment to be made for an entire panorama. Camera height should be 1.5m (unless an alternative height is required). A photograph of the tripod in situ should be taken. Levelling In order to obtain photographs which will splice together satisfactorily to form the baseline panorama, it is essential that the camera is levelled accurately. A simple, cheap spirit level will do this quite satisfactorily and, with care, can produce images levelled to an accuracy of about 0.2°. A tripod head with a built-in sprit level and adjusting screws is better. Focus The camera lens should always be focussed on infinity. On auto-focus lenses, the focussing should be set to manual or locked on infinity. Aperture and Exposure If at all possible, the exposure should be metered once for a complete panorama and then used for all frames either by using a manual setting or by locking the exposure. For greatest depth of field in the images, the aperture should be set to the minimum available on the lens (typically f/16 or f/22). If it is necessary to obtain slightly more resolution, it may help to use a slightly wider aperture: f/5.6 or f/8 are often the optimum settings. However, the photographer should use professional judgement to achieve the best results. Shutter speed should be selected to obtain the correct exposure consistent with the aperture selected. If there are existing wind turbines in the view, the shutter speed will affect the degree of blurring seen in the photograph due to the movement of the blades.

53
www.snh.gov.uk


![Visuomotor Understanding for Representation Learning of ...Visual representation learning Many previous works [7, 26, 34, 34, 35, 37, 61] for unsupervised visual representation learning](https://static.fdocuments.in/doc/165x107/604d0fbc6820572cb01c3708/visuomotor-understanding-for-representation-learning-of-visual-representation.jpg)


