Scottish Drug Misuse Database - ISD Scotland · PDF fileDrug Profile ... This report on the...
45
A National Statistics Publication for Scotland Information Services Division Publication Report Scottish Drug Misuse Database Overview of Initial Assessments for Specialist Drug Treatment 2014/15 Publication date – 17 May 2016
Transcript of Scottish Drug Misuse Database - ISD Scotland · PDF fileDrug Profile ... This report on the...
A National Statistics Publication for Scotland
Information Services Division
Publication Report
Scottish Drug Misuse Database
Overview of Initial Assessments for Specialist Drug Treatment 2014/15
Publication date – 17 May 2016

Information Services Division – Restricted Statistics – Embargoed to 17/05/2016
Contents
Introduction ............................................................................................................................. 1
Key Points .............................................................................................................................. 3
Results and Commentary ....................................................................................................... 5
Using the Electronic Dashboard .......................................................................................... 6
Section 1: SDMD Data Quality and Completeness (Scotland and NHS Board/ADP of
Treatment) .............................................................................................................................. 7
Introduction ......................................................................................................................... 7
Data Completeness ............................................................................................................ 7
Data Representativeness .................................................................................................... 9
Indicator Completeness .................................................................................................... 10
Comparisons between Area of Treatment and Area of Residence ................................... 11
Other Data Quality and Completeness Indicators ............................................................. 13
Conclusions ...................................................................................................................... 14
Section 2: SDMD Findings (Scotland and NHS Board/ADP of Residence) .......................... 16
Demographics ................................................................................................................... 16
Drug Profile ....................................................................................................................... 20
Prescribed Drug Profile ..................................................................................................... 22
Heroin Profile .................................................................................................................... 25
Injecting and Sharing ........................................................................................................ 26
Glossary ............................................................................................................................... 30
List of Tables ........................................................................................................................ 31
Contact ................................................................................................................................. 32
Further Information ............................................................................................................... 32
A1 – Background Information ............................................................................................ 33
A2 – Data Quality .............................................................................................................. 36
A3 – Publication Metadata (including revisions details) .................................................... 40
A4 – Early Access Details (including Pre-Release Access) .............................................. 42
A5 – ISD and Official Statistics ......................................................................................... 43

1
Information Services Division
Introduction
This report on the Scottish Drug Misuse Database (SDMD) presents the available information on individuals presenting for initial assessment (for a new drug treatment episode) at specialist drug treatment services in 2014/15.
The SDMD, which is managed by ISD Scotland, was set up in 1990 to collect information about people with problem drug use, based on data obtained when individuals first made contact with services providing tier 3 and 4 interventions (i.e. structured community and residential treatment) or reinitiated contact following a gap of at least six months since last attendance. Services contributing to the SDMD include specialist drug services and some medical services.
The SDMD is an important and widely used national information source on problem drug use in Scotland. It provides a range of information on individuals assessed for specialist drug treatment that members of the public, government and healthcare/Alcohol and Drug Partnership (ADP) staff may use to identify trends in activity over time, make comparisons between areas/groups, conduct research, improve services and influence policy in relation to service provision for problem drug use.
Further details on SDMD are included within Appendix A1-Background information.
Changes to Reporting
This is the first complete national SDMD Annual Report since 2011/12.
In 2012/13, the SDMD Annual Report included Scotland-level data on a limited range of indicators (overall numbers, gender and age of individuals assessed) in Section 1. A comparison between NHS Boards (except NHS Greater Glasgow & Clyde and Tayside) in relation to a wider range of indicators (‘illicit’1 and prescribed drug use, injecting behaviour, health and socio demographics) was included in Section 2.
In 2013/14, no SDMD Annual Report was published. An electronic dashboard showing NHS Board and ADP level comparisons across a comprehensive range of indicators (overall numbers, gender, age, ‘illicit’ and prescribed drug use and injecting behaviour etc.) was produced. However, it was not possible to provide Scotland-level analyses for those indicators or 2013/14 data for NHS Greater Glasgow & Clyde and Tayside.
Following extensive collaborative work between those NHS Boards and ISD, the quality and completeness of 2014/15 data has improved sufficiently to allow publication of a full national SDMD Annual Report. This report should be viewed in conjunction with the electronic dashboard (replacing the Excel workbook published alongside previous reports). This dashboard is available to all users and provides accessible, interactive content based on data from 2006/07 to 2014/15.
Findings from the assessment of data quality and completeness, which established that 2014/15 SDMD data were suitable for publication, are described in Section 1 and Appendix A2-Data Quality.
1 The term ‘illicit drugs’ includes (as per the SMR25a and SMR25b proforma and guidance) use of solvents,
‘novel’ or ‘new’ psychoactive substances (NPS)/legal highs or inappropriate use of ‘Over The Counter’ (OTC) medications.
2
Information Services Division
The findings in Section 2 focus on 2014/15 Scotland data and national trends from 2006/07. 2014/15 NHS Board/ADP findings are described only where these differed from 2014/15 Scotland results and were sufficiently robust to merit inclusion (see Section 1). The following changes should also be noted:
Due to the data quality and completeness issues described in Appendix A2-Data Quality, limited 2012/13 and 2013/14 data were available for some areas. Therefore, Scotland and relevant NHS Board/ADP trend analyses are incomplete.
Due to issues with data completeness, European Age Sex Standardised Rates (EASRs) have not been calculated within this report.
Methods
The information presented relates to individuals who participated in an initial assessment for specialist drug treatment in 2014/15 and for whom a SMR25a form was submitted to ISD, and does not reflect the total number of individuals seen by services. Some individuals will have had more than one initial assessment during 2014/15, however, only their first recorded initial assessment during the time period is counted and analysed. For some individuals, this may have been their first contact with specialist drug treatment services, while for others this assessment may be one case within a series of treatment episodes spanning multiple years.
Individuals are identified using a simple exact matching technique based on forename initial, surname and date of birth. In future reports, it is hoped that probability matching techniques will be applied in order to improve the methodology of identifying individuals. This should provide a more accurate estimate of the number of individuals participating in an initial assessment for specialist drug treatment.
While attempts have been made to ensure the terminology used is as clear as possible, the nature of this report means that the use of technical/statistical terms is unavoidable. For further explanation of these words or phrases, please refer to the Glossary.
3
Information Services Division
Key Points
Section 1: SDMD Data Quality and Completeness (Scotland and NHS Board/ADP of Treatment)
The SDMD data collection includes a wide range of indicators not available elsewhere and is therefore a unique data source providing national level data on individuals with problem drug use who were assessed for specialist drug treatment in Scotland.
Section 2: SDMD Findings (Scotland and NHS Board/ADP of Residence)
Demographics
In 2014/15, initial assessments for specialist drug treatment relating to 12,402 individuals were recorded on SDMD.
The ratio of male to females assessed in 2014/15 was approximately 3:1 (71% male); consistent with previous years.
An increasing percentage of individuals recorded on SDMD were from older age groups; in 2006/07, almost one-third (30%) of individuals assessed for specialist drug treatment were aged 35 and over, compared with almost half (48%) in 2014/15.
37% of individuals assessed for specialist drug treatment reported that they ‘lived alone’ and 65% reported that they lived in ‘owned/rented accommodation’.
Drug Profile
Among the 8,692 individuals providing information on recent ‘illicit’ drug use (including Novel Psychoactive Substances/legal highs), heroin (3,955; 46%) was the drug for which people most commonly sought treatment, followed by cannabis (1,762; 20%) and diazepam (868; 10%). The percentage of individuals reporting heroin as their main drug has decreased from 64% in 2006/07.
Prescribed Drug Profile
Information about current prescriptions for the treatment of addiction was provided by 5,167 individuals. Among these, methadone (an Opioid Replacement Therapy or ORT) was the most commonly prescribed drug; recorded in 60% (3,115) of assessments where a prescription drug was reported, followed by ‘other drugs’ (1,592; 31%) and diazepam (731; 14%).
Heroin Profile
The percentage of under 25s reporting recent heroin use decreased from 58% (1,592/2,729) in 2006/07 to 23% (362/1,547) in 2014/15.
The percentage of individuals aged 35 and over reporting recent heroin use decreased from 67% (1,755/2,620) in 2006/07 to 58% (2,263/3,916) in 2014/15.
In 2014/15, 47% (2,053/4,380) of individuals who had used heroin in the month prior to assessment reported injecting the drug.
4
Information Services Division
Injecting and Sharing
Among individuals providing information on injecting (9,913), almost half (4,638; 47%) had never injected drugs, 33% (3,265) stated they had done so in the past and 20% (2,010) currently injected drugs. A general downward trend in the percentage of individuals reporting current injecting since 2006/07 (28%) was observed.
Current sharing of needles/syringes and injecting paraphernalia was reported by 6% (282/5,067) and 8% (387/4,622) of individuals injecting drugs in the month prior to assessment; the lowest percentages recorded since 2006/07 (12% and 20% respectively).
Among the 5,275 individuals who had previously injected, previous testing for Hepatitis B, Hepatitis C and HIV was reported by 76% (4,011), 77% (4,084) and 74% (3,896) respectively.
5
Information Services Division
Results and Commentary
This report focuses on information provided by individuals presenting for initial assessment (for a new drug treatment episode) at specialist drug treatment services in 2014/15. This provides us with insights into their substance misuse needs and aspects of their social circumstances and behaviours at the point when they made contact with drug treatment services. It contains:
Section 1: SDMD Data Quality and Completeness (Scotland and NHS Board/ADP of Treatment) - Description of the completeness and data quality of Scottish Drug Misuse Database (SDMD) initial assessment submissions in 2014/15 and trends since 2011/12 for Scotland and NHS Board/Alcohol and Drug Partnership (ADP) of treatment. Comparison with drug treatment records from the Drug and Alcohol Waiting Times database (DATWT).
Section 2: SDMD Findings (Scotland and NHS Board/ADP of Residence) - Analysis of the number of initial assessments for specialist drug treatment recorded in SDMD, socio-demographic characteristics, measures of ‘illicit’2 and prescribed drug use, injecting behaviour and Blood Borne Virus testing in 2014/15 and trends since 2006/07 for Scotland and NHS Board/ADP of residence.
SDMD is a dynamic source of data. It should be noted that the 2014/15 data presented in this report is provisional and may change in future publications, as revised data will be used.
Individuals have been included only once within each NHS Board and ADP area of residence. However, individuals may be counted in more than one area and, as a result, the sums of the NHS Board and ADP area data will not equal the Scotland figure. Where data are presented at a national level, individuals are counted only once in any year.
Due to data completeness issues (see Section 1 and Appendix A2-Data Quality), Scotland data was not available in 2013/14 and available only for a limited range of indicators in 2012/13. In Section 2, where column charts were affected by missing data, relevant columns have been excluded. In line charts, dashed lines have been used to connect 2014/15 data points with the next most recent valid data point. For these line charts, it is important to note that the ‘true’ indicator value in years where data were missing was unknown and may differ from the value represented by the dashed line.
Certain figures (commonly small numbers, for small areas or populations) are not shown. This is as a result of ‘Statistical Disclosure Control’ (SDC) which aims to prevent the release of information that can lead to the identification of individuals. Further information on the SDC methods applied by ISD Scotland is available from the ISD website.
2 The term ‘illicit drugs’ includes (as per the SMR25a and SMR25b proforma and guidance) use of solvents,
‘novel’ or ‘new’ psychoactive substances (NPS)/legal highs or inappropriate use of ‘Over The Counter’ (OTC) medications.

6
Information Services Division
Using the Electronic Dashboard
Information accompanying this report is published in an electronic dashboard. It is recommended that the dashboard should be referred to while reading this report. Commentary within this report includes references to dashboard content using the following format:
(Geography>Domain>Indicator)
Where:
Options within ‘Geography’:
Options within ‘Domain’: Options within ‘Indicator’ for ‘Injecting and sharing’ domain:
Health Board of Residence
ADP of Residence
Data quality and completeness
Demographics
Drug profile
Prescribed drug profile
Heroin profile
Injecting and sharing
Injecting behaviour
Sharing needles/syringes
Sharing paraphernalia
Blood Borne Virus (BBV) testing
For example, (NHS Board of Residence>Demographics>Gender profile) means that the content relevant to the commentary can be found when:
1. the ‘NHS Board of Residence’ Geography is selected;
2. the ‘Demographics’ Domain is selected; and,
3. the ‘Gender profile’ Indicator is selected.
All Indicators with each Domain contain Scotland figures. Therefore, when referring to Scotland data in this report, only the Domain and Indicator selection are specified (e.g. (Demographics>Gender profile).
Once the relevant content has been selected, Scotland level information or information on specific areas (e.g. ‘NHS Borders’) or groups (e.g. heroin within the ‘Main drug’ Indicator of the ‘Drug profile’ domain) can be charted by clicking on the relevant row in the data table in the top left-hand corner of the dashboard.
Nearly all the data referred to in this report can be accessed using the dashboard. However, some statistics may require the associated data table to be exported. This can be done by clicking the ‘Export data’ button when the relevant Geography, Domain and Indicator are selected.
The dashboard contains background and contextual information relevant to the publication. All notes relevant to the data can be found within the specific pages. For further information about the electronic dashboard, please see the User Guide.
7
Information Services Division
Section 1: SDMD Data Quality and Completeness (Scotland and NHS Board/ADP of Treatment)
Introduction
Scottish Drug Misuse Database (SDMD) data has been submitted to ISD since 1990 and, since its introduction in 2009, most data suppliers enter and submit SDMD data via a web system (see Appendix A1-Background information for further details of the background and context of SDMD). Rather than inputting directly into the national SDMD database, some Alcohol and Drug Partnerships (ADPs) choose to capture information from specialist drug treatment assessments using local data collection systems. ISD provides a validated SDMD data upload facility for data extracted from local systems. However, problems with local data collection systems in NHS Greater Glasgow & Clyde and NHS Tayside prevented publication of comprehensive national data for 2012/13 or 2013/14. Further details can be found in Appendix A2-Data Quality.
Following extensive collaborative work between those NHS Boards and ISD, the quality and completeness of 2014/15 data has improved sufficiently to allow publication of a full national SDMD Annual Report. However, in order to establish whether such improvements were sufficient for national reporting, ISD assessed 2014/15 SDMD data quality and completeness from a number of perspectives, nationally and by NHS Board/ADP of treatment.
The publication in January 2015 of the UK Statistics Authority’s (UKSA) Guidelines on Administrative Data Quality Assurance further emphasised the need to critically appraise the representativeness and reliability of SDMD data. Positive relationships between data suppliers and producers and robust data quality assurance are crucial in ensuring the data quality and completeness of SDMD. As SDMD data are used in drug prevalence estimates, Scottish Public Health Observatory (ScotPHO) profiles, ADP annual reports etc. such issues may have a wide impact for a range of data users. These aspects of the SDMD data collection process therefore need to be documented in order to fully understand SDMD data and assess the likelihood and impact of inaccurate reporting.
This section describes the findings from this assessment in order to provide contextual information for users of these statistics. This section also outlines how these findings can be applied to Section 2 of this report, where results are presented nationally and by NHS Board/ADP of residence.
Data Completeness
Data on individuals assessed for specialist drug treatment in Scotland are provided to ISD Scotland using two data collection systems: the Drug and Alcohol Treatment Waiting Times database (DATWT) and SDMD.
Specialist services providing tier 3 and 4 interventions (i.e. structured community and residential treatment) should be submitting information to both DATWT and SDMD. However, ISD comparisons have shown that, since implementation of DATWT, national SDMD compliance has been comparatively low. There are a number of potential explanations for this:
In 2011, the Scottish Government established Health Improvement, Efficiency, Access and Treatment (HEAT) target A11, which stated that, by March 20133, 90% of people who need
3 After March 2013, this became a HEAT standard, and, from 2015/16, a Local Delivery Plan (LDP) Standard for
NHS Boards.

8
Information Services Division
help with their drug or alcohol problem will wait no longer than three weeks for treatment that supports their recovery. The DATWT database was implemented in 2011 to collect information in relation to this target. Since DATWT data has been available, SDMD completeness appears to have been comparatively low. It is possible that, in some areas, inputting data to demonstrate compliance with this target/standard may have been prioritised above SDMD data input.
The SDMD web system used by most data suppliers relies wholly on the informed consent of the individual to the collection and use of their patient identifiable data. However, one of the features of DATWT is the ability to submit anonymous records, reducing the risk that individuals may refuse to participate. This difference between these systems may have contributed to an increase in individuals withholding consent for their data to be recorded on SDMD and consequently, a decrease in data completeness in some areas.
The introduction of the SDMD web system in 2009 allowed services to check if an SMR25 record already existed for an individual and therefore avoid duplication of SMR25 submissions. This may have contributed to a reduction in overall numbers of SDMD records submitted.
In the absence of a comprehensive data source listing all assessments for specialist drug treatment occurring in Scotland, SDMD completeness is measured against DATWT. While DATWT is a useful source of comparison data, it cannot be regarded as a ‘true’ reference population for the following reasons:
As anonymous records are permitted in DATWT, it is not possible to identify the ‘true’ number of individuals assessed for specialist drug treatment using DATWT. As each anonymous record in DATWT must be counted as a unique individual, the number of individuals identified for comparison with SDMD may be slightly inflated.
In a small number of areas, there are differences in the service codes used in SDMD and DATWT. It is therefore not always possible to reconcile the services which submit data to either system. Some ADPs operate a triage system whereby a service will direct individuals to other services for assessment or treatment. In these circumstances, the triage service will submit DATWT data but not SDMD data. Eliminating such disparity is not possible without detailed knowledge of ADP practices and services.
Although NHS Board/ADP completeness varied widely (exceeding 100% where SDMD recording was more comprehensive than DATWT recording), DATWT was more complete on a national basis than SDMD (potentially for the reasons listed) and provides the best available indication of numbers of individuals assessed for specialist drug treatment. Based on the numbers of individuals recorded on SDMD and DATWT, 2014/15 SDMD data was estimated to be 72% complete. This percentage has been fairly consistent since DATWT was introduced in 2011/12 (Data quality and completeness>SDMD compliance with DATWT and Table 1).
Given the issues identified with comparisons between SDMD and DATWT and the comparatively low national completion rate (72%), it was not thought appropriate to impose an unrealistic criterion for SDMD completeness. However, it was thought that areas where completeness was estimated to be 50% or less were comparatively worse than the national average, increasing the probability that SDMD findings in those areas may be unrepresentative.

9
Information Services Division
Table 1: SDMD and DATWT Data Completeness by Financial Year (numbers of individuals; Scotland; 2010/11-2014-15)
Number of individuals
Year SDMD (Initial
Assessments) DATWT
(Drug Waits) % SDMD
Completeness
2010/11 10,590 - -
2011/12 10,407 15,227 68.3%
2012/13 10,836 14,719 73.6%
2013/14 - 15,330 -
2014/15 11,135 15,451 72.1%
NHS Board SDMD completeness (Table A2.1) varied widely from 119% in Forth Valley to 15% in Orkney. Aside from Orkney, the lowest completeness rate among ADPs was observed in Argyll & Bute (40%), while the highest rate was seen in Falkirk (178%). In the following NHS Boards/ADP areas, completeness was estimated to be 50% or lower:
NHS Highland: 48%
Argyll & Bute ADP: 40%
Highland ADP: 50%
NHS Orkney Islands (ADP): 15%
NHS Shetland Islands (ADP): 50%
Collaborative efforts by ISD, the Scottish Government and ADPs have successfully addressed data quality and completeness issues in some areas. However, further work is required in some ADPs to understand how DATWT and SDMD are used for recording activity and to improve data quality and completeness.
While the limitations of the comparison between SDMD and DATWT must be recognised, there was clear evidence of lower SDMD completeness. Nationally, it is estimated that around three in four individuals (72%) assessed for specialist drug treatment were recorded on SDMD. On this basis, it may not be appropriate to consider individuals recorded on SDMD as the complete population of individuals assessed for specialist drug treatment. Further, areas where completeness was estimated to be 50% or less were comparatively worse than the national average, increasing the probability that SDMD findings in those areas may be unrepresentative.
As a result, rates may underestimate the ‘true’ size of the population assessed for specialist drug treatment and should not be reported. Also, findings from areas where completeness was estimated to be 50% or less may not be robust and should not be included in this report.
Data Representativeness
As DATWT data were more complete than SDMD data, they are also assumed to be more representative of the population assessed for specialist drug treatment. National estimates of SDMD-DATWT completeness by age and gender (Table 2) showed a high rate of completeness for individuals aged under 25 (particularly males). Data completeness for other age groups was slightly below average (particularly among males). Further analysis by area of treatment is not provided, due to the small numbers of individuals assessed within specific NHS Boards/ADPs.

10
Information Services Division
The demographic differences between individuals recorded in SDMD and in the comparable data source (DATWT) suggest that there was a slight over-representation of individuals from younger age groups. This increases the likelihood that the characteristics or behaviours more common among those groups (e.g. stimulant use) may be over-reported. This bias could have been corrected by weighting SDMD to a reference population. However, DATWT data was not considered sufficiently robust for such an adjustment and would not overcome all relevant issues4. Therefore, while this potential bias should be recognised, on the basis of the available demographic comparison, SDMD was deemed sufficiently representative.
Table 2: SDMD Data Completeness (compared to DATWT) by Age Group and Gender
(numbers of individuals; Scotland; 2014/15)†
Age Group
Under 25 25-34 35+ Total
Gender SDMD/
DATWT % SDMD/
DATWT % SDMD/
DATWT % SDMD/
DATWT %
Male 1,069/1,209 88.4% 2,636/3,590 73.4% 4,043/5,532 73.1% 7,748/10,331 75.0%
Female 522/642 81.3% 1,371/1,834 74.8% 1,492/1,909 78.2% 3,385/4,385 77.2%
Total 1,591/1,851 86.0% 4,007/5,424 73.9% 5,535/7,441 74.4% 11,133/14,716 75.7% Note: †This analysis excludes DATWT anonymous clients, focusing on those who provided age and gender information.
Indicator Completeness
Analysis suggests that, for the indicators described below, data completeness was generally low across Scotland or varied by NHS Board/ADP of treatment. While these variables have been included in the report and electronic dashboard because of a) their relevance to the issue of problem drug use and b) in order to highlight indicators where data quality or completeness could be improved, it is possible that findings may be biased by variations in reporting. Therefore, results should be interpreted carefully in light of the following contextual information. 2014/15 Indicator completeness tables for Scotland, NHS Boards and ADPs are provided on the ISD website.
Co-Occurring Health Issues: This indicator could potentially provide valuable insights into risk factors for relapse (e.g. people with a mental illness are twice as likely to misuse drugs and vice versa (drugabuse.gov, 2011)). However, there is some ambiguity associated with these data within SDMD (this variable has no ‘none’ category and therefore, it is assumed that the absence of a response means there are no co-occurring health issues). Data completeness across Scotland for 2014/15 was 51%. NHS Orkney and NHS Fife reported issues in 0% and 36% of cases respectively. Within ADPs, completeness ranged from as low as 33% in Renfrewshire ADP to 91% in Na h-Eileanan Siar ADP.
Alcohol Consumption: It seems likely that a high proportion of those assessed for specialist drug treatment may also consume alcohol. However, there was considerable variation between NHS Boards and ADPs in the extent to which these data were recorded. Across Scotland, completion was 81%. Among NHS Boards, completion was as low as 59% in NHS Highland. While 14 ADPs had completeness rates of 90% or greater, 4 ADPs
4 DATWT data does not identify the drugs for which individuals were seeking treatment. Therefore, users of
specific drugs may be under- or over-reported within SDMD compared to DATWT. This is important as users of different drugs present different challenges to treatment services and may have different outcomes, potentially biasing findings.
11
Information Services Division
collected these data in less than 60% of records (Glasgow City ADP: 50%, Argyll & Bute ADP: 54%).
Age First Started Using Drugs: This variable is a useful indicator in assessing age of onset of drug misuse. Overall completeness for Scotland in 2014/15 was 73%. Data completeness in NHS Orkney and NHS Fife was low at 0% and 44% of cases respectively. Recording across ADPs varied considerably from 30% in Argyll & Bute ADP to 97% in East Renfrewshire ADP.
Blood Borne Virus (BBV) Testing: Information about BBV testing is very important within the context of treatment for problem drug use. However, due to the sensitivity of this information, users may not wish to disclose such information or have it recorded in SDMD. Nationally, completeness of the testing indicators was around 76% for all three BBVs. However, data completeness of these indicators varied across NHS Boards and ADPs. For NHS Fife, recording of BBV testing was 56-57%. In Argyll & Bute ADP, data completeness for all BBV testing indicators was 37%, while completeness ranged from 49-52% in Renfrewshire ADP.
Argyll & Bute ADP: It was noted that completeness of a wide range of indicators was poor in Argyll & Bute ADP. In addition to the issues identified above, completion of most non-mandatory demographic indicators (e.g. education/employment, accommodation etc.) was lower than 50% in 2014/15. However, given the small number of individuals recorded on SDMD by Argyll & Bute ADP (46 in 2014/15), this had little impact on Scotland level figures.
Comparisons between Area of Treatment and Area of Residence
The data quality and completeness analyses presented in this section of the report are based on the individual’s area of treatment (NHS Board or ADP) (i.e. the area where an individual was assessed for specialist drug treatment). Data quality and completeness is analysed this way because:
1. NHS Board/ADP treatment services submit SDMD data to ISD based on the patients they assess. Therefore, data quality and completeness issues can only be identified by evaluating records on the basis of NHS Board/ADP of treatment. Likewise, data quality and completeness issues are addressed in communication between ISD and the NHS Board/ADP submitting those records.
2. Specialist drug treatment waiting times from DATWT are reported by area of treatment only. Therefore, analysis of SDMD data quality and completeness by area of treatment facilitates use of DATWT data for comparisons in terms of completeness, representativeness etc.
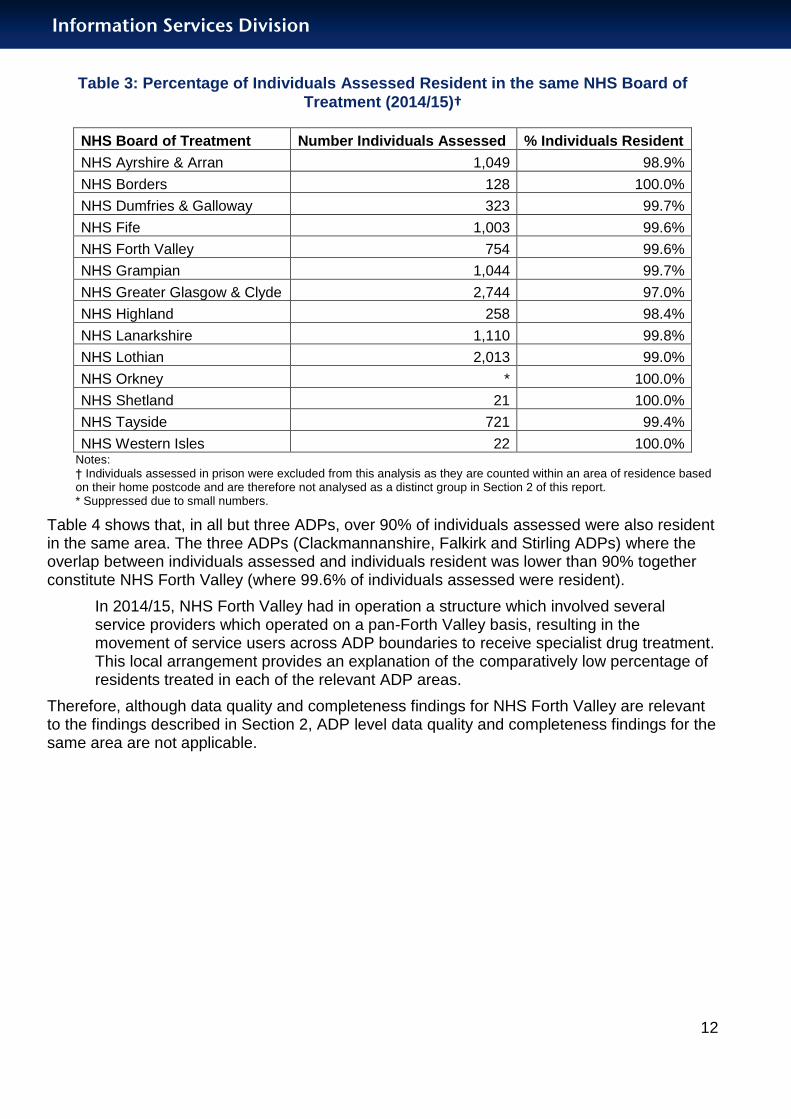
However, an individual may be assessed for treatment outwith the NHS Board or ADP in which they reside. The key SDMD findings presented in Section 2 are based on analysis by area of residence because this is thought to be of most value to end users of these statistics. Given these analytical differences, it is worthwhile examining the extent to which the data quality and completeness figures presented in this section may be applied to the data presented in Section 2. In order for data quality and completeness findings from Section 1 to function as measures of the reliability of findings in Section 2, there should be a high degree of correspondence between the SDMD treatment and resident populations. Table 3 shows that, in all NHS Boards, over 95% of individuals assessed for specialist drug treatment were also resident in the same area.
12
Information Services Division
Table 3: Percentage of Individuals Assessed Resident in the same NHS Board of
Treatment (2014/15)†
NHS Board of Treatment Number Individuals Assessed % Individuals Resident
NHS Ayrshire & Arran 1,049 98.9%
NHS Borders 128 100.0%
NHS Dumfries & Galloway 323 99.7%
NHS Fife 1,003 99.6%
NHS Forth Valley 754 99.6%
NHS Grampian 1,044 99.7%
NHS Greater Glasgow & Clyde 2,744 97.0%
NHS Highland 258 98.4%
NHS Lanarkshire 1,110 99.8%
NHS Lothian 2,013 99.0%
NHS Orkney * 100.0%
NHS Shetland 21 100.0%
NHS Tayside 721 99.4%
NHS Western Isles 22 100.0% Notes: † Individuals assessed in prison were excluded from this analysis as they are counted within an area of residence based on their home postcode and are therefore not analysed as a distinct group in Section 2 of this report. * Suppressed due to small numbers.
Table 4 shows that, in all but three ADPs, over 90% of individuals assessed were also resident in the same area. The three ADPs (Clackmannanshire, Falkirk and Stirling ADPs) where the overlap between individuals assessed and individuals resident was lower than 90% together constitute NHS Forth Valley (where 99.6% of individuals assessed were resident).
In 2014/15, NHS Forth Valley had in operation a structure which involved several service providers which operated on a pan-Forth Valley basis, resulting in the movement of service users across ADP boundaries to receive specialist drug treatment. This local arrangement provides an explanation of the comparatively low percentage of residents treated in each of the relevant ADP areas.
Therefore, although data quality and completeness findings for NHS Forth Valley are relevant to the findings described in Section 2, ADP level data quality and completeness findings for the same area are not applicable.

13
Information Services Division
Table 4: Percentage of Individuals Assessed Resident in the same ADP of Treatment
(2014/15)†
ADP of Treatment Number Individuals Assessed % Individuals Resident
Aberdeen City ADP 669 98.4%
Aberdeenshire ADP 307 99.0%
Angus ADP 159 98.1%
Argyll & Bute ADP 46 100.0%
Ayrshire East ADP 386 97.7%
Ayrshire North ADP 397 99.5%
Ayrshire South ADP 272 93.4%
Clackmannanshire ADP 389 33.2%
Dumfries & Galloway ADP 323 99.7%
Dunbartonshire East ADP 78 94.9%
Dunbartonshire West ADP 341 99.4%
Dundee City ADP 366 98.9%
Edinburgh City ADP 1,158 90.5%
Falkirk ADP 187 84.5%
Fife ADP 1,003 99.6%
Glasgow City ADP 1,796 94.5%
Highland ADP 212 98.1%
Inverclyde ADP 156 99.4%
Lanarkshire ADP 1,110 99.8%
Lothian Mid & East ADP 324 99.1%
Lothian West ADP 553 97.5%
Moray ADP 70 98.6%
Na h-Eileanan Siar ADP 22 100.0%
Orkney Islands ADP * 100.0%
Perth & Kinross ADP 198 94.9%
Renfrewshire ADP 353 96.9%
Renfrewshire East ADP 39 97.4%
Scottish Borders ADP 128 100.0%
Shetland Islands ADP 21 100.0%
Stirling ADP 204 42.2% Notes: † Individuals treated in prison are excluded from this analysis as they are counted within an area of residence based on their home postcode and are therefore not analysed as a distinct group in Section 2 of this report. * Suppressed due to small numbers.
Other Data Quality and Completeness Indicators
The dashboard contains other data quality and completeness indicators which may be of interest to some users of these data.
The completeness of SDMD 3-month follow-up (SMR25b) recording for the most recent treatment episode for each individual recorded on SDMD in 2014/15 is provided in Data

14
Information Services Division
quality and completeness>SDMD follow up completeness. This shows that, nationally, 14% of initial assessments also had follow-up data recorded on SDMD after three months.
Numbers of unplanned discharges are monitored by services because such events may be associated with the relapse of individuals to problem drug use. Data quality and completeness> Unplanned discharge before treatment shows that the percentage of discharges before treatment which were unplanned decreased from 39% in 2011/12 to 28% in 2014/15. Unplanned discharges as a percentage of all discharges during treatment also decreased from 50% in 2011/12 to 42% in 2014/15 (Data quality and completeness> Unplanned discharge during treatment).
Conclusions
Neither the SDMD nor DATWT datasets capture the total population of individuals assessed for specialist drug treatment in Scotland each year. There appear to be some area-level differences in the way that these databases are used. However, a simple comparison of numbers of individuals recorded suggests that, nationally, DATWT was more complete than SDMD, and provides the best available indication of the total number of individuals assessed for specialist drug treatment. On this basis, it may not be appropriate to consider individuals recorded on SDMD as the complete population of individuals assessed for specialist drug treatment. Further, it was thought that areas where completeness was estimated to be 50% or less were comparatively worse than the national average, increasing the probability that SDMD findings in those areas may be unrepresentative.
Analysis of the demographic differences between individuals recorded in SDMD and in the comparable data source (DATWT) suggest that there was a slight over-representation of individuals from younger age groups (particularly among males) in 2014/15 data. While this increases the likelihood that the characteristics or behaviours more common among those groups (e.g. living with parents, stimulant use) may be over-reported, DATWT data was not considered sufficiently robust as a basis for statistical weighting. Therefore, while this potential bias should be recognised, on the basis of the available demographic comparison, SDMD was deemed sufficiently representative.
Analysis of indicator completeness showed that, while national data quality was generally good, completion of a number of indicators varied by area. Despite this, these indicators are included in the report and electronic dashboard because of a) their relevance to the issue of problem drug use and b) in order to highlight the potential for improvement in data quality and completeness. However, it is recommended that the contextual information provided should be taken into consideration when interpreting these data.
The findings presented in this section relate to data suppliers and thus, the area of treatment. However, findings in Section 2 relate to the area of residence. If it were found that the majority of individuals assessed by services were non-residents, there would be a potential lack of correspondence between data quality and completeness findings and results from Section 2. However, in the vast majority of cases, individuals lived in the NHS Board area in which they were assessed. With the exception of Clackmannanshire, Falkirk and Stirling ADPs, individuals also overwhelmingly lived in the ADP area in which they were assessed. On this basis, the data quality and completeness findings in this section function effectively as measures of the reliability of findings in Section 2 and data held in the electronic dashboard.
The analyses presented in Section 2 of this report reflect these findings in the following ways:
Rates may underestimate the ‘true’ size of the population assessed for specialist drug treatment and are not reported.

15
Information Services Division
Areas where completeness in comparison to DATWT was estimated to be 50% or lower are excluded from commentary in Section 2 of this report on the basis that there is a higher probability that SDMD findings may be unrepresentative.
Analysis of indicators with considerable variation in completeness is restricted to Scotland level figures.
It is recommended that secondary uses of SDMD data by stakeholders should also reflect these findings. In particular, secondary analysis relating to numbers of individuals assessed or treated, sub-national areas or the indicators highlighted above should be discussed with ISD.
Despite these changes to reporting and associated recommendations, it is evident that, nationally, SDMD provides data on a demographically representative group of individuals assessed for specialist drug treatment. The SDMD data collection includes a wide range of indicators (e.g. ‘illicit’ drug use, prescribed drug use, injecting behaviour) that are not available, on a national basis, from other drug treatment data sources. Therefore, while SDMD does not provide data on all individuals with problem drug use in Scotland, it is a unique data source that provides national level data on the characteristics of individuals who were assessed for specialist drug treatment.

16
Information Services Division
Section 2: SDMD Findings (Scotland and NHS Board/ADP of Residence)
Demographics5
New Individual Patients/Clients
In 2014/15, initial assessments for specialist drug treatment relating to 12,402 individuals were recorded on the Scottish Drug Misuse Database (SDMD) (Demographics>New individual patients/clients). The annual number of individual assessments recorded on SDMD has remained stable since 2006/07 (Figure 1).
Figure 1: Number of Initial Assessments by Financial Year (Scotland; 2006/07-2014/15)
There was considerable variation over time in the number of initial assessments recorded on SDMD when analysed by specific NHS Board or Alcohol and Drug Partnership (ADP) area. However, while these variations may reflect increases in the demand for specialist drug treatment, they may also be due to changes in service configuration or data submission over time.
Age Profile
Since 2006/07, an increasing percentage of individuals recorded on SDMD have been from older age groups. In 2006/07, almost one-third (30%) of individuals assessed for specialist drug treatment were aged 35 and over, compared with almost half (48%) in 2014/15. Assessments among individuals aged 25-34 (until 2012/13, this was the group most often assessed for specialist drug treatment) decreased from 45% in 2006/07 to 36% in 2014/15.
5 This section describes the demographic profile of individuals presenting for an initial assessment of their drug
use care needs at specialist drug treatment services in Scotland. As stated above, for some individuals this may have been their first contact with specialist drug treatment services, while for others this may be one case within a series of treatment episodes spanning multiple years.
17
Information Services Division
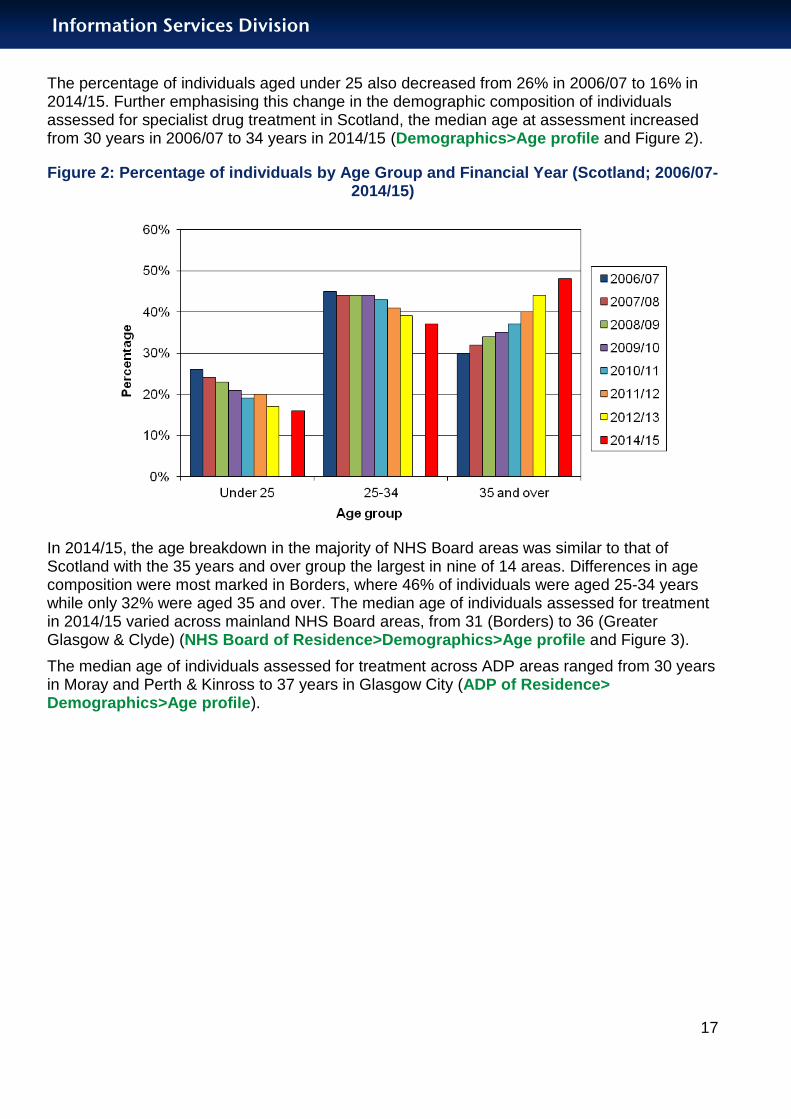
The percentage of individuals aged under 25 also decreased from 26% in 2006/07 to 16% in 2014/15. Further emphasising this change in the demographic composition of individuals assessed for specialist drug treatment in Scotland, the median age at assessment increased from 30 years in 2006/07 to 34 years in 2014/15 (Demographics>Age profile and Figure 2).
Figure 2: Percentage of individuals by Age Group and Financial Year (Scotland; 2006/07-2014/15)
In 2014/15, the age breakdown in the majority of NHS Board areas was similar to that of Scotland with the 35 years and over group the largest in nine of 14 areas. Differences in age composition were most marked in Borders, where 46% of individuals were aged 25-34 years while only 32% were aged 35 and over. The median age of individuals assessed for treatment in 2014/15 varied across mainland NHS Board areas, from 31 (Borders) to 36 (Greater Glasgow & Clyde) (NHS Board of Residence>Demographics>Age profile and Figure 3).
The median age of individuals assessed for treatment across ADP areas ranged from 30 years in Moray and Perth & Kinross to 37 years in Glasgow City (ADP of Residence> Demographics>Age profile).

18
Information Services Division
Figure 3: Percentage of individuals by Age Group and NHS Board of Residence
(2014/15)†
Note: † NHS Orkney is not included in this chart, as a result of the suppression of small numbers. NHS Highland and Shetland
are not included due to low data completeness.
Gender Profile
The ratio of male to female assessments in Scotland in 2014/15 was approximately 3:1 (71% male); consistent with previous years (Demographics>Gender profile).
In 2014/15, the percentage of males was similar across NHS Board areas, ranging from 68% in Tayside and Fife to 76% in Lanarkshire and 79% in Western Isles (NHS Board of Residence>Demographics> Gender profile). There was more variation in gender composition among ADP areas, with the percentage of males ranging from 66% in Angus, Dundee City and Mid & East Lothian to 85% in Moray (ADP of Residence> Demographics>Gender profile).
Source of Referral
The distribution of referral sources reflects local networks of health, social care and justice agencies within NHS Boards. In Scotland, information on source of referral was provided for 94% of individuals undertaking an initial assessment for specialist drug treatment. Of these responses, the most common referral source was ‘Self’ (41%), followed by ‘Health’ (24%). Almost one-sixth (16%) of initial assessments were referred by ‘Criminal Justice’ (Demographics>Source of referral).
In eleven of the NHS Board areas, ‘Self’ referral was the most common; ranging from 21% in Western Isles and 23% in Grampian to 65% in Fife. In Western Isles and Grampian, ‘Health’ referrals were the most common, accounting for 54% and 53% of individuals. In Tayside, around one quarter (24%) of individuals attended an initial assessment after a referral by ‘Criminal Justice’ Services (NHS Board of Residence>Demographics>Source of referral).

19
Information Services Division
In all ADP areas, ‘Self’ or ‘Health’ were the most common sources of referral, with ‘Self’ referrals being the most common in 22 of the 30 ADPs (ADP of Residence>Demographics >Source of referral).
Employment Status
Employment/education status was reported at assessment for 82% of individuals. In 2014/15, almost half (48%) of individuals reported being unemployed at the time they were assessed for specialist drug treatment, 20% reported an ‘other’ employment status6, while 14% were employed or in full time education/training (Demographics>Employment status).
In Borders, 68% of individuals assessed for specialist drug treatment were unemployed. The highest percentage of individuals employed (24%) was observed in the Grampian area (NHS Board of Residence> Demographics>Employment status).
Living Situation
The living situation of individuals known to use drugs can have a profound impact on their lives; living with other drug users may increase the likelihood of relapse to problem drug use while living alone may be a risk factor for drug-related death7. Among individuals recorded on SDMD, ‘lives alone’ (37%) was the most common living situation, followed by ‘living with partner/spouse’ (20%) and ‘living with parents’ (16%). The fourth most common response was ‘living with other drug users’ (12%). This was in marked contrast to the previous national report (2011/12), where ‘living with other drug users’ (34%) was the second most common response (after ‘lives alone’ (35%)) (Demographics>Living situation).
Accommodation Status
In Scotland, 65% of individuals reported that they lived in ‘owned/rented accommodation’. More than one-tenth (11%) of individuals reported being homeless when they were assessed for specialist drug treatment (Demographics>Accommodation status).
The highest percentage of people who were ‘homeless’ when assessed for specialist drug treatment was observed in Western Isles (33%), followed by Grampian (16%) (NHS Board of Residence>Demographics>Accommodation status). Analysed by ADP area, individuals in Clackmannanshire reported the highest percentage living in an ‘owned or rented property’ (86%) and the lowest percentage who were ‘homeless’ (5%) when assessed for specialist dug treatment (ADP of Residence>Demographics> Accommodation status).
Legal Situation
In 2014/15, almost two-thirds (63%) of individuals assessed for specialist drug treatment were not currently subject to any legal proceedings or sanctions, while 12% were in prison and one-sixth (16%) had a case pending (Demographics>Legal situation).
Among NHS Board areas, Forth Valley (70%) had the highest percentage of individuals assessed for drug treatment with no legal proceedings or sanctions. Western Isles had the
6 ‘Other’ employment status includes school, excluded from school, long term sick / disabled, in prison and other.
7 Andrews, J.Y. & Kinner, S.A., 2012. ‘Understanding drug-related mortality in released prisoners: a review of
national coronial records’, in BMC Public Health, 12(1), p.270. Available at: http://www.biomedcentral.com/1471-2458/12/270/abstract

20
Information Services Division
lowest percentage with no legal proceedings or sanctions (52%), followed by Borders, Greater Glasgow & Clyde and Tayside (all 60%). In Fife, 15% of individuals assessed were in prison, compared to 7% in Forth Valley (NHS Board of Residence>Demographics>Legal situation).
Among ADP areas, individuals in Falkirk reported the lowest percentage of assessment in prison (5%) as well as the highest percentage of individuals not currently subject to any legal proceedings or sanctions (73%) (ADP of Residence>Demographics>Legal situation).
Co-Occurring Health Issues
In 2014/15, half of individuals (51%) assessed for specialist drug treatment reported that they had co-occurring health issues. Fifty-six per cent of individuals who reported a co-occurring health condition reported mental health issues, 52% reported drug-related physical issues and 30% reported alcohol issues (Demographics>Co-occurring health issues).
Drug Profile
All Drugs
Examining drugs reported in any of the five ‘illicit’8 drug fields within the SMR25a form provides an indication of general patterns of recent problem drug use among those assessed for specialist drug treatment. Of the 12,402 individuals recorded on SDMD in 2014/15, 70% (8,692) reported ‘illicit’ drug use in the month prior to initial assessment, with approximately half (4,382; 50%) reporting the use of heroin. Cannabis (2,764; 32%), diazepam (2,556; 29%) and cocaine (1,111; 13%) were the next most frequently reported drugs (Drug profile>All drugs and Figure 4).
In almost all NHS Board areas, heroin, cannabis and diazepam were the drugs most often reported to have been used in the month prior to assessment. Of individuals reporting recent ‘illicit’ drug use, heroin was most commonly reported in Fife (68%), compared with only 37% of individuals in Lanarkshire. Reported use of diazepam was relatively high in Western Isles (45%) and Greater Glasgow & Clyde (39%), while cannabis was recently used by up to 44% of individuals in Dumfries & Galloway (NHS Board of Residence>Drug profile>All drugs).
Across ADP areas, heroin use ranged from 18% of individuals reporting recent ‘illicit’ drug use in East Dunbartonshire to 67% in Dundee City. The ADP areas in Greater Glasgow & Clyde all reported high prevalence of recent diazepam use, with the highest overall percentage observed in Inverclyde (54%) (ADP of Residence>Drug profile>All drugs).
8 The term ‘illicit drugs’ includes (as per the SMR25a and SMR25b proforma and guidance) use of solvents,
‘novel’ or ‘new’ psychoactive substances (NPS)/legal highs or inappropriate use of ‘Over The Counter’ (OTC) medications.
21
Information Services Division
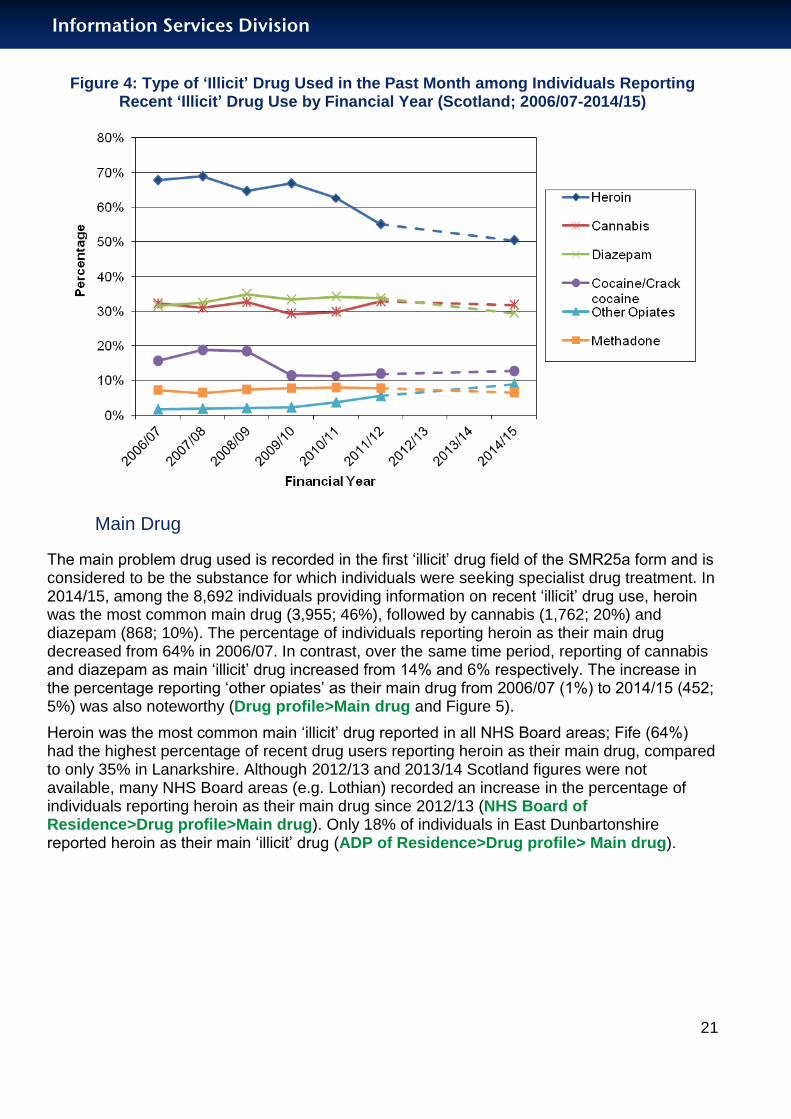
Figure 4: Type of ‘Illicit’ Drug Used in the Past Month among Individuals Reporting Recent ‘Illicit’ Drug Use by Financial Year (Scotland; 2006/07-2014/15)
Main Drug
The main problem drug used is recorded in the first ‘illicit’ drug field of the SMR25a form and is considered to be the substance for which individuals were seeking specialist drug treatment. In 2014/15, among the 8,692 individuals providing information on recent ‘illicit’ drug use, heroin was the most common main drug (3,955; 46%), followed by cannabis (1,762; 20%) and diazepam (868; 10%). The percentage of individuals reporting heroin as their main drug decreased from 64% in 2006/07. In contrast, over the same time period, reporting of cannabis and diazepam as main ‘illicit’ drug increased from 14% and 6% respectively. The increase in the percentage reporting ‘other opiates’ as their main drug from 2006/07 (1%) to 2014/15 (452; 5%) was also noteworthy (Drug profile>Main drug and Figure 5).
Heroin was the most common main ‘illicit’ drug reported in all NHS Board areas; Fife (64%) had the highest percentage of recent drug users reporting heroin as their main drug, compared to only 35% in Lanarkshire. Although 2012/13 and 2013/14 Scotland figures were not available, many NHS Board areas (e.g. Lothian) recorded an increase in the percentage of individuals reporting heroin as their main drug since 2012/13 (NHS Board of Residence>Drug profile>Main drug). Only 18% of individuals in East Dunbartonshire reported heroin as their main ‘illicit’ drug (ADP of Residence>Drug profile> Main drug).
22
Information Services Division
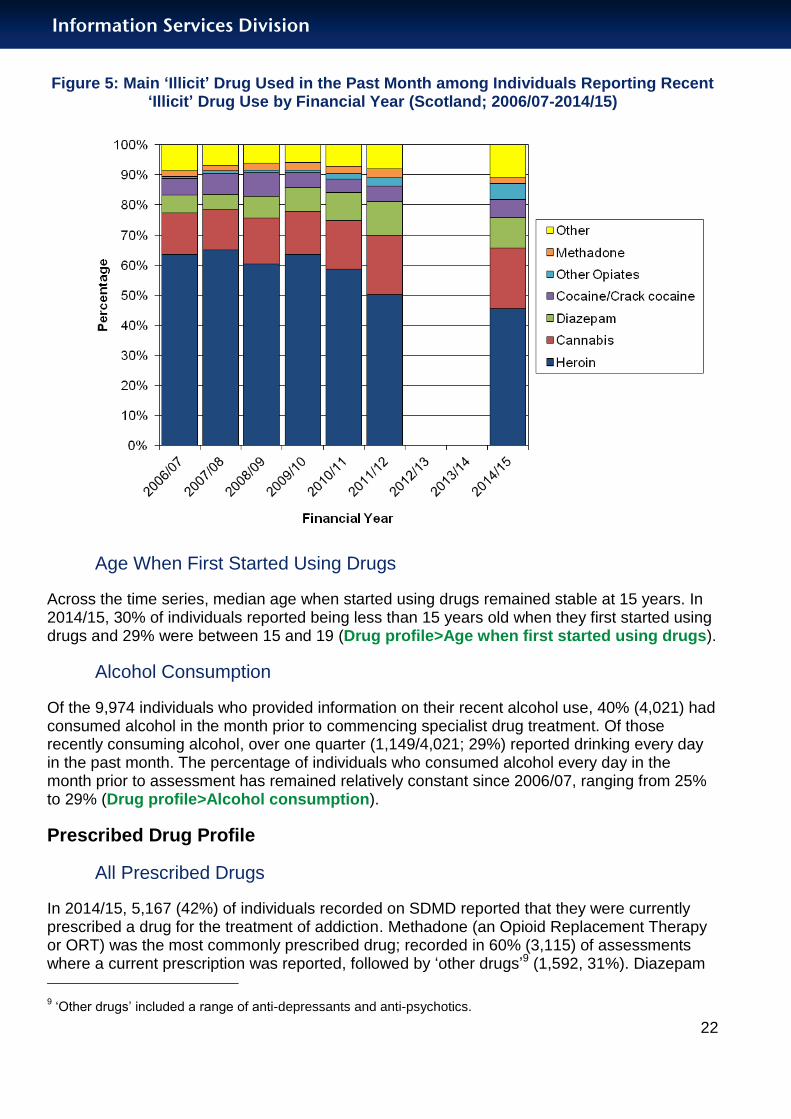
Figure 5: Main ‘Illicit’ Drug Used in the Past Month among Individuals Reporting Recent ‘Illicit’ Drug Use by Financial Year (Scotland; 2006/07-2014/15)
Age When First Started Using Drugs
Across the time series, median age when started using drugs remained stable at 15 years. In 2014/15, 30% of individuals reported being less than 15 years old when they first started using drugs and 29% were between 15 and 19 (Drug profile>Age when first started using drugs).
Alcohol Consumption
Of the 9,974 individuals who provided information on their recent alcohol use, 40% (4,021) had consumed alcohol in the month prior to commencing specialist drug treatment. Of those recently consuming alcohol, over one quarter (1,149/4,021; 29%) reported drinking every day in the past month. The percentage of individuals who consumed alcohol every day in the month prior to assessment has remained relatively constant since 2006/07, ranging from 25% to 29% (Drug profile>Alcohol consumption).
Prescribed Drug Profile
All Prescribed Drugs
In 2014/15, 5,167 (42%) of individuals recorded on SDMD reported that they were currently prescribed a drug for the treatment of addiction. Methadone (an Opioid Replacement Therapy or ORT) was the most commonly prescribed drug; recorded in 60% (3,115) of assessments where a current prescription was reported, followed by ‘other drugs’9 (1,592, 31%). Diazepam 9 ‘Other drugs’ included a range of anti-depressants and anti-psychotics.

23
Information Services Division
(often prescribed for the treatment of opiate withdrawal symptoms) was the third most commonly prescribed drug, reported by almost one-sixth (731; 14%) of individuals currently prescribed medication. ‘Other ORTs’10 were prescribed to 9% (465) of individuals where a current prescription drug was reported (Prescribed drug profile>All prescribed drugs and Figure 6).
Methadone was the most commonly prescribed drug across all NHS Board areas (with the exception of Western Isles, where ‘other drugs’ (50%) were most commonly prescribed), accounting for between 41% (Borders) and 76% (Fife and Dumfries & Galloway) of assessments where a current prescription was recorded. There were also considerable variations between NHS Board areas in the prescribing of diazepam; from 3% (Fife) to 43% (Western Isles) and 31% (Lothian) of individuals currently receiving prescribed medication (NHS Board of Residence>Prescribed drug profile>All prescribed drugs).
Methadone was the most commonly prescribed drug In 24 of the 30 ADP areas. In the remaining six ADP areas (e.g. Glasgow City: methadone (44%); ‘other drugs’ (49%)), ‘other drugs’ was the most common response among those currently prescribed medication for the treatment of addiction (ADP of Residence>Prescribed drug profile>All prescribed drugs).
Figure 6: Type of Drugs Currently Prescribed among Individuals Reporting Current Prescription by Financial Year (Scotland; 2006/07-2014/15)
10
This category includes buprenorphine (subutex), buprenorphine & naloxone (suboxone), lofexidine and naltrexone.
24
Information Services Division
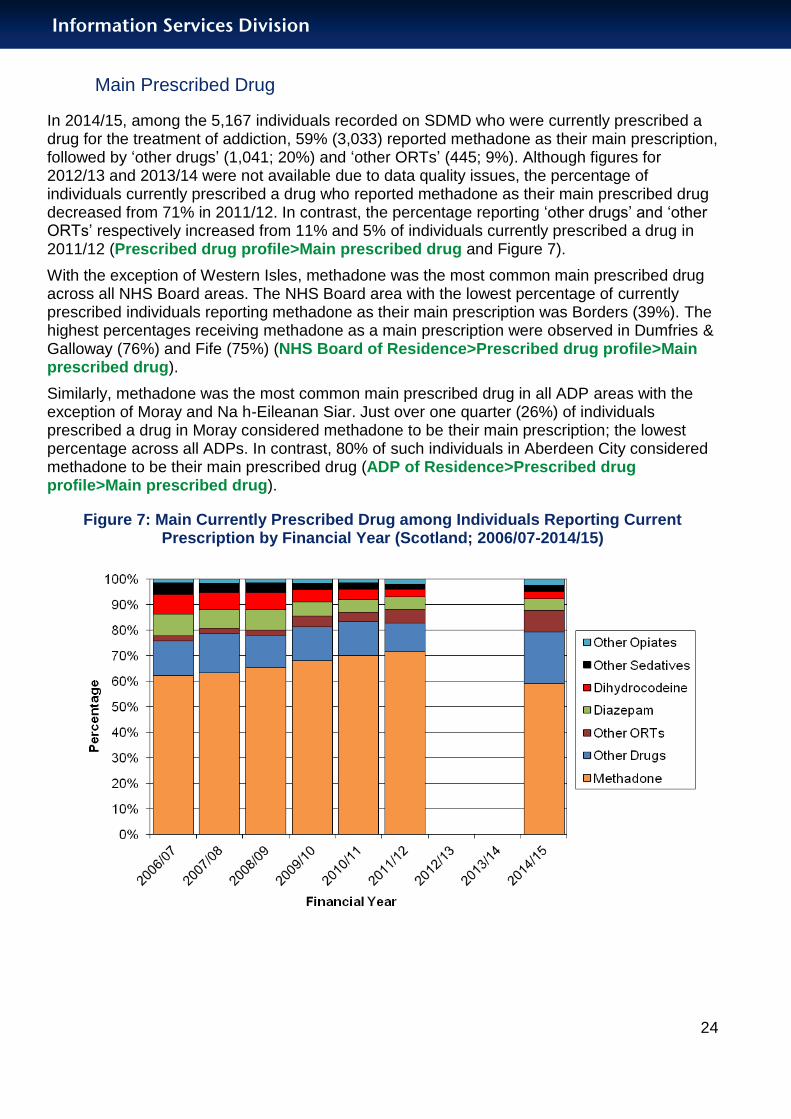
Main Prescribed Drug
In 2014/15, among the 5,167 individuals recorded on SDMD who were currently prescribed a drug for the treatment of addiction, 59% (3,033) reported methadone as their main prescription, followed by ‘other drugs’ (1,041; 20%) and ‘other ORTs’ (445; 9%). Although figures for 2012/13 and 2013/14 were not available due to data quality issues, the percentage of individuals currently prescribed a drug who reported methadone as their main prescribed drug decreased from 71% in 2011/12. In contrast, the percentage reporting ‘other drugs’ and ‘other ORTs’ respectively increased from 11% and 5% of individuals currently prescribed a drug in 2011/12 (Prescribed drug profile>Main prescribed drug and Figure 7).
With the exception of Western Isles, methadone was the most common main prescribed drug across all NHS Board areas. The NHS Board area with the lowest percentage of currently prescribed individuals reporting methadone as their main prescription was Borders (39%). The highest percentages receiving methadone as a main prescription were observed in Dumfries & Galloway (76%) and Fife (75%) (NHS Board of Residence>Prescribed drug profile>Main prescribed drug).
Similarly, methadone was the most common main prescribed drug in all ADP areas with the exception of Moray and Na h-Eileanan Siar. Just over one quarter (26%) of individuals prescribed a drug in Moray considered methadone to be their main prescription; the lowest percentage across all ADPs. In contrast, 80% of such individuals in Aberdeen City considered methadone to be their main prescribed drug (ADP of Residence>Prescribed drug profile>Main prescribed drug).
Figure 7: Main Currently Prescribed Drug among Individuals Reporting Current Prescription by Financial Year (Scotland; 2006/07-2014/15)

25
Information Services Division
Heroin Profile
Individuals aged under 25
In Scotland, reported heroin use among individuals aged under 25 years at initial assessment decreased from 58% (1,592/2,729) in 2006/07 to 23% (362/1,547) in 2014/15. As this change in reported drug use occurred during a period when the numbers of under 25s assessed for treatment also reduced, the number of under 25s reporting heroin use decreased markedly (Heroin profile>Individuals aged under 25 and Figure 8).
There was wide variation across NHS Board areas in reported heroin use among under 25s; in Lanarkshire, 15% of individuals under 25 reported using heroin, while in Borders 59% of under 25s assessed were heroin users (NHS Board of Residence>Heroin profile> Individuals aged under 25). Only 6% of under 25s assessed in the Clackmannanshire ADP area were recorded as using heroin (ADP of Residence>Heroin profile> Individuals aged under 25).
Figure 8: Percentage of Individuals Aged Under 25 and 35 and Over Reporting Recent Heroin Use by Financial Year (Scotland; 2006/07-2014/15)
Individuals aged 35 and over
There was a decrease in the percentage of older drug users (i.e. those aged 35 and over) reporting recent heroin use from 67% in 2006/07 (1,755/2,620) to 58% in 2014/15 (2,263/3,916). This was accompanied by an increase in the number of older drug users recorded on SDMD. Therefore, the total number of older drug users reporting heroin use increased over the time series (Heroin profile>Individuals aged 35 and over and Figure 8).
Among NHS Board areas, Lanarkshire had the lowest percentage (48%) of individuals aged 35 and over reporting heroin use, while the highest was observed in Tayside (74%) (NHS Board of Residence>Heroin profile>Individuals aged 35 and over).

26
Information Services Division
Two of the ADP areas which comprise NHS Tayside (Perth & Kinross and Dundee City) reported the highest percentages of heroin use among individuals aged 35 and over (79% and 74% respectively). East Dunbartonshire and South Ayrshire reported the lowest (28% and 47% respectively) (ADP of Residence>Heroin profile>Individuals aged 35 and over).
Route of Use of Heroin
In 2014/15, 47% (2,053/4,380) of individuals who had used heroin in the month prior to assessment reported injecting the drug. While the number of individuals reporting recent heroin use decreased, the percentage injecting changed little over the time series (50% reported recent injecting in 2006/07) (Heroin profile>Route of use of heroin and Figure 9).
By NHS Board area, the lowest percentage (35%) of injectors was recorded in Greater Glasgow & Clyde, while in Borders 62% of individuals who had used heroin in the month prior to assessment did so by injecting. However, in many of the NHS Board areas, the percentage of heroin users reporting recent injecting changed little since 2011/12 (NHS Board of Residence>Heroin profile>Route of use of heroin).
Among ADP areas, North Ayrshire (29%) reported the lowest percentage of recent injecting heroin use and Borders reported the highest percentage (62%) (ADP of Residence>Heroin profile>Route of use of heroin).
Figure 9: Route of Heroin Use among Recent Heroin Users by Financial Year (Scotland; 2006/07-2014/15)
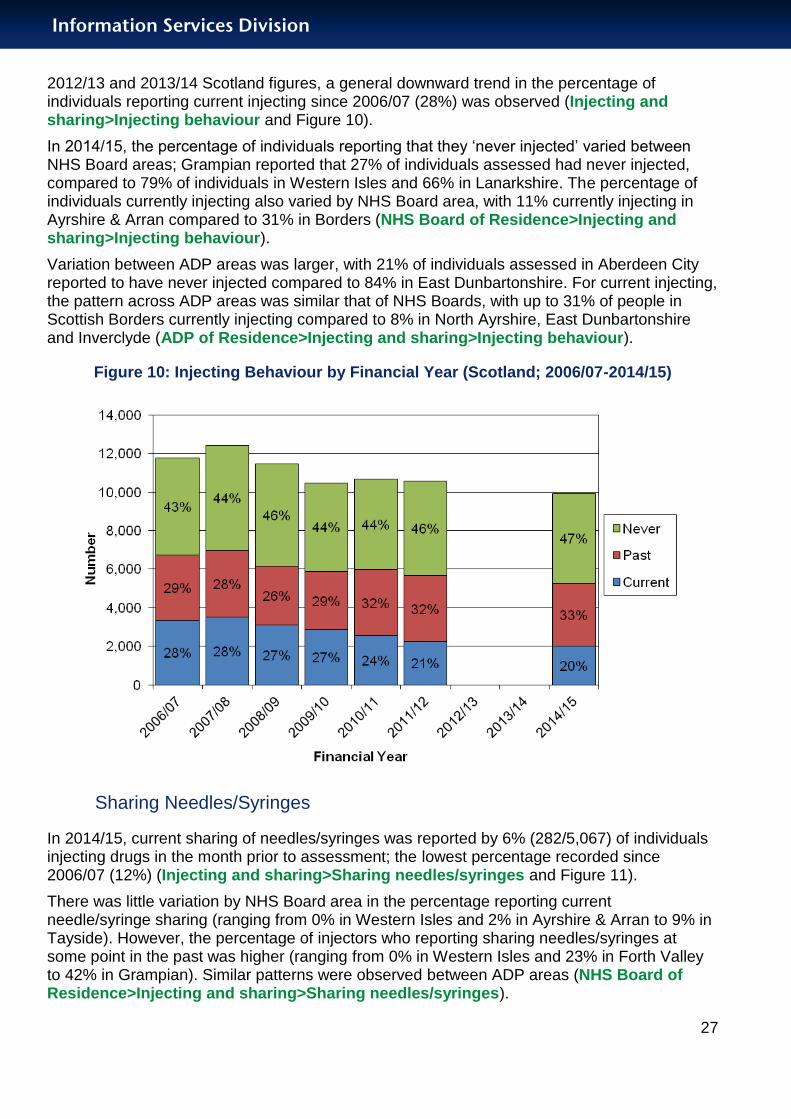
Injecting and Sharing
Injecting Behaviour
Eighty per cent (9,913) of individuals recorded on SDMD provided information on injecting behaviour. Of those, 20% (2,010) currently injected drugs, 33% (3,265) stated they had done so in the past, while 47% (4,638) had never injected drugs. Despite the unavailability of
27
Information Services Division
2012/13 and 2013/14 Scotland figures, a general downward trend in the percentage of individuals reporting current injecting since 2006/07 (28%) was observed (Injecting and sharing>Injecting behaviour and Figure 10).
In 2014/15, the percentage of individuals reporting that they ‘never injected’ varied between NHS Board areas; Grampian reported that 27% of individuals assessed had never injected, compared to 79% of individuals in Western Isles and 66% in Lanarkshire. The percentage of individuals currently injecting also varied by NHS Board area, with 11% currently injecting in Ayrshire & Arran compared to 31% in Borders (NHS Board of Residence>Injecting and sharing>Injecting behaviour).
Variation between ADP areas was larger, with 21% of individuals assessed in Aberdeen City reported to have never injected compared to 84% in East Dunbartonshire. For current injecting, the pattern across ADP areas was similar that of NHS Boards, with up to 31% of people in Scottish Borders currently injecting compared to 8% in North Ayrshire, East Dunbartonshire and Inverclyde (ADP of Residence>Injecting and sharing>Injecting behaviour).
Figure 10: Injecting Behaviour by Financial Year (Scotland; 2006/07-2014/15)
Sharing Needles/Syringes
In 2014/15, current sharing of needles/syringes was reported by 6% (282/5,067) of individuals injecting drugs in the month prior to assessment; the lowest percentage recorded since 2006/07 (12%) (Injecting and sharing>Sharing needles/syringes and Figure 11).
There was little variation by NHS Board area in the percentage reporting current needle/syringe sharing (ranging from 0% in Western Isles and 2% in Ayrshire & Arran to 9% in Tayside). However, the percentage of injectors who reporting sharing needles/syringes at some point in the past was higher (ranging from 0% in Western Isles and 23% in Forth Valley to 42% in Grampian). Similar patterns were observed between ADP areas (NHS Board of Residence>Injecting and sharing>Sharing needles/syringes).

28
Information Services Division
Figure 11: Sharing Needles/Syringes by Financial Year (Scotland; 2006/07-2014/15)
Figure 12: Sharing Paraphernalia by Financial Year (Scotland; 2006/07-2014/15)
29
Information Services Division
Sharing Paraphernalia
In 2014/15, current sharing of paraphernalia was reported by 8% (387/4,622) of individuals injecting drugs in the month prior to assessment; the lowest percentage recorded since 2006/07 (20%) (Injecting and sharing>Sharing paraphernalia and Figure 12).
Analysed by NHS Board area, reported sharing of paraphernalia among injectors was highest in Tayside (12%) and lowest in Western Isles (0%), Fife and Greater Glasgow & Clyde (both 5%). Similar to sharing needles/syringes, the percentage of injectors sharing paraphernalia at some point in the past was higher (ranging from 0% in Western Isles and 31% in Borders to 55% in Grampian) (NHS Board of Residence>Injecting and sharing>Sharing paraphernalia).
Blood Borne Virus (BBV) Testing
The risk of contracting Blood Borne Viruses (BBVs) is higher amongst people who inject drugs than in other populations11. In Scotland, among the 5,275 individuals who had reported previous injecting, information was available on whether individuals were tested for Hepatitis B, Hepatitis C and HIV in 89%, 89%, and 88% of cases respectively. Previous testing for Hepatitis B, Hepatitis C and HIV was reported by 76% (4,011), 77% (4,084) and 74% (3,896) of individuals respectively (Injecting and sharing>Blood Borne Virus (BBV) testing).
11
WHO (2012) Guidance on Prevention of viral Hepatitis B and C among People who inject Drugs [online], Available at: http://apps.who.int/iris/bitstream/10665/75357/1/9789241504041_eng.pdf?ua=1
30
Information Services Division
Glossary
ADP Alcohol and Drug Partnership
BBV Blood Borne Virus
CoSLA Convention of Scottish Local Authorities
DATWT Drugs and Alcohol Treatment Waiting Times database
EASR European Age-Sex Standardised Rate; the rate that would have been found if the population in Scotland had the same age-composition as the hypothetical standard European population.
HEAT Health Improvement, Efficiency, Access and Treatment
ISD Information Services Division
LDP Local Delivery Plan
ORT Opioid Replacement Therapy
SDMD Scottish Drug Misuse Database

31
Information Services Division
List of Tables
Table No. Name Time period File & size
Scottish Drug Misuse Database dashboard 2006/07 to 2014/15
N/A
32
Information Services Division
Contact
Lee Barnsdale Principal Information Analyst [email protected] 0131 275 6055
Joanna Targosz Senior Information Analyst [email protected] 0131 275 6667
Further Information
Information on the Scottish Drug Misuse Database is available at: http://www.isdscotland.org/Health-Topics/Drugs-and-Alcohol-Misuse/Drugs-Misuse/Scottish-Drug-Misuse-Database/.
If you would like further information please contact the Health Improvement Team at [email protected]
Rate this Publication
Please provide feedback on this publication to help us improve our services.
33
Information Services Division
Appendices
A1 – Background Information
Policy Context
The Scottish Drug Misuse Database (SDMD) is an important and widely used national information source on the misuse of drugs in Scotland. Amongst the aims of the database are to support services, Alcohol and Drug Partnerships (ADPs), the NHS and the Scottish Government by:
monitoring problem drug use;
collecting social and demographic information about individuals presenting to services for assessment of their drug use and treatment/care needs;
helping to identify, or confirm, trends in drug use at a national and local level;
informing discussions about service provision and service design; and,
providing data for ADPs to help them take forward local strategies.
The database, established in 1990, holds information on demographic and behavioural characteristics of individuals who have had a specialist assessment of their drug use treatment and care needs by specialist drug services (provided by statutory and non-statutory services across a range of settings) and some medical services (general practice, hospital etc.). Specialist services providing tier 3 and 4 interventions within local authorities, NHS, prisons and the third sector are all expected to submit data to the SDMD.
Scotland's national drugs strategy The Road to Recovery: A New Approach to Tackling Scotland's Drug Problem, launched in May 2008, highlighted the need for ‘evidence informed drugs policy and practice’ and, as part of this, ‘improving data on the drug misusing population’. The strategy’s Action Plan included the following ‘key action’: to ‘Work with Information Statistics Division (ISD) to deliver (by April 2008) an enhanced Scottish Drug Misuse Database (SDMD) to improve outcome data on a person’s journey through treatment’ thus providing better outcome data to inform policy and practice.
The SDMD was developed by ISD to allow the collection of information on individuals throughout their treatment pathway (i.e. not only at initial assessment). From April 2008, ISD began to introduce an enhanced, web-based, SDMD Follow-up Reporting System. The expanded database offered the potential to collect information on substance misuse and the wider social circumstances that may underpin recovery throughout the course of treatment, forming a valuable source of information on the outcomes of drug treatment for services, ADPs and the Government in Scotland.
The Drugs Strategy Delivery Commission (DSDC) was established in 2009 to monitor and assess the delivery of the Road to Recovery. In 2013, the DSDC published the Independent Expert Review Of Opioid Replacement Therapies In Scotland which stated that Scotland requires a new coordinated national approach to develop the relevant evidence base to support a better understanding of the natural history of substance use problems and the delivery of improved treatment and recovery outcomes. Systematic collection and management of routine data from services should be the foundation for this work. Reflecting these aims, ISD have been commissioned by Scottish Government to develop an integrated drug and alcohol information system which will amalgamate the existing functions of the SDMD, Drug & Alcohol Treatment Waiting Times database (DATWT) and gather additional
34
Information Services Division
information on alcohol treatment outcomes (see Drug and Alcohol Information System (DAISy) below).
A joint decision was taken in November 2014 by the Scottish Government, members of the DSDC and relevant stakeholders that the original work of the DSDC had been concluded. Since then, the Scottish Government has worked closely with key stakeholders to develop the new Partnership for Action on Drugs in Scotland (PADS) group which was officially launched at its first meeting in January 2016. The PADS group has been set up to reduce problem drug use and complement the work of the established Road to Recovery strategy. The group brings together leaders from the fields of addiction, mental health, inequality, social work and health and social care, and will help lead and focus the sector on three priorities:
building communities focused on recovery and tackling stigma;
quality and consistency of service planning and delivery; and,
harm reduction and reducing drug-related deaths.
SDMD Data Collection
The SDMD, managed by ISD Scotland, was set up in 1990 to collect information about people with drug problems, based on data obtained when individuals first made contact with services (or reinitiated contact following a gap of at least six months since last attendance). In April 2006, ISD introduced the SMR25a assessment form to replace the SMR24 form which had been in use since 2001. The revised form reflected the need for more detailed information on individuals who presented for treatment. The new dataset incorporated most of the information that was collected using SMR24 but also included new information, including blood borne virus testing information, information on dependent children and alcohol profile. The SMR25a form contains both mandatory and non-mandatory data items and is completed at the beginning of an individual’s episode of care.
There have been a number of changes in data collection methods between SMR24 and SMR25a. This means that information from the SDMD for the financial year 2006/07 onwards are not directly comparable with previously published analysis of data collected using SMR24 forms. Therefore, this report only describes trends from 2006/07 onwards.
Since April 2009, all services which supply data to the SDMD have transferred from paper to electronic proforma, using the web-based data collection system or other local systems (with the exception of General Practitioners (GPs), who continue to complete paper forms12). Using this system, data are collected at the following points throughout an individual’s course of treatment:
Initial assessment (SMR25a proforma): http://www.isdscotland.org/Health-Topics/Drugs-and-Alcohol-Misuse/Docs/smr25A.pdf
12 week follow-up (SMR25b proforma): http://www.isdscotland.org/Health-Topics/Drugs-and-Alcohol-Misuse/Docs/smr25B.pdf
Annual follow-up (SMR25b)
Ad-hoc follow-up (SMR25b)
Discharge from service (SMR25a or SMR25b)
Transfer or referral from service (SMR25b)
12
GP data are not included in the analysis within this publication.

35
Information Services Division
There are two possible methods of submitting data to the SDMD, both of which use a secure internet connection. The first is an online form. Service providers log onto the SDMD application and submit data directly to ISD via a web form. The second is a file upload facility within the application. This allows a local system administrator to log onto the application and submit a batch file of data from their local system directly to ISD, at given points in time.
Drug and Alcohol Information System (DAISy)
ISD were commissioned in 2011 by the Scottish Government to develop a database that would collect and report on Alcohol Treatment Outcomes (ATO) to provide valuable information on those entering specialist alcohol treatment services, their journey through them and their related outcomes. After some careful consideration, it was agreed to expand the remit to investigate the feasibility of developing a single system that would cover SDMD (SMR 25a/b), DATWT as well as the ATO data. By developing a single system it is hoped that the amount of data entry required by ADPs and Specialist Services will reduce and go some way to ensure data quality and completeness can be managed more effectively.
The aim of this project is to support the care of clients accessing and receiving specialist drug and alcohol treatment through improved service planning and design, informed by improved information and data collection. This aim will be met by achieving the following objectives:
Build a data collection system to collect drug and alcohol treatment and outcome data from those delivering specialist drug and alcohol interventions.
Develop and deliver training and guidance materials.
Develop analytical and reporting mechanisms for the information collected.
Support ISD’s active engagement with ADPs by giving them an opportunity to shape this project as key stakeholders and demonstrate a pro-active response to their needs.
Support local and national decision making for planning and delivering specialist drug and alcohol services.
For further information about DAISy, please go to http://www.isdscotland.org/Health-Topics/Drugs-and-Alcohol-Misuse/Drug-Alcohol-Information-System/
Acknowledgements
The co-operation and assistance of the staff at all services contributing to the database and individuals who consent to their data being reported are gratefully acknowledged.
36
Information Services Division
A2 – Data Quality
The publication in January 2015 of the UK Statistics Authority’s (UKSA) Guidelines on Administrative Data Quality Assurance further emphasised the need to critically appraise the representativeness and reliability of SDMD data. Section 1 of this report reflects this requirement.
Positive relationships between data suppliers and producers and robust data quality assurance are crucial in ensuring the data quality and completeness of the Scottish Drug Misuse Database (SDMD). As SDMD data are used in drug prevalence estimates, Scottish Public Health Observatory (ScotPHO) profiles, Alcohol and Drug Partnership (ADP) annual reports etc such issues may have a wide impact for a range of data users. These aspects of the SDMD data collection process therefore need to be documented in order to fully understand SDMD data and assess the likelihood and impact of inaccurate reporting. In addition to working closely with the specific areas highlighted above, the ISD Data Management team routinely provide the following surveillance reports to data suppliers.
SMR25a/b Submission by Service Report (Quarterly): o Data presented at service and ADP level, illustrating breakdown of SMR25a and
SMR25b submissions. o Report also illustrates the compliance level in terms of ‘expected 12-week’ scheduled
reviews (SMR25b), and provides a benchmark against the number of unscheduled reviews, including those made for the purposes of referral, transfer or discharge.
o The aim of this report is to provide an ongoing measure of submissions for initial assessments and compliance with scheduled follow-ups. The additional measures are provided alongside a commentary to give further insight to ADPs/Services, where expected levels of submissions are not being met.
SMR25a Initial Assessment – 12 Week Follow-up Report (Quarterly): o This report is sent alongside the report above, and provides a service-level breakdown
of the level of 12-week SMR25b completed at various time points, from 0 to 24 weeks following initial assessment.
o The report also provides the number of follow-ups being completed before initial assessment, where the date of review has been entered as being before the date of assessment, which aims to illustrate data quality issues.
o The data is presented separately for scheduled and unscheduled reviews, which aims to illustrate where unscheduled reviews are being submitted in place of scheduled reviews.
SMR25a Data Completeness (Monthly): o This report provides a measure of compliance with the key areas of the SMR25a
dataset, for all service providers o The report primarily considers the main data items that are required for the annual
SDMD publication, and illustrates the % completeness at service level for each data item. This is based on whether the user enters a valid variable for each data item or leaves a field blank, and highlights patterns of this missing data.
o The report provides a ‘best-case’ scenario, as there may be further data quality issues that are difficult to identify the cause for due to the nature of the dataset. For example, a user may erroneously choose an invalid field for one data item based on other information recorded.
o The report provides a clear ‘red’, ‘amber’, ‘green’ rating, based on the level of missing data for each service which helps to identify trends.
37
Information Services Division
SMR25a Unsubmitted Records (Monthly): o This report provides a service-level breakdown of unsubmitted SMR25a records held on
SDMD on a monthly basis, including individual record identifiers (episode of care numbers).
o Services are expected to submit these saved records, or remove them from the system. o The aim of this report is to prevent the accumulation of saved records on the database,
and to highlight where services may be duplicating data collection/entry.
These routine surveillance reports aim to provide NHS Boards/ADPs with information about the quality and completeness of all records submitted to SDMD. However, as previously stated, this report presents information relating to individuals13 with problem drug use so that the circumstances and needs of those individuals can be more accurately described. Therefore, the information provided to ADPs in these routine surveillance reports differs from the individual-level analyses of data quality and completeness included in Section 1 and Table A2.1 of this report.
Issues specific to NHS Boards
Data Submission Issues
Rather than inputting directly into the national SDMD database, some ADPs capture information from drug treatment assessments using local data collection systems. ISD provides a validated SDMD data upload facility for data extracted from local systems. However, problems with local data collection systems in two NHS Boards prevented publication of comprehensive national data for 2012/13 or 2013/14.
Glasgow City ADP
During 2012/13, Glasgow City ADP undertook a project to transfer their Community Addiction Teams (CATs) to a new IT platform. The aim of this project was to ensure that all CATs submitted SMR25a records directly to SDMD via electronic file upload from a single system (Carefirst). However, although all CATs were transferred to Carefirst by April 2013, the monthly data upload process was not implemented until September 2015 and there continue to be issues with compliance to the file upload specification for SDMD.
In 2012/13, Glasgow City ADP manually produced a data file of Carefirst data by the agreed deadline, however this did not conform to the agreed SDMD file upload specification and there were issues with the data quality and completeness of a range of data items. It was therefore not possible to validate these data or to upload them into the SDMD dataset in a manner consistent with other data submissions. In 2013/14, Glasgow City ADP produced a data file, but data suppliers were unable to provide detailed information about the completeness of SDMD data. On this basis, a decision was taken to exclude NHS Greater Glasgow & Clyde 2013/14 data from the electronic dashboard published in June 2015.
As 52% of individuals from NHS Greater Glasgow & Clyde who were assessed for specialist drug treatment in years 2009/10 to 2011/12 were resident in the Glasgow City ADP area, it was necessary to exclude 2012/13 and 2013/14 NHS Greater Glasgow & Clyde data from relevant reports. Furthermore, as NHS Greater Glasgow & Clyde residents accounted for 25% of all individuals assessed for specialist drug treatment in Scotland in years 2009/10 to 2011/12, it was not possible to include overall Scotland level figures in those reports.
13
Some individuals will have had more than one initial assessment during 2014/15, however, only their first recorded initial assessment during the time period is counted and analysed in this report.

38
Information Services Division
During 2014/15, Glasgow City ADP successfully finalised phase one development of their local IT infrastructure to enable them to electronically upload SMR25a’s to SDMD. This was completed in September 2015, with the successful upload of 2014/15 initial assessment data. Work on phase two of the development (to electronically upload SMR25b’s) has now commenced and is currently being tested. Regular communications between Glasgow City ADP and ISD have continued throughout this process.
NHS Tayside
In 2012/13, following routine data quality/completeness analysis, issues with poor quality and completeness levels across a range of data items were identified in NHS Tayside. A wide range of SDMD data items were not extracted nor sent to ISD due to technical issues with the file upload process associated with the local IT system (MIDIS) used by one Tayside specialist service. As this service operates in each of the Tayside ADPs (Angus ADP, Dundee City ADP, Perth & Kinross ADP) it was necessary to exclude NHS Tayside data from the majority of the 2012/13 report.
Despite collaborative work between NHS Tayside and ISD to improve data quality and completeness, NHS Tayside advised that 2013/14 data was not suitable for publication due to outstanding issues with data completeness. NHS Tayside residents accounted for 7% of all individuals assessed for specialist drug treatment in Scotland in years 2009/10 to 2011/12.
In 2014/15, NHS Tayside undertook a project to clean-up all SDMD data, including the removal of duplicate entries. This project brought their local data in line with the national average for completeness and compliance. Regular communications between NHS Tayside and ISD have continued throughout this process and work continues to increase compliance and address the local practices for delivering these data.
Data Collection Issues
NHS Forth Valley
ISD Data Management worked closely with ADPs and service providers aligned to NHS Forth Valley with the aim of improving the data item completeness for SMR25a records. This work involved service providers supplying additional assessment information that had been captured locally but not previously submitted to the national SDMD database and ISD facilitated the amendment of this data in the database.

39
Information Services Division
Table A2.1: SDMD and DATWT Data Completeness by Area of Treatment (numbers of individuals; 2014/15)
Number of individuals
SDMD (Initial Assessments)
DATWT (Drug Waits)
% SDMD Completeness
Scotland 11,135 15,451 72%
NHS Ayrshire & Arran 1,049 1,124 93%
Ayrshire East ADP 386 416 93%
Ayrshire North ADP 397 407 98%
Ayrshire South ADP 272 301 90%
NHS Borders (ADP) 128 169 76%
NHS Dumfries & Galloway (ADP) 323 411 79%
NHS Fife (ADP) 1,003 1,464 69%
NHS Forth Valley 754 632 119%
Clackmannanshire ADP 389 365 107%
Falkirk ADP 187 105 178%
Stirling ADP 204 162 126%
NHS Grampian 1,044 1,183 88%
Aberdeen City ADP 669 616 109%
Aberdeenshire ADP 307 478 64%
Moray ADP 70 89 79%
NHS Greater Glasgow & Clyde 2,744 3,976 69%
Dunbartonshire East ADP 78 119 66%
Dunbartonshire West ADP 341 424 80%
Glasgow City ADP* 1,796 2,747 65%
Inverclyde ADP 156 204 76%
Renfrewshire ADP 354 409 87%
Renfrewshire East ADP 39 73 53%
NHS Highland 258 539 48%
Argyll & Bute ADP 46 116 40%
Highland ADP 212 423 50%
NHS Lanarkshire (ADP) 1,110 1,802 62%
NHS Lothian 2,013 2,820 71%
Edinburgh City ADP 1,158 1,824 63%
Lothian Mid & East ADP 325 477 68%
Lothian West ADP 553 519 107%
NHS Orkney Islands (ADP) * * 15%
NHS Shetland Islands (ADP) 21 42 50%
NHS Tayside 721 1,249 58%
Angus ADP 159 285 56%
Dundee City ADP 367 669 55%
Perth & Kinross ADP 199 295 67%
NHS Western Isles (Na h-Eileanan Siar ADP) 22 27 81% Note: * Suppressed due to small numbers.

40
Information Services Division
A3 – Publication Metadata (including revisions details)
Metadata Indicator Description
Publication title Scottish Drug Misuse Database - Overview of Initial Assessments for Specialist Drug Treatment 2014/15
Description This publication presents the latest available information on initial assessments for specialist drug treatment recorded in the Scottish Drug Misuse Database (SDMD). Information is presented for Scotland and by NHS Board/Alcohol and Drug Partnerhsip (ADP) of Residence.
Theme Health and Social Care
Topic Substance Misuse
Format PDF report with electronic dashboard
Data source(s) Scottish Drug Misuse Database (SDMD), Drug and Alcohol Treatment Waiting Times database (DATWT)
Date that data are acquired Extracted November 2015
Release date Tuesday 17 May 2016
Frequency Annual
Timeframe of data and timeliness
Data published up to 31 March 2015
Continuity of data See Section 1 and Appendices A1 and A2.
Revisions statement Data from the most recent year is considered provisional and subject to revision in future publications.
Data are subject to routine quality assurance checks and may be revised periodically to improve accuracy.
Revisions relevant to this publication
Concepts and definitions Guidance on definitions for SDMD is available at: http://www.isdscotland.org/Health-Topics/Drugs-and-Alcohol-Misuse/Drugs-Misuse/Scottish-Drug-Misuse-Database/.
Relevance and key uses of the statistics
Relevant to understanding problem drug use in Scotland. Statistics will be used for policy making and service planning.
Accuracy Quality checks are conducted by ISD. Figures are compared to previously published data and expected trends.
Completeness It is not mandatory for individuals to provide their information in the collection of data through SDMD.
Data quality & completeness issues are described in Section 1. See Appendix A2 for further information.
Comparability Data quality & completeness issues are described in
41
Information Services Division
Section 1. See Appendix A2 for further information.
Accessibility It is the policy of ISD Scotland to make its web sites and products accessible according to published guidelines.
Coherence and clarity The report is available as a PDF file with relevant dashboard content clearly highlighted for ease of use.
Value type and unit of measurement
Numbers and percentages.
Disclosure The ISD protocol on Statistical Disclosure Protocol was followed.
Official Statistics designation National Statistics
UK Statistics Authority Assessment
National Statistics
Last published 24 June 2014
Next published Winter 2016/17
Date of first publication 1998
Help email [email protected]
Date form completed 12 May 2016

42
Information Services Division
A4 – Early Access Details (including Pre-Release Access)
Pre-Release Access
Under terms of the "Pre-Release Access to Official Statistics (Scotland) Order 2008", ISD are obliged to publish information on those receiving Pre-Release Access ("Pre-Release Access" refers to statistics in their final form prior to publication). The standard maximum Pre-Release Access is five working days. Shown below are details of those receiving standard Pre-Release Access.
Standard Pre-Release Access:
Scottish Government Health Department
NHS Board Chief Executives
NHS Board Communication leads

43
Information Services Division
A5 – ISD and Official Statistics
About ISD
Scotland has some of the best health service data in the world combining high quality, consistency, national coverage and the ability to link data to allow patient based analysis and follow up.
Information Services Division (ISD) is a business operating unit of NHS National Services Scotland and has been in existence for over 40 years. We are an essential support service to NHSScotland and the Scottish Government and others, responsive to the needs of NHSScotland as the delivery of health and social care evolves.
Purpose: To deliver effective national and specialist intelligence services to improve the health and wellbeing of people in Scotland.
Mission: Better Information, Better Decisions, Better Health
Vision: To be a valued partner in improving health and wellbeing in Scotland by providing a world class intelligence service.
Official Statistics
Information Services Division (ISD) is the principal and authoritative source of statistics on health and care services in Scotland. ISD is designated by legislation as a producer of ‘Official Statistics’. Our official statistics publications are produced to a high professional standard and comply with the Code of Practice for Official Statistics. The Code of Practice is produced and monitored by the UK Statistics Authority which is independent of Government. Under the Code of Practice, the format, content and timing of statistics publications are the responsibility of professional staff working within ISD.
ISD’s statistical publications are currently classified as one of the following:
National Statistics (ie assessed by the UK Statistics Authority as complying with the Code of Practice)
National Statistics (ie legacy, still to be assessed by the UK Statistics Authority)
Official Statistics (ie still to be assessed by the UK Statistics Authority)
other (not Official Statistics)
Further information on ISD’s statistics, including compliance with the Code of Practice for Official Statistics, and on the UK Statistics Authority, is available on the ISD website.
The United Kingdom Statistics Authority has designated these statistics as National Statistics, in accordance with the Statistics and Registration Service Act 2007 and signifying compliance with the Code of Practice for Official Statistics. Designation can be broadly interpreted to mean that the statistics:
meet identified user needs;
are well explained and readily accessible;
are produced according to sound methods, and
are managed impartially and objectively in the public interest.
Once statistics have been designated as National Statistics it is a statutory requirement that the Code of Practice shall continue to be observed.