Scotland s Councillors 2013 - Improvement Service Survey... · 2013 2 This report presents the...
33
Scotland’s Councillors 2013 Research Report
Transcript of Scotland s Councillors 2013 - Improvement Service Survey... · 2013 2 This report presents the...

Scotland’s Councillors 2013Research Report
Scotland’s Councillors 2013Research Report
2
This report presents the findings of a survey of all councillors in Scotland. Rather than undertake the survey immediately following the May 2012 local elections, we issued the survey in April 2013 in order that we could also get feedback from councillors on their induction to their role.
The main aim of the survey was to develop a comprehensive picture of Scottish councillors, including gender, age, educational level, employment status, household income and caring responsibilities. In addition, the survey explored wider issues such as why the councillors stood for election, their training and development experiences and their views on policy priorities. This survey was similar, but not identical, to surveys of newly elected and re-elected councillors carried out in 1999 and 2003 by COSLA and the then Scottish Executive, and in 2007 by the Improvement Service.
This was the first time the survey was undertaken online, which has had an impact on the response rate. 26.2% of councillors responded to the survey, compared to 61.8% in 2007. Due to this difference in response rates, and the differing age and gender profile of the respondees to that of Scottish councillors as a whole, no direct comparison can be made with the 2007 survey results.
The response rate that we received is not unusual for an online survey, especially given the age profile of the audience. We issued the survey by sending an email to each councillor explaining why we were undertaking the survey, what was involved and providing them with a direct link. An important lesson we have noted for future online surveys is that rather than issue automated reminder emails from the online survey tool to those who have not completed the survey, we will consider sending a personalised email to each councillor who has not completed the survey, asking them to complete it and offering them the option of requesting a paper survey. Evidence shows that this approach could markedly increase the response rate.
There are several benefits to online surveys, including low cost, ease of implementation and built-in features that enable the data analysis to be undertaken automatically rather than manually. For that reason, combined with the desire to continue to engage with councillors in innovative ways, we will continue to use online surveys when seeking councillors’ views on issues and we will learn from this experience to improve the response rate.
Key findingsThe average councillor who responded to the survey is white, married or in a same sex civil partnership, aged 60-69, home-owning, well educated male drawn from professional or senior managerial occupations.
Age• 73.5% of the councillors that responded are aged 50 or over.• Fewer than 10% of the councillors are under the age of 40.
Executive Summary

Scotland’s Councillors 2013 Research Report
3
Gender • 69.6% of councillors who responded to the survey were male and 30.4% were
female.• Female councillors are over-represented in this survey as only 24.3% of
councillors elected in 2012 were female (Denver, Bochel and Steven, 2012).• There is a gender imbalance amongst councillors as females represent 51.5%
(Scotland’s Census, 2011) of the Scottish population yet accounted for only 24.3% of councillors after the 2012 election.
Ethnicity• 96.6% of councillors responding to the survey said their ethnic group was
‘White’, which is very similar to the Scottish population (96%) (Scotland’s Census, 2011).
• 1.3% of the councillors that responded are Asian/Asian Scottish/Asian British which is less than half the Scottish demographic (2.7%) (Scotland’s Census, 2011).
Religion• 54.4% of councillors claim they belong to a religious denomination or body
which is almost proportional to the general Scottish population (56.4%) (Scotland’s Census, 2011).
Marital Status• 72.3% of the councillors responding to the survey were married or in a same
sex civil partnership, compared to 45.4% of the general Scottish population (Scotland’s Census, 2011).
Education• 50.3% of councillors said their highest level of qualification is a degree or
professional qualification. Although not directly comparable, the figure for the Scottish population aged 16-64 is 27% (Scotland’s People Annual Report: Results from the 2011 Scottish Household Survey).
Occupation• 40.8% of councillors who responded were currently in paid employment or self-
employed in addition to their councillor duties. Of these, 25.4% were full-time employees, 44.4% worked part-time and 30.2% were self-employed.
• It is clear from the responses that the role of councillor attracts citizens from specific occupational backgrounds (professional and managerial) and is much less attractive to clerical or manual workers.
Income and Housing Tenure• 37.3% of councillors who responded have gross household income in excess of
£36,400 whilst 13.7% of councillors have gross household income below £10,399 (excluding councillor remuneration or expenses).
Scotland’s Councillors 2013Research Report
4
• 85.6% of councillors who responded own their main residence outright or with a mortgage compared to 62% of the Scottish population (Scotland’s Census, 2011).
Councillors’ Responsibilities• 29.5% of councillors in paid employment (excluding self-employment) were
granted some paid leave to undertake their council duties. A further 30.6% were permitted time off for council business without pay.
• The average number of hours councillors spend on Council business is 36 hours per week.
• 40.8% of councillors have paid employment outside of their councillor duties and spend an average of 25 hours per week working in their paid employment.
• Councillors with no additional employment spend on average 39 hours per week on Council business while councillors who have additional employment spend on average 31 hours per week.
Health and Caring Responsibilities• 88.9% of councillors rated their health as being either ‘Good’ or ‘Very Good’.• 13.6% of councillors who responded provide help or care on a regular basis for
someone who is sick, disabled or elderly. 64.3% who are carers are looking after their parents or in-laws.
• 20.7% of councillors who responded live with, or have responsibility for, children up to the age of sixteen. 58.1% of these have had to make special childcare arrangements to enable them to carry out their council business.
Elections • The main reasons councillors stood for election to local government were
‘interest in the community’ (89.5%), ‘to improve services and/or local area (84.1%), ‘duty/public service’ (69.5%) and ‘to make changes to the council/the way the council is run’ (62.5%).
• 52.1% of councillors stood for election to promote party objectives. • 66.7% of councillors who responded were re-elected whilst 33.3% were newly
elected.• 44.4% of councillors who responded were aware of public information
campaigns designed to encourage people to stand for election, with the remainder unaware.
Training and Development• 84.9% of councillors who responded participated in the council’s local induction
programme. 80.9% of these felt that the induction programme addressed their needs.
• 68% of councillors said they would like to take up the CPD Framework for Elected Members in Scottish Local Government in future.
• 63.8% of councillors felt they had been given adequate training to carry out their scrutiny role effectively.
Scotland’s Councillors 2013 Research Report
5
Public Services• 69.3% of councillors felt that all local public services should be accountable
for the delivery of shared outcomes through the local Community Planning Partnerships.
• 36.8% of councillors felt that the Community Planning Partnership Board should comprise a mix of councillors, non-executives and senior officers.
• 50.6% of councillors said that investment in early years has the greatest preventative impact, followed by investment in job creation (25.3%).
• 65.1% of councillors did not think it is necessary for public services to integrate into a single organisation to achieve shared outcomes.
• 50.3% of councillors felt that the council had a sound strategy for dealing with future budget cuts. Only 16.6% felt that the Community Planning Partnership had a sound strategy for dealing with future budget cuts.
• 69.5% of councillors felt that further devolution of powers was likely to strengthen the role and empowerment of local government.
• 61.8% of councillors felt that local public services should decentralise more decision making directly to communities, with 25.9% disagreeing.
• 52.3% of councillors felt that councils should actively deliver more services through the third-sector, with 25.3% disagreeing.

Scotland’s Councillors 2013Research Report
6
Introduction
1.1 ContextThe Improvement Service issued an online survey to all Scottish councillors in April 2013, to find out some basic demographic information, to see what they thought of their training and development since being elected in May 2012 and to seek their views on topical issues facing Scottish local government.
The survey was similar to previous surveys of elected members carried out post-election in 2003 and 2007 that aimed to better understand the profile of councillors. The information collected will be used to inform the supports offered to councillors as well as policy development.
This report contains comparisons between the profile of councillors and the Scottish population using the most recent, and closely matched data available. Where possible and appropriate, the questions in this survey were tailored to allow for direct comparisons with the Scottish Census 2011 and other national datasets.
For the first time since the surveys began, the 2013 survey was only carried out online and councillors were not issued with a paper copy. The online survey tool carried out a lot of the data analysis that was previously done manually and as such it was a more cost-effective way to carry out the survey. It would appear that the decision to issue the survey online did have an impact on the number of responses, with the response rate being less than half the total of previous surveys. In future, rather than issue automated email reminders from the online survey tool to councillors who have not completed the survey, we will consider sending them a personalised email asking them to complete the survey and offering them the option of requesting a paper survey.
The survey focused largely on developing a comprehensive picture of Scottish councillors, asking questions about:
• Age• Gender• Ethnicity• Religion• Marital Status• Education• Employment status• Household income• Responsibilities• Health• Caring responsibilities• Training and Development• Elections• Public services
Scotland’s Councillors 2013 Research Report
7
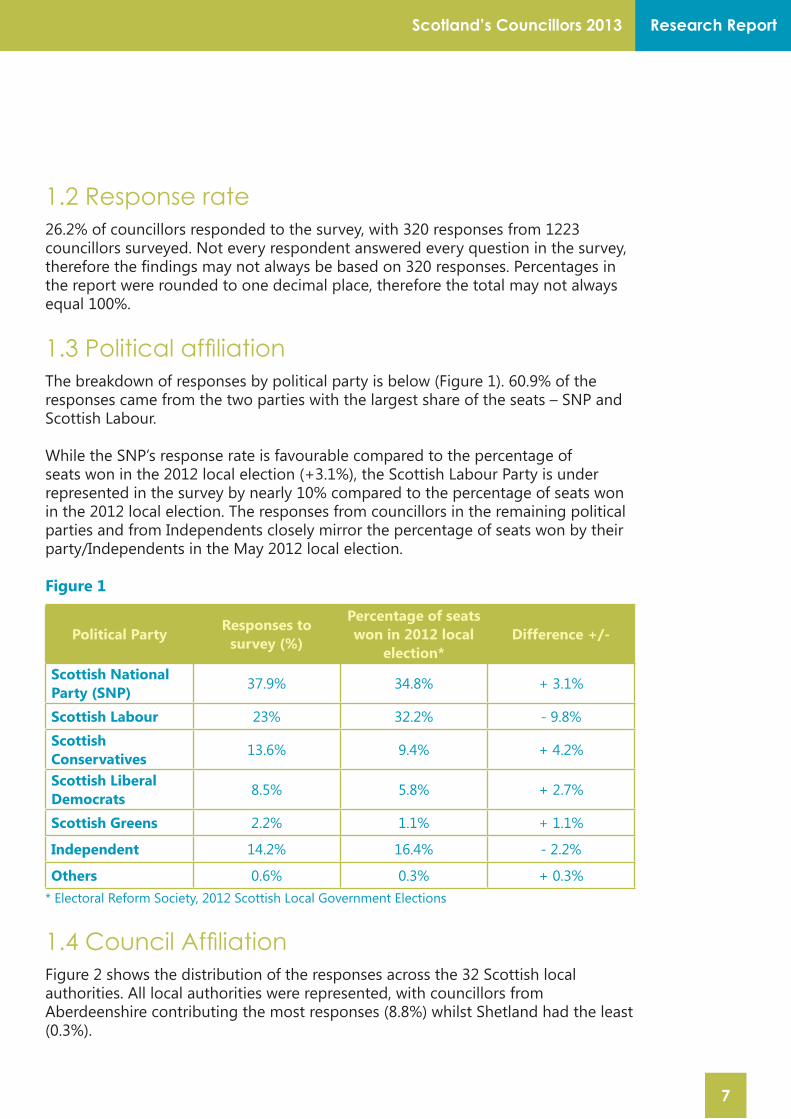
1.2 Response rate26.2% of councillors responded to the survey, with 320 responses from 1223 councillors surveyed. Not every respondent answered every question in the survey, therefore the findings may not always be based on 320 responses. Percentages in the report were rounded to one decimal place, therefore the total may not always equal 100%.
1.3 Political affiliationThe breakdown of responses by political party is below (Figure 1). 60.9% of the responses came from the two parties with the largest share of the seats – SNP and Scottish Labour.
While the SNP’s response rate is favourable compared to the percentage of seats won in the 2012 local election (+3.1%), the Scottish Labour Party is under represented in the survey by nearly 10% compared to the percentage of seats won in the 2012 local election. The responses from councillors in the remaining political parties and from Independents closely mirror the percentage of seats won by their party/Independents in the May 2012 local election.
Figure 1
Political Party Responses to survey (%)
Percentage of seats won in 2012 local
election*Difference +/-
Scottish National Party (SNP) 37.9% 34.8% + 3.1%
Scottish Labour 23% 32.2% - 9.8%
Scottish Conservatives 13.6% 9.4% + 4.2%
Scottish Liberal Democrats 8.5% 5.8% + 2.7%
Scottish Greens 2.2% 1.1% + 1.1%
Independent 14.2% 16.4% - 2.2%
Others 0.6% 0.3% + 0.3%* Electoral Reform Society, 2012 Scottish Local Government Elections
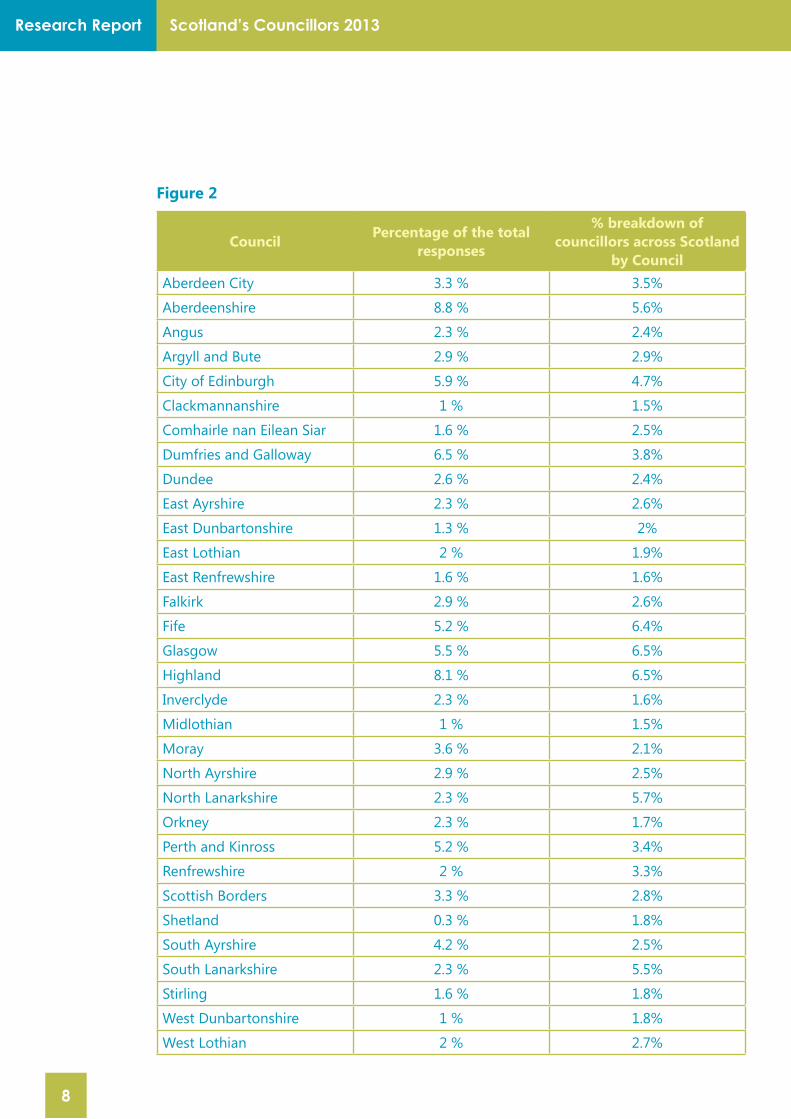
1.4 Council Affiliation Figure 2 shows the distribution of the responses across the 32 Scottish local authorities. All local authorities were represented, with councillors from Aberdeenshire contributing the most responses (8.8%) whilst Shetland had the least (0.3%).
Scotland’s Councillors 2013Research Report
8
Figure 2
Council Percentage of the total responses
% breakdown of councillors across Scotland
by CouncilAberdeen City 3.3 % 3.5%
Aberdeenshire 8.8 % 5.6%
Angus 2.3 % 2.4%
Argyll and Bute 2.9 % 2.9%
City of Edinburgh 5.9 % 4.7%
Clackmannanshire 1 % 1.5%
Comhairle nan Eilean Siar 1.6 % 2.5%
Dumfries and Galloway 6.5 % 3.8%
Dundee 2.6 % 2.4%
East Ayrshire 2.3 % 2.6%
East Dunbartonshire 1.3 % 2%
East Lothian 2 % 1.9%
East Renfrewshire 1.6 % 1.6%
Falkirk 2.9 % 2.6%
Fife 5.2 % 6.4%
Glasgow 5.5 % 6.5%
Highland 8.1 % 6.5%
Inverclyde 2.3 % 1.6%
Midlothian 1 % 1.5%
Moray 3.6 % 2.1%
North Ayrshire 2.9 % 2.5%
North Lanarkshire 2.3 % 5.7%
Orkney 2.3 % 1.7%
Perth and Kinross 5.2 % 3.4%
Renfrewshire 2 % 3.3%
Scottish Borders 3.3 % 2.8%
Shetland 0.3 % 1.8%
South Ayrshire 4.2 % 2.5%
South Lanarkshire 2.3 % 5.5%
Stirling 1.6 % 1.8%
West Dunbartonshire 1 % 1.8%
West Lothian 2 % 2.7%

Scotland’s Councillors 2013 Research Report
9
2. Demographic Profiles
2.1 AgeFigure 3 shows the age ranges of the councillors who responded to the survey. Only 9.9% of councillors who responded were under the age of 40, and the majority (66.5%) were between the ages of 50-69.
Figure 3 - Age range of elected members in survey
2.1.1 Age profile of elected members by party
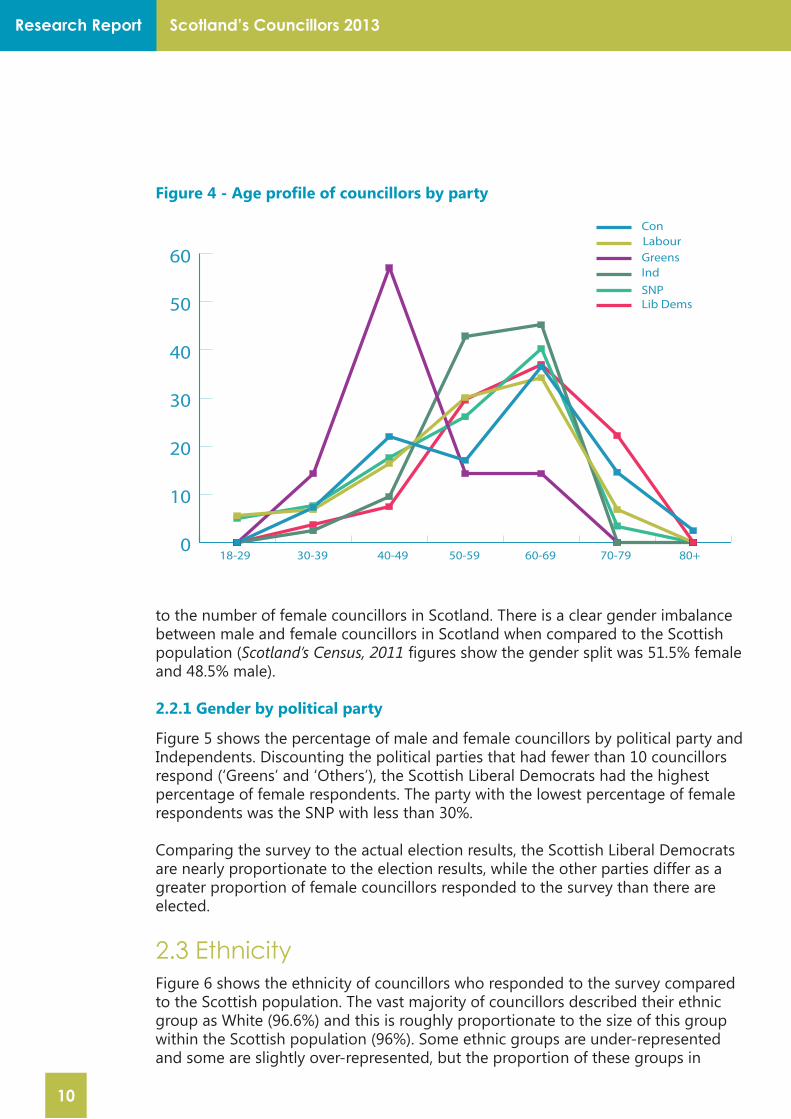
Figure 4 shows the age profile of councillors within each party and Independents who responded to the survey. Compared with the age range of councillors across all parties/Independents (Figure 3), you can see that most parties and Independents follow the same trend. Generally, there is an upward trend from the age range of 18-29 to a peak of councillors aged 60-69. From the age of 70 upwards, there is a decrease in the number of Independent and political party councillors.
The party that bucks this trend is the Scottish Greens, whose peak age range is 40-49. The Scottish Conservatives go against the trend with more elected members aged 40-49 than 50-59, but fall back on trend for the age range of 60-69 and upwards.
2.2 Gender The majority of councillors who responded to the survey were male (69.6%), with 30.4% female. Figures show that the percentage of female councillors elected in 2012 was actually 24.3% (Denver et al, 2012).
The number of female councillors who responded to the survey is disproportionate
0%
5%
10%
15%
20%
25%
30%
35%
40%
80+70-7960-6950-5940-4930-3918-29
Age range of elected members in survey
3.2%6.7%
16.6%
28.3%
38.2%
6.7%
0.3%
Scotland’s Councillors 2013Research Report
10
0
10
20
30
40
50
60
Age pro�le of councillors by partyConLabourGreensIndSNPLib Dems
18-29 30-39 40-49 60-69 70-79 80+50-59
to the number of female councillors in Scotland. There is a clear gender imbalance between male and female councillors in Scotland when compared to the Scottish population (Scotland’s Census, 2011 figures show the gender split was 51.5% female and 48.5% male).
2.2.1 Gender by political party
Figure 5 shows the percentage of male and female councillors by political party and Independents. Discounting the political parties that had fewer than 10 councillors respond (‘Greens’ and ‘Others’), the Scottish Liberal Democrats had the highest percentage of female respondents. The party with the lowest percentage of female respondents was the SNP with less than 30%.
Comparing the survey to the actual election results, the Scottish Liberal Democrats are nearly proportionate to the election results, while the other parties differ as a greater proportion of female councillors responded to the survey than there are elected.
2.3 EthnicityFigure 6 shows the ethnicity of councillors who responded to the survey compared to the Scottish population. The vast majority of councillors described their ethnic group as White (96.6%) and this is roughly proportionate to the size of this group within the Scottish population (96%). Some ethnic groups are under-represented and some are slightly over-represented, but the proportion of these groups in
Figure 4 - Age profile of councillors by party

Scotland’s Councillors 2013 Research Report
11
Scottish society is relatively small. For example, 1.6% of councillors described their ethnic group as ‘Mixed/Multiple ethnic groups’, whereas their proportion in the Scottish population is 0.4%.
Figure 6: Councillors by ethnic group
2011 - 2012 % of Councillors % of Scottish Population*
African 0.6% 0.6%
Arab, Arab Scottish or Arab British 0% 0.2%
Asian / Asian Scottish / Asian British 1.3% 2.7%
Caribbean or Black 0% 0.1%
Mixed / Multiple ethnic groups 1.6% 0.4%
Other ethnic group 0% 0.1%
White 96.6% 96%* Scotland’s Census, 2011
2.4 Religious denominationFigure 7 shows the religious denomination of councillors who responded to the survey. 49.9% of councillors described themselves as Christian whilst 40.3% had no religious denomination. The proportion of the other religious denominations of
Figure 5 - Gender by political party
Political PartyMale Female
Survey Election Results * Survey Election
Results *Independent 69 % 83.1% 31 % 16.9%
Scottish Conservative and Unionist
68.4 % 75.7% 31.6 % 24.3%
Scottish Green Party 57.1 % 71.4% 42.9 % 28.6%
Scottish Labour Party 68.1 % 74.1% 31.9 % 25.9%
Scottish Liberal Democrat Party 64 % 63.4% 36 % 36.6%
Scottish National Party 71.6 % 75.7% 28.4 % 24.3%
Other 100 % 100% 0 % 0%
Overall 69.6% 75.7% 30.4% 24.3%
* Denver et al, 2012

Scotland’s Councillors 2013Research Report
12
respondents was very small, which is comparative to figures from the 2011 Scottish Census.
The 2011 Scottish Census data for religion shows that 36.7% of respondents had no religious faith, 32.4% were Church of Scotland, 15.9% Roman Catholic and 5.5% belonged to other Christian faiths.
Figure 7: Religious denomination
Religion Elected Members *Scottish Population
None 40.3% 36.7%
Church of Scotland 33.4% 32.4%
Roman Catholic 10.6% 15.9%
Other Christian 5.9% 5.5%
Buddhist 0.3% 0.2%
Hindu 0% 0.3%
Muslim 0.6% 1.5%
Jewish 0% 0.1%
Sikh 0.6% 0.2%
Other 2.8% 0.3%
No religion stated 5.3% 7%
* Scotland’s Census 2011
2.5 Marital statusFigure 8 shows that 72.3% of councillors are married or in a registered same-sex civil partnership, which is significantly greater than the Scottish population.
Figure 8 - Marital status of councillors
Marital Status Councillors % *Scottish Population %
Single (never married or never registered a same-sex civil partnership) 12.2% 35.4%
Married / In a registered same-sex civil partnership 72.3% 45.4%
Separated (but still legally married or still legally in a same-sex civil partnership) 2.3% 3.2%
Divorced or formerly in a same-sex civil partnership which is now legally dissolved 9% 8.2%
Widowed or surviving partner from a same-sex civil partnership 4.2% 7.8%
* Scotland’s Census 2011
Scotland’s Councillors 2013 Research Report
13
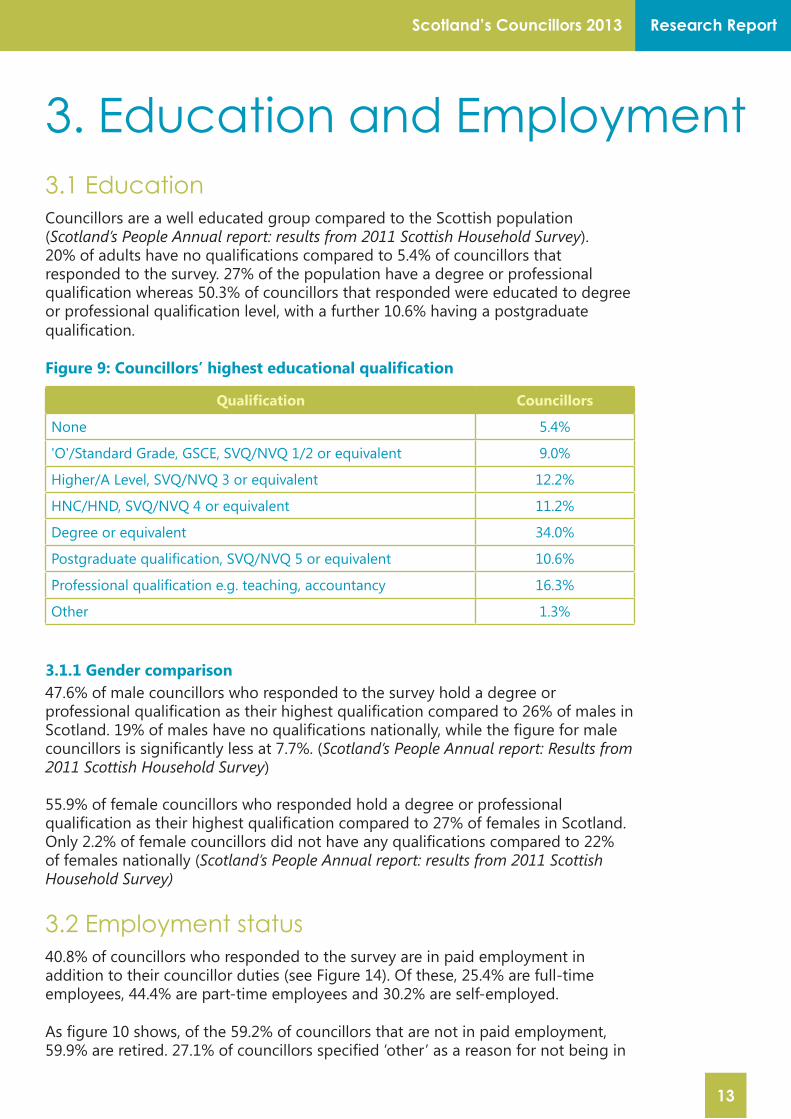
3. Education and Employment3.1 EducationCouncillors are a well educated group compared to the Scottish population (Scotland’s People Annual report: results from 2011 Scottish Household Survey). 20% of adults have no qualifications compared to 5.4% of councillors that responded to the survey. 27% of the population have a degree or professional qualification whereas 50.3% of councillors that responded were educated to degree or professional qualification level, with a further 10.6% having a postgraduate qualification.
Figure 9: Councillors’ highest educational qualification
Qualification Councillors
None 5.4%
'O'/Standard Grade, GSCE, SVQ/NVQ 1/2 or equivalent 9.0%
Higher/A Level, SVQ/NVQ 3 or equivalent 12.2%
HNC/HND, SVQ/NVQ 4 or equivalent 11.2%
Degree or equivalent 34.0%
Postgraduate qualification, SVQ/NVQ 5 or equivalent 10.6%
Professional qualification e.g. teaching, accountancy 16.3%
Other 1.3%
3.1.1 Gender comparison47.6% of male councillors who responded to the survey hold a degree or professional qualification as their highest qualification compared to 26% of males in Scotland. 19% of males have no qualifications nationally, while the figure for male councillors is significantly less at 7.7%. (Scotland’s People Annual report: Results from 2011 Scottish Household Survey)
55.9% of female councillors who responded hold a degree or professional qualification as their highest qualification compared to 27% of females in Scotland. Only 2.2% of female councillors did not have any qualifications compared to 22% of females nationally (Scotland’s People Annual report: results from 2011 Scottish Household Survey)
3.2 Employment status40.8% of councillors who responded to the survey are in paid employment in addition to their councillor duties (see Figure 14). Of these, 25.4% are full-time employees, 44.4% are part-time employees and 30.2% are self-employed.
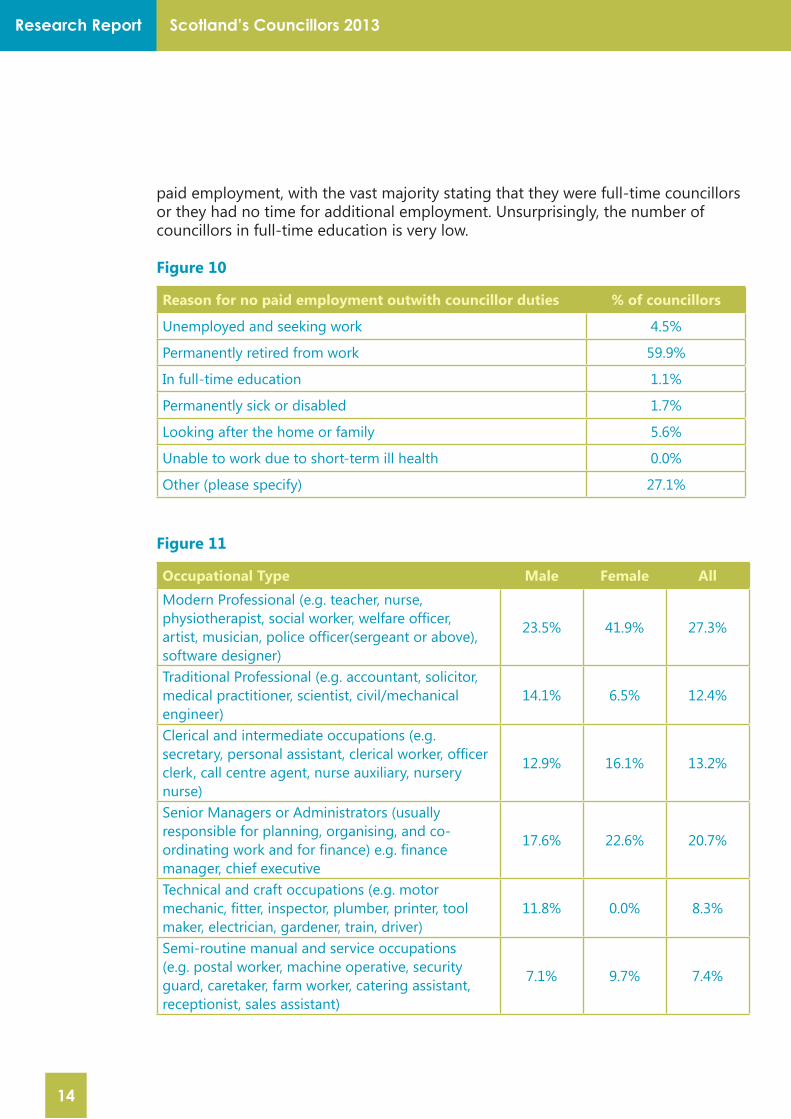
As figure 10 shows, of the 59.2% of councillors that are not in paid employment, 59.9% are retired. 27.1% of councillors specified ‘other’ as a reason for not being in
Scotland’s Councillors 2013Research Report
14
paid employment, with the vast majority stating that they were full-time councillors or they had no time for additional employment. Unsurprisingly, the number of councillors in full-time education is very low.
Figure 10
Reason for no paid employment outwith councillor duties % of councillors
Unemployed and seeking work 4.5%
Permanently retired from work 59.9%
In full-time education 1.1%
Permanently sick or disabled 1.7%
Looking after the home or family 5.6%
Unable to work due to short-term ill health 0.0%
Other (please specify) 27.1%
Figure 11
Occupational Type Male Female AllModern Professional (e.g. teacher, nurse, physiotherapist, social worker, welfare officer, artist, musician, police officer(sergeant or above), software designer)
23.5% 41.9% 27.3%
Traditional Professional (e.g. accountant, solicitor, medical practitioner, scientist, civil/mechanical engineer)
14.1% 6.5% 12.4%
Clerical and intermediate occupations (e.g. secretary, personal assistant, clerical worker, officer clerk, call centre agent, nurse auxiliary, nursery nurse)
12.9% 16.1% 13.2%
Senior Managers or Administrators (usually responsible for planning, organising, and co-ordinating work and for finance) e.g. finance manager, chief executive
17.6% 22.6% 20.7%
Technical and craft occupations (e.g. motor mechanic, fitter, inspector, plumber, printer, tool maker, electrician, gardener, train, driver)
11.8% 0.0% 8.3%
Semi-routine manual and service occupations (e.g. postal worker, machine operative, security guard, caretaker, farm worker, catering assistant, receptionist, sales assistant)
7.1% 9.7% 7.4%
Scotland’s Councillors 2013 Research Report
15
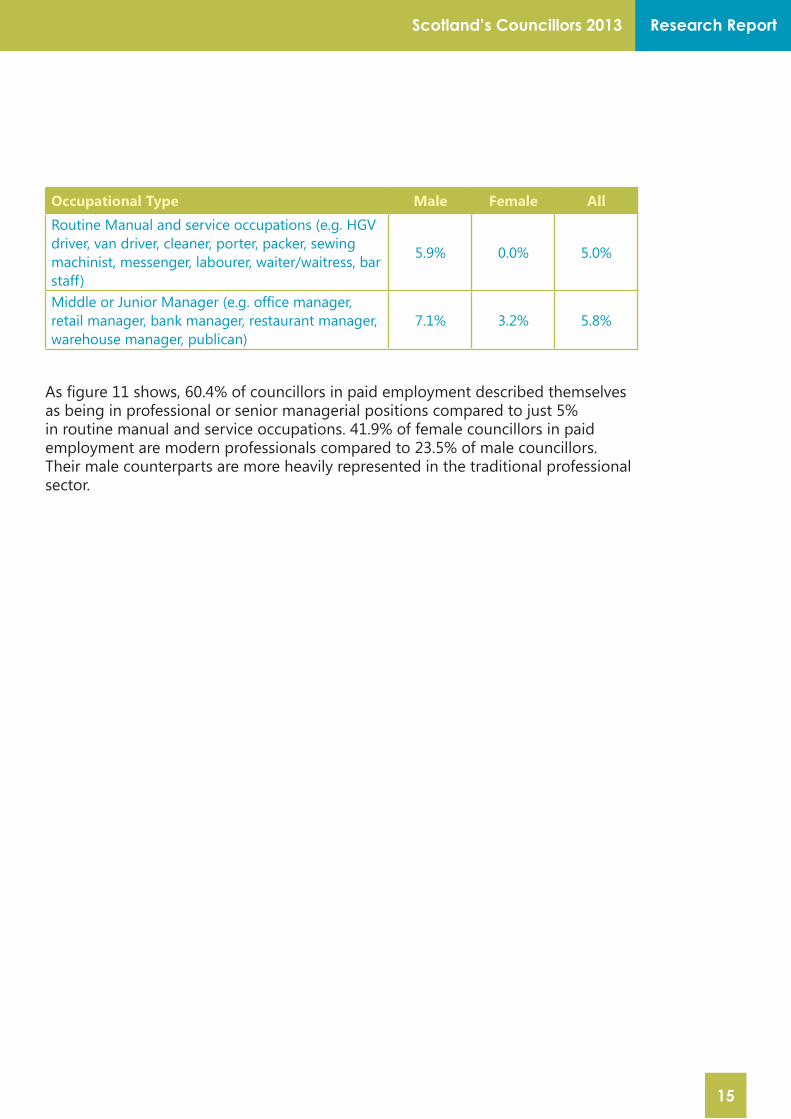
Occupational Type Male Female AllRoutine Manual and service occupations (e.g. HGV driver, van driver, cleaner, porter, packer, sewing machinist, messenger, labourer, waiter/waitress, bar staff)
5.9% 0.0% 5.0%
Middle or Junior Manager (e.g. office manager, retail manager, bank manager, restaurant manager, warehouse manager, publican)
7.1% 3.2% 5.8%
As figure 11 shows, 60.4% of councillors in paid employment described themselves as being in professional or senior managerial positions compared to just 5% in routine manual and service occupations. 41.9% of female councillors in paid employment are modern professionals compared to 23.5% of male councillors. Their male counterparts are more heavily represented in the traditional professional sector.
Scotland’s Councillors 2013Research Report
16
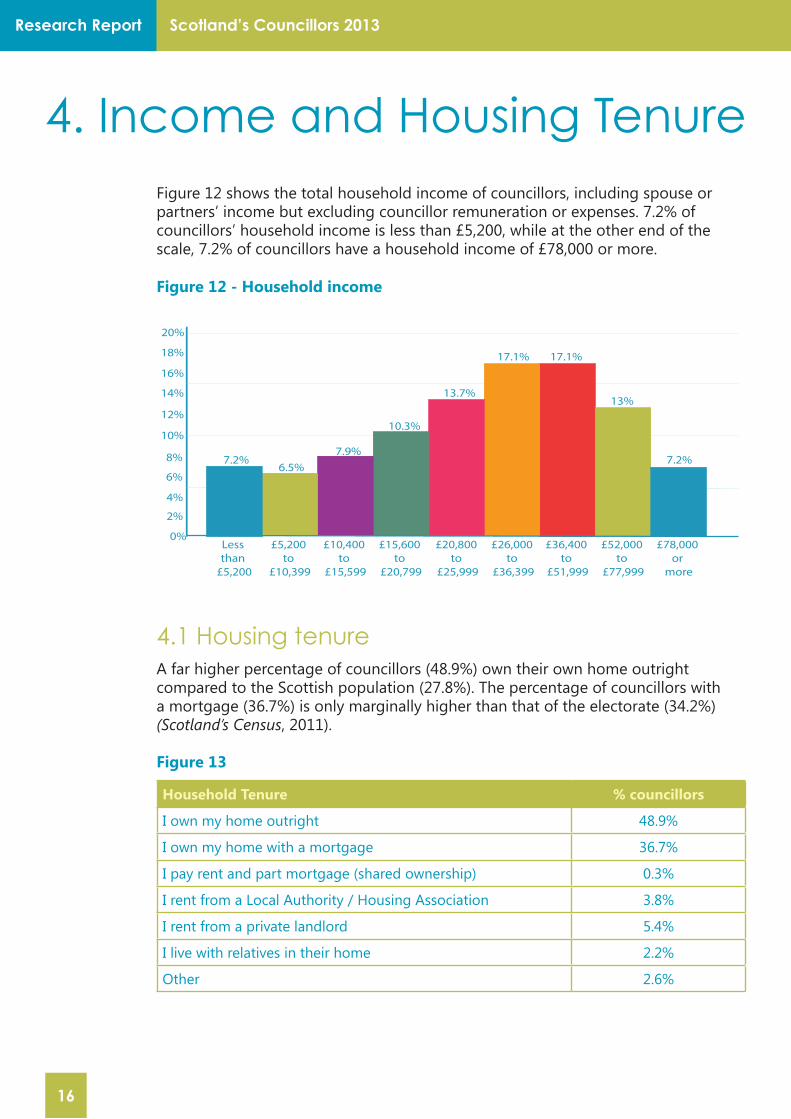
4. Income and Housing TenureFigure 12 shows the total household income of councillors, including spouse or partners’ income but excluding councillor remuneration or expenses. 7.2% of councillors’ household income is less than £5,200, while at the other end of the scale, 7.2% of councillors have a household income of £78,000 or more.
Figure 12 - Household income
4.1 Housing tenureA far higher percentage of councillors (48.9%) own their own home outright compared to the Scottish population (27.8%). The percentage of councillors with a mortgage (36.7%) is only marginally higher than that of the electorate (34.2%) (Scotland’s Census, 2011).
Figure 13
Household Tenure % councillors
I own my home outright 48.9%
I own my home with a mortgage 36.7%
I pay rent and part mortgage (shared ownership) 0.3%
I rent from a Local Authority / Housing Association 3.8%
I rent from a private landlord 5.4%
I live with relatives in their home 2.2%
Other 2.6%
0%
2%
4%
6%
8%
10%
12%
14%
16%
18%
20%
7.2% 7.2%6.5%
7.9%
10.3%
13.7%
17.1% 17.1%
13%
Less than
£5,200
£5,200 to
£10,399
£10,400 to
£15,599
£15,600 to
£20,799
£20,800 to
£25,999
£26,000 to
£36,399
£36,400 to
£51,999
£52,000 to
£77,999
£78,000 or
more
Household Income
Scotland’s Councillors 2013 Research Report
17
5. Councillors’ Responsibilities
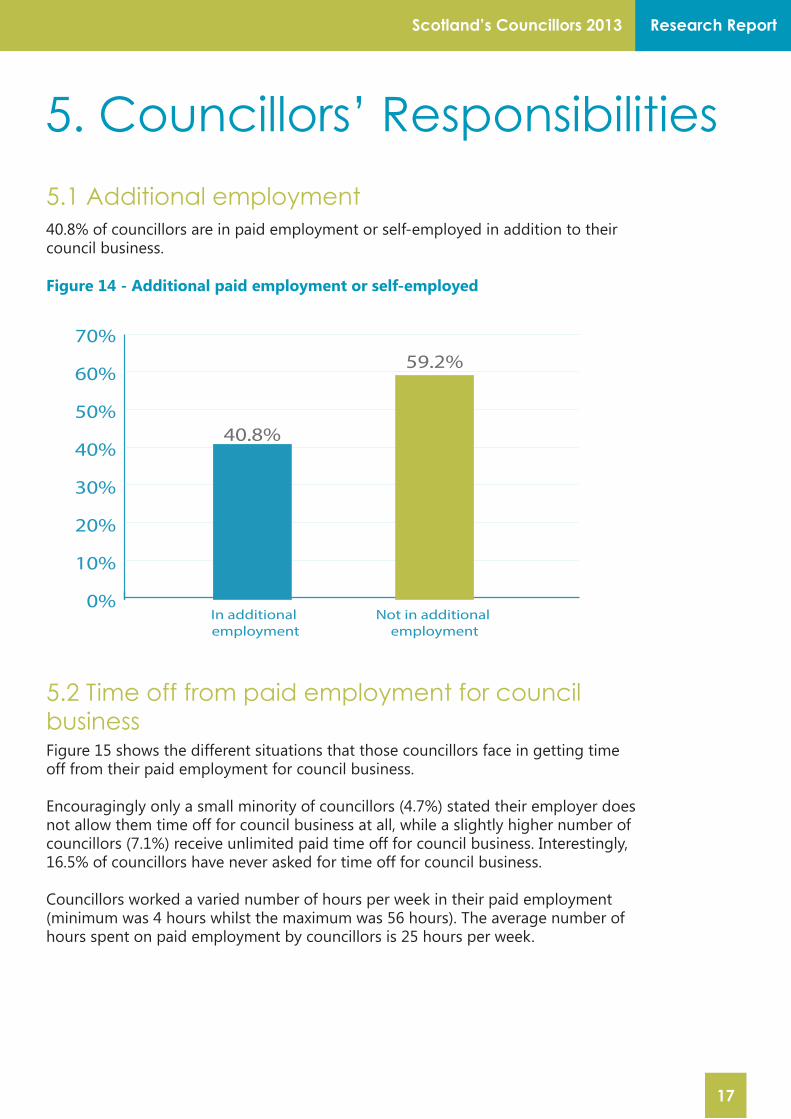
5.1 Additional employment40.8% of councillors are in paid employment or self-employed in addition to their council business.
Figure 14 - Additional paid employment or self-employed
5.2 Time off from paid employment for council businessFigure 15 shows the different situations that those councillors face in getting time off from their paid employment for council business.
Encouragingly only a small minority of councillors (4.7%) stated their employer does not allow them time off for council business at all, while a slightly higher number of councillors (7.1%) receive unlimited paid time off for council business. Interestingly, 16.5% of councillors have never asked for time off for council business.
Councillors worked a varied number of hours per week in their paid employment (minimum was 4 hours whilst the maximum was 56 hours). The average number of hours spent on paid employment by councillors is 25 hours per week.
0%
10%
20%
30%
40%
50%
60%
70%
Not in additional employment
In additional employment
Additional paid employment or self-employed
40.8%
59.2%

Scotland’s Councillors 2013Research Report
18
Figure 15
Time off paid employment (excluding self-employed councillors) % of councillors
My employer allows me unlimited paid time off for council business 7.1%
My employer allows me limited paid time off for council business 22.4%
My employer allows me unlimited unpaid time off for council business 14.1%
My employer allows me limited unpaid time off for council business 16.5%
I have never asked for time off for council business 16.5%
My employer will not allow time off for council business 4.7%
Other (please specify) 18.8%
5.3 Hours spent on councillor duties The minimum number of hours per week spent on councillor duties was 8 and the maximum was 84. The average number of hours spent on Council business was 36 hours per week. It is worth comparing the number of hours spent by councillors in paid employment with those of full time councillors:
• The minimum number of hours spent on council business by a councillor in paid employment is 8 and the maximum is 60. The average is 31 hours per week. If we combine this figure with the average number of hours spent in paid employment, councillors are working on average 56 hours per week on council business and paid employment.
• The minimum number of hours worked on council business by a councillor with no additional paid employment is 10 and the maximum was 84. The average is 39 hours per week.
5.4 Councillors’ care responsibilities13.6% of councillors provide care to someone on a regular basis who is sick, elderly or disabled and 26.2% of these councillors will have to or have had to make special care arrangements in order to carry out their council business.
20.7% of councillors have responsibility for children aged sixteen or under and 58.1% of these have to make special childcare arrangements to carry out their council business.

Scotland’s Councillors 2013 Research Report
19
6. HealthFigure 16 shows that 88.9% of councillors have either ‘Good’ or ‘Very good’ health in general.
Figure 16: Health of councillors
Health in General % of councillors
Very good 46.2%
Good 42.7%
Fair 9.2%
Bad 1.9%
Very bad 0.0%
67% of councillors do not have a disability or health problem that has, or is expected to, last 12 months and limit their day to day activities. 29.8% of councillors have a condition that limits them a little, while 3.2% are limited a lot.

Scotland’s Councillors 2013Research Report
20
7. Local Government Elections
7.1 Returning and newly elected councillorsFigure 17 shows that 66.7% of councillors that were elected in 2013 had previously served as a councillor, with nearly all of these councillors in seats prior to the May 2012 local elections.
Figure 17 - Previously served as councillor
7.2 Councillors’ motivations for standing for electionFigure 18 shows the reasons councillors had for standing at the local government elections in May 2012. The most popular reason for standing was having an interest in the community which 89.5% of councillors said was a factor, followed closely by a desire to improve services and/or local area (84.1%). Only 1% of councillors were encouraged by a public information campaign, despite 44.4% of councillors being aware of a public awareness campaign and the publication of the ‘Be a Councillor 2012’ guide by the Improvement Service and CoSLA.
7.3 Encouraging prospective candidatesCouncillors were asked for their thoughts on how to encourage more candidates to stand for local government elections in future. The comments were varied but there were common themes that emerged:
0%
20%
40%
60%
80%
NoYes
Previously served as a Councillor
66.7%
33.3%

Scotland’s Councillors 2013 Research Report
21
0
20
40
60
80
100
Reasons for standing for electionInterest in the community
Duty/Public Service
To improve services and/or local area
To resolve/improve a single issue
Career/personal development
To promote party objectives
To provide a choice/vote for a party
To make changes to the council
Because I was asked to stand
Encouraged by public info campaign
The position of councillor is paid
The position of councillor is part-time
To defeat the incumbent councillor
89.5%
69.5%
84.1%
7.0%9.2%
52.1%
23.2%
62.5%
6.3%
26.3%
1.0%
12.7%
6.7%
Figure 18 - Councillors’ motivations for standing at 2012 election
• Increase the pay to attract a higher calibre of candidate/young people and make the position full-time.
• Better childcare arrangements within councils for example, creches, to encourage more women to stand.
• More flexibility with meetings / council business being conducted in evenings to support those in paid employment.
• Better targeting of under-represented groups through promotion of the councillor role in schools, higher education, community organisations etc.
• Run a high profile campaign using social media and the media in general to promote the role of a councillor, along with running candidate workshops.

Scotland’s Councillors 2013Research Report
22
8. Training and Development
8.1 Local induction programmes84.9% of councillors participated in the council’s local induction programme. 55.6% of the councillors who did not participate said it was due to them not feeling they needed to, which was mainly as a result of them being re-elected and having previously participated in an induction programme in 2007.
Figure 19 shows that 74.9% of councillors rated their council’s induction programme as excellent or good, with a further 20.2% rating it as fair. Less than 5% of councillors who participated in the induction programme said it was poor or very poor. 80.9% of councillors felt that the council’s induction programme met their needs.
Councillors were asked for their thoughts on how to improve the council’s induction programme in future. The common themes that emerged were:
• Spread the induction programme out over a longer period of time.• Involve experienced councillors in the delivery of the induction programme,
as induction programmes are typically delivered by officers with no practical experience of being a councillor.
• Establish a buddy/mentor programme so newly elected councillors can be mentored by more experienced councillors.
• Differentiate between the needs of newly elected and returning councillors and develop tailored induction packages for the two different audiences.
• Make the content as practical as possible to support the development of councillors’ skills.
Figure 19 - Local induction experience
60%
0%
10%
20%
30%
40%
50%
60%
14.40%
70%
Induction ExperienceExcellent
GoodFairPoorVery Poor
60.50%
20.20%
3.80%1.10%
Scotland’s Councillors 2013 Research Report
23
8.2 Improvement Service elected member development programmeCouncillors were asked if they were aware of the induction notebooks produced by the Improvement Service in conjunction with COSLA, SOLACE and councils. 52.6% of councillors were aware of the notebooks and of these, 61.5% had accessed the notebooks. When asked to rate the overall quality of these induction notebooks, 72.9% said they were good and 14.6% rated them as excellent.
Of those councillors that didn’t access the induction notebooks, 41.9% said they didn’t have time to read them, 33.9% felt they didn’t need to read them, 4.8% felt they covered too much information and the remainder gave a range of reasons.
When asked which existing opportunities councillors would like to take up in future through the IS Elected Member Development Programme, 68% said they would like professional development through the CPD Framework for Elected Members in Scottish Local Government. 50.9% said they would use the Briefing Notes Series, 57.7% would like to attend cross council/cross party face-to-face masterclasses and 50.2% would access elearning.
When asked for their views on how training materials could potentially be delivered to councillors in future, 68.8% said they would be interested in accessing materials through an iPad, 49.8% were interested in accessing online videos, 43.7% were interested in virtual classrooms (facilitated workshops delivered online), 30% said they would access learning through a smartphone and 19% were interested in podcasts.
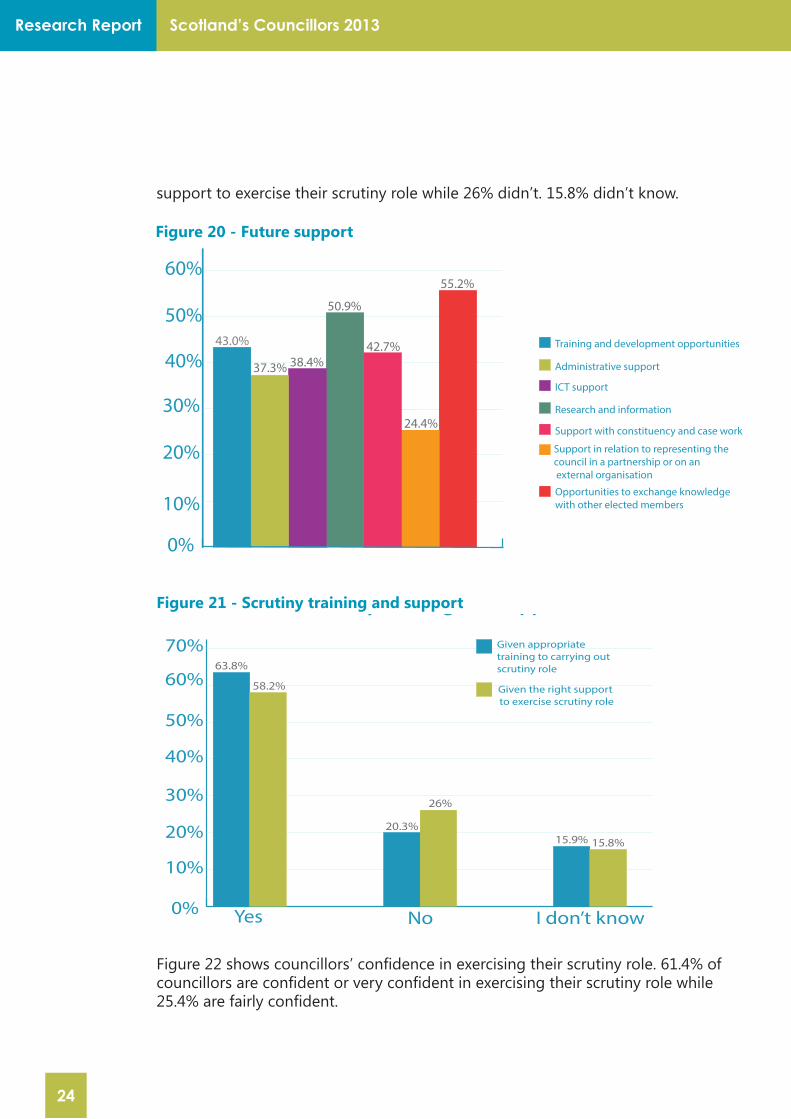
8.3 Future supportCouncillors were asked what further support they needed to fulfil their role effectively. Figure 20 shows that 55.2% of councillors would like opportunities to exchange knowledge with other elected members across Scotland and 50.9% want access to research and information to help them fulfil their role effectively.
Councillors were asked whether they were interested in exchanging information with councillors in different councils as part of a secure online community. 76.9% of councillors were interested in doing so across councils but only with councillors in their own party (or with other Independents). 44.8% of councillors were interested in exchanging information with fellow councillors across councils and in all political parties (including Independents).
8.4 ScrutinyFigure 21 shows that 63.8% of councillors said they felt they had been given the appropriate training in order to carry out their scrutiny role, with 20.3% saying they did not and 15.9% saying that they didn’t know. 58.2% felt they received the right
Scotland’s Councillors 2013Research Report
24
0%
10%
20%
30%
40%
50%
60%
43.0%
Future Support
37.3% 38.4%
50.9%
42.7%
24.4%
55.2%
Training and development opportunities
Administrative support
ICT support
Research and information
Support with constituency and case work
Support in relation to representing the council in a partnership or on an external organisation
Opportunities to exchange knowledge with other elected members
Figure 20 - Future support
support to exercise their scrutiny role while 26% didn’t. 15.8% didn’t know.
Figure 21 - Scrutiny training and support
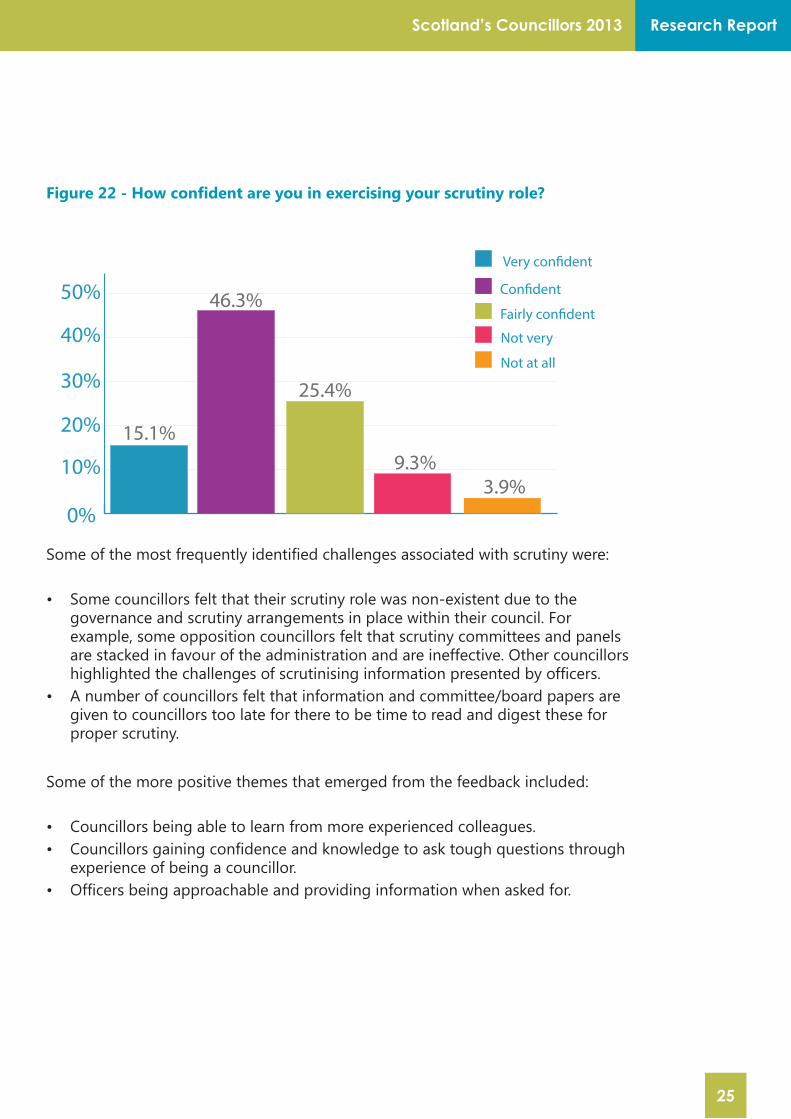
Figure 22 shows councillors’ confidence in exercising their scrutiny role. 61.4% of councillors are confident or very confident in exercising their scrutiny role while 25.4% are fairly confident.
0%
40%
50%
Scrutiny training and support
63.8%
10%
20%
30%
60%
70%
58.2%
26%
20.3%15.9% 15.8%
Yes I don’t knowNo
Given appropriate training to carrying out scrutiny role
Given the right support to exercise scrutiny role
Scotland’s Councillors 2013 Research Report
25
Figure 22 - How confident are you in exercising your scrutiny role?
Some of the most frequently identified challenges associated with scrutiny were:
• Some councillors felt that their scrutiny role was non-existent due to the governance and scrutiny arrangements in place within their council. For example, some opposition councillors felt that scrutiny committees and panels are stacked in favour of the administration and are ineffective. Other councillors highlighted the challenges of scrutinising information presented by officers.
• A number of councillors felt that information and committee/board papers are given to councillors too late for there to be time to read and digest these for proper scrutiny.
Some of the more positive themes that emerged from the feedback included:
• Councillors being able to learn from more experienced colleagues.• Councillors gaining confidence and knowledge to ask tough questions through
experience of being a councillor.• Officers being approachable and providing information when asked for.
0%
40%
50%
How con�dent are you in exercising your scrutiny role?
46.3%
25.4%
10%
20%
30%
15.1%9.3%
3.9%
Very con�dent
Con�dent
Fairly con�dent
Not very
Not at all
Scotland’s Councillors 2013Research Report
26
9. Public ServicesCouncillors were asked their opinions on a range of issues affecting public services.
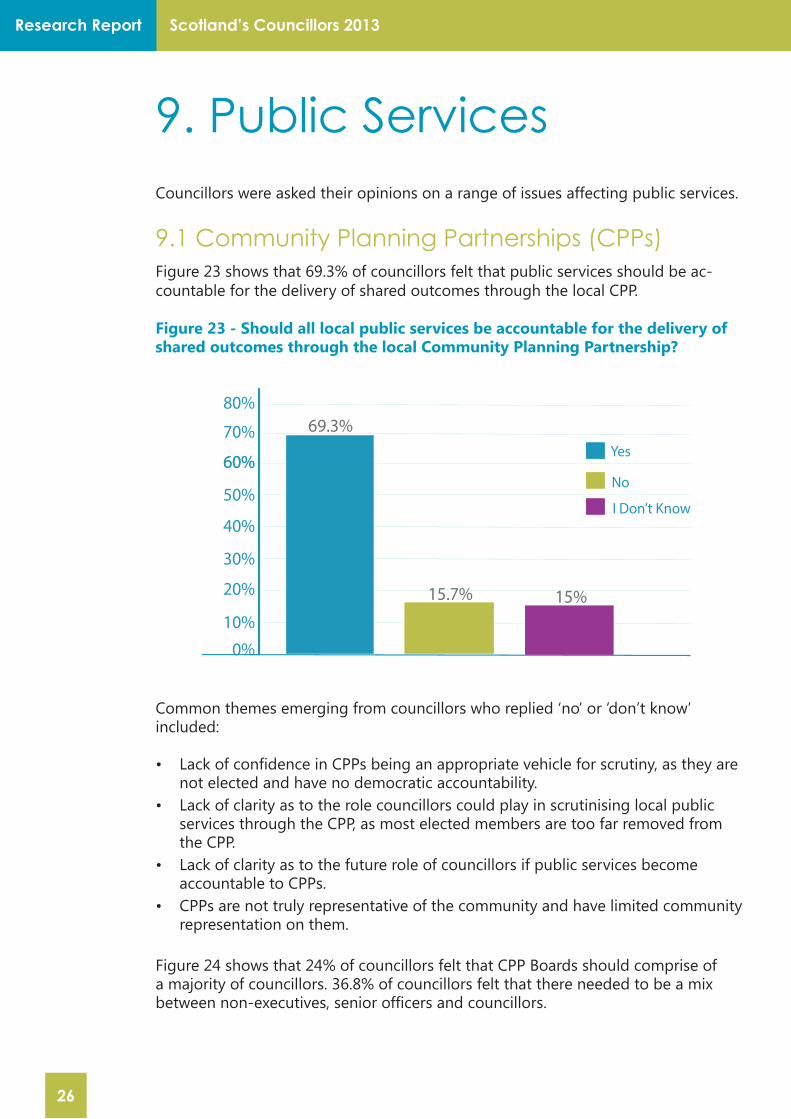
9.1 Community Planning Partnerships (CPPs)Figure 23 shows that 69.3% of councillors felt that public services should be ac-countable for the delivery of shared outcomes through the local CPP.
Figure 23 - Should all local public services be accountable for the delivery of shared outcomes through the local Community Planning Partnership?
Common themes emerging from councillors who replied ‘no’ or ‘don’t know’ included:
• Lack of confidence in CPPs being an appropriate vehicle for scrutiny, as they are not elected and have no democratic accountability.
• Lack of clarity as to the role councillors could play in scrutinising local public services through the CPP, as most elected members are too far removed from the CPP.
• Lack of clarity as to the future role of councillors if public services become accountable to CPPs.
• CPPs are not truly representative of the community and have limited community representation on them.
Figure 24 shows that 24% of councillors felt that CPP Boards should comprise of a majority of councillors. 36.8% of councillors felt that there needed to be a mix between non-executives, senior officers and councillors.
60%
0%
10%
20%
30%
40%
50%
60%
69.3%
15.7% 15%
70%
80%
Yes
No
I Don’t Know

Scotland’s Councillors 2013 Research Report
27
Figure 24
A Community Planning Partnership Board should comprise of: % of councillors
A majority of elected members 24.0%
An equal balance of elected members and non-executive directors from other public authorities 15.5%
A mix of elected members, non-executives and senior officers 36.8%
Anything decided locally by partners 16.4%
I don't know 7.2%
Some councillors felt that:
• Utilising officer knowledge and understanding with political impetus and drive is key to the effectiveness of a CPP Board.
• CPP Boards should reflect true partnership principles and not be dominated by local authority members.
Others felt that:
• A majority of councillors on the CPP Board would maintain the democratic accountability.
• One size doesn’t fit all – a composition that will work well in one CPP may not work in another.
• CPP Boards should include community representation.
Some councillors also questioned the purpose and powers of the CPP Board, pointing out that the role of the CPP Board is not sufficiently defined.
9.2 Preventative spendFigure 25 shows that 50.6% of councillors felt that ‘Investment in early years’ has the greatest preventative impact while 25.3% said ‘Investment in job creation’ would have the greatest impact. Of those that said ‘other’, the majority felt that all of these areas were equally important, they weren’t exclusive and they needed to be tackled together.
9.3 Organisational change and devolution of powers21.7% of councillors felt it was necessary for public services to integrate into a single organisation to achieve shared outcomes, while 65.1% did not (Figure 26).

Scotland’s Councillors 2013Research Report
28
60%
0%
10%
20%
30%
40%
50%
70%
Which of the following will have the greatest preventative impact?
8.1%15.9%
25.3%
50.6%
Investment in early years
Investment in job creation
Investment in community capacity building
Other
Figure 25 - Which of the following will have the greatest preventative impact?
Figure 26 - Do you think it is necessary for public services to integrate into a single organisation to achieve shared outcomes?
Responses were overwhelmingly based on the following themes:
• Integration needs to be considered on a case by case basis – what might be right for one service may not be appropriate for others.
• The key issue is ensuring there is a proper alignment in outcomes, priorities and resources between public services - this may be easier to achieve than integration, which may be perceived as a threat by some.
• Integrated public services may lack local accountability and lead to centralisation. • Formal integration may not be necessary if organisations can collaborate
0%
10%
20%
30%
40%
50%
60%
70%
NoYes
Do you think it is necessary for public services to into a single organisation to achieve shared outcomes?
21.7%
65.1%
I don’t know
13.2%

Scotland’s Councillors 2013 Research Report
29
and work effectively together, sharing budgets and decision making where necessary.
80.5% of councillors thought that public services (e.g. local authorities, NHS, Police Fire) should share services in their area (Figure 27).
Figure 27 - Should public services (e.g. local authorities, NHS, Police, Fire, etc) share services locally in your area?
69.5% of councillors said that further devolution of powers would likely strengthen the role and empowerment of local government, while 16.4% said it wouldn’t and 14.1% didn’t know.
61.8% of councillors said that local public services, including the council, should decentralise more decision making directly to communities while 25.9% said they shouldn’t (Figure 28).
Figure 28 - Should local public services, including the council, decentralise more decision making directly to communities?
0%
20%
40%
60%
80%
100%
NoYes
Should public services (e.g. local authorities, NHS, Police, Fire etc)
share services locally in your area?
80.5%
11.2%
I don’t know
8.3%
60%
0%
10%
20%
30%
40%
50%
60% 61.8%
25.9%
12.3%
70%
Should local public services, including the council, decentralise more decision making directly to communities?
Yes
No
I Don’t Know
Scotland’s Councillors 2013Research Report
30
Some of the issues raised by councillors in relation to decentralising more decision making to communities were:
• Whilst communities should have a say, final decisions should be left to councillors as they are the locally democratically elected representatives.
• Not every local community would wish to take on this responsibility.• The methods of determining community views are not well enough developed
and decisions could end up being taken by activists rather than representative communities.
• Communities would need to have a level of understanding of the implications of decisions.
• Capacity of communities to make decisions.
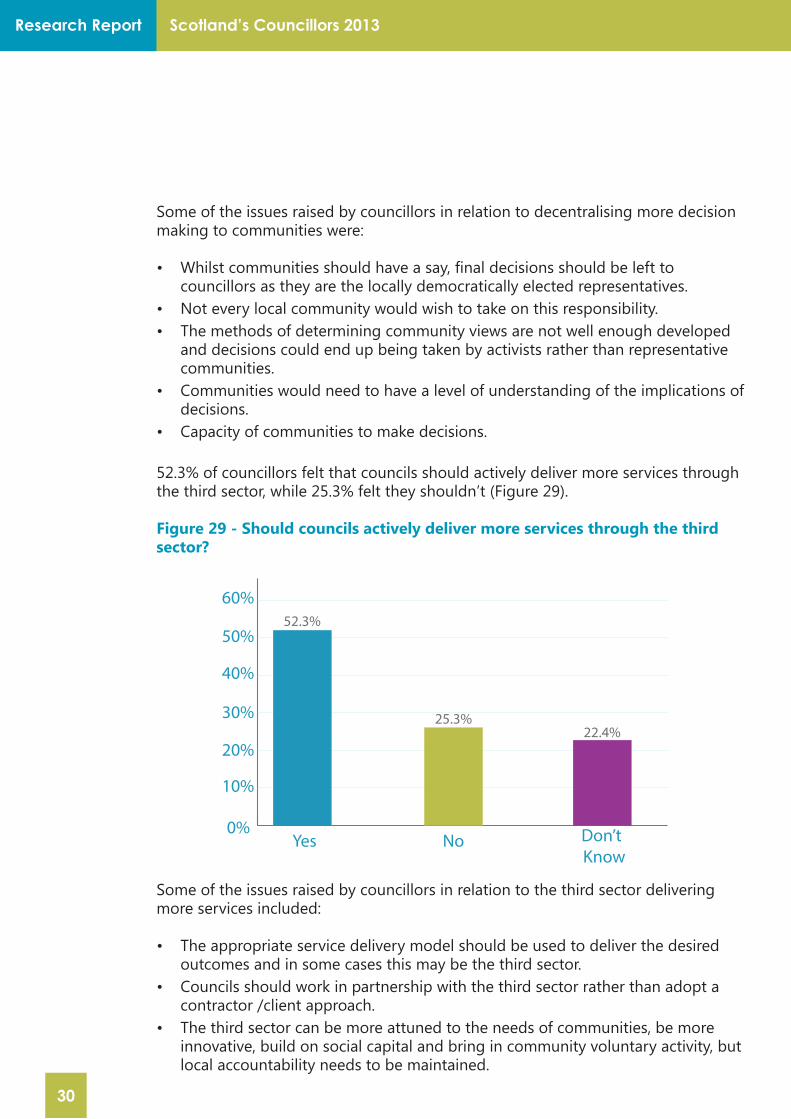
52.3% of councillors felt that councils should actively deliver more services through the third sector, while 25.3% felt they shouldn’t (Figure 29).
Figure 29 - Should councils actively deliver more services through the third sector?
Some of the issues raised by councillors in relation to the third sector delivering more services included:
• The appropriate service delivery model should be used to deliver the desired outcomes and in some cases this may be the third sector.
• Councils should work in partnership with the third sector rather than adopt a contractor /client approach.
• The third sector can be more attuned to the needs of communities, be more innovative, build on social capital and bring in community voluntary activity, but local accountability needs to be maintained.
0%
40%
50%
Should councils should actively deliver more services through the third sector?
52.3%
10%
20%
30%
60%
25.3%22.4%
Yes No Don’t Know
Scotland’s Councillors 2013 Research Report
31
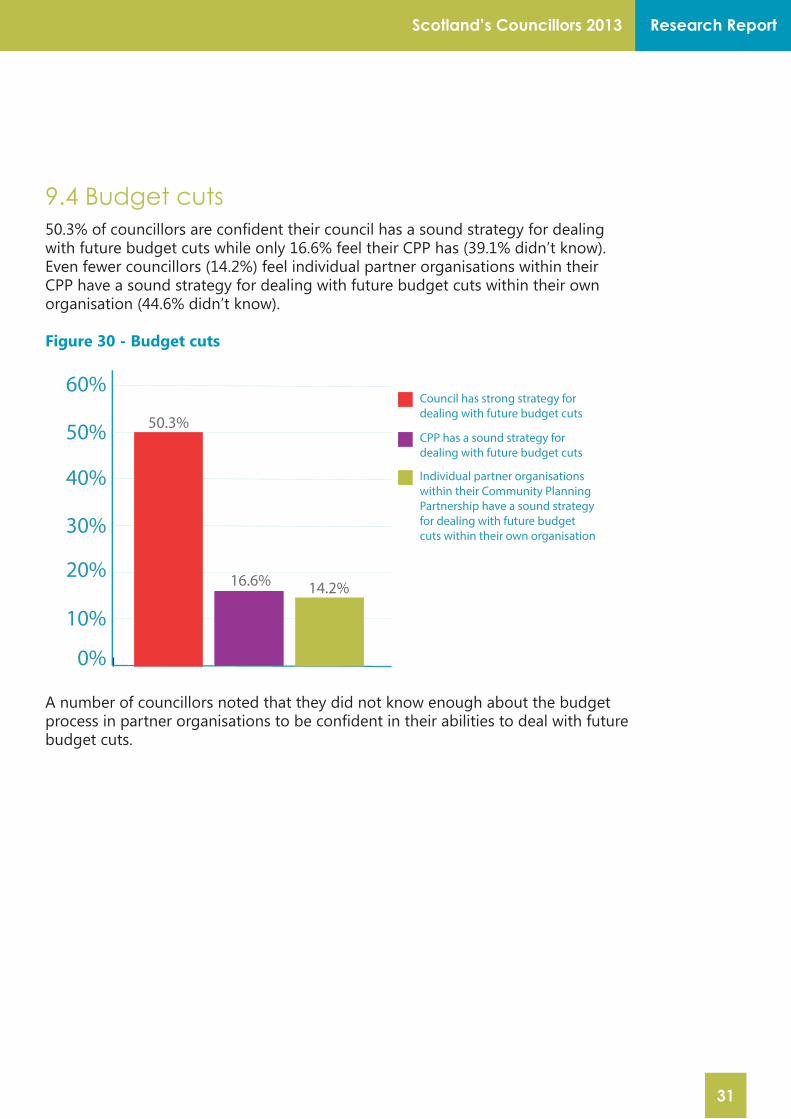
9.4 Budget cuts50.3% of councillors are confident their council has a sound strategy for dealing with future budget cuts while only 16.6% feel their CPP has (39.1% didn’t know). Even fewer councillors (14.2%) feel individual partner organisations within their CPP have a sound strategy for dealing with future budget cuts within their own organisation (44.6% didn’t know).
Figure 30 - Budget cuts
A number of councillors noted that they did not know enough about the budget process in partner organisations to be confident in their abilities to deal with future budget cuts.
0%
10%
20%
30%
40%
50%
60%
50.3%
16.6% 14.2%
Council has strong strategy for dealing with future budget cuts
CPP has a sound strategy for dealing with future budget cuts
Individual partner organisations within their Community PlanningPartnership have a sound strategyfor dealing with future budget cuts within their own organisation
Budget Cuts

Scotland’s Councillors 2013Research Report
32
ReferencesCurtice, J., 2012 Scottish Local Government Elections, Electoral Reform Society
Denver, D., Bochel, H. and Steven, M. (2012), Mixed messages for (some) parties: the Scottish council elections of 2012, Scottish Affairs, 80, 1-12.
Scotland’s Census 2011: Shaping our future, www.scotlandcensus.gov.uk
Scotland’s People Annual Report: Results for the 2011 Scottish Household Survey
Improvement ServiceWesterton House
East Mains Industrial EstateBroxburn
EH52 5AU
T. 01506 775558E. [email protected]
www.improvementservice.org.uk