Scotiabank (Ireland) Designated Activity Company · Scotiabank (Ireland) DAC – Pillar 3...
73
Scotiabank (Ireland) Designated Activity Company Pillar 3 Disclosures As at 31 st October 2018
Transcript of Scotiabank (Ireland) Designated Activity Company · Scotiabank (Ireland) DAC – Pillar 3...

Scotiabank (Ireland) Designated Activity Company
Pillar 3 Disclosures
As at 31st October 2018
Scotiabank (Ireland) DAC – Pillar 3 Disclosures 2018
1
Table of Contents
Table of Contents .............................................................................................................................................................. 1
1 Introduction ................................................................................................................................................................ 5
1.1 Background ....................................................................................................................................................... 5 1.2 Key Changes in the 2018 Pillar 3 Disclosures .................................................................................................. 5
1.3 Scope of Disclosure .......................................................................................................................................... 5
1.4 Principal Activities ............................................................................................................................................. 8
1.5 Business Strategy ............................................................................................................................................. 8
1.6 Key Performance Indicators .............................................................................................................................. 8
2 Capital Adequacy ...................................................................................................................................................... 9 2.1 Capital Management ......................................................................................................................................... 9
2.2 Minimum Regulatory Capital Requirement (Pillar 1) ......................................................................................... 9
2.3 Internal Capital Requirement (Pillar 2) ............................................................................................................ 10
2.4 Leverage Ratio ................................................................................................................................................ 12
3 Risk Management.................................................................................................................................................... 13
3.1 Statement of Internal Controls ........................................................................................................................ 15 3.2 Risk Governance ............................................................................................................................................. 15
3.2.1 Nomination and Directorship ................................................................................................................... 17
3.3 Risk Management Framework ........................................................................................................................ 19
3.3.1 Structure as at 31 October 2018 ............................................................................................................. 19 3.3.2 Revised Structure .................................................................................................................................... 19
4 Credit Risk ............................................................................................................................................................... 20
4.1 Credit Risk Management and Risk Measures ................................................................................................. 21
4.2 Exposure to Credit Risk .................................................................................................................................. 22
4.3 Approaches to Credit Risk .............................................................................................................................. 33
4.4 Credit Risk Mitigation ...................................................................................................................................... 37
4.5 Counterparty Credit Risk ................................................................................................................................. 38 4.6 Credit Risk Stress Testing ............................................................................................................................... 41
4.7 Wrong-way Risk .............................................................................................................................................. 41
5 Market Risk .............................................................................................................................................................. 41
5.1 Market Risk Management and Risk Measures ............................................................................................... 41
5.1.1 Interest Rate Risk .................................................................................................................................... 41 5.1.2 Foreign Exchange Risk ........................................................................................................................... 42
5.2 Market Risk Mitigation ..................................................................................................................................... 42
5.2.1 Interest Rate Risk .................................................................................................................................... 43 5.2.2 Foreign Exchange Risk ........................................................................................................................... 43
5.3 Market Risk Stress Testing ............................................................................................................................. 43
5.3.1 Interest Rate Risk .................................................................................................................................... 43 5.3.2 Foreign Exchange Risk ........................................................................................................................... 43

Scotiabank (Ireland) DAC – Pillar 3 Disclosures 2018
2
6 Operational Risk ...................................................................................................................................................... 43
6.1 Operational Risk Management and Risk Measures ........................................................................................ 43 6.2 Exposure to Operational Risk ......................................................................................................................... 44
6.3 Operational Risk Mitigation ............................................................................................................................. 44
6.4 Operational Risk Stress Testing ...................................................................................................................... 44
7 Information Technology risk .................................................................................................................................... 44
8 Compliance Risk (including Conduct Risk) ............................................................................................................. 45
8.1 Governance and Controls ............................................................................................................................... 45 9 Liquidity Risk ........................................................................................................................................................... 45
9.1 Liquidity Risk Management and Risk Measures ............................................................................................. 45
9.2 Exposure to Liquidity Risk ............................................................................................................................... 46
9.3 Liquidity Risk Mitigation ................................................................................................................................... 48
9.4 Liquidity Risk Stress Testing ........................................................................................................................... 48
10 Concentration Risk .................................................................................................................................................. 49 10.1 Concentration Risk Management and Risk Measures ................................................................................ 49
10.2 Concentration Risk Mitigation ..................................................................................................................... 50
11 Securitisations ......................................................................................................................................................... 50
12 Asset Encumbrance ................................................................................................................................................ 51
13 Remuneration .......................................................................................................................................................... 53
13.1 Qualitative Disclosure.................................................................................................................................. 53 13.1.1 Governance ......................................................................................................................................... 53 13.1.2 Material Risk Taker Criteria ................................................................................................................. 55 13.1.3 Link between pay and performance .................................................................................................... 55 13.1.4 Design and Structure of Remuneration ............................................................................................... 55 13.1.5 Annual Incentives ................................................................................................................................ 56 13.1.6 Deferred Incentives ............................................................................................................................. 56 13.1.7 Risk Management and Risk Adjustment ............................................................................................. 57
13.2 Quantitative Disclosure ............................................................................................................................... 58
13.2.1 Material Risk Takers ............................................................................................................................ 59 13.2.2 All Employees (who are not MRTs) ..................................................................................................... 60 13.2.3 SIDAC Board ....................................................................................................................................... 60
14 Appendix 1 – Countercyclical Capital Buffer ........................................................................................................... 61
15 Appendix 2 – CRR Roadmap .................................................................................................................................. 62
16 Appendix 3 – Geographical Distributions ................................................................................................................ 68
17 Appendix 4 – Additional disclosure Own Funds ...................................................................................................... 69
18 Appendix 5 – Reconciliation of equity in the Financial Statements to Regulatory own funds and main features of the Company’s capital instruments ................................................................................................................................. 70

Scotiabank (Ireland) DAC – Pillar 3 Disclosures 2018
3
Index of tables Table 1 – EU LI1 – Mapping of Financial Statements categories with regulatory risk categories .................................... 6
Table 2 – EU LI2 – Main sources of differences between regulatory exposure amounts and carrying values in Financial Statements ......................................................................................................................................................... 7
Table 3 – Key Performance Indicators .............................................................................................................................. 9 Table 4 – Regulatory Capital Ratios ............................................................................................................................... 10
Table 5 – EU OV1 – Overview of RWAs ......................................................................................................................... 11
Table 6 – LRSum: Summary reconciliation of accounting assets and leverage ratio exposures ................................... 12
Table 7 – LRCom: Leverage ratio common disclosure ................................................................................................... 12
Table 8 – LRSpl: Split-up of on balance sheet exposures (excluding derivatives, SFTs and exempted exposures) .... 13 Table 9 – Risk Appetite Metrics ...................................................................................................................................... 13
Table 10 – 2018 Members of the Board of Directors ...................................................................................................... 17
Table 11 – Directors knowledge, skills and expertise ..................................................................................................... 18
Table 12 – Directorships ................................................................................................................................................. 19
Table 13 – Internal Grading Cross Reference ................................................................................................................ 22
Table 14 – EU CRB-B – Total and average net amount of exposures ........................................................................... 22 Table 15 – EU CRB-C – Geographical breakdown of exposures ................................................................................... 23
Table 16 – EU CRB-D – Concentration of exposures by industry or counterparty type ................................................. 25
Table 17 – EU CRB-E – Maturity of Exposures .............................................................................................................. 26
Table 18 – EU CR1-A – Credit quality of exposures by exposure class and instrument................................................ 28
Table 19 – EU CR1-B – Credit quality of exposures by industry or counterparty types ................................................. 29
Table 20 – EU CR1-C – Credit quality of exposures by geography ............................................................................... 30 Table 21 – EU CR1-D – Ageing of past-due exposures ................................................................................................. 31
Table 22 – EU CR1-E – Non-performing and forborne exposures ................................................................................. 31
Table 23 – EU CR2-A – Changes in the stock of general and specific credit risk adjustments ..................................... 32
Table 24 – EU CR2-B – Changes in the stock of defaulted and impaired loans and debt securities ............................. 32
Table 25 – EU CR4 – Standardised approach – Credit risk exposure and CRM effects ............................................... 34
Table 26 – Exposure by credit quality step (CQS) .......................................................................................................... 34 Table 27 – RWAs and capital requirements by exposure class ..................................................................................... 35
Table 28 – EU CR5 – Standardised approach ................................................................................................................ 36
Table 29 – EU CR3 – CRM techniques – Overview ....................................................................................................... 37
Table 30 – CRM Techniques split by exposure class ..................................................................................................... 37
Table 31 – EU CCR5-A – Impact of netting and collateral held on exposure values ..................................................... 39 Table 32 – EU CCR5-B – Composition of collateral for exposures to CCR ................................................................... 39
Table 33 – EU CCR1 – Analysis of CCR exposure by approach ................................................................................... 40
Table 34 – EU CCR2 – CVA capital charge ................................................................................................................... 40
Table 35 – EU CCR3 – CCR exposures by regulatory portfolio and risk weight – Standardised Approach .................. 40
Table 36 – DV01 changes in value ................................................................................................................................. 41
Table 37 – EU MR1 – Market Risk under the Standardised Approach .......................................................................... 42 Table 38 – Impact of 100 bps shift in interest rate .......................................................................................................... 43

Scotiabank (Ireland) DAC – Pillar 3 Disclosures 2018
4
Table 39 – EU LIQ1 – LCR Disclosure ........................................................................................................................... 47
Table 40 – Total outstanding securitised exposures ...................................................................................................... 50 Table 41 – Encumbered and unencumbered assets ...................................................................................................... 52
Table 42 – Collateral received (encumbered and unencumbered) ................................................................................. 52
Table 43 – Sources of encumbrance .............................................................................................................................. 53
Table 44 – Fixed and Variable Remuneration for MRTs (pro-rated for part-year MRTs or employees who joined SIDAC or transferred out, from the BNS group) ......................................................................................................................... 59
Table 45 – Variable pay earned during fiscal year 2018 for MRTs, split between cash and share linked instruments . 59 Table 46 – Deferred remuneration outstanding as at October 31, 2018 and awarded/redeemed in fiscal 2018 ........... 59
Table 47 – All employee remuneration (excluding MRTs) .............................................................................................. 60
Table 48 – Non-Executive Director Remuneration ......................................................................................................... 60
Table 49 – Countercyclical capital buffer – geographical distribution of credit exposures ............................................. 61
Table 50 – Countercyclical capital buffer ........................................................................................................................ 61
Table 51 – CRR Roadmap .............................................................................................................................................. 62 Table 52 – Transitional own funds disclosure template .................................................................................................. 69
Table 53 – Reconciliation of equity in Financial Statements to Regulatory own funds .................................................. 70
Table 54 – Capital instruments main features template – Ordinary equity ..................................................................... 70
Table 55 – Capital instruments main features – Preference shares ............................................................................... 71

Scotiabank (Ireland) DAC – Pillar 3 Disclosures 2018
5
1 Introduction
1.1 Background
Scotiabank (Ireland) Designated Activity Company (“SIDAC” or the “Company”), is subject to Irish and European Union legislation which seeks to stabilise and strengthen the EU financial system by ensuring that institutions, including the Company, hold adequate capital to meet the potential impact of the risks to which they are exposed. As part of this capital adequacy regime, institutions are required to publicly disclose specified information (“Pillar 3 disclosures”) to enable market participants to understand how an institution implements the applicable legislation. This report represents the Company’s Pillar 3 disclosures as at 31 October 2018 as required under the Capital Requirements Directive (Directive 2013/36/EU) (“CRD IV”), the Capital Requirements Regulation (Regulation (EU) No. 575/2013) (“CRR”), associated implementing legislation and guidelines issued by the European Banking Authority (“EBA”). The Company is required to disclose this information on an annual basis.
1.2 Key Changes in the 2018 Pillar 3 Disclosures
In December 20161 the EBA issued revised guidelines on Pillar 3 disclosures. The Central Bank of Ireland (“CBI”) communicated to the Company in November 2017 in writing that it had determined that the Company should apply the revised EBA guidelines in full. The 2017 report therefore included, for the first time, all required disclosures in a stand-alone document with new qualitative and quantitative data with no requirement under the EBA guidelines to provide prior year comparatives alongside new quantitative data. These comparatives are now included in the 2018 report along with required narrative commentary explaining (at a minimum) any significant changes between reporting periods and any other issues that management considers to be of interest to market participants.
The Company adopted IFRS 9 on 1 November 2017 and chose not to apply the associated transitional arrangements specified in Article 473(a) of the CRR. As such, the Company’s own funds, capital and leverage ratios already reflect the full impact of IFRS 9 ECLs. None of the comparative tables have been restated compared to those reported in the Pillar 3 2017 Disclosures as a result of adoption of IFRS 9.
Following a holistic review, a revised internal governance and management committee structure has been created. The roll-out of this new structure commenced in September 2018 and will be in place by the end of January 2019. See section 3.3.2 for more details.
1.3 Scope of Disclosure
These Pillar 3 disclosures are prepared on an unconsolidated / individual basis. They are disclosed on an annual basis in line with the financial statements and are published on the Company’s website at the following location: https://www.scotiabank.com/global/en/country/ireland.html. Disclosures required under Pillar 3 are only incorporated if they are deemed relevant and material for the Company and if their omission or misstatement would change or influence the assessment or decision of a user relying on the information. Information regarded as proprietary or confidential has been excluded from this document, as allowed under the CRR.
The information provided in this document is not required to be subject to an external audit. These disclosures do not constitute any form of a Financial Statement and should not be relied upon in making any financial or investment decision. The disclosures have been checked for consistency with existing risk reports and appropriateness against the disclosure requirements and have been reviewed by authorised senior management representatives. The disclosures have been deemed adequate, both in terms of frequency and level of detail, to convey SIDAC’s risk profile comprehensively to market participants.
The below table provides a mapping of Financial Statement categories under the regulatory scope of consolidation to regulatory risk categories, as at 31 October 2018. As the Company does not publish consolidated financial statements, a reconciliation of the Company’s balance sheet on an accounting basis to the Company’s balance sheet under the regulatory scope of consolidation is not required.
1 The guidelines were subsequently updated to Version 2 in June 2017.

Scotiabank (Ireland) DAC – Pillar 3 Disclosures 2018
6
Table 1 – EU LI1 – Mapping of Financial Statements categories with regulatory risk categories
31 Oct 2018 31 Oct 2017
b c d e f g
Carrying values under
scope of regulatory
consolidation
Carrying values of items
Carrying values under
scope of regulatory
consolidation
Carrying values of items
US$’000
Subject to the credit
risk framework
Subject to the CCR
framework
Subject to the
securitisation framework
(1) Subject to the market
risk framework
Not subject to capital
requirements or subject to
deduction from capital
Subject to the credit
risk framework
Subject to the CCR
framework
Subject to the
securitisation framework
(1) Subject to the market
risk framework
Not subject to capital
requirements or subject to
deduction from capital
Assets
Cash and balances at central banks 365,445 365,445 - - - - 212,562 212,562 - - - -
Loans and advances to banks 10,402 10,402 - - - - 11,981 11,981 - - - -
Loans and advances to customers 2,679,692 2,393,158 - 286,534 - - 2,827,255 2,529,195 - 298,060 - - Investment securities measured at FVOCI(2) 2,230,620 2,230,620 - - - - - - - - - - Investment securities measured at amortised cost (2) 882,965 882,965 - - - - - - - - - -
Investment securities mandatorily measured at FVTPL (2) 56,863 13,686 - 43,177 - - - - - - - -
Available-for-sale financial assets (2) - - - - - - 2,832,897 2,789,045 - 43,852 - -
Held-to-maturity financial assets (2) - - - - - - 996,001 996,001 - - - -
Derivative financial instruments 107,044 - 107,044 - - - 61,829 - 61,829 - - -
Deferred taxation assets - - - - - - - - - - - -
Tangible fixed assets 360 360 - - - - 278 278 - - - -
Intangible assets 500 - - - - 500 1,034 - - - - 1,034
Other assets 7,803 7,803 - - - - 24,627 24,627 - - - -
Prepayments and accrued income 22,864 20,797 - 2,067 21,119 19,068 - 2,051 - -
Total assets 6,364,558 5,925,236 107,044 331,778 - 500 6,989,583 6,582,756 61,829 343,964 - 1,034
Liabilities
Deposits by banks 136,802 - - - - 136,802 68,057 - - - - 68,057
Customer accounts 91 - - - - 91 11,162 - - - - 11,162
Derivative financial instruments 5,954 - 5,954 - - - 44,960 - 44,960 - - -
Debt securities in issue 3,107,761 - - - - 3,107,761 3,785,309 - - - - 3,785,309
Loan notes - - - - - - 50,000 - - - - 50,000
Deferred taxation liabilities 683 - - - - 683 729 - - - - 729
Current taxation liabilities 7,112 - - - - 7,112 45,674 - - - - 45,674
Accruals, deferred income & other liabilities 38,848 - 11,963 - - 26,885 27,862 - - - - 27,862
Net retirement benefit liabilities 7,892 - - - - 7,892 10,444 - - - - 10,444
Total liabilities 3,305,143 - 17,917 - - 3,287,226 4,044,197 - 44,960 - - 3,999,237
(1) As the Company does not have an active trading book all remaining market risk relates to FX in the banking book. At 31 October 2018 the FX risk exposure was US$ 77,984,000 (2017: US$ 22,030,000) with an associated capital charge of US$ 6,239,000 (2017: US$ 1,762,000). (2) The amounts for the year ended 31 October 2018 have been prepared in accordance with IFRS 9; prior year amounts have not been restated.

Scotiabank (Ireland) DAC – Pillar 3 Disclosures 2018
7
Table 2 outlines, for items subject to the credit risk and counterparty credit risk (CCR) frameworks, a reconciliation of the carrying value of assets to Exposure at Default (EAD).
Table 2 – EU LI2 – Main sources of differences between regulatory exposure amounts and carrying values in Financial Statements 31 Oct 2018 31 Oct 2017
a b c d e
Total
Items subject to
Total
Items subject to
US$’000 Credit risk framework
CCR framework
Securitisation framework
Market risk framework (1)
Credit risk framework
CCR framework
Securitisation framework
Market risk framework (1)
1 Assets carrying value amount under the scope of regulatory consolidation (as per template EU LI1) 6,364,058 5,925,236 107,044 331,778 - 6,988,549 6,582,756 61,829 343,964 -
2 Liabilities carrying value amount under the regulatory scope of consolidation (as per template EU LI1) 17,917 - 17,917 - - 44,960 - 44,960 - -
3 Total net amount under the regulatory scope of consolidation 6,364,058 5,925,236 107,044 331,778 - 6,988,549 6,582,756 61,829 343,964 -
4 Off-balance-sheet amounts 864,317 864,317 936,280 936,280 - - - 5 Differences due to Derivatives 20,375 - 20,375 - - (13,449) - (13,449) - -
6 Differences due to Provisions - - - - - 6,896 6,896 - - -
7 Other (10,905) (8,086) (2,819) - - (1,524) (254) (1,270) - -
8 Exposure amounts considered for regulatory purposes
7,237,845 6,781,467 124,600 331,778 - 7,916,752 7,525,678 47,110 343,964 -
(1) See note on table 1.
The main differences between carrying amounts reported in the Financial Statements and those for Regulatory purpose are:
• Off balance sheet items included as an exposure value for Regulatory purposes; • The following effects recognised in the calculation of Derivative exposure amounts considered for regulatory purposes (i.e. EAD) according to CRR:
- inclusion of derivatives with negative fair value which have been recorded in balance sheet liabilities; - recognition of ISDA netting agreements

Scotiabank (Ireland) DAC – Pillar 3 Disclosures 2018
8
1.4 Principal Activities
The Company, which holds a banking licence, is incorporated in Ireland and is a wholly owned subsidiary of The Bank of Nova Scotia International Limited (“BNSI”), Nassau, Bahamas which is in turn wholly owned by The Bank of Nova Scotia, Toronto, Canada (“Scotiabank” or “BNS”).
The primary activities of the Company are securities investment, treasury management and international corporate lending. The Company’s financial objective is to generate a stable source of income using investment, money market and lending portfolios. Each portfolio is carefully managed and diversified with regard to maturity, credit exposure and currency to achieve this objective, making use of interest rate and currency derivatives to reduce the overall risk profile and to take positions in the market.
1.5 Business Strategy
Following a recent change in internal reporting line from Group Treasury to Global Banking & Markets (GBM) within Scotiabank, the Company is focused on integrating into GBM Europe, recognising the resulting benefit of enhanced global sponsorship across all three lines of defence.
The Company is pivoting from a Corporate Banking referral model to establishing an Origination Desk in Dublin to control business growth and opportunities, including opportunities resulting from Brexit.
In line with Scotiabank, the Company is focused on delivering a superior customer experience and creating shareholder value. In the near term we strive for consistent and predictable financial performance, however the ultimate objective is to position the Company for success over the longer term. The foundation of this is the Company’s strategic agenda, which is set out below along with those elements that must be focused on in order to deliver the strategy - the Company’s strategic priorities :
Enhance Customer Focus
Serve priority, multi-regional clients, aligned with Scotiabank’s global footprint to support GBM’s objective of maintaining a focused presence in the EU and achieve business growth through a focus on up-tiering relationships to maximise Scotiabank’s cross-sell of products and services per client.
Strengthen business partner relationships within the Company and across Scotiabank’s global footprint.
Focus on Talent and Leadership
Build a team of diverse and inclusive-minded leaders to elevate the Company’s performance and proactively develop high potential employees for promotional opportunities.
Elevate performance orientation culture through development and recognition of top performers.
Optimise Effectiveness
Meet Scotiabank targets for NIAT growth and return on Capital, execute productivity leadership by prudent expense and resource management, prioritisation of the efficient use of resources to deliver results, and enable a culture that focuses on driving productivity improvements.
Keep Scotiabank Safe
Champion a strong risk culture which keeps the Company and its customers safe, including alignment with all regulatory requirements.
1.6 Key Performance Indicators
Both the level of business performance and the year-end financial position were satisfactory and the Directors expect that the present level of activity will continue in the future. The Company recorded a profit for the year ended 31 October 2018 of US$ 112.2mm which was an increase of 4.3% from the previous year. Other Key Performance Indicators are:

Scotiabank (Ireland) DAC – Pillar 3 Disclosures 2018
9
Table 3 – Key Performance Indicators
Key performance indicators 2018 2017
Return on Regulatory Capital Employed 10.0% 13.4%
Total Capital Ratio 61.6% 56.3%
Leverage Ratio 42% 37%
Return on Equity (ROE) 3.7% 3.7%
Net Interest Margin 2.5% 2.3%1
1 Restated to exclude short-term assets held for liquidity management.
2 Capital Adequacy
2.1 Capital Management
The Company has complied with all externally imposed capital requirements throughout the period. There have been no material changes in the Company’s management of capital during the year. The Company recognises the need to maintain a balance between the higher returns that might be possible with greater gearing and the advantages and security afforded by a sound capital position. This is achieved through the Internal Capital Adequacy Assessment Process (“ICAAP”).
The overarching principle of the ICAAP is the explicit linkage between capital and risk; the adequacy of the Company’s capital is assessed on the basis of the risks to which it is exposed. This requires a clear assessment of the material risk profile of the Company and a consideration of the extent to which identified risks, both individually and in aggregate, require capital to support them. Banking operations are categorised as either trading book or banking book which informs the capital to be held against the products. In addition, the level of capital held by the Company is influenced by minimum regulatory requirements.
The Company uses two measures for determining capital requirements in the decision-making process:
• Minimum regulatory capital requirements (Pillar 1), and • Internal capital requirement (Pillar 2) under the Supervisory Review and Evaluation Process (SREP)
2.2 Minimum Regulatory Capital Requirement (Pillar 1)
As regards regulatory capital requirements and capital adequacy, the Company is subject to the requirements of the CBI, EBA and the provisions under CRD IV/CRR. The adequacy of the Company’s capital is assessed by comparing available regulatory capital resources with capital requirements expressed as a percentage of risk weighted assets or equivalent. The regulatory minimum ratios (Pillar 1) are as follows, CET 1 and Tier 1 Capital of 4.5% and 6% respectively and a Total Capital ratio of 8%. In addition, the Company is required to maintain a Capital Conservation Buffer comprising CET 1 eligible instruments of 1.875% (increasing to 2.5% on 1 January 2019) of risk weighted assets and also an institution-specific Countercyclical Buffer of CET 1 calculated as risk weighted assets multiplied by a weighted average of countercyclical buffer rates determined by the geographic distribution of the Company’s exposures. As at October 2018 the countercyclical capital buffer stood at 0.2249%, equivalent to US$ 11.2mm (October 2017: 0.0636% equivalent to US$ 3.3mm). Refer to Appendix 1 for the detailed calculation of the countercyclical capital buffer.
Credit risk
The Company uses the Standardised Approach for calculating capital requirements for credit risk. This approach involves the application of risk weights to the Company’s assets based on the deemed creditworthiness of its debtors and the rules as laid out in the CRR. More detail is provided in the Credit Risk section.
The Company utilises the Mark-to-Market method for the computation of counterparty credit risk (CCR), covering over-the-counter (OTC) Derivatives and Securities Financing Transactions (SFT) (repurchase transactions). In addition, banks are required to hold capital against the risk that the credit quality of the counterparties could deteriorate. A Credit Valuation Adjustment (CVA) capital charge is required to cover this risk.

Scotiabank (Ireland) DAC – Pillar 3 Disclosures 2018
10
Market risk
The Company applies the Standardised Approach for the calculation of market risk regulatory capital.
Operational risk
The capital requirement for operational risk is calculated according to the Basic Indicator Approach. This requires the Company to hold a capital amount equal to 15% of the average of the sum of net interest income and net non-interest income for the three preceding 12-month financial periods for which audited financial information is available.
2.3 Internal Capital Requirement (Pillar 2)
The Company defines its internal capital requirement as the capital required to protect it against severe unexpected losses that might put the solvency of the Company at risk. CRD IV requires banks to undertake the ICAAP which is then subject to periodic supervisory review under the SREP process to determine whether or not additional Pillar 2 capital is required for any material risk. In addition to the Pillar 1 capital the Company holds Pillar 2 capital, as considered necessary, for those additional risks not captured in the Pillar 1 computation. The additional risks identified through the ICAAP process are credit concentration risk, interest rate risk in the banking book, credit spread volatility risk and pension risk. As at 31 October 2018 the Company was required to maintain a Pillar 2 requirement of 2.82% (2017: 3.125%).
In addition, a new measure called Pillar 2 Guidance (“P2G”) was applied to the Company by the CBI in 2018. P2G is a supervisory tool setting capital expectations at a level above that of overall capital requirements and is based on the SREP process. It is an assessment of the adequacy of an institution’s own funds in stressed conditions. While not an own funds requirement, failure to meet P2G could result in institution-specific supervisory measures.
From 1 January 2019, the Company will be required to maintain a Total Capital ratio of 13.32%. This comprises the above Pillar 1 requirement of 8%, a capital conservation buffer for 2019 of 2.5% and the Pillar 2 requirement of 2.82%.
Table 4 – Regulatory Capital Ratios Transitional Fully Loaded Transitional Fully Loaded US$'000 31 October 31 October 31 October 31 October OWN FUNDS 2018 2018 2017 2017 Common Equity Tier 1 Capital (CET1)
Paid up ordinary shares 40,000 40,000 40,000 40,000 Capital contribution reserve 812,194 812,194 811,092 811,092 Retained earnings 2,166,578 2,166,578 2,035,621 2,035,621 Accumulated other comprehensive income 643 643 18,673 18,673 CET1 Capital before Regulatory Adjustments 3,019,415 3,019,415 2,905,386 2,905,386 Regulatory Adjustments to CET1 Capital
Deductions from Own Funds
Additional value adjustments (2,400) (2,400) (2,266) (2,833) Intangible assets (500) (500) (1,034) (1,034) Qualifying AT1 deductions that exceed the AT1 capital of the institution - - (207) - Prudential Filters
Unrealised gains and losses measured at fair value - - (3,735) - Intangible assets - - 207 - Defined benefit pension obligations - - 1,444 - Total Regulatory Adjustments to CET1 Capital (2,900) (2,900) (5,591) (3,867) CET1 Capital/Tier 1 Capital 3,016,515 3,016,515 2,899,795 2,901,519 Tier 2 Capital Paid up perpetual non-cumulative preference shares 40,000 40,000 40,000 40,000 Own Funds 3,056,515 3,056,515 2,939,795 2,941,519 Capital Requirements - Pillar I Credit risk 368,791 368,791 399,259 399,259 Market risk 6,239 6,239 1,762 1,762 Of which: FX 6,239 6,239 1,762 1,762 Operational risk 19,437 19,437 15,709 15,709

Scotiabank (Ireland) DAC – Pillar 3 Disclosures 2018
11
Transitional Fully Loaded Transitional Fully Loaded US$'000 31 October 31 October 31 October 31 October OWN FUNDS 2018 2018 2017 2017 Credit Valuation Adjustment risk 2,252 2,252 843 843 Capital Requirements - Pillar I 396,719 396,719 417,573 417,573 Risk Weighted Assets (or Equivalent) Credit risk 4,609,892 4,609,897 4,990,731 4,990,731 Market risk 77,984 77,984 22,030 22,030 Of which:
FX 77,984 77,984 22,030 22,030
Operational risk 242,965 242,965 196,365 196,365 Credit Valuation Adjustment risk 28,152 28,152 10,540 10,540 Risk Weighted Assets (or Equivalent) 4,958,993 4,958,998 5,219,666 5,219,666 Capital Ratios CET1 capital ratio 60.8% 60.8% 55.6% 55.6% T1 capital ratio 60.8% 60.8% 55.6% 55.6% Total capital ratio 61.6% 61.6% 56.3% 56.4%
The total capital ratio increased by 5.3% due to the combined effect of reduction in RWA (due to asset size) and increase in Own Funds (due to 2018 profit for the year). For further information on Transitional Own Funds, see the disclosure in Appendix 4. A reconciliation of equity in Financial Statements to Regulatory own funds and the main features of the Company’s capital instruments is contained in Appendix 5.
Risk Weighted Asset Calculation
Exposures and Risk Weighted Assets (RWAs) for the Company, with the minimum capital requirements as at 31 October 2018 are outlined in the following table.
Table 5 – EU OV1 – Overview of RWAs US$'000 RWAs Minimum
capital requirements
RWAs Minimum capital
requirements Breakdown by risk type 31 Oct 2018 31 Oct 2018 31 Oct 2017 31 Oct 2017
1 Credit risk (excluding CCR) 3,925,630 314,050 4,334,401 346,752
2 Of which the standardised approach 3,925,630 314,050 4,334,401 346,752
6 CCR 90,391 7,231 34,095 2,728
7 Of which mark to market 62,239 4,979 23,555 1,884
12 Of which CVA 28,152 2,252 10,539 843
13 Settlement risk - - - -
14 Securitisation exposures in the banking book (after the cap) 622,023 49,762 632,775 50,622
18 Of which standardised approach 622,023 49,762 632,775 50,622
19 Market risk 77,984 6,239 22,030 1,762
20 Of which the standardised approach 77,984 6,239 22,030 1,762
22 Large exposures - - - -
23 Operational risk 242,965 19,437 196,365 15,709
24 Of which basic indicator approach 242,965 19,437 196,365 15,709
27 Amounts below the thresholds for deduction (subject to 250% risk weight) - - - -
28 Floor adjustment - - - -
29 Total 4,958,993 396,719 5,219,666 417,573 The main drivers of the reduction in RWA are a reduction in credit risk (due to asset size), partially offset by an increase in market risk (FX risk) and operational risk (due to increased average operational income under the basic indicator approach).

Scotiabank (Ireland) DAC – Pillar 3 Disclosures 2018
12
2.4 Leverage Ratio
The leverage ratio is a supplementary non-risk based measure to constrain the build-up of leverage (i.e. create a backstop on the degree to which a banking firm can leverage its capital base). It is calculated as a percentage of Tier 1 capital versus the total on and off balance sheet exposure (not risk weighted).
The following tables analyse the leverage ratio exposures of the Company for the year end 31 October 2018 and comparable.
Table 6 – LRSum: Summary reconciliation of accounting assets and leverage ratio exposures US$'000 31/10/2018 31/10/2017
1 Total assets as per published Financial Statements 6,364,558 6,989,584
4 Adjustments for derivative financial instruments 14,775 (16,023)
5 Adjustment for securities financing transactions (SFTs) - -
6 Adjustment for off-balance sheet items (i.e. conversion to credit equivalent amounts of off-balance sheet exposures) 864,424 936,280
7 Other adjustments (2,764) (3,818)
8 Leverage ratio total exposure measure 7,240,993 7,906,023
Table 7 – LRCom: Leverage ratio common disclosure
CRR leverage ratio exposures
US$'000 31/10/2018 31/10/2017
On-balance sheet exposures (excluding derivatives and SFTs)
1 On-balance sheet items (excluding derivatives, SFTs and fiduciary assets, but including collateral) 6,254,869 6,926,500
2 (Asset amounts deducted in determining Tier 1 capital) (2,900) (3,867)
3 Total on-balance sheet exposures (excluding derivatives, SFTs and fiduciary assets) 6,251,969 6,922,633
Derivative exposures
4 Replacement cost associated with all derivatives transactions (i.e. net of eligible cash variation margin) 93,237 19,967
5 Add-on amounts for PFE associated with all derivatives transactions (mark-to-market method) 31,363 27,143
7 (Deductions of receivables assets for cash variation margin provided in derivatives transactions) - -
11 Total derivatives exposures 124,600 47,110
SFT exposures 14 Counterparty credit risk exposure for SFT assets - -
16 Total securities financing transaction exposures - -
Other off-balance sheet exposures
17 Off-balance sheet exposures at gross notional amount 1,756,831 1,963,433
18 (Adjustments for conversion to credit equivalent amounts) (892,407) (1,027,153)
19 Other off-balance sheet exposures 864,424 936,280
Capital and total exposure measure 20 Tier 1 capital 3,016,515 2,901,519
21 Leverage ratio total exposure measure 7,240,993 7,906,023
Leverage ratio
22 Leverage ratio 41.7% 36.7%
Choice on transitional arrangements and amount of derecognised fiduciary items
EU-23 Choice on transitional arrangements for the definition of the capital measure Fully phased in
EU-24 Amount of derecognised fiduciary items in accordance with Article 429(11) of Regulation (EU) No 575/2013 - -

Scotiabank (Ireland) DAC – Pillar 3 Disclosures 2018
13
Table 8 – LRSpl: Split-up of on balance sheet exposures (excluding derivatives, SFTs and exempted exposures) CRR leverage ratio exposures
US$'000 31/10/2018 31/10/2017
EU-1 Total on-balance sheet exposures (excluding derivatives, SFTs, and exempted exposures), of which: 6,254,869 6,926,500
EU-2 Trading book exposures - -
EU-3 Banking book exposures, of which: 6,254,869 6,926,500
EU-4 Covered Bonds 59,539 91,336
EU-5 Exposures treated as sovereigns 2,021,226 2,239,483
EU-6 Exposures to regional governments, MDB, international organisations and PSE not treated as sovereigns 196,286 165,327
EU-7 Institutions 240,028 277,635
EU-10 Corporate 3,362,350 3,709,020
EU-11 Exposures in default 27,885 26,653
EU-12 Other exposures (e.g. equity, securitisations, and other non-credit obligation assets) 347,555 417,046
The leverage ratio moved to 41.7% at 31 October 2018 from 36.7% at 31 October 2017. The increase was driven by decreases in exposures to both corporates and sovereigns, coupled with an increase in tier 1 capital (see table 7).
The Company manages the risk of excessive leverage through the use of two risk appetite metrics which are presented to the Risk Committee on a quarterly basis and outlined in Table 9 below.
3 Risk Management
Introduction
The Company’s financial risk management objective is the prudent management of risk within the parameters of the risk appetite articulated by the Board of Directors (“the Board”), ensuring an appropriate balance between risk and reward in order to maximise shareholder returns. The Company has put in place a disciplined and constructive control environment in which all employees understand their roles and obligations. As part of this framework, the Company has defined a suite of risk metrics, the main ones being:
Table 9 – Risk Appetite Metrics
Category Measure Risk Appetite Metrics Risk Appetite Limit Early Warning Threshold
Enterprise Risk Capacity Total Capital
Ratio
Total Capital ratio > 14.5% <20%
Enterprise Risk Appetite
Total Capital ratio may not fall more than 10% below planned level for the fiscal year >49.4% <52%
Leverage Leverage Ratio
Leverage Ratio may not be > 5 percentage points lower than the planned Ratio for the current fiscal year. >37% <39%
“Floor” Leverage Ratio 6% 10%
Earnings
Sustainable Earnings
(Net Interest + Fees) / Total Operating Income: Minimum Target Ratio 35% <40%
Return on Capital
Scotiabank Consolidated: Return on Attributed Capital: Guidance range 14%-18% Guidance Ratio
<15% or >17%
Local Purposes: Return on Regulatory Capital Employed: Guidance range 5%-10%
Guidance Ratio <6% or >9%
Credit Risk
Corporate Loans
Max Corporate Loan Commitments US$6.5 bn >US$6bn
Minimum Rating (on date of first commitment) IG77 None
Investment Bond Book
Maximum Exposure US$5 bn >US$4.5bn
Minimum Credit Quality at purchase Investment Grade None
All portfolios Max loan loss experienced in any one fiscal year (To include changes in Expected Credit Losses (ECL) relating to IFRS 9)
<1% of authorised committed loan
facilities Loan losses >0.75%

Scotiabank (Ireland) DAC – Pillar 3 Disclosures 2018
14
Liquidity Risk
LCR Liquidity Coverage Ratio >120% <125%
WART WART metric >70 days <75 days
NSFR NSFR (Effective 30 June 2018) >105% >110%
Market Risk (Trading) N/A Not specified at present due to inactivity in trading portfolios N/A N/A
Structural Risk (IRRBB & FX)
Annual Income Interest Rate: Annual Income US$35mm US$30mm
Economic Value Interest Rate: Economic Value US$100mm US$80mm
Concentration Risk
Concentration of Credit Risk, Geographic Risk, Funding Risk, Market Risk
Material Concentration of Credit Risk, Geographic Risk, Funding Risk, Market Risk *except where expressly ratified by the Board
None*
Credit/geographic concentration >23%
Funding concentration (non-Scotiabank)
>25%
Earnings (Market risk) concentration >45%
Compliance Risk
Regulatory fines Regulatory fines/sanctions Zero tolerance None
Reputational Risk
Brand / franchise value
Negative impacts to Scotiabank brand / franchise value arising from SIDAC activity or deficiency including any failing arising from AML or Anti-terrorist Financing obligations.
Zero tolerance None
Operational Risk
Operational Risk events
Max Operational loss US$100k >US$50k
# of high severity Operational risk events Zero None
Outsourcing # of material1 issues per quarter identified by the SLA performance monitoring <=1 None
IT & Cybersecurity Risk
Systems availability Systems Availability - Downtime tolerance2
<1% downtime for systems outages
<5% degradation of system performance
>0.75% downtime for systems outages
>4% degradation of system performance
IT Support IT Support Processes
Zero tolerance for issue giving rise to a
High Severity Operational Risk
Event
None
(1) Where an event, issue or failure on behalf of a service provider causes SIDAC to be unable to: satisfy financial and regulatory reporting or other legal or regulatory obligations within required timelines, where failure to so do would result in an a ‘High Severity’ operational risk event; operate within Board approved Risk Appetite metrics; a “material issue” is deemed to have occurred.
(2) Downtime is computed locally based on the five defined key systems, using an “uptime” measure of 240 hours per month.
The application of the control environment is through training, management standards and procedures. In the view of the Board the Risk Management Framework (as described below), which is modelled significantly on that of its ultimate parent Scotiabank, is appropriate to the size and scale of operations of the Company and is effective in controlling these operations within the expressed risk appetite.
The Company has identified the following risks as material:
• Credit risk • Concentration risk • Credit Spread Volatility risk • Market risk • Liquidity risk • Operational risk • Information Technology risk • Compliance risk (including Conduct Risk)
In addition to the above, the Company has assessed Reputational risk (the potential that negative publicity regarding the Company’s conduct, business practices or associations, whether true or not, will adversely affect its revenues, operations or customer base, or require costly litigation or other defensive measures) and has determined that it is not a material risk in respect of the Company as a standalone entity. Rather than being considered separately, reputational risk is considered inherent in any activity conducted, or association maintained, by the Company and the successful management of reputational risk is inextricably linked to the successful management of all other risks, especially
Scotiabank (Ireland) DAC – Pillar 3 Disclosures 2018
15
Compliance and Operational Risk as well as Credit and Market Risk. Information regarding the principal risks and uncertainties facing the Company and its capital management policies are set out below. The Board actively oversees the management of these risks by monitoring of performance against the risk metrics which it has established and also via means of stress testing.
The Company’s policy is to hedge certain risks including:
• interest rate risk: using interest rate swaps and interest rate futures; and • currency exposures: using foreign exchange contracts.
More detailed information on risk mitigation is presented in the paragraphs below for each type of risk.
3.1 Statement of Internal Controls
The Board acknowledges its responsibility to maintain a sound system of internal control, to safeguard the shareholder’s investment and the Company’s assets and to set appropriate policies, controls and limits for the Company’s operations. It further recognises its obligation to seek regular assurance that will enable it to satisfy itself that the system is functioning properly. The Board is assisted in its responsibilities by its Risk and Audit Committees. The Board Risk Committee (BRC) reviews and challenges the risk management policies, controls and limits, recommending them for Board approval, and oversees the management of material risks through receipt of reports from management across the Company’s universe of material risks. The Audit Committee (AC) monitors the effectiveness of controls through reviewing and assessing reports presented by the heads of control functions as well as Internal Audit and Scotiabank Group Internal Audit (GIA).
The Board recognises that sound risk management is essential to the Company’s prudent operation. The Board charges management with developing the required control system and implementing its policies, controls and limits. This includes the process of identifying, evaluating and managing the risks faced by the Company. It receives comfort that these duties have been exercised during the year under review through the regular reporting structure and periodic discussions between Board, AC and BRC members and Senior Management.
Assessment of internal controls by the Board and its Committees consists of quarterly reviews of submissions by Senior Management incorporating information on key risks, financial performance, limit usage and details of any unforeseen events. The Board is satisfied that the procedures and processes outlined above have been in operation throughout the year and may request the implementation of revisions or improvements as it deems appropriate.
The internal control system is designed to mitigate risk and cannot be seen as a method by which all risk can be eliminated. Therefore it provides reasonable rather than absolute assurance against material loss or misstatement. The Company is subject to the CBI “Corporate Governance Requirements for Credit Institutions 2015” (the “Governance Requirements”). The Company does not have to comply with the additional obligations in Appendices 1 and 2 of the Governance Requirements for High Impact designated credit institutions.
3.2 Risk Governance
The main elements of the Company’s risk governance model include:
• The Board of Directors • Board Committees • Senior Management
As mentioned in section 1.2 a revised internal governance and management committee structure has been created, the roll-out of which commenced in September 2018 and will be in place by the end of January 2019. The new structure will enable more focused discussions by the appropriate committee members and decision makers and is detailed in section 3.3.2.

Scotiabank (Ireland) DAC – Pillar 3 Disclosures 2018
16
• The Board of Directors
The Board of Directors, either directly or through its Committees ensures that decision-making is aligned with the Company’s strategies and risk appetite.
The Board believes that its membership should be composed of highly qualified directors from diverse backgrounds, who have familiarity with the financial industry in the European Union and in Ireland in particular, and who reflect the required expertise and skill sets appropriate for Directors supervising the management of the business and affairs of the Company, and that they should demonstrate sound and independent business judgement, based on the criteria detailed in section 3.2.1 below.
The Board reviews and approves policies designed to help mitigate the risks faced by the business and sets limits to control the level of exposure to these risks. Policies are reviewed regularly to reflect changes in market conditions, regulatory requirements or product mix.
The Board of Directors has the ultimate responsibility for ensuring that Senior Management establishes and maintains:
- An adequate and effective system of internal control; - A measurement system for assessing the various risks of the Company’s activities; - A system for relating risks to the capital level; and - Appropriate methods for monitoring compliance with laws, regulations and supervisory and internal policies.
• Board Committees
The BRC assists the Board in risk and capital issues, especially in:
- Understanding the risks run by the Company which are typically inherent in banking activities; - Overseeing that these risks are appropriately and effectively managed; - Setting and monitoring risk appetite metrics; and - Ensuring the adequacy of the Company’s capital in relation to the risks inherent in the operations as a whole.
The AC assists the Board in:
- Fulfilling its supervision and monitoring duties in the area of internal controls, including internal control over financial reporting.
- Reviewing the financial statements of the Company. - Monitoring compliance with the Company’s risk management controls and procedures.
The Board and its Committees meet at least quarterly and review detailed information provided on all areas of the Company’s operation, including, but not limited to, all of the risk areas set out above. The Chairpersons of the AC and BRC report to the Board on the topics discussed by the Committees and submit recommendations to the Board for final decision-making.
• Senior Management
The Board has delegated the day-to-day management of the Company to the Chief Executive Officer (CEO). The CEO is assisted by Senior Management who are responsible for managing the Company by setting strategic goals and high-level policy in the area of risk management (including monitoring risk reports) and allocating capital. In carrying out their roles the CEO and Senior Management are assisted by the Management Committees and the Risk Management function.
The Company operates a “Three Lines-of-Defence” model under its Risk Management Framework (see section 3.3). Within this model, the First Line of Defence (the 1LOD) incur and own the risks, while the Second Line of Defence (comprised of control functions such as Risk Management, Compliance and Finance – the 2LOD ) provide independent oversight and objective challenge to the First Line of Defence, as well as monitoring and control of risk. Internal Audit Department (the 3LOD) provides enterprise-wide independent assurance over the design and operation of SIDAC’s internal control, risk management and governance processes throughout the first and second lines of defence. Employees in every area of the organization are responsible for risk management.

Scotiabank (Ireland) DAC – Pillar 3 Disclosures 2018
17
3.2.1 Nomination and Directorship
Management Body
The Board has a broad range of expertise across a number of relevant areas including accounting, risk management, taxation and legal matters. During 2018, the Board comprised of six directors made up of one Executive Director, one group non–executive director and four independent non-executive directors as shown below. The Corporate Governance structure is documented in a policy paper which is approved by the Board.
Table 10 – 2018 Members of the Board of Directors
Name Roles/Job Titles Board Member Member of Sub-
Committee of the Board
Andrew Branion Scotiabank (BNS) Executive Vice-President and Group Treasurer Group Non-Executive Director (Chair of SIDAC Board) BRC
Nicola Vavasour SIDAC CEO (appointed 21 May 2018) Executive Director N/A
Bob Brooks Risk Management professional in various banks Independent Non-Executive Director Chair of BRC
Mary Walsh Chartered Accountant and former International tax partner Independent Non-Executive Director Chair of AC
Máire O’Connor Solicitor and former partner at McCann Fitzgerald Solicitors Independent Non-Executive Director AC and BRC

Scotiabank (Ireland) DAC – Pillar 3 Disclosures 2018
18
Name Roles/Job Titles Board Member Member of Sub-
Committee of the Board
Susan Foster* SIDAC CEO (resigned 21 May 2018) Executive Director BRC
Michael Bourke* Bank Director and Chairman of Supervisory Board of Parex Bank Group, Latvia (resigned 5 February 2018) Independent Non-Executive Director AC and BRC
*Resigned during 2018
Recruitment Policy for Board of Directors
Diversity
The Company’s Board is composed of highly qualified directors from diverse backgrounds, who have familiarity with the financial industry in the European Union and Ireland in particular.
To support this composition as part of the Board’s commitment to sound and effective corporate governance practices, the Board will, when identifying candidates, and bearing in mind the desire for a diverse Board and diversity criteria, including gender, age, ethnicity and geographic background, recommend for appointment to the Board only those candidates who:
• have the relevant skills, experience, expertise, knowledge, appropriate qualification for role (e.g. accounting, auditing for Audit Committee and risk management for Board Risk Committee) and;
• have the necessary personal qualities, professionalism and integrity expected of a Board member.
As part of its commitment to board diversity, the Company is a member of the 30% Club Ireland. The Board’s Diversity Policy states that it aspires to have each gender comprise at least 30% of the Board. For 2018, based on the periods served on the Board, this target was achieved with 57% of serving directors being women. SIDAC is committed to having a diverse board, to achieving the aspirations set in this regard and to ensuring an open and fair recruitment process. As part of the process underpinning the Board’s annual confirmation of compliance with the CBI Corporate Governance Requirements (2015), the Board undertakes an annual review of its Board Diversity Policy’s effectiveness in its review of Board effectiveness.
Selection Criteria and Policy
The Board as a whole must have the relevant financial and risk expertise. When appropriate the Board may engage qualified independent external advisors to conduct a search for candidates who meet the Board’s expertise, skills and diversity criteria to help achieve its diversity aspirations.
The Board is responsible for either the appointment of Independent Non-Executive Directors or where appropriate identifying and proposing the appointment of Independent Non-Executive Directors to shareholders. Before appointment to the Board, the proposed director must show that the individual satisfies the selection criteria applicable to the role for which the individual is being proposed for appointment, evidencing items such as their skills, experience, expertise, competencies, professionalism, fitness, probity and integrity to carry out his or her duties, including a knowledge and appreciation of public issues and familiarity with local, national and international affairs.
Table 11 – Directors knowledge, skills and expertise Name Knowledge, skills and expertise
Andrew Branion
Mr. Branion’s current position is the Executive Vice President and Group Treasurer of BNS. He is also a member of both the BNS Market Risk Management and Policy Committee, and of the BNS Asset and Liability Committee (“ALCO”). Previously, Mr. Branion was Chief Market Risk Officer and prior to that Head of Risk Policy and Capital Markets, Global Risk Management (“GRM”), BNS. Mr. Branion has also held various senior roles in GBM. Prior to joining BNS Mr. Branion worked for the Bank of Canada.
Nicola Vavasour
Ms. Vavasour was appointed to the position of CEO on 21 May 2018. Prior to her current role, Ms. Vavasour was Scotiabank’s Chief Risk Officer, Asia Pacific where she was responsible for the overall efficient and effective management, monitoring and reporting of all risks across Scotiabank’s Asia Pacific operations. Prior to this Ms. Vavasour was responsible for developing Scotiabank’s global Liquidity Risk Framework in Toronto.
Bob Brooks Mr. Brooks has occupied Senior Risk Management roles at a number of major UK banks including NatWest and HBOS and more recently was engaged as a consultant to Daiwa Capital Markets. He is currently supporting the UK Asset and Liability Management Association in developing a new professional banking exam syllabus.
Mary Walsh Ms Walsh, a chartered accountant, is a former international tax partner with over 25 years’ experience at PwC. Her Non-Executive Directorships include the National Treasury Management Agency. She was a member of the Commission on Taxation and has also held a Directorship with the Central Bank of Ireland during which time she chaired its Audit Committee.

Scotiabank (Ireland) DAC – Pillar 3 Disclosures 2018
19
Name Knowledge, skills and expertise
Máire O’ Connor
Ms O’ Connor, a solicitor, is a retired partner from McCann Fitzgerald where she was Head of the Investment Management Group. Previously she was a Partner and Head of the Investment Management Group at Ernst & Young and was also a Director of NCB Corporate Finance Limited. She currently holds a number of Directorships of Irish Regulated Investment Companies. She is also a former director of the Irish Stock Exchange.
Susan Foster* Ms Foster was SIDAC’s CEO until her resignation on 21 May 2018. She has extensive experience in market, liquidity and credit risk management. Previously, Ms Foster was Vice President International Banking, Treasury Business Development and Support. Prior to this Ms Foster held various Market Risk related Vice President positions in GRM, BNS.
Michael Bourke* Mr. Bourke worked for many years in various capacities in the Central Bank of Ireland and has also worked with the International Monetary Fund. He has also held Executive and Non-Executive Directorship roles for Latvian banks where he was involved in building management and risk management regimes. Mr. Bourke resigned on 5 February 2018.
*Resigned during 2018
Directorship
Appointments must not proceed where possible conflicts of interest may emerge which are significant to the overall work of the Board. The following Directorships are held by members of the Board, none of which was at an institution.
Table 12 – Directorships Name No. of directorships‡
Andrew Branion 1
Nicola Vavasour 0
Bob Brooks 0
Mary Walsh 4
Máire O’ Connor* 10
Susan Foster† 0
Michael Bourke† 1 *8 Directorships were approved by the CBI. †Resigned during 2018. ‡These totals also include pro bono directorships of Public Interest Bodies or Charities.
3.3 Risk Management Framework
The Company has implemented a Risk Management Framework which is captured in a Board approved document of that name. This Framework is the key source of information for the Board, Senior Management, and all other employees of the Company that describes how the Company identifies, measures, manages and controls the key risks to which it is exposed, as well as the risk governance, risk management principles, risk culture, risk management tools and the other key elements of its risk management framework; and represents the over-arching framework for all elements of risk management activities.
3.3.1 Structure as at 31 October 2018
The Board and its AC and BRC sit at the head of the Company risk management structure. The Senior Management team acting through the Senior Management Committees, which throughout the year comprised the Risk Management Committee (RMC), Compliance & Regulatory Committee (C&RC) and the Human Resources Committee (HRC) (together the ‘Management Committees’), are responsible for risk management under the direct oversight of the CEO. These Committees are supported by the Risk Management, Compliance and Internal Audit functions as well as an Advice and Counsel process involving Scotiabank technical groups, which includes GRM.
3.3.2 Revised Structure
Following a holistic review of the existing management committee structure a revised internal governance and committee structure has been created. The roll-out of this new structure commenced in September 2018 with the formation of a new Credit Committee, followed by the formation of an Executive Committee and its new sub-committees on 12th December 2018, with all new committees agreeing their mandates. All the remaining committees will commence

Scotiabank (Ireland) DAC – Pillar 3 Disclosures 2018
20
by the end of January 2019. Whereas the old structure consisted of the RMC, C&RC and HRC; The new structure which will enable more focused discussions by the appropriate committee members and decisions makers, consists of2:
- Executive Committee (ExCo) an overarching committee which will focus on significant matters of strategy, operations, governance etc.
- The Asset & Liability Committee (ALCO) which is supported by its sub-committee: Recovery and Liquidity Crisis Committee (RLCC)
- Credit Committee - Operational Risk Committee - Compliance and Regulatory Committee - Remuneration Oversight Committee (ROC)3. The remuneration oversight role that was previously undertaken
by the HRC is now the responsibility of ROC and this is supported by a new sub-committee: Conduct Risk Committee. The remaining responsibilities of the HRC have been taken over by the ExCo.
The RMC and HRC are being unwound as they transfer responsibilities to the new committees. The diagram below sets out this new governance structure and provides more details on the roles of each committee. This structure has been designed so that ultimate responsibility for implementing and maintaining the structure and for reviewing its effectiveness lies with the Board of Directors.
4 Credit Risk
Credit risk is the risk of financial loss resulting from the failure of a customer, for any reason, to fully honour its financial or contractual obligations.
2 The CEO is supported in their governance of SIDAC by the management committees and in particular the ExCo as outlined above and sits on the Board serving as the main link between the board and the executive.
ExCo focuses on significant matters of culture and conduct, strategy, operations, governance and control in order to provide a key forum for the effective, coordinated management and oversight of SIDAC. ExCo is comprised of the Chief Executive Officer of SIDAC as its Chair and senior management from each business line and support and control functions.
3 ROC is responsible for providing oversight and guidance to management and the board on HR remuneration matters and to oversee implementation of compensation policies and procedures. Conduct Committee, a sub-committee of ROC, ensures there is an appropriate linkage between compensation and behaviours
* The Head of HR, as appropriate, may present directly to the Board of Directors without the CEO present.

Scotiabank (Ireland) DAC – Pillar 3 Disclosures 2018
21
4.1 Credit Risk Management and Risk Measures
The Company’s management of credit risk includes the credit risk policies, guidelines, procedures and processes that articulate the Company’s credit risk governance, management and control structures. This framework ensures that credit risk exposures are adequately assessed, properly approved and actively managed in a consistent manner across all business lines. Management of the credit risk portfolios also encompasses a Scotiabank risk culture approach, in-house credit experience, infrastructure and a due diligence process that is closely embedded within the risk management structure. The Company’s Credit Risk Management Policy sets out the processes and procedures to measure credit risk. The Company has adopted Scotiabank’s Credit Policy Manual, having assessed its suitability for the Company, which defines its approach to the measurement of credit risk. The Company has established a Credit Loss and Provisioning Policy that sets out the approach to identifying, assessing and quantifying impairments and resultant credit losses. The Company has access to and benefits from Scotiabank origination (through its affiliates Scotiabank Europe plc and Scotia Capital USA), execution and Scotiabank GRM risk management resources and these relationships are managed through a Master Service Level Agreements (MSLA).
As detailed above, a dedicated Credit Committee (CC) has been formed to replace the credit risk responsibilities previously undertaken by the RMC. The CC has a mandate to oversee the credit risk of the Company, assess potential new credit exposures and deterioration in credit profile ensuring that credit risk and portfolio composition are kept within the risk appetite approved, at least annually, by the Board.
In relation to credit risk and under the Company’s Three Lines-of-Defence structure the Credit Risk function (CRF) is charged with 2nd line of defence responsibility for assessing, challenge and controlling credit risk. It is required to review, assess and challenge all initial credit applications and reviews, including assessing the appropriateness of due diligence conducted by the business lines. The CRF ensures the risk appetite as set by Board and credit related processes and policies are adhered to and that that problem loans are promptly identified, properly assessed and classified, and effectively followed up by the business lines. It tracks the quality of credit portfolios, monitoring for Early Warning Indicators (EWIs) and managing the reporting process, including Heightened Monitoring and Watchlist Reports, Single Name Limits and Board Reports. The CRF also reviews and assesses the appropriateness of recommendations in relation to impairment assessment and provisioning including Expected Credit Losses; ensures that Credit Risk Management policies and programs and risk rating systems are documented, reviewed, and updated to reflect material changes; and reviews and implements Credit Risk measurement and mitigation methodologies.
The Company’s primary sources of credit risk arise from lending and investment business:
• Corporate lending; • Sovereign, SSAs bonds/bills; • Non-sovereign bonds (predominantly senior unsecured investment grade corporate bonds); • Financial Institutions bonds (predominantly covered bonds); and • Derivatives and repurchase agreements (risk mitigated and limited to overnight risk by Credit Support Annexes
(CSAs) and other margining arrangements) which fall under the category of CCR (section 4.5).
The Company’s Corporate Lending business operates within the global Scotiabank business line as part of a global strategy to cross sell multi-products to customers in a disciplined manner. The Company’s lending is largely in the form of syndicated or bilateral loans with investment-grade borrowers. The objective of this portfolio is to generate sustainable income accruals while maintaining a capital preservation ethos. The focus of the portfolio is on the key industries in which Scotiabank is an established lender and borrowers are normally in the top tier of their industry and the Company endeavours to maintain a diversified portfolio through the credit assessment process and controls absolute levels using Board Industry limits.
The Company’s Treasury Investment business operates closely with the overall Scotiabank Group Treasury business line in executing the global liquidity strategy, purchasing bonds that not only are required for regulatory liquidity management but also to complement that global strategy. Combined with the liquidity strategy the team may make other investments which have a greater emphasis on investment return than liquidity.
Credit Risk limits encompass Counterparty, Single Name, and Country & Industry Limits. Counterparty limits are established per transaction type while the Company has well-documented maximum exposure guidelines relating to any individual borrower/ counterparty, country or industry. A high level of concentration exposes SIDAC to adverse changes in the area in which the credits are concentrated. Credit Risk is primarily controlled by means of credit limits and is

Scotiabank (Ireland) DAC – Pillar 3 Disclosures 2018
22
monitored through Board-approved single name limits, country and industry limits. These Limits are ratified by the Board at least quarterly and exposures are expected to remain within Board approved limits. As noted above, the CRF, in consultation with Business Lines, is responsible for reviewing existing limits to ensure that they remain appropriate and consistent with the risk appetite and aligned with Scotiabank’s overall credit risk strategy and approach.
Settlement Risk is the risk that the Company will deliver the sold asset or cash to a counterparty and will not receive the cash or purchased asset as expected. As such, settlement risk comprises credit risk and liquidity risk. The Company controls and mitigates settlement risk by means of daily settlement limits, netting agreements and the quality of the counterparties with whom it will transact.
The Company uses Scotiabank’s credit risk rating systems to support the determination of key credit risk parameter estimates which measure credit and transaction risk. These risk parameters – probability of default, loss given default and exposure at default are transparent and are used to provide consistency of credit adjudication for each of the risk rating categories. These credit risk rating systems include an internal grading (I.G.) system for evaluating credit risk. The general relationship between the Company’s I.G. codes and external agency ratings is shown below:
Table 13 – Internal Grading Cross Reference I.G. Moody’s S&P
Government/ Supranational 99 Aaa AAA
Excellent 98 Aaa to Aa1 AAA to AA+
Very Good 95 Aa2 to A1 AA to A+
Good 90 A2 to A3 A to A-
Acceptable 87 – 80 Baa1 to Ba1 BBB+ to BB+
Higher Risk 77 – 70 Ba2 to B3 BB to B-
Watch list 30 – 65 - -
Default 21 - 27 - -
4.2 Exposure to Credit Risk
Table 14 outlines the Company’s actual and average1 exposure to credit risk.
Table 14 – EU CRB-B – Total and average net amount of exposures a b
US$’000 Net value of exposures at the end of the period
Average net exposures over
the period
Net value of exposures at the end of the period
Average net exposures over
the period 31/10/2018 31/10/2018 31/10/2017 31/10/2017
16 Central governments or central banks 1,381,618 1,473,345 1,551,965 997,475
18 Public sector entities 473,332 487,825 487,542 550,758
19 Multilateral development banks 362,562 344,017 336,536 335,052
20 International organisations - 41,861 53,877 53,104
21 Institutions 234,598 237,431 277,627 269,145
22 Corporates 5,102,562 5,517,041 5,631,621 5,459,705
28 Exposures in default 27,885 25,454 26,653 28,945
29 Items associated with particularly high risk 30,187 30,063 29,147 28,598
30 Covered bonds 59,539 62,830 91,336 116,236
31 Claims on institutions and corporates with a short-term credit assessment - - 16,943 16,825
33 Equity exposures - - 31,109 29,985
34 Other exposures 1,591 31,601 10,540 3,740
35 Total standardised approach 7,673,874 8,251,468 8,544,896 7,889,568
36 Total 7,673,874 8,251,468 8,544,896 7,889,568 1Net exposures are pre CRM and CCF; averages are calculated based on quarterly datapoints.
The overall decrease of US$ 871mm in net exposures as at 31 Oct 2018 was driven mainly by a reduction in corporates (loan commitments and investment securities) and sovereigns.

Scotiabank (Ireland) DAC – Pillar 3 Disclosures 2018
23
Table 15, presented on the following two pages, provides information on the geographical breakdown of the net value of exposures based on the domicile of the immediate counterparty
Table 15 – EU CRB-C – Geographical breakdown of exposures 31 Oct 2018
Of which; Of which; Of which;
US$’000 Europe United Kingdom
France Netherlands Germany Ireland Other
European countries
North America USA Canada Asia-
Pacific Japan Australia Other Asia
Pacific countries
Other geographical
areas Total
7 Central governments or central banks
546,902 90,144 - - - 365,438 91,320 348,780 348,780 - 485,936 485,936 - - - 1,381,618
9 Public sector entities 473,332 - - 113,272 277,046 - 83,014 - - - - - - - - 473,332
10 Multilateral development banks
- - - - - - - - - - - - - - 362,562 362,562
11 International organisations
- - - - - - - - - - - - - - - -
12 Institutions 38,423 2,883 - - 103 334 35,103 101,292 80 101,212 94,883 38 94,771 74 - 234,598 13 Corporates 3,565,948 1,823,365 238,610 366,434 237,095 189,464 710,980 1,212,722 1,199,699 13,023 - - - - 323,892 5,102,562 16 Exposures in default - - - - - - - - - - - - - - 27,885 27,885
17 Items associated with particularly high risk
- - - - - - - - - - - - - - 30,187 30,187
18 Covered bonds 59,539 11,493 28,602 - - - 19,444 - - - - - - - - 59,539
19
Claims on institutions and corporates with a short-term credit assessment
- - - - - - - - - - - - - - - -
21 Equity exposures - - - - - - - - - - - - - - - - 22 Other exposures 1,591 - - - - 1,591 - - - - - - - - - 1,591
23 Total standardised approach
4,685,735 1,927,885 267,212 479,706 514,244 556,827 939,861 1,662,794 1,548,559 114,235 580,819 485,974 94,771 74 744,526 7,673,874
24 Total 4,685,735 1,927,885 267,212 479,706 514,244 556,827 939,861 1,662,794 1,548,556 114,235 580,819 485,974 94,771 74 744,526 7,673,874

Scotiabank (Ireland) DAC – Pillar 3 Disclosures 2018
24
31 Oct 2017
Of which; Of which;
US$’000 Europe United Kingdom
France Netherlands Germany Ireland Other
European countries
North America USA Canada Asia-
Pacific Japan Australia Other Asia
Pacific countries
Other geographical
areas Total
7 Central governments or central banks 1,075,766 246,117 582,406 - - 212,558 34,685 - - - 476,199 476,199 - - - 1,551,965
9 Public sector entities 487,542 - - 106,315 322,215 - 59,012 - - - - - - - - 487,542
10 Multilateral development banks - - - - - - - - - - - - - - 336,536 336,536
11 International organisations - - - - - - - - - - - - - - 53,877 53,877
12 Institutions 37,195 - - - 118 444 36,632 144,589 12,980 131,609 95,844 148 95,693 3 - 277,627 13 Corporates 4,156,429 2,197,952 242,809 318,661 83,566 159,314 1,154,128 1,139,389 1,098,105 41,284 - - - - 335,802 5,631,621 16 Exposures in default - - - - - - - - - - - - - - 26,653 26,653
17 Items associated with particularly high risk - - - - - - - 29,147 29,147 - - - - - - 29,147
18 Covered bonds 91,336 11,965 59,242 - - - 20,129 - - - - - - - - 91,336
19
Claims on institutions and corporates with a short-term credit assessment
16,943 - 16,943 - - - - - - - - - - - - 16,943
21 Equity exposures 31,109 - 31,109 - - - - - - - - - - - - 31,109 22 Other exposures 10,527 - - - - 10,527 - 13 - 13 - - - - - 10,540
23 Total standardised approach 5,906,848 2,456,034 932,509 424,975 405,899 382,844 1,304,587 1,313,138 1,140,232 172,905 572,043 476,347 95,693 3 752,868 8,544,896
24 Total 5,906,848 2,456,034 932,509 424,975 405,899 382,844 1,304,587 1,313,138 1,140,232 172,905 572,043 476,347 95,693 3 752,868 8,544,896
As per table 14, the overall decrease of US$ 871mm in net exposures as at 31 Oct 2018 was driven mainly by a reduction in corporates (loan commitments and investment securities – mainly UK and other European countries) and sovereigns (UK and France, offset by USA).
Please refer to Appendix 3 for details of the materiality threshold applied and a listing of immaterial countries included in the ‘other’ categories.

Scotiabank (Ireland) DAC – Pillar 3 Disclosures 2018
25
Table 16 provides a breakdown of the net values of exposures by industry classification based on the nature of the immediate counterparty. Please refer to tables 14 and 15 for variance commentary.
Table 16 – EU CRB-D – Concentration of exposures by industry or counterparty type
31 Oct 2018 31 Oct 2017 a b c d e f g
US$’000
Central banks
General governments
Credit institutions
Other financial
corporations
Non-financial corporations
Other Total
Central banks
General governments
Credit institution
s
Other financial
corporations
Non-financial
corporations
Other Total
7 Central governments or central banks 365,438 1,016,180 - - - - 1,381,618
212,558 1,314,298 - - - - 1,551,965
9 Public sector entities - 473,332 - - - - 473,332
- 487,542 - - - - 487,542
10 Multilateral development banks - - 362,562 - - - 362,562
- - 336,536 - - - 336,536
11 International organisations - - - - - - -
- 53,877 - - - - 53,877
12 Institutions - - 234,598 - - - 234,598
- - 277,625 3 - - 277,627
13 Corporates - - 6,784 1,478,023 3,617,755 - 5,102,562
- - - 1,776,225 3,855,396 - 5,631,621
16 Exposures in default - - - - 27,885 - 27,885
- - - 26,653 - 26,653
17 Items associated with particularly high risk - - - 30,187 - - 30,187
- - - 29,147 - - 29,147
18 Covered bonds - - 59,539 - - - 59,539
- - 91,336 - - - 91,336
19 Claims on institutions and corporates with a short-term credit assessment
- - - - - - -
- - - - 16,943 - 16,943
21 Equity exposures - - - - - - -
- - 31,109 - - - 31,109
22 Other exposures - - - - - 1,591 1,591
- - - - - 10,540 10,540
23 Total standardised approach 365,438 1,489,512 663,483 1,508,210 3,645,640 1,591 7,673,874
212,558 1,855,716 736,605 1,830,485 3,898,992 10,540 8,544,896
24 Total 365,438 1,489,512 663,483 1,508,210 3,645,640 1,591 7,673,874
212,558 1,855,716 736,605 1,830,485 3,898,992 10,540 8,544,896

Scotiabank (Ireland) DAC – Pillar 3 Disclosures 2018
26
Table 17 provides a breakdown of the net values of exposures by residual maturity
Table 17 – EU CRB-E – Maturity of Exposures 31 Oct 2018 31 Oct 2017 a b c d f
US$’000 On demand <= 1 year > 1 year
<= 5 years > 5 years Total On demand <= 1 year > 1 year
<= 5 years > 5 years Total
7 Central governments or central banks - 1,032,839 348,779 - 1,381,618 - 1,492,170 59,795 - 1,551,965
9 Public sector entities - 235,055 238,277 - 473,332 - 63,054 424,487 - 487,542
10 Multilateral development banks - 108,283 254,279 - 362,562 - - 336,536 - 336,536
11 International organisations - - - - - - 53,877 - - 53,877
12 Institutions 809 196,152 37,637 - 234,598 2,154 39,500 235,973 - 277,627
13 Corporates - 1,107,025 3,904,625 90,912 5,102,562 - 1,184,510 4,233,783 213,327 5,631,621
16 Exposures in default - - 27,885 - 27,885 - - 26,653 - 26,653
17 Items associated with particularly high risk - 30,187 - - 30,187 - 29,147 - - 29,147
18 Covered bonds - 28,603 30,936 - 59,539 - 29,399 61,937 - 91,336
19 Claims on institutions and corporates with a short-term credit assessment - - - - - - 16,943 - - 16,943
21 Equity exposures - - - - - - 31,109 - - 31,109
22 Other exposures - 1,591 - - 1,591 - 10,540 - - 10,540
23 Total standardised approach 809 2,739,735 4,842,418 90,912 7,673,874 2,154 2,950,251 5,379,165 213,327 8,544,896
24 Total 809 2,739,735 4,842,418 90,912 7,673,874 2,154 2,950,251 5,379,165 213,327 8,544,896
The overall decrease of US$ 871mm in net exposures as at 31 Oct 2018 was concentrated in the 1 to 5 year maturity band (US$ 537mm, most of which Corporates: US$ 329mm, PSEs: US$ 186mm, Institutions: US$ 198mm; offset by an increase in Sovereigns: US$ 289mm.

Scotiabank (Ireland) DAC – Pillar 3 Disclosures 2018
27
Credit quality of exposures
The Company applies the Scotiabank approach to the classification of performing versus non-performing loans, utilising the Scotiabank internal credit risk process. With transition to IFRS 9, all facilities rated IG 27 or lower and entities rated IG 21 are considered credit-impaired and require individual provisions or “Stage 3” Expected Credit Loss (ECL).
The Company uses the definition of default as set down under Article 178 of the CRR for the purposes of regulatory capital computation relating to all credit exposures and applies this definition for use within any relevant sections of the annual financial statements. In keeping with these requirements, default is considered by the Company to have occurred with regard to a particular obligor when one or more of the following have taken place:
• the Company considers that the obligor is unlikely to pay its credit obligations, without recourse by the Company to actions such as realising security;
• the obligor is past due more than 90 days on any material credit obligation to the Company.
Past due and impaired loans
Based on the above definition, a loan is considered past due and impaired when a counterparty has not made a payment for more than 90 days after the contractual due date or there is objective evidence of impairment as a result of one or more events that occurred after the initial recognition of the asset (a ‘loss’ event) and the loss event (or events) has an impact on the estimated future cash flows. Objective evidence of impairment is recognised when, in management’s opinion, there is no longer reasonable assurance that interest and principal payments will be collected based on original contractual terms.
Impairment review and provisions
Impairment assessments necessarily include the use of estimates and expert judgment as management attempts to project the effect of future events on its exposures. Following best practice, the Company regularly reviews and revises key judgements, assumptions and estimates relating to impairment provisioning. The most significant judgements or estimates relate to management’s expectations regarding changes in collateral values, timing of cash flows, value attributed to guarantees and cash flows from trading or other sources. The Company documents all key assumptions including explanations outlining why assumptions have been changed. CRD IV introduced the definition of ‘specific’ and ‘general’ credit risk adjustments and, in line with the relevant technical standard, the Company has included all ECL amounts as specific credit risk adjustments.

Scotiabank (Ireland) DAC – Pillar 3 Disclosures 2018
28
Table 18 summarises the credit quality of on-balance sheet and off-balance sheet exposures by exposure class. The gross carrying value of exposures presented in this table is before the application of: a) credit risk mitigation; b) credit conversion factors; and c) impairment provisions. CCR is excluded.
Table 18 – EU CR1-A – Credit quality of exposures by exposure class and instrument 31 Oct 2018 31 Oct 2017
US$’000 a b c d e f g Gross carrying values of (1)
Specific credit risk
adjust- ment
General credit risk
adjust- ment
Accum-ulated
write-offs
Credit risk adjustment
charges (credit) of the
period
Gross carrying values of (1)
Specific credit risk
adjust- ment
General credit risk
adjust- ment
Accum-ulated
write-offs
Credit risk adjustment
charges (credit) of the
period
Net values
(a+b-c-d)
Exposure class Defaulted exposures
Non- defaulted
exposures
Net values
(a+b-c-d)
Defaulted exposures
Non-defaulted
exposures
16 Central governments or central banks - 1,381,618 - - - - 1,381,618 - 1,526,856 - - - - 1,526,856
18 Public sector entities - 473,336 4 - - 4 473,332 - 487,542 - - - - 487,542
19 Multilateral development banks - 362,564 2 - - 2 362,562 - 336,536 - - - - 336,536
20 International organisations - - - - - - - - 53,877 - - - - 53,877
21 Institutions - 234,600 2 - - 2 234,598 - 277,627 - - - - 277,627
22 Corporates - 5,104,237 1,675 - - 1,675 5,102,562 - 5,663,626 - - 486 - 5,663,626
23 Of which: SMEs - - - - - - - - - - - - - -
28 Exposures in default 39,136 11,251 - - (7,973) 27,885 45,877 - 19,224 - - - 26,653
29 Items associated with particularly high risk - 30,187 - - - - 30,187 - 29,147 - - - - 29,147
30 Covered bonds - 59,540 1 - - 1 59,539 - 91,336 - - - - 91,336
31 Claims on institutions and corporates with a short-term credit assessment
- - - - - - -
- 16,943 - - - - 16,943
33 Equity exposures - - - - - - - - 31,109 - - - - 31,109
34 Other exposures - 1,591 - - - - 1,591 - 10,540 - - - - 10,540
35 Total standardised approach 39,136 7,647,673 12,935 - - (6,289) 7,673,874 45,877 8,525,139 19,224 - 486 - 8,551,793
36 Total 39,136 7,647,673 12,935 - - (6,289) 7,673,874 45,877 8,525,139 19,224 - 486 - 8,551,793
37 Of which: Loans 39,136 2,748,915 12,764 - - (6,460) 2,775,287 45,877 2,784,337 19,224 - - - 2,810,990
38 Of which: Debt securities - 3,126,650 64 - - 64 3,126,586 - 3,755,111 - - - - 3,755,111
39 Of which: Off- balance-sheet exposures - 1,756,831 107 - - 107 1,756,724 - 1,963,433 - - - - 1,963,433
(1) The Company’s collective allowance for impairment of US$ 6,896,000 as at 31 October 2017 was assessed as qualifying as a specific credit risk adjustment as defined in Article 1 of Commission Delegated Regulation (EU) No 183/2014. However, the Company did not reduce its exposures by these amounts when calculating its 2017 capital ratios as they were not material. Therefore, for tables 18, 19, 20 and 23 this amount was not included as an adjustment in line with the Company’s regulatory reporting. The full impact of IFRS 9 ECLs have been included as specific credit risk adjustments for 2018.
As per note 1, the Company is now including the full impact of IFRS 9 ECLs in contrast with the approach in 2017 of excluding the collective allowance. Specific credit risk adjustments have decreased due in part to the adoption of IFRS 9 and the calculation of stage 3 ECLs. Please refer to tables 14 and 15 for variance commentary.

Scotiabank (Ireland) DAC – Pillar 3 Disclosures 2018
29
Table 19 below presents an overview of the credit quality of on-balance sheet and off-balance sheet exposures by counterparty type.
Table 19 – EU CR1-B – Credit quality of exposures by industry or counterparty types
31 Oct 2018 31 Oct 2017
US$’000 a b c d e f g
Gross carrying values of Specific credit risk
adjust- ment
General credit risk
adjust- ment
Accum- ulated
write-offs
Credit risk adjustment
charges (credit) of the period
Net values
(a+b-c-d)
Gross carrying values of Specific
credit risk adjust-
ment
General credit risk
adjust- ment
Accum- ulated
write-offs
Credit risk adjustment
charges (credit) of the period
Net values
(a+b-c-d)
Counterparty type Defaulted
exposures
Non-defaulted
exposures
Defaulted
exposures
Non-defaulted
exposures
1 Central banks - 365,438 - - - - 365,438 - 212,558 - - - - 212,558
2 General governments - 1,489,516 4 - - 4 1,489,512 - 1,855,716 - - - - 1,855,716
3 Credit institutions - 663,488 5 - - 5 663,483 - 736,605 - - - - 736,605
4 Other financial corporations - 1,508,251 41 - - 41 1,508,210 - 1,830,724 - - - - 1,830,724
5 Non-financial corporations 39,136 3,619,389 12,885 - - (6,339) 3,645,640 45,877 3,878,996 19,224 - - - 3,905,649
6 Other - 1,591 - - - - 1,591 - 10,540 - - 486 - 10,540
7 Total 39,136 7,647,673 12,935 - - (6,289) 7,673,874 45,877 8,525,139 19,224 - 486 - 8,551,793
The overall decrease of US$ 878mm in net exposures as at 31 Oct 2018 is in line with the explanation on table 14, with the difference of US$ 7mm relating to the collective provision in 2017 - refer to note 1 on table 18. Please refer to tables 14 and 15 for variance commentary.

Scotiabank (Ireland) DAC – Pillar 3 Disclosures 2018
30
Table 20 below presents an overview of the credit quality of on-balance sheet and off-balance sheet exposures by geographical breakdown.
Table 20 – EU CR1-C – Credit quality of exposures by geography
31 Oct 2018 31 Oct 2017
US$’000 a b c d e f g
Gross carrying values of Specific
credit risk adjust-
ment
General credit risk
adjust- ment
Accum- ulated
write-offs
Credit risk adjustment
charges (credit) of the period
Net values
(a+b-c-d)
Gross carrying values of Specific
credit risk adjust-
ment
General credit risk
adjust- ment
Accum- ulated
write-offs
Credit risk adjustment
charges (credit) of the
period Net values
(a+b-c-d)
Geographical area Defaulted exposures
Non-defaulted
exposures
Defaulted exposures
Non-defaulted
exposures
1 Europe - 4,686,052 317 - - 317 4,685,735 - 5,908,616 - - 486 - 5,908,616
of which;
2 - United Kingdom - 1,927,936 51 - - 51 1,927,885 - 2,456,522 - - - - 2,456,522
3 - France - 267,222 10 - - 10 267,212 - 932,556 - - - - 932,556
4 - Netherlands - 479,761 55 - - 55 479,706 - 425,188 - - - - 425,188
5 - Germany - 514,251 7 - - 7 514,244 - 405,905 - - - - 405,905
6 - Ireland - 556,890 63 - - 63 556,827 - 382,968 - - - - 382,968
7 - Other European countries - 939,992 131 - - 131 939,861 - 1,305,475 - - 486 - 1,305,475
8 North America - 1,662,929 135 - - 135 1,662,794 - 1,313,475 - - - - 1,313,475
of which;
9 - USA - 1,548,693 134 - - 134 1,548,559 - 1,140,569 - - - - 1,140,569
10 - Canada - 114,236 1 - - 1 114,235 - 172,906 - - - - 172,906
11 Asia-Pacific - 580,820 1 - - 1 580,819 572,043 - - - - 572,043
of which;
12 - Japan - 485,974 - - - - 485,974 - 476,347 - - - - 476,347
13 - Australia - 94,772 1 - - 1 94,771 - 95,693 - - - - 95,693
14 - Other Asia-Pacific Countries - 74 - - - - 74 - 3 - - - - 3
15 Other geographical areas 39,136 717,872 12,482 - - (6,742) 744,526 45,877 731,006 19,224 - - - 757,659
16 Total 39,136 7,647,673 12,935 - - (6,289) 7,673,874 45,877 8,525,139 19,224 - 486 - 8,551,793
Please refer to Appendix 3 for details of the materiality threshold applied and a listing of immaterial countries included in the ‘other’ categories. Please refer to tables 14 and 15 for variance commentary.

Scotiabank (Ireland) DAC – Pillar 3 Disclosures 2018
31
Table 21 below presents the ageing analysis of accounting on-balance sheet past-due exposures regardless of their impairment status. There were no past-due exposures as at 31 October 2018. The prior year balance relates to non-financial corporations in other geographical areas (as per the breakdown in table 20).
Table 21 – EU CR1-D – Ageing of past-due exposures
31 Oct 2018
US$’000 Gross carrying values
≤ 30 days > 30 days ≤ 60 days
> 60 days ≤ 90 days
> 90 day ≤ 180 days
> 180 days ≤ 1 year > 1 year
1 Loans - - - - - -
2 Debt securities - - - - - -
3 Total exposures - - - - - -
31 Oct 2017
US$’000 Gross carrying values
≤ 30 days > 30 days ≤ 60 days
> 60 days ≤ 90 days
> 90 day ≤ 180 days
> 180 days ≤ 1 year > 1 year
1 Loans - - 25,402 - - -
2 Debt securities - - - - - -
3 Total exposures - - 25,402 - - -
Forbearance
Forbearance occurs when a borrower is granted a temporary or permanent concession or an agreed change to the terms of a loan (‘forbearance measure’) for reasons relating to the actual or apparent financial stress or distress of that borrower. A concession may involve restructuring the contractual terms of a debt or payment in some form other than cash, such as an equity interest in the borrower.
Prior to any decision to grant forbearance the Company performs an assessment of a customer’s financial circumstances and ability to repay. This assessment includes an individual assessment for impairment of the loan.
Table 22 presents an overview of non-performing and forborne exposures.
Table 22 – EU CR1-E – Non-performing and forborne exposures
31 Oct 2018 31 Oct 2017
US$’000 Debt
securities Loans and advances
Off balance sheet
exposures
Debt securities
Loans and advances
Off balance sheet
exposures
Gross carrying values of performing and non-performing exposures
3,126,650 2,788,051 1,756,831 3,755,111 2,830,214 1,963,433
Of which performing but past due > 30 days and <= 90 days - - - - - -
Of which performing forborne - 44,616 - - 150,088 -
Of which non-performing
- 39,136 - - 45,877 -
Of which defaulted - 39,136 - - 45,877 -
Of which impaired - 39,136 - - 45,877 -
Of which forborne - - - - - -
Accumulated impairment and provisions and negative fair value adjustments due to credit risk
On performing exposures
64 1,513 107 47 6,380 469
Of which forborne - 1,101 - - 4,336 -
On non-performing exposures
- 11,251 - - 19,224 -
Of which forborne - 11,251 - - 19,224 -
Collaterals and financial guarantees received
On non-performing exposures - 27,884 - - 24,500 -
Of which forborne exposures - 71,399 - - 75,443 -
This table is compiled based on definitions as per Annex V of the Commission Implementing Regulation (EU) No 680/2014 and so the reported impairments differ to the credit risk adjustments in the above tables. Please refer to note 1 on table 18.

Scotiabank (Ireland) DAC – Pillar 3 Disclosures 2018
32
Table 23 presents the reconciliation of specific and general credit risk adjustments held against loans and debt securities that are defaulted or impaired. It is based on Financial Statements information.
Table 23 – EU CR2-A – Changes in the stock of general and specific credit risk adjustments US$’000 a b
(1) Accumulated
specific credit risk adjustment
Accumulated general credit
risk adjustment
(1) Accumulated specific credit risk
adjustment
Accumulated general credit
risk adjustment
31/10/2018 31/10/2018 31/10/2017 31/10/2017
1 Opening balance 19,224 - 19,224 -
1a Remeasurement on transition to IFRS 9 2,824 -
2 Increases due to amounts set aside for estimated loan losses during the period - - 612 -
3 Decreases due to amounts reversed for estimated loan losses during the period (9,534) - - -
3a Increases due to origination and acquisition 860 - - -
3b Decrease due to derecognition repayments and disposals (616) - - -
3c Changes due to modifications without derecognition (net) 1,168 - - -
3d Changes due to update in the institution's methodology for estimation (net) 44 - - -
4 Decreases due to amounts taken against accumulated credit risk adjustments - - - -
5 Transfers between credit risk adjustments - - - -
6 Impact of exchange rate differences - - - -
7 Business combinations, including acquisitions and disposals of subsidiaries - - - -
8 Other adjustments (1,035) - (612) -
9 Closing balance 12,935 - 19,224 -
10 Recoveries on credit risk adjustments recorded directly to the statement of profit or loss - - 82 -
11 Specific credit risk adjustments directly recorded to the statement of profit or loss - - - -
This table is based on the definitions in Article 1 of Commission Delegated Regulation (EU) No 183/2014, so as per tables 18, 19 and 22 above, the Company did not report the collective allowance for impairment as at 31 October 2017 here. The full impact of IFRS 9 ECLs have been included as specific credit risk adjustments for 2018.
Table 24 presents the changes in the stock of defaulted loans and debt securities.
Table 24 – EU CR2-B – Changes in the stock of defaulted and impaired loans and debt securities US$’000 a Gross carrying value
defaulted exposures Gross carrying value defaulted exposures
31/10/2018 31/10/2017
1 Opening balance 45,877 49,678
2 Loans and debt securities that have defaulted or impaired since the last reporting period - -
3 Returned to non-defaulted status - -
4 Amounts written off - -
5 Other changes (6,741) (3,801)
6 Closing balance 39,136 45,877

Scotiabank (Ireland) DAC – Pillar 3 Disclosures 2018
33
4.3 Approaches to Credit Risk
While the capital requirements for credit risk depend to a significant degree on the creditworthiness of the obligor, CRD IV permits the use of different approaches to the calculation of RWAs; the Standardised Approach and the Internal Ratings-Based (IRB) approaches.
The Company uses the Standardised Approach for calculating capital requirements for credit risk. This approach involves the application of risk weights to the Company’s assets based on the deemed creditworthiness of its debtors and the rules as laid out in the CRR. The Company utilises credit ratings attributed by its chosen External Credit Assessment Institutions (ECAIs), Standard and Poor’s or Moody’s, whichever is the lower, to all its exposure classes. The Company uses the EBA’s standard association of ECAI ratings and credit quality steps to map ratings to the relevant credit quality step.
As per the CRR, the following priorities are used in applying the credit assessments:
For exposures to public sector entities (Article 116), institutions (Articles 119 & 121), or in the form of covered bonds (Articles 129 & 121), the ECAIs are applied in the following priority:
• Rating of Issue (exposure) • Rating of Issuer (counterparty) • Rating of Central government of jurisdiction of incorporation
For exposures to central governments or central banks (Article 114), multilateral development banks (Article 117), international organisations (Article 118), corporates (Article 122), the ECAIs are applied in the following priority:
• Rating of Issue (exposure) • Rating of Issuer (counterparty)
Exposures to rated securitisations are based purely on the rating of the programme.

Scotiabank (Ireland) DAC – Pillar 3 Disclosures 2018
34
Table 25 – EU CR4 – Standardised approach – Credit risk exposure and CRM effects
31 Oct 2018 31 Oct 2017 US$'000 a b c d e f
Exposures before CCF and CRM
Exposures post CCF and CRM
Exposures before CCF and
CRM Exposures post CCF and
CRM
Exposure classes
On-balance sheet
amount
Off-balance sheet
amount
On-balance sheet
amount
Off-balance sheet
amount
RWAs RWA density
On-balance sheet
amount
Off-balance sheet
amount
On-balance sheet
amount
Off-balance sheet
amount
RWAs RWA density
1 Central governments or central banks 1,381,618 - 1,406,684 - 97,187 7% 1,526,856 - 1,551,965 - 95,240 6%
3 Public sector entities 473,332 - 473,332 - 39,257 8% 487,542 - 487,542 - 33,065 7% 4 Multilateral development banks 362,562 - 362,562 - - - 336,536 - 336,536 - - - 5 International organisations - - - - - - 53,877 - 53,877 - - - 6 Institutions 234,598 - 234,598 - 47,020 20% 277,627 - 277,627 - 55,659 20% 7 Corporates 3,362,339 1,740,223 3,337,273 856,067 3,666,256 87% 3,715,835 1,947,792 3,690,728 928,460 4,024,071 87%
10 Exposures in default 27,885 - 27,885 - 35,465 127% 26,653 - 26,653 - 26,653 100%
11 Exposures associated with particularly high risk 13,686 16,501 13,686 8,250 32,904 150% 13,506 15,641 13,506 7,821 31,990 150%
12 Covered bonds 59,539 - 59,539 - 5,954 10% 91,336 - 91,336 - 9,134 10%
13 Institutions and corporates with a short-term credit assessment - - - - - - 16,943 - 16,943 - 16,943 100%
15 Equity - - - - - - 31,109 - 31,109 - 31,109 100% 16 Other items 2,091 - 2,091 - 7,837 375% 11,574 - 11,574 - 23,465 203% 17 Total 5,917,650 1,756,724 5,917,650 864,317 3,931,880 58% 6,589,393 1,963,433 6,589,398 936,280 4,347,329 58%
The increase in RWA density of exposures in default is due to the reduction of a specific credit risk adjustment as a percentage of the related exposure below 20%, as per Article 127 (1)(a) of the CRR. Please refer to tables 14 and 15 for other variance commentary.
Table 26 – Exposure by credit quality step (CQS) US$'000 Exposure value Exposure value Exposure value Exposure value
(Pre CRM) (Post CRM) RWAs (Pre CRM) (Post CRM) RWAs 31/10/2018 31/10/2018 31/10/2018 31/10/2017 31/10/2017 31/10/2017 CQS
1 2,274,826 2,274,826 136,933 2,491,321 2,491,321 131,452
2 1,179,175 1,179,175 442,896 1,404,064 1,404,064 563,365
3 800,761 800,761 800,679 740,315 740,315 740,219 4 247,812 247,812 247,631 118,233 118,233 118,011
Unrated 2,279,450 2,279,450 2,303,741 2,771,745 2,771,745 2,794,282 Total 6,782,024 6,782,024 3,931,880 7,525,678 7,525,678 4,347,329
Tables 25 and 26 both include items deducted from own funds and so differ from table OV1 and table 27 below. All exposure values are presented post CCF.
The reduction in exposures to unrated entities is due mostly reduced corporate loan facilities. Please refer to tables 14 and 15 for other variance commentary.
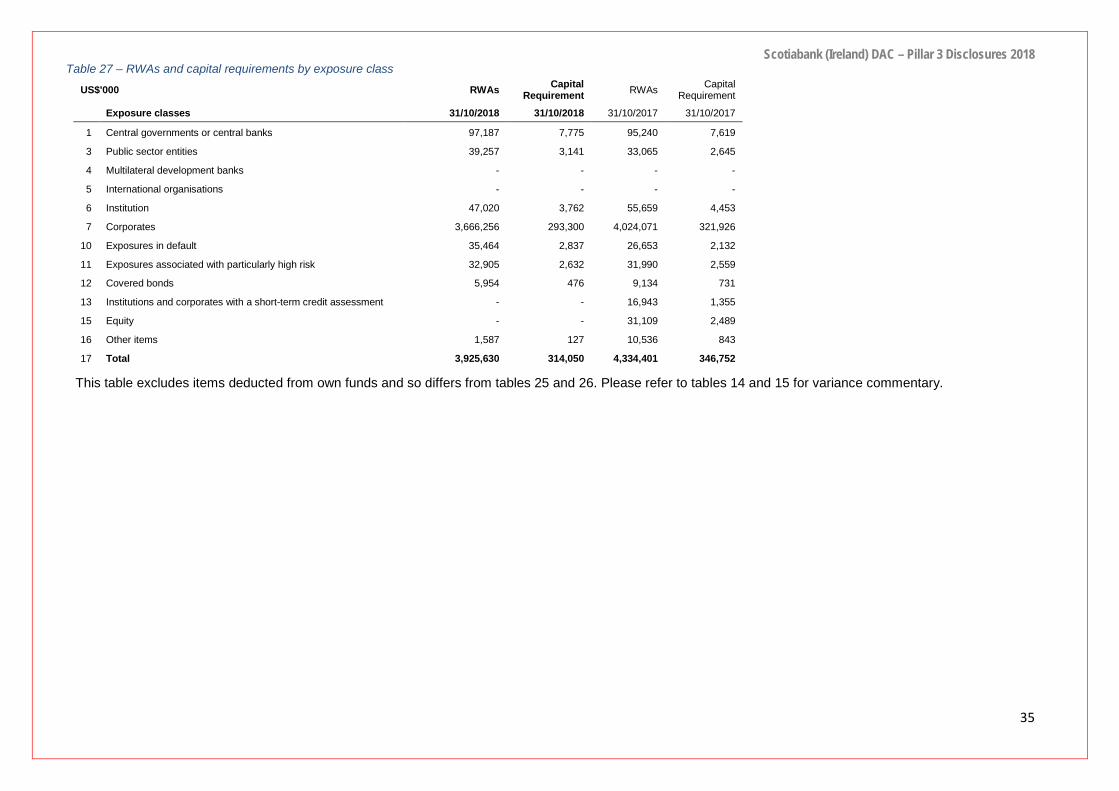
Scotiabank (Ireland) DAC – Pillar 3 Disclosures 2018
35
Table 27 – RWAs and capital requirements by exposure class
US$'000 RWAs Capital Requirement RWAs Capital
Requirement
Exposure classes 31/10/2018 31/10/2018 31/10/2017 31/10/2017
1 Central governments or central banks 97,187 7,775 95,240 7,619
3 Public sector entities 39,257 3,141 33,065 2,645
4 Multilateral development banks - - - -
5 International organisations - - - -
6 Institution 47,020 3,762 55,659 4,453
7 Corporates 3,666,256 293,300 4,024,071 321,926
10 Exposures in default 35,464 2,837 26,653 2,132
11 Exposures associated with particularly high risk 32,905 2,632 31,990 2,559
12 Covered bonds 5,954 476 9,134 731
13 Institutions and corporates with a short-term credit assessment - - 16,943 1,355
15 Equity - - 31,109 2,489
16 Other items 1,587 127 10,536 843
17 Total 3,925,630 314,050 4,334,401 346,752
This table excludes items deducted from own funds and so differs from tables 25 and 26. Please refer to tables 14 and 15 for variance commentary.

Scotiabank (Ireland) DAC – Pillar 3 Disclosures 2018
36
Table 28 below details exposures under the standardised approach by risk weight and exposure class. All amounts presented are post Credit Risk Mitigation (CRM), post Credit Conversion Factors (CCF) and net of impairment provisions. CCR is excluded. Variance commentary on tables 14 and 15 also applies here.
Table 28 – EU CR5 – Standardised approach 31 Oct 2018 US$'000 Risk weight (%) Total
Of which unrated
Exposure classes 0 2 4 10 20 35 50 70 75 100 150 250 370 1250 Others Deducted
1 Central governments or central banks
920,748 - - - 485,936 - - - - - - - - - - - 1,406,684 -
3 Public sector entities 277,046 - - - 196,286 - - - - - - - - - - - 473,332 -
4 Multilateral development banks 362,562 - - - - - - - - - - - - - - - 362,562 -
5 International organisations - - - - - - - - - - - - - - - - - -
6 Institutions - - - - 234,264 - 334 - - - - - - - - - 234,598 10
7 Corporates - - - - 227,478 - 690,204 - - 3,275,658 - - - - - - 4,193,340 2,227,528
10 Exposures in default - - - - - - - - - 12,726 15,159 - - - - - 27,885 27,885
11 Exposures associated with particularly high risk
- - - - - - - - - - 21,936 - - - - - 21,936 21,936
12 Covered bonds - - - 59,539 - - - - - - - - - - - - 59,539 -
13 Institutions and corporates with a short-term credit assessment
- - - - - - - - - - - - - - - - - -
15 Equity - - - - - - - - - - - - - - - - - -
16 Other items 4 - - - - - - - - 1,587 - - - - - 500 2,091 2,091
17 Total 1,560,360 - - 59,539 1,143,964 - 690,538 - - 3,289,971 37,095 - - - - 500 6,781,967 2,279,450
31 Oct 2017
US$'000 Risk weight (%) Total Of which unrated
Exposure classes 0 2 4 10 20 35 50 70 75 100 150 250 370 1250 Others Deducted
1 Central governments or central banks 1,075,766 - - 476,199 - - - - - - - - - 1,551,965 -
3 Public sector entities 322,215 - - 165,327 - - - - - - - - - 487,542 -
4 Multilateral development banks 336,536 - - - - - - - - - - - - 336,536 -
5 International organisations 53,877 - - - - - - - - - - - - 53,877 -
6 Institutions - - - 277,184 - 444 - - - - - - - - 277,628 -
7 Corporates - - - 183,463 - 896,659 - - 3,539,066 - - - - - - 4,619,188 2,712,191
10 Exposures in default - - - - - - - - 26,653 - - - - - - 26,653 26,653
11 Exposures associated with particularly high risk - - - - - - - - - 21,327 - - - - - 21,327 21,327
12 Covered bonds - - - 91,336 - - - - - - - - - - - - 91,336 -
13 Institutions and corporates with a short-term credit assessment - - - - - - - - 16,943 - - - - - - 16,943 -
15 Equity - - - - - - - - 31,109 - - - - - - 31,109 31,109
16 Other items 4 - - - - - - - 10,536 - - - - - 1,034 11,574 11,574
17 Total 1,778,398 - - 91,336 1,102,173 - 897,103 - - 3,624,308 21,327 - - - - 1,034 7,525,678 2,802,854

Scotiabank (Ireland) DAC – Pillar 3 Disclosures 2018
37
4.4 Credit Risk Mitigation
The Company uses two methods of credit risk mitigation: direct and indirect.
Direct mitigating methods
The main direct credit risk mitigation is the taking of security or collateral. The Company holds collateral in respect of certain exposures including corporate loans, securities held as part of repurchase agreements and/or OTC derivative activity. Collateral is not usually held against investment securities, and no such collateral was held during the year. The types of collateral that the Company is willing to accept under OTC derivative transactions and repurchase agreements are guided by advice and counsel from Scotiabank GRM and are set out in Limit Documents. The acceptable types of collateral are reviewed on an annual basis as part of the annual limit review process.
A variety of types of collateral are accepted against corporate loan advances, including securities, cash, guarantees and insurance, grouped broadly as follows: Financial collateral (lien over deposits, shares, etc.); Physical collateral (shipping vessels, etc.); Other collateral (guarantees, insurance, etc.)
Note that the Company is not currently using credit derivatives to mitigate risk.
Parental guarantees are utilised in corporate lending arrangements and guarantees by corporates or sovereigns in respect of certain securities holdings are also utilised. Guarantees may improve the credit quality of the exposures. The Company has not disclosed the fair value of collateral held against collectively impaired financial assets as it is operationally impracticable to do so. The fair value of financial assets accepted as collateral, under reverse repurchase agreements, that were permitted to be sold or re-pledged at 31 October 2018 was nil (2017: nil). Variance commentary on tables 14 and 15 also applies here.
Table 29 – EU CR3 – CRM techniques – Overview 31 Oct 2018 31 Oct 2017
US$’000 a b c d e
Exposures unsecured –
Carrying amount
Exposures secured
- Carrying amount
Exposures secured
by collateral
Exposures secured by
financial guarantees
Exposures secured by
credit derivatives
Exposures unsecured – Carrying
amount
Exposures secured
- Carrying amount
Exposures secured
by collateral
Exposures secured by
financial guarantees
Exposures secured by credit
derivatives
1 Total loans 2,775,287 - - - - 2,758,732 - - - -
2 Total debt securities 3,101,520 25,066 - 25,066 - 3,730,002 25,109 - 25,109 -
3 Total exposures 5,876,807 25,066 - 25,066 - 6,488,734 25,109 - 25,109 -
4 Of which defaulted
39,136 - - - - 26,653 - - - -
Table 30 – CRM Techniques split by exposure class 31 Oct 2018 31 Oct 2017 US$’000 Exposures
unsecured - Carrying
amount
Exposures secured
- Carrying amount
Exposures secured
by collateral
Exposures secured by
financial guarantees
Exposures secured by
credit derivatives
Exposures unsecured – Carrying
amount
Exposures secured
- Carrying amount
Exposures secured by
collateral
Exposures secured by
financial guarantees
Exposures secured by
credit derivatives
Total loans 2,775,287 - - - - 2,758,732 - - - -
Central governments or central banks 365,438 - - - - 212,558 - - - -
Institutions 3,613 - - - - 2,154 - - - -
Corporates 2,378,351 - - - - 2,517,367 - - - -
Exposures in default 27,885 - - - - 26,653 - - - -
Total debt securities 3,101,520 25,066 - 25,066 - 3,730,002 25,109 - 25,109 - Central governments or central banks 991,114 25,066 - 25,066 - 1,314,298 25,109 - 25,109 -
Public sector entities 473,332 - - - - 487,542 - - - - Multilateral development banks 362,562 - - - - 336,536 - - - -
International organisations - - - - - 53,877 - - - -
Institutions 230,985 - - - - 262,494 - - - -
Corporates 983,988 - - - - 1,166,977 - - - -
Covered bonds 59,539 - - - - 91,336 - - - - Institutions and corporates with a short-term credit assessment
- - - - - 16,943 - - - -
Total exposures 5,876,807 25,066 - 25,066 - 6,488,734 25,109 - 25,109 -

Scotiabank (Ireland) DAC – Pillar 3 Disclosures 2018
38
Table 29 and 30 provide details on secured and unsecured exposures. Secured exposures are limited to those exposures against which eligible collateral which meets CRR definitions is held and has been used in the calculation of the Company’s capital requirements. This table is not reflective of the total volume of exposures against which collateral and guarantees are actually held, nor does it reflect the full range of credit risk mitigation taken. A significant portion of the exposures included in the table (exposures unsecured carrying amount) benefit from security taken to mitigate credit risk, but this security is not eligible for use in the regulatory capital calculations. The total credit exposures where the Company benefits from guarantees from investment graded (or equivalent rating) entities as at 31 October 2018 is US$ 1,353,995,000 (31 October 2017: US$ 1,160,678,000).
Indirect mitigating methods
Indirect credit risk mitigants are generally embedded in the structure of the individual transaction to minimise the impact of an external event on the obligor e.g. the requirement for the obligor to hedge interest rates and input material prices or insure assets or receivables.
In addition, credit risk is also mitigated by policy and procedural controls and regular monitoring and reporting of risks to facilitate effective management oversight.
Credit risk concentrations within risk mitigation
As noted in section 3, concentration risk has been recognised as a material risk. The Company recognises the application of credit risk mitigation techniques as a source of concentration risk. A highly concentrated portfolio has more potential for extreme outcomes and could prevent the effectiveness of the credit risk mitigants used. The Company has a Board approved Concentration Risk Policy, which has been subject to advice and counsel from Scotiabank GRM.
As noted in table 9 above, the Company seeks to avoid excessive risk concentrations through a diversified mix of businesses, products, geographies, currencies and customers. Appropriate management of concentration risk is also ensured by limits, policies and procedures. Oversight of the management of concentration risk includes management committee and Board review and approval of policies and limits relating to Credit Risk, among other material risks, as well as quarterly reporting to the BRC on risk concentrations and stress testing on sectors where a material concentration is deemed to arise. No material concentration has arisen as a result of the credit risk mitigation measures which would prevent their effectiveness.
4.5 Counterparty Credit Risk
As per CRR Article 272, CCR is defined as the risk that the counterparty to a transaction could default before the final settlement of the transaction's cash flows.
The Company’s primary sources of CCR are derivatives and repurchase agreements (all risk mitigated and limited to overnight risk by Credit Support Annexes (CSAs) and other margining arrangements).
SIDAC mitigates counterparty risk in a number of ways. A prerequisite for transacting OTC derivatives with counterparties is to ensure a CSA agreement is in place. The Company is compliant with variation margin rules for Non-Centrally Cleared Derivatives. This in effect reduced variation margin thresholds to zero. The Company now transacts interest rate swaps via Central Counterparty clearing (CCP) (facilitated by Scotiabank) which mitigates counterparty credit risk. These techniques are documented in standard trading agreements.
Counterparty limits are set for each individual counterparty, guided by advice and counsel from Scotiabank GRM. Sub limits can be put in place for each product type. The risk is monitored independently by CRF on a daily basis.
Netting and collaterals held
Legal agreements providing for enforceable master netting arrangements are put in place with counterparties, guided by Scotiabank legal counsel. These include International Swaps and Derivatives Association (ISDA) agreements and collateral arrangements (Global Master Repurchase Agreement (GMRA)) and CSA). Note that these arrangements do not meet the criteria for offsetting in the balance sheet. This is because they create for the parties to the agreement a right of set-off of recognised amounts that is enforceable only following an event of default, insolvency or bankruptcy of the Company or the counterparties or following other predetermined events. In addition, the Company and its counterparties do not intend to settle on a net basis or to realise the assets and settle the liabilities simultaneously.

Scotiabank (Ireland) DAC – Pillar 3 Disclosures 2018
39
The Company is unrated by ECAIs and so is not exposed to the effects of a downgrade of its own credit rating. There is also no risk of increased collateral requirements as a result of a downgrade of the Company’s parent as the Company’s credit support agreements do not allow for triggers for the posting of additional collateral due to increased counterparty risk. The Company’s collateral requirement is expected to diminish in future periods as OTC derivatives are gradually replaced by those settled with CCP clearing members, as noted above.
Collateral arising in respect of any Credit Risk exposures is managed through daily monitoring and by comparison of mark-to-market values of applicable positions against collateral calls. With regard to repurchase agreements, when the values exceed collateral thresholds, collateral calls are made. The acceptable types of collateral are reviewed on an annual basis as part of the annual limit review process.
When calculating the CVA capital charge, the Company uses the standardised approach, as permitted by the Regulation.
Table 31 shows the impact of netting and collateral held on exposures. The increase in net credit exposure in 2018 is due mostly to increased positive market value of forward foreign exchange contracts.
Table 31 – EU CCR5-A – Impact of netting and collateral held on exposure values 31 Oct 2018 31 Oct 2017 US$’000 a b c d e
Gross positive fair value or net
carrying amount
Netting benefits
Netted current
credit exposure
Collateral held
Net credit
exposure
Gross positive fair value or net
carrying amount
Netting benefits
Netted current
credit exposure
Collateral held
Net credit
exposure 1 Derivatives 104,225 8,602 95,624 2,387 93,237 60,559 40,592 19,967 - 19,967 2 SFTs - - - - - - - - - -
3 Cross-product netting
- - - - - - - - - -
4 Total 104,225 8,602 95,624 2,387 93,237 60,559 40,592 19,967 - 19,967
Table 32 shows a breakdown of all types of collateral posted or received to support or reduce CCR exposures related to derivative transactions and to SFTs. The movement in collateral received/posted reflects market value movements in derivative contracts with third parties subject to a credit support annex.
Table 32 – EU CCR5-B – Composition of collateral for exposures to CCR 31 Oct 2018 31 Oct 2017
US$’000 a b c d e f
Collateral used in derivative transactions Collateral used in derivative transactions
Fair value of collateral received
Fair value of posted collateral
Collateral used in SFTs
Fair value of collateral received
Fair value of posted collateral
Collateral used in SFTs
Segre- gated
Unsegre- gated
Segre- gated
Unsegre- gated
Fair value of collateral received
Fair value of posted
collateral
Segre- gated
Unsegre- gated
Segre- gated
Unsegre- gated
Fair value of collateral received
Fair value of collateral received
Cash - 2,387 - 5,240 - - - - - 12,980 - -
Total - 2,387 - 5,240 - - - - - 12,980 - -

Scotiabank (Ireland) DAC – Pillar 3 Disclosures 2018
40
Table 33 and 34 set out the methods used to calculate CCR regulatory requirements and the resultant RWAs.
Table 33 – EU CCR1 – Analysis of CCR exposure by approach 31 Oct 2018 31 Oct 2017
US$’000 a b c d e f g
Notional
Replace- ment cost /
current market
value
Potential future credit
exposure EEPE Multiplier
EAD post CRM RWAs
Notional
Repla-cement
cost / current market
value
Potential future credit expo- sure EEPE Multiplier
EAD post
CRM RWAs
1 Mark to market - 93,237 31,363 - - 124,600 62,239 - 19,967 27,143 - - 47,110 23,555
9
Financial collateral comprehensive method (for SFTs)
- - - - - - -
- - - - - - -
11 Total - 93,237 31,363 - - 124,600 62,239 - 19,967 27,143 - - 47,110 23,555
Table 34 – EU CCR2 – CVA capital charge US$’000 a b
Exposure value RWAs Exposure value RWAs 31/10/2018 31/10/2018 31/10/2017 31/10/2017
1 Total portfolios subject to the advanced method - - - - 2 (i) VaR component (including the 3× multiplier) - - - - 3 (ii) SVaR component (including the 3× multiplier) - - - - 4 All portfolios subject to the standardised method 124,600 28,152 47,110 10,539
EU4 Based on the original exposure method - - - -
5 Total subject to the CVA capital charge 124,600 28,152 47,110 10,539
Table 35 provides a breakdown of CCR by exposure class and risk weight.
Table 35 – EU CCR3 – CCR exposures by regulatory portfolio and risk weight – Standardised Approach
31 Oct 2018 US$’000 Risk weight (%)
Exposure classes 0 2 4 10 20 50 70 75 100 150 Others Total
Of which
unrated 6 Institutions - - - - 204 124,396 - - - - - 124,600 - 7 Corporates - - - - - - - - - - - - -
9 Institutions and corporates with a short-term credit assessment - - - - - - - - - - - - -
11 Total - - - - 204 124,396 - - - - - 124,600 -
31 Oct 2017 US$’000 Risk weight (%)
Exposure classes 0 2 4 10 20 50 70 75 100 150 Others Total
Of which
unrated 6 Institutions - - - - - 47,110 - - - - - 47,110 - 7 Corporates - - - - - - - - - - - - -
9 Institutions and corporates with a short-term credit assessment - - - - - - - - - - - - -
11 Total - - - - - 47,110 - - - - - 47,110 -
The increase in exposure value (EAD post-CRM) is due mostly to the increase in positive fair value of the Company’s FX derivatives (see table 33).

Scotiabank (Ireland) DAC – Pillar 3 Disclosures 2018
41
4.6 Credit Risk Stress Testing
SIDAC performs quarterly credit stress tests. The first estimates the change in regulatory capital requirements that would arise during a mild recession. This is derived by performing a one-notch downgrade of each asset and calculating the resulting capital requirement based on the new risk-weighting of the assets. The second estimates the Expected Loss (EL) of each counterparty across all of SIDAC's portfolios. The stress test is based on a statistical confidence which uses the mean historical default and recovery rates with a stress applied. A worsening of the current credit conditions is reflected by applying a stress factor equivalent to 2.33 standard deviations to the default and recovery rates for the stressed case. This is equivalent to a 99% confidence level. The base case simply applies the mean historical default and recovery rates across all SIDAC's counterparty exposures. These are presented to RMC (to be transferred to ALCO and Credit Committee) and the BRC.
In addition, the Company has adopted the model from Scotiabank for the computation of expected losses under stressed conditions for inclusion in its ICAAP Enterprise Wide Stress Test (EWST). A stressed credit risk impact is estimated, based on model, by translating the macro-economic environment projected in each scenario into credit downgrade scenarios.
4.7 Wrong-way Risk
Wrong-way risk is a form of CCR which occurs when the exposure to a counterparty is adversely correlated with the credit quality of that counterparty, causing the default risk and credit exposure to increase together. It arises when default risk and credit exposure increase together. The Company’s derivative counterparty risks and CVA are potentially sensitive to wrong-way risks. These risks are managed and monitored through limit controls at counterparty level resulting in minimal wrong-way risk exposures.
5 Market Risk
This is the current or prospective risk to earnings and capital arising from adverse movements in asset prices, foreign exchange rates and interest rates. This can arise from dealing in debt securities, currencies or derivatives.
5.1 Market Risk Management and Risk Measures
Overall authority for managing market risk in accordance with the Board’s risk appetite is vested in the RMC (to be transferred to ALCO). The principal market risk that the Company is exposed to is interest rate risk in the banking book. The Company is also exposed to foreign exchange risk. SIDAC does not currently engage in trading activity.
5.1.1 Interest Rate Risk
A primary aspect of the Company’s business activities is the taking of interest rate risk through outright fixed positions taken by its Treasury operations. All aspects of this risk are closely monitored and controlled. The Board articulates its appetite for this risk by approving policies, setting limits and approving the annual Business Plan.
Part of the Company’s return on financial instruments is obtained from controlled mismatching of the dates on which interest receivable on assets and payable on liabilities is next reset.
In addition to higher level policy, these risks are also controlled by Board approved specific “DV01” limits which measure the change in value caused by a 1 basis point change in yield. These are set by maturity/rate sensitivity bucket, currency and in aggregate. DV01 reports are circulated daily to business line staff for review. Any reported breach is investigated and, if valid, reported to the CEO no later than the day following occurrence and to the AC at their next quarterly meeting.
As at 31 Oct 2018 the DV01 changes in value were as follows with Max, Min and Average being over the full year:
Table 36 – DV01 changes in value
US$ equivalent thousands 31 Oct Max Min Average (159.0) (206.0) (140.0) (164.0)

Scotiabank (Ireland) DAC – Pillar 3 Disclosures 2018
42
The Board charges Senior Management with the implementation of its Interest Rate Risk policy and management of its business activities in the Treasury areas. The RMC (responsibilities in this regard will transfer to ALCO) met throughout the year on at least a fortnightly basis to discuss and implement strategy based on its views of the current market.
The Risk Management function executes daily stress tests on the banking book interest rate portfolios. An immediate 1% move in rates is applied to the portfolios and the impacts on Economic Value (EV) and Annual Income (AI) are assessed. Results of EV and AI tests are monitored against Board approved limits.
The primary tool for measuring Market Risk is the Value at Risk (VaR) measure. Historically an Investment Book VaR has formed the basis of the Company’s Pillar 2 add-on for Interest Rate Risk in the Banking Book (IRRBB) with the internal capital measure for this risk designated as the annualised one-day result. After evaluating a number of options, the Company is adopting the Scotiabank economic capital model for IRRBB Pillar 2 capital charges which will include bonds and money book positions and has a rolling 10-year observation period with market volatility scaled to one year and a confidence level of 99.95%.
5.1.2 Foreign Exchange Risk
The Company’s foreign exchange risk consists of residual risk arising from foreign exchange funding position management and nostro balances. It does not arise from any trading or proprietary positions.
SIDAC’s Market Risk VaR calculation is performed by GRM based on Scotiabank’s approved methodology which in general includes all trading portfolios, foreign exchange and commodity risk exposures. The Scotiabank VaR model is a historical simulation model based on 300 business days of market data, a 1 day holding period and a 99% confidence level. VaR is computed on SIDAC’s behalf by GRM under an SLA based on position information provided by SIDAC. The VaR result is calculated daily and reviewed by Risk Management and business line staff. In fiscal 2018 the VaR analysis included only FX positions as SIDAC does not have a trading portfolio or commodity risk exposures. The results are also reviewed by the Risk Management Committee (to be transferred to ALCO) and are reported to the BRC on a quarterly basis.
In addition to VaR the Company also utilises product and maturity limits to restrict market risk.
Table 37 details the RWAs and capital requirements for market risk under the Standardised Approach. The increase in 2018 is due to general movements in assets and liabilities across all non-reporting currencies.
Table 37 – EU MR1 – Market Risk under the Standardised Approach
5.2 Market Risk Mitigation
The Company mitigates Market Risk through the use of derivatives (refer to the Risk Management Introduction section above), has approved products for this purpose and has experience in employing this strategy across a range of portfolios.
a b
US$’000 RWAs Capital requirements RWAs Capital requirements 31/10/2018 31/10/2018 31/10/2017 31/10/2017 Outright products
1 Interest rate risk (general and specific) - - - - 2 Equity risk (general and specific) - - - - 3 Foreign exchange risk 77,984 6,239 22,030 1,762 4 Commodity risk - - - - Options
5 Simplified approach - - - - 6 Delta-plus method - - - - 7 Scenario approach - - - - 8 Securitisation (specific risk) - - - -
9 Total 77,984 6,239 22,030 1,762

Scotiabank (Ireland) DAC – Pillar 3 Disclosures 2018
43
5.2.1 Interest Rate Risk Interest rate swaps are used to hedge interest rate risk in the investment bond book and are booked with multiple approved counterparties thus avoiding concentration. Currently the Company only has cash collateral for margining purposes and thus no collateral concentrations arise. No material concentration arises as a result of these risk mitigation measures which would prevent their effectiveness.
5.2.2 Foreign Exchange Risk The Company mitigates its foreign exchange risk exposures through matched funding of its non-US dollar assets or using other financial instruments, including derivatives to hedge this risk. The Company’s open FX positions post hedge is minimal and foreign currency income hedges are under the direction of the RMC (to be transferred to ALCO).
5.3 Market Risk Stress Testing
The Company’s market risk stress testing is focused primarily on interest rate risk (economic value (EV) and annual income (AI) - performed daily). Market risk is also a principal risk considered in the Company’s ICAAP EWST which includes market risk shocks for both interest rate risk and foreign exchange risk, among other key inputs.
5.3.1 Interest Rate Risk As mentioned above, the Company’s principal interest rate risk stress tests are the EV test, designed to protect shareholder equity and the AI test, designed to protect short-term revenue. They measure the maximum effect of a +/- 100 basis point parallel shift in yield curves on the net present value of the Company’s assets and liabilities for EV and on annual income for AI. Other daily interest rate stress tests are also conducted including a range of non-parallel yield curve shifts.
At 31 October 2018, an immediate and sustained 100 basis point shift in interest rates across all currencies and maturities would lower the fair value of assets and liabilities by approximately US$ 17.6mm (2017: US$ 19.2 mm) in aggregate. This is comprised of the following impact by currency:
Table 38 – Impact of 100 bps shift in interest rate US$ equivalent millions USD EUR GBP Others Total (17.6) 0.0 0.0 0.0 (17.6)
5.3.2 Foreign Exchange Risk As noted in section 5.2, the Company’s open FX positions, post hedging, on its non-US dollar assets is minimal. The Company does not perform dedicated foreign exchange risk stress tests, however shocks to FX markets are an important consideration for Scotiabank’s ICAAP EWST, as noted above.
6 Operational Risk
Operational Risk is the risk of loss, whether direct or indirect, to which the Company is exposed due to external events, human error, or the inadequacy or failure of processes, procedures, systems or controls. The Company views Outsourcing and Third-Party Risk to be a subset of Operational Risk.
All of the Basel Operational Event Classes and Event Types are considered in the review of Operational Risk. Internal factors, such as the internal control environment and external factors, such as macroeconomic conditions, external threats (e.g. fraud/crime) and the legal/regulatory environments all contribute to levels of operational risk. The Company has identified its top Operational Risk concerns as follows:Processes and procedures; People risk (Loss of key staff); Legal Risk; Compliance and Conduct Risk.
6.1 Operational Risk Management and Risk Measures
The Company’s objective is to manage operational risk so as to balance the avoidance of financial losses and damage to the Company’s reputation with overall cost effectiveness and control procedures that do not restrict initiative and creativity. Within these parameters the Company operates by following the Operational and Compliance policies and controls approved by the Board. Application of these policies and procedures is monitored by the Risk Management, Compliance and Internal Audit functions.

Scotiabank (Ireland) DAC – Pillar 3 Disclosures 2018
44
Senior management is responsible for ensuring that internal controls designed to minimise Operational Risk are in place and that all staff are trained to understand their responsibilities in identifying and reporting Operational Risk events. Furthermore, a periodic Risk Control and Self-Assessment (RCSA) process is conducted with participation by the relevant business lines, operational areas and control functions of the Company. The resulting report is reviewed and approved by senior management and a summary is presented to the BRC.
The overarching documents for Operational Risk are the Scotiabank Operational Risk Policy - adopted by the Board along with a SIDAC Policy Addendum reflecting local requirements - and the Scotiabank Operational Risk Management framework adopted by the RMC (to transfer to the Operational Risk Committee) along with a SIDAC Policy Addendum. In addition, advice and counsel is received from Scotiabank GRM on the two addendums.
The Company recognises the range of operational risks that are inherent in any organisation. The Company has developed a monthly report by category of operational risk, with appropriate Key Risk Indicators (KRIs) identified to address each one. KRIs are reviewed by the RMC (to be transferred to Operational Risk Committee) and presented quarterly to the AC. The indicators are based on the Company’s classifications of operational risk as mapped to the Basel classifications such as Fraud, Systems & Technology, Legal, Regulatory Compliance, People and others. The monthly report details operational risk quantitative and qualitative measures and any other identified high or moderate operational risk events.
Procedures exist for the identification, assessment and reporting of operational risk events, with reports being evaluated and categorised for severity by the Risk Management function and reviewed, where appropriate, by the RMC (to be transferred to Operational Risk Committee). If weaknesses arise Senior Management take remedial action. Regulatory reporting for Operational risk is also a requirement as a condition of the Company’s banking licence.
6.2 Exposure to Operational Risk
The CRR sets out three approaches for calculating capital requirements for operational risk: Basic Indicator Approach, Standardised Approach, and the Advanced Measurement Approaches. The Company has elected to use the Basic Indicator Approach. This requires the Company to hold a capital amount equal to 15% of the average of the sum of net interest income and net non-interest income for the three preceding 12-month financial periods for which audited financial information is available.
6.3 Operational Risk Mitigation
The Company has put in place policies and procedures to mitigate each of the key elements of the Operational Risk as described above. One of the potential factors to cause financial impact for the Company is one or more failed trades or payments. Due to the netting procedure with the parent, the Company’s risk has been substantially reduced. Actual losses for penalty payments during the last three fiscal years amounted to US$13k. Since the Company has a Business Continuity Planning (BCP) site and has recourse to Scotiabank facilities, it is deemed highly unlikely that a failure to process payments could extend beyond one business day. The Company also considers payment fraud in its Enterprise Wide Stress Test (EWST) and incorporates a component for Operational Risk based on scenarios modelled and included two potential operational risk losses of US$50mm and US$25mm over the horizon of the stress in the 2018 EWST result. The EWST can potentially increment the Company’s Pillar 2 Guidance (‘P2G’) and did so in 2018.
6.4 Operational Risk Stress Testing
Operational risk stress testing is performed based on scenario analysis. Different scenarios are defined by Risk Management in conjunction with the business lines and support functions in the overall assessment of Operational Risk. Each scenario is considered with and without management action, to assess the possible operational loss and evaluate the stressed capital ratios compared to the regulatory requirements.
7 Information Technology risk
Information Technology (IT) Risk is now categorised as a separate risk from Operational Risk and is deemed to be a material risk. This is based on the pervasive nature of IT and Cyber Security Risk and the potential for substantial losses and reputational damage that could be caused by an IT failure. Scotiabank, to whom the Company’s IT Functions are largely outsourced, is exposed to cyber security risks, which may include theft of assets, unauthorized access to

Scotiabank (Ireland) DAC – Pillar 3 Disclosures 2018
45
sensitive information, or operational disruption such as breaches of cyber security. Scotiabank has implemented a robust and continuously evolving cyber security program to keep pace with evolving threats in which the Company participates. While computer systems continue to be subject to sophisticated cyber-attack attempts, Scotiabank’s countermeasures in place remain effective. The Company, assisted by Scotiabank IT staff, continues to actively monitor this risk, leveraging external threat intelligence, internal monitoring, reviewing best practices and implementing additional controls as required to mitigate these risks, while noting that the Company is a less likely target for cyber-crime, since it has no retail dimension.
8 Compliance Risk (including Conduct Risk)
Compliance Risk is the risk that the Company’s business activities may not be conducted in conformity with applicable Regulations, internal policies and procedures and ethical standards expected by regulators, customers, investors, employees and other stakeholders. “Regulations” means all Governmental Acts, laws, rules, regulations, regulatory guidelines and industry or self-regulatory organizational codes of conduct, rules and by-laws.
Compliance Risk is now deemed a material risk. It arises throughout the organisation with respect to on-going compliance with transactions, documentation and a wide range of prudential and conduct of business regulations, including regulatory reporting). This risk is heightened as a result of:
- Increased volume and complexity of new regulations and changes to existing regulatory obligations (such as MiFID II, EBA/CBI guidance on Remuneration, Volcker, Data Protection Legislation, Anti-Money Laundering, Fitness & Probity , Basel III, Recovery and Resolution Planning, Corporate Governance etc.) and a new focus by regulators on non-financial risk such as Conduct Risk;
- Increased number of regulatory bodies and associations whose rules or guidance have application to the Company’s activities; e.g. CBI, EBA, BASEL, ESMA, FATF, OSFI;
- Extra-territorial scope for international regulation e.g. Volcker, FATCA, EMIR;
- Increased volume and complexity of reporting requirements and impact on existing systems; and
- Increased level of scrutiny, enquiry, inspection and regulatory enforcement by the Central Bank with an expectation that recommendations will be dealt with promptly.
While the risk is considered material to the Company, exposure to this risk is sufficiently mitigated by the capital held for Operational Risk.
8.1 Governance and Controls
The Board is ultimately responsible for overseeing the execution of the Company’s principal Compliance Risk Summary Framework and this is monitored through the Board Audit Committee. The Board approves a number of policies supporting regulatory compliance. The Director, Head of Compliance has a reporting line directly to the Audit Committee of the Board and presents a report to the Committee quarterly on all compliance or regulatory issues arising. The Compliance and Regulatory Committee (C&RC) is the management committee responsible for ensuring that the risk of the Company being non-compliant with new or current legal and regulatory requirements is effectively managed and controlled. The C&RC also ensures that the compliance implications of product/service initiatives are considered and the implications of implementing any attendant compliance requirements are assessed and accepted before any proposal is adopted. The Compliance Function supports this committee in achieving these objectives.
9 Liquidity Risk
This is the current or prospective risk to earnings and capital arising from an institution’s inability to meet its liabilities when they fall due.
9.1 Liquidity Risk Management and Risk Measures
The Company’s Internal Liquidity Adequacy Assessment Process (ILAAP) and Liquidity Risk Management Policy set out in detail the risk measurement and management approaches employed to address this risk. By approving the ILAAP, the Board has satisfied itself as far as possible, that the Company will always have sufficient liquidity to meet its

Scotiabank (Ireland) DAC – Pillar 3 Disclosures 2018
46
obligations when due, under both normal and stressed conditions, without incurring unacceptable losses or risking damage to the Company’s reputation.
The Company monitors its Liquidity Coverage Ratio (LCR), a short-term liquidity measure defined under CRD IV, on a daily basis. Banks are required to have sufficient high-quality liquid assets to withstand a 30 calendar day liquidity stress scenario. A regulatory minimum ratio as set out in the CRR and associated implementing legislation and EBA guidelines applied from October 2015 and was phased in and reached the final minimum ratio of 100% on 1 January 2018. As at 31 October 2018, the Company’s LCR was 1085% (31 October 2017: 484%), exceeding the regulatory minimum. The Company also monitors the LCR in significant currencies on a daily basis (where currency liabilities > 5% of total liabilities).
The Net Stable Funding Ratio (NSFR) supports the maintenance of a stable funding profile and requires the Company to have sufficient quantities of funding from stable sources. The effective date for a regulatory minimum of 100% has not yet been set but the Company has been working to achieve this level and during 2018 set a Board approved Risk Appetite Limit of >105% for the NSFR ratio and began monitoring the ratio internally on a weekly basis. The ratios are reported monthly to the RMC (to be transferred to ALCO) and quarterly to the BRC. The calculation of the ratio is based on the Company’s interpretation of the Basel Committee on Banking Supervision’s document (Basel III: The Net Stable Funding Ratio October 2014) as a calculation basis has not yet been set in the EU.
Liquidity Risk is measured and controlled through the establishment of quantifiable metrics outlined in the Company’s Risk Appetite Framework, namely LCR, Weighted Average Remaining Maturity (WART), and NSFR. This is supplemented by internal liquidity limits and the performance of daily stress tests applied to the behavioural characteristics of the Company’s portfolio.
The Company also complies with regulatory liquidity management requirements set by the CBI, including the maintenance of a minimum liquidity buffer (MLB) defined as the minimum liquidity buffer required covering net stressed cash-outflows under the worst case (maximum net cash-outflow) moderate liquidity stress scenario for the defined liquidity horizon. The MLB mitigates against liquidity stress events that may occur over a short time horizon of 1 week and a longer time horizon of a month. These stress results are reviewed daily by appropriate senior management and the Treasury function.
The Company has Board approved limits on the maximum liability cash flow gap (i.e. mismatch between inflows and outflows) it can operate and a minimum level of Core Liquid Assets. Both are managed and limits are set by currency. These are monitored through a cumulative 10 day and 30 day cash flow gap position report. The Company also manages the term of its funding through the operation of a Weighted Average Remaining Term (WART) measure. Funding held is measured against the minimum Board approved and regulatory metrics on a daily basis.
Cash flow interest rate risk is the risk that the future cash flows of a financial instrument will fluctuate because of changes in market interest rates. The Company runs a daily Income Stress test that assesses the impact of a 1% increase/decrease in interest rates on profitability arising from asset and liability positions re-setting within the next year.
Liquidity Risk Governance
The Company’s Treasury function, under the direction of the RMC (to transfer to ALCO) is responsible for managing the Company’s liquidity. The RMC, with its mandate to address ALCO issues, is the committee responsible for the strategic direction for Liquidity and Funding Risk management. It approves limits and the methodologies used for measuring and managing Liquidity Risk. It also seeks advice and counsel from Scotiabank GRM as appropriate. The Company’s Liquidity Policy and all liquidity limits are reviewed by the RMC and receive advice and counsel from GRM. The Liquidity Policy subsequently receives approval from the Board and limits are presented to the Board for annual review and approval.
9.2 Exposure to Liquidity Risk
Table 39 on the following page has been produced in line with the 2017 EBA Guidelines on LCR disclosure (EBA/GL/2017/01). All figures included in the table represent a 12-month rolling average for each quarter of 2018 and for the year ended 2017.

Scotiabank (Ireland) DAC – Pillar 3 Disclosures 2018
47
Table 39 – EU LIQ1 – LCR Disclosure
Total unweighted value (average) Total weighted value (average) 2018 2017 2018 2017
US$’000 31 Oct 31 Jul 30 Apr 31 Jan 31 Oct 31 Oct 31 Jul 30 Apr 31 Jan 31 Oct HIGH QUALITY LIQUID ASSETS 1 Total high-quality liquid assets (HQLA) 2,230,950 2,327,195 2,354,866 2,316,454 2,018,128 CASH OUTFLOWS 2 Retail deposits and deposits from small business customers, of which: - - - - - - - - - - 3 Stable deposits - - - - - - - - - - 4 Less stable deposits - - - - - - - - - - 5 Unsecured wholesale funding 596,661 529,506 453,290 357,794 344,400 596,600 529,438 453,223 357,726 344,345 6 Operational deposits (all counterparties) and deposits in networks of cooperative banks - - - - - - - - - - 7 Non-operational deposits (all counterparties) 110,991 105,267 107,247 86,108 72,292 110,930 105,199 107,180 86,040 72,237 8 Unsecured debt 485,670 424,239 346,043 271,686 272,108 485,670 424,239 346,043 271,686 272,108 9 Secured wholesale funding 2,039 2,039 3,005 3,046 2,727 10 Additional requirements 1,984,395 2,026,157 1,963,513 1,900,835 1,601,606 564,057 592,419 574,312 521,167 408,551 11 Outflows related to derivative exposures and other collateral requirements 20,435 22,708 24,795 21,175 13,285 20,435 22,708 24,795 21,175 13,285 12 Outflows related to loss of funding on debt products - - - - - - - - - - 13 Credit and liquidity facilities 1,963,960 2,003,449 1,938,718 1,879,660 1,588,321 543,622 569,711 549,517 499,992 395,266 14 Other contractual funding obligations 24,814 18,788 20,477 17,000 12,033 23,291 17,341 19,026 15,479 10,612 15 Other contingent funding obligations - - - - - - - - - -
16 TOTAL CASH OUTFLOWS 1,185,987 1,141,237 1,049,566 897,418 766,235 CASH INFLOWS 17 Secured lending (e.g. reverse repos) 19,043 19,043 20,085 31,585 37,385 72 72 205 220 194 18 Inflows from fully performing exposures 463,525 364,350 322,845 234,294 143,557 459,593 363,036 319,696 231,146 140,659 19 Other cash inflows 332,872 367,447 337,354 314,987 189,131 332,865 367,431 337,329 314,953 189,099
EU-19a (Difference between total weighted inflows and total weighted outflows arising from transactions in third countries where there are transfer restrictions or which are denominated in non-convertible currencies) - - - - -
EU-19b (Excess inflows from a related specialised credit institution) - - - - -
20 TOTAL CASH INFLOWS 815,440 750,840 680,284 580,866 370,073 792,530 730,539 657,230 546,319 329,952
EU-20a Fully exempt inflows - - - - - - - - - - EU-20b Inflows Subject to 90% Cap - - - - - - - - - - EU-20c Inflows Subject to 75% Cap 815,440 750,840 680,284 580,866 370,073 792,530 730,539 657,230 546,319 138,264 21 LIQUIDITY BUFFER 2,125,543 2,217,651 2,212,802 2,175,239 2,127,806 22 TOTAL NET CASH OUTFLOWS 482,982 490,101 464,830 414,703 496,057 23 LIQUIDITY COVERAGE RATIO (%) 617% 588% 612% 665% 550%
The quarterly 12 month rolling average LCR ranged from 588% to 665% in 2018. The quarterly average HQLA ranged from US$ 2,231mm to US$ 2,355mm. The quarterly weighted average of outflows ranged from US$ 897mm to US$ 1,186mm. The quarterly weighted average inflows ranged from US$ 1,639mm to US$ 2,378mm.
Scotiabank (Ireland) DAC – Pillar 3 Disclosures 2018
48
9.3 Liquidity Risk Mitigation
Through an analysis of its business lines, operating procedures, EBA guidelines and relevant regulatory requirements, the Company has identified several risk drivers to which the institution is exposed in relation to liquidity risk and funding risk. The Company has adopted policies and measures to mitigate these risks.
Cross-Currency Risk
One significant driver of liquidity risk is cross-currency risk as the Company’s business is multi-currency, with the key operational currencies identified as EUR, GBP and USD. The Company’s capital and its liability base are denominated in USD, sourced from Bank of Nova Scotia Group affiliates. The Company’s business activities require it to fund assets denominated in currencies other than USD. In order for the Treasury function to efficiently fund these non-USD assets, it executes foreign exchange (FX) swaps to fund its non-USD positions. FX Funding is at present the most cost-effective method of funding non-USD assets.
FX Swaps are transacted on a frequent and ongoing basis and are currently executed with Scotiabank Group entities. Potential future shortfalls in the funding of non-USD currencies are identified in advance and remedied via FX Swaps
The Company is cognisant that its sources of funding are not diversified and concentration risk is generated as a result of its dependence on FX swap instruments. This risk is mitigated by imposing limits on the percentage amount of funding that can be conducted via FX, by holding a large portfolio of liquid assets and other unencumbered assets in various currencies, as well as by managing the maturity mismatch by ensuring diversification of the funding maturity profile. Risk metrics have been established to ensure the aforementioned mitigants are effective.
Intraday Liquidity Risk
Intraday Liquidity risk is the risk that a bank fails to manage its intraday liquidity properly, which could leave it unable to meet a payment obligation at the time expected, thereby affecting its own liquidity position and that of other parties. The Company faces intraday liquidity risk through participation indirectly in clearing and payment systems via nostro banks used to access them. Its nostro banks are suitably diversified across major international banks. Funding of intraday payments is monitored continuously. External payments are prioritised over inter-group payments and all internal payments are netted were possible. The Company also uses clearing agents for securities. Intraday liquidity risk is monitored via intraday liquidity reports, real time monitoring of major nostro accounts, and monitoring of payments against expected flows amongst other reports.
To mitigate intraday liquidity risk, the Company has overdrafts in place as appropriate, currently covering North America due to the time difference. Close monitoring of payments and receipts intraday occurs with escalation of potential non-receipts on a timely basis.
Off-Balance Sheet Liquidity Risk
The main source of the Company’s off-balance sheet risk is from undrawn lines under committed credit facilities. The undrawn committed facilities can be drawn in the Company’s key operational currencies and also its non-material currencies, the potential for which is comparatively low. As noted above, the Company relies on the FX market to fund its non-USD exposures. Assumptions are made within the Liquidity Stress Test (LST) framework about the extent and timing of drawings during normal business and under a market disruption.
In addition to the above, to help mitigate liquidity risk, the Company’s pool of bonds enables it to raise funds through wholesale banking repo markets, the ECB and other national central banks. In addition, in order to mitigate its funding risk, the Company has a US$1bn committed funding facility from Scotiabank and the primary sources of the Company’s funding are deposits from Scotiabank and Scotiabank affiliates.
9.4 Liquidity Risk Stress Testing
The Company’s Liquidity Stress Testing Framework (the Framework) governs its Liquidity Stress Testing Program (the LST Program). The LST Program is established to ensure that the Company maintains a sufficient liquidity buffer to mitigate liquidity shortfalls from stress events, such as those defined by the scenarios outlined within the Framework. The LST program defines a range of liquidity stress scenarios that could be encountered and includes idiosyncratic (or

Scotiabank (Ireland) DAC – Pillar 3 Disclosures 2018
49
Scotiabank specific), market wide and combination scenarios, types of stress tests undertaken, their frequency, methodological details, appropriate assumptions and relevant data infrastructure.
The Framework aligns with the principles outlined in the Committee of European Banking Supervisors (CEBS, now European Banking Authority (EBA)) “Guidelines on Liquidity Buffers & Survival Periods” (December 2009) as well as the BNS Liquidity Stress Testing Operating Framework.
With regard to the solvency of the Company, a Reverse Stress Test is conducted on a qualitative basis through discussion at the RMC (to be transferred to ALCO). Consideration is given to outcomes resulting in both the insolvency and the un-viability of the Company.
Four scenarios are considered:
• Idiosyncratic: Short-term Cash Flow Shock (Scotiabank): It is assumed that there is no situation, with the possible exception of a large-scale fraud or a major regulatory issue, which would specifically cause an idiosyncratic liquidity crisis for the Company. Since it is an unrated subsidiary of Scotiabank it is assumed that the entity specific scenario explored should be that of a shock or a crisis at BNS, for example a downgrade to its credit rating. This would impact Scotiabank’s ability to raise liquidity which could impact its ability to fund its affiliates.
• Systemic: Global Recession: This scenario assumes widespread disruption to the market with restrictions on the availability of wholesale and interbank funding, significant deterioration in market values and action by central banks to lower interest rates. In addition, it is assumed that liquidity shortages would cause wholesale banks to significantly increase rates in the interbank market.
• Combination: This is a combination event that incorporates both a significant operational issue affecting Scotiabank and a systemic stress.
• Extraordinary Liquidity Condition: This scenario assumes Scotiabank is unable to provide liquidity support to the Company.
10 Concentration Risk
Concentration Risk is the risk associated with any single exposure (or group of exposures that may perform similarly because of a common characteristic or common sensitivity to economic, financial, or business developments) that has the potential to cause considerable risk to earnings and capital. Concentration Risk may arise as a result of correlated positions that present exposure to multiple risk factors. Credit concentration risk includes concentrations to the same counterparties or groups of connected counterparties, and counterparties in the same industry sector, geographical region or concentrations from the same activity.
10.1 Concentration Risk Management and Risk Measures
The Board has approved a Concentration Risk Policy which sets out types of concentration risk and the levels at which concentrations are regarded as material or significant. Oversight of the Company’s management of Concentration Risk also includes RMC (to transfer to both ALCO and Credit Committee) and Board review and approval of policies and limits relating to Credit, Market, Liquidity, and Operational Risk as well as quarterly reporting to the BRC on risk concentrations relating to these key risk disciplines and stress testing on sectors where a material concentration is deemed to arise. Specific Board approved limits are set to control the maximum exposure to any counterparty or group of related counterparties. Coupled with this, the Regulatory Large Exposure rules must be observed. Industry and country concentration is monitored on a regular basis for internal and regulatory purposes. Overall industry and country exposures are reviewed by the RMC (to transfer to Credit Committee) on a regular basis. As at 31 October 2018, the
Scenario TypeShort Term Cash Flow Shock IdiosyncraticGlobal Recession SystemicCombination CombinationExtraordinary Liquidity Condition Combination
Severity
Moderate Extreme
Extreme
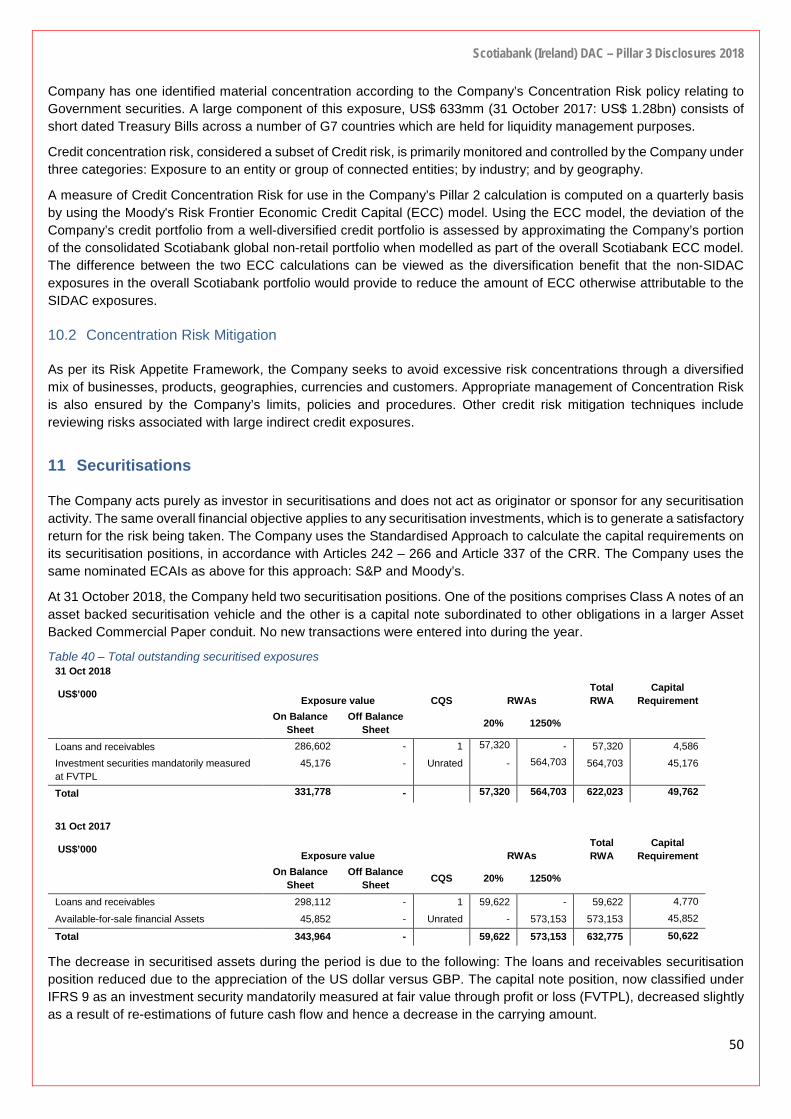
Scotiabank (Ireland) DAC – Pillar 3 Disclosures 2018
50
Company has one identified material concentration according to the Company’s Concentration Risk policy relating to Government securities. A large component of this exposure, US$ 633mm (31 October 2017: US$ 1.28bn) consists of short dated Treasury Bills across a number of G7 countries which are held for liquidity management purposes.
Credit concentration risk, considered a subset of Credit risk, is primarily monitored and controlled by the Company under three categories: Exposure to an entity or group of connected entities; by industry; and by geography.
A measure of Credit Concentration Risk for use in the Company’s Pillar 2 calculation is computed on a quarterly basis by using the Moody's Risk Frontier Economic Credit Capital (ECC) model. Using the ECC model, the deviation of the Company’s credit portfolio from a well-diversified credit portfolio is assessed by approximating the Company’s portion of the consolidated Scotiabank global non-retail portfolio when modelled as part of the overall Scotiabank ECC model. The difference between the two ECC calculations can be viewed as the diversification benefit that the non-SIDAC exposures in the overall Scotiabank portfolio would provide to reduce the amount of ECC otherwise attributable to the SIDAC exposures.
10.2 Concentration Risk Mitigation
As per its Risk Appetite Framework, the Company seeks to avoid excessive risk concentrations through a diversified mix of businesses, products, geographies, currencies and customers. Appropriate management of Concentration Risk is also ensured by the Company’s limits, policies and procedures. Other credit risk mitigation techniques include reviewing risks associated with large indirect credit exposures.
11 Securitisations
The Company acts purely as investor in securitisations and does not act as originator or sponsor for any securitisation activity. The same overall financial objective applies to any securitisation investments, which is to generate a satisfactory return for the risk being taken. The Company uses the Standardised Approach to calculate the capital requirements on its securitisation positions, in accordance with Articles 242 – 266 and Article 337 of the CRR. The Company uses the same nominated ECAIs as above for this approach: S&P and Moody’s.
At 31 October 2018, the Company held two securitisation positions. One of the positions comprises Class A notes of an asset backed securitisation vehicle and the other is a capital note subordinated to other obligations in a larger Asset Backed Commercial Paper conduit. No new transactions were entered into during the year.
Table 40 – Total outstanding securitised exposures 31 Oct 2018
US$’000 Exposure value CQS RWAs Total RWA
Capital Requirement
On Balance Sheet
Off Balance Sheet
20% 1250%
Loans and receivables 286,602 - 1 57,320 - 57,320 4,586 Investment securities mandatorily measured at FVTPL
45,176 - Unrated - 564,703 564,703 45,176
Total 331,778 - 57,320 564,703 622,023 49,762
31 Oct 2017
US$’000 Exposure value RWAs Total RWA
Capital Requirement
On Balance Sheet
Off Balance Sheet CQS 20% 1250%
Loans and receivables 298,112 - 1 59,622 - 59,622 4,770
Available-for-sale financial Assets 45,852 - Unrated - 573,153 573,153 45,852
Total 343,964 - 59,622 573,153 632,775 50,622
The decrease in securitised assets during the period is due to the following: The loans and receivables securitisation position reduced due to the appreciation of the US dollar versus GBP. The capital note position, now classified under IFRS 9 as an investment security mandatorily measured at fair value through profit or loss (FVTPL), decreased slightly as a result of re-estimations of future cash flow and hence a decrease in the carrying amount.

Scotiabank (Ireland) DAC – Pillar 3 Disclosures 2018
51
Accounting treatment
On transition to IFRS 9, the existing securitisation exposures have either been reclassified or remeasured.
The Class A notes continue to be measured at their amortised cost using the effective interest method, however their impairment is now calculated using the expected credit loss (ECL) approach and they now have a specific credit risk adjustment relating to this ECL amount.
The capital note has been reclassified from Available-for-sale financial assets to Investment securities mandatorily measured at FVTPL as its cash flows do not represent payments that are solely payments of principal and interest (SPPI). This note is now measured at fair value in the balance sheet with realised and unrealised gains and losses recognised in the Profit and Loss account as part of net trading income or net gain/loss from other financial instruments carried at fair value. This position is classified as Level 3 as it does not trade in an active market. It is fair valued based on an internally developed model that requires the use of significant unobservable inputs, involving greater management judgment for valuation purposes. The unobservable inputs used in the valuation primarily include assumptions on the level of cash flows and discount rates. These assumptions are reviewed on an ongoing basis by management.
Monitoring of risks
In relation to the capital note position the Company conducts an annual valuation review which incorporates changes in the expected average life, cash flows received and projected, and discount rate to use. The RMC (to transfer to ALCO) approve this document.
In relation to the Class A notes, these are the Senior ranking notes with only net swap payments ranking ahead of principal and interest on the notes. The Company performs monitoring and analysis of the transactions based on the investor report provided by the borrower on a monthly basis. This includes an analysis of delinquency ratios, retention and return rates and the level of overcollateralization. A formal review and update is also provided to the credit team at least annually which includes relevant stress testing.
Periodically throughout the year Risk Management and the business line have discussions with the Securitisation manager regarding changes in the portfolio – i.e. pools, new business, margins and expected cash flows. Risk management also conduct an annual limit review via the appropriate credit committee.
Credit risk
The securitisations are subject to a credit risk capital charge under the standardised approach of US$ 49.8mm as at 31 October 2018 (2017: US$ 50.6mm). Using Moody’s ratings, the Class A notes position attract a risk-weighting of 20%. The Company does not avail of available techniques of hedging or unfunded protection to mitigate the exposures to securitisations.
Other risks
There are a number of possible inherent risks in purchasing certain securitised notes including: the performance of the underlying assets; the explicit support of the Issuer and its financial stability; volatility in the market value of securitised notes; and liquidity risk that the SPV issuing the purchased securitisation notes has insufficient income from the underlying assets to meet its obligations. The Company is not subject to these other risks in a material way which would require additional regulatory capital beyond what has been provided under the standardised approach.
12 Asset Encumbrance
An asset would be treated as encumbered if it has been pledged or if it is subject to any form of arrangement to secure, collateralise or credit enhance any transaction from which it cannot be freely withdrawn.
The asset encumbrance disclosure templates, shown on the following two pages, have been compiled in accordance with the Commission Delegated Regulation (EU) 2017/2295 on disclosure of encumbered and unencumbered assets under Article 443 of the CRR. The regulation requires that the data is presented as a median calculation. The reported amounts are median values based on quarter end point in time amounts over the year to 31 October 2018.

Scotiabank (Ireland) DAC – Pillar 3 Disclosures 2018
52
Table 41 – Encumbered and unencumbered assets 31 Oct 2018 31 Oct 2017 US$’000 Carrying
amount of encumbered
assets
Fair value of encumbered
assets
Carrying amount of
unencumbered assets
Fair value of unencumbered
assets
Carrying amount of
encumbered assets
Fair value of encumbered
assets
Carrying amount of
unencumbered assets
Fair value of unencumbered
assets
010 040 060 090 010 040 060 090 010 Assets of the reporting institution 47,562 6,862,710 29,157 6,539,603
030 Equity instruments - 13,686 - 14,990
040 Debt securities 41,247 41,247 3,503,393 3,503,393 14,947 14,947 3,767,182 3,767,182
050 of which: covered bonds - - 62,801 62,801 - - 118,620 118,620
060 of which: asset-backed securities - - 45,284 45,284 - - 37,842 37,842
070 of which: issued by general governments 4,983 4,983 1,493,161 1,493,161 - - 1,426,673 1,426,673
080 of which: issued by financial corporations 17,247 17,247 1,475,633 1,475,633 - - 1,657,436 1,657,436
090 of which: issued by non-financial corporations 19,018 19,018 658,065 658,065 4,929 4,929 857,099 857,099
120 Other assets 6,315 3,333,297 14,210 2,757,127
Table 42 – Collateral received (encumbered and unencumbered)
31 Oct 2018 31 Oct 2017 US$’000 Fair value of
encumbered collateral received
or own debt securities issued
Fair value of unencumbered collateral
received or own debt securities issued available
for encumbrance
Fair value of encumbered
collateral received or own debt
securities issued
Fair value of unencumbered collateral
received or own debt securities issued available
for encumbrance
010 040 010 040 130 Collateral received by the reporting institution - - - - 140 Loans on demand - - - - 150 Equity instruments - - - - 160 Debt securities - - - - 220 Loans and advances other than loans on demand - - - - 230 Other collateral received - - - -
240 Own debt securities issued other than own covered bonds or asset-backed securities - - - -
241 Own covered bonds and asset-backed securities issued and not yet pledged - -
250 Total assets, collateral received and own debt securities issued 47,562 29,157

Scotiabank (Ireland) DAC – Pillar 3 Disclosures 2018
53
Table 43 – Sources of encumbrance 31 Oct 2018 31 Oct 2017
Matching liabilities,
contingent liabilities or
securities lent
Assets, collateral received and own
debt securities issued other than
covered bonds and ABSs encumbered
Matching liabilities,
contingent liabilities or
securities lent
Assets, collateral received and own
debt securities issued other than
covered bonds and ABSs encumbered
US$’000 010 030 010 030 010 Carrying amount of selected financial liabilities 46,972 47,562 30,044 29,157
011 of which: Derivatives 5,635 6,315 15,106 14,210 012 of which: Repurchase agreements 41,337 41,247 14,937 14,947
As an integral aspect of its business, the Company engages in activities that result in certain assets being encumbered. The majority of encumbrance arises from its repo and reverse repo transactions. Other sources of encumbrance are collateral pledged under CSA agreements with OTC derivative counterparties.
The Company primarily adopts standard collateral agreements and collateralises based on industry standard contractual agreements (mostly CSA, ISDA, and GMRA).
13 Remuneration
The SIDAC Board is responsible for oversight of SIDAC’s remuneration policy and local regulatory processes, within the overarching framework of The Bank of Nova Scotia (“BNS”) Compensation Policy, the BNS Clawback Policy, as well as a SIDAC Addendum to both policies.
As SIDAC employees participate in a compensation structure and programmes that apply to BNS employees globally, the SIDAC Board and the BNS Human Resources Committee (“BNS HRC”) work together to fulfil the oversight responsibilities contained in their respective mandates outlined below.
13.1 Qualitative Disclosure
13.1.1 Governance
Role of SIDAC Board
The Board is ultimately responsible for ensuring that SIDAC has in place remuneration policies and practices which are consistent with sound and effective risk management and do not promote excessive risk-taking. The Board monitors remuneration adequacy, effectiveness and related governance and is responsible for overseeing the development and implementation of SIDAC’S remuneration practices in accordance with all regulatory remuneration requirements, SIDAC remuneration policy, and ensuring compliance with same.
SIDAC does not have a practice of using variable remuneration vehicles or methods that facilitate avoidance of the EBA Guidelines on Sound Remuneration Policies.
Additionally, the Board, within its mandate, is responsible for:
• Approving the remuneration for executive management as well as other identified Material Risk Takers (“MRTs”).
• Approving SIDAC’s remuneration policy and overseeing that policies, practices and processes are in compliance with such policy;
• Assessing the achievement of performance targets and the need for any ex-post risk adjustments;
• Reviewing remuneration decisions in the context of SIDAC’s risk appetite; and
• Overseeing that appropriate compensation frameworks are in place, which may include the adoption of new incentive plans or material changes to existing plans, in accordance with the compensation programmes and policies of the parent company, BNS.

Scotiabank (Ireland) DAC – Pillar 3 Disclosures 2018
54
The Board reviews those material matters that are discussed with, or decisions made by, the BNS Human Resources Committee (“BNS HRC”) which are relevant to SIDAC, providing for local oversight, review and input on remuneration matters, where appropriate. The Board interacts with the BNS HRC as required.
The Board met ten times during fiscal 2018, of which five of the meetings included discussion of remuneration matters. Composition of the Board is as referenced in section 3.2.1 of this document.
During 2018, the Board was supported in executing its remuneration mandate by SIDAC’s Human Resources Committee (“SIDAC HRC”, a management committee). The primary objective of the SIDAC HRC was to provide guidance to Senior Management and the Board on human resource-related matters and to implement BNS HR and compensation policies and procedures as applicable to SIDAC. Specifically, the SIDAC HRC’s remuneration responsibilities included:
• Ensuring all employee incentive plans and terms and conditions of employment approved on behalf of SIDAC are in compliance with applicable legislation and regulations and regulatory guidelines including, but not limited to, the remuneration requirements of the Capital Requirements Directives IV and related EBA Guidelines and Regulatory Technical Standards/Regulations; and
• Reviewing the compensation principles and programmes of BNS as applicable to SIDAC.
Following a holistic review of SIDAC’s internal governance structure, a new structure was introduced effective fiscal year 2019. The SIDAC HRC was dissolved and remuneration matters previously within its remit were mandated to a newly established Remuneration Oversight Committee (“ROC”, also a management committee) to ensure compliance with all key remuneration-related regulatory requirements.
Role of The Bank of Nova Scotia Human Resources Committee (“BNS HRC”)
BNS has an established Human Resources Committee of its Board of Directors (the “Parent Board”), which is responsible for setting global, Bank-wide policies for BNS on compensation, overseeing the compensation governance framework and ensuring that compensation arrangements are consistent with and promote effective risk management. The BNS HRC assumes decision-making responsibilities relating to compensation and annual disclosure and related reviews and recommends to the Parent Board for approval the content and effectiveness of the BNS Compensation Policy, as informed by corporate human resources and independent advisors, and ensures that they align with BNS’ strategic objectives.
At an Enterprise level, the BNS HRC is responsible for:
• Leadership and succession planning – oversees management succession plans to ensure effective leadership
• Compensation philosophy and human resources policies and practices – oversees alignment with BNS’ pay-for-performance strategy and risk appetite
• Compensation programmes – oversees material compensation programmes and incentive plans and makes recommendations to the Parent Board with respect to these programmes. Reviews compensation disclosure and recommends approval to the Parent Board prior to publication
• Compensation governance – reviews evolving governance practices and the alignment of compensation policies with best practices and the remuneration-related requirements of the Financial Stability Board (“FSB”), CBI, EBA and shareholder advisory firms such as Institutional Shareholder Services (“ISS”) and Glass Lewis, and monitors compliance
• Managing compensation risk – meets with the Parent Board’s Risk Committee to jointly review and recommend all key elements of material incentive plans, including plan design, targets, metrics and potential pay-outs. Seeks independent advice and input from a third-party advisor.
The BNS HRC retains an external, qualified third party to advise on compensation matters including matters that are applicable to SIDAC, for example regulatory trends and updates in the European Union.
The BNS HRC held seven meetings in 2018 (2017: seven meetings), including a joint session with the Parent Board’s Risk Committee. Additional information on BNS HRC composition and compensation decision-making can be found in the Parent’s Management Proxy Circular at http://www.scotiabank.com/ca/en/0,,917,00.html.

Scotiabank (Ireland) DAC – Pillar 3 Disclosures 2018
55
13.1.2 Material Risk Taker Criteria
SIDAC follows EBA regulatory technical standards4 and identifies the following groups of employees as MRTs based on qualitative criteria (related to the role and decision-making authority of employees) and quantitative criteria (related to the level of total gross remuneration in absolute or relative terms):
(a) SIDAC executive-level employees
(b) Employees leading business line functions with a significant proportion of revenues, numbers of staff and capital usage;
(c) Employees leading control and stewardship functions including risk, compliance, finance, audit and HR;
(d) Employees responsible for developing and implementing SIDAC’s business line strategy;
(e) Senior management whose activities are deemed to have a material impact on SIDAC’s risk profile;
(f) Higher earners and employees involved in trading activities who have a material impact on the risk profile of SIDAC; and
(g) SIDAC’s non-executive Board members.
13.1.3 Link between pay and performance
In addition to base salary, SIDAC’s remuneration programme includes a mix of annual and deferred incentives – which together are variable pay and known as “pay-at-risk” since they are not guaranteed. In compliance with the requirements as set out within Article 94 (1) CRD IV, and SIDAC shareholder approval on July 18, 2014, SIDAC has capped variable pay at a maximum ratio of 200% of fixed compensation for its MRTs.
Total remuneration of SIDAC employees, including MRTs, may be comprised of fixed remuneration (i.e., base salary, non-discretionary pension, other benefits and all allowances including mobility-related allowances) and variable remuneration (i.e., annual incentives and deferred incentives). Severance pay, if any, is determined on a case-by-case basis and involves the control functions including legal, human resources and compliance. Additionally, we seek the advice of external counsel to ensure any severance payments are sound.
In determining the appropriate mix, an employee’s ability to affect results over the longer term, the mix for similar positions in BNS’ comparator group, and market practice are all considered.
Guaranteed variable remuneration is not part of SIDAC’s remuneration approach and is discouraged in keeping with SIDAC’s remuneration policy and, in any event, could not be paid without ensuring adherence to the provisions of the regulation, including application of deferral and clawback arrangements.
13.1.4 Design and Structure of Remuneration
Salary
Base salary compensates employees for fulfilling their day-to-day roles and responsibilities, including leadership and management duties. Total remuneration, including base salary and incentives, is reviewed annually and adjusted where appropriate based on each employee’s role and experience, sustained performance, internal job value and local external market practice.
Pension Plan
SIDAC operates two registered pension schemes for its employees, a defined benefit pension (“DB”) scheme which is closed to new members effective November 2005 and a defined contribution scheme (“DC”). The schemes are funded over the employees’ period of service and the assets of the schemes are held in separate trustee-administered funds. In addition, SIDAC makes employer contributions that mirror the DC scheme to Personal Retirement Savings Accounts (“PRSAs”) for temporary or fixed-term employees.
4 Under Article 92(2) of the CRD, the EBA introduced regulatory technical standards to set out the criteria to identify categories of staff whose professional activities have a material impact on the firm’s risk profile (Commission Delegated Regulation (EU) No 604/2014 (the ‘RTS’))

Scotiabank (Ireland) DAC – Pillar 3 Disclosures 2018
56
13.1.5 Annual Incentives
Rationale & Eligibility Criteria
All SIDAC employees are eligible to participate in an annual incentive plan. Annual incentives are designed to reward employees for their contribution to the achievement of BNS’ annual financial and non-financial goals.
In 2018, SIDAC had one annual incentive programme for employees, including MRTs. The Annual Incentive Plan (AIP) is designed to reward employees for their contribution to the achievement of annual goals.
Performance Measurement/Assessment
The AIP rewards employees based on BNS’ performance on financial and customer metrics for the fiscal year as well as individual performance, which has a significant impact on final awards. The AIP includes risk-adjusted measures that reflect the full range of potential risks. The aggregate AIP pool is determined based on BNS’ achievement on a scorecard of all-Bank measures: return on equity (“ROE”), earnings per share (“EPS”), operating leverage and customer goals, adjusted for performance relative to peers, as well as a discretionary risk adjustment that is approved by the Parent Board after considering performance against BNS’ Risk Appetite Framework.
Risk Adjustment
Prior to the awards being approved, the Parent’s Chief Risk Officer assesses whether there are any other potential risks that should be reflected in the incentive pool funding and recommends adjustments – where appropriate – to the BNS HRC. Additionally, SIDAC’s Managing Director and Chief Risk Officer produces a risk assessment on operations and adherence to business risk appetite. For further details please refer to section 11.1.7.
Deferral and Vesting
Non-exempt MRTs receive 50% of their AIP award in immediately-vested Restricted Share Units (“RSUs”) pursuant to the BNS Restricted Share Unit Plan for Participants in the European Economic Area (the “EEA RSU Plan”) and the remainder is paid in cash.
Exempt MRTs5 and other SIDAC employees participating in AIP receive their full award in cash. There is no regulatory restriction on how the payment of their annual incentive should be made.
Beginning in 2018, RSUs awarded to all MRTs do not attract reinvested dividend equivalents and are subject to a 12-month retention period prior to payment. Payment of the immediately-vested RSUs is based on the value of the units at the time of payment in cash.
13.1.6 Deferred Incentives
Rationale & Eligibility Criteria
A portion of the incentive awards made to MRTs are deferred to reward them for sustained performance over a three- or five-year period. Deferred incentive awards include RSUs and Deferred Cash Awards.
The EEA RSU Plan is intended for key individuals who have the ability to assist in creating future shareholder value. Employees in control function roles and supporting personnel who are not client-facing at the internal director level and above may be eligible to receive grants of deferred compensation. On an exception basis, in order to meet the deferral requirements of the EBA Guidelines, RSUs may be awarded to non-exempt MRTs below director level (employees below director level are typically not eligible for RSU awards) as a carve-out of their annual incentive.
Deferred Cash Awards are intended for non-exempt MRTs only. All non-exempt MRTs in SIDAC are eligible to receive Deferred Cash Awards, and such awards make up 50% of the total deferred incentive.
Performance Measurement/Assessment
The EEA RSU Plan is designed to reward nominated employees below the executive level and certain executives in Ireland for delivering sustained shareholder value. RSUs gain value with the appreciation in the Parent’s common share price.
5 Exempt MRTs are those for whom a waiver has been granted by the CBI, exempting them from full application of the MRT remuneration rules.

Scotiabank (Ireland) DAC – Pillar 3 Disclosures 2018
57
Deferral and Vesting
Deferral and vesting of deferred incentives for MRTs are as follows:
• Non-exempt MRTs receive 50% of their deferred award in RSUs and 50% as Deferred Cash Awards. Both RSUs and Deferred Cash Awards vest pro-rata over a three- or five-year deferral period depending on the MRT’s role6. The portion of the total incentive deferred varies between 40% and 60%, depending on the non-exempt MRT’s remuneration7.
• Exempt MRTs5 and other AIP-eligible employees, depending on seniority, may receive deferred compensation on a discretionary basis based on individual performance and potential, and awards typically range between 0% - 40% of total incentives received. Awards are made entirely in RSUs that vest 100% at the end of three years.
Risk Adjustments
Prior to the awards vesting, the Parent’s Chief Risk Officer assesses whether there are any other potential risks that should be reflected in the amount vesting, and recommends adjustments – where appropriate – to the BNS HRC and BNS Risk Committee. Additionally, SIDAC’s Managing Director and Chief Risk Officer produces a risk assessment on operations and adherence to business risk appetite. For further details please refer to section 13.1.7.
13.1.7 Risk Management and Risk Adjustment
SIDAC and BNS’ approach to risk management and compensation is to ensure alignment of compensation with the respective organizations’ risk profile and risk time horizon. BNS’ compensation programme takes into account the risks that employees take on behalf of BNS, and ensures compensation takes into consideration prospective risks and outcomes.
In designing employee compensation programmes, SIDAC and BNS strive to ensure that:
1. Risk is carefully managed, so that all business performance targets and individual/department objectives can be accomplished within established risk policies, limits, processes and standards. The key metrics on which incentive compensation plans are based are approved by the Parent Board. Employees are discouraged from taking unreasonable and excessive risks through a strong internal risk culture that is reinforced by compensation programmes. By delivering incentive compensation through a combination of annual, mid-term and long-term incentives that reflect BNS’ risk profile and by deferring a substantial portion of the incentive compensation paid to senior executives and other employees whose actions can have a material impact on risk, employees are discouraged from taking unreasonable and excessive risks. Caps are also placed on annual incentive funding in conjunction with stress-testing potential pay-outs and implementing share ownership and post-retirement share retention requirements to ensure shareholder alignment on a long-term basis.
2. The Board is responsible for ensuring compliance with key Central Bank of Ireland and EU remuneration regulatory requirements and overseeing the implementation of policies and procedures to support the requirements, including those of the EBA, CBI, CRD IV and CRR. To ensure compliance with Irish requirements, the Director, Head of Compliance, analyses whether SIDAC’s remuneration policy complies with legislation, regulations, internal policies and risk culture and reports any findings annually.
3. SIDAC has a local compensation adjustment process for all employees, the purpose of which is to maintain the alignment between risk and rewards to ensure that variable remuneration is paid / vests only if it is sustainable, taking into account the financial situation of SIDAC, and justified on the basis of the performance of SIDAC, the business area and the individual(s) concerned. Under this framework, SIDAC may take action to adjust variable remuneration either individually or collectively. This process includes SIDAC’s Managing Director and Chief Risk Officer conducting a risk assessment on operations and adherence to business risk appetite, and the Board’s assessment on the achievement of performance targets and the need for ex-post risk adjustment, including any proposed application of malus and claw back arrangements in SIDAC. Additionally, the process includes input from
6 5-year vesting for Senior Management occurs on a pro-rata basis at the end of years 1 through 5, where Senior Management is defined as a SIDAC MRT who also meets the Bank’s definition of Material Risk Impact (MRI) employee. MRI employees are those employees whose role can have a material impact on BNS’ risk profile. 3-year vesting for all other MRTs occurs on a pro-rata basis at the end of years 1 through 3. 7 60% deferral applies to High-earner MRTs which are those MRTs whose variable remuneration exceeds €300,000. 40% deferral applies to all other non-exempt MRTs.

Scotiabank (Ireland) DAC – Pillar 3 Disclosures 2018
58
SIDAC Finance on the quality and sustainability of net income and profit that feeds into the determination of bonus spend in SIDAC, and valuations conducted for SIDAC through its ICAAP to ensure SIDAC has been prudent in managing its capital.
4. Measures for incentive programmes are thoroughly reviewed by the BNS senior executive leadership team: A committee has been established of the President and CEO of the Parent and his direct reports, the BNS Human Capital Committee (“BNS HCC”), that provides senior leaders with the opportunity to review and evaluate the key aspects of material incentive programmes from an overall policy and comprehensive risk basis.
5. The Parent Board’s Risk Committee participates in reviews of the design and results of incentive programmes: The Risk Committee members and the HRC members jointly review and approve the design, metrics, targets, and payouts of material incentive programmes. In addition, SIDAC’s Chief Risk officer, produces a risk assessment analysis on operations and adherence to business risk appetite.
6. Key stewardship and control functions are focused on overall corporate interests: this focus ensures that compensation for employees responsible for areas such as risk management, legal, compliance, finance, internal audit, anti-money laundering and human resources is tied to overall BNS performance rather than the performance of any one line of business they may support. Key stewardship and control function management have day-to-day responsibility and ultimate accountability for key stewardship and control function employees including hiring decisions, performance appraisals, and compensation.
7. Adherence to business values, code of conduct, risk and compliance-related policies are key considerations when determining individual compensation awards. For material risk impact employees throughout the Parent organization and MRTs in SIDAC, the Parent’s Compensation Review Committee (whose membership includes the global heads of finance, risk management, legal, compliance, internal audit, and human resources) and the SIDAC Remuneration Oversight Committee review possible breaches in risk or conduct to ensure appropriate linkage between incentive compensation and risk.
8. Clawback provisions: The BNS Clawback Policy and SIDAC’s ‘Schedule B’ of the same policy, applies to covered individuals and employee groups, including SIDAC MRTs. Employees may forfeit outstanding awards, be required to repay previous compensation or have future grants reduced if there is: a) employee misconduct, misbehaviour, fraud or gross negligence; b) material risk management failure of the firm and/or business unit; c) material misstatement of the Parent’s or a business of the Parent’s financial results; d) material downturn in financial performance; e) significant increases in the Parent’s economic or regulatory capital base; or f) any regulatory sanctions where the conduct of the covered individual contributed to the sanctions.
9. Anti-hedging and non-assignability provisions prohibit employees from utilizing hedging strategies or derivatives to circumvent the risk alignment effects of the Parent’s compensation programmes.
10. Compensation programmes are reviewed independently of management. The Parent’s internal audit group conducts an annual review of compensation programmes and practices, reporting directly to the BNS HRC. The review includes all material compensation plans and programmes, and assessment of the appropriateness of these plans and programmes against organisational goals and risk profile as well as the Financial Stability Board (“FSB”) principles and standards, and an assessment of appropriateness of pay-outs relative to performance and risk. At the local level, SIDAC’s internal audit and compliance teams conduct reviews of the remuneration programmes applicable to SIDAC employees against remuneration-related regulatory requirements.
13.2 Quantitative Disclosure
The following pages show compensation awards and related data for 2018 MRTs, all employees (who are not MRTs), and Directors who are not executives of SIDAC. The information is reported by major business areas (front office; control and support functions) and by management level (senior management; non-senior management). Given the relatively small size of SIDAC’s business areas, front office is a consolidation of the Corporate Banking and Treasury businesses. The figures reflect the full value of the compensation awarded to MRTs in a manner appropriate to the size, nature and internal organization of SIDAC. There were no employees that received total remuneration exceeding EUR 1 million (approximately USD $1.17 million) in fiscal 2018.
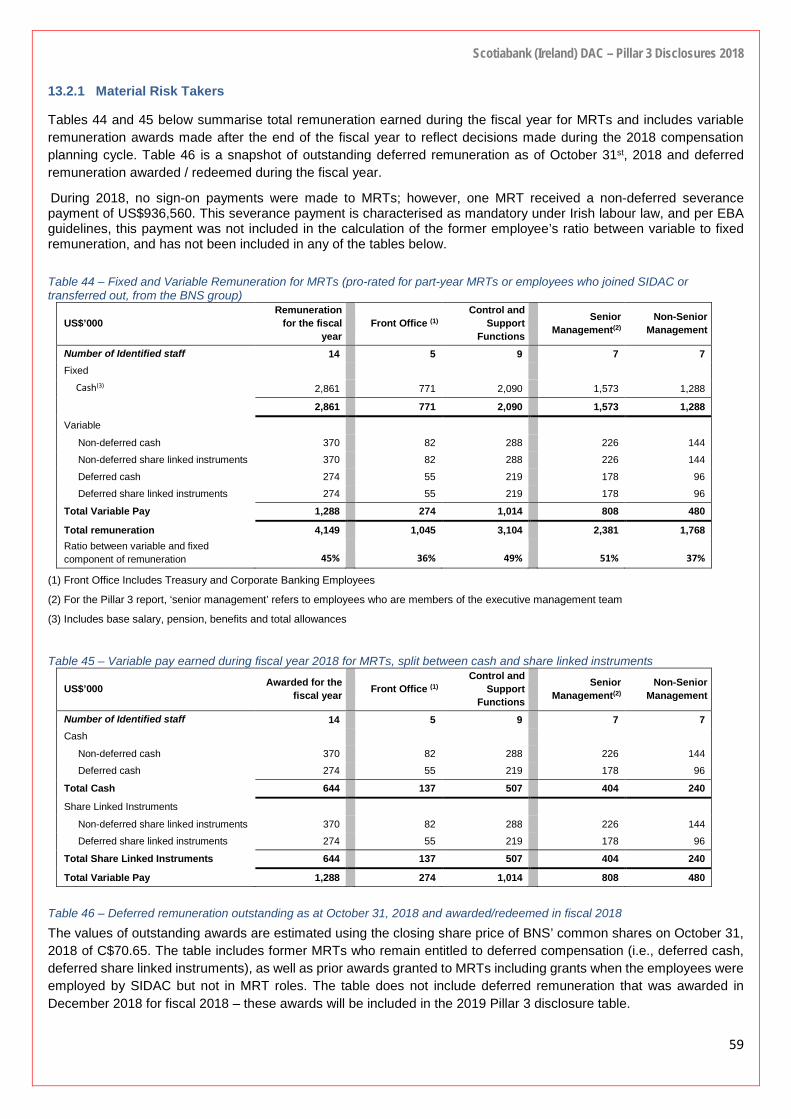
Scotiabank (Ireland) DAC – Pillar 3 Disclosures 2018
59
13.2.1 Material Risk Takers
Tables 44 and 45 below summarise total remuneration earned during the fiscal year for MRTs and includes variable remuneration awards made after the end of the fiscal year to reflect decisions made during the 2018 compensation planning cycle. Table 46 is a snapshot of outstanding deferred remuneration as of October 31st, 2018 and deferred remuneration awarded / redeemed during the fiscal year.
During 2018, no sign-on payments were made to MRTs; however, one MRT received a non-deferred severance payment of US$936,560. This severance payment is characterised as mandatory under Irish labour law, and per EBA guidelines, this payment was not included in the calculation of the former employee’s ratio between variable to fixed remuneration, and has not been included in any of the tables below. Table 44 – Fixed and Variable Remuneration for MRTs (pro-rated for part-year MRTs or employees who joined SIDAC or transferred out, from the BNS group)
US$’000 Remuneration
for the fiscal year
Front Office (1) Control and
Support Functions
Senior Management(2)
Non-Senior Management
Number of Identified staff 14 5 9 7 7 Fixed Cash(3) 2,861 771 2,090 1,573 1,288 2,861 771 2,090 1,573 1,288
Variable
Non-deferred cash 370 82 288 226 144 Non-deferred share linked instruments 370 82 288 226 144 Deferred cash 274 55 219 178 96 Deferred share linked instruments 274 55 219 178 96
Total Variable Pay 1,288 274 1,014 808 480
Total remuneration 4,149 1,045 3,104 2,381 1,768 Ratio between variable and fixed component of remuneration 45% 36% 49% 51% 37%
(1) Front Office Includes Treasury and Corporate Banking Employees
(2) For the Pillar 3 report, ‘senior management’ refers to employees who are members of the executive management team
(3) Includes base salary, pension, benefits and total allowances
Table 45 – Variable pay earned during fiscal year 2018 for MRTs, split between cash and share linked instruments
US$’000 Awarded for the fiscal year Front Office (1)
Control and Support
Functions Senior
Management(2) Non-Senior
Management
Number of Identified staff 14 5 9 7 7 Cash
Non-deferred cash 370 82 288 226 144 Deferred cash 274 55 219 178 96
Total Cash 644 137 507 404 240
Share Linked Instruments
Non-deferred share linked instruments 370 82 288 226 144 Deferred share linked instruments 274 55 219 178 96
Total Share Linked Instruments 644 137 507 404 240
Total Variable Pay 1,288 274 1,014 808 480 Table 46 – Deferred remuneration outstanding as at October 31, 2018 and awarded/redeemed in fiscal 2018 The values of outstanding awards are estimated using the closing share price of BNS’ common shares on October 31, 2018 of C$70.65. The table includes former MRTs who remain entitled to deferred compensation (i.e., deferred cash, deferred share linked instruments), as well as prior awards granted to MRTs including grants when the employees were employed by SIDAC but not in MRT roles. The table does not include deferred remuneration that was awarded in December 2018 for fiscal 2018 – these awards will be included in the 2019 Pillar 3 disclosure table.

Scotiabank (Ireland) DAC – Pillar 3 Disclosures 2018
60
Additionally, table 46 includes outstanding and redeemed deferred remuneration for the former CEO whose assignment ended in May 2018, but does not include information for the CEO as her assignment to SIDAC was effective May 2018.
US$’000 Total deferred remuneration Front Office (1)
Control and Support
Functions Senior
Management(2) Non-Senior
Management
Outstanding and Vested 18 - 18 18 - Outstanding and Unvested 882 279 603 783 99 Awarded during financial year 643 215 428 610 33 Paid Out 936 243 694 910 26 Reduced through performance adjustments - - - - -
(1) Front Office Includes Treasury and Corporate Banking Employees (2) For the Pillar 3 report, ‘senior management’ refers to employees who are members of the executive management team
13.2.2 All Employees (who are not MRTs)
The table below summarises total remuneration earned during the fiscal year for all employees of SIDAC (excluding MRTs) and includes variable remuneration awards made after the end of the fiscal year to reflect decisions made during the 2018 compensation planning cycle. This table does not include any mandatory severance payments made to employees who have departed the firm (mandatory severance payments made to departed MRTs are disclosed above).
Table 47 – All employee remuneration (excluding MRTs)
US$’000 Fixed Remuneration
Variable Remuneration
Total Remuneration
Number of Employees
Control and Support Functions 3,699 700 4,399 33 Front Office 686 216 902 15 Total 4,385 916 5,301 48
13.2.3 SIDAC Board
The table below summarises total remuneration earned during the fiscal year for Directors who are not executives of SIDAC. For fiscal 2018, these Directors received their entire remuneration as fixed compensation (i.e., they received no variable compensation). For additional clarity, the table below does not include the CEO (who is an MRT and remuneration is included in the tables above) and Chairman of the Board (who is a non-executive Director who is not independent).
Table 48 – Non-Executive Director Remuneration
US$’000 Fixed Remuneration
Variable Remuneration
Total Remuneration
Number of Non-Executive
Directors SIDAC Board 150 - 150 4

Scotiabank (Ireland) DAC – Pillar 3 Disclosures 2018
61
14 Appendix 1 – Countercyclical Capital Buffer
The Company is required to maintain an institution specific countercyclical buffer (“counter”). The table below shows the geographical distribution of the Company’s credit exposure relevant for the calculation of its CcyB:
Table 49 – Countercyclical capital buffer – geographical distribution of credit exposures US$’000 Own Funds requirements Own Funds
requirements weights
CcyB rate
Weighted CcyB
rate Country of which: General Credit exposures
of which: Securitisation
Total Own Funds requirements
United Arab Emirates 2,047 2,047 0.006
Belgium 2,654 2,654 0.008 Bermuda 6,220 6,220 0.018
Bahamas 543 543 0.001
Canada 559 559 0.001 Switzerland 3,880 3,880 0.011
Germany 10,742 10,742 0.031
Spain 2,354 2,354 0.007 Finland 3,372 3,372 0.009
France 16,745 16,745 0.048
United Kingdom 104,660 104,660 0.300 0.50% 0.001499 Ireland 12,244 12,244 0.035
Isle of man 1,370 1,370 0.004
Jersey 11,582 11,582 0.033 Cayman Islands 2,997 2,997 0.009
Luxembourg 3,656 4,586 8,242 0.024 Marshall Islands 1,094 1,094 0.003
Netherlands 20,785 20,785 0.060
Norway 11,281 11,281 0.032 2.00% 0.000646 Poland 4,440 4,440 0.013
Sweden 1,811 1,811 0.005 2.00% 0.000104
United States 68,369 45,176 113,545 0.325 Virgin Islands 5,967 5,967 0.017
Total 299,372 49,762 349,134 1.000 0.002249
The additional countercyclical capital buffer requirement as at 31 October 2018 is shown below for the Company (31 October 2017: US$ 3.3mm)
Table 50 – Countercyclical capital buffer US$’000
Total Risk Exposure amount 4,958,993
Institution specific countercyclical capital buffer 0.2249%
Institution specific countercyclical capital buffer requirement 11,152

Scotiabank (Ireland) DAC – Pillar 3 Disclosures 2018
62
15 Appendix 2 – CRR Roadmap
Table 51 – CRR Roadmap CRR Ref High Level Summary Company Reference
431 Scope of disclosure requirements
431 (1) Requirement to publish Pillar 3 disclosures. Scotiabank (Ireland) Designated Activity Company Pillar 3 Disclosures as at October 2018
431 (2) Firms with permission to use specific operational risk methodologies must disclose operational risk information. Not applicable
431 (3) Institution must have a policy covering frequency of disclosures, their verification, comprehensiveness and overall appropriateness. Section 1.3
431 (4) Explanation of ratings decision upon request. Not applicable
432 Non-material, proprietary or confidential Information
432 (1) Institutions may omit information that is not material if certain conditions are respected.
SIDAC complies with all relevant disclosure requirements with regards to non-material, proprietary or confidential information.
432 (2) Institutions may omit information that is proprietary or confidential if certain conditions are respected.
432 (3) Where 432 (1) and (2) apply this must be stated in the disclosures, and more general information must be disclosed.
432 (4) Use of 432 (1) or (2) is without prejudice to scope of liability for failure to disclose material information.
433 Frequency of disclosure
433 (1) Disclosures must be published once a year at a minimum, and more frequently if necessary. Section 1.3
433 (2) Disclosures should be published in line with the publication of the Financial Statements Section 1.3
434 Means of disclosures
434 (1) To include of disclosures in one appropriate medium, or provide clear cross-references. Section 1.3
434 (2) Disclosures made under other requirements (e.g. accounting) can be used to satisfy Pillar 3 if appropriate. Not applicable
435 Risk management objectives and policies
435 (1) (a)
Disclose information on strategies and processes; organisational structure, reporting systems and risk mitigation/hedging.
Sections 3 -10 as applicable for each of the risks
435 (1) (b)
435 (1) (c)
435 (1) (d)
435 (1) (e) Inclusion of a declaration approved by the Board on adequacy of risk management arrangements. Section 3
435 (1) (f) Inclusion of a concise risk statement approved by the Board. Section 3
435 (2) Information on governance arrangements, including information on Board composition and recruitment, and risk committees. Section 3.2
435 (2) (a) Number of directorships held by directors. Section 3.2
435 (2) (b) Recruitment policy of Board members, their experience and expertise. Section 3.2
435 (2) (c) Policy on diversity of Board membership and results against targets. Section 3.2
435 (2) (d) Disclosure of whether a dedicated risk committee is in place, and number of meetings in the year. Section 3.2
435 (2) (e) Description of information flow on risk to Board. Section 3.3
436 Scope of application
436 (a) Name of institution. Section 1.1
436 (b) Difference in basis of consolidation for accounting and prudential purposes, naming entities that are: Section 1.3
436 (b) (i) Fully consolidated; Not applicable
436 (b) (ii) Proportionally consolidated; Not applicable
436 (b) (iii) Deducted from own funds; Not applicable

Scotiabank (Ireland) DAC – Pillar 3 Disclosures 2018
63
CRR Ref High Level Summary Company Reference
436 (b) (iv) Neither consolidated nor deducted. Not applicable
436 (c) Impediments to transfer of funds between parent and subsidiaries. Not applicable
436 (d) Capital shortfalls in any subsidiaries outside of scope of consolidation. Not applicable
436 (e) Making use of articles on derogations from a) prudential requirements or b) liquidity requirements for individual subsidiaries/entities.
Not applicable
437 Own funds
437 (1)
Requirements regarding capital resources table.
Section 2.3 Appendix 1 Appendix 4 Appendix 5
437 (1) (a)
437 (1) (b)
437 (1) (c)
437 (1) (d) (i) 437 (1) (d) (ii) 437 (1) (d) (iii)
437 (1) (e)
437 (1) (f)
437 (2) EBA to publish implementation standards for points above. Not applicable
438 Capital requirements
438 (a) Summary of institution’s approach to assessing adequacy of capital levels. Section 2
438 (b) Result of ICAAP on demand from authorities. Not applicable
438 (c) Capital requirement amounts for credit risk for each Standardised Approach exposure class. Section 4.2
438 (d) (i)
Capital requirements amounts for credit risk for each Internal Ratings Based Approach exposure class. Not applicable
438 (d) (ii)
438 (d) (iii)
438 (d) (iv)
438 (e) Capital requirements amount for market risk or settlement risk, or large exposures where they exceed limits. Section 5.1
438 (f) Capital requirement amounts for operational risk, separately for the basic indicator approach, the standardised approach, and the advanced measurement approaches as applicable.
Section 2.3
438 endnote
Requirement to disclose specialised lending exposures and equity exposures in the banking book falling under the simple risk weight approach. Not applicable
439 Exposure to counterparty credit risk (CCR)
439 (a) Description of process to assign internal capital and credit limits to CCR exposures. Section 4.5
439 (b) Discussion of process to secure collateral and establishing reserves. Section 4.5
439 (c) Discussion of management of wrong-way exposures. Section 4.7
439 (d) Disclosure of collateral to be provided (outflows) in the event of a ratings downgrade. Section 4.5
439 (e) Derivation of net derivative credit exposure. Section 4.5
439 (f) Exposure values for mark-to-market, original exposure, standardised and internal model methods. Section 4.5
439 (g) Notional value of credit derivative hedges and current credit exposure by type of exposure. Not applicable
439 (h) Notional amounts of credit derivative transactions for own credit, intermediation, bought and sold, by product type. Not applicable
439 (i) Estimate of alpha, if applicable. Not applicable
440 Capital buffers
440 (1) (a) Geographical distribution of relevant credit exposures. Section 4.2 and Appendix 3

Scotiabank (Ireland) DAC – Pillar 3 Disclosures 2018
64
CRR Ref High Level Summary Company Reference
440 (1) (b) Amount of the institution specific countercyclical capital buffer. Appendix 1
440 (2) EBA will issue technical implementation standards related to 440 (1). Not applicable
441 Indicators of global systemic importance
441 (1) Disclosure of the indicators of global systemic Importance. Not applicable
441 (2) EBA will issue technical implementation standards related to 441 (1). Not applicable
442 Credit risk adjustments
442 (a) Disclosure of bank‘s definitions of past due and impaired. Section 4.2
442 (b) Approaches for calculating credit risk adjustments. Section 4.2
442 (c) Disclosure of pre-CRM EAD by exposure class. Section 4.2
442 (d) Disclosures of pre-CRM EAD by geography and exposure class. Section 4.2
442 (e) Disclosures of pre-CRM EAD by industry and exposure class. Section 4.2
442 (f) Disclosures of pre-CRM EAD by residual maturity and exposure class. Section 4.2
442 (g)
Breakdown of impaired, past due, specific and general credit adjustments, and impairment charges for the period, by exposure class or counterparty type. Section 4.2
442 (g) (i)
442 (g) (ii)
442 (g) (iii)
442 (h) Impaired, past due exposures, by geographical area, and amounts of specific and general impairment for each geography.
Section 4.2
442 (i)
Reconciliation of changes in specific and general credit risk adjustments. Section 4.2
442 (i) (i)
442 (i) (ii)
442 (i) (iii)
442 (i) (iv)
442 (i) (v)
442 endnote
Specific credit risk adjustments recorded to income statement are disclosed separately. Section 4.2
443 Unencumbered assets
443 EBA shall issue guidelines specifying the disclosure of unencumbered assets Section 10
444 Use of ECAIs
444 (a) Names of the ECAIs used in the calculation of Standardised Approach RWAs, and reasons for any changes.
Section 4.3
444 (b) Exposure classes associated with each ECAI. Section 4.3
444 (c) Explanation of the process for translating external ratings into credit quality steps. Section 4.3
444 (d) Mapping of external rating to credit quality steps. Section 4.3
444 (e) Exposure value pre- and post-credit risk mitigation, by credit quality step. Section 4.3
445 Exposure to market risk
445 Disclosure of position risk, large exposures exceeding limits, FX, settlement and commodities risk. Section 5.1
446 Operational risk
446 Disclosure of the scope of approaches used to calculate operational risk, discussion of advanced methodology and external factors considered. Section 6.2
447 Exposure in equities not included in the trading book
447 (a) Differentiation of exposures based on objectives. Not applicable
447 (b) Recorded and fair value and actual prices of exchange traded equity where it differs from fair value. Not applicable
447 (c) Types, nature and amounts of the relevant classes of equity exposures. Not applicable
447 (d) Realised cumulative gains and losses on sales over the period. Not applicable
447 (e) Total unrealised gains/losses, latent revaluation gains/losses, and amounts Not applicable

Scotiabank (Ireland) DAC – Pillar 3 Disclosures 2018
65
CRR Ref High Level Summary Company Reference included within Tier 1 capital.
448 Exposure to interest rate risk on positions not included in the trading book
448 (a) Nature of risk and key assumptions in measurement models. Section 5.1
448 (b) Variation in earnings or economic value, or other measures used by the bank from upward and downward shocks to interest rates, by currency. Section 5.1
449 Exposure to securitisation positions
449 (a) Objectives in relation to securitisation activity. Section 9
449 (b) Nature of other risks in securitised assets, including liquidity. Section 9
449 (c) Risks in re-securitisation activity stemming from seniority of underlying securitisations and ultimate underlying assets. Section 9
449 (d) The roles played by institutions in the securitisation process. Section 9
449 (e) Indication of the extent of involvement in these roles. Section 9
449 (f) Processes in place to monitor changes in credit and market risks of securitisation exposures, and how the processes differ for re-securitisation exposures. Section 9
449 (g) Description of the institution’s policies with respect to hedging and unfunded protection, and identification of material hedge counterparties. Not applicable
449 (h) Approaches to calculation of RWA for securitisations mapped to types of exposures. Section 9
449 (i) Types of SSPEs used to securitise third-party exposures, and list of SSPEs. Not applicable
449 (j) Summary of accounting policies for securitisations: Section 9
449 (j) (i) Treatment of sales or financings; Section 9
449 (j) (ii) Recognition of gains on sales; Section 9
449 (j) (iii) Approach to valuing securitisation positions; Not applicable
449 (j) (iv) Treatment of synthetic securitisations; Not applicable
449 (j) (v) Valuation of assets awaiting securitisations; Not applicable
449 (j) (vi) Recognition of arrangements that could require the bank to provide support to securitised assets. Not applicable
449 (k) Names of ECAIs used for securitisations. Section 9
449 (l) Full description of Internal Assessment Approach. Not applicable
449 (m) Explanation of changes in quantitative disclosures. Section 9
449 (n) Banking and trading book securitisation exposures:
449 (n) (i) Amount of outstanding exposures securitised; Not applicable
449 (n) (ii) On balance sheet securitisation retained or purchased, and off-balance sheet exposures; Section 9
449 (n) (iii) Amount of assets awaiting securitisation; Not applicable
449 (n) (iv) Early amortisation treatment; aggregate drawn exposures, capital requirements; Not applicable
449 (n) (v) Deducted or 1250%-weighted securitisation positions; Not applicable
449 (n) (vi) Amount of exposures securitised and recognised gains or losses on sales. Not applicable
449 (o) Banking and trading book securitisations by risk band:
449 (o) (i) Retained and purchased exposure and associated capital requirements, broken down by risk-weight bands; Section 9
449 (o) (ii) Retained and purchased re-securitisation exposures before and after hedging and insurance; exposure to financial guarantors broken down by guarantor credit worthiness.
Not applicable
449 (p) Impaired assets and recognised losses related to banking book securitisations, by exposure type. Not applicable
449 (q) Exposure and capital requirements for trading book securitisations, separately into traditional. Not applicable
449 (r) Whether the institution has provided financial support to securitisation vehicles. Not applicable
450 Remuneration Policy
450 Disclosures on Remuneration Section 11

Scotiabank (Ireland) DAC – Pillar 3 Disclosures 2018
66
CRR Ref High Level Summary Company Reference
451 Leverage
451 (1) (a) Leverage ratio, and breakdown of total exposure measure, including reconciliation to Financial Statements, and derecognised fiduciary items. Section 2.4 451 (1) (b)
451 (1) (c)
451 (1) (d) Description of the risk management approach to mitigate excessive leverage, and factors that impacted the leverage ratio during the year. Section 2.4
451 (1) (e)
451 (2) EBA to publish implementation standards for points above. Not applicable
452 Use of the IRB Approach to credit risk
452 (a) Permission for use of the IRB approach from authority.
Not applicable
452 (b) Explanation of:
452 (b) (i) Internal rating scales mapped to external ratings;
452 (b) (ii) Use of internal ratings for purposes other than capital requirement calculations;
452 (b) (iii) Management and recognition of credit risk mitigation;
452 (b) (iv) Controls around ratings systems.
452 (c)
Description of ratings processes for each IRB asset class, provided separately.
452 (c) (i)
452 (c) (ii)
452 (c) (iii)
452 (c) (iv)
452 (c) (v)
452 (d) Exposure values by IRB exposure class, separately for Advanced and Foundation IRB.
452 (e) For wholesale exposure classes, disclosed separately by obligor grade:
452 (e) (i) Total exposure, separating loans and undrawn exposures where applicable;
452 (e) (ii) Exposure-weighted average risk weight;
452 (e) (iii) Undrawn commitments and average exposure values by asset class.
452 (f) For retail exposure classes, same disclosures as under 452 (e), by risk grade or EL grade.
452 (g) Actual specific risk adjustments for the period and explanation of changes.
452 (h) Commentary on drivers of losses in preceding period.
452 (i) Disclosure of predicted against actual losses for sufficient period, and historical analysis to help assess the performance of the rating system over a sufficient period.
452 (j) For all IRB exposure classes:
452 (j) (i) Where applicable, PD and LGD by each country where the bank operates.
452 (j) (ii)
453 Use of credit risk mitigation techniques
453 (a) Use of on- and off-balance sheet netting. Not applicable
453 (b) How collateral valuation is managed. Section 4.4
453 (c) Description of types of collateral used Section 4.4
453 (d) Types of guarantor and credit derivative counterparty, and their creditworthiness. Section 4.4
453 (e) Disclosure of market or credit risk concentrations within risk mitigation exposures.
Section 4.4 Section 5.2
453 (f) For exposures under either the Standardised or Foundation IRB approach, disclose the exposure value covered by eligible collateral. Section 4.4
453 (g) Exposures covered by guarantees or credit derivatives. Section 4.4
454 Use of the Advanced Measurement Approaches to operational risk
454 Description of the use of insurance or other risk transfer mechanisms to mitigate operational risk. Not applicable

Scotiabank (Ireland) DAC – Pillar 3 Disclosures 2018
67
CRR Ref High Level Summary Company Reference
455 Use of Internal Market Risk Models
455 (a) (i) Disclosure of the characteristics of the market risk models.
Not applicable
455 (a) (ii) Disclosure of the methodology and description of comprehensive risk measure and incremental risk charge.
455 (a) (iii) Descriptions of stress tests applied to the portfolios.
455 (a) (iv) Methodology for back-testing and validating the models.
455 (b) Scope of permission for use of the models.
455 (c) Policies and processes to determine which exposures are to be included in the trading book, and to comply with prudential valuation requirements.
455 (d)
High/Low/Mean values over the year of VaR, sVaR, comprehensive risk measure and incremental risk charge.
455 (d) (i)
455 (d) (ii)
455 (d) (iii)
455 (e) The elements of the own fund calculation.
455 (f) Weighted average liquidity horizons of portfolios covered by models.
455 (g) Comparison of end-of-day VaR measures compared with one-day changes in portfolio’s value.

Scotiabank (Ireland) DAC – Pillar 3 Disclosures 2018
68
16 Appendix 3 – Geographical Distributions
For all tables that require a breakdown by geographical distribution, a threshold of 5% of the net value of exposures by geographical area has been used as the materiality threshold for disclosure of individual jurisdictions.
As such the immaterial jurisdictions are as follows:
1. Other European countries: Belgium, Switzerland, Denmark, Spain, Finland, Guernsey, Isle of Man, Jersey, Luxembourg, Norway, Poland, Sweden.
2. Other Asia-Pacific countries: Hong Kong, New Zealand, Singapore.
3. Other geographical areas: United Arab Emirates, Bermuda, Bahamas, Cayman Islands, Marshal Islands, Virgin Islands.
Also included in ‘other geographical areas’ are the following supranational organisations, as per EBA guidance:
Council of Europe Development Bank, European Investment Bank, International Bank for Reconstruction and Development, Nordic Investment Bank.
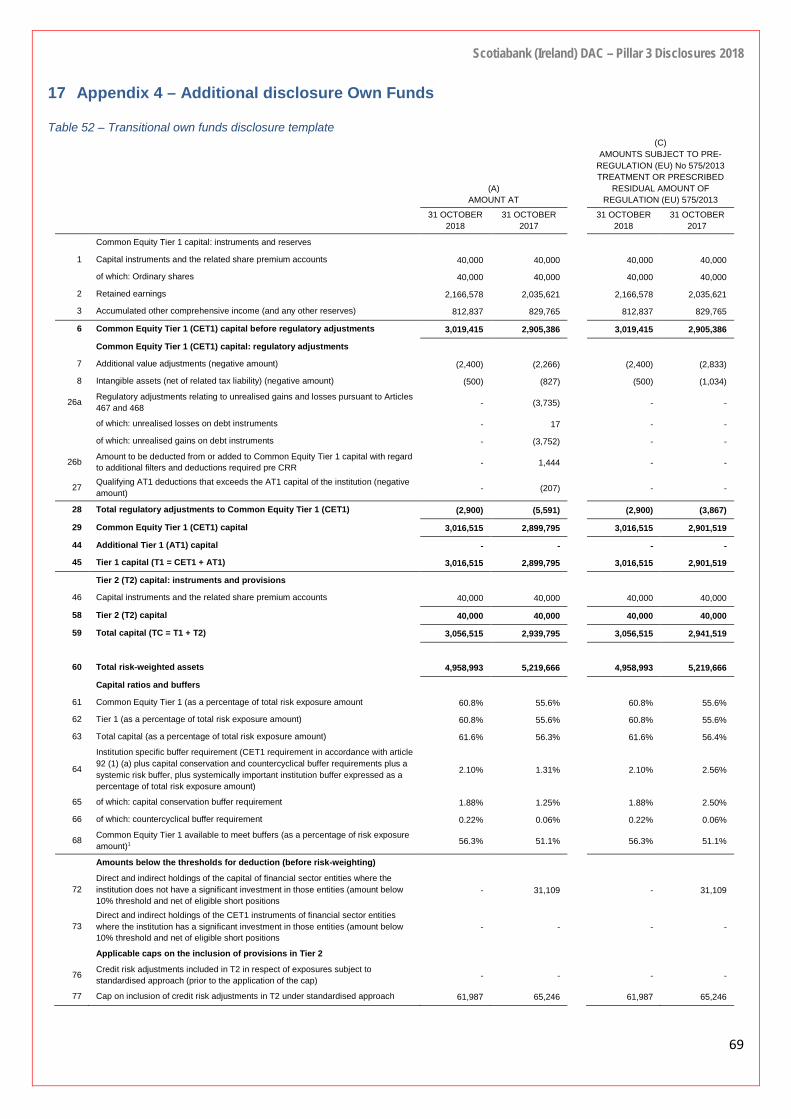
Scotiabank (Ireland) DAC – Pillar 3 Disclosures 2018
69
17 Appendix 4 – Additional disclosure Own Funds
Table 52 – Transitional own funds disclosure template
(A) AMOUNT AT
(C) AMOUNTS SUBJECT TO PRE-
REGULATION (EU) No 575/2013 TREATMENT OR PRESCRIBED
RESIDUAL AMOUNT OF REGULATION (EU) 575/2013
31 OCTOBER 2018
31 OCTOBER 2017
31 OCTOBER 2018
31 OCTOBER 2017
Common Equity Tier 1 capital: instruments and reserves
1 Capital instruments and the related share premium accounts 40,000 40,000 40,000 40,000 of which: Ordinary shares 40,000 40,000 40,000 40,000
2 Retained earnings 2,166,578 2,035,621 2,166,578 2,035,621
3 Accumulated other comprehensive income (and any other reserves) 812,837 829,765 812,837 829,765
6 Common Equity Tier 1 (CET1) capital before regulatory adjustments 3,019,415 2,905,386 3,019,415 2,905,386 Common Equity Tier 1 (CET1) capital: regulatory adjustments
7 Additional value adjustments (negative amount) (2,400) (2,266) (2,400) (2,833)
8 Intangible assets (net of related tax liability) (negative amount) (500) (827) (500) (1,034)
26a Regulatory adjustments relating to unrealised gains and losses pursuant to Articles 467 and 468 - (3,735) - -
of which: unrealised losses on debt instruments - 17 - -
of which: unrealised gains on debt instruments - (3,752) - -
26b Amount to be deducted from or added to Common Equity Tier 1 capital with regard to additional filters and deductions required pre CRR - 1,444 - -
27 Qualifying AT1 deductions that exceeds the AT1 capital of the institution (negative amount) - (207) - -
28 Total regulatory adjustments to Common Equity Tier 1 (CET1) (2,900) (5,591) (2,900) (3,867)
29 Common Equity Tier 1 (CET1) capital 3,016,515 2,899,795 3,016,515 2,901,519
44 Additional Tier 1 (AT1) capital - - - -
45 Tier 1 capital (T1 = CET1 + AT1) 3,016,515 2,899,795 3,016,515 2,901,519 Tier 2 (T2) capital: instruments and provisions
46 Capital instruments and the related share premium accounts 40,000 40,000 40,000 40,000
58 Tier 2 (T2) capital 40,000 40,000 40,000 40,000
59 Total capital (TC = T1 + T2) 3,056,515 2,939,795 3,056,515 2,941,519
60 Total risk-weighted assets 4,958,993 5,219,666 4,958,993 5,219,666 Capital ratios and buffers
61 Common Equity Tier 1 (as a percentage of total risk exposure amount 60.8% 55.6% 60.8% 55.6%
62 Tier 1 (as a percentage of total risk exposure amount) 60.8% 55.6% 60.8% 55.6%
63 Total capital (as a percentage of total risk exposure amount) 61.6% 56.3% 61.6% 56.4%
64
Institution specific buffer requirement (CET1 requirement in accordance with article 92 (1) (a) plus capital conservation and countercyclical buffer requirements plus a systemic risk buffer, plus systemically important institution buffer expressed as a percentage of total risk exposure amount)
2.10% 1.31% 2.10% 2.56%
65 of which: capital conservation buffer requirement 1.88% 1.25% 1.88% 2.50%
66 of which: countercyclical buffer requirement 0.22% 0.06% 0.22% 0.06%
68 Common Equity Tier 1 available to meet buffers (as a percentage of risk exposure amount)1 56.3% 51.1% 56.3% 51.1%
Amounts below the thresholds for deduction (before risk-weighting)
72 Direct and indirect holdings of the capital of financial sector entities where the institution does not have a significant investment in those entities (amount below 10% threshold and net of eligible short positions
- 31,109 - 31,109
73 Direct and indirect holdings of the CET1 instruments of financial sector entities where the institution has a significant investment in those entities (amount below 10% threshold and net of eligible short positions
- - - -
Applicable caps on the inclusion of provisions in Tier 2
76 Credit risk adjustments included in T2 in respect of exposures subject to standardised approach (prior to the application of the cap) - - - -
77 Cap on inclusion of credit risk adjustments in T2 under standardised approach 61,987 65,246 61,987 65,246
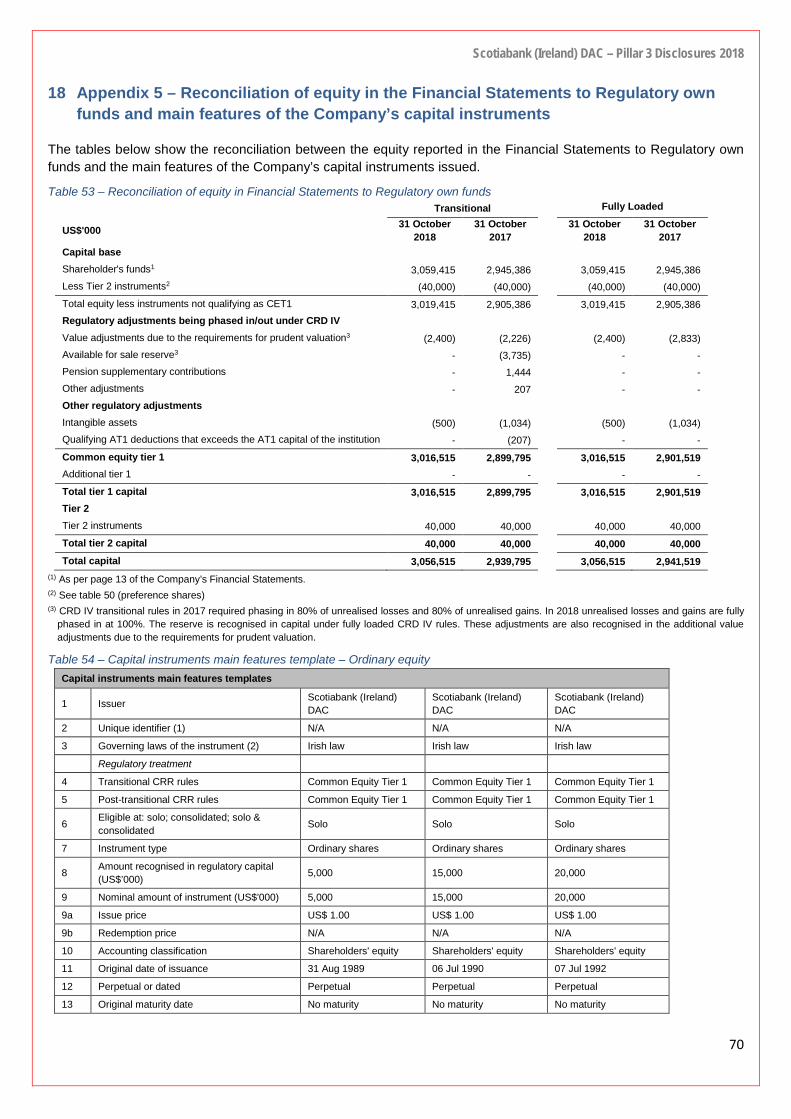
Scotiabank (Ireland) DAC – Pillar 3 Disclosures 2018
70
18 Appendix 5 – Reconciliation of equity in the Financial Statements to Regulatory own funds and main features of the Company’s capital instruments
The tables below show the reconciliation between the equity reported in the Financial Statements to Regulatory own funds and the main features of the Company’s capital instruments issued.
Table 53 – Reconciliation of equity in Financial Statements to Regulatory own funds Transitional Fully Loaded
US$'000 31 October 2018
31 October 2017
31 October 2018
31 October 2017
Capital base
Shareholder's funds1 3,059,415 2,945,386 3,059,415 2,945,386 Less Tier 2 instruments2 (40,000) (40,000) (40,000) (40,000) Total equity less instruments not qualifying as CET1 3,019,415 2,905,386 3,019,415 2,905,386 Regulatory adjustments being phased in/out under CRD IV Value adjustments due to the requirements for prudent valuation3 (2,400) (2,226) (2,400) (2,833) Available for sale reserve3 - (3,735) - - Pension supplementary contributions - 1,444 - - Other adjustments - 207 - - Other regulatory adjustments Intangible assets (500) (1,034) (500) (1,034) Qualifying AT1 deductions that exceeds the AT1 capital of the institution - (207) - - Common equity tier 1 3,016,515 2,899,795 3,016,515 2,901,519 Additional tier 1 - - - - Total tier 1 capital 3,016,515 2,899,795 3,016,515 2,901,519 Tier 2 Tier 2 instruments 40,000 40,000 40,000 40,000 Total tier 2 capital 40,000 40,000 40,000 40,000 Total capital 3,056,515 2,939,795 3,056,515 2,941,519
(1) As per page 13 of the Company’s Financial Statements. (2) See table 50 (preference shares) (3) CRD IV transitional rules in 2017 required phasing in 80% of unrealised losses and 80% of unrealised gains. In 2018 unrealised losses and gains are fully
phased in at 100%. The reserve is recognised in capital under fully loaded CRD IV rules. These adjustments are also recognised in the additional value adjustments due to the requirements for prudent valuation.
Table 54 – Capital instruments main features template – Ordinary equity Capital instruments main features templates
1 Issuer Scotiabank (Ireland) DAC
Scotiabank (Ireland) DAC
Scotiabank (Ireland) DAC
2 Unique identifier (1) N/A N/A N/A
3 Governing laws of the instrument (2) Irish law Irish law Irish law
Regulatory treatment
4 Transitional CRR rules Common Equity Tier 1 Common Equity Tier 1 Common Equity Tier 1
5 Post-transitional CRR rules Common Equity Tier 1 Common Equity Tier 1 Common Equity Tier 1
6 Eligible at: solo; consolidated; solo & consolidated Solo Solo Solo
7 Instrument type Ordinary shares Ordinary shares Ordinary shares
8 Amount recognised in regulatory capital (US$’000) 5,000 15,000 20,000
9 Nominal amount of instrument (US$’000) 5,000 15,000 20,000
9a Issue price US$ 1.00 US$ 1.00 US$ 1.00
9b Redemption price N/A N/A N/A
10 Accounting classification Shareholders' equity Shareholders' equity Shareholders' equity
11 Original date of issuance 31 Aug 1989 06 Jul 1990 07 Jul 1992
12 Perpetual or dated Perpetual Perpetual Perpetual
13 Original maturity date No maturity No maturity No maturity

Scotiabank (Ireland) DAC – Pillar 3 Disclosures 2018
71
Capital instruments main features templates
14 Issuer call subject to prior Supervisory approval N/A N/A N/A
15 Optional call date N/A N/A N/A
Contingent call dates and redemption amount N/A N/A N/A
16 Subsequent call dates, if applicable N/A N/A N/A
Coupon/dividends
17 Fixed or floating dividend/coupon N/A N/A N/A
18 Coupon rate and any related index N/A N/A N/A
19 Existence of a dividend stopper No No No
20a Fully discretionary, partially discretionary or mandatory - in terms of timing
Mandatory Mandatory Mandatory
20b Fully discretionary, partially discretionary or mandatory - in terms of amount
Mandatory Mandatory Mandatory
21 Existence of step up or other incentive to redeem N/A N/A N/A
22 Noncumulative or cumulative N/A N/A N/A
23 Convertible or non-convertible N/A N/A N/A
24 If convertible, conversion trigger(s) N/A N/A N/A
25 If convertible, fully or partially N/A N/A N/A
26 If convertible, conversion rate N/A N/A N/A
27 If convertible, mandatory or optional conversion N/A N/A N/A
28 If convertible, specify instrument type convertible into N/A N/A N/A
29 If convertible, specify issuer of instrument it converts into N/A N/A N/A
30 Write-down features N/A N/A N/A
31 If write-down, write down triggers N/A N/A N/A
32 If write-down, full or partial N/A N/A N/A
33 If write-down, permanent or temporary N/A N/A N/A
34 If temporary write-down, description of write-up mechanism (4) N/A N/A N/A
35 Position in subordination hierarchy in liquidation N/A N/A N/A
36 Non-compliant transitioned features No No No
37 If yes, specify non-compliant features N/A N/A N/A
Table 55 – Capital instruments main features – Preference shares Capital instruments main features templates
1 Issuer Scotiabank (Ireland) DAC
Scotiabank (Ireland) DAC
2 Unique identifier (1) N/A N/A
3 Governing laws of the instrument (2) Irish law Irish law
Regulatory treatment
4 Transitional CRR rules Tier 2 Tier 2
5 Post-transitional CRR rules Tier 2 Tier 2
6 Eligible at: solo; consolidated; solo & consolidated Solo Solo
7 Instrument type Preference Shares Preference Shares
8 Amount recognised in regulatory capital (US$’000) 20,000 20,000
9 Nominal amount of instrument (US$’000) 20,000 20,000
9a Issue price US$ 1.00 US$ 1.00
9b Redemption price US$ 1.00 US$ 1.00
10 Accounting classification Shareholders' equity Shareholders' equity

Scotiabank (Ireland) DAC – Pillar 3 Disclosures 2018
72
Capital instruments main features templates
11 Original date of issuance 06 Jul 1990 07 Jul 1992
12 Perpetual or dated Perpetual Perpetual
13 Original maturity date No maturity No maturity
14 Issuer call subject to prior Supervisory approval Yes Yes
15 Optional call date 07 Jul 2019 07 Jul 2019
16 Subsequent call dates, if applicable All subsequent days All subsequent days
Coupon/dividends
17 Fixed or floating dividend/coupon Floating Floating
18 Coupon rate and any related index 6-month LIBOR 6-month LIBOR
19 Existence of a dividend stopper No No
20a Fully discretionary, partially discretionary or mandatory - in terms of timing Mandatory Mandatory
20b Fully discretionary, partially discretionary or mandatory - in terms of amount Mandatory Mandatory
21 Existence of step up or other incentive to redeem N/A N/A
22 Noncumulative or cumulative Noncumulative Noncumulative
23 Convertible or non-convertible N/A N/A
24 If convertible, conversion trigger(s) N/A N/A
25 If convertible, fully or partially N/A N/A
26 If convertible, conversion rate N/A N/A
27 If convertible, mandatory or optional conversion N/A N/A
28 If convertible, specify instrument type convertible into N/A N/A
29 If convertible, specify issuer of instrument it converts into N/A N/A
30 Write-down features N/A N/A
31 If write-down, write down triggers N/A N/A
32 If write-down, full or partial N/A N/A
33 If write-down, permanent or temporary N/A N/A
34 If temporary write-down, description of write-up mechanism (4) N/A N/A
35 Position in subordination hierarchy in liquidation N/A N/A
36 Non-compliant transitioned features No No
37 If yes, specify non-compliant features N/A N/A