Scoring Matrices June 19, 2008 Learning objectives- Understand how scoring matrices are constructed....
24
Scoring Matrices June 19, 2008 Learning objectives- Understand how scoring matrices are constructed. Workshop-Use different BLOSUM matrices in the Dotter Program to determine their effects on output when comparing squid p53 and human p53. Create your own scoring matrix and use it to compare two protein sequences. Explain to the instructor the rationale behind your scoring matrix.
-
date post
20-Dec-2015 -
Category
Documents
-
view
219 -
download
0
Transcript of Scoring Matrices June 19, 2008 Learning objectives- Understand how scoring matrices are constructed....
Scoring MatricesJune 19, 2008
Learning objectives- Understand how scoring matrices are constructed.Workshop-Use different BLOSUM matrices in the Dotter Program to determine their effects on output when comparing squid p53 and human p53.Create your own scoring matrix and use it to compare two protein sequences. Explain to the instructor the rationale behind your scoring matrix.
Scoring Matrices
Scoring matrices appear in all analyses involving sequence comparisons. Scoring matrices implicitly represent a particular theory of relationships. Understanding theories underlying a given scoring matrix can aid in making proper choice of scoring matrix.
Scoring MatricesWhen we consider scoring matrices, we encounter the convention that matrices have numeric indices corresponding to the rows and columns of the matrix.
For example, M12 refers to the entry at the first row and the second column. In general, Mij refers to the entry at the ith row and the jth column.
Two major scoring matrices for amino acid sequence comparisons
PAM-derived from sequences known to be closely related (Eg. Chimpanzee and human). Generally ranges from PAM 1 to PAM 500
BLOSUM-derived from sequences not closely related (Eg. E. coli and human). Ranges from BLOSUM 10-BLOSUM 100
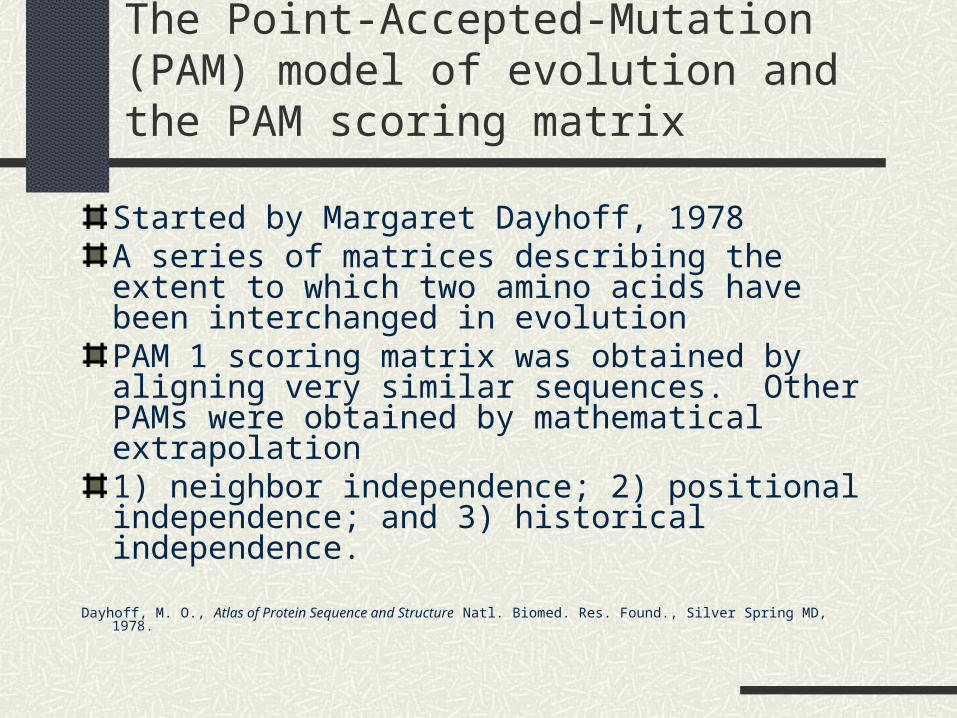
The Point-Accepted-Mutation (PAM) model of evolution and the PAM scoring matrix
Started by Margaret Dayhoff, 1978A series of matrices describing the extent to which two amino acids have been interchanged in evolutionPAM 1 scoring matrix was obtained by aligning very similar sequences. Other PAMs were obtained by mathematical extrapolation1) neighbor independence; 2) positional independence; and 3) historical independence.
Dayhoff, M. O., Atlas of Protein Sequence and Structure Natl. Biomed. Res. Found., Silver Spring MD, 1978.
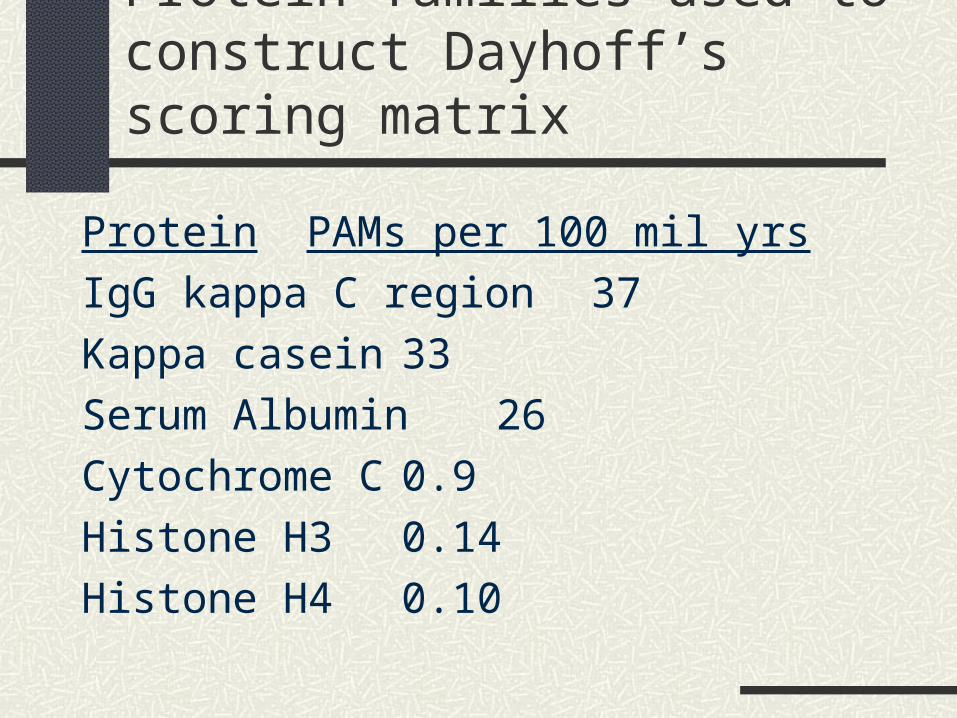
Protein families used to construct Dayhoff’s scoring matrix
Protein PAMs per 100 mil yrs
IgG kappa C region 37
Kappa casein 33
Serum Albumin 26
Cytochrome C 0.9
Histone H3 0.14
Histone H4 0.10
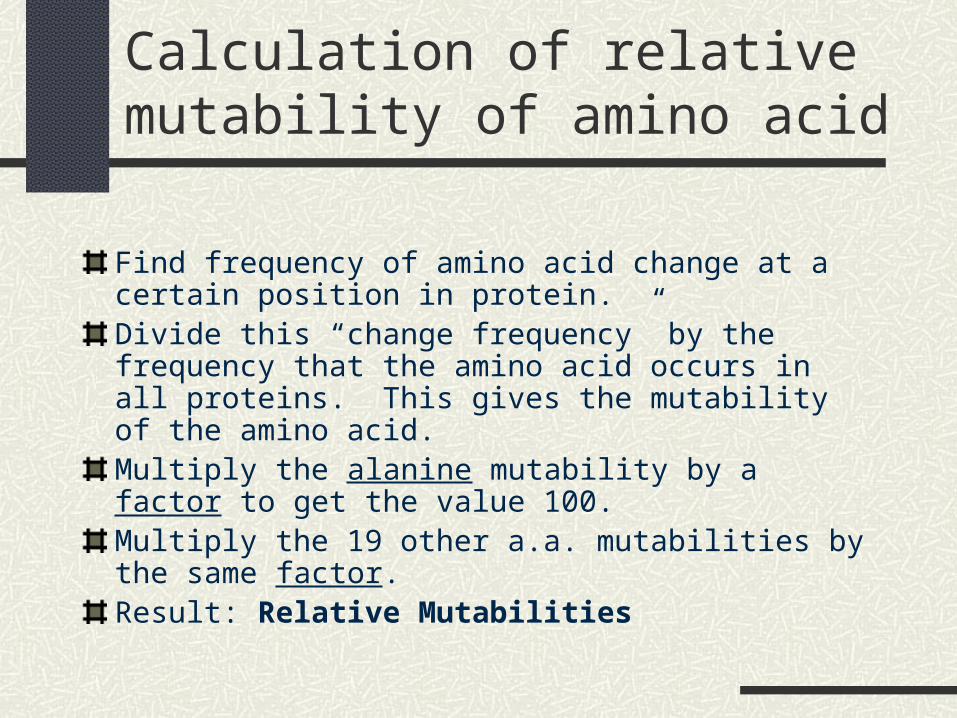
Calculation of relative mutability of amino acid
Find frequency of amino acid change at a certain position in protein.Divide this “change frequency” by the frequency that the amino acid occurs in all proteins. This gives the mutability of the amino acid.Multiply the alanine mutability by a factor to get the value 100.Multiply the 19 other a.a. mutabilities by the same factor.Result: Relative Mutabilities
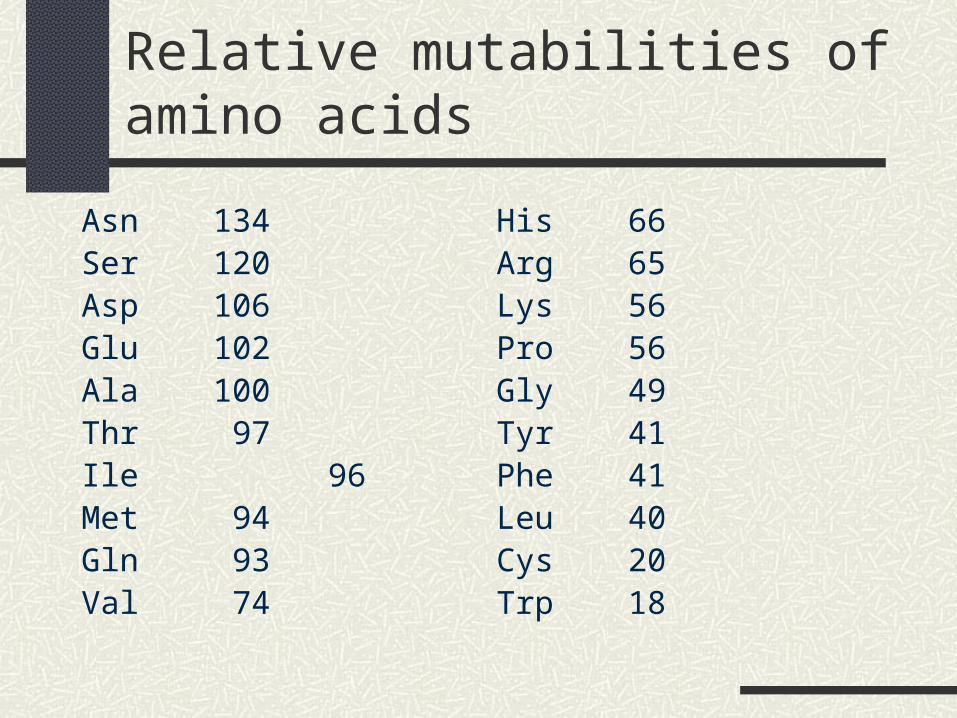
Relative mutabilities of amino acids
Asn 134Ser 120Asp 106Glu 102Ala 100Thr 97Ile 96Met 94Gln 93Val 74
His 66Arg 65Lys 56Pro 56Gly 49Tyr 41Phe 41Leu 40Cys 20Trp 18

Why are the mutabilities different?
High mutabilities because a similar amino acid can replace it. (Asp for Glu)
Conversely, the low mutabilities are unique, can’t be replaced.
Tally all pairwise replacements
Next, tally a.a. replacements "accepted" by natural selection, in all pair-wise sequence comparisons.
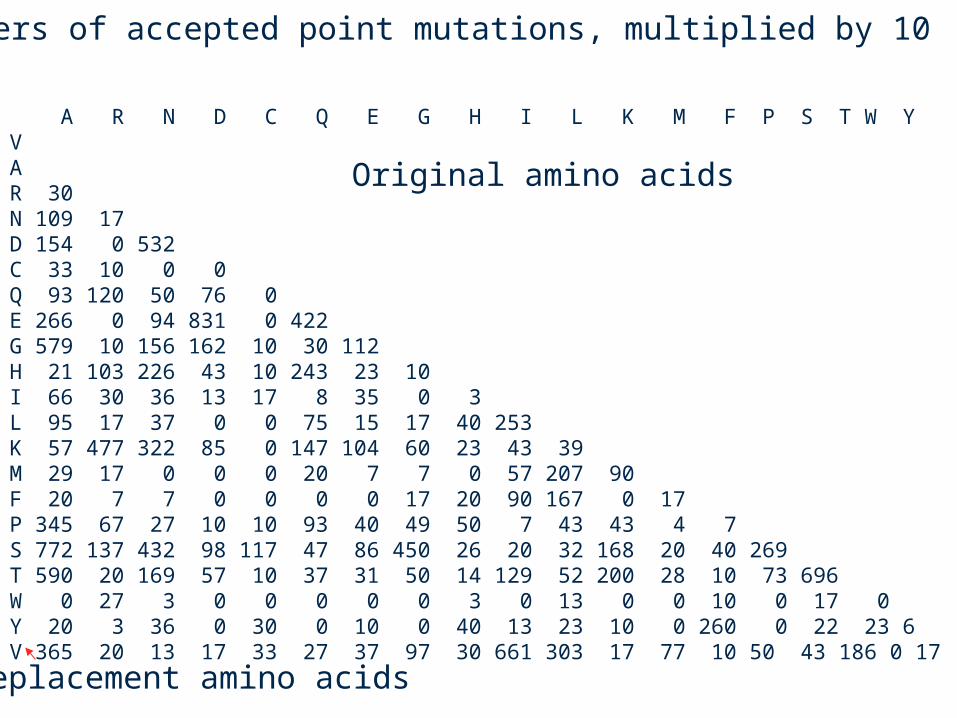
A R N D C Q E G H I L K M F P S T W Y V AR 30N 109 17D 154 0 532C 33 10 0 0Q 93 120 50 76 0E 266 0 94 831 0 422G 579 10 156 162 10 30 112H 21 103 226 43 10 243 23 10I 66 30 36 13 17 8 35 0 3L 95 17 37 0 0 75 15 17 40 253K 57 477 322 85 0 147 104 60 23 43 39M 29 17 0 0 0 20 7 7 0 57 207 90F 20 7 7 0 0 0 0 17 20 90 167 0 17P 345 67 27 10 10 93 40 49 50 7 43 43 4 7S 772 137 432 98 117 47 86 450 26 20 32 168 20 40 269T 590 20 169 57 10 37 31 50 14 129 52 200 28 10 73 696W 0 27 3 0 0 0 0 0 3 0 13 0 0 10 0 17 0Y 20 3 36 0 30 0 10 0 40 13 23 10 0 260 0 22 23 6V 365 20 13 17 33 27 37 97 30 661 303 17 77 10 50 43 186 0 17
Numbers of accepted point mutations, multiplied by 10
Original amino acids
Replacement amino acids
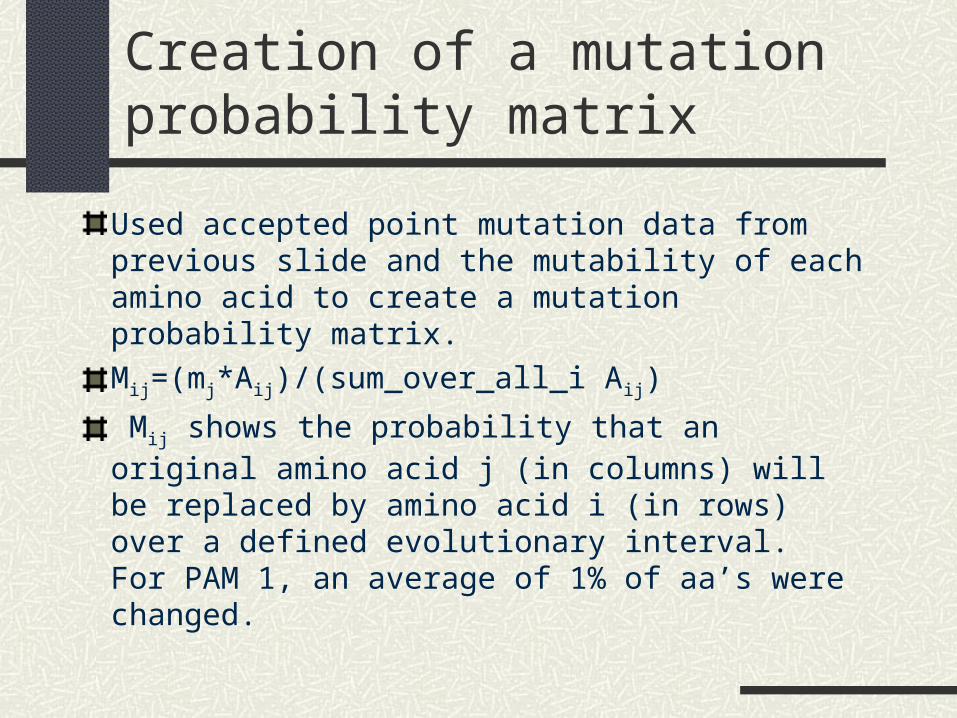
Creation of a mutation probability matrix
Used accepted point mutation data from previous slide and the mutability of each amino acid to create a mutation probability matrix.
Mij=(mj*Aij)/(sum_over_all_i Aij)
Mij shows the probability that an original amino acid j (in columns) will be replaced by amino acid i (in rows) over a defined evolutionary interval. For PAM 1, an average of 1% of aa’s were changed.
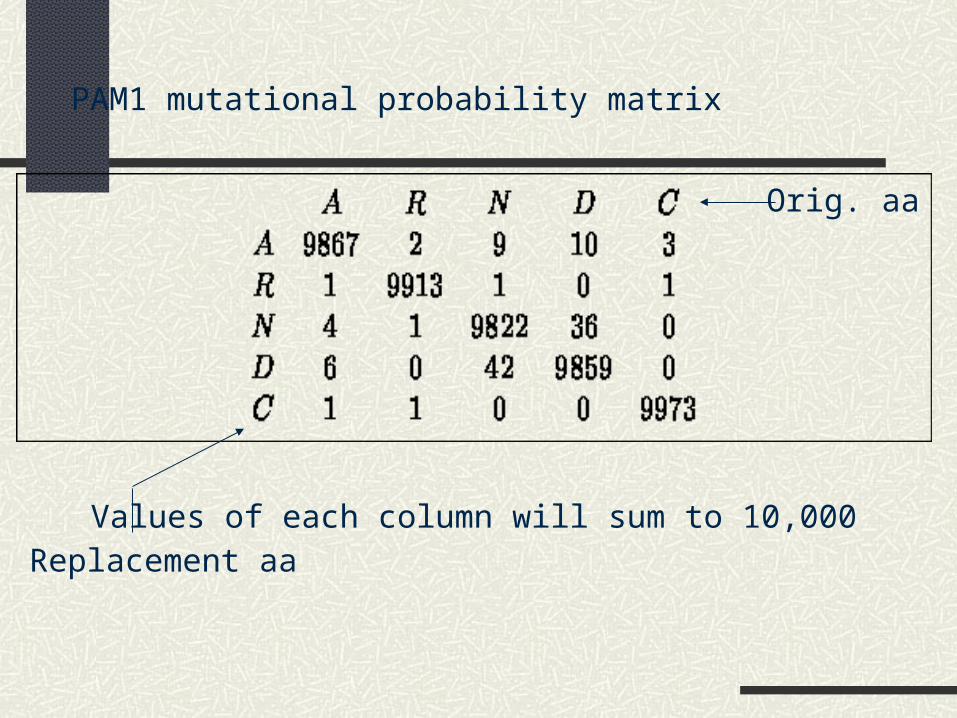
PAM1 mutational probability matrix
Values of each column will sum to 10,000
Orig. aa
Replacement aa
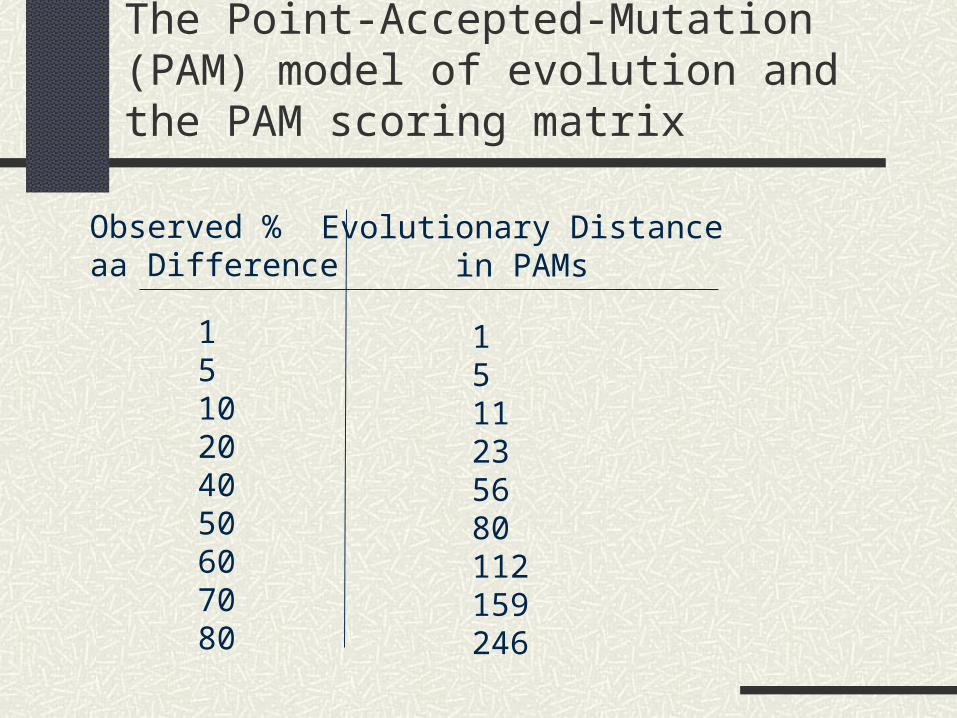
The Point-Accepted-Mutation (PAM) model of evolution and the PAM scoring matrix
Observed %aa Difference
Evolutionary Distancein PAMs
1510204050607080
1511235680112159246
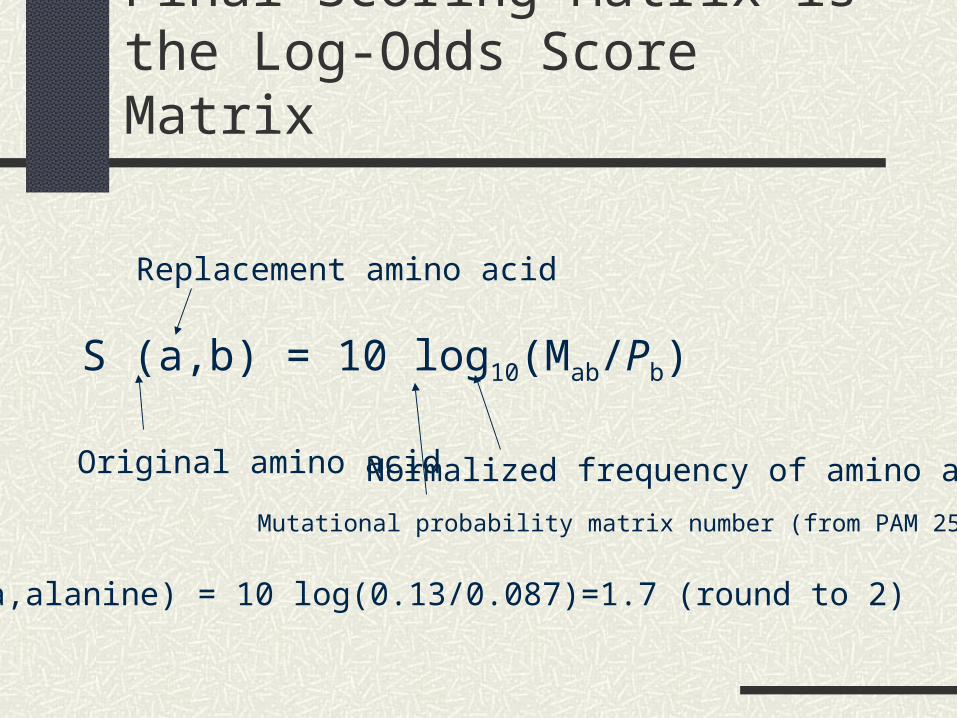
Final Scoring Matrix is the Log-Odds Score Matrix
S (a,b) = 10 log10(Mab/Pb)
Original amino acid
Replacement amino acid
Mutational probability matrix number (from PAM 250)
Normalized frequency of amino acid b
S(a,alanine) = 10 log(0.13/0.087)=1.7 (round to 2)

At this evolution-ary distance, there is a 13% chancethat the second sequence will also have an alanine.
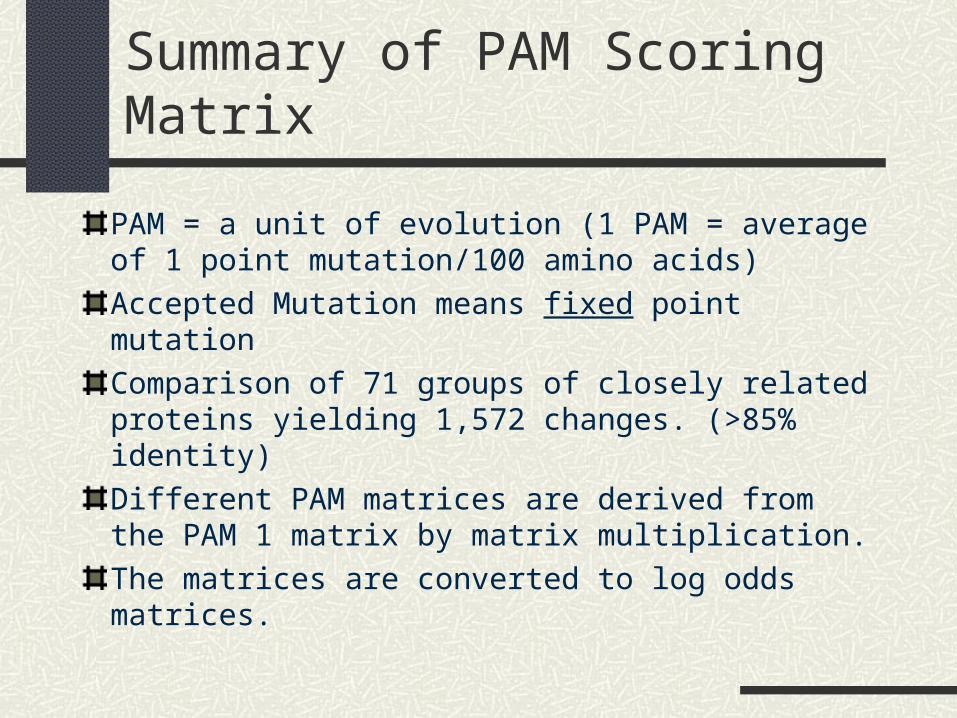
Summary of PAM Scoring Matrix
PAM = a unit of evolution (1 PAM = average of 1 point mutation/100 amino acids)
Accepted Mutation means fixed point mutation
Comparison of 71 groups of closely related proteins yielding 1,572 changes. (>85% identity)
Different PAM matrices are derived from the PAM 1 matrix by matrix multiplication.
The matrices are converted to log odds matrices.
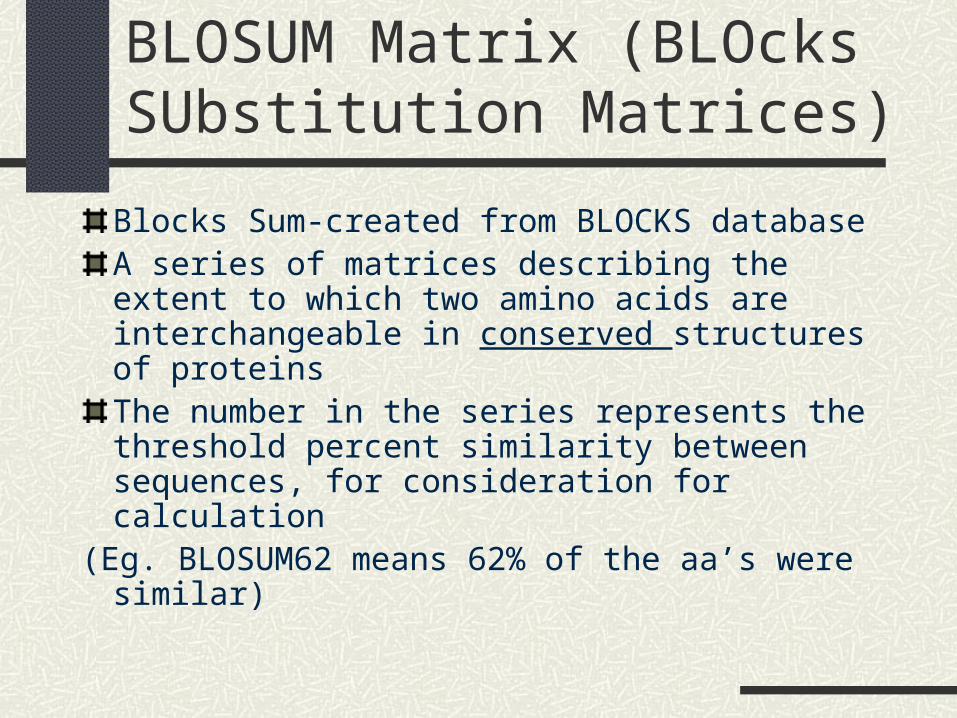
BLOSUM Matrix (BLOcks SUbstitution Matrices)
Blocks Sum-created from BLOCKS databaseA series of matrices describing the extent to which two amino acids are interchangeable in conserved structures of proteinsThe number in the series represents the threshold percent similarity between sequences, for consideration for calculation
(Eg. BLOSUM62 means 62% of the aa’s were similar)
BLOSUM
BLOSUMs are built from distantly related sequences within conserved blocks of sequences
BLOSUMs are built from the BLOCKS database (the BLOCKS database is a secondary database that derives information from the PROSITE Family database)
BLOSUM (cont.1)
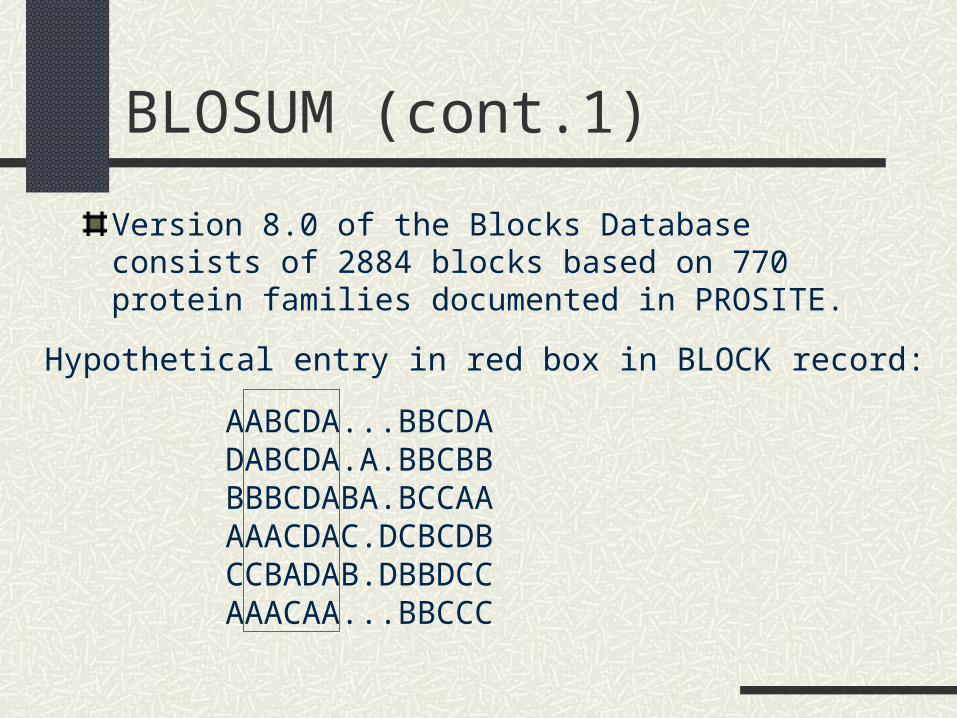
Version 8.0 of the Blocks Database consists of 2884 blocks based on 770 protein families documented in PROSITE.
Hypothetical entry in red box in BLOCK record:
AABCDA...BBCDADABCDA.A.BBCBBBBBCDABA.BCCAAAAACDAC.DCBCDBCCBADAB.DBBDCCAAACAA...BBCCC

Building BLOSUM Matrices
1. To build the BLOSUM 62 matrix one must eliminate sequences that are identical in more than 62% of their amino acid sequences. This is done by either removing sequences from the BLOCK or by finding a cluster of similar sequences and replacing the cluster with a single representative sequence.
2. Next, the probability for a pair of amino acids to be placed in the same column is calculated. In the previous page this would be the probability of replacement of A with A, A with B, A with C, and B with C. This gives the value qij
3. Next, one calculates the frequency that the replacement amino acid exists in nature, fi.
Building BLOSUM Matrices (cont.)
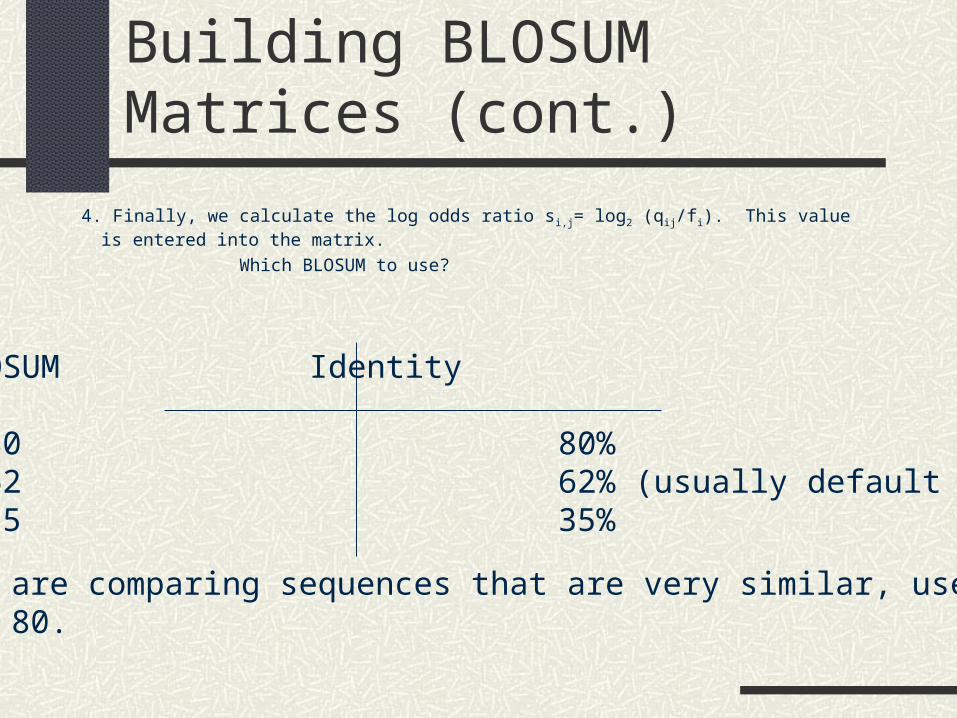
4. Finally, we calculate the log odds ratio si,j= log2 (qij/fi). This value is entered into the matrix.
Which BLOSUM to use?
BLOSUM Identity
80 80% 62 62% (usually default value) 35 35%
If you are comparing sequences that are very similar, useBLOSUM 80.
Which Scoring Matrix to use?
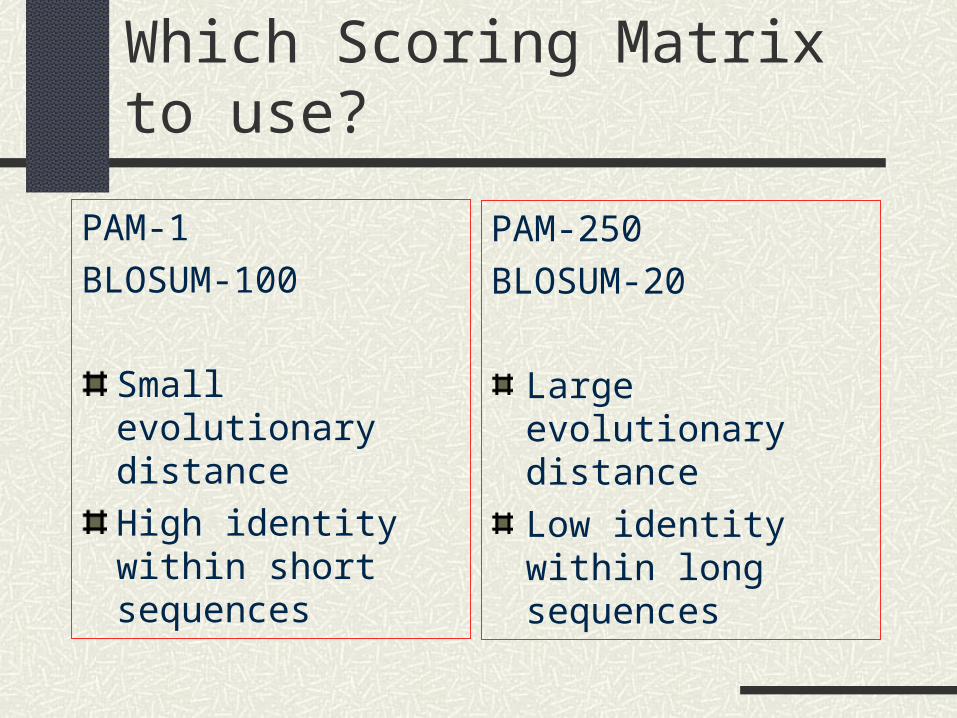
PAM-1
BLOSUM-100
Small evolutionary distance
High identity within short sequences
PAM-250
BLOSUM-20
Large evolutionary distance
Low identity within long sequences

Workshop