SCORECARD FOR CITIES DISASTER RESILIENCE … Deloitte helpful. It is a simple spread sheet tool...
118
DETAILED LEVEL ASSESSMENT MAY 2017 DISASTER RESILIENCE SCORECARD FOR CITIES
Transcript of SCORECARD FOR CITIES DISASTER RESILIENCE … Deloitte helpful. It is a simple spread sheet tool...

DETAILED LEVEL ASSESSMENT
MAY
201
7
DISASTER RESILIENCE SCORECARD FOR CITIES

United Nations Office for Disaster Risk Reduction (UNISDR) Developed with the support of USAID, European Commission, IBM and AECOM
To support reporting and implementation of the Sendai Framework for Disaster Risk Reduction: 2015-2030 Based on the Ten Essentials for Making Cities Resilient
Disaster Resilience Scorecard for Cities Detailed level assessment
Disaster Resilience Scorecard for Cities
2
United Nations Office for Disaster Risk Reduction

What do we mean by resilience? The scope of the Disaster Resilience Scorecard for CitiesResilience as defined by the Sendai Framework is the ability of a system, community or society exposed to hazards to resist, absorb, accommodate, adapt to, transform and recover from the effects of a hazard in a timely and efficient manner, including through the preservation and restoration of its Essential basic structures and functions through risk management.
Increasingly in the context of cities it is framed around the ability to withstand and bounce back from both acute shocks (natural and manmade) such as floods, earthquakes, hurricanes, wild-fires, chemical spills, power outages, as well as chronic stresses occurring over longer time scales, such as groundwater depletion or deforestation, or socio-economic issues such as homelessness and unemployment.
Disaster resilience, and indeed this Scorecard, covers the ability of a city to understand the disaster risks it may face, to mitigate those risks, and to respond to disasters that may occur so that immediate and longer term loss of life or damage to livelihoods, property, infrastructure, economic activity and the environment is minimized. However, this also requires practitioners to
consider the chronic stresses can affect the likelihood or severity of an acute shock event, as well as undermine a city’s capacity to respond and adapt. For example, deforestation may increase the potential for flash flooding, or deprived (and likely uninsured) communities may not be able to rebuild their homes and businesses after a major earthquake. Figure 1 depicts the scope of the Scorecard in relation to the range of shocks and stresses that a city may face.
Figure 1: The scope of the Disaster Resilience Scorecard for Cities
SCOPE OF THE SCORECARD
CLIMATE CHANGE NATURAL DISASTERS
SEA LEVEL RISE MANMADE DISASTERS
ENVIRONMENTAL DEGRADATION
SOCIAL, ECONOMIC, CULTURAL STRESS
CHRONIC STRESSES ACUTE SHOCK
FREQUENT INTERACTIONS
This Scorecard provides a set of assessments that will allow local governments to monitor and review progress and challenges in the implementation of the Sendai Framework for Disaster Risk Reduction: 2015-2030, and assess their disaster resilience. It is structured around UNISDR’s Ten Essentials for Making Cities Resilient.
United Nations Office for Disaster Risk Reduction Disaster Resilience Scorecard for Cities
3

The Scorecard is structured around the “Ten Essentials for Making Cities Resilient”, first developed as part of the Hyogo Framework for Action in 2005, and then updated to support implementation of the Sendai Framework for Disaster Risk Reduction: 2015-2030.
As shown in Figure 2, the Ten Essentials for Making Cities Resilient offer a broad coverage of the many issues cities need to address to become more disaster resilient:
• Essentials 1-3 cover governance and financial capacity;
• Essentials 4-8 cover the many dimensions of planning and disaster preparation;
• Essentials 9-10 cover the disaster response itself and post-event recovery.
1. ORGANISE FOR DISASTER RESILIENCE
2. IDENTIFY, UNDERSTAND AND USE CURRENT ANDFUTURE RISK SCENARIOS
3. STRENGTHEN FINANCIAL CAPABILITY FOR RESILIENCE
4. PURSUE RESILIENT URBAN DEVELOPMENT AND DESIGN
5. SAFEGUARD NATURAL BUFFERS TO ENHANCE THEPROTECTIVE FUNCTIONS OFFERED BY NATURAL CAPITAL
6. STRENGTHEN INSTITUTIONAL CAPACITY FOR RESILIENCE
7. UNDERSTAND AND STRENGTHEN SOCIETAL CAPACITYFOR RESILIENCE
8. INCREASE INFRASTRUCTURE RESILIENCE
9. ENSURE EFFECTIVE DISASTER RESPONSE
10. EXPEDITE RECOVERY AND BUILD BACK BETTER
CORPORATE / CITY GOVERNANCE
INTEGRATED PLANNING
CIT
Y PL
AN /
RESI
LIEN
CE
STRA
TEGY
/ AC
TIO
N P
LAN
RESPONSE PLANNING
Figure 2: The Ten Essentials for Making Cities Resilient
United Nations Office for Disaster Risk ReductionDisaster Resilience Scorecard for Cities
4

Primary Purpose of the Disaster Resilience Scorecard for Cities• To assist countries and local governments in
monitoring and reviewing progress and challenges in the implementation of the Sendai Framework.
• To enable the development of a local disaster risk reduction strategy (resilience action plans).
The benefits of using the Disaster Resilience Scorecard for CitiesEarly users of the Scorecard have reported a number of benefits. The Scorecard can support cities to:
• Establish a baseline measurement of their current level of disaster resilience;
• Increase awareness and understanding of resilience challenges;
• Enable dialogue and concensus between key city stakeholders who may otherwise not collaborate regularly;
• Enable discussion of priorities for investment and action, based on a shared understanding of the current situation;
• Ultimately lead to actions and implementable projects that will deliver increased resilience for the city over time.
Who should use the Disaster Resilience Scorecard for Cities? A city is a system of systems, with each of those systems (e.g. communications, water, sanitation, energy, healthcare, welfare, law and order, education, businesses, social and neighbourhood systems)
potentially having separate owners and stakeholders. Resilience needs consideration within and across each of these systems and therefore can only be achieved through effective collaboration.
A range of actors – whether government, private business, community groups, academic institutions, other organisations or individuals – have roles to play in maintaining and improving city resilience. Ideally, local government authorities - which often have the best convening power- should take the lead in conducting the assessments of the Scorecard. A multi-stakeholder dialogue and approach between key city stakeholders will be necessary to complete the Scorecard, and is Essential in the push towards more resilient cities.
How does the Disaster Resilience Scorecard for Cities deal with risk? While the Scorecard can be used as a standalone tool, it does require you to consider your city’s hazards and risks. Specifically, the Scorecard prompts you to identify “most probable” and “most severe” risk scenarios for each of your identified city hazards, or for a potential multi-hazard event. Some cities will have clear critical hazards, but for others it may be less obvious, and the major risk may lie in a combination of otherwise sub-critical events. In considering risk, you may find the Quick Risk Estimation tool (QRE) developed by UNISDR and Deloitte helpful. It is a simple spread sheet tool aimed at improving risk awareness and is designed to be used alongside this Scorecard. The QRE tool can be downloaded from http://www.unisdr.org/campaign/resilientcities/home/toolkit
How does the scoring in the Disaster Resilience Scorecard for Cities work? Local Governments that have used the Scorecard so far have found that it can be useful at a range of levels, as follows:
• As a high-level survey, often via a 1 or 2 day workshop – this can be supported by questionnaires that participants fill out in advance. Sometimes an average or consensus score is applied at the level of each of the “Ten Essentials”, rather than for each individual criteria / assessment;
• As a limited exercise focusing on some individual Essentials, to create an in-depth review of some specific aspects of resilience, e.g. community-level preparedness;
• As a detailed review of the city’s entire resilience position, likely to take one to several months to complete.
• In light of user feedback, the Scorecard now offers the potential for scoring at two levels:
- Level 1: Preliminary level, responding to key Sendai Framework targets and indicators, and with some critical sub-questions. This approach is suggested for use in a 1 to 2 day city multi-stakeholder workshop. In total there are 47 questions / indicators, each with a 0 – 3 score;
- Level 2: Detailed assessment. This approach is a multi-stakeholder exercise that may take 1 – 4 months and can be a basis for a detailed city resilience action plan. The detailed assessment includes 117 indicator criteria, each with a score of 0 – 5. Note that the criterion in the detailed assessment may serve as helpful discussion prompts for a preliminary level workshop.
United Nations Office for Disaster Risk Reduction Disaster Resilience Scorecard for Cities
5

For the preliminary assessment, questions all need to be scored – the scoring is intentionally simple and crude. Treat the questions as prompts. Think, what could be done better? These points, if recorded, may be further developed into actions or projects in your city resilience strategy / action plan. In completing the preliminary assessment, the conversation is often as important as the score.
For the detailed assessment it is possible to opt out of completing some assessment criteria if they are not relevant to your city (for example, there is an assessment related to ports, when your city may not have one). Your final percentage score excludes any assessment criteria that you have deemed not to be relevant.
There is some intentional overlap between the preliminary and the detailed assessment. Local Governments completing the detailed assessment should find it easier if they have already completed the preliminary assessment. The detailed assessment is designed to build on the preliminary assessment, but prompt deeper thought, review and consultation.
This document (Part 2) contains the assessment criteria for the detailed level assessment. The preliminary assessment can be downloaded from: http://www.unisdr.org/campaign/resilientcities/home/toolkit
The Scorecard is designed to be used flexibly, in a way, which best suits the needs of the city. Given this, local governments are free to apply their own weighting to scoring, across the “Ten Essentials” and decide on their own “evidence” to support the assessment. UNISDR has provided some suggestions regarding the types of evidence that would generally satisfy the scoring requirements. Cities may have other or similar evidence that provides assurance that the scoring criteria have been achieved.
As you use this Scorecard, keep in mind that:
• While the Scorecard aims to be systematic, individual scores may unavoidably be subjective – use your judgment to decide which scores apply most closely to your level of disaster resilience. Recording your justification for each evaluation score will enable validation, as well as future revisions and tracking of progress;
• Disaster risk reduction and building resilience needs to be a collaborative effort. Some aspects of disaster resilience may not be under the control of local governments (for example, the city’s electricity supply or phone system may be operated by a separate agency or private utility, or there may be a provincial or neighbouring government that also needs to be involved). The Scorecard should be completed in consultation with these other organizations. The consultation process will also help to engage and build understanding, ownership and alignment with these other organizations;
• Consulting your citizen groups as you complete the Scorecard will improve the validity of your results;
• Being as accurate and realistic as possible will help identify areas of vulnerability, enabling their prioritisation for attention and funding;
• The Scorecard may not address all the disaster resilience issues facing your city. If in doubt, take advice from an expert in risk management or another relevant discipline.
Adopting a growth mind-set!The Scorecard provides an aspirational definition of disaster resilience – it is very unlikely that any city will score maximum points, and most will not score more than 50%. The intention of the Scorecard is to guide cities towards improved disaster risk reduction, and to challenge complacency.
The scores are not normative and therefore not comparable across different cities. The Scorecard was not designed to facilitate competition between cities, but to identify and promote sharing of knowledge. Local governments using the Scorecard, may wish to encourage participants to adopt a “growth mind-set” – this means accepting that they will identify weaknesses in their city’s resilience, but that this will also inspire development of actions that, when acted on, can enhance and improve city resilience.
Alignment with other global frameworks This Scorecard is based on the Ten Essentials of Making Cities Resilient, which were first developed as part of the Hyogo Framework in 2005, and revised and updated as part of the Sendai Framework agreed in 2015. The Sendai Framework contains a number of key indicators developed to support reporting at a Global and National Level. Appendix D includes some illustrations to show – at a conceptual level - the relationships between the Sendai targets and the broader Sustainable Development Goals (SDGs), and the key climate goals agreed through the Paris Agreement (COP 21).
United Nations Office for Disaster Risk ReductionDisaster Resilience Scorecard for Cities
6

Supporting toolsA supporting MS Excel spread sheet tool, which facilitates scoring at the two levels referred to above accompanies this version of the Disaster Resilience Scorecard for Cities. This tool also allows simple recording of comments or suggested actions that may arise through workshop discussion and which could begin to form the basis of a simple city resilience action plan. The supporting MS Excel tool can be downloaded from the http://www.unisdr.org/campaign/resilientcities/home/toolkit
An online tool will be soon made available for local governments as part of the Sendai Framework monitoring, to help collect and analyse data. This platform will be developed primarily for use by local governments and their partners. Local government leaders are best placed, to use the findings of the Scorecard and inform policy and planning decisions, and to track city progress over time.
Glossary A glossary of terminology is included at the end of this document.
Acknowledgements • IBM and AECOM, who are members of UNISDR’s
Private Sector Advisory Group (PSAG) co-created the City Disaster Resilience Scorecard that was released in 2014, and collaborated again to produce version 2 of the Scorecard released in April 2015, post Sendai.
• A number of cities have supported official piloting of the Scorecard; feedback from these cities has informed this version. Our thanks go to the resilience champions in the following cities: Greater Manchester and Stoke on Trent, UK; Amadora and Lisbon, Portugal; Jonkoping and Arvika, Sweden; Bugaba, Panama; Kisumu, Kenya; Aqaba, Jordon; Yogyakarta, Indonesia; Makati, Philippines and Islamabad, Pakistan. Numerous other cities have completed Scorecard assessments and developed action plans. This feedback has also been considered as part of this Scorecard update.
• The Center for Climate and Energy Solutions (C2ES), with IBM and AECOM, has executed a series of workshops with US cities (Anchorage, AK; Providence, RI; Miami Beach, FL; Kansas City, MO; Phoenix, AZ). Learning from these workshops has informed the update of the Scorecard.
• UNISDR brought together a large working group to develop indicators that have formed substantial part of this Scorecard. Thanks to the entire working group comprising: Arghya Sinha Roy, ADB; Katy Vines, C40 Cities; Sarah Hendle-Blackwood, Ecofys; Ben Smith, AECOM; Mark Harvey, Resurgence; Esteban Leon, UN Habitat; Stefan Kohler, UNOPS, Hugh Macleman, OECD, Cassidy Johnston, UCL, Mostafa Mohaghegh, IFRC; Ebru Gencer, CUDRR; Jair Torres UNESCO; and Margaret Arnold, World Bank.
Questions?Contact our staff and partners in the region nearest you.
Africa: Mr. Animesh Kumar, [email protected]
Americas: Ms. Saskia Carusi, [email protected]
Arab States: Mr. Ragy Saro, [email protected]
Asia: Tejas Patnaik, [email protected]
Pacific: Mr. Timothy Wilcox, [email protected]
North East Asia: Mr. Sanjaya Bhatia, [email protected]
Europe and Central Asia: Mr. Takashi Kawamoto, [email protected]
Global: Mr. Peter Williams, [email protected];
Mr. Ben Smith, [email protected];
Mr. Abhilash Panda, [email protected];
Ms. Fernanda Del Lama Soares, [email protected]
United Nations Office for Disaster Risk Reduction Disaster Resilience Scorecard for Cities
7

The next pages of this document contain an outline of each of the Ten Essentials for Making Cities Resilient, together with the associated Disaster Resilience Scorecard for Cities assessment criteria. This document (part 2) contains the assessment criteria for the detailed level assessment.
United Nations Office for Disaster Risk ReductionDisaster Resilience Scorecard for Cities
8

ESSENTIAL
Organize for Resilience
01

Put in place an organizational structure and identify the necessary processes to understand and act on reducing disaster risks.
Essential 01: Organize for Resilience
Recognizing that the exact format / structure will vary within and between countries, this will include but is not limited to:
• Establishing a single point of coordination in the city, accepted by all stakeholders.
• Exercising strong leadership and commitment at the highest elected level within the city authority, such as the Mayor.
• Ensuring that all departments understand the importance of disaster risk reduction for achieving objectives of their policies and programs; and that they have a framework within which to collaborate as required.
• Ensuring that all city government discussions routinely capture resilience implications; that the resilience implications of policies and standards in use are also assessed; and that action is taken upon these as needed.
• Engaging and building alliances with all relevant stakeholder groups including government at all levels (e.g. national, state, city, county, parish or other subdivision, neighbouring cities or countries as applicable), civil society and community organizations and the private sector.
• Engaging and learning from other city networks and initiatives (e.g. city to city learning programmes, climate change, resilience initiatives etc.)
• Establish necessary strategies, acts, laws, codes or integrate resilience qualities into existing policies aimed at preventing the creation of risk and reduction of existing risk.
• Creating policies to gather and manage data for sharing amongst all stakeholders and citizens.
• Putting in place reporting mechanisms for all citizens that capture key information about resilience and promote transparency, accountability and improved data capture over time (e.g. consider use of UNISDR tools e.g. this Scorecard) and enable information sharing with other organizations and with the public.
Data you will need to answer this section of the Scorecard will include: organization charts; lists of organizations by area, subject and other criteria; as applicable, memoranda of understanding (MOUs) and other role descriptions for each organization concerned; names of key individuals involved; meeting minutes and actions from the organizations concerned; a list of information and data available to each stakeholder.
Note: Data sharing can be important in helping to organise for resilience; assessment criteria covering data sharing are included under Essential 6.
United Nations Office for Disaster Risk ReductionDisaster Resilience Scorecard for Cities
10

Detailed assessment
Ref Subject / Issue Question / Assessment Area
Indicative measurement scale Comments
1.1 Plan Making
1.1.1 Risk consideration in Plan Making
To what extent are risk factors considered within the City Vision / Strategic Plan?
5 – The plan includes a range of actions / priorities (e.g. urban growth and infrastructure projects) that directly respond to current and anticipated future risks.
4 – The plan includes a range of actions / priorities (e.g. urban growth and infrastructure projects) that directly respond to current identified risks.
3 – The plan context is framed around clear presentation of the city risk factors.
2 – A robust risk assessment methodology is integral to the city plan.
1 – There is evidence within the plan that risks (hazards x likelihood) is broadly understood within the City planning team.
0 – Risks are not considered in the plan.
Risk identification and aggregation into scenarios is considered in Essential 2.
This assessment criterion (1.1.1) is aimed at the city teams involved in strategic planning / plan making. Does the plan making process use best available science and risk assessment process to inform the order, magnitude and location of major new urban growth or significant infrastructure investment? i.e. is the future spatial vision for the city informed through clear risk assessment processes.
1.1.2 Consultation in Plan Making
Is this strategy developed through inclusive, participatory multi-stakeholder consultation?
5 – Yes – All relevant groups have been invited and attended. Stakeholders have been fully briefed on the process and receive regular bulletins on the progress of the plan.
4 – At least 8 of the 10 listed groups (right) have been engaged / consulted.
3 – At least 6 of the 10 listed groups have been engaged / consulted.
2 – At least 4 of the listed groups have been engaged / consulted.
1 – At least 2 of the listed groups were invited.
0 – Stakeholder engagement has been undertaken.
• The city emergency services;
• Other city services and departments (public works, transportation);
• The local health sector;• Utility providers including
telecommunications;• Local businesses;• NGOs;• Civil society organisations
including minority group representation;
• Environmental sector;• The wider city population
in all neighbourhoods, both formal and informal community groups;
• Local universities;• Scientific institutions;• Other tiers of government
or neighbouring cities, where necessary for the city’s resilience;
• Industry associations.
United Nations Office for Disaster Risk Reduction Disaster Resilience Scorecard for Cities
11

1.1.3 Review of strategic plans
Is the city strategic plan reviewed on a regular basis?
5 – The plan has already been reviewed and there is a published commitment to review the plan at least every 3 years. The plan update process (including capturing lessons learned) is detailed in the plan and stakeholders are clear how they can inform the plan update process.
4 – The plan has already been reviewed and there is a published commitment to review the plan at least every 3 years. Clear processes have been instigated to capture lessons learnt and to ensure these lessons inform plan updates.
3 – The plan has already been reviewed and updated and there is a published commitment to ongoing / regular review (at least every 3 years).
2 – No review has taken place but there is a commitment to undertake a review every 5 years.
1 – No review has happened yet, but a review is assumed. No timescale has been set out. The commitment to review is not published.
0 – No review has been undertaken and there are no plans to undertake a review.
1.2 Organization, coordination and participation
1.2.1 Pre-event planning and preparation
Co-ordination of all relevant pre-event planning and preparation activities exists for the city’s area, with clarity of roles and accountability across all relevant organizations.
5 - There is a clear coordination of all relevant pre-event planning and preparation activities. All roles and accountability are clearly defined between relevant organizations.
4 - There is some coordination of pre-event planning and preparation in the city. However, overlapping roles exist and accountability is not clearly defined.
3 - The city (or focal point/institution) is currently in process of coordination of pre-event and planning activities, which will clearly identify roles and accountability among relevant organizations.
2 - Coordination of pre-event planning and preparation activities not sufficient. No clear identification of roles and accountability among relevant organizations.
1 - The city is currently discussing to start a process to coordinate all pre-event planning and activities.
0- There are currently no plans to coordinate pre-event and planning activities.
The single point of co-ordination may be a person, or a group or committee (with sub-groups or committees as appropriate). It will coordinate the relevant (see below) activities of:
• The city government and, if separate, highways, police, armed forces/civil defence, water, energy, or any other relevant city organizations);
• Other tiers of government (e.g. state, ward-level) or neighbouring municipalities);
• Private sectors organizations with relevant roles – for example, utilities, phone companies, healthcare, logistics companies, fuel depots, property companies and other relevant organisations.
Some cities may have different organizational arrangements for different types of disaster. However, these need at least to work through the same coordination point (person or committee) to ensure consistency in response arrangements; and also to enable management of simultaneous disasters as applicable. The test of relevance is whether the organization or activity must contribute in any way to preparing for the event scenarios covered below in Essential 2. Coordination of data and systems is covered in Essential 6.
United Nations Office for Disaster Risk ReductionDisaster Resilience Scorecard for Cities
12

1.2.2 Co-ordination of event response
Coordination of all relevant event response activities in the city’s area, with clarity of roles and accountability across all relevant organizations.
5 - There is a clear coordination of all relevant response activities. All roles and accountability are clearly defined between relevant organizations.
4 - There is some coordination of response activities in the city. However, overlapping roles exist and accountability is not clearly defined.
3 - Coordination of response activities is not sufficient. There is currently no clear identification of roles and accountability among relevant organizations in the city.
2 - The city (or focal point/institution) is currently in process of coordination of response activities, which will clearly identify roles and accountability among relevant organizations.
1 - The city is currently discussing to start a process to coordinate all response activities.
0 - There are currently no plans to coordinate response activities.
See guidance above.
Event response coordination arrangements should be regularly tested, if not by real events, at least in simulation exercises – see Essential 9.
Coordination of data and systems is covered in Essential 6.
1.2.3 City resources for managing organisation, co-ordination and participation
Ability of the city government to play the critical convening and plan making role for DRR. Do the city and or other lead agencies have the authority and resources to deliver on their DRR commitments?
This assessment criteria relating to resources and funding should be considered for pre-event planning (1.2.1), event response (1.2.2) and post event (1.2.6 together).
5 – Yes – all lead agency teams are well established properly resourced / funded and have authority to act across all DRR stages – pre, event response and post disaster.
4 – Yes – all lead agency teams are well established properly resourced / funded and have authority to act, but there is inconsistency in resourcing across the key DRR stages.
3 – City teams have authority, convening power and resource / funding but they do not have proper inter-agency support.
2 – City / lead agencies have authority but are under resourced. They co-opt support with some success.
1 – City / lead agencies have authority but are under resourced.
0 – No. Lead agencies lack proper authority and are under resourced.
It is assumed these assessment criteria most relevant to the city government, but could be applied to other agencies if they take the lead organisational / convening role for DRR. Support can be co-opted (1.2.5) from public and private sectors – this question relates specifically to resource and authority to plan and co-ordinate activities.
United Nations Office for Disaster Risk Reduction Disaster Resilience Scorecard for Cities
13

1.2.4 Identification of physical contributions
Co-option of physical contributions by both public and private sectors.
Identification of physical contributions for each major organization.
5 – All key contributions fully defined for pre and post-event, underwritten by MOUs.
4 – Most key contributions defined – some minor gaps in coverage. MOUs may not exist.
3 – Some contributions formally defined but full leverage of private sector yet to be achieved.
2 – One or two contributions defined for specific areas – perhaps via informal agreements.
1 – Plans being developed to seek contributions.
0 – No private sector.
Physical contributions refer to plant and equipment, people, premises and accommodation, supplies, data, computer systems, and so on. These will supplement those provided by the city and may come from other agencies or from private sector organizations such as those defined above.
The key is to have a clear view of what will be needed to supplement the city’s own resources (defined in Essential 9); and then to enter into explicit MOUs with the organizations that will supply those items.
Note that the city may also receive contributions to support plan making and risk reduction – see 1.1 above.
1.3 Integration
1.3.1 Integration of disaster resilience with other initiatives
Extent to which any proposal in government is also evaluated for disaster resilience benefits or impairments.
Explicit stage in policy and budget approval process where disaster resilience side benefits, or impairments, of any city government initiative are identified and counted towards the Return on Investment (ROI) for that proposal.
5 – Explicit decision step, applied to all policy and budget proposals in all relevant functional areas.
4 – Explicit or semi-explicit decision step, applied in most cases and in most functional areas.
3 – No formal process, but disaster resilience benefits are generally understood to be “helpful” to a proposal, in most functional areas.
2 – Decision step sometimes applied, but very likely to be overlooked in most functional areas if a proposal would impair disaster resilience.
1 – Applied ad hoc or occasionally.
0 – Not applied.
For example:
• Traffic management systems may also help with evacuation, so increasing disaster resilience;
• A development approval may locate people in harm’s way;• A land use change may reduce benefit of wetlands in
preventing floods.
Includes, but not restricted to, the functional areas of: land use and zoning; development; water, energy; public safety; transportation; food supply; healthcare.
United Nations Office for Disaster Risk ReductionDisaster Resilience Scorecard for Cities
14

1.4 Data capture, publication and sharing
1.4.1 Extent to which data on the city’s resilience position is shared with other organizations involved with the city’s resilience
Availability of a single “version of the truth” – a single integrated set of resilience data for practitioners.
5 – Full availability of the information listed at right on readiness and risk; fully shared with other organizations.
4 – Some minor gaps, or the information is in more than one place – but it is shared and it is at least linked to enable navigation.
3 – Some more significant gaps, for example on readiness; other organizations may have to “hunt around” to create a complete picture for themselves.
2 – Some significant information on readiness and risk is withheld from other organizations or is missing and/or badly fragmented across multiple websites.
1 – Information provision to other organizations on readiness and risk is rudimentary at best. Not possible to for those organizations to derive specific conclusions for themselves.
0 – No information.
Information to consider making open for public access might include:
• A summary of readiness; • The outcomes of this Scorecard;• An explanation of the hazards and perils that the city is thought
to face, and probabilities;• A hazard-map based summary (see Essential 2) of at-risk
areas;• A description of what building codes will protect against, and
where these have been applied;• A full set of disaster response plans and known issues;• Key roles and accountabilities;• Planned investments that will affect the city’s resilience position;• Further resources and contact details.
United Nations Office for Disaster Risk Reduction Disaster Resilience Scorecard for Cities
15

Notes
United Nations Office for Disaster Risk ReductionDisaster Resilience Scorecard for Cities
16
ESSENTIAL
Identify, Understand and use Current and Future Risk Scenarios
02
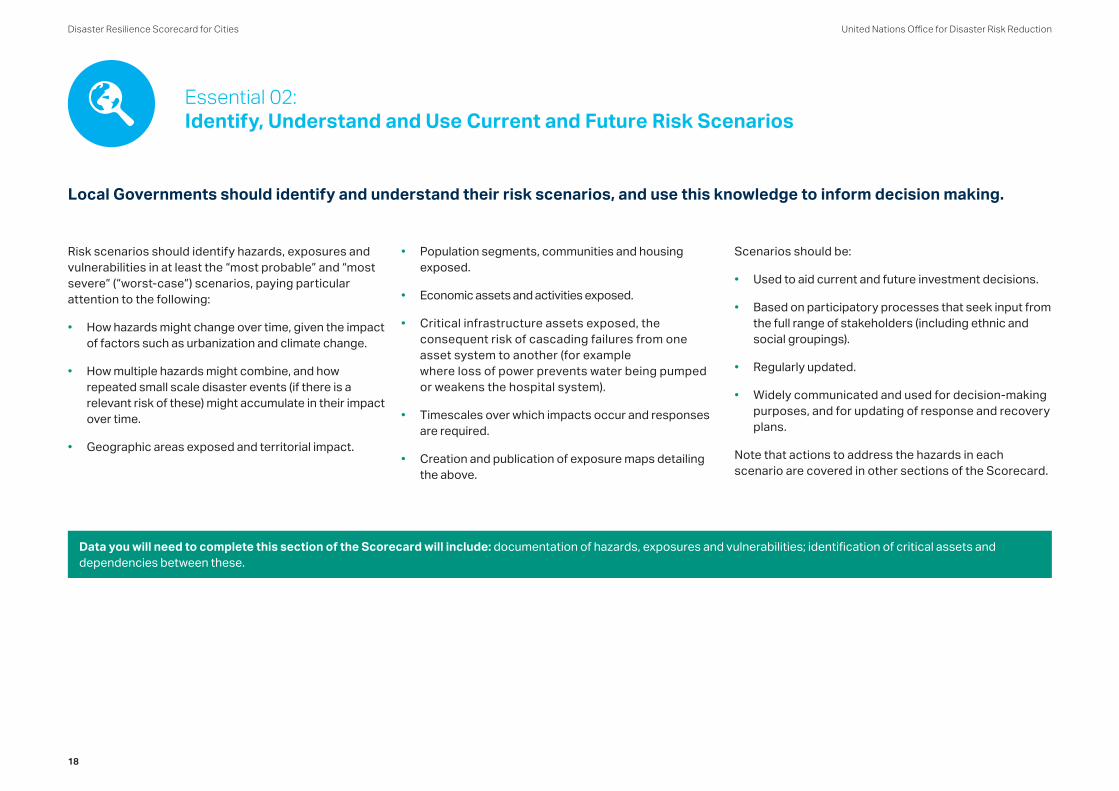
Local Governments should identify and understand their risk scenarios, and use this knowledge to inform decision making.
Essential 02: Identify, Understand and Use Current and Future Risk Scenarios
Risk scenarios should identify hazards, exposures and vulnerabilities in at least the “most probable” and “most severe” (“worst-case”) scenarios, paying particular attention to the following:
• How hazards might change over time, given the impact of factors such as urbanization and climate change.
• How multiple hazards might combine, and how repeated small scale disaster events (if there is a relevant risk of these) might accumulate in their impact over time.
• Geographic areas exposed and territorial impact.
• Population segments, communities and housing exposed.
• Economic assets and activities exposed.
• Critical infrastructure assets exposed, the consequent risk of cascading failures from one asset system to another (for example where loss of power prevents water being pumped or weakens the hospital system).
• Timescales over which impacts occur and responses are required.
• Creation and publication of exposure maps detailing the above.
Scenarios should be:
• Used to aid current and future investment decisions.
• Based on participatory processes that seek input from the full range of stakeholders (including ethnic and social groupings).
• Regularly updated.
• Widely communicated and used for decision-making purposes, and for updating of response and recovery plans.
Note that actions to address the hazards in each scenario are covered in other sections of the Scorecard.
Data you will need to complete this section of the Scorecard will include: documentation of hazards, exposures and vulnerabilities; identification of critical assets and dependencies between these.
United Nations Office for Disaster Risk ReductionDisaster Resilience Scorecard for Cities
18

Ref Subject / Issue
Question / Assessment Area
Indicative measurement scale Comments
2.1 Hazard assessment2.1.1 Knowledge of
hazards (also called perils, or shocks and stresses) that the city faces, and their likelihood
Existence of recent, expert-reviewed estimates of probability of known hazards or perils and their extents.
5 – Comprehensive estimates exist, were updated in last 3 years and reviewed by a 3rd party. “Most severe” and “most probable” hazards are generally accepted as such.
4 – Estimates exist but have minor shortcomings in terms of when updated, level of review, or level of acceptance.
3 – Estimates exist but with more significant shortcomings in terms of when updated and level of review or acceptance.
2 – Some estimates exist but are not comprehensive; or are comprehensive but more than 3 years old; or are not reviewed by a 3rd party.
1 – Only a generalized notion of hazards, with no attempt systematically to identify probability.
0 – No estimates.
Note: Use of the UNISDR Quick Risk Estimator Tool (QRE) can support assessment against these criteria.
Cities need to have a view of the hazards or perils that they face – what specific hazards (tsunami, hurricane, earthquake, flood, fire etc) exist and how severe might they be? For each hazard there needs to be identified, as a minimum:
• A “most probable” incident;• A “most severe” incident.
Hazards may be identified from probability distributions, specifically conducted for the purpose of assessing disaster resilience: “most probable” would be at the midpoint of the range of hazards that need to be addressed and “most severe” would be from the top 10% of the probability range.
Alternatively, they may be approximated from such sources as:
• General hazard assessments for the region; • Assumptions created as an input to land zoning, planning discussions
or permitting;• Insurance industry risk assessments;• Expert opinion as to “typical” hazards;• Prior experience or historical records of disasters in the region.
However, if these levels of knowledge are not available, cities should still try to assemble a picture from prior experiences and/or estimation of the general level of hazard that they face.
Sophisticated cities may also attempt to estimate the impact of multiple consecutive smaller hazards, or combinations of hazards (a hurricane and accompanying storm surge, for example).
It is important to note that hazards may change over time as a consequence of urbanization and land use (for example where deforestation increases propensity for flash flooding), climate change (for example, changing rainfall or storm patterns), or better knowledge (for example, understanding of seismic threats or likely storm tracks). Thus, hazard estimates need to be updated regularly (See 2.5).
United Nations Office for Disaster Risk Reduction Disaster Resilience Scorecard for Cities
19

2.2 Knowledge of exposure and consequence
2.2.1 Knowledge of exposure and vulnerability
Existence of scenarios setting out city-wide exposure and vulnerability from each hazard level (see above).
5 – Comprehensive scenarios exist city-wide, for the “most probable” and “most severe” incidence of each hazard, updated in last 18 months and reviewed by a 3rd party.
4 – Scenarios have minor shortcomings in terms of coverage, when updated, level or thoroughness of review.
3 – Scenarios have more significant shortcomings in terms of coverage, when updated, level of review, thoroughness.
2 – Partial scenarios exist but are not comprehensive or complete; and/or are more than 18 months old; and/or are not reviewed by a 3rd party.
1 – Only a generalized notion of exposure and vulnerability, with no attempt systematically to identify impacts.
0 – No risk assessment.
Note: Use of the UNISDR Quick Risk Estimator Tool (QRE) can support assessment against these criteria.
Exposure may be thought of as who or what (people, land, ecosystems, crops, assets, infrastructure, economic activity) is potentially in harm’s way as a result of a hazard. Vulnerability may be thought of as the potential consequences of that exposure (loss of life, property or service; physical damage; health impact, economic impact; environmental impact and so on). Different exposures and/or vulnerabilities may combine, for example where the tsunami generated by the Tohoku earthquake in Japan in 2011 (also known as the Great East Japan Earthquake) badly damaged the Fukushima nuclear power plant – generating a whole additional set of exposures and vulnerabilities.
Exposures and vulnerabilities may be assessed from sources such as regional flood maps or earthquake hazard maps, or from expert estimation.
Hazards, exposures and vulnerabilities need to be assembled into “scenarios”. Scenarios are comprehensive pictures of the total impact of the hazard (if any) across all neighbourhoods and all aspects of the city, and will include:
• Exposure and vulnerability of neighbourhoods and economic zones;• Exposure and vulnerability of critical infrastructure items, with and
without alternatives (see below); • Benefit from, and status of ecosystem services, where applicable;• Estimates of recovery time, given estimated benefit of mitigation
measures, if any.
Scenarios will ideally have been for reviewed for thoroughness and plausibility by a 3rd party and updated in last 18 months. This is more frequently than the reviews of hazards, above, as land use and development that may affect exposure and vulnerability happens on a faster time-scale.
United Nations Office for Disaster Risk ReductionDisaster Resilience Scorecard for Cities
20
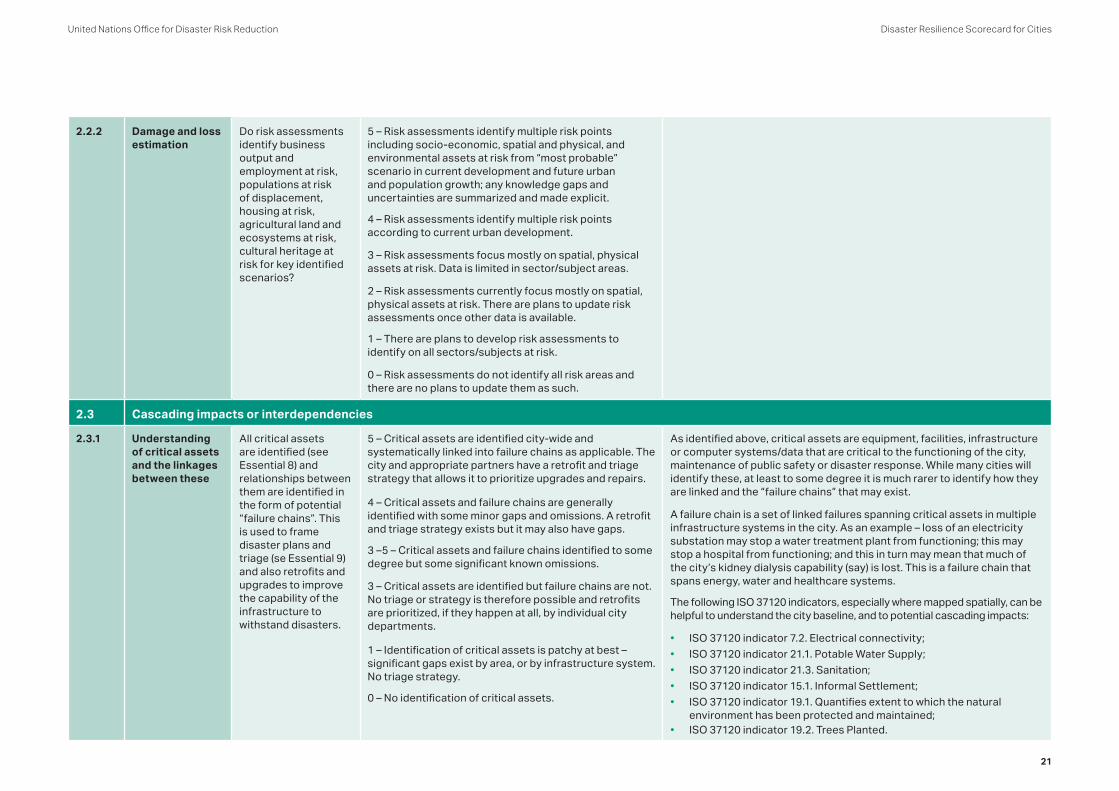
2.2.2 Damage and loss estimation
Do risk assessments identify business output and employment at risk, populations at risk of displacement, housing at risk, agricultural land and ecosystems at risk, cultural heritage at risk for key identified scenarios?
5 – Risk assessments identify multiple risk points including socio-economic, spatial and physical, and environmental assets at risk from “most probable” scenario in current development and future urban and population growth; any knowledge gaps and uncertainties are summarized and made explicit.
4 – Risk assessments identify multiple risk points according to current urban development.
3 – Risk assessments focus mostly on spatial, physical assets at risk. Data is limited in sector/subject areas.
2 – Risk assessments currently focus mostly on spatial, physical assets at risk. There are plans to update risk assessments once other data is available.
1 – There are plans to develop risk assessments to identify on all sectors/subjects at risk.
0 – Risk assessments do not identify all risk areas and there are no plans to update them as such.
2.3 Cascading impacts or interdependencies
2.3.1 Understanding of critical assets and the linkages between these
All critical assets are identified (see Essential 8) and relationships between them are identified in the form of potential “failure chains”. This is used to frame disaster plans and triage (se Essential 9) and also retrofits and upgrades to improve the capability of the infrastructure to withstand disasters.
5 – Critical assets are identified city-wide and systematically linked into failure chains as applicable. The city and appropriate partners have a retrofit and triage strategy that allows it to prioritize upgrades and repairs.
4 – Critical assets and failure chains are generally identified with some minor gaps and omissions. A retrofit and triage strategy exists but it may also have gaps.
3 –5 – Critical assets and failure chains identified to some degree but some significant known omissions.
3 – Critical assets are identified but failure chains are not. No triage or strategy is therefore possible and retrofits are prioritized, if they happen at all, by individual city departments.
1 – Identification of critical assets is patchy at best – significant gaps exist by area, or by infrastructure system. No triage strategy.
0 – No identification of critical assets.
As identified above, critical assets are equipment, facilities, infrastructure or computer systems/data that are critical to the functioning of the city, maintenance of public safety or disaster response. While many cities will identify these, at least to some degree it is much rarer to identify how they are linked and the “failure chains” that may exist.
A failure chain is a set of linked failures spanning critical assets in multiple infrastructure systems in the city. As an example – loss of an electricity substation may stop a water treatment plant from functioning; this may stop a hospital from functioning; and this in turn may mean that much of the city’s kidney dialysis capability (say) is lost. This is a failure chain that spans energy, water and healthcare systems.
The following ISO 37120 indicators, especially where mapped spatially, can be helpful to understand the city baseline, and to potential cascading impacts:
• ISO 37120 indicator 7.2. Electrical connectivity; • ISO 37120 indicator 21.1. Potable Water Supply;• ISO 37120 indicator 21.3. Sanitation;• ISO 37120 indicator 15.1. Informal Settlement; • ISO 37120 indicator 19.1. Quantifies extent to which the natural
environment has been protected and maintained;• ISO 37120 indicator 19.2. Trees Planted.
United Nations Office for Disaster Risk Reduction Disaster Resilience Scorecard for Cities
21

2.4 Hazard maps
2.4.1 Hazard maps Presence of hazard maps (for example, flood or seismic risk maps).
5- Hazard maps for current urban development and future urban growth are developed based on available risk- assessments. Relevant guidelines exist including multiple benefits of tackling cross cutting issues in an integrated way (such as benefits of addressing adaptation, mitigation interface opportunities within built environment).
4 – Hazard maps exist for current urban development and relevant guidelines exist.
3- Hazard maps are available for current urban development but there are no guidelines to guide risk-sensitive urban planning and development.
2- Hazard maps and relevant guidelines to guide risk-sensitive urban planning and development are currently being developed.
1 – There are plans to develop hazard maps and relevant guidelines to guide risk-sensitive urban planning and development.
0 – There are no plans to develop hazard maps and / or relevant guidelines to guide risk-sensitive urban planning and development.
For availability / access and publication of hazard, vulnerability and risk maps to other organizations and to the public – see Essential 1.
Training in risk, vulnerability and exposure see Essential 6.
Note that cities may wish to think about the frequency of updates to risk maps. Urban conditions and risks frequently vary. Smart sensing and controls are shifting focus towards more dynamic updating of hazard maps.
United Nations Office for Disaster Risk ReductionDisaster Resilience Scorecard for Cities
22

2.5 Updating of scenario, risk, vulnerability and exposure information
2.5.1 Update process Process ensuring frequent and complete updates of scenarios.
Existence of a process agreed between all relevant agencies to:
Update hazard estimates every 3 years or less;
Update exposure and vulnerability assessments and asset inventory every 18 months or less.
5 – Update processes exist, are proven to work at required frequency and thoroughness, and are accepted by all relevant agencies.
4 – Processes exist with some minor flaws in coverage, date slippage or less important agencies being bought in.
3 – Processes exist, but with at least 1 major omission in terms of frequency, thoroughness or agency buy-in. Risk identification may be compromised in some areas, accordingly.
2 – Processes have some major flaws to the point where overall value is impaired and original risk assessments are becoming significantly obsolete.
1 – Processes are rudimentary at best. A complete risk assessment – even if elderly – has yet to be achieved.
0 – No processes.
Updates are Essential because hazards may change over time (especially if weather or sea-level related); and because land use, population and economic activity patterns may also change as cities grow.
Updates need to address:
• Hazard patterns;• Dwellings;• Businesses;• City infrastructure and facilities (see Essential 8), including critical
assets and failure chains;• Critical computer systems and data (see Essential 8);• Schools and healthcare facilities (see Essential 8); • Ecosystem services (see Essential 5).
The focus here is on the process itself and its ability to ensure continued and complete updating of scenarios.
Updates may be by means of a regular updating exercise that captures all changes for the preceding period, or by means of an incremental update process that reliably captures changes as they occur.
Many countries update their risk data on a 5 year cycle. This is unlikely to be adequate to keep pace with urban boundary or land use changes.
United Nations Office for Disaster Risk Reduction Disaster Resilience Scorecard for Cities
23

Notes
United Nations Office for Disaster Risk ReductionDisaster Resilience Scorecard for Cities
24

ESSENTIAL
Strengthen Financial Capacity for Resilience
03

Understand the economic impact of disasters and the need for investment in resilience. Identify and develop financial mechanisms that can support resilience activities.
Essential 03: Strengthen Financial Capacity for Resilience
Key actions might include:
• Understanding and assessing the significant direct and indirect costs of disasters (informed by past experience, taking into account future risk), and the relative impact of investment in prevention rather than incurring more significant costs during recovery
• Assigning a ring-fenced capital budget for any major works found to be necessary to improve resilience
• Including risk management allocations in operating budget as required to maintain the required state of resilience over time
• Assessing disaster risk levels and implications from all planning, permitting and capital spending decisions, and adjusting those decisions as needed
• Creating incentives for homeowners, low-income families, communities, businesses and public sector to invest in reducing the risks they face (e.g. business continuity planning, redundancy, building upgrades)
• Applying (and if necessary generating) insurance coverage for lives, livelihoods, city and private assets
• Exploring as needed innovative financing mechanisms such as specialised bonds, specialised insurance, tax efficient finance, development impact bonds etc.
Data you will need to complete this section of the Scorecard will include: budget and capital plan documentation; documentation of any incentives or financing schemes (for example, loans for seismic upgrades) with a disaster resilience impact, together with take-up statistics for each area of the city and insurance coverage statistics.
United Nations Office for Disaster Risk ReductionDisaster Resilience Scorecard for Cities
26

Detailed assessment
Ref Subject / Issue Question / Assessment Area Indicative measurement scale Comments
3.1 Knowledge of approaches for attracting new investment to the city for DRR
3.1.1 Awareness and knowledge of all possible methods of financing and funding, as required
The city is actively pursuing financing and funding, as required
Note: If sufficient funds exist these assessment criteria can be omitted
Where a city has outstanding resilience expenditure needs (revenue or capital) – the extent to which it has researched and understands all available routes / options to close any funding shortfalls.
The extent to which the city is actively trying to meet funding needs and has a clear responsibility for this. This may include the use of external funding or management consultants.
This may include the systematic identification of “resilience dividends” (see right – also known as co-benefits).
5 - Yes there is dedicated responsibility within the city authority to access available financing at international and national levels.
4 – Yes there is dedicated responsibility within the city authority to access those funding streams known to the city, but awareness of all available funds is incomplete or accessing such funds can be too resource intensive.
3 - There is no dedicated responsibility within the city authority, however there are plans to discuss and implement this to gain full awareness of available funds and how to access them.
2 - There is no dedicated responsibility within the city authority to access the funds; there is a low/partial awareness of available funds for response and recovery.
1 – No dedicated responsibility within the city authority to access such funds and no awareness of which finds to access/ no plans to do so.
0 – Response and recovery funding not considered whatsoever.
(If no additional financing needs apply, omit this assessment).
Many cities do not have a fully developed “atlas” of where all possible sources of resilience funding may lie. As a result improvements to resilience may go un-funded.
Alternative financing methods and sources may include, but are not restricted to:
• Leasing;• Government grants, including matching grants;• Social impact or resilience bonds (payment for results achieved);• Development banks and aid organizations;• Foundations that may have a direct interest in some aspect of
resilience – for example where a conservation NGO might support restoration of ecosystem services, or an education NGO might support awareness and training;
• Other government agencies that may have a direct interest in some aspect of resilience – for example where a transportation agency finances a new bridge that may also improve evacuation capacity;
• Crowd-funding;• Development fees;• Public-private partnerships;• Taxes and surcharges.
“Resilience dividends” – sometimes called co-benefits - arise in two ways:
• “Inbound” dividends arise where investments elsewhere in the city have additional resilience benefits – for example where advanced meter infrastructures make water and energy systems more able to report damage from a flood or earthquake. Inbound dividends will tend to reduce the visible costs of resilience.
“Outbound” dividends, where an investment in resilience also provides an additional, non-resilience benefit- for example where a flood zone doubles as a park during times of normal weather. Outbound dividends serve to increase the visible benefits of resilience.
United Nations Office for Disaster Risk Reduction Disaster Resilience Scorecard for Cities
27
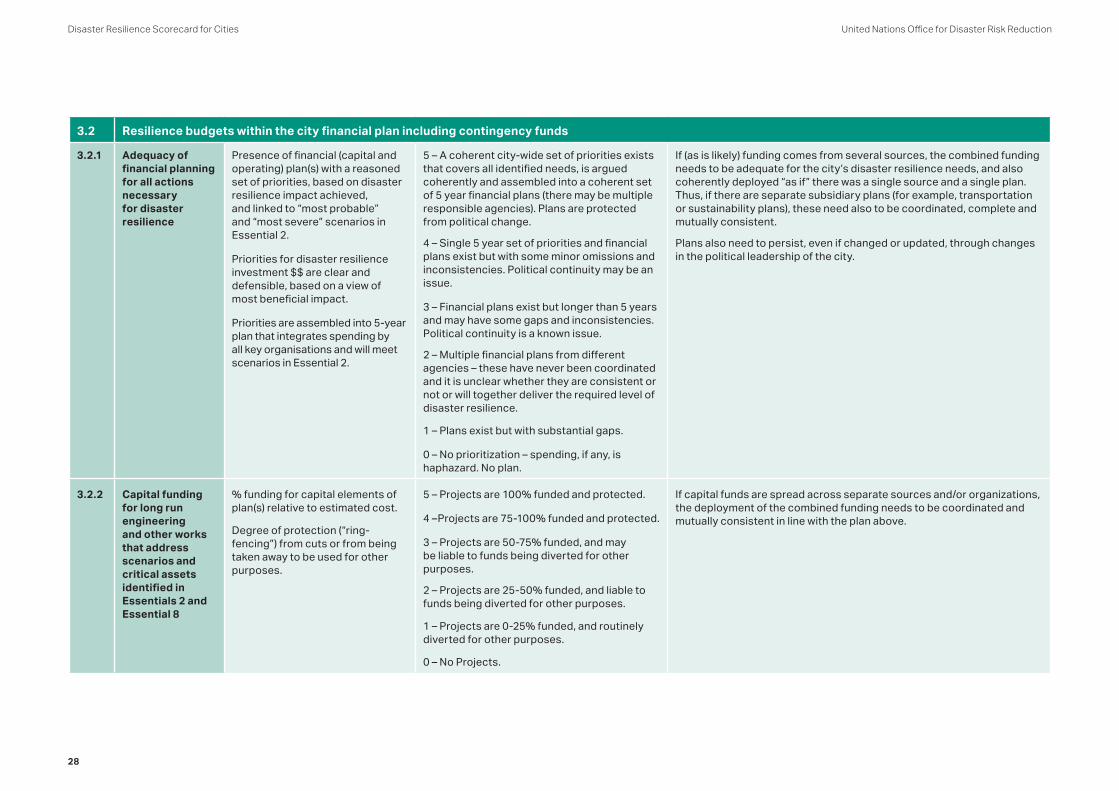
3.2 Resilience budgets within the city financial plan including contingency funds
3.2.1 Adequacy of financial planning for all actions necessary for disaster resilience
Presence of financial (capital and operating) plan(s) with a reasoned set of priorities, based on disaster resilience impact achieved, and linked to “most probable” and “most severe” scenarios in Essential 2.
Priorities for disaster resilience investment $$ are clear and defensible, based on a view of most beneficial impact.
Priorities are assembled into 5-year plan that integrates spending by all key organisations and will meet scenarios in Essential 2.
5 – A coherent city-wide set of priorities exists that covers all identified needs, is argued coherently and assembled into a coherent set of 5 year financial plans (there may be multiple responsible agencies). Plans are protected from political change.
4 – Single 5 year set of priorities and financial plans exist but with some minor omissions and inconsistencies. Political continuity may be an issue.
3 – Financial plans exist but longer than 5 years and may have some gaps and inconsistencies. Political continuity is a known issue.
2 – Multiple financial plans from different agencies – these have never been coordinated and it is unclear whether they are consistent or not or will together deliver the required level of disaster resilience.
1 – Plans exist but with substantial gaps.
0 – No prioritization – spending, if any, is haphazard. No plan.
If (as is likely) funding comes from several sources, the combined funding needs to be adequate for the city’s disaster resilience needs, and also coherently deployed “as if” there was a single source and a single plan. Thus, if there are separate subsidiary plans (for example, transportation or sustainability plans), these need also to be coordinated, complete and mutually consistent.
Plans also need to persist, even if changed or updated, through changes in the political leadership of the city.
3.2.2 Capital funding for long run engineering and other works that address scenarios and critical assets identified in Essentials 2 and Essential 8
% funding for capital elements of plan(s) relative to estimated cost.
Degree of protection (“ring-fencing”) from cuts or from being taken away to be used for other purposes.
5 – Projects are 100% funded and protected.
4 –Projects are 75-100% funded and protected.
3 – Projects are 50-75% funded, and may be liable to funds being diverted for other purposes.
2 – Projects are 25-50% funded, and liable to funds being diverted for other purposes.
1 – Projects are 0-25% funded, and routinely diverted for other purposes.
0 – No Projects.
If capital funds are spread across separate sources and/or organizations, the deployment of the combined funding needs to be coordinated and mutually consistent in line with the plan above.
United Nations Office for Disaster Risk ReductionDisaster Resilience Scorecard for Cities
28

3.2.3 Operating funding to meet all operating costs of disaster resilience activities
Funding for operating expenses relative to estimated costs: presence of separately delineated budget line item(s).
Degree of protection (“ring-fencing”) from cuts or from being taken away to be used for other purposes.
5 – Budget exists, is 100% adequate and is protected.
4 – Budget exists, is 75-100% adequate, and is protected.
3 – Budget exists, is 50-75% adequate but is liable to diversion for other purposes.
2 – Budget exists, is 25-50% adequate but is liable to diversion for other purposes.
1 – Budget exists, but is only 0-25% adequate and is routinely diverted for other purposes.
0 – No budget.
If operating funds are spread across separate sources and/or organizations, or separate budget line-items, the deployment of the combined funding needs to be coordinated and mutually consistent in line with the financial plan above.
3.2.4 Contingency fund(s) for post disaster recovery (may be referred to as a “rainy-day fund”)
Existence of fund(s) capable of dealing with estimated impacts from “most severe” scenario (See Essential 2).
Degree of protection (“ring-fencing”) of contingency fund(s) from being taken away to be used for other purposes.
5 – Contingency fund (and insurance as applicable) exists to rectify impacts from “most probable” scenario, is 100% adequate and protected.
4 – Fund exists, is 75-100% adequate and protected.
3 – Fund exists, is 50-75% adequate but may be liable to funds being diverted for other purposes.
2 – Fund exists, is 25-50% adequate, and liable to funds being diverted for other purposes.
1 – Fund exists is only 0-25% adequate, and routinely diverted for other purposes.
0 – No fund.
Include impact of insurance coverage where applicable (see below). Include money also available from other agencies, different levels of government etc.
United Nations Office for Disaster Risk Reduction Disaster Resilience Scorecard for Cities
29

3.3 Insurance
3.3.1 Domestic insurance coverage
Extent of coverage of domestic housing.
(Personal or life coverage is not assessed).
5 – 75 – 100% of likely housing losses from “most severe” scenario is covered city-wide by insurance.
4 – 75-100% of likely losses from “most probable” scenario is covered city-wide.
3 – 50-75% of likely losses from “most probable” scenario is covered city-wide.
2 – 25-50% of likely losses from “most probable” scenario is covered city-wide.
1 – 0-25% of likely losses from “most probable” scenario is covered city-wide.
0 – No cover.
This assessment covers insurance on domestic dwellings. Personal or life coverage is excluded. Governmental, industrial and commercial insurance is covered below.
Insurance may come from multiple public or private providers.
3.3.2 Non-domestic insurance coverage
Extent of insurance coverage of non-domestic property, infrastructure and assets.
5 – 75 – 100% of likely losses from most severe scenario is covered city-wide by insurance.
4 – 75-100% of likely losses from “most probable” scenario is covered city-wide.
3 – 50-75% of likely losses from “most probable” scenario is covered city-wide.
2 – 25-50% of likely losses from “most probable” scenario is covered city-wide.
1 – 0-25% of likely losses from “most probable” scenario is covered city-wide.
0 – No cover.
This question covers insurance to commercial, industrial property and assets, as well as to NGO-, government- or city-owned buildings, assets and infrastructure. Domestic insurance is covered above.
Insurance may come from multiple providers.
Some governments and agencies and some businesses may self-insure. It will be necessary to confirm that funds exist to meet the likely needs.
United Nations Office for Disaster Risk ReductionDisaster Resilience Scorecard for Cities
30

3.4 Incentives and financing for businesses, community organizations and citizens.
3.4.1 Incentives to businesses organizations to improve disaster resilience – disaster plans, premises etc
Existence of incentives to help business owners take steps to improve disaster resilience to a standard to deal with the “most severe” scenario (Essential 2).
5 – Incentives are visibly achieving (or have achieved) required results evenly with businesses across the city.
4 – Incentives are generally effective but with some minor shortcomings perhaps in some areas.
3 - Incentives have larger gaps in coverage of the economic base.
2 - Incentives have larger gaps in coverage of the required issues.
1 – Incentives have major weaknesses and have so far failed to achieve their purpose.
0 – No incentives.
Incentives and financing may come from multiple sources.
3.4.2 Incentives to non-profit organizations to improve disaster resilience – disaster plans, premises etc
Existence of incentives to help non-profits take steps to improve disaster resilience to a standard to deal with the “most severe” scenario (Essential 2).
5 – Incentives are visibly achieving (or have achieved) required results evenly with non-profits across the city.
4 – Incentives are generally effective but with some minor shortcomings perhaps in some areas.
3 - Incentives have larger gaps in coverage of the non-profit base.
3 - Incentives have larger gaps in coverage of the required issues.
1 – Incentives have major weaknesses and have so far failed to achieve their purpose.
0 – No incentives.
Incentives and financing may come from multiple sources.
Non-profits may be directly concerned with disaster resilience issues (for example, emergency response groups, neighbourhood watch, food kitchens); or indirectly (for example, churches, environmental watch groups or similar).
United Nations Office for Disaster Risk Reduction Disaster Resilience Scorecard for Cities
31

3.4.3 Incentives to homeowners to improve disaster resilience – disaster plans, premises etc
Existence of incentives to help homeowners take steps to improve disaster resilience to a standard to deal with the “most severe” scenario (Essential 2). Ideally means-tested, to ensure that funds go to those most in need.
5 – Incentives are visibly achieving (or have achieved) required results evenly with householders across the city.
4 – Incentives are generally effective but with some minor shortcomings perhaps in some areas.
3 - Incentives have larger gaps in coverage of householders.
2 - Incentives have larger gaps in coverage of the required issues.
1 – Incentives have major weaknesses and have so far failed to achieve their purpose.
0 – No incentives.
United Nations Office for Disaster Risk ReductionDisaster Resilience Scorecard for Cities
32

ESSENTIAL
Pursue Resilient Urban Development
04
The built environment needs to be assessed and made resilient, as applicable.
Essential 04: Pursue Resilient Urban Development
Building on the scenarios and risk maps from Essential 2, this will include:
• Land zoning and management of urban growth to avoid exacerbating resilience issues – identification of suitable land for future development taking into consideration of how low-income groups can access suitable land
• Risk-aware planning, design and implementation of new buildings, neighbourhoods and infrastructure, using innovative or existing/traditional techniques as applicable
• Addressing needs of informal settlements including basic infrastructure deficits such as water, drainage and sanitation
• Development and implementation of appropriate building codes, and using these to assess existing structures for resiliency to potential hazards, incorporating appropriate retro-fitting of prevention measures
• Maximizing use of urban design solutions such as impermeable surfaces, green areas, shadowing, water retention areas, ventilation corridors etc) that can cope with risks and also reduce the dependency on technical infrastructure like sewage systems, dikes etc
• Engaging affected stakeholders in appropriate and proportional participatory decision-making processes when making urban development decisions
• Incorporating exemplary sustainable design principles into new development. Link to other existing standards where appropriate (BREEAM, LEED, Greenstar, etc)
• Updating building regulations and standards regularly (or periodically) to take account of changing data and evidence on risks.
Data you will need to complete this section of the Scorecard will include: land use, population, income levels and economic activity by segment of the city; and also relevant building codes and their application on a property-by-property basis.
United Nations Office for Disaster Risk ReductionDisaster Resilience Scorecard for Cities
34

Detailed assessment
Ref Subject / Issue Question / Assessment Area Indicative measurement scale Comments
4.1 Land use zoning
4.1.1 Potential population displacement
% of population at risk of displacement.
5 – No population displacement from “most severe” scenario.
4 – No population displacement from “most probable” scenario.
3 – <2.5% population displacement from “most probable” scenario.
2 – 2.5-5% population displacement from “most probable” scenario.
1 – 5-7.5% population displacement from “most probable” scenario.
0 – >7.5% population displacement from “most probable” scenario.
Displacement for 3 months or longer as a consequence of housing being destroyed or rendered uninhabitable, or the area in which it is located being rendered uninhabitable.
This assessment also needs to cover informal and unplanned settlements.
Effectiveness of zoning should ideally be independently validated (see also Essential 2).
4.1.2 Economic activity at risk
% of employment at risk. 5 – No loss of employment from “most severe” scenario.
4 – No loss of employment from “most probable” scenario.
3 – <2.5% of employment at risk from “most probable” scenario.
2 – 2.5-5% of employment at risk from “most probable” scenario.
1 – 5-7.5% of employment risk from “most probable” scenario.
0 – >7.5% of employment at risk from “most probable” scenario.
Employment is at risk from damage to farmland, factories, offices, and so on.
Loss is for 1 month or longer.
Effectiveness of zoning should ideally be independently validated (see also Essential 2).
United Nations Office for Disaster Risk Reduction Disaster Resilience Scorecard for Cities
35

4.1.2.1 % of business output at risk. 5 – No loss of business output from “most severe” scenario.
4 – No loss of business output from “most probable” scenario.
3 – <2.5% of business output at risk from “most probable” scenario.
2 – 2.5-5% of business output at risk from “most probable” scenario.
1 – 5-7.5% of business output risk from “most probable” scenario.
0 – >7.5% of business output at risk from “most probable” scenario.
Business output measured in financial terms. This assessment also includes loss through business being forced to relocate elsewhere, even if only temporarily, due to loss of premises or facilities, loss of markets, loss of services from the city or loss of workforce through inability to reach their place of work.
Loss is for 1 month or longer.
Effectiveness of zoning should ideally be independently validated (see also Essential 2).
4.1.3 Agricultural land at risk
% of agricultural land at risk. 5 – No loss of agricultural land from “most severe” scenario.
4 – No loss of agricultural land from “most probable” scenario.
3 – <2.5% of agricultural land at risk from “most probable” scenario.
2 – 2.5-5% of agricultural land at risk from “most probable” scenario.
1 – 5-7.5% of agricultural land at risk from “most probable” scenario.
0 – >7.5% of agricultural land at risk from “most probable” scenario.
Note: Some elements of land use zoning / strategic planning are covered under Essential 1. Further detail is included here.
This assessment is intended to focus on agricultural land required to feed the city, excluding imported food from other regions or countries.
Loss is for 6 months or longer.
Effectiveness of zoning should ideally be independently validated (see also Essential 2).
United Nations Office for Disaster Risk ReductionDisaster Resilience Scorecard for Cities
36

4.2. New urban development
4.2.1 Urban design solutions that increase resilience
Use of urban design solutions to improve resilience; often by maximizing the extent and benefit of ecosystem services within the city (see also Essential 5).
5 – Systematic use of design solutions to improve resilience throughout the city, enforced by codes. Assumed to be “the norm”.
4 – Widespread use of urban design features but some missed opportunities. Proposals to use urban design solutions are likely to be favourably received but not mandated.
3 – Some use of urban design features – perhaps in some areas, or perhaps concentrating on one or two solutions. Their use is not assured but the argument for using them can be made depending on each case.
2 – Scattered use of urban design solutions, but interest in expanding this.
1 – Little use and little interest.
0 – No use and no interest.
Urban design solutions that can improve resilience will include, but are not limited to:
• soakaways and porous pavement used to deal with urban storm-water run-off and replenish ground water;
• underground parking garages used as holding tanks for storm water, and parks that function as flood zones;
• green roofs to help cool buildings and reduce storm run-off;
• trees and greenery to reduce heat-island effects, or stabilize hillsides;
• neighbourhood micro-grids or roof-top generation as back-up to the main energy supply.
4.3 Building codes and standards
4.3.1 Existence of building codes designed to address risks identified in Essential 2.
Existence of applicable codes to all physical assets.
Codes exist that will ensure:
5 – Zero damage. All physical structures and assets remaining usable in the “most probable” scenario.
4 – >75% of all physical structures and assets remaining usable in the “most probable” scenario.
3 – >50% of all physical structures and assets remaining usable in the “most probable” scenario.
2 – >20% of all physical structures and assets remaining usable in the “most probable” scenario.
1 – >10% of all physical structures and assets remaining usable in the “most probable” scenario.
0 – 0-10% of all physical structures and assets remaining in the “most probable” scenario.
Building codes should be specifically evaluated for ability to deal with “most probable” and “most severe” scenarios in Essential 2.
It may make sense to subdivide the city by region or neighbourhood.
Effectiveness of codes should ideally be independently validated (see also Essential 2).
United Nations Office for Disaster Risk Reduction Disaster Resilience Scorecard for Cities
37
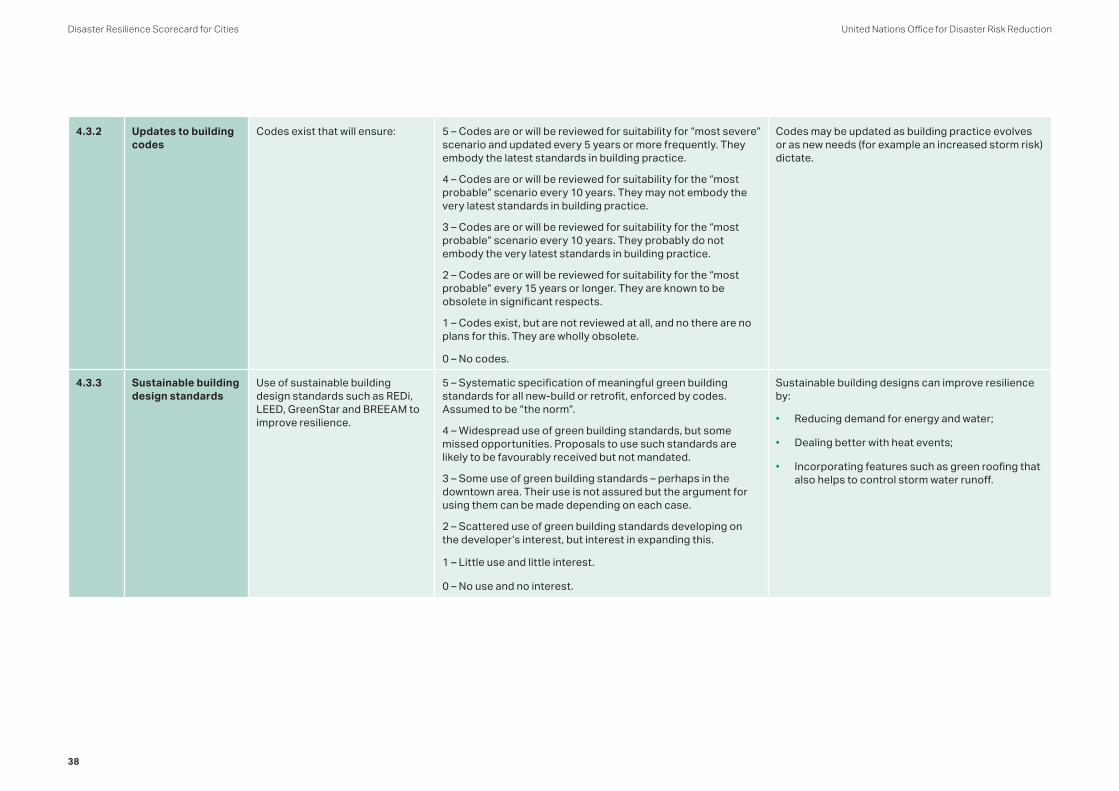
4.3.2 Updates to building codes
Codes exist that will ensure: 5 – Codes are or will be reviewed for suitability for “most severe” scenario and updated every 5 years or more frequently. They embody the latest standards in building practice.
4 – Codes are or will be reviewed for suitability for the “most probable” scenario every 10 years. They may not embody the very latest standards in building practice.
3 – Codes are or will be reviewed for suitability for the “most probable” scenario every 10 years. They probably do not embody the very latest standards in building practice.
2 – Codes are or will be reviewed for suitability for the “most probable” every 15 years or longer. They are known to be obsolete in significant respects.
1 – Codes exist, but are not reviewed at all, and no there are no plans for this. They are wholly obsolete.
0 – No codes.
Codes may be updated as building practice evolves or as new needs (for example an increased storm risk) dictate.
4.3.3 Sustainable building design standards
Use of sustainable building design standards such as REDi, LEED, GreenStar and BREEAM to improve resilience.
5 – Systematic specification of meaningful green building standards for all new-build or retrofit, enforced by codes. Assumed to be “the norm”.
4 – Widespread use of green building standards, but some missed opportunities. Proposals to use such standards are likely to be favourably received but not mandated.
3 – Some use of green building standards – perhaps in the downtown area. Their use is not assured but the argument for using them can be made depending on each case.
2 – Scattered use of green building standards developing on the developer’s interest, but interest in expanding this.
1 – Little use and little interest.
0 – No use and no interest.
Sustainable building designs can improve resilience by:
• Reducing demand for energy and water;
• Dealing better with heat events;
• Incorporating features such as green roofing that also helps to control storm water runoff.
United Nations Office for Disaster Risk ReductionDisaster Resilience Scorecard for Cities
38

4.4 Application of zoning building codes and standards
4.4.1 Application of land use zoning
Extent to which land use zoning is enforced.
5 – Zoning is 100% implemented and all settlement and economic activity is compliant.
4 – Zoning is 90-200% implemented and enforced.
3 – Zoning is 80-90% implemented and enforced.
2 – Zoning is 70-80% implemented and enforced.
1 – Zoning is 50=70% implemented and enforced.
0 – Zoning is <50% implemented and enforced.
By definition, it will be difficult for cities with informal settlements to score highly on this measure, unless it so happens that they are safely located, and unless separate steps have been taken to make these more resilient.
4.4.2 Application of building codes
Implementation of building codes on relevant structures.
5 – Codes are 100% implemented on applicable structures and certified as such by a 3rd party.
4 – Codes are 90-100% implemented on applicable structures and 3rd-party certified.
3 – Codes are 80-90% implemented on applicable structures. They may or may not be 3rd party certified.
2 – Codes are 70-80% implemented on applicable structures. They may or may not be 3rd party certified.
1 – Codes are 50-70 % implemented on applicable structures. No 3rd party certification.
0 – Codes are <50% implemented on applicable structures. No 3rd party certification.
Effectiveness of codes should ideally be independently validated (see also Essential 2).
Application of codes will be a particular issue in unplanned or informal settlements.
Codes and standards will include those for the supply of basic infrastructure services to informal settlements, without which the ability of those settlements to recover from disasters will be severely compromised.
United Nations Office for Disaster Risk Reduction Disaster Resilience Scorecard for Cities
39

Notes
United Nations Office for Disaster Risk ReductionDisaster Resilience Scorecard for Cities
40
ESSENTIAL
Safeguard Natural Buffers to Enhance the Protective Functions
Offered by Natural Ecosystems
05

Safeguard natural buffers to enhance the protective functions offered by natural ecosystems. Identify, protect and monitor critical ecosystems services that confer a disaster resilience benefit.
Essential 05: Safeguard Natural Buffers to Enhance the Protective Functions Offered by Natural Ecosystems
Relevant ecosystem services may include, but are not limited to: water retention or water infiltration; afforestation; urban vegetation; floodplains; sand dunes; mangrove and other coastal vegetation, and pollination. Many ecosystem services that are relevant to the city’s resilience may be provided well outside its geographical area.
This Essential includes:
• Recognising value and benefits from ecosystem services for disaster risk prevention, protecting and /or enhancing them as part of risk reduction strategies for cities.
• Considering also natural buffers in the rural hinterland of the city, watershed and wider region, and cooperation with municipalities there to establish a regional approach of land use planning to protect the buffers.
• Anticipating changes from climate trends and urbanization, and planning to enable ecosystem services to withstand these, enhanced as required by green and blue infrastructure.
Ecosystem services that benefit a city may be located many miles away (for example, where upstream forests may manage floodwater run-off to the benefit of cities on downstream floodplains). Ecosystem services may not be recognized or even suspected, and you may require external expertise to identify them. Ecosystem services that offer a generalized, planetary benefit (for example, polar icecaps) are excluded.
Data you will need to complete this section of the Scorecard will include: land use and zoning documentation, plus data on the extent and health of relevant ecosystems as measured by applicable indicators.
United Nations Office for Disaster Risk ReductionDisaster Resilience Scorecard for Cities
42

Detailed assessment
Ref Subject / Issue Question / Assessment Area Indicative measurement scale Comments
5.1 Existing natural environment and ecosystem health
5.1.1 Awareness of the role that ecosystem services may play in the city’s disaster resilience
Ecosystem services are specifically identified, and managed as critical assets.
5 – Critical ecosystem services identified and monitored annually on a defined set of key health/performance indicators.
4 – Critical ecosystem services identified and monitored annually, but less systematic use of metrics.
3 – Critical ecosystem services identified but have ad hoc monitoring – no real attempt to track health over time.
2 – Some key ecosystem services omitted from monitoring altogether.
1 – Identification and monitoring of ecosystem services is formative at best, or is seriously deficient.
0 – No monitoring.
Ecosystem services may include:
• Sand dunes, coastal wetlands, mangroves or reefs that protect against storm surges and tsunamis;
• Forestation that protects against flash flooding, landslides;• Natural overflow channels, sandy soil soak-zones, and
marshes that can protect against river flooding and storm water run-off;
• Lakes, rivers and aquifers that supply water;• Water-tables that, if lowered, may cause low-lying or
reclaimed land to shrink to below sea level;• Trees and greenery that reduce urban heat-island effects or
enable urban soak-way zones for flood management.
Many ecosystem services also relieve chronic stresses – for example, wetlands help to remediate water pollution; forests help to remediate air pollution, and so on. Where those chronic stresses degrade the city’s disaster resilience (for example, where pollution reduces water available in a drought or where lack of pollinating insects reduces food supply) then the ecosystem services concerned should also be monitored.
5.1.2 Ecosystem health
Change in health, extent or benefit of each ecosystem service in last 5 years.
5 – Improved health and performance across the board for critical eco-system services.
4 – At least neutral status across the board, with some improvements in some cases.
3 – Neutral status on average – some improvements offset by some declines.
2 – Generalized decline in ecosystem service status.
1 – Generalized severe degradation in status known or suspected.
0 – Potentially fatal damage to some or many key eco-system services.
Measures will include extent, health (perhaps captured as species diversity) and buffering capacity. Measures will be specific to each ecosystem and may need to be derived by scientists or technical experts practicing in the relevant areas.
United Nations Office for Disaster Risk Reduction Disaster Resilience Scorecard for Cities
43

5.2 Integration of green and blue infrastructure into city policy and projects
5.2.1 Impact of land use and other policies on ecosystem services
Absence of policies or land uses liable to weaken ecosystem services.
5 – Land use policies are strongly supportive of critical ecosystem services and are fully enforced.
4 – Land use policies are strongly supportive of critical ecosystem services and are generally enforced.
3 – Land use policies are broadly supportive but are not fully enforced.
2 – Land use policies (or lack thereof) may lead or have led to damage to one or more critical ecosystem services.
1 – Land use policies (or lack thereof) inflict generalized degradation on ecosystem services.
0 – Land use policies (or lack thereof) may lead or have led to complete destruction of critical ecosystem services.
This assessment complements the assessment of land use zoning in Essential 4.
5.2.2 Green and blue infrastructure is routinely embedded into city projects
Green and blue infrastructure is routinely embedded into projects across the city – in new urban development, regeneration and infrastructure projects.
5 – The city has maximised opportunities to include green and blue infrastructure and has processes and codes (see Essential 4) to ensure this will continue with future development.
4 – The city is a heavy user of green and blue infrastructure, perhaps with 80% of known opportunities taken. The issue is regularly considered and embedded in codes.
3 – The city is an extensive user of blue and green infrastructure but this is ad hoc – green and blue infrastructure not covered by city policy or codes.
2 – The city is a moderate user of blue and green infrastructure for new development – less effort at retrofitting.
1 – The city is familiar with the idea of blue and green infrastructure and is an occasional user.
0 – No usage or awareness of blue and green infrastructure issues.
Green Infrastructure includes: greening streets, squares and roadsides; greening roofs and facades, developing urban agriculture; creating urban green corridors; replace impermeable surfaces; natural water filtration; daylighting urban rivers and restoring embankments, etc.
Blue Infrastructure includes: river corridors, wetlands and other waterways.
Ecosystem functions include: water attenuation, food growing, fuel, carbon sequestration, air filtration, heat attenuation, pollination, aesthetic value etc.
While resilience and sustainability are not the same (items like concrete seawalls are resilient but not very sustainable, whereas species conservation may be sustainable but taking place in a location doomed by sea level rise), they are often aligned. For example, environmental stress such as deforestation may worsen flash-flooding or heat events; or degraded agricultural land may hinder the ability of a region to recover from a disaster. Enhancing green environmental services through the use of Green and Blue infrastructure is often an excellent strategy for improving resilience.
United Nations Office for Disaster Risk ReductionDisaster Resilience Scorecard for Cities
44

5.3 Transboundary environmental issues
5.3.1 Identification of critical environmental assets
How many critical ecosystem assets have been identified outside of the city boundaries that act towards enhancing city resilience?
5 – The city regularly undertakes transboundary assessments of ecosystem assets and works with border neighbours to manage these assets.
4 - The city has mapped ecosystem assets and carried out a complete assessment of risk reduction due to these assets, considering assets beyond its own borders.
3 - The city’s mapping of ecosystem assets extends beyond its own borders.
2 - There are critical ecosystem assets beyond the city boundaries, but they haven’t been properly identified.
1 - No critical ecosystem assets have been identified.
0 – City has no plans to consider ecosystems beyond its own borders.
Critical environmental assets might include (but not be restricted to) shared watersheds, ground water aquifers, wetlands, nearby green spaces, urban greenery (to reduce heat island effects), food sources and so on.
5.3.2 Transboundary agreements
Are there trans-boundary agreements and collaborations in place to enable policy and planning for the implementation of ecosystem based approaches?
For those ecosystems that are outside city jurisdictional boundary.
5 – All transboundary agreements and collaborations are in place with relevant organisations and implemented where required, according to findings of risk assessment.
4 – Some agreements in place with some organisations; further examples are currently being identified.
3 – The city has identified the need to establish transboundary agreements and is in process of deciding next steps.
2 – No transboundary agreements exist but it is on the city agenda to undertake such an assessment.
1 – No transboundary examples identified.
0 – City sees no value in establishing trans-boundary agreements and no plans to do so.
United Nations Office for Disaster Risk Reduction Disaster Resilience Scorecard for Cities
45

Notes
United Nations Office for Disaster Risk ReductionDisaster Resilience Scorecard for Cities
46

ESSENTIAL
Strengthen Institutional Capacity for Resilience
06

It is important to ensure that all institutions relevant to a city’s resilience have the capabilities they need to discharge their roles.
Essential 06: Strengthen Institutional Capacity for Resilience
“Institutions” include, as applicable, central, state and local government organizations; private sector organizations providing public services; (depending on locale, this may include phone, water, energy, healthcare, road operations, waste collection companies and others as well as those volunteering capacity or equipment in the event of a disaster); industrial facility owners and operators; building owners (individual or corporate); NGOs; professional, employers’ and labour organizations, and cultural and civil society organizations (see Essential 7).
Capacity should be developed across the five key DRR areas of understanding, prevention, mitigation, response and recovery planning. Factors affecting capacity will include:
• Skills, including but not limited to: hazard/risk assessment, risk-sensitive planning (spatial and socio-economic), integrating disaster and climate risk considerations in project evaluation/design (including engineering design, co-ordination, communication, data and technology management, and disaster management, response, recovery, assessment of structures post disaster; business and services continuity planning).
• Training, based ideally on case studies of how DRR can be implemented and what business continuity requires (Note that the training referred to here is about the subject of disaster resilience. Formal emergency response practice drills, which obviously are a form of training, are covered under Essential 9).
• Creating and implementing information and data frameworks for resilience and disaster risk reduction that build consistency in data capture and storage and enable data access, use and re-use by multiple stakeholder groups for regular development processes.
Shared understanding of roles and responsibilities, and a framework of shared and open information on resilience in the city are also important to capacity – these are covered in Essential 1.
Data you will need to complete this assessment include: training curricula; training records for those trained, courses run; school and university curricula; survey and market research data on effectiveness.
United Nations Office for Disaster Risk ReductionDisaster Resilience Scorecard for Cities
48

Detailed assessment
Ref Subject / Issue Question / Assessment Area Indicative measurement scale Comments
6.1 Skills and experience
6.1.1 Availability of skills and experience in disaster resilience – risk identification, mitigation, planning, response and post event response
Known (i.e. inventoried in last 1 year) availability of key skills, experience and knowledge.
5 – Skills inventory carried out in last year and all key skills and experience are available in required quantities for all organizations relevant to city disaster resilience.
4 – Inventory carried out - shows with minor gaps in quantity or skill type in some organizations.
3 – Inventory carried out but each organization has at least one skill or experience type in short supply.
2 – Inventory may not have complete coverage, but known widespread lack of multiple skill or experience types in many organizations.
1 – Rudimentary and partial inventory. Suspicion of complete or almost complete lack of skills available across the city.
0 – No inventory.
Skills will include: land planning, energy, environmental, water and structural engineering, logistics, debris disposal, healthcare, law and order, project planning and management.
Knowledge refers to operating knowledge of city government and city infrastructure(s): the energy, water, sanitation, traffic and other critical city systems at risk. (see Essential 8).
Experience refers to direct experience of the types of perils the city faces (see Essential 2) and the capabilities of the city’s infrastructure to withstand and/or recover from these.
Some skills, knowledge or experience may be purchased from specialist consultancies, or supplied on a one-time basis by aid agencies.
(First responders – see Essential 9).
6.1.2 Private sector links
To what extent does the city utilise and engage the private sector?
5 – City DRR stakeholders have in place comprehensive MOU agreements with private companies to co-opt resources such as food, warehousing, data centers and vehicles, and perhaps skilled employees such as engineers, in an emergency situation. There are regular meetings between DRR stakeholders and local companies updating on local risks.
4 – The city has MoUs and fairly regular meetings but these could be improved.
3 – The city has some formal MOUs and meetings with the private sector but these could be improved.
2 – Some agreements exist but these are not formal / coordinated. Meetings are rare.
1 – The city DRR stakeholders have started to engage the private sector but this is at an early stage.
0 – No agreements or meetings.
United Nations Office for Disaster Risk Reduction Disaster Resilience Scorecard for Cities
49

6.1.3 Engagement of the insurance sector
Is the city engaging with the insurance sector to assess, mitigate and manage risk and stimulate a market for insurance products?
5 – Very substantial engagement for some years, city is actively collaborating.
4 – Some engagement but missing a thorough process for cross sector engagement.
3 – Engagement is happening, but only for the cities critical assets.
2 – Discussions have been initiated.
1 – The need for engagement with the insurance has been recognised, but no discussions have taken place yet.
0 – No engagement, no insurance.
As society’s traditional risk manager, the (re) insurance industry has significant expertise in the quantification and evaluation of complex risks and can play a highly-constructive role in assisting cities identify and respond to risks and build their resilience. The widespread availability of insurance within cities represents a crucial component of resilience due to insurance’s critical role in helping economies and communities ‘bounce back’ quickly from disasters and extreme events. Promoting urban resiliency is also a strategic imperative of the (re) insurance industry as it can help catalyze market growth, address under-insurance, reduce losses, enhance ‘license to operate’, and present opportunities for innovative risk transfer and insurance solutions. (Ref: WCCD and UNISDR, Towards Standardized City Indicators for Insurability & Resilience, July 2016).
6.1.4 Civil society links
To what extent does the city utilise and engage civil society organisations?
5 – City DRR stakeholders have in place comprehensive MOU agreements with various NGOs with NGO role defined in providing support in response, relief and meeting resource demands. High volunteer capacity as required. Regular planning and coordination meetings.
4 – The city works with NGOs and/or volunteers in various DRR capacities but this could be utilised even further. High volunteer capacity as required.
3 – The city works with NGOs and/or volunteers in some DRR capacities but this could improve. Modest volunteer capacity relative to the city needs.
2 – Some agreements exist but these are not formal / coordinated. Need for greater volunteer capacity.
1 – The city DRR stakeholders have started to engage NGO organisations and/or volunteers but this is at an early stage.
0 – No agreements / arrangements.
Engagement with volunteers is also an important way of enabling social capacity to respond (see Essential 7).
United Nations Office for Disaster Risk ReductionDisaster Resilience Scorecard for Cities
50

6.2 Public education and awareness
6.2.1 Exposure of public to education and awareness materials/messaging
Coordinated public relations and education campaign exists, with structured messaging, channels, and delivery.
5 – Systematic, structured campaign exists using at least 6 of the media at right, via neighbourhood mobilization (see Essential 7), and schools outreach.
4 – Campaign uses at least 5 of the media/channels above, including 1 of neighbourhood mobilization and schools outreach.
3 – Campaign uses at least 4 of the media/channels above; also, weighted to least informative such as radio and poster ads.
2 – Campaign uses 3 of the media/channels above; also weighted to least informative such as radio and poster ads.
1 – Ad hoc – no structured education and awareness campaign as such.
0 – No education work.
Likely to be based on information made public – see Essential 1.
Media may include:
• Print – books, newspapers, leaflets, fliers;• School and college teaching material;• TV – advertisements. Documentaries, news features;• Radio – as for TV;• Web – websites, advertisements, content on city web-
sites;• Mobile – as for web but also social media – Twitter,
Facebook, Weebo etc; Possibly also create specialist app for city’s disaster resilience information;
• Posters – on buildings, buses, trains, city offices.
Material may come from multiple agencies and sources, but should have coordinated messages.
Schools and colleges may be an especially important channel; also churches, neighbourhood groups, libraries.
6.2.1.1 Exposures per member of the public, per month to messaging
5 – Average 1 or more exposures per person per week, city-wide.
4 – Average 1 exposure per person per two weeks, city-wide.
3 – Average 1 exposure per person per month, city-wide.
2 – Average 1 exposure per person per quarter, city-wide.
1 – Average 1 exposure per person per six months, city-wide.
0 – Average 1 exposure per person per year or worse.
Exposures established, for example, via traffic counts (web sites, mobile), audience figures (TV, radio), road traffic counts (i.e., road traffic past posters), and so on.
If funds permit exposures could also be validated via survey.
United Nations Office for Disaster Risk Reduction Disaster Resilience Scorecard for Cities
51

6.3 Data capture, publication and sharing
6.3.1 Extent to which data on the city’s resilience position is shared with other organizations involved with the city’s resilience
Availability of a single “version of the truth” – a single integrated set of resilience data for practitioners.
5 – Full availability of the information listed at right on readiness and risk; fully shared with other organizations.
4 – Some minor gaps, or the information is in more than one place – but it is shared and it is at least linked to enable navigation.
3 – Some more significant gaps, for example on readiness; other organizations may have to “hunt around” to create a complete picture for themselves.
2 – Some significant information on readiness and risk is withheld from other organizations or is missing and/or badly fragmented across multiple websites.
1 – Information provision to other organizations on readiness and risk is rudimentary at best. Not possible to for those organizations to derive specific conclusions for themselves.
0 – No information.
Information to consider making open for other organizations to access might include:
• A summary of readiness – perhaps the outcomes of this Scorecard;
• An explanation of the hazards and perils that the city faces, and probabilities;
• A risk-map based summary (see Essential 2) of at-risk areas;
• A description of what building codes will protect against, and where these have been applied;
• A description of what businesses and other organizations should expect by way of disaster impacts, the city’s likely response and the implications for business continuity;
• A description of what businesses and other organizations need to do for themselves;
• Key roles and accountabilities in the city;• Planned investments that will affect the city’s resilience
position;• Further resources and contact details.
6.3.2 Extent to which data on the city’s resilience position is shared with the community organizations and public
Availability of a single “version of the truth” – a single integrated set of resilience data for citizens and community organizations containing at least the items shown at right.
5 – Full availability of the information listed at right on readiness and risk; fully shared with other community organizations and available to the public via website, mobile device etc.
4 – Some minor gaps, or the information is in more than one place – but it is shared and it is at least linked to enable navigation.
3 – Some more significant gaps, for example on readiness; other organizations or citizens may have to “hunt around” to create a complete picture for themselves.
2 – Some significant information on readiness and risk is withheld from other organizations or is missing and/or badly fragmented across multiple websites.
1 – Information provision to other community organizations and to citizens on readiness and risk is rudimentary at best. Not possible to for those organizations or citizens to derive specific conclusions for themselves or their neighbourhoods.
0 – No information.
Information to consider making open for public access might include:
• A summary of readiness – perhaps a summary of the outcomes of this Scorecard;
• An explanation of the hazards that the city is thought to face, and probabilities;
• A hazard-map based summary (see Essential 2) of at-risk areas;
• A description of what building codes will protect against, and where these have been applied;
• A description of what citizens should expect by way of disaster impacts, the city’s likely response and the implications for daily life;
• A description of citizens need to do for themselves and their families;
• Key roles and accountabilities in the city;• Planned investments that will affect the city’s – or a
neighbourhood’s - resilience;• Further resources and contact details.
United Nations Office for Disaster Risk ReductionDisaster Resilience Scorecard for Cities
52
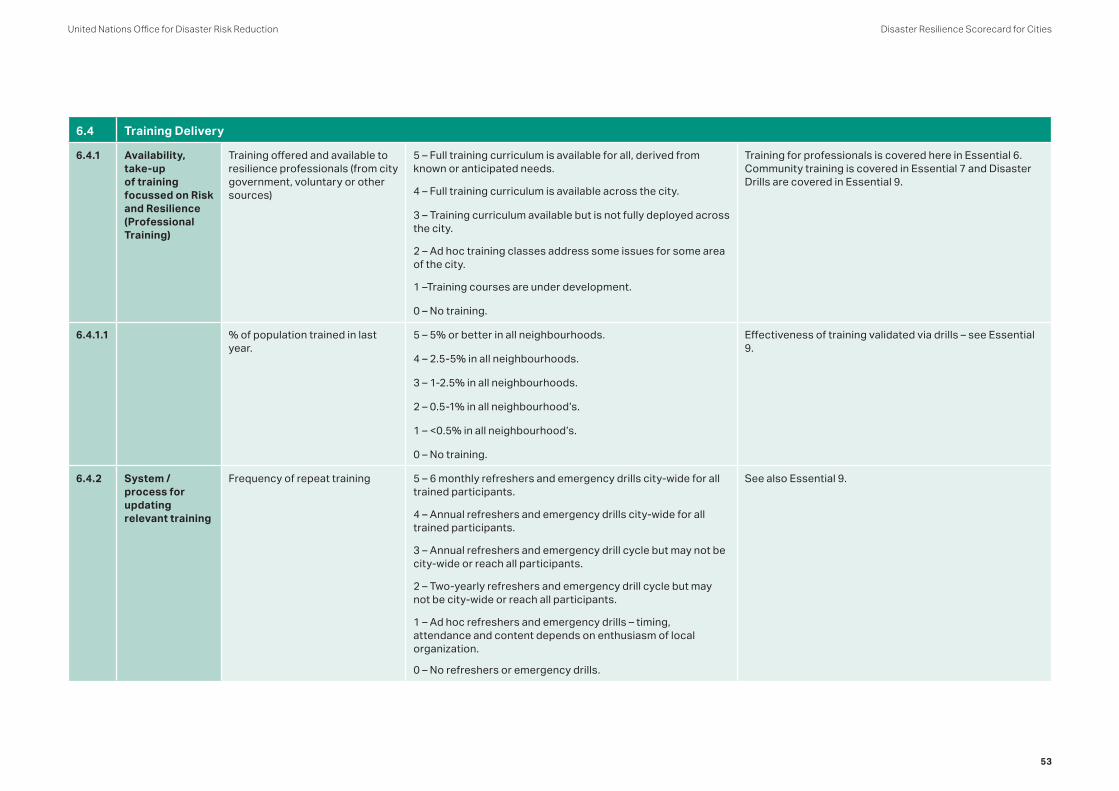
6.4 Training Delivery
6.4.1 Availability, take-up of training focussed on Risk and Resilience (Professional Training)
Training offered and available to resilience professionals (from city government, voluntary or other sources)
5 – Full training curriculum is available for all, derived from known or anticipated needs.
4 – Full training curriculum is available across the city.
3 – Training curriculum available but is not fully deployed across the city.
2 – Ad hoc training classes address some issues for some area of the city.
1 –Training courses are under development.
0 – No training.
Training for professionals is covered here in Essential 6. Community training is covered in Essential 7 and Disaster Drills are covered in Essential 9.
6.4.1.1 % of population trained in last year.
5 – 5% or better in all neighbourhoods.
4 – 2.5-5% in all neighbourhoods.
3 – 1-2.5% in all neighbourhoods.
2 – 0.5-1% in all neighbourhood’s.
1 – <0.5% in all neighbourhood’s.
0 – No training.
Effectiveness of training validated via drills – see Essential 9.
6.4.2 System / process for updating relevant training
Frequency of repeat training 5 – 6 monthly refreshers and emergency drills city-wide for all trained participants.
4 – Annual refreshers and emergency drills city-wide for all trained participants.
3 – Annual refreshers and emergency drill cycle but may not be city-wide or reach all participants.
2 – Two-yearly refreshers and emergency drill cycle but may not be city-wide or reach all participants.
1 – Ad hoc refreshers and emergency drills – timing, attendance and content depends on enthusiasm of local organization.
0 – No refreshers or emergency drills.
See also Essential 9.
United Nations Office for Disaster Risk Reduction Disaster Resilience Scorecard for Cities
53

6.5 Languages
6.5.1 Accessibility of education and training to all linguistic groups in the city
Availability of all education and training in all languages spoken in the city.
5 – Available for 100% of linguistic groups and 100% of the population.
4 – Available for 95% of the population irrespective of language.
3 – Available for 90% of the population irrespective of language.
2 – Available for 85% of the population irrespective of language.
1 – Available for 80% of the population irrespective of language.
0 – Available for <80% of the population irrespective of language.
Cities with high numbers of different languages may need to settle for a selection of languages that reaches everyone as a first or second language. Validation will be required that 100% of population is being reached in this way.
6.6 Learning from others
6.6.1 Effort taken to learn from what other cities, states and countries (and companies) do to increase resilience
Learning activities executed with other cities and other practitioners.
5 – Regular (say, annual) exchanges with other cities and regions, specifically to share understand and capture resilience best practices, issues, responses; and examples exist of changes made in the city as a result. Supplemented by regular peer-to-peer contacts with practitioners in other organizations.
4 – Regular exchanges but may be in the context of other meetings with sharing of best practices as a side-effect. Outcomes are captured and some impact may be identified on how the city prepares for disasters.
3 – Reliance only on networking by individual practitioners in the organization with their peers in other organizations. These can be frequent, and there will be some attempt to capture and implement learnings.
2 – Occasional exchanges of a more one-off or ad hoc nature. Impact on/benefit for the city is diffuse and harder to identify.1 – Even networking is limited and learning potential is therefore also limited.
0 – No attempt to learn from others.
These activities are focused on learning and improving – actual coordination of response management and resilience planning is covered in Essential 1.
Learning might be via a direct exchange with peer cities, or through industry groups, national resilience and emergency management forums, city groups such as 100RC, C40, ICLEI and others, or NGOs such as the UN.
United Nations Office for Disaster Risk ReductionDisaster Resilience Scorecard for Cities
54

ESSENTIAL
Understand and Strengthen Societal Capacity for Resilience
07

Ensure understanding and strengthening of societal capacity for resilience. Cultivate an environment for social connectedness which promotes a culture of mutual help through recognition of the role of cultural heritage and education in disaster risk reduction.
Essential 07: Understand and Strengthen Societal Capacity for Resilience
Social connectedness and a culture of mutual help have a major impact on the actual outcomes of disasters of any given magnitude. These can be encouraged by measures that include:
• Establishing and maintaining neighbourhood emergency response groups and training
• Engaging and co-opting civil society organizations– youth groups, clubs, religious groups, advocacy groups (e.g. for the disabled)
• Encouraging diversity to support decision making and outreach (e.g. gender, racial and ethnic, socioeconomic, geographic, academic, professional, political, sexual orientation and life experience.)
• Offering education, training and support to community groups
• Providing community groups with clear data on risk scenarios, the current level of response capabilities and thus the situation they may need to deal with.
• Undertaking formal or informal censuses of those who may be vulnerable and less able to help themselves, in each neighbourhood, and understanding from them what their needs are
• Using government engagements with the public such as welfare or social services visits and offices, police, libraries and museums to build awareness and understanding
• Engaging with employers as a communications channel with their workforces for disaster awareness, business continuity planning and training
• Engage local media in capacity building (TV, print, social media, etc.)
• Mobile (phone / tablet) and web-based systems of engagement (for example, crowdsourcing or disseminating data on preparedness)
• Translation of all materials into all languages used in the city
• Ensuring that the education curriculum within schools, higher education, universities and the workplace includes disaster awareness activities and training is a key element of social resilience – this is covered in Essential 6.
Data you will need to complete this assessment include: list of grass-roots organizations and information on their size, roles and how they operate; details of how the city works with disadvantaged groups – for example, those in areas of high poverty; transient or nomadic communities; slum/favela residents; the elderly; physically or mentally sick or disabled; children; non-native language speakers.
United Nations Office for Disaster Risk ReductionDisaster Resilience Scorecard for Cities
56

Detailed assessment
Ref Subject / Issue Question / Assessment Area Indicative measurement scale Comments
7.1 Community or “grass roots” organizations
7.1.1 Coverage of community or “grass roots” organization(s) throughout the city
Presence of at least one non-government body for pre and post event response for each neighbourhood in the city.
5 – Community organization(s) addressing full spectrum of disaster resilience issues exist(s) for every neighbourhood, irrespective of wealth, demographics etc.
4 – >75% of neighbourhoods covered.
3 – >50 -75% of neighbourhoods covered.
2 – >25-50% of neighbourhoods covered.
1 – Plans to engage neighbourhoods and maybe one or two initial cases.
0 – No engagement.
Community organizations may include:
• Those set up specifically for disaster resilience management (for example, community emergency response teams – CERT – in the US).
• Those serving some other purpose but willing and able to play a disaster resilience role: for example, churches, business Round Tables, youth organizations, food kitchens, neighbourhood watch, day centres and so on.
Community organizations should be willing and able to contribute to disaster resilience plans for their area based on the input of their members. They need to be seen as legitimate, and to cooperate with each other and the city government.
(Event response element is regularly tested at least in simulation exercises – see Essential 9).
7.1.2 Effectiveness of community network
Community organization meeting frequency and attendance.
5 – For >75% of neighbourhoods, one meeting per month, all personnel roles staffed and 10x formal role-holder numbers in regular attendance.
4 – For 50-75% of neighbourhoods, one meeting per quarter – all roles staffed and 5 x role-holder numbers in attendance. No meetings in the rest.
3 – For 25-50% of neighbourhoods, semi-annual meetings, but with some gaps in roles and less than 3x role-holders in attendance. No meetings in the rest.
2 – For 25-50% of neighbourhoods, annual meetings but with significant gaps in roles and less than 3x formal role-holders in attendance. No meetings in the rest.
1 – Ad hoc meetings in less than 25% of neighbourhoods, of a few “enthusiasts”.
0 – No meetings.
Community organizations defined as above.
United Nations Office for Disaster Risk Reduction Disaster Resilience Scorecard for Cities
57
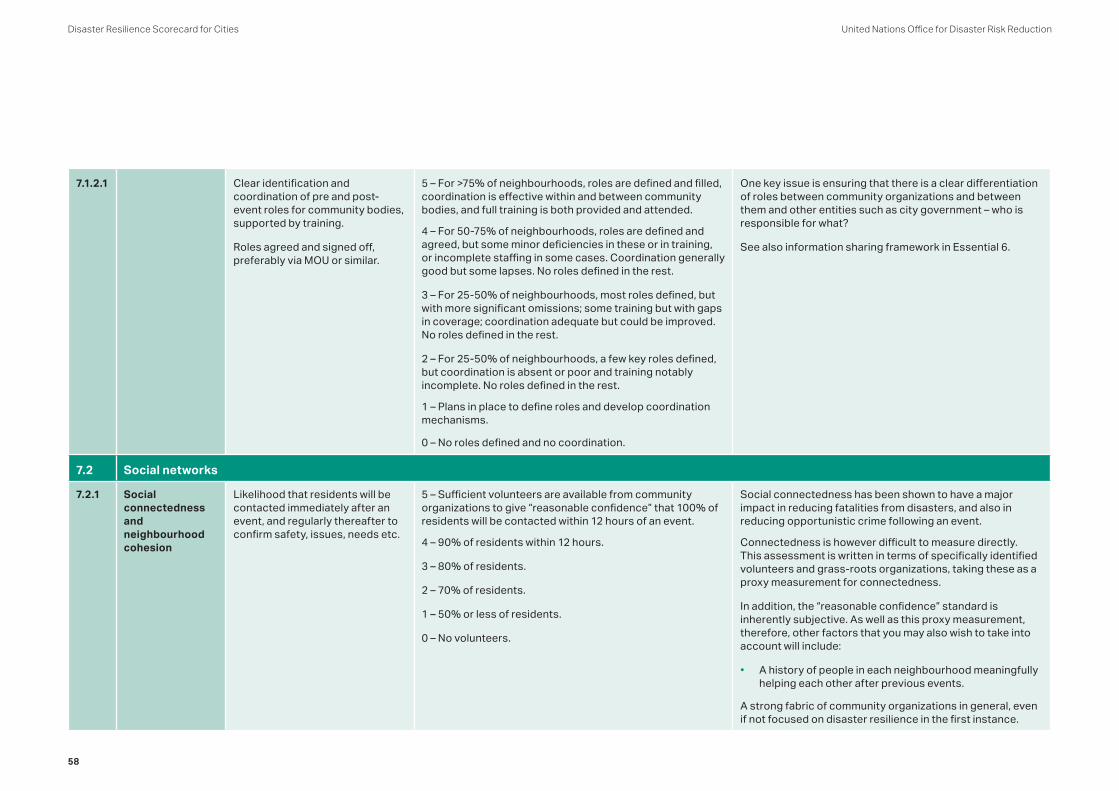
7.1.2.1 Clear identification and coordination of pre and post-event roles for community bodies, supported by training.
Roles agreed and signed off, preferably via MOU or similar.
5 – For >75% of neighbourhoods, roles are defined and filled, coordination is effective within and between community bodies, and full training is both provided and attended.
4 – For 50-75% of neighbourhoods, roles are defined and agreed, but some minor deficiencies in these or in training, or incomplete staffing in some cases. Coordination generally good but some lapses. No roles defined in the rest.
3 – For 25-50% of neighbourhoods, most roles defined, but with more significant omissions; some training but with gaps in coverage; coordination adequate but could be improved. No roles defined in the rest.
2 – For 25-50% of neighbourhoods, a few key roles defined, but coordination is absent or poor and training notably incomplete. No roles defined in the rest.
1 – Plans in place to define roles and develop coordination mechanisms.
0 – No roles defined and no coordination.
One key issue is ensuring that there is a clear differentiation of roles between community organizations and between them and other entities such as city government – who is responsible for what?
See also information sharing framework in Essential 6.
7.2 Social networks
7.2.1 Social connectedness and neighbourhood cohesion
Likelihood that residents will be contacted immediately after an event, and regularly thereafter to confirm safety, issues, needs etc.
5 – Sufficient volunteers are available from community organizations to give “reasonable confidence” that 100% of residents will be contacted within 12 hours of an event.
4 – 90% of residents within 12 hours.
3 – 80% of residents.
2 – 70% of residents.
1 – 50% or less of residents.
0 – No volunteers.
Social connectedness has been shown to have a major impact in reducing fatalities from disasters, and also in reducing opportunistic crime following an event.
Connectedness is however difficult to measure directly. This assessment is written in terms of specifically identified volunteers and grass-roots organizations, taking these as a proxy measurement for connectedness.
In addition, the “reasonable confidence” standard is inherently subjective. As well as this proxy measurement, therefore, other factors that you may also wish to take into account will include:
• A history of people in each neighbourhood meaningfully helping each other after previous events.
A strong fabric of community organizations in general, even if not focused on disaster resilience in the first instance.
United Nations Office for Disaster Risk ReductionDisaster Resilience Scorecard for Cities
58

7.2.2 Engagement of vulnerable groups of the population
Evidence of disaster resilience planning with or for the relevant groups covering the span of the vulnerable population.
Confirmation from those groups of effective engagement.
5 – All vulnerable groups are regularly engaged on disaster resilience issues and they or their representatives confirm as such.
4 – All major groups (measured by membership % of those defined as vulnerable in the city as a whole) are engaged – some minor gaps.
3 – One or more major gaps in coverage or effective engagement.
2 – Multiple gaps in coverage or effective engagement.
1 – Generalized failure to engage with vulnerable groups.
0 – No vulnerable groups specifically identified.
Vulnerable groups of the population might include, as examples:
• Those in areas of high poverty;• Transient or nomadic communities;• The elderly;• Physically or mentally sick or disabled;• Children;• Non-native language speakers.
Engagement may be through neighbourhood organizations or via specialist government organizations, charities, NGOs etc. These may also function as “grass roots” organizations (see above).
(Public awareness, education and training materials – see Essential 7).
7.3 Private sector / employers
7.3.1 Extent to which employers act as a channel with employees
Proportion of employers that pass resilience communications to employers, and allow limited time off for resilience volunteer activities.
5 – 50% of employers with more than 10 employees take part in communicating with their workforce about resilience issues/ 10% take part in resilience training and allow small amounts of time off for resilience volunteer activities.
4 – 40% / 8%.
3 – 30% / 5%.
2 – 20% / 3%.
1 – 10% / 1%.
0 – 0% / 0%.
Employees can act as an important communications conduit to employees on resilience issues, especially in the area of hazards faced and preparation – which are also likely to benefit them in the form of better continuity of operations after an event.
United Nations Office for Disaster Risk Reduction Disaster Resilience Scorecard for Cities
59
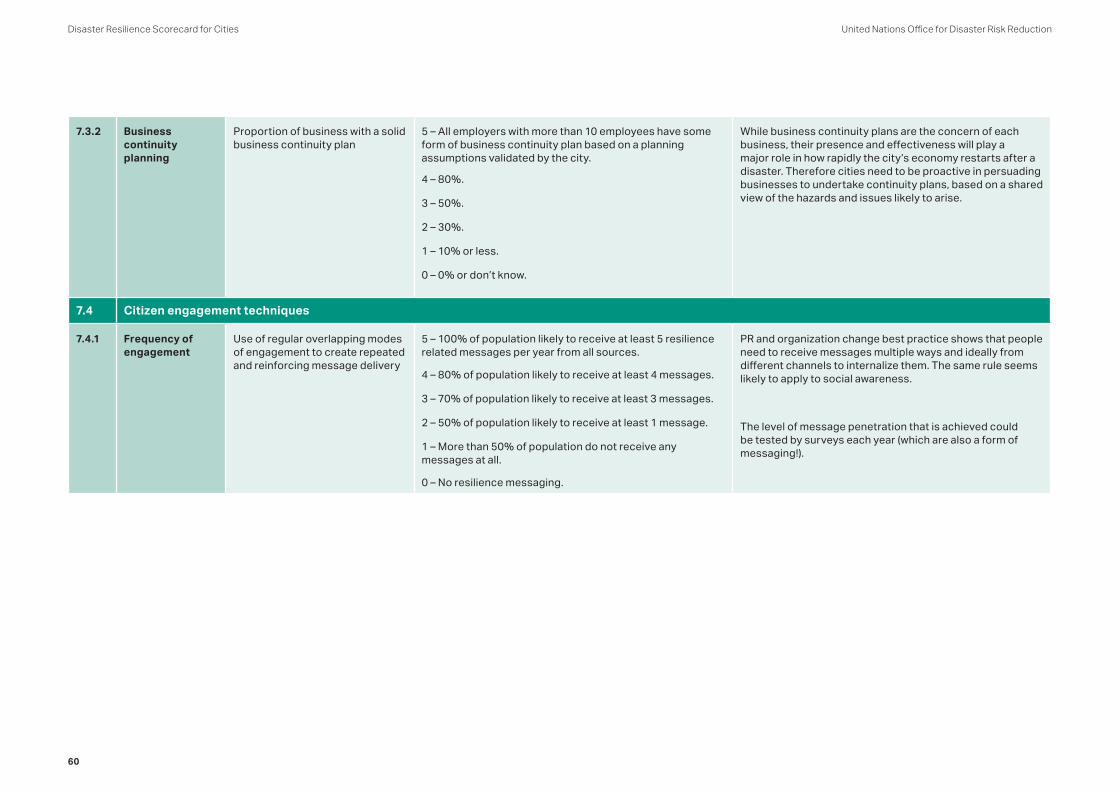
7.3.2 Business continuity planning
Proportion of business with a solid business continuity plan
5 – All employers with more than 10 employees have some form of business continuity plan based on a planning assumptions validated by the city.
4 – 80%.
3 – 50%.
2 – 30%.
1 – 10% or less.
0 – 0% or don’t know.
While business continuity plans are the concern of each business, their presence and effectiveness will play a major role in how rapidly the city’s economy restarts after a disaster. Therefore cities need to be proactive in persuading businesses to undertake continuity plans, based on a shared view of the hazards and issues likely to arise.
7.4 Citizen engagement techniques
7.4.1 Frequency of engagement
Use of regular overlapping modes of engagement to create repeated and reinforcing message delivery
5 – 100% of population likely to receive at least 5 resilience related messages per year from all sources.
4 – 80% of population likely to receive at least 4 messages.
3 – 70% of population likely to receive at least 3 messages.
2 – 50% of population likely to receive at least 1 message.
1 – More than 50% of population do not receive any messages at all.
0 – No resilience messaging.
PR and organization change best practice shows that people need to receive messages multiple ways and ideally from different channels to internalize them. The same rule seems likely to apply to social awareness.
The level of message penetration that is achieved could be tested by surveys each year (which are also a form of messaging!).
United Nations Office for Disaster Risk ReductionDisaster Resilience Scorecard for Cities
60
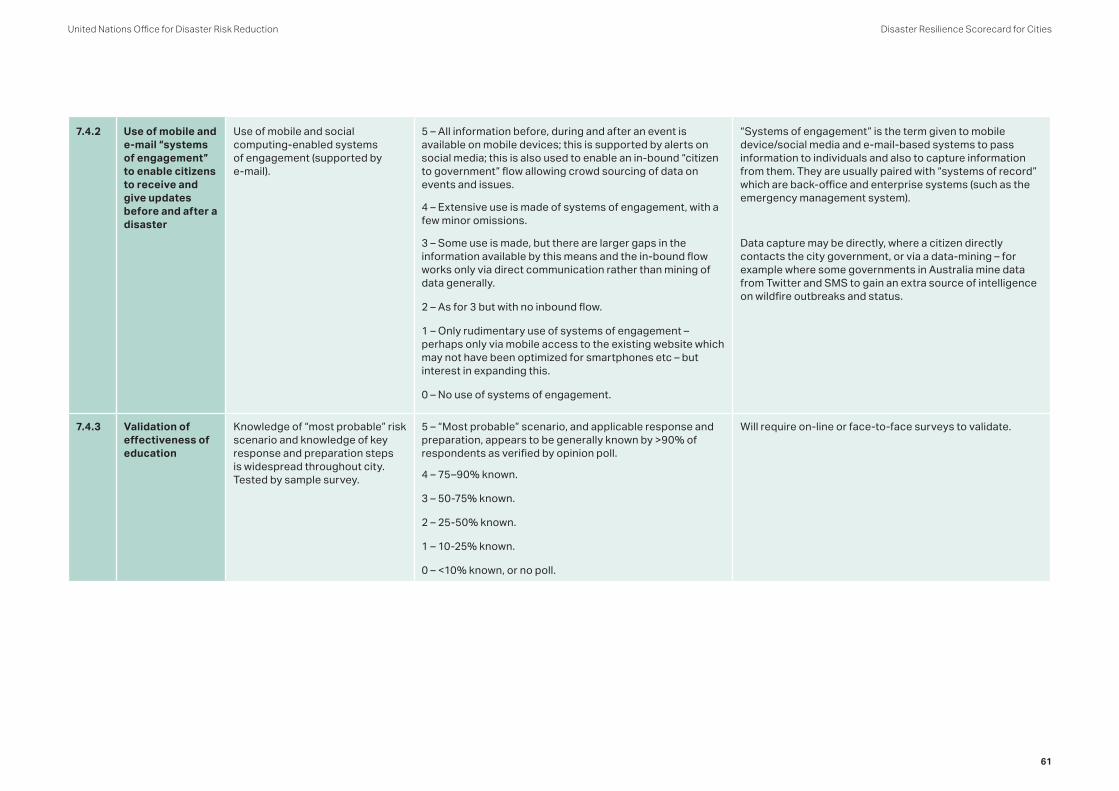
7.4.2 Use of mobile and e-mail “systems of engagement” to enable citizens to receive and give updates before and after a disaster
Use of mobile and social computing-enabled systems of engagement (supported by e-mail).
5 – All information before, during and after an event is available on mobile devices; this is supported by alerts on social media; this is also used to enable an in-bound “citizen to government” flow allowing crowd sourcing of data on events and issues.
4 – Extensive use is made of systems of engagement, with a few minor omissions.
3 – Some use is made, but there are larger gaps in the information available by this means and the in-bound flow works only via direct communication rather than mining of data generally.
2 – As for 3 but with no inbound flow.
1 – Only rudimentary use of systems of engagement – perhaps only via mobile access to the existing website which may not have been optimized for smartphones etc – but interest in expanding this.
0 – No use of systems of engagement.
“Systems of engagement” is the term given to mobile device/social media and e-mail-based systems to pass information to individuals and also to capture information from them. They are usually paired with “systems of record” which are back-office and enterprise systems (such as the emergency management system).
Data capture may be directly, where a citizen directly contacts the city government, or via a data-mining – for example where some governments in Australia mine data from Twitter and SMS to gain an extra source of intelligence on wildfire outbreaks and status.
7.4.3 Validation of effectiveness of education
Knowledge of “most probable” risk scenario and knowledge of key response and preparation steps is widespread throughout city. Tested by sample survey.
5 – “Most probable” scenario, and applicable response and preparation, appears to be generally known by >90% of respondents as verified by opinion poll.
4 – 75–90% known.
3 – 50-75% known.
2 – 25-50% known.
1 – 10-25% known.
0 – <10% known, or no poll.
Will require on-line or face-to-face surveys to validate.
United Nations Office for Disaster Risk Reduction Disaster Resilience Scorecard for Cities
61

Notes
United Nations Office for Disaster Risk ReductionDisaster Resilience Scorecard for Cities
62

ESSENTIAL
Increase Infrastructure Resilience
08

Assess the capacity and adequacy of, as well as linkages between, critical infrastructure systems and upgrade these as necessary according to risks identified in Essential 2.
Essential 08: Increase Infrastructure Resilience
This Essential addresses how critical infrastructure systems will cope with disasters the city might experience and developing contingencies to manage risks caused by these outcomes. This should be addressed through measures including, but not limited to:
• Assessment of capacity and adequacy in the light of the scenarios in Essential 2. Consider possible damage to parallel infrastructure (for example, impact on evacuation capacity if one of two roads out of a city is blocked), as well as linkages between different systems (for example, impact if a hospital loses its power or water supply).
• Liaising with, and building connections between infrastructure agencies (including those that may be in the private sector) to ensure resilience is considered appropriately in project prioritization, planning, design, implementation and maintenance cycles.
• Tendering and procurement processes that to include resilience criteria agreed upon by the city and stakeholders and is consistent throughout.
• For emergency management infrastructure, assessment of “surge” capacity, which refers to the ability to deal with suddenly increased loadings from law and order issues, casualties, evacuees, and so on.
Systematically triaged processes are also required for prioritization of retrofit or replacement of unsafe infrastructure. These are covered in Essential 2.
Critical infrastructure includes that required for the operation of the city and that required specifically for emergency response, where different. Infrastructure required for operation includes but is not limited to:
• Transport – roads, rail, airports and other ports
• Vehicle and heating fuel supplies
• Telecommunication systems
• Utilities systems (water, wastewater, electricity, gas, waste disposal)
• Health care centres, hospitals
• Schools and educational institutes
• Community centres, institutions
• Food supply chain
• Emergency response including ambulance, police and fire services
• Jails
• “Back office” administration – welfare payments, housing
• Computer systems and data supporting the above
• As resources allow, safety and survivability of cultural heritage sites and artefacts.
Infrastructure required for disaster response may include the above, and others such as:
• Emergency or incident command centres, and associated communications and monitoring/situation awareness systems – these may include cameras, sensors and crowdsourcing mechanisms such as reading of SMS and Twitter feeds
• Additional fire, police and ambulance vehicles
• National guard or other military services
• Earth and debris-removing equipment
• Pumps
• Generators
• Sports facilities, school buildings and so on that provide places of shelter
• Mortuaries
• Back-up computing facilities.
Data you will need to complete this section of the Scorecard will include: disaster resilience plans for each infrastructure system (each may be owned by one or more separate agencies), and data on execution of those plans; location of, and relationship between, critical assets, the populations they serve, and documentation linking their loss or damage to the scenarios in Essential 2. This data is likely to come from multiple organizations and completion of this section of the Scorecard will probably require engineering input.
United Nations Office for Disaster Risk ReductionDisaster Resilience Scorecard for Cities
64
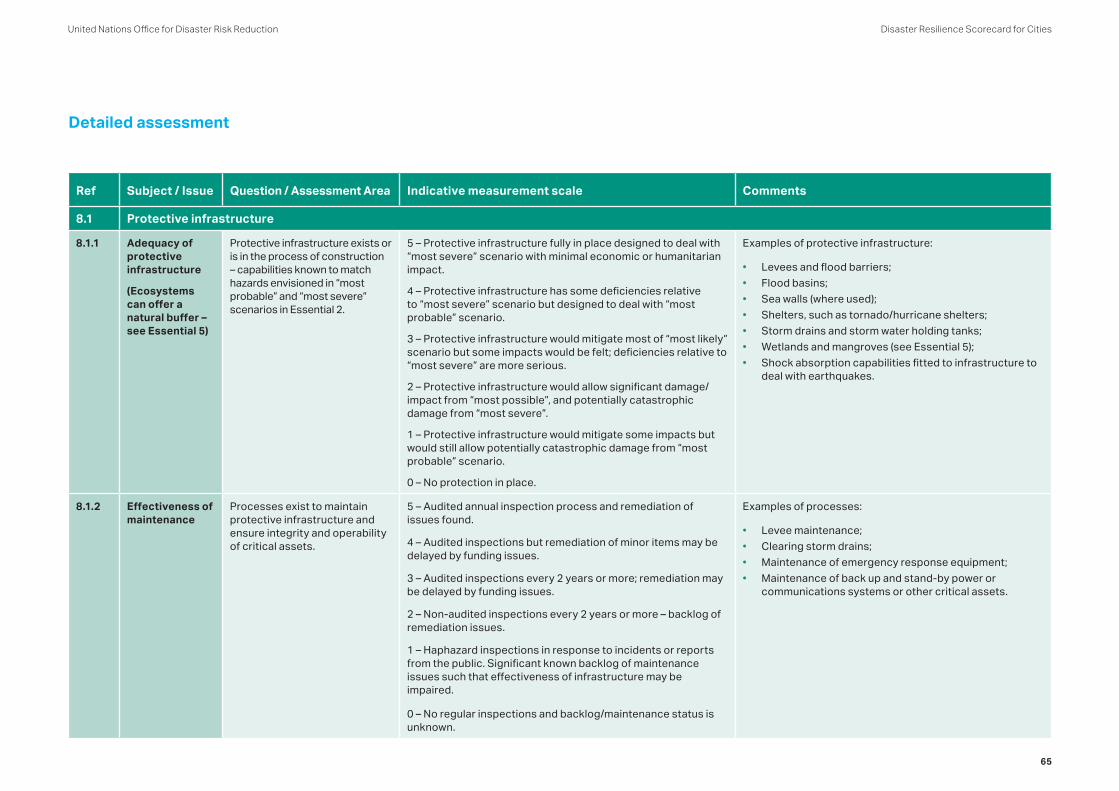
Detailed assessment
Ref Subject / Issue Question / Assessment Area Indicative measurement scale Comments
8.1 Protective infrastructure
8.1.1 Adequacy of protective infrastructure
(Ecosystems can offer a natural buffer – see Essential 5)
Protective infrastructure exists or is in the process of construction – capabilities known to match hazards envisioned in “most probable” and “most severe” scenarios in Essential 2.
5 – Protective infrastructure fully in place designed to deal with “most severe” scenario with minimal economic or humanitarian impact.
4 – Protective infrastructure has some deficiencies relative to “most severe” scenario but designed to deal with “most probable” scenario.
3 – Protective infrastructure would mitigate most of “most likely” scenario but some impacts would be felt; deficiencies relative to “most severe” are more serious.
2 – Protective infrastructure would allow significant damage/impact from “most possible”, and potentially catastrophic damage from “most severe”.
1 – Protective infrastructure would mitigate some impacts but would still allow potentially catastrophic damage from “most probable” scenario.
0 – No protection in place.
Examples of protective infrastructure:
• Levees and flood barriers;• Flood basins;• Sea walls (where used);• Shelters, such as tornado/hurricane shelters;• Storm drains and storm water holding tanks;• Wetlands and mangroves (see Essential 5);• Shock absorption capabilities fitted to infrastructure to
deal with earthquakes.
8.1.2 Effectiveness of maintenance
Processes exist to maintain protective infrastructure and ensure integrity and operability of critical assets.
5 – Audited annual inspection process and remediation of issues found.
4 – Audited inspections but remediation of minor items may be delayed by funding issues.
3 – Audited inspections every 2 years or more; remediation may be delayed by funding issues.
2 – Non-audited inspections every 2 years or more – backlog of remediation issues.
1 – Haphazard inspections in response to incidents or reports from the public. Significant known backlog of maintenance issues such that effectiveness of infrastructure may be impaired.
0 – No regular inspections and backlog/maintenance status is unknown.
Examples of processes:
• Levee maintenance;• Clearing storm drains;• Maintenance of emergency response equipment;• Maintenance of back up and stand-by power or
communications systems or other critical assets.
United Nations Office for Disaster Risk Reduction Disaster Resilience Scorecard for Cities
65
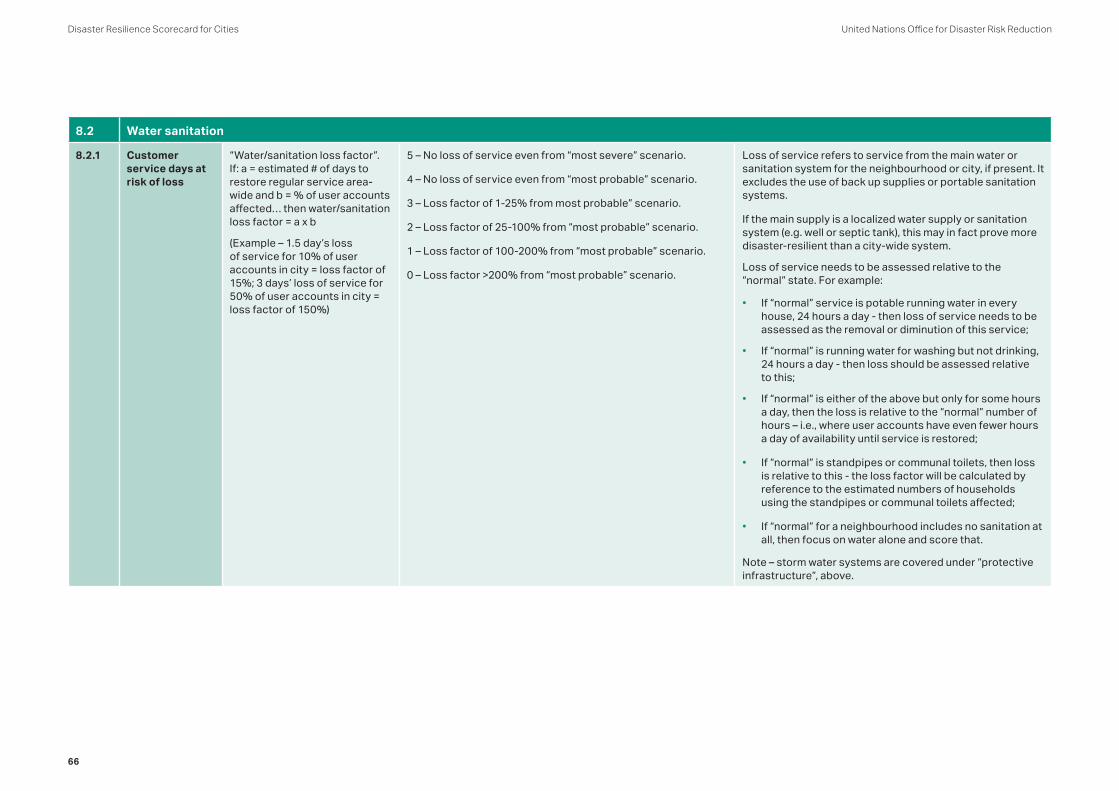
8.2 Water sanitation
8.2.1 Customer service days at risk of loss
“Water/sanitation loss factor”. If: a = estimated # of days to restore regular service area-wide and b = % of user accounts affected… then water/sanitation loss factor = a x b
(Example – 1.5 day’s loss of service for 10% of user accounts in city = loss factor of 15%; 3 days’ loss of service for 50% of user accounts in city = loss factor of 150%)
5 – No loss of service even from “most severe” scenario.
4 – No loss of service even from “most probable” scenario.
3 – Loss factor of 1-25% from most probable” scenario.
2 – Loss factor of 25-100% from “most probable” scenario.
1 – Loss factor of 100-200% from “most probable” scenario.
0 – Loss factor >200% from “most probable” scenario.
Loss of service refers to service from the main water or sanitation system for the neighbourhood or city, if present. It excludes the use of back up supplies or portable sanitation systems.
If the main supply is a localized water supply or sanitation system (e.g. well or septic tank), this may in fact prove more disaster-resilient than a city-wide system.
Loss of service needs to be assessed relative to the “normal” state. For example:
• If “normal” service is potable running water in every house, 24 hours a day - then loss of service needs to be assessed as the removal or diminution of this service;
• If “normal” is running water for washing but not drinking, 24 hours a day - then loss should be assessed relative to this;
• If “normal” is either of the above but only for some hours a day, then the loss is relative to the “normal” number of hours – i.e., where user accounts have even fewer hours a day of availability until service is restored;
• If “normal” is standpipes or communal toilets, then loss is relative to this - the loss factor will be calculated by reference to the estimated numbers of households using the standpipes or communal toilets affected;
• If “normal” for a neighbourhood includes no sanitation at all, then focus on water alone and score that.
Note – storm water systems are covered under “protective infrastructure”, above.
United Nations Office for Disaster Risk ReductionDisaster Resilience Scorecard for Cities
66

8.2.2 Designated critical asset service days (for example, service to hospitals or other critical assets) at risk of loss from water or sanitation failure
“Water/sanitation critical asset (WCA) loss factor”. If: a = estimated # of days to restore regular service area-wide and b = % of critical assets affected… then WCA loss factor = a x b
(Example – 1.5 day’s loss of service for 10% of critical assets in city = loss factor of 15%; 3 days’ loss of service for 50% of critical assets in city = loss factor of 150%)
5 – No loss of service even from “most severe” scenario.
4 – No loss of service even from “most probable” scenario.
3 – Loss factor of 1-25% from most probable” scenario.
2 – Loss factor of 25-100% from “most probable” scenario.
1 – Loss factor of 100-200% from “most probable” scenario.
0 – Loss factor >200% from “most probable” scenario.
Critical water or sanitation assets are those that are either:
• Essential for the operation of some part of the water or sanitation systems for the city;
• Essential for the functioning of some other critical asset (say, a hospital).
Loss of service refers to service from the main water or sanitation system for the neighbourhood or city, as above.
Service may be provided either from the asset itself or via a designated alternative/back-up.
8.2.3 Cost of restoration of service
Likely cost of lost service and restoration as % of annual billed revenue
5 – No loss of service.
4 – 10% of annual billed revenue.
3 – 10-15%.
2 – 15-25%.
1 – 25-50%.
0 – >50% of annual billed revenue.
This assessment is designed to help establish the return on investment from investing in hardening the relevant infrastructure, in reducing the burden of restoring the city to normal life after a disaster.
8.3 Energy - Electricity
8.3.1 Customer service days at risk of loss
“Electrical energy loss factor”. If: a = estimated # of days to restore regular service area-wide and b = % of user accounts affected…then electrical energy loss factor = a x b
(Example – 1.5 day’s loss of service for 10% of user accounts in city = loss factor of 15%; 3 days’ loss of service for 50% of user accounts in city = loss factor of 150%)
5 – No loss of service even from “most severe” scenario.
4 – No loss of service even from “most probable” scenario.
3 – Loss factor of 1-25% from most probable” scenario.
2 – Loss factor of 25-100% from “most probable” scenario.
1 – Loss factor of 100-200% from “most probable” scenario.
0 – Loss factor >200% from “most probable” scenario.
Loss of service refers to service from the main electricity supply. It excludes the use of backup generators.
Loss of service should be assessed relative to the “normal” state:
• If “normal” service is electricity 24 hours a day, then loss of service is anything that reduces this.
If “normal” service is electricity for less than 24 hours per day, then loss of service is anything that reduces this still further.
United Nations Office for Disaster Risk Reduction Disaster Resilience Scorecard for Cities
67

8.3.2 Designated critical asset service days at risk of loss from energy failure
“Electricity critical asset (ECA) loss factor”. If: a = estimated # of days to restore regular service area-wide and b = % of critical assets affected… then ECA loss factor = a x b
(Example – 1.5 day’s loss of service for 10% of critical assets in city = loss factor of 15%; 3 days’ loss of service for 50% of critical assets in city = loss factor of 150%)
5 – No loss of service even from “most severe” scenario.
4 – No loss of service even from “most probable” scenario.
3 – Loss factor of 1-25% from most probable” scenario.
2 – Loss factor of 25-100% from “most probable” scenario.
1 – Loss factor of 100-200% from “most probable” scenario.
0 – Loss factor >200% from “most probable” scenario.
Critical electrical assets are those that are either:
• Essential for the operation of some part of the energy grid for the city;
• Essential for the functioning of some other critical asset (say, a water treatment plant or a rail line).
Loss of service refers to service from the main electricity supply.
Service may be provided either from the asset itself or via a designated alternative/back-up.
8.3.3 Cost of restoration
Likely cost of lost service and restoration as % of annual billed revenue.
5 – No loss of service.
4 – 10% of annual billed revenue.
3 – 10-15%.
2 – 15-25%.
1 – 25-50%.
0 – >50% of annual billed revenue.
This assessment is designed to help establish the return on investment from investing in hardening the relevant infrastructure, in reducing the burden of restoring the city to normal life after a disaster.
8.4 Energy - Gas
8.4.1 Safety and integrity of gas system (if applicable)
Use of fracture resistant gas pipes in seismic or flood zones, and installation of automated shut-off capabilities.
5 – Full use: automated shut-offs on every property and 100% fracture resistant pipe.
4 – >90% of properties; 90% fracture resistant pipe if applicable.
3 – 75-90% in both cases.
2 – 50-75% in both cases.
1 – 1-50% in both cases.
0 – 0% in both cases.
Fracture resistant pipe: PVC pipe or similar.
If no mains gas system present – omit this assessment.
United Nations Office for Disaster Risk ReductionDisaster Resilience Scorecard for Cities
68

8.4.2 Customer service days at risk of loss
“Gas loss factor”. If: a = estimated # of days to restore regular service area-wide and b = % of user accounts affected… then gas loss factor = a x b.
(Example – 1.5 day’s loss of service for 10% of user accounts in city = loss factor of 15%; 3 days’ loss of service for 50% of user accounts in city = loss factor of 150%).
5 – No loss of service even from “most severe” scenario.
4 – No loss of service even from “most probable” scenario.
3 – Loss factor of 1-25% from “most probable” scenario.
2 – Loss factor of 25-100% from “most probable” scenario.
1 – Loss factor of 100-200% from “most probable” scenario.
0 – Loss factor >200% from “most probable” scenario.
Loss of service refers to those customer premises where mains (piped) gas is available.
If the main form of gas supply is bottles, this may prove more disaster-resilient than a piped (mains) supply. Bottled gas is dealt with under fuel supply, below.
“Loss of service” needs to be assessed relative to the “normal” state – for example, a significant drop in gas pressure relative to normal levels.
8.4.3 Designated critical asset service days at risk of loss from gas supply failure
“Gas critical asset (GCA) loss factor”. If: a = estimated # of days to restore regular service area-wide and b = % of critical assets affected… then GCA loss factor = a x b.
(Example – 1.5 day’s loss of service for 10% of critical assets in city = loss factor of 15%; 3 days’ loss of service for 50% of critical assets in city = loss factor of 150%).
5 – No loss of service even from “most severe” scenario.
4 – No loss of service even from “most probable” scenario.
3 – Loss factor of 1-25% from most probable” scenario.
2 – Loss factor of 25-100% from “most probable” scenario.
1 – Loss factor of 100-200% from “most probable” scenario.
0 – Loss factor >200% from “most probable” scenario.
Critical gas assets are those that are either:
• Essential for the operation of some part of mains gas system for the city;
• Essential for the functioning of some other critical asset (say, a power-station).
Service may be provided either from the asset itself or via a designated alternative/back-up.
8.4.4 Cost of restoration of service
Likely cost of lost service and restoration as % of annual billed revenue.
5 – No loss of service.
4 – 10% of annual billed revenue.
3 – 10-15%.
2 – 15-25%.
1 – 25-50%.
0 – >50% of annual billed revenue.
This assessment is designed to help establish the return on investment from investing in hardening the relevant infrastructure, in reducing the burden of restoring the city to normal life after a disaster.
United Nations Office for Disaster Risk Reduction Disaster Resilience Scorecard for Cities
69

8.5 Transportation
8.5.1 Road – service from road system at risk of loss
Road loss factor – If: a = miles of major road network for city and surrounding area at risk of becoming impassable to any type of vehicle after event and b = likely number of days estimated before reopening and c = total of major roads in the city and surrounding area lost for one day…then road loss factor = (a/c) x b as a %.
(Example - 10 miles of major road likely to be lost for two days, out of total of 100 miles of major road = road loss factor of 20% ((10/100) x 2).
5 – No loss of service even from “most severe” scenario.
4 – No loss of service even from “most probable” scenario.
3 – Loss factor of 1-25% from most probable” scenario.
2 – Loss factor of 25-100% from “most probable” scenario.
1 – Loss factor of 100-200% from “most probable” scenario.
0 – Loss factor >200% from “most probable” scenario.
Loss of service refers to general road mobility. It primarily refers to damage to road surfaces or bridges and tunnels, or from fallen debris from buildings, cliffs etc.
8.5.2 Road – survival of critical access and evacuation routes
Road critical asset (RCA) loss factor. If: a = carrying capacity (vehicles per hour) of evacuation/emergency supply routes to and from the city at risk of becoming impassable after event and b = # of days estimated before reopening and c = carrying capacity (vehicles per hour) of all designated critical evacuation/emergency supply routes… then RCA loss factor = (a/c) x b as a %.
(Example –route with carrying capacity of 1,000 vehicles per hour likely to be closed for 3 days, out of a total carrying capacity on all evacuation/ supply routes of 2,000 vehicles per hour = RCA loss factor of 150% ((1000/2000 x 3).
5 – No loss of service even from “most severe” scenario.
4 – No loss of service even from “most probable” scenario.
3 – Loss factor of 1-25% from most probable” scenario.
2 – Loss factor of 25-100% from “most probable” scenario.
1 – Loss factor of 100-200% from “most probable” scenario.
0 – Loss factor >200% from “most probable” scenario.
Loss of service on critical access and evacuation routes should if possible also include an estimate of the likely impact of traffic gridlock on access or evacuation rates.
Keep in mind that, if they give access to some critical asset, even minor access roads or suburban streets can become critical assets in their own right.
United Nations Office for Disaster Risk ReductionDisaster Resilience Scorecard for Cities
70

8.5.3 Rail/metro (if applicable) – service from rail system at risk of loss
Rail loss factor (for rail, use tons; for metro, use passengers). If: a = carrying capacity (tons or passengers per day) of affected rail lines to the city and b = # of days estimated before reopening and c = carrying capacity (tons per day per hour) of all rail links to the city…then RCA loss factor = (a/c) x b as a %.
Example – rail line with carrying capacity of 10,000 tons or passengers per day likely to be closed for 2 days, out of a total carrying capacity on all rail lines of 15,000 tons or passengers per day = RCA loss factor of 133% ((10000/15000 x 2).
5 – No loss of service even from “most severe” scenario.
4 – No loss of service even from “most probable” scenario.
3 – Loss factor of 1-25% from most probable” scenario.
2 – Loss factor of 25-100% from “most probable” scenario.
1 – Loss factor of 100-200% from “most probable” scenario.
0 – Loss factor >200% from “most probable” scenario.
Electrified rail lines are susceptible to energy outages (see above); and diesel lines are susceptible to fuel shortages (see below).
If no rail lines, omit this assessment.
8.5.4 Air (if applicable)
Airport loss factor. If: a = estimated # of flights in and out per day possible after the disaster and b = max # of flights per day in normal operations and c = # of days estimated before restoration of full capacity…then airport loss factor = (a/b) x c as a %.
Example if 80 flights in and out per day are possible after a disaster, compared with a normal maximum of 100, and it takes 2 days to restore full capacity, then the airport loss factor is 160% ((80/100) x 2).
5 – No loss of service even from “most severe” scenario.
4 – No loss of service even from “most probable” scenario.
3 – Loss factor of 1-25% from most probable” scenario.
2 – Loss factor of 25-100% from “most probable” scenario.
1 – Loss factor of 100-200% from “most probable” scenario.
0 – Loss factor >200% from “most probable” scenario.
If no airport, omit this assessment.
If multiple airports, combine capacities and scores. Airports should be capable of admitting commercial airliners or military transport aircraft - omit minor airfields.
United Nations Office for Disaster Risk Reduction Disaster Resilience Scorecard for Cities
71

8.5.5 River/Sea (if applicable)
River/seaport loss factor. If: a = estimated # of dockings per day possible after the disaster and b = max # of dockings per day in normal operations and c = # of days estimated before restoration of full capacity…then River/seaport loss factor = (a/b) x c as a %.
(Example if 5 dockings per day are possible after a disaster, compared with a normal maximum of 8, and it takes 2 days to restore full capacity, then the airport loss factor is 125% ((5/8) x 2).
Per port:
5 – No loss, even from “most severe” scenario.
4 – No loss, even from “most probable” scenario.
3 – 0.1-1 day from ”most probable” scenario.
2 – 1-2 days from ”most probable” scenario.
1 – 2-5 days from ”most probable” scenario.
0 – > 5 days.
If no river or seaports, omit this assessment.
8.5.6 Other public transport (if applicable)
(Buses and taxis effectively captured in road measures above).
5 – No loss of service even from “most severe” scenario.
4 – No loss of service even from “most probable” scenario.
3 – Loss factor of 1-10% from most probable” scenario.
2 – Loss factor of 20% from “most probable” scenario.
1 – Loss factor of 30% from “most probable” scenario.
0 – Loss factor >30% from “most probable” scenario.
Omit if not applicable.
8.5.7 Cost of restoration of service (all transport routes)
Likely cost of lost service and restoration.
5 – No loss of service.
4 – All routes / services can be restored / rebuilt within existing borrowing plans, e.g. without drawing on national budgets and without requiring a tax increase.
3 – 80% of routes / services can be restored / rebuilt within existing borrowing plans.
2 – 60% of routes / services can be restored / rebuilt within existing borrowing plans.
1 – 40% of routes / services can be restored / rebuilt within existing borrowing plans.
0 – >20% of routes / services can be restored / rebuilt within existing borrowing plans.
United Nations Office for Disaster Risk ReductionDisaster Resilience Scorecard for Cities
72

8.6 Communications
8.6.1 Service days at risk of loss
“Communications loss factor”. If, a = estimated # of days to restore regular service area-wide and b = % of user accounts affected… then communications loss factor = a x b (Example – 1.5 day’s loss of service for 10% of user accounts in city = loss factor of 15%; 3 days’ loss of service for 50% of user accounts in city = loss factor of 150%).
5 – No loss of service even from “most severe” scenario.
4 – No loss of service from “most probable” scenario.
3 – Loss factor of 1-25% from most probable” scenario.
2 – Loss factor of 25-100% from “most probable” scenario.
1 – Loss factor of 100-200% from “most probable” scenario.
0 – Loss factor >200% from “most probable” scenario.
Communications are arguably the most critical infrastructure of all, because all other infrastructures (as well as processes such as emergency response and public awareness) are likely to depend on them.
8.6.2 Designated critical asset service days at risk of loss from communications failure
“Communications critical asset (CCA) loss factor”. If
a = estimated # of days to restore regular service area-wide and b = % of critical assets affected… then CCA loss factor = a x b.
(Example – 1.5 day’s loss of service for 10% of critical assets in city = loss factor of 15%; 3 days’ loss of service for 50% of critical assets in city = loss factor of 150%).
5 – No loss of service even from “most severe” scenario.
4 – No loss of service from “most probable” scenario.
3 – Loss factor of 1-25% from most probable” scenario.
2 – Loss factor of 25-100% from “most probable” scenario.
1 – Loss factor of 100-200% from “most probable” scenario.
0 – Loss factor >200% from “most probable” scenario.
Critical communications assets might include, for example:
• Police or armed forces communications systems;• Water and energy sensing systems;• Traffic control systems;• Communication towers, transmitters, switches and
other nodal components of public phone systems;• Data- and switching-centres routing internet traffic.
Service may be provided either from the asset itself or via a designated alternative/back-up.
8.6.3 Cost of restoration
Likely cost of loss of service and restoration of communications system(s) as % of annual billed revenue.
5 – No loss of service.
4 – 10% of annual billed revenue.
3 – 10-15%.
2 – 15-25%.
1 – 25-50%.
0 – >50% of annual billed revenue.
This assessment is designed to help establish the return on investment from investing in hardening the relevant infrastructure, in reducing the burden of restoring the city to normal life after a disaster.
If a communications system does not have billed revenue (for example a private radio network), calculate cost to replace as % of initial installation cost of entire system. Use same thresholds as shown left.
United Nations Office for Disaster Risk Reduction Disaster Resilience Scorecard for Cities
73

8.7 Healthcare
8.7.1 Structural safety and disaster resilience of health care and emergency facilities
(Staffing/ first responders – see Essential 9)
“Bed days lost” – estimated # of beds at risk x number of days’ loss under “most probable” and “most severe” scenarios.
5 – No bed days lost even under “most severe” scenario.
4 – No bed days lost under “most probable” scenario.
3 – 1-5% of annual bed days lost from most probable” scenario.
2 – 5-10% of annual bed days lost from “most probable” scenario.
1 – 10-15% of annual bed days lost from “most probable” scenario.
0 –>15% of annual bed days lost from “most probable” scenario.
Healthcare may continue to be provided at the original facilities if they are sufficiently disaster resilient, or in designated alternative facilities (although moving patients is usually undesirable and the feasibility of this after a disaster needs to be considered).
8.7.1.1 “Critical bed days lost: estimated # of bed days for designated critical services (e.g. ER, dialysis, intensive care – TBD) at risk under “most probable” and “most severe” scenarios.
5 – No critical bed days lost even under “most severe” scenario.
4 – No critical bed days lost under “most probable” scenario.
3 – <2.5% of critical annual bed days lost from most probable” scenario.
2 – 2.5-5% of critical annual bed days lost from “most probable” scenario.
1 – 5-7.5% of critical annual bed days lost from “most probable” scenario.
0 – >7.5% of critical annual bed days lost from “most probable” scenario.
Healthcare may continue to be provided at the original facilities or in designated alternative facilities (although moving patients is usually undesirable, especially for those with critical injuries and the feasibility of this after a disaster needs to be considered).
8.7.2 Health records and data
% of patient and health system data and associated apps stored and accessible at location unlikely to be affected by the event.
5 – All critical healthcare data and associated apps routinely backed up and accessible within 1 hour at a remote site not known to be vulnerable to any events affecting the city.
4 – 95% or more of critical healthcare data, with associated apps.
3 – 90% or more of critical healthcare data, with associated apps.
2 – 85% or more of critical healthcare data, with associated apps.
1 – 80% or more of critical healthcare data, with associated apps.
0 – Less than 80% or more of critical healthcare data, with associated apps.
Healthcare data covers:
• Personal medical records and histories;• Dental records (may be needed for identification of
victims);• Critical operating data for healthcare facilities.
(Communications disaster resilience – see above).
Loss of data needs to be assessed relative to what pre-existed the disaster.
United Nations Office for Disaster Risk ReductionDisaster Resilience Scorecard for Cities
74

8.7.3 Availability of emergency healthcare including facilities and urgent medical supplies for acute needs
Sufficient acute healthcare capabilities exist to deal with expected major injuries.
5 – 100% of major injuries in “most probable” scenario; and 90% of major injuries in “most severe” scenario, can be treated within 6 hours.
4 – 100% of major injuries in “most probable” scenario; and 90% of major injuries in “most severe” scenario, can be treated within 12 hours.
3 – 100% of major injuries in “most probable” scenario; and 90% of major injuries in “most severe” scenario, can be treated within 18 hours.
2 – 100% of major injuries in “most probable” scenario; and 90% of major injuries in “most severe” scenario, can be treated within 24 hours.
1 – 100% of major injuries in “most probable” scenario; and 90% of major injuries in “most severe” scenario, can be treated within 36 hours.
0 – Longer than 36 hours, or no emergency healthcare capability.
This assessment needs to take into account estimated losses in critical bed days, above.
8.8 Education
8.8.1 Structural safety of education facilities
% of education structures at risk of damage from “most probable” and “most severe” scenarios.
5 – No teaching facilities at risk even from “most severe”.
4 – No teaching facilities at risk from “most probable”.
3 – 1-5% of teaching facilities at risk from “most probable”.
2 – 5-10% of teaching facilities at risk from “most probable”.
1 – 10-15% of teaching facilities at risk from “most probable”.
0 – >15% of teaching facilities at risk from “most probable”.
Some schools may be assessed as critical assets as they provide shelter – see Essential 9.
United Nations Office for Disaster Risk Reduction Disaster Resilience Scorecard for Cities
75
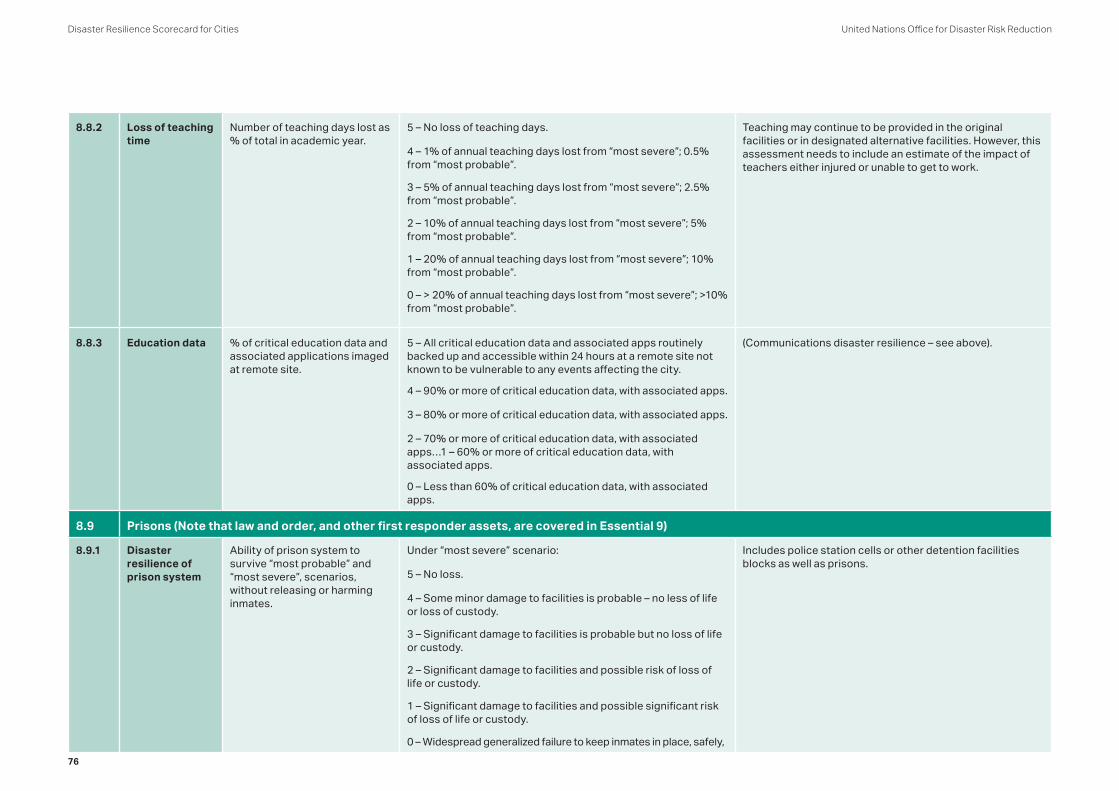
8.8.2 Loss of teaching time
Number of teaching days lost as % of total in academic year.
5 – No loss of teaching days.
4 – 1% of annual teaching days lost from “most severe”; 0.5% from “most probable”.
3 – 5% of annual teaching days lost from “most severe”; 2.5% from “most probable”.
2 – 10% of annual teaching days lost from “most severe”; 5% from “most probable”.
1 – 20% of annual teaching days lost from “most severe”; 10% from “most probable”.
0 – > 20% of annual teaching days lost from “most severe”; >10% from “most probable”.
Teaching may continue to be provided in the original facilities or in designated alternative facilities. However, this assessment needs to include an estimate of the impact of teachers either injured or unable to get to work.
8.8.3 Education data % of critical education data and associated applications imaged at remote site.
5 – All critical education data and associated apps routinely backed up and accessible within 24 hours at a remote site not known to be vulnerable to any events affecting the city.
4 – 90% or more of critical education data, with associated apps.
3 – 80% or more of critical education data, with associated apps.
2 – 70% or more of critical education data, with associated apps…1 – 60% or more of critical education data, with associated apps.
0 – Less than 60% of critical education data, with associated apps.
(Communications disaster resilience – see above).
8.9 Prisons (Note that law and order, and other first responder assets, are covered in Essential 9)
8.9.1 Disaster resilience of prison system
Ability of prison system to survive “most probable” and “most severe”, scenarios, without releasing or harming inmates.
Under “most severe” scenario:
5 – No loss.
4 – Some minor damage to facilities is probable – no less of life or loss of custody.
3 – Significant damage to facilities is probable but no loss of life or custody.
2 – Significant damage to facilities and possible risk of loss of life or custody.
1 – Significant damage to facilities and possible significant risk of loss of life or custody.
0 – Widespread generalized failure to keep inmates in place, safely,
Includes police station cells or other detention facilities blocks as well as prisons.
United Nations Office for Disaster Risk ReductionDisaster Resilience Scorecard for Cities
76

8.10 Administrative operations
8.10.1 Assurance of continuity of all critical administration functions
Estimated # of days’ disruption to critical administration services under “most probable” and “most severe” scenarios, given availability of redundant facilities, support staff etc.
5 – No disruption to services even under “most severe” scenario.
4 – No disruption to services under “most probable” scenario.
3 – Minor disruptions (few hours or less) under “most probable” scenario.
2 – Some significant disruptions for up to 48 hours or less under “most probable” scenario.
1 – Significant disruptions for 48 hours – 5 days under “most probable” scenario.
0 – Generalized failure of services for > 5 days.
Critical administration functions will include those that directly affect the well-being of the public or individuals. For example:
• Payment of food-stamps or unemployment benefit;• Housing offices;• Reporting of damage after the disaster;• Trash collection and disposal (impacts from road
closures are covered above).
(Healthcare and education – see above).
(Critical IT systems – see below).
The assessment of disruption is intended to apply at the neighbourhood level, for example with closure of or damage to neighbourhood offices.
8.11 Computer systems and data
8.11.1 Assurance of continuity of computer systems and data critical to government continuity
% of critical applications and associated data (to include social services and other personal records) imaged at, and accessible from, remote site.
5 – All critical apps and data routinely backed up and accessible within 1 hour at a remote site not known to be vulnerable to any events affecting the city.
4 – 90% or more of critical apps, with associated data.
3 – 80% or more of critical apps, with associated data.
2 – 70% or more of critical apps, with associated data.
1 – 60% or more of critical apps, with associated data.
0 – Less than 60% of critical apps, with associated data
This assessment is focused on the computer systems required for the critical administration functions identified above.
(Communications disaster resilience – see above).
(Health and Education data – see above).
8.11.2 Assurance of continuity of computer systems and data critical to any of the above infrastructure
% of critical applications and associated imaged at, and accessible from, remote site.
5 – All critical apps and data routinely backed up and accessible within 15 minutes at a remote site not known to be vulnerable to any events affecting the city.
4 – 90% or more of critical apps, with associated data.
3 – 80% or more of critical apps, with associated data.
2 – 70% or more of critical apps, with associated data.
1 – 60% or more of critical apps, with associated data.
0 – Less than 60% of critical apps, with associated data.
This assessment is focused on the SCADA systems, PLCs, control rooms, logistics and planning systems and so on that are required to maintain the operation of the infrastructure items above.
(Communications disaster resilience – see above).
(Health and Education data – see above).
United Nations Office for Disaster Risk Reduction Disaster Resilience Scorecard for Cities
77

Notes
United Nations Office for Disaster Risk ReductionDisaster Resilience Scorecard for Cities
78

ESSENTIAL
Ensure Effective Disaster Response
09

Building on the scenarios in Essential 2, ensure effective disaster response, for example by:
Essential 09: Ensure Effective Disaster Response
• Creating and regularly updating contingency and preparedness plans, communicated to all stakeholders through the structure in Essential 1 (especially including other levels of government and adjacent cities, infrastructure operators, community groups). Contingency plans to include law and order, providing vulnerable populations with food, water, medical supplies, shelter, and staple goods (e.g. for housing repairs).
• Developing and installing detection and monitoring equipment and early warning systems and effective associated communication systems to all stakeholders and community groups.
• Ensuring interoperability of emergency response systems in adjacent cities or counties, between agencies and with neighbouring cities.
• Holding regular training drills/tests and exercises for all aspects of the wider emergency response “system” including community elements and volunteers.
• Integration of risk reduction and emergency response with engineers, contractors, et al to be able to effectively and efficiently engage in preparedness, response and recovery operations.
• Coordinating and managing response activities and relief agencies’ inputs.
• Ensuring in advance that a viable mechanism will exist for the rapid, rational and transparent disbursement of funds after a disaster (Essential 10).
• Assigning and ring-fencing adequate contingency funds for post event response and recovery (Essential 3).
Data you will need to complete this section of the Scorecard (potentially from multiple organizations and agencies) will include: which warning systems exist and whom they will reach; emergency management plans and procedures that specifically consider the impact of the scenarios in section 3; documentation of first responder – staffing and equipment - capabilities; records of drills and practices; identification of systems where interoperability with other agencies is critical and of the standards adopted; and records of evaluations, learning points and improvements enacted.
United Nations Office for Disaster Risk ReductionDisaster Resilience Scorecard for Cities
80

Detailed assessment
Ref Subject / Issue Question / Assessment Area
Indicative measurement scale Comments
9.1 Early warning
9.1.1 Existence and effectiveness of early warning systems
Length and reliability of warning – enabling practical action to be taken.
5 – Warnings exist for all hazards known to be relevant to the city, and will allow time for reaction (as far as technology permits). Warnings are seen as reliable and specific to the city.
4 – Warnings exist but warning time maybe less than technology currently permits. Warnings are seen as reliable and specific.
3 – Some hazards, especially earthquakes, are excluded and warning time may be less than technology permits. (If earthquakes are the only hazard for your city, score 0).
2 – Warning time is less than technology permits and there may also be some false positives: reliability of warnings may therefore be perceived as questionable.
1 – Warnings seen as ad hoc and unreliable. Likely to be ignored.
0 – No warnings.
The technology of disaster warnings is rapidly evolving, both in the long-term assessment of risk (for example weather risk in the coming season) and the notification period and update frequency for a specific event (for example the progress of a flood crest down a river, or landslide risk, or tornado warnings).
Improved warning may enable an improved risk assessment in Essential 2, for example, by enabling better preparation or enabling more people to move from harm’s way.
However, while they are the focus of much research currently, meaningful earthquake warning systems do not currently exist for practical purposes. If earthquakes are the only hazard for your city, omit this assessment.
9.1.1.1 Reach of warning Will 100% of population receive it?
5 – 100% reached.
4 – 90-100% reached.
3 – 80-90% reached.
2 – 70-80% reached.
1 – 50-70% reached.
0 – <50% reached (or no warnings – see above).
This assessment refers to the specific warning of the imminent event. Other pre-event, and post event communications are dealt with in Essential 7.
Warnings should be delivered over the maximum possible notice period via multiple media, including phone, TV, radio, web, as well as sirens.
United Nations Office for Disaster Risk Reduction Disaster Resilience Scorecard for Cities
81

9.2 Event response plans
9.2.1 Existence of emergency response plans that integrate professional responders and community organizations
(For post-event response - see Essential 10)
Existence of plans formulated to address “most likely” and “most severe” scenarios, shared and signed off by all relevant actors (including citizen organizations
5 – Complete plans exist, keyed to scenarios referenced in Essential 2. They have been tested in real emergencies.
4 – Complete plans exist as above, but may not have been fully tested.
3 – Plans exist but are not keyed to scenarios referenced in Essential 2.
2 – Plans exist are known to be incomplete or otherwise deficient.
1 – Plans exist but are known to have major shortcomings.
0 – No plans.
Note – more strategic planning is covered in Essential 1 and Essential 10.
Emergency response plans will need to cover:
• Command and control - coordination with other agencies and cities, roles, responsibilities (see Essential 1);
• Evacuations (including hospitals, jails, etc.);• Communication systems;• Critical asset management (including likely “failure
chains” – see Essential 8);• Integration of private sector utilities covering
energy, water / sanitation, trash collection, communications etc;
• Medical response;• Law and order response;• Fire and rescue response;• Public information;• Triage policies.
Incorporation of contributions from citizen / grass roots organization.
Elements of emergency response plans may be linked to, and tested through, plans for “regular” events such as sporting fixtures, carnivals or parades (see below).
United Nations Office for Disaster Risk ReductionDisaster Resilience Scorecard for Cities
82

9.3 Staffing / responder needs
9.3.1 ‘Surge” capacity of police also to support first responder duties
Sufficient back-up or para-professional capacity to maintain law and order in “most severe” and “most probable” scenarios, in addition to supporting burden of first responder duties.
5 – Surge capacity exists and is tested either via actual events or practice drills for scenarios in Essential 2 – coverage of all neighbourhoods will be possible within 4 hours.
4 – Adequate surge capacity nominally exists but is untested.
3 – Surge capacity exists but is known or suspected to have minor inadequacies, perhaps in location, numbers. Coverage of all neighbourhoods within 4-12 hours.
2 – Coverage of all neighbourhoods within 12-48 hours.
1 – Coverage of all neighbourhoods within 48-72 hours.
0 – No surge capacity identified.
This capacity may come from other agencies such as the Army or civil defence force but needs to be confirmed via MOU or similar.
9.3.2 Definition of other first responder and other staffing needs, and availability
Staffing needs are defined for “most probable” and “most severe” scenarios.
5 – Needs defined, either from actual events or from practice drills for scenarios in Essential 2, taking into account the role of volunteers.
4 – Needs defined independently of latest scenarios.
3 – Some needs defined but with some gaps for specific professions or for specific areas of the city.
2 –Needs definition has more serious shortcomings.
1 –Needs definition is Essentially nominal or guesswork.
0 – No needs defined (or no plan – see above).
Different national response standards may apply in this area.
The category includes fire, ambulance, healthcare, neighbourhood support, key communications, energy and water utility staff and key highway staff. Parts of this capacity may come from other agencies such as the Army or civil defence force.
9.4 Equipment and relief supply needs
9.4.1 Definition of equipment and supply needs, and availability of equipment
Equipment and supply needs are defined for “most probable” and “most severe” scenarios in Essential 2
5 – Needs defined, keyed to scenarios from Essential 2, and take into account the role of volunteers.
4 – Needs defined independently of latest scenarios.
3 – Some needs defined but with some gaps for specific professions or for specific areas of the city.
2 –Needs definition has more serious shortcomings.
1 –Needs definition is Essentially nominal or guesswork.
0 – No needs defined (or no plan).
Equipment includes:
• Police, fire and ambulance vehicles, and fuel;• Helicopters, planes as applicable, and fuel;• Rescue equipment;• Medical supplies;• Bulldozers, excavators, debris trucks (may be
supplied by private organizations);• Pumps and generators;• Hand equipment – chainsaws, winches, shovels, etc;• Local emergency response IT systems, hand-held
devices.
(Medical/hospital needs – see Essential 8).
United Nations Office for Disaster Risk Reduction Disaster Resilience Scorecard for Cities
83

9.4.1.1 Estimated shortfall in available equipment per defined needs – potentially from multiple sources. MOUs exist for mutual aid agreements with other cities, and also for private sector sources.
5 – Equipment known to be available in line with defined needs for “most severe” scenario.
4 – Equipment known to be available in line with defined needs for “most probable” scenario.
3 – Shortfall of <5% of ideal equipment numbers for key items.
2 – Shortfall of 5-10% of ideal equipment numbers for key items.
1 – Shortfall of >10% of ideal equipment numbers for key items.
0 – No definition of needs – see above.
Equipment defined as above.
9.5 Food, shelter, staple goods and fuel supply
9.5.1 Likely ability to continue to feed population
“Food gap” - # of days that city can feed all segments of its population likely to be affected minus # of days’ disruption estimated under those scenarios.
Under “most severe” scenario:
5 – Positive outcome – days of emergency food available exceeds estimated days disruption to regular supply.
4 –Neutral outcome – days of food available equals estimated days’ disruption to regular supply.
3 – Negative outcome – estimated food gap is 24 hours.
2 – Negative outcome – estimated food gap is 48 hours.
1 – Negative outcome – estimated food gap is 72 hours.
0 – Negative outcome – estimated food gap is more than 72 hours.
Food = food and water. Needs to include certainty that food from other agencies is available, via MOU or similar.
9.5.2 Likely ability to meet needs for shelter/safe places
“Shelter gap” – numbers of displaced persons minus shelter places available within 24 hours.
Under “most severe” scenario:
5 – Positive outcome – shelter places available within 12 hours exceeds estimated need.
4 – Neutral outcome – shelter places available equal to estimated need.
3 – Negative outcome – shelter places available less than estimated need (shelter gap) by 5%.
2 – Negative outcome – estimated shelter gap is 10%.
1 – Negative outcome – estimated shelter gap is 15%.
0 – Negative outcome – estimated shelter gap is 20% or more.
Shelter may include existing structures likely to resist the disaster in question, by virtue of their strong construction and/or their location – sports stadia, school halls, shopping malls, parking garages and so on.
Shelters need to take account of separate needs of men, women, children, disabled.
Signage to, and for use within, shelters is also likely to be required.
Third-party owners of shelter facilities/safe places should be engaged via MOUs or similar.
United Nations Office for Disaster Risk ReductionDisaster Resilience Scorecard for Cities
84

9.5.2.1 “Shelter gap” – ability of shelters to withstand disaster events and remain safe and usable.
Under “most severe” scenario:
5 – All designated shelter places are assessed as likely to safely withstand a “most severe” event.
4 – 90% of shelter places are assessed as likely to safely withstand a “most severe” event.
3 – 80% of shelter places are assessed as likely to safely withstand a “most severe” event.
2 – 70% of shelter places are assessed as likely to protect users in “most severe” event.
1 – 50% of shelter places are assessed as likely to safely withstand a “most severe” event.
0 – Less than 50%, are assessed as likely to withstand a “most severe “event.
This applies to shelters in which people may have taken refuge prior to an event (for example a hurricane, where there will be some hours warning); or shelters to which people may be directed after the event.
9.5.3 Ability to meet likely needs for staple goods
“Staples gap” - % shortfall in supply within 24 hours relative to demand
Under “most severe” scenario:
5 – Positive outcome – supply of staples available within 12 hours exceeds estimated demand.
4 –Neutral outcome – supply equals estimated demand.
3 – Negative outcome – supply of five or more critical staples less than estimated demand (staples gap) by 5%.
2 – Negative outcome – estimated staples gap is 10%.
1 – Negative outcome – estimated staples gap is 15%.
0 – Negative outcome – estimated staples gap is 20% or more.
Cities will need to compile lists of critical staple items, as these are to some extent culturally or population-dependent. But they are likely to include:
• Sanitation;• Personal sanitary supplies and diapers;• Medications and first aid supplies;• Batteries;• Clothing;• Bedding;• Bottled gas for cooking, heating;• Materials for immediate repairs or weather-proofing
of housing.
In some countries these may be provided via private sector retailers, operating under MOU with the city or other government agency.
United Nations Office for Disaster Risk Reduction Disaster Resilience Scorecard for Cities
85

9.5.4 Likely availability of fuel
“Fuel gap” - # of days that city can meet fuel requirements, minus # of days’ disruption to regular supply.
Under “most severe” scenario:
5 – Positive outcome – days of fuel available exceeds estimated days’ disruption to supply.
4 –Neutral outcome – days of fuel available equals estimated days’ disruption to supply.
3 – Negative outcome – estimated disruption exceeds days of fuel available (fuel gap) by 24 hours.
2 – Negative outcome – estimated fuel gap is 48 hours.
1 – Negative outcome – estimated fuel gap is 72 hours.
0 – Negative outcome – estimated fuel gap is more than 72 hours.
Fuel – gasoline, diesel, as required for emergency vehicles, back up equipment, and personal and business transportation.
9.6 Interoperability and inter-agency working
9.6.1 Interoperability with neighbouring cities/states and other levels of government of critical systems and procedures
Ability to cooperate at all levels with neighbouring cities and other levels of government.
5 – Proven interoperability of all key systems and procedures.
4 – Interoperability in theory of all key systems but yet to be tested in practice.
3 – Some minor incompatibilities exist but are being addressed.
2 – Major incompatibilities but plan exists to address them.
1 – Major incompatibilities but no plan.
0 – Interoperability never assessed.
Critical first response systems and procedures will include those in the areas of communications, law and order, fire, first responder, food distribution, etc).
Interoperability needs to be assessed at multiple levels, including:
• Communications systems;• Data;• Emergency management applications;• Assumptions, rehearsed procedures and priorities;• Accountabilities (see Essential 1);• Territorial coverage.Physical asset characteristics (for example, fire hose widths for neighbouring fire departments; fuel compatibility for vehicles).
United Nations Office for Disaster Risk ReductionDisaster Resilience Scorecard for Cities
86

9.6.2 Emergency operations centre
Existence of emergency operations centre with participation from all agencies, automating standard operating procedures specifically designed to deal with “most likely” and “most severe” scenarios.
5 – Emergency operations centre exists with hardened communications and camera-enabled visibility of whole city, and with SOPs designed and proven to deal with “most severe” scenario; all relevant agencies participate.
4 – Emergency operations centre exists with hardened communications and camera-enabled visibility of whole city, and with SOPs designed and proven to deal with “most probable” scenario; all relevant agencies participate.
3 – Emergency operations centre exists with SOPs designed for “most probable” scenario (but may not be proven), most agencies participating but incomplete camera visibility or communications.
2 – Emergency operations centre exists but SOPs unproven, participation incomplete and poor camera visibility.
1 – Emergency operations centre designated but with significant generalized shortcomings.
0 – No emergency operations centre.
Operations centre needs itself to be highly disaster-resilient!
SOP = Standard operating procedures – pre-rehearsed processes and procedures for emergency response.
9.6.3 Coordination of post event recovery
Coordination arrangements identified in advance for all post-event activities in the city’s area, with clarity of roles and accountability across all relevant organizations.
Does an organizational chart documenting structure and role definitions at each relevant agency exist, to achieve a single overall point of co-ordination?
5 - There is a clear coordination of all relevant post-response activities. All roles and accountability are clearly defined between relevant organizations.
4 - There is some coordination of post-response activities in the city. However, overlapping roles exist and accountability is not clearly defined.
3 - Coordination of post-response activities is not sufficient. There is currently no clear identification of roles and accountability among relevant organizations in the city.
2 - The city (or focal point/institution) is currently in process of coordination of post-response activities, which will clearly identify roles and accountability among relevant organizations.
1 - The city is currently discussing to start a process to coordinate all post-response activities.
0 - There are currently no plans to coordinate post-response activities.
Also addressed in Essential 9.
As for 1.2.1 / 2 – the single point may be a person or a group.
Key activities will be:
• Day to day government (especially if provided by a stand-in entity such as the armed forces, a neighbouring state etc);
• Longer term management of rebuilding process – an organizational arrangement is needed for including all stakeholders including citizen groups.
One major issue will be the speed with which this organization can be assembled and begin operation. The post event organization should in effect be mobilized at the same time as the event response organization.
United Nations Office for Disaster Risk Reduction Disaster Resilience Scorecard for Cities
87

9.7 Drills
9.7.1 Practices and rehearsals – involving both the public and professionals
Testing of plans annually, by reference to simulated emergency and actual non-emergency events.
5 – Annual suite of drills validated by professionals to be realistic representation of “most severe” and “most probable” scenarios.
4 – Annual suite of drills broadly thought to be realistic.
3 – Annual suite of drills but not realistic in some significant respects.
2 – Less than annual drills.
1 – Ad hoc partial exercises – not all scenarios tested, not realistic.
0 – No exercises (or no plans – see above).
Drills to include use of/response to education and healthcare facilities.
Drills linked to public engagement and local training – see Essential 6.
Specific emergency drills may be supplemented by use of sporting events, rallies, parades and other local activities, and also minor versions of the disaster event (e.g. minor flooding, weaker earthquakes) to:
• Practice aspects of emergency response such as crowd management;
• Test carrying capacity of potential evacuation routes;
• Evaluate response and access times, etc. (These may also be used for disaster awareness).
9.7.2 Effectiveness of drills and training
Level of effectiveness of drills
5 – All professional and public participants in drills show strong evidence of having absorbed training.
4 – Most participants show evidence of having absorbed training, with some minor issues.
3 – One or more issues with training evident from outcome of drills.
2 – Several significant skills or knowledge gaps revealed.
1 – Drills indicate that city is broadly unprepared for disaster in terms of training and skills.
0 – No drills.
Requires evaluation of every drill after completion.
Training delivery and level of participation – see Essentials 6 & 7.
United Nations Office for Disaster Risk ReductionDisaster Resilience Scorecard for Cities
88

ESSENTIAL
Expedite Recovery and Build Back Better
10

Ensure sufficient pre-disaster plans according to risks identified, and that after any disaster, the needs of the affected are at the centre of recovery and reconstruction, with their support to design and implement rebuilding.
Essential 10: Expedite Recovery and Build Back Better
Building Back Better is a key element of the Sendai Framework and Ten Essentials. After any disaster there will be a need to:
• Ensure that the needs of disaster survivors and affected communities are placed at the centre of recovery and reconstruction, with support for them and their community organizations to design and rebuilding shelter, assets and livelihoods at higher standards of resilience.
• Planners should ensure that the recovery programmes are consistent with the long-term priorities and development of the disaster-affected areas.
Recovery, rehabilitation and reconstruction can, to a considerable degree, be planned ahead of the disaster. This is critical to building back better and making nations, cities and communities more resilient to disasters than they were before the event. Pre-disaster plans for post-event recovery should cover the following and with necessary capacity building, where relevant:
• Providing shelter, food, water, communication, addressing psychological needs, etc.
• Limiting and planning for any use of schools as temporary shelters.
• Identifying the dead and notifying next of kin.
• Debris clearing and management.
• Taking over abandoned property.
• Management of local, national and international aid and funding, and coordination of efforts and prioritizing and managing resources for maximum efficiency, benefit and transparency.
• Integration of further disaster risk reduction in all investment decisions for recovery and reconstruction.
• Business continuity and economic reboot.
• Learning loops: undertake retrospective/post-disaster assessments to assess potential new vulnerabilities and build learning into future planning and response activities.
Data you will need to answer this section of the Scorecard will include: post–event plans, potentially from multiple organizations and agencies.
United Nations Office for Disaster Risk ReductionDisaster Resilience Scorecard for Cities
90

Detailed assessment
Ref Subject / Issue Question / Assessment Area Indicative measurement scale Comments
10.1 Post event recovery planning – pre event
10.1.1 Planning for post event recovery and economic reboot
Existence of comprehensive post event recovery and economic reboot plans.
5 – Fully comprehensive plans exist addressing economic, infrastructure and community needs after “most probable” and “most severe” scenario.
4 – Fully comprehensive plans exist addressing economic, infrastructure and community needs after “most probable” scenario.
3 – Plans exist for post “most probable” event but with some shortfalls.
2 – Plans exist for post “most probable” event but with more significant shortfalls.
1 – Plans exist for post “most probable” event but with generalized inadequacy.
0 – No plan.
Comprehensive post event recovery plans will need to detail (not an exhaustive list):
• Interim arrangements for damaged facilities and homes anticipated from “most probable” and “most severe” scenarios;
• Locations and sources of temporary housing (if different from emergency shelters – see Essential 9);
• Triage policies for inspection, repairs and debris removal and preferred contractors;
• Counselling and personal support arrangements;• Community support arrangements – re-initiation of social
security, food and other benefits payments;• Economic “re-boot” arrangements – interim tax relief,
incentives, etc;• Improvements to city layout and operations sought as
rebuilding takes place, to reduce future risk; • Arrangements to ensure social equality – equality
of attention, inputs, funding, priority across all neighbourhoods;
• Code updates so that rebuilding can be immediate and to better standards than before;
• Directory of inspectors trained / accredited to assess building damage (particularly relating to red-flagging or red-tagging buildings after floods, storm damage or earthquakes);
• Directory of insurance loss adjustors.
Plans may be from several organizations, but these should be reviewed for consistency of assumptions and priorities.
(Post event organization structures – see Essential 1).
(Funding – see Essential 3).
United Nations Office for Disaster Risk Reduction Disaster Resilience Scorecard for Cities
91

10.1.2 Extent to which there has been stakeholder consultation around the ‘event recovery and reboot’ plans
Stakeholder involved in build back better plan.
5 – Yes – All relevant groups have been invited and attended. Stakeholders have been fully briefed on the process and receive regular bulletins on the progress of the plan.
4 – At least 8 of the 10 listed groups (right) have been engaged / consulted.
3 – At least 6 of the 10 listed groups have been engaged / consulted.
2 – At least 4 of the listed groups have been engaged / consulted.
1 – At least 2 of the listed groups were invited.
0 – No stakeholder engagement has been undertaken.
• The city emergency services;• The local health sector;• Utility providers including telecommunications;• Local businesses and scientific institutions;• NGOs;• Civil society organisations including minority group
representation;• Environmental sector;• Business interests;• Other relevant government tiers or agencies;• The wider city population in all neighbourhoods, both
formal and informal;• Local universities;• Scientific institutions / industry associations.
10.1.3 Shadow financial arrangements for processing incoming aid and disbursing funds
Post event arrangements exist for dealing with incoming financial aid and disbursements.
5 – Arrangements exist and are believed to be workable.
4 – Arrangements have some minor gaps but are believed to be workable.
3 – Arrangements have one or more significant gaps that may compromise aspects of workability.
2 – Arrangements have more significant shortfalls that place overall workability in doubt.
1 – Partial or incomplete arrangements only. Unlikely to be workable.
0 – No plan.
May be provided by national government, if still functional, or by a private sector organization such as an accounting firm.
United Nations Office for Disaster Risk ReductionDisaster Resilience Scorecard for Cities
92
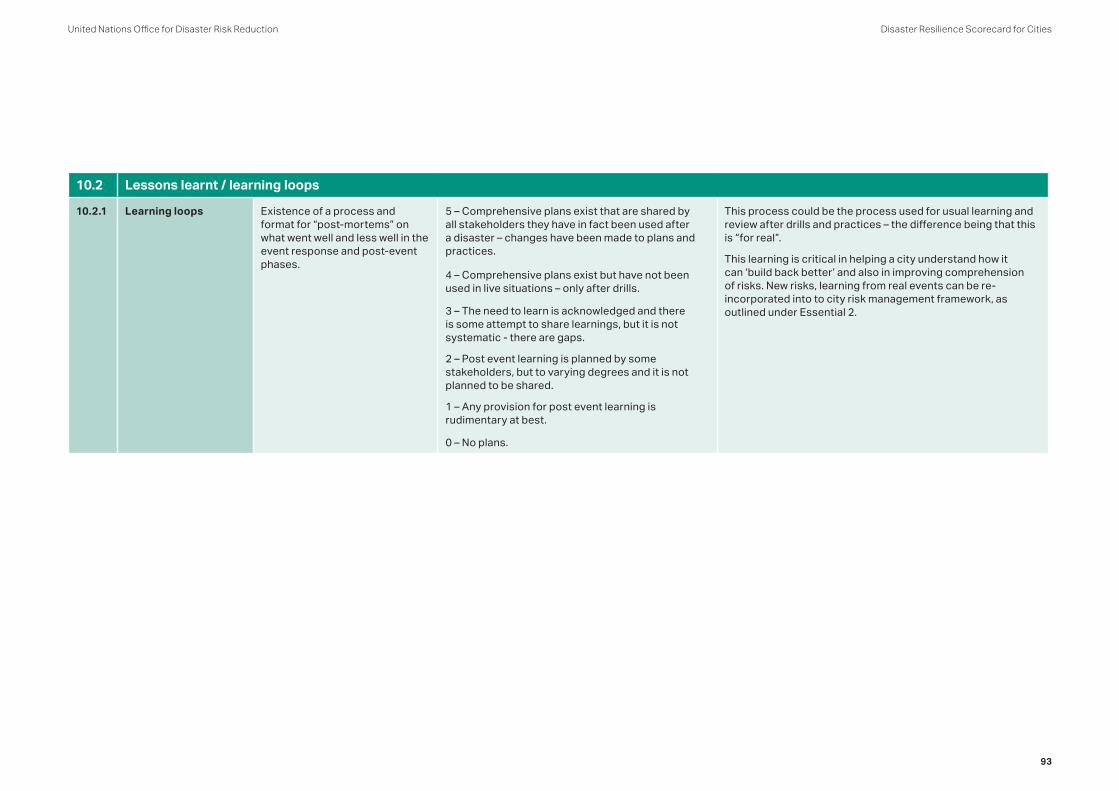
10.2 Lessons learnt / learning loops
10.2.1 Learning loops Existence of a process and format for “post-mortems” on what went well and less well in the event response and post-event phases.
5 – Comprehensive plans exist that are shared by all stakeholders they have in fact been used after a disaster – changes have been made to plans and practices.
4 – Comprehensive plans exist but have not been used in live situations – only after drills.
3 – The need to learn is acknowledged and there is some attempt to share learnings, but it is not systematic - there are gaps.
2 – Post event learning is planned by some stakeholders, but to varying degrees and it is not planned to be shared.
1 – Any provision for post event learning is rudimentary at best.
0 – No plans.
This process could be the process used for usual learning and review after drills and practices – the difference being that this is “for real”.
This learning is critical in helping a city understand how it can ‘build back better’ and also in improving comprehension of risks. New risks, learning from real events can be re-incorporated into to city risk management framework, as outlined under Essential 2.
United Nations Office for Disaster Risk Reduction Disaster Resilience Scorecard for Cities
93

Notes
United Nations Office for Disaster Risk ReductionDisaster Resilience Scorecard for Cities
94

Appendices
Disaster Resilience Scorecard for Cities
95
United Nations Office for Disaster Risk Reduction

Appendix 1: Glossary of Terminology
The majority of the definitions listed in this Glossary are taken from, and align with, definitions in Annex II from the “Recommendations of the Open-ended Intergovernmental Expert Working Group on Indicators and Terminology relating to Disaster Risk Reduction”, Open-ended intergovernmental expert working group on indicators and terminology relating to disaster risk reduction (Geneva, 29-30 September 2015, 10-11 February 2016 and 15-18 November 2016).
Acute shock Some natural or man-made event that causes a disaster. Acute shock is the direct focus of this Scorecard – but the resulting disasters may be made more severe, or more frequent, or the city may be rendered less able to respond, by underlying or chronic stress. Acute shock is one end of a continuum – the other being chronic stress
Affected People who are affected, either directly or indirectly, by a hazardous event. Directly affected are those who have suffered injury, illness or other health effects; who were evacuated, displaced, relocated or have suffered direct damage to their livelihoods, economic, physical, social, cultural and environmental assets.
Indirectly affected are people who have suffered consequences, other than or in addition to direct effects, over time due to disruption or changes in economy, critical infrastructures, basic services, commerce, work or social, health and psychological consequences.
Annotation: People can be affected directly or indirectly. Affected people may experience short-term or long- term consequences to their lives, livelihoods or health and in the economic, physical, social, cultural and environmental assets. In addition, people who are missing or dead may be considered as directly affected.
Build Back Better The use of the recovery, rehabilitation and reconstruction phases after a disaster to increase the resilience of nations and communities through integrating disaster risk reduction measures into the restoration of physical infrastructure and societal systems, and into the revitalisation of livelihoods, economies, and the environment.
Annotation: The term ‘societal’ will not be interpreted as political system of any country.
Building code A set of ordinances or regulations and associated standards intended to regulate aspects of the design, construction, materials, alteration and occupancy of structures which are necessary to ensure human safety and welfare, including resistance to collapse and damage.
Annotation: Building codes can include both technical and functional standards. They should incorporate the lessons of international experience and should be tailored to national and local circumstances. A systematic regime of enforcement is a critical supporting requirement for effective implementation of building codes.
United Nations Office for Disaster Risk ReductionDisaster Resilience Scorecard for Cities
96

Capacity The combination of all the strengths, attributes and resources available within an organization, community or society to manage and reduce disaster risks and strengthen resilience.
Annotation: Capacity may include infrastructure, institutions, human knowledge and skills, and collective attributes such as social relationships, leadership and management.
Coping capacity is the ability of people, organizations and systems, using available skills and resources, to manage adverse conditions, risk or disasters. The capacity to cope requires continuing awareness, resources and good management, both in normal times as well as during disasters or adverse conditions. Coping capacities contribute to the reduction of disaster risks.
Capacity assessment is the process by which the capacity of a group, organisation or society is reviewed against desired goals, where existing capacities are identified for maintenance or strengthening, and the capacity gaps are identified for further action.
Capacity development is the process by which people, organizations and society systematically stimulate and develop their capacities over time to achieve social and economic goals. It is a concept that extends the term of capacity building to encompass all aspects of creating and sustaining capacity growth over time. It involves learning and various types of training, but also continuous efforts to develop institutions, political awareness, financial resources, technology systems, and the wider enabling environment.
Contingency planning
A management process that analyses disaster risks and establishes arrangements in advance to enable timely, effective and appropriate responses.
Annotation: Contingency planning results in organized and coordinated courses of action with clearly identified institutional roles and resources, information processes, and operational arrangements for specific actors at times of need. Based on scenarios of possible emergency conditions or hazardous events, it allows key actors to envision, anticipate and solve problems that can arise during disasters. Contingency planning is an important part of overall preparedness. Contingency plans need to be regularly updated and exercised.
Critical administration functions
Critical administration functions will include those that directly affect the well-being of the public or individuals. For example: payment of food-stamps or unemployment benefit; housing offices; reporting of damage after the disaster; trash collection and disposal.
Critical asset Equipment, facility infrastructure or computer system/data that is critical to the functioning of the city, maintenance of public safety or disaster response. Critical assets are frequently interlinked and may form failure chains that need to be identified and managed.
Critical infrastructure
The physical structures, facilities, networks and other assets which provide services that are Essential to the social and economic functioning of a community or society.
Chronic stress Environmental degradation and other natural or man-made factors that cause underlying damage without directly leading to a full blown disaster. Examples might include issues such as over-use of groundwater, pollution or deforestation. Chronic stresses are not directly the focus of this Scorecard. They may however make disasters more likely, or more severe, or reduce the ability of the city to respond to them. Chronic stress is one end of a continuum – the other being acute shock.
United Nations Office for Disaster Risk Reduction Disaster Resilience Scorecard for Cities
97
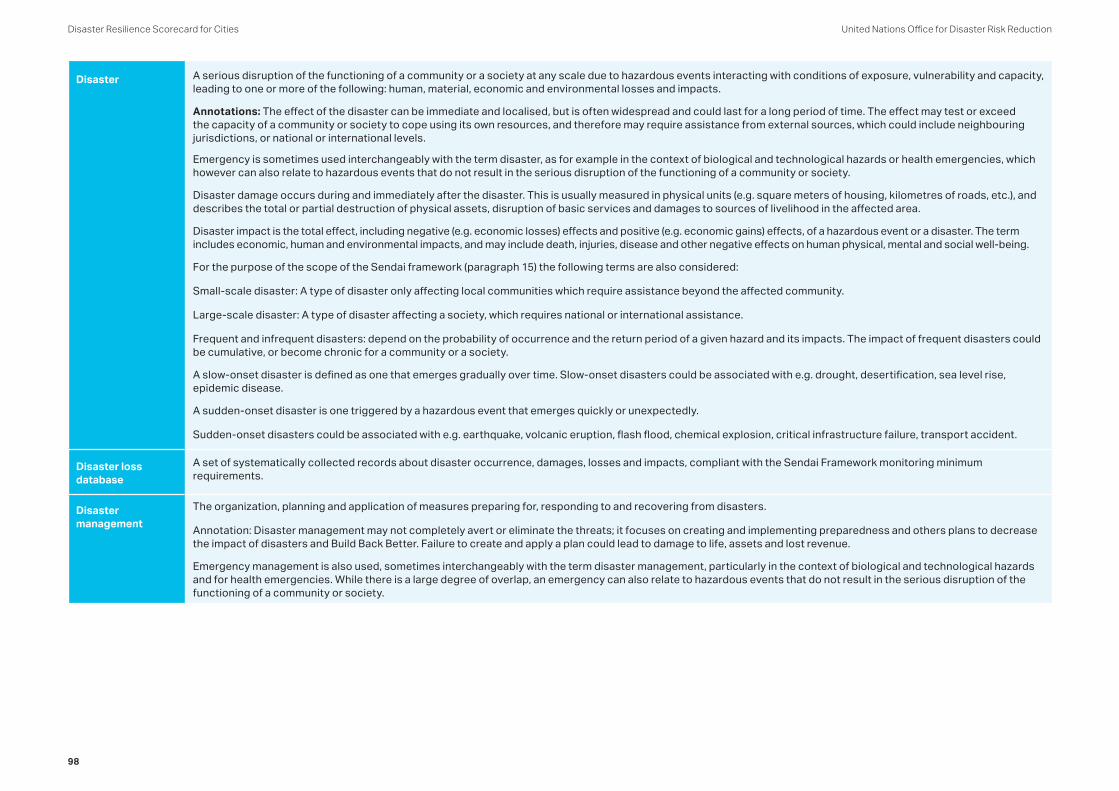
Disaster A serious disruption of the functioning of a community or a society at any scale due to hazardous events interacting with conditions of exposure, vulnerability and capacity, leading to one or more of the following: human, material, economic and environmental losses and impacts.
Annotations: The effect of the disaster can be immediate and localised, but is often widespread and could last for a long period of time. The effect may test or exceed the capacity of a community or society to cope using its own resources, and therefore may require assistance from external sources, which could include neighbouring jurisdictions, or national or international levels.
Emergency is sometimes used interchangeably with the term disaster, as for example in the context of biological and technological hazards or health emergencies, which however can also relate to hazardous events that do not result in the serious disruption of the functioning of a community or society.
Disaster damage occurs during and immediately after the disaster. This is usually measured in physical units (e.g. square meters of housing, kilometres of roads, etc.), and describes the total or partial destruction of physical assets, disruption of basic services and damages to sources of livelihood in the affected area.
Disaster impact is the total effect, including negative (e.g. economic losses) effects and positive (e.g. economic gains) effects, of a hazardous event or a disaster. The term includes economic, human and environmental impacts, and may include death, injuries, disease and other negative effects on human physical, mental and social well-being.
For the purpose of the scope of the Sendai framework (paragraph 15) the following terms are also considered:
Small-scale disaster: A type of disaster only affecting local communities which require assistance beyond the affected community.
Large-scale disaster: A type of disaster affecting a society, which requires national or international assistance.
Frequent and infrequent disasters: depend on the probability of occurrence and the return period of a given hazard and its impacts. The impact of frequent disasters could be cumulative, or become chronic for a community or a society.
A slow-onset disaster is defined as one that emerges gradually over time. Slow-onset disasters could be associated with e.g. drought, desertification, sea level rise, epidemic disease.
A sudden-onset disaster is one triggered by a hazardous event that emerges quickly or unexpectedly.
Sudden-onset disasters could be associated with e.g. earthquake, volcanic eruption, flash flood, chemical explosion, critical infrastructure failure, transport accident.
Disaster loss database
A set of systematically collected records about disaster occurrence, damages, losses and impacts, compliant with the Sendai Framework monitoring minimum requirements.
Disaster management
The organization, planning and application of measures preparing for, responding to and recovering from disasters.
Annotation: Disaster management may not completely avert or eliminate the threats; it focuses on creating and implementing preparedness and others plans to decrease the impact of disasters and Build Back Better. Failure to create and apply a plan could lead to damage to life, assets and lost revenue.
Emergency management is also used, sometimes interchangeably with the term disaster management, particularly in the context of biological and technological hazards and for health emergencies. While there is a large degree of overlap, an emergency can also relate to hazardous events that do not result in the serious disruption of the functioning of a community or society.
United Nations Office for Disaster Risk ReductionDisaster Resilience Scorecard for Cities
98

Disaster Risk The potential loss of life, injury, destroyed or damaged assets which could occur to a system, society or a community in a specific period of time, determined probabilistically as a function of hazard, exposure, vulnerability and capacity.
Annotation: The definition of disaster risk reflects the concept of hazardous events and disasters as the outcome of continuously present conditions of risk. Disaster risk comprises different types of potential losses which are often difficult to quantify. Nevertheless, with knowledge of the prevailing hazards and the patterns of population and socio-economic development, disaster risks can be assessed and mapped, in broad terms at least.
It is important to consider the social and economic contexts in which disaster risks occur and that people do not necessarily share the same perceptions of risk and their underlying risk factors.
Acceptable risk, or tolerable risk, is therefore an important sub-term; the extent to which a disaster risk is deemed acceptable or tolerable depends on existing social, economic, political, cultural, technical and environmental conditions. In engineering terms, acceptable risk is also used to assess and define the structural and non- structural measures that are needed in order to reduce possible harm to people, property, services and systems to a chosen tolerated level, according to codes or “accepted practice” which are based on known probabilities of hazards and other factors.
Residual risk is the disaster risk that remains even when effective disaster risk reduction measures are in place, and for which emergency response and recovery capacities must be maintained. The presence of residual risk implies a continuing need to develop and support effective capacities for emergency services, preparedness, response and recovery together with socio-economic policies such as safety nets and risk transfer mechanisms, as part of a holistic approach.
Disaster risk governance
The system of institutions, mechanisms, policy and legal frameworks and other arrangements to guide, coordinate and oversee disaster risk reduction and related areas of policy.
Annotation: Good governance needs to be transparent, inclusive, collective, and efficient to reduce existing disaster risks and avoid creating new ones.
Disaster risk management
Disaster risk management is the application of disaster risk reduction policies and strategies to prevent new disaster risk, reduce existing disaster risk and manage residual risk, contributing to the strengthening of resilience and reduction of disaster losses.
Annotation: Disaster risk management actions can be distinguished between prospective disaster risk management, corrective disaster risk management, and compensatory disaster risk management, also called residual risk management.
Prospective disaster risk management activities address and seek to avoid the development of new or increased disaster risks. They focus on addressing disaster risks that may develop in future if disaster risk reduction policies are not put in place; examples are better land-use planning or disaster-resistant water supply systems.
Corrective disaster risk management activities address and seek to remove or reduce disaster risks which are already present and which need to be managed and reduced now. Examples are the retrofitting of critical infrastructure or the relocation of exposed populations or assets.
Compensatory disaster risk management activities strengthen the social and economic resilience of individuals and societies in the face of residual risk that cannot be effectively reduced. They include preparedness, response and recovery activities, but also a mix of different financing instruments, such as national contingency funds, contingent credit, insurance and reinsurance, and social safety nets.
Community Based disaster risk management promotes the involvement of potentially affected communities in disaster risk management at the local level. This includes community assessments of hazards, vulnerabilities and capacities, and their involvement in planning, implementation, monitoring and evaluation of local action for disaster risk reduction.
Local and indigenous peoples approach to disaster risk management is the recognition and use of traditional, indigenous and local knowledge and practices to complement scientific knowledge in disaster risk assessments and for the planning and implementation of local disaster risk management.
Disaster risk management plans set out the goals and specific objectives for reducing disaster risks together with related actions to accomplish these objectives. They should be guided by the Sendai Framework and considered and coordinated within relevant development plans, resource allocations and programme activities. National level plans need to be specific to each level of administrative responsibility and adapted to the different social and geographical circumstances that are present. The time frame and responsibilities for implementation and the sources of funding should be specified in the plan. Linkages to sustainable development and climate change adaptation plans should be made where possible.
United Nations Office for Disaster Risk Reduction Disaster Resilience Scorecard for Cities
99

Disaster risk reduction
Disaster risk reduction is aimed at preventing new and reducing existing disaster risk and managing residual risk, all of which contributes to strengthening resilience and therefore to the achievement of sustainable development.
Annotation: Disaster risk reduction is the policy objective of disaster risk management and its goals and objectives are defined in disaster risk reduction strategies and plans.
Disaster risk reduction strategies and policies define goals and objectives across different timescales and with concrete targets, indicators and time frames. In line with the Sendai Framework, these should be aimed at preventing the creation of disaster risk, the reduction of existing risk and the strengthening of economic, social, health and environmental resilience.
A global, agreed policy of disaster risk reduction is set out in the United Nations’ endorsed “Sendai Framework for Disaster Risk Reduction 2015-2030”, adopted in March 2015, whose expected outcome over the next 15 years is: “The substantial reduction of disaster risk and losses in lives, livelihoods and health and in the economic, physical, social, cultural and environmental assets of persons, businesses, communities and countries”.
Disaster Resilience The ability to mitigate and recover from disaster events. A subset of the wider concept of resilience. (See Resilience)
Early warning system
An integrated system of hazard monitoring, forecasting and prediction, disaster risk assessment, communication and preparedness activities systems and processes that enables individuals, communities, governments, businesses and others to take timely action to reduce disaster risks in advance of hazardous events.
Annotations: Effective “end-to-end” and “people-centred” early warning system may include four interrelated key elements: 1) disaster risk knowledge based on the systematic collection of data and disaster risk assessments; 2) detection, monitoring, analysis and forecasting of the hazards and possible consequences; 3) dissemination and communication by an official source, of authoritative, timely, accurate and actionable warnings and associated information on likelihood and impact; and 4) preparedness at all levels to respond to the warnings received. These four interrelated components need to be coordinated within and across sectors and multiple levels for the system to work effectively and to include feedback mechanism for continuous improvement. Failure in one component or lack of coordination across them could lead to the failure of the whole system.
Multi-hazard early warning systems cover a range of hazards and impacts. They are designed to be used in multi-hazard contexts where hazardous events may occur simultaneously, cascadingly or cumulatively over time, and taking into account the potential interrelated effects. A multi-hazard early warning system increases the efficiency and consistency of warnings through coordinated and compatible mechanisms and capacities, involving multiple disciplines for updated and accurate hazards identification and monitoring for multiple hazards. Multi hazard early warning systems address several hazards and/or impacts of similar or different type in context where hazardous events may occur alone, simultaneously or cumulatively over time, and taking into account the potential inter-related effects. A multi-hazard early warning system with the ability to warn of one or more hazards increased the efficiency and consistency of warnings through coordinated and compatible mechanisms and capacities, involving multiple disciplines for updated and accurate hazards identification and monitoring.
Economic loss Total economic impact that consists of direct economic loss and indirect economic loss. Direct economic loss: the monetary value of total or partial destruction of physical assets existing in the affected area. Direct economic loss is nearly equivalent to physical damage. Indirect economic loss: a decline in economic value added as a consequence of direct economic loss and/or human and environmental impacts.
Annotations: Example of physical assets that are the basis for calculating direct economic loss include homes, schools, hospitals, commercial and governmental buildings, transport, energy, telecommunications infrastructures and other infrastructure; business assets and industrial plants; production such as crops, livestock and production infrastructure. They may also encompass environmental assets and cultural heritage.
Direct economic loss usually happen during the event or within the first few hours after the event and are often assessed soon after the event to estimate recovery cost and claim insurance payments. These are tangible and relatively easy to measure.
Indirect economic loss includes micro-economic impacts (e.g. revenue declines owing to business interruption), meso-economic impacts (e.g. revenue declines owing to impacts on natural assets, interruptions to supply chains or temporary unemployment) and macro-economic impacts (e.g. price increases, increases in government debt, negative impact on stock market prices, and decline in GDP).
Indirect losses can occur inside or outside of the hazard area and often with a time lag. As a result they may be intangible or difficult to measure.
United Nations Office for Disaster Risk ReductionDisaster Resilience Scorecard for Cities
100

Evacuation Moving people and assets temporarily to safer places before, during or after the occurrence of a hazardous event in order to protect them.
Annotations: Evacuation plans refer to the arrangements established in advance to enable the moving of people and assets temporarily to safer places before, during or after the occurrence of a hazardous event. Evacuation plans may include plans for return of evacuees and options for shelter in place.
Exposure The situation of people, infrastructure, housing, production capacities and other tangible human assets located in hazard-prone areas.
Annotation: Measures of exposure can include the number of people or types of assets in an area. These can be combined with the specific vulnerability and capacity of the exposed elements to any particular hazard to estimate the quantitative risks associated with that hazard in the area of interest.
Extensive disaster risk
The risk of low-severity, high-frequency hazardous events and disasters, mainly but not exclusively associated with highly localized hazards.
Annotation: Extensive disaster risk is usually high where communities are exposed to, and vulnerable to, recurring localised floods, landslides storms or drought. Extensive disaster risk is often exacerbated by poverty, urbanization and environmental degradation.
Failure chain A failure chain is a set of linked failures spanning critical assets in multiple infrastructure systems in the city. As an example – loss of an electricity substation may stop a water treatment plant from functioning; this may stop a hospital from functioning; and this in turn may mean that much of the city’s kidney dialysis capability (say) is lost. This failure chain would therefore span energy, water and healthcare systems.
Grass roots organizations
Organizations that exist to create disaster resilience at the local level, whether set up specifically for the purpose (for example, community emergency response organizations), or serving some other purpose but willing and able to play a disaster resilience role: for example, churches, business Round Tables, youth organizations, food kitchens, neighbourhood watch, day centres and so on.
United Nations Office for Disaster Risk Reduction Disaster Resilience Scorecard for Cities
101

Hazard A process, phenomenon or human activity that may cause loss of life, injury or other health impacts, property damage, social and economic disruption or environmental degradation.
Annotations: Hazards may be natural, anthropogenic or socio-natural in origin. Natural hazards are predominantly associated with natural processes and phenomena. Anthropogenic hazards, or human-induced hazards, are induced entirely or predominantly by human activities and choices. This term does not include the occurrence or risk of armed conflicts and other situations of social instability or tension which are subject to International Humanitarian Law and national legislation. Several hazards are socio-natural in that they are associated with a combination of natural and anthropogenic factors, including environmental degradation and climate change.
Hazards may be single, sequential or combined in their origin and effects. Each hazards is characterised by its location, intensity or magnitude, frequency and probability. Biological hazards are also defined by their infectiousness or toxicity or other characteristics of the pathogen such as dose-response, incubation period, case fatality rate and estimation of the pathogen for transmission.
Multi-hazard means the selection of multiple major hazards that the country faces, and (2) specific contexts where hazardous events may occur simultaneously, cascadingly or cumulatively over time, and taking into account the potential interrelated effects.
Hazards include (as mentioned in the Sendai Framework for Disaster Risk Reduction and in alphabetical order) biological, environmental, geological, hydro-meteorological and technological processes and phenomena.
Biological hazards are of organic origin or conveyed by biological vectors, including pathogenic micro-organisms, toxins and bioactive substances. Examples are bacteria, viruses or parasites as well as venomous wildlife and insects, poisonous plants, and mosquitoes carrying disease-causing agents.
Environmental hazards may include chemical2, natural and biological hazards. They can be created by environmental degradation, physical or chemical pollution in the air, water and soil. However, many of the processes and phenomena that fall into this category may be termed drivers of hazard and risk rather than hazards in themselves, such as soil degradation, deforestation, loss of biodiversity, salinization and sea level rise.
Geological or geophysical hazards originate from internal earth processes. Examples are earthquakes, volcanic activity and emissions, and related geophysical processes such as mass movements, landslides, rockslides, surface collapses, and debris or mud flows. Hydro-meteorological factors are important contributors to some of these processes. Tsunamis are difficult to categorize; although they are triggered by undersea earthquakes and other geological events, they Essentially become oceanic process that is manifested as a coastal water-related hazard.
Hydro-meteorological hazards are of atmospheric, hydrological or oceanographic origin. Examples are tropical cyclones (also known as typhoons and hurricanes), floods including flash floods, drought, heatwaves and cold spells and coastal storm surges. Hydro-meteorological conditions may also be a factor in other hazards such as landslides, wildland fires, locust plagues, epidemics, and in the transport and dispersal of toxic substances and volcanic eruption material.
Technological hazards originate from technological or industrial conditions, dangerous procedures, infrastructure failures or specific human activities. Examples include industrial pollution, nuclear radiation, toxic wastes, dam failures, transport accidents, factory explosions, fires and chemical spills. Technological hazards also may arise directly as a result of the impacts of a natural hazard event.
Hazardous Event The manifestation of a hazard in a particular place during a particular period of time.
Annotation: Severe hazardous events can lead to a disaster as a result of the combination of hazard occurrence and other risk factors.
Intensive disaster risk
The risk of high-severity, mid to low-frequency disasters, mainly associated with major hazards.
Annotation: Intensive disaster risk is mainly a characteristic of large cities or densely populated areas that are not only exposed to intense hazards such as strong earthquakes, active volcanoes, heavy floods, tsunamis, or major storms but also have high levels of vulnerability to these hazards.
United Nations Office for Disaster Risk ReductionDisaster Resilience Scorecard for Cities
102

Mitigation The lessening or minimising of the adverse impacts of a hazardous event.
Annotation: The adverse impacts of hazards, in particular natural hazards, often cannot be prevented fully, but their scale or severity can be substantially lessened by various strategies and actions. Mitigation measures include engineering techniques and hazard-resistant construction as well as improved environmental and social policies and public awareness. It should be noted that in climate change policy, “mitigation” is defined differently, being the term used for the reduction of greenhouse gas emissions that are the source of climate change.
“Most Probable” A disaster-causing hazard and its severity computed to be at the midpoint of a probability distribution (preferred) or assessed as “typical;” through expert judgment and other ad hoc estimation.
“Most Severe” A disaster-causing hazard and its severity computed to be in the top 10% of a probability distribution (preferred) or assessed as “worst case” through expert judgment or other ad hoc estimation.
National platform for disaster risk reduction
A generic term for national mechanisms for coordination and policy guidance on disaster risk reduction that are multi-sectoral and inter-disciplinary in nature, with public, private and civil society participation involving all concerned entities within a country.
Annotations: Effective government coordination forums are composed of relevant stakeholders at national and local levels and have a designated national focal point. F or such a mechanisms to have a strong foundation in national institutional frameworks further key element and responsibilities should be established through laws, regulations, standards and procedures, including: clearly assigned responsibilities and authority; build awareness and knowledge of disaster risk through sharing and dissemination of non-sensitive disaster risk information and data; contribute to and coordinate reports on local and national disaster risk; coordinate public awareness campaigns on disaster risk; facilitate and support local multi-sectoral cooperation (e.g. among local governments); contribute to the determination of and reporting on national and local disaster risk management plans and all policies relevant for disaster risk management.
Preparedness The knowledge and capacities developed by governments, response and recovery organizations, communities and individuals to effectively anticipate, respond to, and recover from, the impacts of likely, imminent or current disasters.
Annotation: Preparedness action is carried out within the context of disaster risk management and aims to build the capacities needed to efficiently manage all types of emergencies and achieve orderly transitions from response to sustained recovery.
Preparedness is based on a sound analysis of disaster risks and good linkages with early warning systems, and includes such activities as contingency planning, stockpiling of equipment and supplies, the development of arrangements for coordination, evacuation and public information, and associated training and field exercises. These must be supported by formal institutional, legal and budgetary capacities. The related term “readiness” describes the ability to quickly and appropriately respond when required.
A preparedness plan establishes arrangements in advance to enable timely, effective and appropriate responses to specific potential hazardous events or emerging disaster situations that might threaten society or the environment.
Prevention Activities and measures to avoid existing and new disaster risks.
Annotations: Prevention (i.e. disaster prevention) expresses the concept and intention to completely avoid potential adverse impacts of hazardous events. While certain disaster risks cannot be eliminated, prevention aims at reducing vulnerability and exposure in such contexts where as a result the risk of disaster is removed. Examples include dams or embankments that eliminate flood risks, land-use regulations that do not permit any settlement in high risk zones, seismic engineering designs that ensure the survival and function of a critical building in any likely earthquake, and immunisation against vaccine-preventable diseases. Prevention measures can also be taken in or after a hazardous event or disaster to prevent secondary hazards or their consequences such as measures to prevent contamination of water.
Reconstruction The medium and longer-term rebuilding and sustainable restoration of resilient critical infrastructures, services, housing, facilities and livelihoods required for full functioning of a community or a society affected by a disaster, aligning with the principles of sustainable development and Build Back Better, to avoid or reduce future disaster risk.
United Nations Office for Disaster Risk Reduction Disaster Resilience Scorecard for Cities
103

Recovery The restoring or improving of livelihoods, health, as well as economic, physical, social, cultural and environmental assets, systems and activities, of a disaster-affected community or society, aligning with the principles of sustainable development and Build Back Better, to avoid or reduce future disaster risk.
Rehabilitation The restoration of basic services and facilities for the functioning of a community or a society affected by a disaster.
Residual risk The disaster risk that remains in unmanaged form, even when effective disaster risk reduction measures are in place, and for which emergency response and recovery capacities must be maintained.
Annotation: The presence of residual risk implies a continuing need to develop and support effective capacities for emergency services, preparedness, response and recovery together with socio-economic policies such as safety nets and risk transfer mechanisms, as part of a holistic approach.
Resilience The ability of a system, community or society exposed to hazards to resist, absorb, accommodate, adapt to, transform and recover from the effects of a hazard in a timely and efficient manner, including through the preservation and restoration of its Essential basic structures and functions through risk management.
Resilience dividend The capacity of any entity, ranging from an individual, a corporation or a society, to pre-emptively prepare for sudden disruptions that were unpredicted, to recover from them and then to take advantage of new opportunities produced by the disruption for further growth and expansion (Judith Rodin)
Response Actions taken directly before, during or immediately after a disaster in order to save lives, reduce health impacts, ensure public safety and meet the basic subsistence needs of the people affected.
Annotation: Disaster response is predominantly focused on immediate and short-term needs and is sometimes called disaster relief. Effective, efficient and timely response relies on disaster risk-informed preparedness measures, including the development of the response capacities of individuals, communities, organizations, countries and the international community.
The institutional elements of response often include provision of emergency services and public assistance by public and private sectors and community sectors, as well as community and volunteer participation.
Emergency services are a critical set of specialised agencies that have specific responsibilities in serving and protecting people and property in emergency and disaster situations. They include civil protection authorities, police and fire services among many others. The division between the response stage and the subsequent recovery stage is not clear-cut. Some response actions, such as the supply of temporary housing and water supplies, may extend well into the recovery stage.
Retrofitting Reinforcement or upgrading of existing structures to become more resistant and resilient to the damaging effects of hazards.
Annotation: Retrofitting requires consideration of the design and function of the structure, the stresses that the structure may be subject to from particular hazards or hazard scenarios, and the practicality and costs of different retrofitting options. Examples of retrofitting include adding bracing to stiffen walls, reinforcing pillars, adding steel ties between walls and roofs, installing shutters on windows, and improving the protection of important facilities and equipment.
Disaster risk assessment
A qualitative or quantitative approach to determine the nature and extent of disaster risk by analysing potential hazards and evaluating existing conditions of exposure and vulnerability that together could harm people, property, services, livelihoods and the environment on which they depend.
Annotation: Disaster risk assessments include: the identification of hazards, a review of the technical characteristics of hazards such as their location, intensity, frequency and probability; the analysis of exposure and vulnerability including the physical, social, health, environmental and economic dimensions, and the evaluation of the effectiveness of prevailing and alternative coping capacities in respect to likely risk scenarios.
Disaster risk information
Comprehensive information on all dimensions of disaster risk including hazards, exposure, vulnerability and capacity related to persons, communities, organizations and countries and their assets.
Annotation: Disaster risk information includes all studies, information and mapping required to understand the disaster risk drivers and underlying risk factors.
United Nations Office for Disaster Risk ReductionDisaster Resilience Scorecard for Cities
104

Risk transfer The process of formally or informally shifting the financial consequences of particular risks from one party to another whereby a household, community, enterprise or state authority will obtain resources from the other party after a disaster occurs, in exchange for ongoing or compensatory social or financial benefits provided to that other party.
Annotation: Insurance is a well-known form of risk transfer, where coverage of a risk is obtained from an insurer in exchange for ongoing premiums paid to the insurer. Risk transfer can occur informally within family and community networks where there are reciprocal expectations of mutual aid by means of gifts or credit, as well as formally where governments, insurers, multi-lateral banks and other large risk-bearing entities establish mechanisms to help cope with losses in major events. Such mechanisms include insurance and re-insurance contracts, catastrophe bonds, contingent credit facilities and reserve funds, where the costs are covered by premiums, investor contributions, interest rates and past savings, respectively.
Structural and non-structural measures
Structural measures are any physical construction to reduce or avoid possible impacts of hazards, or application of engineering techniques or technology to achieve hazard resistance and resilience in structures or systems. Non-structural measures are measures not involving physical construction, which use knowledge, practice or agreement to reduce disaster risks and impacts, in particular through policies and laws, public awareness raising, training and education.
Annotation: Common structural measures for disaster risk reduction include dams, flood levies, ocean wave barriers, earthquake-resistant construction, and evacuation shelters. Common non-structural measures include building codes, land use planning laws and their enforcement, research and assessment, information resources, and public awareness programmes. Note that in civil and structural engineering, the term “structural” is used in a more restricted sense to mean just the load- bearing structure, with other parts such as wall cladding and interior fittings being termed non- structural.
Scenario A comprehensive assessment of the severity, probability of a hazard and its total impact – the exposure and vulnerability of the city to loss of life, damage or other adverse impact in the resulting disaster. As a minimum cities will ideally have two scenarios – one for the “most probable” event and one for the “most severe”
Single point of coordination
Person or group/committee (with subgroups or sub committees as required) from which all organizations with any role in the city’s disaster resilience accept direction or guidance in resilience matters, and to which they report on such matters.
Standard operating procedure (SOP)
Pre-rehearsed processes and procedures for emergency response.
Underlying disaster risk drivers
Processes or conditions, often development-related, that influence the level of disaster risk by increasing levels of exposure and vulnerability or reducing capacity.
Annotations: Underlying disaster risk drivers – also referred to as underlying disaster risk factors – include poverty and inequality, climate change and variability, unplanned and rapid urbanization, lack of disaster risk considerations in land management and environmental and natural resource management, as well as compounding factors such as demographic change, non-disaster risk-informed policies, lack of regulation and incentives for private disaster risk reduction investment, complex supply chains, limited availability of technology, unsustainable uses of natural resources, declining ecosystems, pandemics and epidemics.
Vulnerability The conditions determined by physical, social, economic and environmental factors or processes, which increase the susceptibility of an individual, a community, assets or systems to the impacts of hazards.
Annotation: For positive factors which increase the ability of people to cope with hazards see also the definitions of Capacity and Coping Capacity.
United Nations Office for Disaster Risk Reduction Disaster Resilience Scorecard for Cities
105
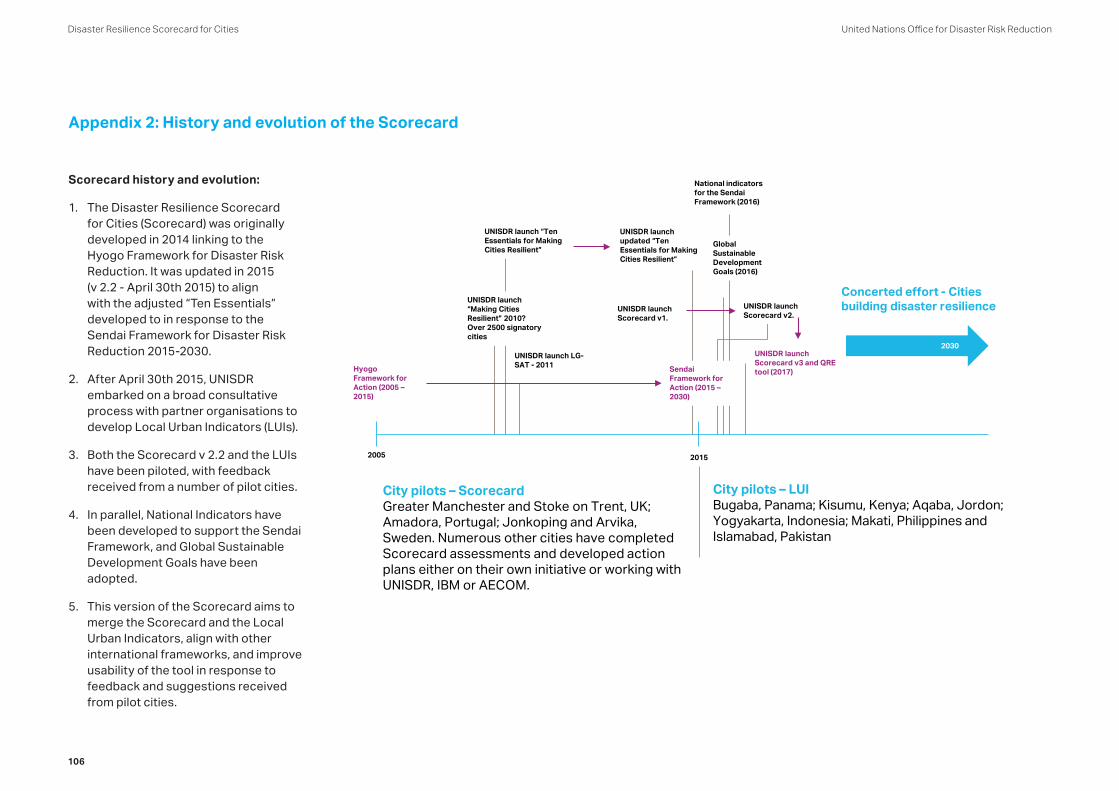
Appendix 2: History and evolution of the Scorecard
Hyogo Framework for Action (2005 –2015)
City pilots – ScorecardGreater Manchester and Stoke on Trent, UK; Amadora, Portugal; Jonkoping and Arvika, Sweden. Numerous other cities have completed Scorecard assessments and developed action plans either on their own initiative or working with UNISDR, IBM or AECOM.
City pilots – LUI Bugaba, Panama; Kisumu, Kenya; Aqaba, Jordon; Yogyakarta, Indonesia; Makati, Philippines and Islamabad, Pakistan
Global Sustainable Development Goals (2016)
UNISDR launch LG-SAT - 2011
National indicators for the Sendai Framework (2016)
UNISDR launch “Making Cities Resilient” 2010? Over 2500 signatory cities
UNISDR launch “Ten Essentials for Making Cities Resilient”
UNISDR launch updated “Ten Essentials for Making Cities Resilient”
UNISDR launch Scorecard v1.
Sendai Framework for Action (2015 –2030)
UNISDR launch Scorecard v2.
2005
UNISDR launch Scorecard v3 and QRE tool (2017)
2015
Concerted effort - Cities building disaster resilience
2030
Scorecard history and evolution:
1. The Disaster Resilience Scorecard for Cities (Scorecard) was originally developed in 2014 linking to the Hyogo Framework for Disaster Risk Reduction. It was updated in 2015 (v 2.2 - April 30th 2015) to align with the adjusted “Ten Essentials” developed to in response to the Sendai Framework for Disaster Risk Reduction 2015-2030.
2. After April 30th 2015, UNISDR embarked on a broad consultative process with partner organisations to develop Local Urban Indicators (LUIs).
3. Both the Scorecard v 2.2 and the LUIs have been piloted, with feedback received from a number of pilot cities.
4. In parallel, National Indicators have been developed to support the Sendai Framework, and Global Sustainable Development Goals have been adopted.
5. This version of the Scorecard aims to merge the Scorecard and the Local Urban Indicators, align with other international frameworks, and improve usability of the tool in response to feedback and suggestions received from pilot cities.
United Nations Office for Disaster Risk ReductionDisaster Resilience Scorecard for Cities
106

Appendix 3: Conceptual linking of the Sendai targets and indicators to the Ten Essentials for Making Cities Resilient and to other international frameworks
A. The Ten Essentials for Making Cities Resilient and the Global and draft National Sendai Targets and Indictors
B. Global Sendai Targets and Global Sustainable Development Goals
C. Global Sendai Targets and Paris Agreement (COP21)
In updating the Disaster Resilience Scorecard for Cities AECOM and IBM completed a review of alignments between the criteria included in the Scorecard assessment under the Ten Essentials for Making Cities Resilient and the Global and draft National indicators for monitoring the Sendai Framework for Disaster Risk Reduction.
• Global indictors from: Recommendations of the Open-ended Intergovernmental Expert Working Group on Indicators and Terminology relating to Disaster Risk Reduction, Open-ended intergovernmental expert working group on indicators and terminology relating to disaster risk reduction Geneva, 29-30 September 2015, 10-11 February 2016 and 15-18 November 2016,
• National indicators from: Preliminary list of indicators to monitor Sendai Framework for DRR at national level (draft for consultation)
The table over the next two pages is a summary to show alignment between the Ten Essentials for Making Cities Resilient and the Global and National Sendai indicators.
A
United Nations Office for Disaster Risk Reduction Disaster Resilience Scorecard for Cities
107

Linkages to Global and Draft National Sendai Indicators
Essential 1: Organize for Resilience
Global National
Target E
Substantially increase the number of countries with national and local disaster risk reduction strategies by 2020.
• E-1 Number of countries that adopt and implement national disaster risk reduction strategies in line with the Sendai Framework for Disaster Risk Reduction 2015-2030.
• E-2 Percentage of local governments that adopt and implement local disaster risk reduction strategies in line with national strategies. Information should be provided on the appropriate levels of government below the national level with responsibility for disaster risk reduction.
B2: National DRR strategy and plan: Does the country have national DRR strategies and plans with targets, indicators and time frames, aimed at preventing the creation of risk, the reduction of existing risk and the strengthening of economic, social, health and environmental resilience? (Y/N) (TARGET (e))
B3: Sectoral DRR strategy and plan: Does the country require sectoral ministries to establish local DRR strategies and plans with targets, indicators and time frames, aimed at preventing the creation of risk, the reduction of existing risk and the strengthening of economic, social, health and environmental resilience? (Y/N)
B4: Disaster risk reduction and economic development planning: Is disaster and climate risk included and accounted for in development plans? (Y/N) (TARGET (e))
B5: Disaster risk reduction and climate change adaptation: Are the policy frameworks for managing disaster risks and climate change adaptation integrated? (Y/N)
B6: Institutional framework: Does the country have a dedicated institutional framework (office, agency, system) for implementing the Sendai Framework? (Y/N)
B7: Multi stakeholder coordination: Does the country have a formal mechanism (Committee, National Platform etc.) to coordinate DRR policies (especially activities to reduce existing risk, prevent new risk generation and strengthening resilience) across sectors? (Y/N)
B11: DRR in local development plan: Is DRR legally required to be integrated into local development planning? (Y/N)
B12: Multi stakeholder coordination: Does the country have a laws, regulations, standards or procedures to require local governments to establish formal mechanism (Committee, National Platform etc.) to coordinate DRR (activities to reduce existing risk, prevent new risk generation and strengthen resilience) across sectors and stakeholders? (Y/N).
Essential 2: Identify, Understand and Use Current and Future Risk Scenarios
Global National
Target G
Substantially increase the availability of and access to multi-hazard early warning systems and disaster risk information and assessments to the people by 2030
G-5 Number of countries that have accessible, understandable, usable and relevant disaster risk information and assessment available to the people at the national and local level
A4: Post-disaster review: Does the country have a policy or strategy to carry out post-disaster evaluations using an agreed methodology/ guideline to review disaster causality, occurrence and response/recovery based on evidence (Y/N)?
A7: Risk assessments: Is the government legally or by national policy required to carry out risk assessments according to agreed guidelines in relevant sectors, including lifeline infrastructure and facilities (power, water and transport networks, hospitals etc.)? (Y/N)
A8: Multi Hazard risk profile: Does the country have a profile of all major risks that country is exposed to? (Y/N) (TARGET (g))
A9: Sector level risk assessments: Does the key development sector have implemented risk assessment? (Y/N)
A10: Local level risk assessments: Does the country legally require local government to develop risk assessments? ( Y/N)
A11: Risk and Hazard maps: Are local governments legally required to develop and use risk and hazard maps? (Y/N)
A15: Open data platform: Does the country have policies and standards in place to develop and maintain a data platform enabling stakeholders and people to access and exchange risk-related information such as non-sensitive hazard exposure, vulnerability, risk, disasters and loss disaggregated information? (Y/N)
United Nations Office for Disaster Risk ReductionDisaster Resilience Scorecard for Cities
108

Essential 3: Strengthen Financial Capacity for Resilience
Global National
None are directly relevant, although Global Target F could be tangentially relevant for cities in developing countries:
F-1 (compound) Total official international support, (ODA plus other official flows), for national DRR actions. Reporting of the provision or receipt of international cooperation for DRR shall be done in accordance with the modalities applied in respective countries. Recipient countries are encouraged to provide information on the estimated amount of national DRR expenditure.
A13: Cost-benefit analysis: Does a standardised approach or methodology exist for calculating the costs and benefits of DRR when determining public investments? (Y/N)
E1 (C1): Budget: Does the country have a dedicated budget line for disaster risk reduction that can be accessed by sectors and local governments for all aspects of DRR including preventing new disaster risk generation (Y/N), reducing existing disaster risk (Y/N), increasing preparedness for response and recovery(Y/N), response and recovery (Y/N) and reconstruction (Y/N)?
E3 (C42): Public Investment planning: Is disaster risk concern included in public investment plan? (Y/N)
E4 (C43): Public Investment criteria: Does the national government institutionalise by policy or law the evaluation of benefit of disaster risk reduction/prevention as criteria of decision making of all or large scale public investment projects? (Y/N)
E50 (C21): Contingency fund: Does the country have a contingency fund (money pooled over years)? (Y/N)
E51 (C22): Annual budget allocation for contingency: Does the country have a policy to set aside certain % of the budget for emergency? (Y/N)
E60 (C47): Investment promotion: Is disaster risk management integrated into investment promotion policies, including the location setting of Special Economic Zones (SEZs)? (Y/N)
E61 (C48): FDI policy: Does the country have a scheme (based on law or programme) to provide financial incentives (subsidy or tax exemption) for risk sensitive foreign direct investment? (Y/N)
Essential 4: Pursue Resilient Urban Development
Global National
B11: DRR in local development plan: Is DRR legally required to be integrated into local development planning? (Y/N)
B16: Enforcement: Can non-compliance with existing safety-enhancing provisions of sectoral laws and regulations (e.g. land use and urban planning, building codes, environmental and resource management and health safety) and accompanying malicious risk generation or transfer be legally defined and judged to be breach of a law in civil law (Y/N), criminal law (Y/N) and/or administrative law (Y/N)?
B17: Quality standards: Does the country have quality standards, such as certifications and awards for DRR, with the participation of the private sector, civil society, professional associations, scientific organizations or the United Nations? (Y/N)
E23 (C50): Risk sensitive infrastructure: Are laws and policies in place to ensure that disaster risk is integrated into the engineering design code and site selection criteria of all public works and infrastructure? (Y/N)
E37 (C54): Land-use regulation policy and planning (including urban planning): Are disaster risk considerations factored into land-use planning laws, regulations and norms? (Y/N)
E39 (C55): Building codes: Does the country have building codes that consider disaster risks? (Y/N)
E45 (C57): Inclusive urban development: Are laws or policies in place that facilitate access to safe land (for example publically provided serviced sites) and risk reducing infrastructure for low-income households? (Y/N)
E78 (C70): Commercial agriculture and land development: Are laws or policies in place that regulate the acquisition and use of productive land by national and international investors from a perspective of disaster risk (Y/N)?
United Nations Office for Disaster Risk Reduction Disaster Resilience Scorecard for Cities
109

Essential 5: Safeguard Natural Buffers to Enhance the Protective Functions Offered by Natural Ecosystems
Global National
Target D
Substantially reduce disaster damage to critical infrastructure and disruption of basic services, among them health and educational facilities, including through developing their resilience by 2030.
D-4 Number of other destroyed or damaged critical infrastructure units and facilities attributed to disasters. Those elements of critical infrastructure to be included in the calculation will be at the decision of Member States and described in the accompanying metadata. Protective infrastructure and green infrastructure should be included where relevant.
A14: Baseline environmental data development through System of Environmental Economic Accounting (SEEA) : Does country implement and report on SEEA accounts?
B19: Trans-boundary Cooperation: Does the county participate in formal cooperation arrangements and protocols with neighbouring countries to address trans-boundary risks? (Y/N)
E67 (C65): Ecosystem planning: Does the national government prepare ecosystem management plan that take disaster risk into consideration? (Y/N)
E70 (C29): Environmental restoration/conservation/enhancement: Does the country have a policy to restore or enhance damaged or degraded ecosystems in order to reduce risks and increase ecosystem services? (Y/N)
E71 (C64): Ecosystem protection area: Does the national government use protected areas legislation to ensure the conservation and enhancement of regulatory ecosystem services? (Y/N)
Essential 6: Strengthen Institutional Capacity for Resilience
Global National
Target G
G-5 Number of countries that have accessible, understandable, usable and relevant disaster risk information and assessment available to the people at the national and local level.
Target F (relating specifically to developing countries)
Substantially enhance international cooperation to developing countries through adequate and sustainable support to complement their national actions for implementation of this framework by 2030.
A5: International lessons learned: Are there any evidence that lessons learned from events abroad and changes in international agreements are reflected in domestic DRR policy?
A15: Open data platform: Does the country have policies and standards in place to develop and maintain a data platform enabling stakeholders and people to access and exchange risk-related information such as non-sensitive hazard exposure, vulnerability, risk, disasters and loss disaggregated information? (Y/N)
A16: Media involvement: Does the country have legislation or an official mechanism that requires national and local media accurately and responsibly represent / analyze DRR information in public domain? (Y/N)
A18: Research agenda: Does the national science and technology agenda include research fields to strengthen technical and scientific capacity to capitalize on and consolidate existing knowledge and to develop and apply methodologies and models to assess disaster risks, vulnerabilities and exposure to all hazards that the country face? (Y/N)
A21: Professional Education: Does the country have an educational policy that supports the establishment and/or maintenance of undergraduate or postgraduate programmes on DRR? (Y/N)
A22: Awareness raising: Does the country have a national strategy to strengthen public education and awareness in DRR and preparedness, including disaster risk information and knowledge, through campaigns, social media and community mobilization? (Y/N)
A23: Capacity building for government official: Are there dedicated plan or policy to strengthen the DRR capacity of public officials at both national and local levels? (Y/N)
B7: Multi stakeholder coordination: Does the country have a formal mechanism (Committee, National Platform etc.) to coordinate DRR policies (especially activities to reduce existing risk, prevent new risk generation and strengthening resilience) across sectors? (Y/N)
B18: Regional Cooperation: Is the country a formal member of a regional partnership mechanism for DRR? (Y/N)
United Nations Office for Disaster Risk ReductionDisaster Resilience Scorecard for Cities
110

F-1 (compound) Total official international support, (ODA plus other official flows), for national DRR actions. Reporting of the provision or receipt of international cooperation for DRR shall be done in accordance with the modalities applied in respective countries. Recipient countries are encouraged to provide information on the estimated amount of national DRR expenditure.
F-5 Number of international, regional and bilateral programmes and initiatives for the transfer and exchange of science, technology and innovation in disaster risk reduction for developing countries.
F-8 Number of developing countries supported by international, regional, bilateral initiatives to strengthen their DRR related statistical capacity.
A19: Science-policy interface: Is there a formal mechanism (e.g. DRR platform) to improve dialogue and cooperation among scientific and technological communities (e.g. Expert Committee on Risk Information), other relevant stakeholders and policy makers in order to facilitate a science-policy interface for effective public and private decision making in DRR? (Y/N)
B19: Trans-boundary Cooperation: Does the county participate in formal cooperation arrangements and protocols with neighbouring countries to address trans-boundary risks? (Y/N)
B20: Global and Regional Platform for DRR: Does your country participate in the latest Global and regional platform for DRR? (Y/N)
E11 (D6): Emergency operations centre (information management): Does the country have an emergency operation centre which coordinates information and activities during disaster? (Y/N)
E13 (D8): Community centres: Does the national government promote establishment/designation of community centres which contribute to the promotion of public awareness and stock piling of emergency materials? (Y/N)
Essential 7: Understand and Strengthen Societal Capacity for Resilience
Global National
Target B
Substantially reduce the number of affected people globally by 2030, aiming to lower the average global figure per 100,000 between 2020-2030 compared to 2005-2015.
B-5 Number of people whose livelihoods were disrupted or destroyed, attributed to disasters.
Target G
Substantially increase the availability of and access to multi-hazard early warning systems and disaster risk information and assessments to the people by 2030.
G-6 Percentage of population exposed or at risk from disasters protected through pre-emptive evacuation following early warning.
G-3 Number of people per 100,000 that are covered by early warning information through local governments or through national dissemination mechanisms.
A16: Media involvement: Does the country have legislation or an official mechanism that requires national and local media accurately and responsibly represent / analyze DRR information in public domain? (Y/N)
A17: Crowd data sourcing mechanism: Does the country have a policy to utilize the information produced by the public (e.g. social media utilization)?
A22: Awareness raising: Does the country have a national strategy to strengthen public education and awareness in DRR and preparedness, including disaster risk information and knowledge, through campaigns, social media and community mobilization? (Y/N)
E10 (D14): Training and drills targeting citizens: Do regular emergency drills and training sessions take place engaging and targeting citizens, civil sector and private sectors? (Y/N)
E14 (D9): Government Business Continuity planning: Does the government have a business continuity plan in place that allows for the continuity of critical public service provision following disaster? (Y/N)
E64 (D16): Business continuity planning: Does the country have a scheme (based on law or programme) to provide incentives (financial, technical) to private companies to have business risk management and continuity planning? (Y/N)
E65 (D18): Retail preparedness: Does the country have formal protocol to mobilize cooperation from major retail companies to prepare for emergency supply?
United Nations Office for Disaster Risk Reduction Disaster Resilience Scorecard for Cities
111
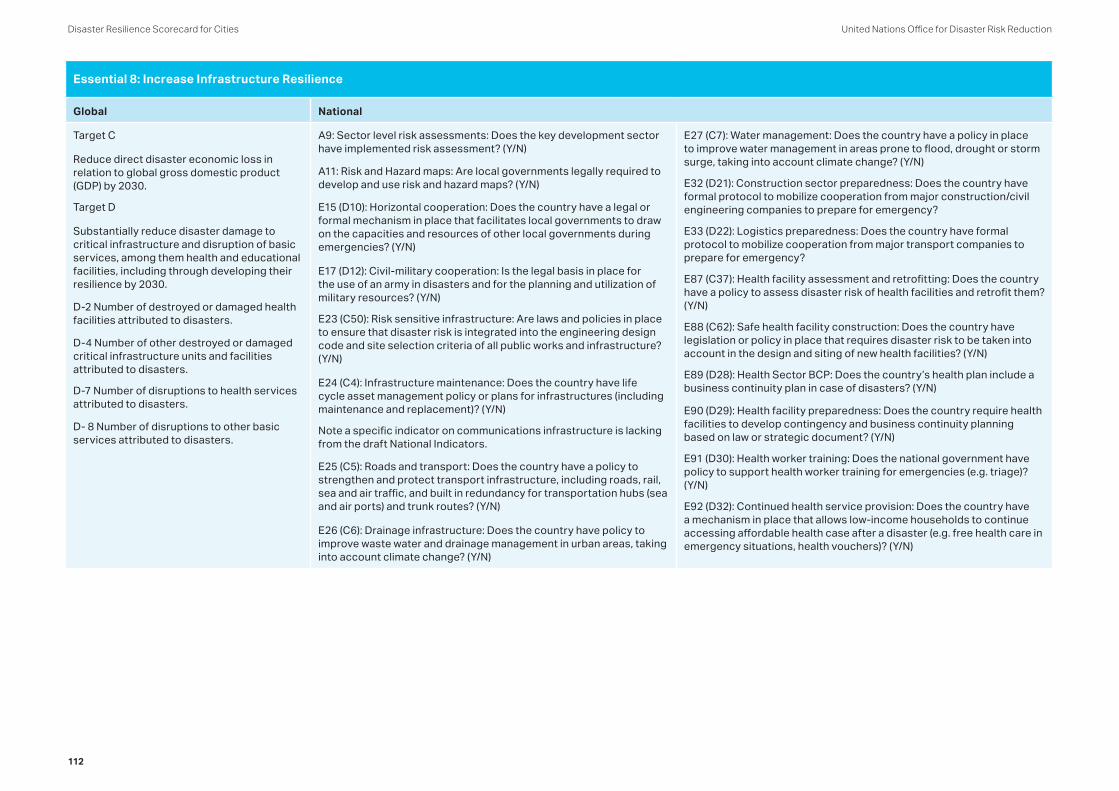
Essential 8: Increase Infrastructure Resilience
Global National
Target C
Reduce direct disaster economic loss in relation to global gross domestic product (GDP) by 2030.
Target D
Substantially reduce disaster damage to critical infrastructure and disruption of basic services, among them health and educational facilities, including through developing their resilience by 2030.
D-2 Number of destroyed or damaged health facilities attributed to disasters.
D-4 Number of other destroyed or damaged critical infrastructure units and facilities attributed to disasters.
D-7 Number of disruptions to health services attributed to disasters.
D- 8 Number of disruptions to other basic services attributed to disasters.
A9: Sector level risk assessments: Does the key development sector have implemented risk assessment? (Y/N)
A11: Risk and Hazard maps: Are local governments legally required to develop and use risk and hazard maps? (Y/N)
E15 (D10): Horizontal cooperation: Does the country have a legal or formal mechanism in place that facilitates local governments to draw on the capacities and resources of other local governments during emergencies? (Y/N)
E17 (D12): Civil-military cooperation: Is the legal basis in place for the use of an army in disasters and for the planning and utilization of military resources? (Y/N)
E23 (C50): Risk sensitive infrastructure: Are laws and policies in place to ensure that disaster risk is integrated into the engineering design code and site selection criteria of all public works and infrastructure? (Y/N)
E24 (C4): Infrastructure maintenance: Does the country have life cycle asset management policy or plans for infrastructures (including maintenance and replacement)? (Y/N)
Note a specific indicator on communications infrastructure is lacking from the draft National Indicators.
E25 (C5): Roads and transport: Does the country have a policy to strengthen and protect transport infrastructure, including roads, rail, sea and air traffic, and built in redundancy for transportation hubs (sea and air ports) and trunk routes? (Y/N)
E26 (C6): Drainage infrastructure: Does the country have policy to improve waste water and drainage management in urban areas, taking into account climate change? (Y/N)
E27 (C7): Water management: Does the country have a policy in place to improve water management in areas prone to flood, drought or storm surge, taking into account climate change? (Y/N)
E32 (D21): Construction sector preparedness: Does the country have formal protocol to mobilize cooperation from major construction/civil engineering companies to prepare for emergency?
E33 (D22): Logistics preparedness: Does the country have formal protocol to mobilize cooperation from major transport companies to prepare for emergency?
E87 (C37): Health facility assessment and retrofitting: Does the country have a policy to assess disaster risk of health facilities and retrofit them? (Y/N)
E88 (C62): Safe health facility construction: Does the country have legislation or policy in place that requires disaster risk to be taken into account in the design and siting of new health facilities? (Y/N)
E89 (D28): Health Sector BCP: Does the country’s health plan include a business continuity plan in case of disasters? (Y/N)
E90 (D29): Health facility preparedness: Does the country require health facilities to develop contingency and business continuity planning based on law or strategic document? (Y/N)
E91 (D30): Health worker training: Does the national government have policy to support health worker training for emergencies (e.g. triage)? (Y/N)
E92 (D32): Continued health service provision: Does the country have a mechanism in place that allows low-income households to continue accessing affordable health case after a disaster (e.g. free health care in emergency situations, health vouchers)? (Y/N)
United Nations Office for Disaster Risk ReductionDisaster Resilience Scorecard for Cities
112
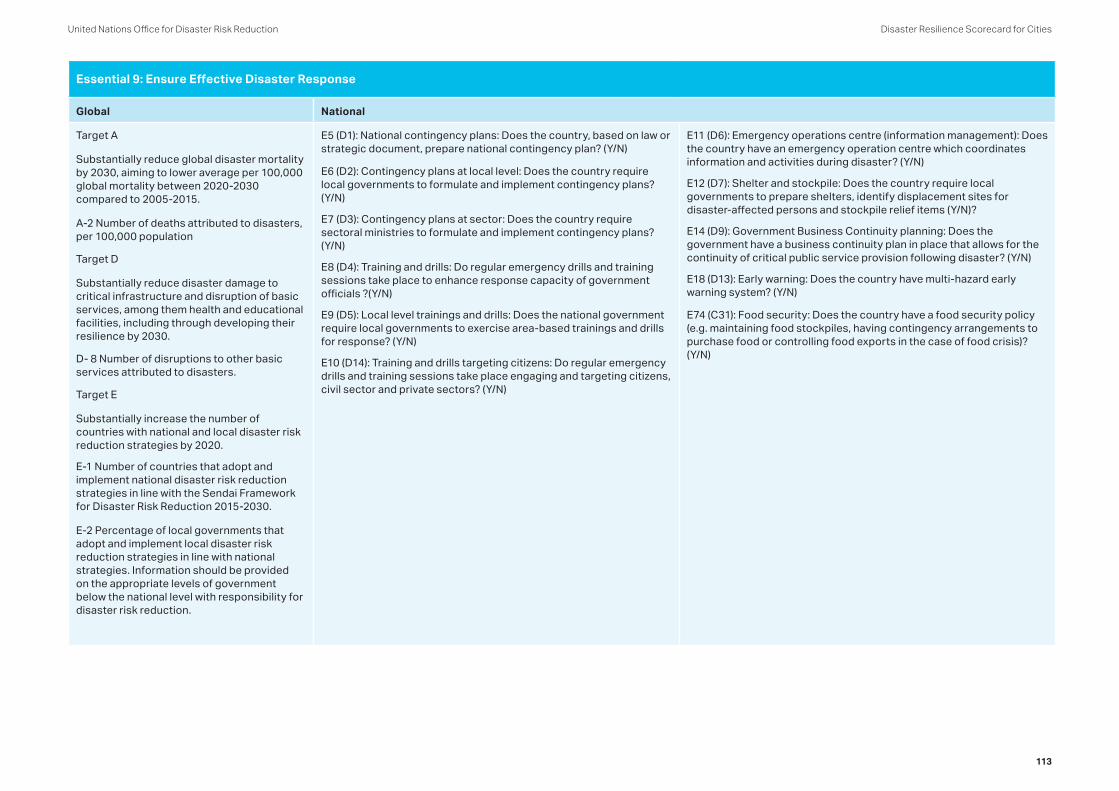
Essential 9: Ensure Effective Disaster Response
Global National
Target A
Substantially reduce global disaster mortality by 2030, aiming to lower average per 100,000 global mortality between 2020-2030 compared to 2005-2015.
A-2 Number of deaths attributed to disasters, per 100,000 population
Target D
Substantially reduce disaster damage to critical infrastructure and disruption of basic services, among them health and educational facilities, including through developing their resilience by 2030.
D- 8 Number of disruptions to other basic services attributed to disasters.
Target E
Substantially increase the number of countries with national and local disaster risk reduction strategies by 2020.
E-1 Number of countries that adopt and implement national disaster risk reduction strategies in line with the Sendai Framework for Disaster Risk Reduction 2015-2030.
E-2 Percentage of local governments that adopt and implement local disaster risk reduction strategies in line with national strategies. Information should be provided on the appropriate levels of government below the national level with responsibility for disaster risk reduction.
E5 (D1): National contingency plans: Does the country, based on law or strategic document, prepare national contingency plan? (Y/N)
E6 (D2): Contingency plans at local level: Does the country require local governments to formulate and implement contingency plans? (Y/N)
E7 (D3): Contingency plans at sector: Does the country require sectoral ministries to formulate and implement contingency plans? (Y/N)
E8 (D4): Training and drills: Do regular emergency drills and training sessions take place to enhance response capacity of government officials ?(Y/N)
E9 (D5): Local level trainings and drills: Does the national government require local governments to exercise area-based trainings and drills for response? (Y/N)
E10 (D14): Training and drills targeting citizens: Do regular emergency drills and training sessions take place engaging and targeting citizens, civil sector and private sectors? (Y/N)
E11 (D6): Emergency operations centre (information management): Does the country have an emergency operation centre which coordinates information and activities during disaster? (Y/N)
E12 (D7): Shelter and stockpile: Does the country require local governments to prepare shelters, identify displacement sites for disaster-affected persons and stockpile relief items (Y/N)?
E14 (D9): Government Business Continuity planning: Does the government have a business continuity plan in place that allows for the continuity of critical public service provision following disaster? (Y/N)
E18 (D13): Early warning: Does the country have multi-hazard early warning system? (Y/N)
E74 (C31): Food security: Does the country have a food security policy (e.g. maintaining food stockpiles, having contingency arrangements to purchase food or controlling food exports in the case of food crisis)? (Y/N)
United Nations Office for Disaster Risk Reduction Disaster Resilience Scorecard for Cities
113

Global National
Target G
Substantially increase the availability of and access to multi-hazard early warning systems and disaster risk information and assessments to the people by 2030.
G-1 (compound) Number of countries that have multi-hazard early warning systems.
G-2 Number of countries that have a multi-hazard monitoring and forecasting systems.
G-3 Number of people per 100,000 that are covered by early warning information through local governments or through national dissemination mechanisms.
G-4 Percentage of local governments having a plan to act on early warnings.
G-5 Number of countries that have accessible, understandable, usable and relevant disaster risk information and assessment available to the people at the national and local level.
G-6 Percentage of population exposed or at risk from disasters protected through pre-emptive evacuation following early warning.
United Nations Office for Disaster Risk ReductionDisaster Resilience Scorecard for Cities
114
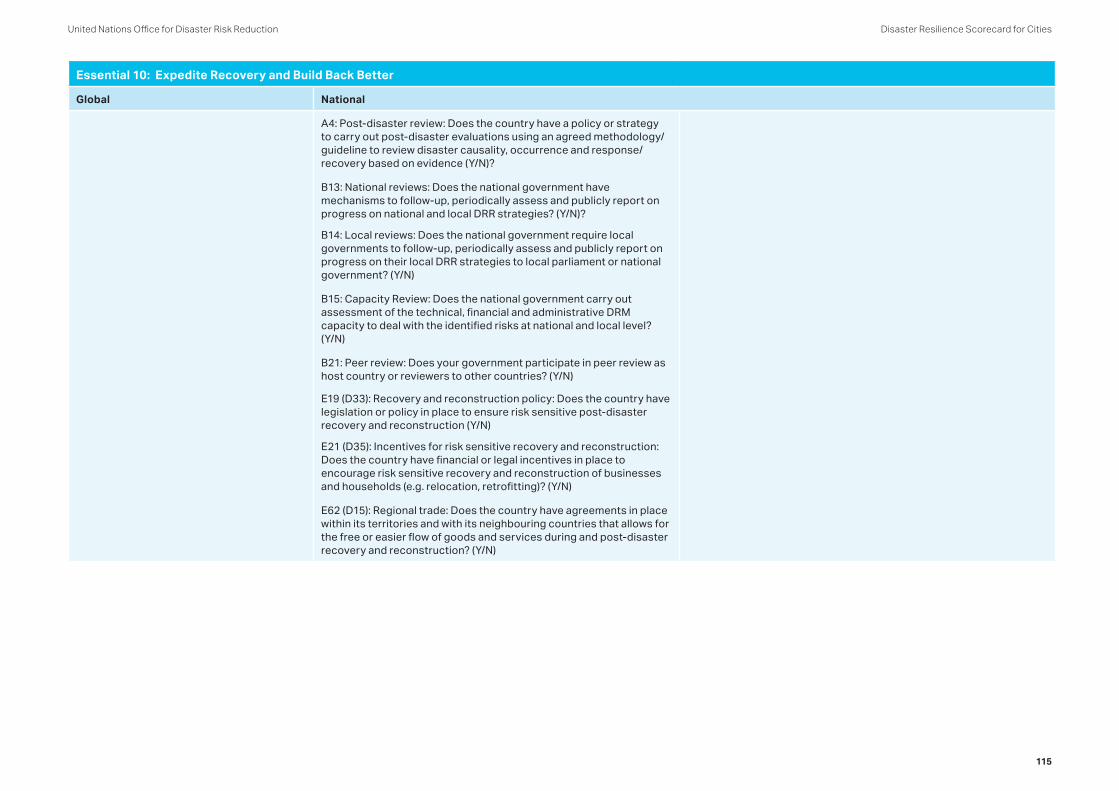
Essential 10: Expedite Recovery and Build Back Better
Global National
A4: Post-disaster review: Does the country have a policy or strategy to carry out post-disaster evaluations using an agreed methodology/ guideline to review disaster causality, occurrence and response/recovery based on evidence (Y/N)?
B13: National reviews: Does the national government have mechanisms to follow-up, periodically assess and publicly report on progress on national and local DRR strategies? (Y/N)?
B14: Local reviews: Does the national government require local governments to follow-up, periodically assess and publicly report on progress on their local DRR strategies to local parliament or national government? (Y/N)
B15: Capacity Review: Does the national government carry out assessment of the technical, financial and administrative DRM capacity to deal with the identified risks at national and local level? (Y/N)
B21: Peer review: Does your government participate in peer review as host country or reviewers to other countries? (Y/N)
E19 (D33): Recovery and reconstruction policy: Does the country have legislation or policy in place to ensure risk sensitive post-disaster recovery and reconstruction (Y/N)
E21 (D35): Incentives for risk sensitive recovery and reconstruction: Does the country have financial or legal incentives in place to encourage risk sensitive recovery and reconstruction of businesses and households (e.g. relocation, retrofitting)? (Y/N)
E62 (D15): Regional trade: Does the country have agreements in place within its territories and with its neighbouring countries that allows for the free or easier flow of goods and services during and post-disaster recovery and reconstruction? (Y/N)
United Nations Office for Disaster Risk Reduction Disaster Resilience Scorecard for Cities
115

DISASTER MORTALITY
Substantially reduce global disaster mortality by 2030,aiming to lower the average per 100,000 global mortalityrate in the decade 2020–2030 compared to the period 2005–2015
PEOPLE AFFECTED BY DISASTERS
Substantially reduce the number of affected people globally by 2030, aiming to lower the average global figure per 100,000 in the decade 2020–2030 comparedto the period 2005–2015
ECONOMIC LOSS
Reduce direct disaster economic loss in relation to global gross domestic product (GDP) by 2030
INFRASTRUCTURE DISRUPTION
Substantially reduce disaster damage to critical infrastructure and disruption of basic services, among them health and educational facilities, including through developing their resilience by 2030
NATIONAL STRATEGIES
Substantially increase the number of countries with national and local disaster risk reduction strategies by 2020
INTERNATIONAL CO-OPERATION
Substantially enhance international cooperation to developing countries through adequate and sustainablesupport to complement their national actions for implementation of the present Framework by 2030
DISASTER RISK INFORMATION
Substantially increase the availability of and access to multi-hazard early warning systems and disaster risk information and assessments to people by 2030
# Deaths per 100,000 population# Missing persons per 100,000 population
# Injured or ill people per 100,000 population# People with damaged dwellings# People with destroyed dwellings# Livelihoods disrupted or destroyed
$ Agricultural loss$ Housing sector loss $ Other critical infrastructure or productive asset loss$ Cultural heritage loss
# Destroyed or damaged health facilities# Destroyed or damaged educational facilities# Destroyed or damaged critical infrastrucutre units# Disruptions to basic services
# Countries implementing DRR strategies% Local governments that implementing DRR strategies
$ International support for national DRR actions and technology # DRR knowledge transfer initiatives for developing countries$ International support for DRR capacity-building# Developing countries strengthening statistical capacity
# Countries with mulit-hazard monitoring and forecasting systems# People receiving early warning information per 100,000 population% Local governments with early warning action plan# Countries with DRR information available% Population protected through pre-emptive evacuation
Resilience and sustainability are two key concepts in the development of transformativeenvironments, protecting communities and natural resources.
This diagram illustrates the linkages betweensustainable development and disaster riskreduction, drawing on ‘Disaster Risk Reductionand Resilience in the 2030 Agenda forSustainable Development’ (UNISDR, 2015).
Measuring and monitoring progress is vital.These indicators are taken from ‘Report of theopen-ended intergovernmental expert workinggroup on indicators and terminology relating todisaster risk reduction’ (UN, 2016).
GOAL 01: NO POVERTY
GOAL 02: ZERO HUNGER
GOAL 03: HEALTHY PEOPLE
GOAL 04: QUALITY EDUCATION
GOAL 07: CLEAN ENERGY
GOAL 08: ECONOMIC GROWTH
GOAL 10: REDUCED INEQUALITIES
GOAL 12: RESPONSIBLE CONSUMPTION
GOAL 16: PEACE & JUSTICE
GOAL 17: PARTNERSHIPS
GOAL 13: CLIMATE ACTION
GOAL 14: LIFE BELOW WATER
GOAL 15: LIFE ON LAND
GOAL 11: SUSTAINABLE CITIES
GOAL 09: IMPROVE INFRASTRUCTURE
GOAL 05: GENDER EQUALITY
GOAL 06: CLEAN WATER
A
B
C
D
E
F
G
TRANSFORMING OUR WORLD:THE 2030 AGENDA FOR SUSTAINABLE DEVELOPMENT
SENDAI FRAMEWORK FOR DISASTER RISK REDUCTION 2015-2030
GLOBAL TARGETS GLOBAL INDICATORS
RESILIENCE ANDSUSTAINABILITY
B
United Nations Office for Disaster Risk ReductionDisaster Resilience Scorecard for Cities
116

STRENGTHEN THE GLOBAL RESPONSETO THE THREAT OF CLIMATE CHANGE
LIMITTEMPERATURE
RISE TO 2ºC
INCREASEABILITY TO
ADAPT
FINANCEFOR A LOW
GHG ECONOMY
EQUITABLE &DIFFERENTIATEDRESPONSIBILITY
NATIONAL POLICYARTICLE 4
TECHNOLOGYARTICLE 10
CAPACITY-BUILDINGARTICLE 11
DISASTER MORTALITY
Substantially reduce global disaster mortality by 2030,aiming to lower the average per 100,000 global mortalityrate in the decade 2020–2030 compared to the period 2005–2015
PEOPLE AFFECTED BY DISASTERS
Substantially reduce the number of affected people globally by 2030, aiming to lower the average global figure per 100,000 in the decade 2020–2030 comparedto the period 2005–2015
ECONOMIC LOSS
Reduce direct disaster economic loss in relation to global gross domestic product (GDP) by 2030
INFRASTRUCTURE DISRUPTION
Substantially reduce disaster damage to critical infrastructure and disruption of basic services, among them health and educational facilities, including through developing their resilience by 2030
NATIONAL STRATEGIES
Substantially increase the number of countries with national and local disaster risk reduction strategies by 2020
INTERNATIONAL CO-OPERATION
Substantially enhance international cooperation to developing countries through adequate and sustainablesupport to complement their national actions for implementation of the present Framework by 2030
DISASTER RISK INFORMATION
Substantially increase the availability of and access to multi-hazard early warning systems and disaster risk information and assessments to people by 2030
# Deaths per 100,000 population# Missing persons per 100,000 population
EDUCATIONARTICLE 12
LOSS & DAMAGEARTICLE 8
ECOSYSTEMSARTICLE 5
FINANCEARTICLE 9
# Injured or ill people per 100,000 population# People with damaged dwellings# People with destroyed dwellings# Livelihoods disrupted or destroyed
$ Agricultural loss$ Housing sector loss $ Other critical infrastructure or productive asset loss$ Cultural heritage loss
# Destroyed or damaged health facilities# Destroyed or damaged educational facilities# Destroyed or damaged critical infrastrucutre units# Disruptions to basic services
# Countries implementing DRR strategies% Local governments that implementing DRR strategies
$ International support for national DRR actions and technology # DRR knowledge transfer initiatives for developing countries$ International support for DRR capacity-building# Developing countries strengthening statistical capacity
# Countries with mulit-hazard monitoring and forecasting systems# People receiving early warning information per 100,000 population% Local governments with early warning action plan# Countries with DRR information available% Population protected through pre-emptive evacuation
Climate change presents significant risks tocommunities, livelihoods and ecosystems, andcan act to multiply disaster risks. There are realopportunities to tackle both together in aconnected and coherent way.
This diagram illustrates the linkages betweenclimate change action and disaster riskreduction, highlighting some of the most relevant articles from the ‘Paris Agreement’(UN, 2015).
Measuring and monitoring progress is vital.These indicators are taken from ‘Report of theopen-ended intergovernmental expert workinggroup on indicators and terminology relating todisaster risk reduction’ (UN, 2016).
- Increase GHG reduction ambition over time- Balance sources and sinks by 2050- Develop long-term low GHG development strategies
- Conserve and enhance natural GHG sinks- Reduce emissions from deforestation- Sustainably manage forests
- Technologies improve resilience to climate change- Strengthen cooperative technology development- Further technology transfer
- Enhance the capacity of developing countries- Use lessons-learned in an iterative process- Measure and communicate actions
- Enhance climate change education and training- Improve public access to information
- Minimize loss caused by climate change- Improve early warning systems- Undertake risk assessment and management- Improve the resilience of people and ecosystems
- Developed countries provide financial assistance- Fund adaptation and mitigation actions
A
B
C
D
E
F
G
PARIS AGREEMENT (COP 21) SENDAI FRAMEWORK FOR DISASTER RISK REDUCTION 2015-2030
RESILIENCE ANDCLIMATE CHANGE
GLOBAL TARGETS GLOBAL INDICATORS
$
C
United Nations Office for Disaster Risk Reduction Disaster Resilience Scorecard for Cities
117

170101G
The main contact points for the Disaster Resilience Scorecard for Cities are:
Africa: Mr. Animesh Kumar, [email protected]
Americas: Ms. Saskia Carusi, [email protected]
Arab States: Mr. Ragy Saro, [email protected]
Asia: Tejas Patnaik, [email protected]
Pacific: Mr. Timothy Wilcox, [email protected]
North East Asia: Mr. Sanjaya Bhatia, [email protected]
Europe and Central Asia: Mr. Takashi Kawamoto, [email protected]
Global: Mr. Peter Williams, [email protected];
Mr. Ben Smith, [email protected];
Mr. Abhilash Panda, [email protected];
Ms. Fernanda Del Lama Soares, [email protected]