Scoping Study to Explore the Suitability of SDG Indicator...
108
Scoping Study to Explore the Suitability of SDG Indicator 9.1.2 for Rural Access Final Report Niklas Sieber, John Hine, Holger Dalkmann, Shedrack Wililo, Teferra Mengesha and Sunil Kumar Poudyal GEN2173A February 2020
Transcript of Scoping Study to Explore the Suitability of SDG Indicator...

Scoping Study to Explore the Suitability of SDG Indicator 9.1.2 for Rural Access
Final Report
Niklas Sieber, John Hine, Holger Dalkmann, Shedrack Wililo, Teferra Mengesha and Sunil Kumar Poudyal
GEN2173A
February 2020

ReCAP | Scoping Study to Explore the Suitability of SDG Indicator 9.1.2 for Rural Access ii
Preferred citation: Sieber, N. et.al. (2019). Scoping Study to Explore the Suitability of SDG Indicator 9.1.2 for Rural Access Project, Final Report GEN2173A, London: ReCAP for DFID.
For further information, please contact: Niklas Sieber, [email protected]
ReCAP Project Management Unit
Cardno Emerging Market (UK) Ltd
Level 5, Clarendon Business Centre 42 Upper Berkeley Street, Marylebone London W1H 5PW United Kingdom
The views in this document are those of the authors and they do not necessarily reflect the views of the Research for Community Access Partnership (ReCAP) or Cardno Emerging Markets (UK) Ltd for whom the document was prepared
Cover photo: Niklas Sieber
Quality assurance and review table
1.0 John Hine, Holger Dalkmann,
Niklas Sieber Annabel Bradbury (ReCAP PMU) Joseph Haule (ReCAP PMU) ReCAP Technical Panel
31/01/2020 04/02/2020
2.0 Niklas Sieber Annabel Bradbury (ReCAP PMU) 05/03/2020
ReCAP Database Details: Scoping Study to Explore the Suitability of SDG Indicator 9.1.2 for Rural Access
Reference No: GEN2173A Location Asia and Africa
Source of Proposal ReCAP PMU Procurement Method Open Tender
Theme Transport Services Sub-Theme Sustainable Development Goals
Lead Implementation Organisation
N/A Partner Organisation N/A
Total Approved Budget £48,615 Total Used Budget £ 46,300
Start Date 12 August 2019 End Date 30 March 2020
Report Due Date 28 February 2020 Date Received 28 February 2020

ReCAP | Scoping Study to Explore the Suitability of SDG Indicator 9.1.2 for Rural Access iii
Contents
Executive Summary .................................................................................................................................................... ix
1 Introduction ....................................................................................................................................................... 1 1.1 Rural Transport and Poverty Alleviation ................................................................................................................ 1 1.2 Scoping Study on SDG 9.1.2 ................................................................................................................................... 3 1.3 Motivation for the Research .................................................................................................................................. 3
2 The SDG Process and the Inclusion of Rural Transport ....................................................................................... 4 2.1 (Rural) Transport and the SDGS ............................................................................................................................. 4 2.2 Linking SDGS and the climate process – observations from COP 25 ..................................................................... 5 2.3 Annual Review and Reporting ............................................................................................................................... 7 2.4 Management and Institutional Set Up .................................................................................................................. 9 2.5 Data Collection and Sources for Indicator 9.1.2 .................................................................................................. 10
3 Definitions of Rural Transport and Rural Areas .................................................................................................11 3.1 Definition of Rural Areas ..................................................................................................................................... 11 3.2 Definition of Rural Transport ............................................................................................................................... 13
4 International Transport Statistics ......................................................................................................................16 4.1 Africa Infrastructure Country Diagnostic (AICD). ................................................................................................. 17 4.2 International Civil Aviation Organization (ICAO) ................................................................................................. 17 4.3 International Road Federation (IRF) .................................................................................................................... 17 4.4 International Transport Forum, (ITF) ................................................................................................................... 17 4.5 International Organisation of Motor Vehicle Manufacturers (OICA) .................................................................. 17 4.6 International Union of Railways (UIC) ................................................................................................................. 18 4.7 United Nations Economic Commission for Europe (UNECE) ............................................................................... 18 4.8 United Nations SDG database ............................................................................................................................. 18 4.9 Sustainable Mobility for all (SuM4All) ................................................................................................................. 18 4.10 World Road Association (PIARC) .......................................................................................................................... 18
5 Results of the Country Surveys ..........................................................................................................................19 5.1 Data Collection and Institutions in Ethiopia ........................................................................................................ 19 5.2 Data Collection and Institutions in Nepal ............................................................................................................ 21 5.3 Data Collection and Institutions in Tanzania ....................................................................................................... 24 5.4 Rural Transport Data Collection .......................................................................................................................... 26 5.5 Transport Data Collection in the ReCAP Countries .............................................................................................. 27 5.6 Road Classification and Length ............................................................................................................................ 28 5.7 Design Standards ................................................................................................................................................. 29 5.8 Vehicle Fleet ........................................................................................................................................................ 30 5.9 Traffic Counts ....................................................................................................................................................... 31 5.10 Transport Volumes .............................................................................................................................................. 32 5.11 Household Surveys, Indicators and O/D matrices ............................................................................................... 33 5.12 Public Transport ................................................................................................................................................... 34 5.13 Freight Transport ................................................................................................................................................. 35 5.14 Rail Transport ...................................................................................................................................................... 35 5.15 Non-Motorised Transport.................................................................................................................................... 35 5.16 Inland Water Transport ....................................................................................................................................... 36 5.17 Other Transport Information ............................................................................................................................... 36
6 Model Based Transport Volume Estimations .....................................................................................................38 6.1 Four-Step Transport Model ................................................................................................................................. 38

ReCAP | Scoping Study to Explore the Suitability of SDG Indicator 9.1.2 for Rural Access iv
6.2 System for Traffic Demand Analysis STRADA ...................................................................................................... 39 6.3 Highway Development and Management HDM-4 .............................................................................................. 39 6.4 Road Network Evaluation Tools RONET .............................................................................................................. 40 6.5 Roads Economic Decision Model RED ................................................................................................................. 41 6.6 Freight Volume Estimations................................................................................................................................. 41 6.7 The ITF Model ...................................................................................................................................................... 42 6.8 Discussion on the Use of Transport Models ........................................................................................................ 42
7 Practical Approaches towards Rural Transport Volume Estimations .................................................................44 7.1 Rural Traffic in the United States and the United Kingdom ................................................................................ 44 7.1 Proposed Approaches for the ReCAP Research Countries .................................................................................. 45 7.2 A Basic Model to Assess Rural Transport Volumes .............................................................................................. 46
8 Methods for Transport Data Collection .............................................................................................................49 8.1 General Approach ................................................................................................................................................ 49 8.2 Road Networks .................................................................................................................................................... 49 8.3 Traffic Counts ....................................................................................................................................................... 52 8.4 Transport Model Usage ....................................................................................................................................... 54 8.5 Vehicle Odometer Readings ................................................................................................................................ 54 8.6 Mobile Phone Data .............................................................................................................................................. 55 8.7 Cross-Checking the Final Result ........................................................................................................................... 56
9 Conclusions .......................................................................................................................................................58 9.1 International Sources for Transport Data ............................................................................................................ 58 9.2 Results of the Country Surveys ............................................................................................................................ 58 9.3 A Basic Model for Transport Volume Estimation ................................................................................................ 59 9.4 Further Research Needs ...................................................................................................................................... 60 9.5 Alignment with the SDG Process ......................................................................................................................... 61
Annex 1 Number of Countries or Areas According to the Criteria Used in Defining Urban Areas, 2018 ..............69
Annex 2 Stakeholder Meetings ...........................................................................................................................70
Annex 3 Country Reports ....................................................................................................................................71

ReCAP | Scoping Study to Explore the Suitability of SDG Indicator 9.1.2 for Rural Access v
List of Tables
Table 1: Examples for Definitions of rural areas ............................................................................................................... 11
Table 2: The number of countries/territories covered by different international sources for Land Transport. .............. 16
Table 3: Major challenges faced while collecting transport data in ReCAP Countries ..................................................... 28
Table 4: Number of institutions collecting transport data in ReCAP Countries ................................................................ 28
Table 5: Functional road classification in ReCAP Countries .............................................................................................. 29
Table 6: Data on rural road length available .................................................................................................................... 29
Table 7: Design standards for rural roads in ReCAP Countries ......................................................................................... 30
Table 8: Data on vehicle fleet available in ReCAP Countries ............................................................................................ 31
Table 9: Traffic counting in ReCAP Countries ................................................................................................................... 31
Table 10: Information on basic transport indicators ........................................................................................................ 33
Table 11: Public transport ................................................................................................................................................. 34
Table 12: Availability of data on freight transport ............................................................................................................ 35
Table 13: Other transport information ............................................................................................................................. 37
Table 14: Data requirements of a transport model .......................................................................................................... 38
Table 15: Transport Models used in the researched ReCAP countries ............................................................................. 39
Table 16: Average daily traffic composition and volumes from rural road surveys in six countries ................................ 44
Table 17: Data inputs rural transport volume assessment ............................................................................................... 49
Table 18. Summary of major barriers to the inclusion of rural transport indicator in SDG 9.1.2 ..................................... 61
Table 19: SuM4All policy goals, principal indicators and country group thresholds ........................................................ 63
List of Figures
Figure 1: Impacts of improved rural transport on the SDGs ............................................................................................... 2
Figure 2: Direct and indirect related SDGs targets to transport (SLoCaT, 2019) ................................................................ 5
Figure 3: Linking NDC and SDG (Karl Peet, SLoCaT, 2019) .................................................................................................. 6
Figure 4: Number of VNRs (143 countries submitted 156 VNRs) with references to transport sub-sectors (2016-2019) . 8
Figure 5: Data Flow in SDG Reporting – SDG 6 (UN Water) ................................................................................................ 9
Figure 6: Comparison of the World Bank’s agglomeration index with country-specific definitions ................................ 12
Figure 7: Rural transport according to different definitions ............................................................................................. 14
Figure 8: Conventional four step model ........................................................................................................................... 38
Figure 9: Matrix of road classes used in RONET ............................................................................................................... 41
Figure 10: Comparison of Google Earth and OpenStreetMap, Makete District, Tanzania ............................................... 51
Figure 11: Procedure of road network assessment .......................................................................................................... 52

ReCAP | Scoping Study to Explore the Suitability of SDG Indicator 9.1.2 for Rural Access vi
Abstract
This scoping study contributes to the development of Sustainable Development Target (SDG) 9.1 that seeks to ‘develop quality, reliable, sustainable and resilient infrastructure, including regional and trans-border infrastructure, to support economic development and human well-being, with a focus on affordable and equitable access for all’. The study investigates the feasibility of adapting the SDG Indicator 9.1.2 (covering passenger and freight volumes) to include a sub-indicator for rural mobility, with a view to identifying a measurement framework and data collection methodology based around the movement of rural passenger and freight road transport.
The paper discusses definitions of rural transport and recommends using national classifications. It provides an overview of international transport statistics. Many of the international statistics contain important data gaps, and some have major inconsistencies. The availability and collection of transport statistics in Ethiopia, Nepal and Tanzania is analysed as well. The main challenges identified were the absence of central databases, large data inconsistencies, capacity and skill gaps, timely availability of data, and lack of resources for data collection. The paper finds that most of the transport models are not eligible to assess rural transport volumes in practice. Therefore, a Basic Model for rural transport estimation was developed and related methods of data collection discussed.
In summary, there are a number of institutional and financial constraints, as well as deficits in data availability, and insufficient integration into the SDG process. Two options might be considered to be explored further: (i) Incremental development, i.e. submission of a suggestion for a rural indicator within 9.1.2. for the next consultation for IAED-SDG review in 2025; or (ii) integrated reporting for ALL transport related SDGs.
Key words
Rural transport volume, Sustainable Development Goal, Road statistics, Transport statistics, Traffic counts, Passenger-kilometres, Tonne-kilometres, Rural passenger transport, Rural freight transport, Origin-Destination Survey.
Research for Community Access Partnership (ReCAP)
Safe and sustainable transport for rural communities
ReCAP is a research programme, funded by UK Aid, with the aim of promoting safe and sustainable transport for rural communities in Africa and Asia. ReCAP comprises the Africa Community Access Partnership (AfCAP) and the Asia Community Access Partnership (AsCAP). These partnerships support knowledge sharing between participating
countries in order to enhance the uptake of low cost, proven solutions for rural access that maximise the use of local resources. The ReCAP programme is managed by Cardno Emerging Markets (UK) Ltd.
www.research4cap.org

ReCAP | Scoping Study to Explore the Suitability of SDG Indicator 9.1.2 for Rural Access vii
Acronyms, Units and Currencies
$ United States Dollar (US$ 1.00 ≈ provide conversion to local currencies) AADT Annual average daily traffic ADB Asian Development Bank AfCAP Africa Community Access Partnership AsCAP Asia Community Access Partnership ASDT Average Seasonal Daily Traffic CBS Central Bureau of Statistics, Nepal CSA COP
Central Statistical Agency, Ethiopia Conference of the Parties (UN Climate Change Conference)
DFID Department for International Development, UK (UKAid) DOLI Department of Local Infrastructure, Nepal DOR Department of Roads, Nepal DOTM Department of Transport Management, Nepal DTMP District Transport Master Plan (Nepal) DTMP District Transport Masterplan, Nepal EAs Enumeration Areas, Ethiopia ECAA ECOWAS
Ethiopian Civil Aviation Authority Economic Community of west African States
E.g. for example ERA Ethiopian Roads Authority ERC Ethiopian Railway Corporation GIS Geographical information system GPS Global positioning system GRA Global Roadmap of Action HDM-4 Highway Development and Management Model IAEG-SDGs Inter-agency and Expert Group on SDG Indicators ICAO International Civil Aviation Organisation IFRTD International Forum for Rural Transport and Development IMT ISDB
Intermediate means of transport Islamic Development Bank
ITF International Transport Forum ITF-OECD International Transport Forum of the OECD Kg kilogramme Km kilometre LATRA Land Transport Regulatory Authority, Tanzania LIC Low Income Country LVRR Low-volume rural road MoE Ministry of Education (MoE), Ethiopia MOFAGA Ministry of Federal Affairs and General Administration, Nepal MoH Ministry of Health, Ethiopia MOPIT Ministry of Physical Planning and Transport, Nepal MoT Federal Police-for road safety Regional Road and Transport, Ethiopia MoWTC Ministry of Works Transport and Communication, Tanzania NBS NDCs
National Bureau of Statistics, Tanzania Nationally Determined Contributions
NGO Non-governmental organisation

ReCAP | Scoping Study to Explore the Suitability of SDG Indicator 9.1.2 for Rural Access viii
NPC National Planning Commission, Nepal NSO National Statistical Office NTA National Transit Authority Pkm Passenger kilometres PORALG President Office Regional Administration and Local Government, Tanzania PSUs Primary sampling units, Ethiopia PTMP Province Transport Masterplan, Nepal RAI Rural Access Index ReCAP Research for Community Access Partnership RED REN21
Roads Economic Decision (software) Renewable Energy Policy Network for the 21st Century
RFB Roads Fund Board RMMS Routine Maintenance Management System RONET Road Network Evaluation Tool RSDP Road Sector Development Program, Ethiopia SDG Sustainable Development Goal SSUs Secondary sampling units, Ethiopia SuM4All Sustainable Mobility for All (multi-stakeholder initiative coordinated by World Bank) TA Transport Authority, Ethiopia TAA Tanzania Airport Authority TANROADS Tanzania National Roads Agency TARURA Tanzania Rural and Urban Roads Agency TCAA Tanzania Civil Aviation Authority Tkm Tonne-kilometres TMA Tanzania Meteorology Agency ToR Terms of Reference TPA Tanzania Ports Authority TRC Tanzania Railways Corporation UITP International Association of Public Transport UK United Kingdom (of Great Britain and Northern Ireland) UKAid UNCRD
United Kingdom Aid (Department for International Development, UK) United Nations Centre for Regional Development
UNCTAD UNDESA
United National Conference on Trade and Development United nations Department of Economic and Social Affairs
UNECE UNEP
United Nations Economic Commission for Europe United Nations Environmental Programme
UNSD United Nations Statistics Division UPU Universal Postal Union URRAP Universal Rural Roads Access Program, Ethiopia Vehkm VNR
Vehicle kilometre Voluntary National Review
VOC Vehicle operating costs WMS Welfare Monitoring Survey, Ethiopia

ReCAP | Scoping Study to Explore the Suitability of SDG Indicator 9.1.2 for Rural Access ix
Executive Summary
This scoping study is designed to contribute to the development of SDG Target 9.1 that seeks to ‘develop quality, reliable, sustainable and resilient infrastructure, including regional and trans-border infrastructure, to support economic development and human well-being, with a focus on affordable and equitable access for all’. This study focuses on SDG Indicator 9.1.2, that covers passenger and freight volumes, by mode of transport. The objective is to explore the suitability of including within SDG Indicator 9.1.2 a sub-indicator for rural mobility, with a view to identifying a measurement framework, and data collection methodology, to estimate the movement of rural passenger and freight road transport.
Section 1 provides an introduction to the research topic. Emphasis is given to the justification for improving rural transport in order to alleviate poverty in developing countries. Additionally, the motivation to conduct this research is further explained.
Section 2 gives an overview on the present state of the SDG process, and describes the state of inclusion of rural transport within SDG Indicators 9.1.1 and 9.1.2. The custodian and partner agencies as well as other stakeholders are interested in further collaboration with regard to disaggregation of transport data. However, there is a need for a long-term plan to integrate the issue in the next round of consultations of the Inter-agency and Expert Group on SDG Indicators (IAED-SDG) in 2025. An alternative option would be to create a Transport SDG report for ALL transport related SDGs and to look into geographical disaggregation of the different objectives.
The definition of ‘rural transport’ is inevitably dependent upon the definition of what constitutes a ‘rural area’. Section 3 addresses the issue of how rural areas and rural transport may be defined by examining a number of international and national sources. Clearly, there is no internationally agreed standard definition of a rural area that may be used for this study. Instead, it is recommended to use national definitions where appropriate. Additionally, an appropriate definition of ‘rural transport’ is provided. In the circumstances the most sensible course of action is to adopt a definition that is currently used in the United States and the UK. This approach assumes that the total road network is divided into different categories; i.e. trunk roads, secondary roads, urban roads, rural classified and unclassified roads. To estimate rural traffic volumes according to this definition, classified traffic counts (i.e. broken down by vehicle type) are taken on a sample of roads across the country and the counts are then multiplied by the corresponding length of roads in each category.
The availability of transport data at the international and national level is discussed in Sections 4 and 5. A range of international sources of data have been found that provide land transport data, covering road lengths, vehicle fleet, vehicle kilometres, passenger-kilometres and freight-kilometres, for both road and rail. Many of the international statistics contain important data gaps, and some have major inconsistencies. None of the international data sources specifically identify rural transport data. However rural traffic data is only provided by individual countries, particularly the UK and the USA.
The Country Reports conducted in Ethiopia, Nepal and Tanzania investigated a wide range of institutional and statistical issues. Section 5 provides information for each country on: data collection methodologies, the institutions involved, the rural transport data available, the road classification, the design standards, the vehicle fleet, traffic counting methods, availability of freight and passenger volumes, rail, non-motorised and water transport and the usage of transport models. The main challenges identified were the absence of central databases, large data inconsistencies, capacity and skill gaps, timely availability of data, and lack of resources for data collection. The main features of transport data collection include weaknesses in designing and organising a regular flow of data and information, and the multiplicity of organisations without clearly defined responsibility and coordination.
Section 6 discusses the options of using transport models to estimate rural transport volumes. For this purpose, five models designed for passenger transport are introduced and their suitability discussed. For
ReCAP | Scoping Study to Explore the Suitability of SDG Indicator 9.1.2 for Rural Access x
the most part the prime purpose of the models is not to provide current estimates of traffic volumes, and some of the models, such as the four-step transport model are very complex and expensive to use. As with all models the accuracy of the output data is dependent on the quality and extent of the input data. In low-income countries there is a particular shortage of both transport data and of knowledge and expertise of the more complex transport models. In the absence of a comprehensive rural transport dataset only the Road Network Evaluation Tool (RONET) model and the model of the International Transport Forum (ITF) (if suitably adjusted) might be useful for our purposes to estimate rural transport volumes.
Section 7 provides practical approaches towards transport volume estimations and develops a Basic Model for rural transport estimations. The approach has been developed by the project team based on methodologies used in the USA and the UK. These are accomplished by proposals made from the country experts. The idea is to use existing datasets and adjust them based on the definition of rural roads. For this purpose, RONET may be a useful tool, but local road definitions can be used as well. So, a simple sub-set of “n” relevant classes of rural roads will be selected for our purposes, and all vehicles, passengers and tonnes transported on the selected road will be considered as rural transport. The mathematical mode of calculation for the Basic Model is provided as well.
Section 8 discusses methods of transport data collection for the classified and unclassified road networks, for both traffic counts and mobile phone data. Other sources of information are discussed, including odometer readings and fuel sales. While reliable information on classified roads is mostly available, the identification of unclassified roads constitutes a challenge. The use of the online ‘OpenStreetMap’ (OSM) and satellite images may be feasible options, but their applicability needs to be tested in practice. Roadside traffic counts are indispensable to collect the necessary data for the Basic Model. In any case, the results of the estimations need to be cross checked with national data. Transport fuel sales and household surveys may be used for this purpose.
In conclusion (Section 9), there are a number of institutional and financial constraints, as well as deficits in data availability and an insufficient integration into the SDG process. A number of research needs arise for testing of the Basic Model in practice. From the interviews with the custodian agencies, and partner agencies and experts in the field, two options might be considered to be explored further:
Incremental development: Submission of a suggestion for a rural indicator within 9.1.2. for the next consultation for IAED-SDG review 2025.
An integrated report for ALL transport related SDGs.
As the project ends in February 2020, the following next steps for further development of this work are recommended:
1. Development of detailed proposals of one or both options outlined above. 2. Organise a workshop with selected experts and custodian agencies. 3. Host a side event at the 2nd Global Sustainable Transport Conference in Beijing in May 2020.

ReCAP | Scoping Study to Explore the Suitability of SDG Indicator 9.1.2 for Rural Access 1
1 Introduction
1.1 Rural Transport and Poverty Alleviation Poverty is predominantly rural, and agriculture is the main source of rural income. About 79 per cent of the world’s poor live in rural areas. Extreme poverty today is concentrated and overwhelmingly affects rural populations1. One of the major obstacles preventing rural development is isolation. One measure of isolation is the Rural Access Index (RAI). It measures the proportion of the rural population that lives further than 2 km (typically a walk of 20-25 minutes) from an all-season road2. E.g., the proportion of population with access to an all-season road is 47% in Ethiopia, 59% in Tanzania and 69% in Nepal3. On the basis of this definition it is estimated that 1.178 billion people do not have direct access to an all-season road4. There is also a strong correlation between poor access and poverty (SuM4All, 2017). The lack of all-season roads is especially problematic in countries with pronounced rainy seasons when low volume roads often become impassable even by motorcycles or non-motorised traffic. This difficulty locks people into subsistence farming as markets become regularly inaccessible. Poor access forces them to continue with subsistence production, they remain unemployed, uneducated and poor. Isolated people are more often sick, and too many – especially pregnant women and children - die before reaching medical services. The poor quality of low volume rural roads also results in significant damage to agricultural produce en-route to markets and so reduces its value and the income to the farmer.
Although the observed impacts of road investment are dependent on the underlying economic potential of an area, there is a consensus amongst researchers about the positive effects of improved rural access on income and poverty. This is partly due to increased accessibility to social services and non-agricultural employment. Three major literature surveys confirm the positive effects of rural road improvements5:
The studies by Sieber and Allen (2016), Starkey and Hine (2014) and Hine et al (2016) confirmed that rural road investment can induce a market led local development, via agricultural marketing and increased incomes from farming.
The studies also reveal that rural roads increased the revenues from non-farming activities. This implies a shift from subsistence agriculture to employment in other areas, including services and manufacturing.
Health and educational benefits can also arise from better rural accessibility. However, road investment alone may not be sufficient to generate these effects on their own.
The extent to which the poor and very poor benefit from improved roads largely depends on their asset base and access to resources and opportunities. Thus, the very poor may not benefit from road improvements.
1 https://unstats.un.org/sdgs/report/2019/goal-01/, accessed on 17/01/2020 2 https://datacatalog.worldbank.org/dataset/rural-access-index-rai, An “all-season road” is a road that is
motorable all year round by the prevailing means of rural transport (typically a pick-up or a truck which does not have four-wheel-drive) (Roberts 2005).
3 https://rai.azavea.com 4 See Table 11-1 for RAI world estimates in Workman and McPherson (2019a). 5 These findings stem from large literature surveys that were undertaken by Sieber and Allen (2016), Starkey
and Hine (2014), Hine et al. (2016)

ReCAP | Scoping Study to Explore the Suitability of SDG Indicator 9.1.2 for Rural Access 2
Figure 1: Impacts of improved rural transport on the SDGs
Adapted from Sieber (2019)
India:•A single investment of US$1,000 on rural roads in India lifts 7 people out of poverty, which
equals only US$111 per person.
Improving rural access leads to •Increased agricultural production, •Lower costs for farm inputs •Lower transport costs for marketed outputs. •Price changes in inputs and outputs.
India, the provision of rural roads •Decreased infant and child mortality,improved antenatal and post-natal care•Increased use of preventive health care, improved the management of infectious diseases, •Increased attendance to emergencies and the frequency of visits by a health worker, •Decreased obstetric emergencies.
Impacts of rural access improvements •Increased school enrolment and attendance•Reduced school drop-out rates, reduced absenteeism •Positive impacts on primary school completion rates•Better staffing at schools
Zambia, Uganda, Burkina Faso, Tanzania•Women carry three to five fold the transport load, measured in tonne-km compared to men.•Women in rural areas are up to three times more likely to die while giving birth than women
living in urban centers.
China•For every Yuan invested in rural roads, 9 Yuan in rural GDP is generated. Roads yielded the
largest return on rural non-farm GDP, 35% higher than the return on education investment.
Poor AccessOne billion people live more than two kilometres (25-30 minutes walking) from an all-season road, which refers to 31% of the rural population.
Spatial disparities•About 70% people affected by extreme poverty live in rural regions. Essential disparities exist in
the field of education, nutrition, and health care, as well as for mortality and fertility rates. Access to safe water, sanitation, and health services plays a critical role.
•Improved rural access reduces disparities.
Adaptation to Climate Change•Current and future climate threats pose a significant risk to rural access. •Low volume roads are presently justified if they are designed, constructed and maintained using
low-cost methods. This makes low volume roads more vulnerable to climate risk than high volume roads. Therefore climate adaptation is imperative.

ReCAP | Scoping Study to Explore the Suitability of SDG Indicator 9.1.2 for Rural Access 3
The present focus on urban areas neglects the fact that rural development is important for sustainable national growth, food security and reduction of income and other social service disparities. As shown in Figure 1, improved rural access is indispensable for rural development and supports 9 out of 17 Sustainable Development Goals SDGs (Sieber, 2019).
1.2 Scoping Study on SDG 9.1.2 This scoping study contributes to the development of SDG Target 9.1 that seeks to ‘develop quality, reliable, sustainable and resilient infrastructure, including regional and trans-border infrastructure, to support economic development and human well-being, with a focus on affordable and equitable access for all’. Two indicators have been developed within Target 9.1:
1. Indicator 9.1.1 ‘Proportion of the rural population who live within 2 km of an all-season road’. This indicator is clearly related to rural access. It is commonly referred to as the Rural Access Index (RAI). The RAI is currently being investigated by ReCAP, in partnership with the World Bank.6 This indicator is now attributed to Tier II status, which implies that ‘the indicator is conceptually clear, has an internationally established methodology and standards are available, but data are not regularly produced by countries’.
2. Indicator 9.1.2 ‘Passenger and freight volumes, by mode of transport’. This indicator has already reached Tier I status, which implies that the ‘indicator is conceptually clear, has an internationally established methodology and standards are available, and data are regularly produced for at least 50 per cent of countries, and of the population in every region where the indicator is relevant’. The Custodian Agencies are the International Civil Aviation Organization (ICAO) and International Transport Forum of the OECD (ITF-OECD). Partner agencies are the Universal Postal Union UPU, the United Nations Economic Commission for Europe (UNECE), and United National Conference on Trade and Development (UNCTAD).
The objective of this project is to undertake a scoping study in order to explore the suitability of SDG Indicator 9.1.2 covering rural mobility. The purpose of the scoping study is to investigate the feasibility of developing a sub-indicator of 9.1.2 for rural mobility, with a view to identifying a measurement framework and data collection methodology for estimating the movement of rural passenger and freight road transport.
1.3 Motivation for the Research Before adopting a definition of rural transport, it is useful to understand why rural traffic data is demanded. There are likely to be a number of motivations. These are:
1. A measure of poverty and well-being in rural areas. It is well known that rural populations have much higher levels of poverty and poorer access to social facilities than people living in urban areas. The Rural Access Index (RAI) provides a measure of access; however, it does not tell us how mobility (or the take-up of transport services) varies between countries and areas.
2. A measure of the integration of rural areas into the social and economic life of the country and the economy. Traffic volumes provide a useful indicator of the integration of the rural areas in the wider economy. While passenger transport may be the best measure of poverty and well-being and social integration, freight transport is perhaps a better measure of rural economic integration.
6 Workman and McPherson 2019a, http://www.research4cap.org/SitePages/RAI.aspx

ReCAP | Scoping Study to Explore the Suitability of SDG Indicator 9.1.2 for Rural Access 4
3. To help provide additional data for the allocation of infrastructure budgets. Road Authorities and Road Funds are often hard pressed to justify their budget allocations for the support of rural roads. Reliable rural traffic trends could prove to be very useful in planning and prioritisation of rural road investment.
2 The SDG Process and the Inclusion of Rural Transport The 2030 Agenda for Sustainable Development was adopted by all 193 UN member states in September 2015 in New York. A key part of the agenda was the establishment of 17 Sustainable Development Goals (SDGs), which replaced the former Millennium Development Goals (MDGs). The 2030 Agenda is one of five key global agreements made by the United Nations between March 2015 and October 2016 (see Box 1) and it provides key guidance for national governments as well as multilateral organisations to align their future policies and investments. As part of the stakeholder consultation the annual Conference of the Parties (COP) 25 was attended to identify opportunities to link rural transport to the current climate process and to test the idea of a holistic Transport SDG report (see Section 2.2).
Box 1: Key Global Agreements
• Sendai Framework for Disaster Risk Reduction (March 2015) • Addis Ababa Action Agenda on Financing for Development (July 2015) • The 2030 Agenda for Sustainable Development (September 2015) • Paris Agreement on Climate Change (December 2015) • New Urban Agenda (October 2016)
As the aim of this report is to explore the opportunities to increase the visibility of rural access to contribute to the overall success of the SDGs, particularly in developing countries, it is important to understand the SDG process and identify the opportunities to include a new indicator in the forthcoming years. This section helps to explain the SDG process, the role of key stakeholders, as well as the role of transport within the SDG Indicator Framework. It also considers the specific focus of rural transport within SDG 9.1.2. It is based on a detailed analysis of the current documents available online as well as interviews with the custodian agencies (ICAO, ITF), partner agencies (UNECE) and further experts from UNHABITAT (see details in Section 3.1).
2.1 (Rural) Transport and the SDGS There is no dedicated transport related SDG Goal unlike other sectors, such as water (SDG 6) or energy (SDG 7). Several initiatives highlight the challenges for the sector. This is demonstrated by the Partnership for Sustainable Transport (SLoCaT), Sustainable Mobility for All (SuM4All), and the UN High Level Panel for Sustainable Transport. As there is no separate goal for transport, it is given a lower level of priority within country actions. As a result, there is a lack of guidance for multilateral support, which inevitably leads to a lack of focus and more complex data collection and reporting. The low level of reporting of transport indicators in the Voluntary National Reports (VNR) (see Section 2.3) reflects the diffuse nature of how transport is included within the SDG Targets and Indicators.
SLoCaT (2019) identified five direct and seven indirect related targets to transport. The second circle in Figure 2 shows the direct related targets, while the outer circle represents the indirect targets.

ReCAP | Scoping Study to Explore the Suitability of SDG Indicator 9.1.2 for Rural Access 5
Figure 2: Direct and indirect related SDGs targets to transport (SLoCaT, 2019)
While there are two targets directly related to urban transport (11.2 and 11.6), only indicator 9.1.1 is related directly to rural transport. In none of the transport related indicators is a spatial disaggregation provided, so there is no differentiation between rural and urban transport.
2.2 Linking SDGS and the climate process – observations from COP 25 The Conference of the Parties (COP) 25 was hosted by Chile, but due to social unrest in the country it took place in Madrid from the 2nd to the 13th of December 2019. More than 27,000 delegates were registered for the two weeks. This section highlights observations with particular relevance to the integration of a rural dimension within SDG Indicator 9.1.2, based on personal stakeholder interviews.
More than 50 transport related events took place. While several events were hosted outside the official venue, the vast majority happened at the so-called blue zone, where only registered delegates had access. The detailed event list can be found here:
http://www.ppmc-transport.org/sustainable-transport-events-at-cop25/
The vast majority of the events were related to mitigation actions in passenger land transport. It is not surprising, that due to the rather lower amount of emission reduction potential of rural transport there is not much attention on the mitigation action within the NDCs (National Determined Contribution) and therefore hardly any discussion on rural transport at COP25. In addition, there was almost no attention to transport and adaptation, which is highly relevant to rural transport. Only one event focused on resilience.
ReCAP | Scoping Study to Explore the Suitability of SDG Indicator 9.1.2 for Rural Access 6
The two key events for transport were the Transport Day on 6th December and the Transport event of the Marrakesh Partnership on 7th December. Initially the Chilean presidency was planning to host a Transport Ministers conference which would have been the first of its kind at a climate conference. However, although this did not happen in Madrid it is still expected that the Chilean Transport Minister will continue her efforts to meet her counterparts in the first half of 2020 and to come up with a future declaration signed by the transport ministers. The UK Transport Minister attended the pre-meeting in Costa Rica and appears to be open for a continuation of these efforts in the preparation for COP 26 and its COP presidency until November 2021. The UK will host COP 26 in Glasgow in December 2020.
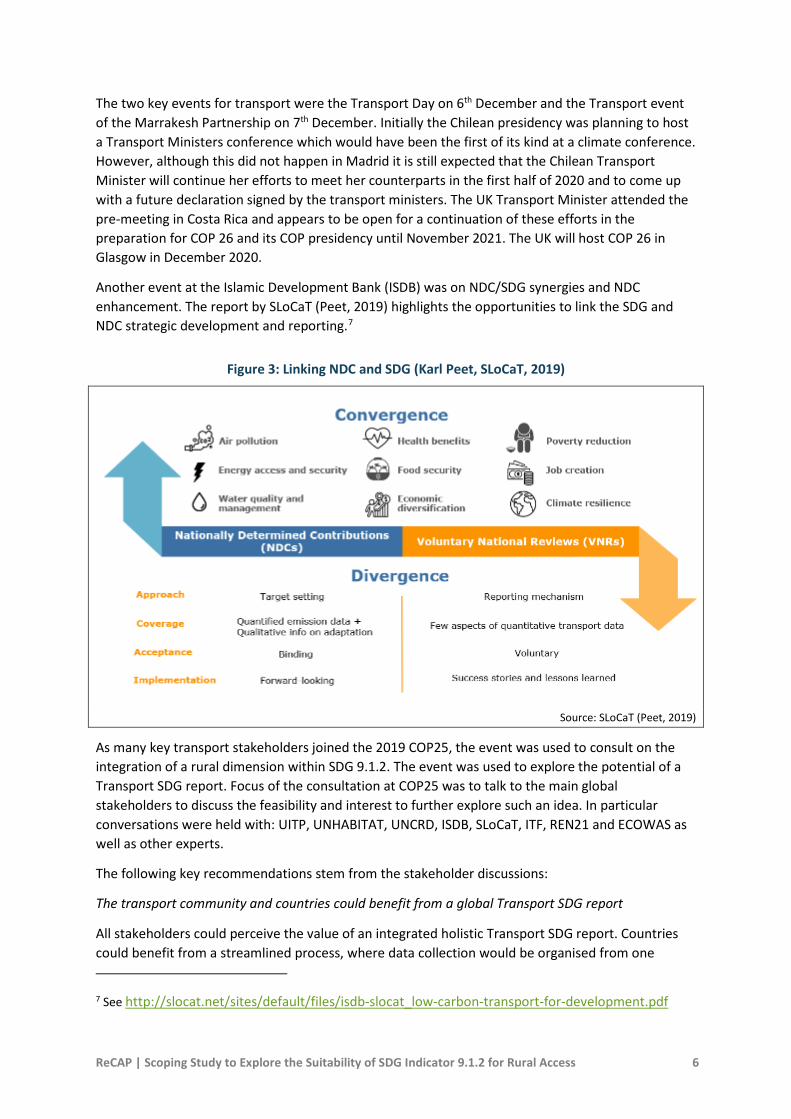
Another event at the Islamic Development Bank (ISDB) was on NDC/SDG synergies and NDC enhancement. The report by SLoCaT (Peet, 2019) highlights the opportunities to link the SDG and NDC strategic development and reporting.7
Figure 3: Linking NDC and SDG (Karl Peet, SLoCaT, 2019)
Source: SLoCaT (Peet, 2019)
As many key transport stakeholders joined the 2019 COP25, the event was used to consult on the integration of a rural dimension within SDG 9.1.2. The event was used to explore the potential of a Transport SDG report. Focus of the consultation at COP25 was to talk to the main global stakeholders to discuss the feasibility and interest to further explore such an idea. In particular conversations were held with: UITP, UNHABITAT, UNCRD, ISDB, SLoCaT, ITF, REN21 and ECOWAS as well as other experts.
The following key recommendations stem from the stakeholder discussions:
The transport community and countries could benefit from a global Transport SDG report
All stakeholders could perceive the value of an integrated holistic Transport SDG report. Countries could benefit from a streamlined process, where data collection would be organised from one
7 See http://slocat.net/sites/default/files/isdb-slocat_low-carbon-transport-for-development.pdf

ReCAP | Scoping Study to Explore the Suitability of SDG Indicator 9.1.2 for Rural Access 7
institution rather than a broad set of different organisations as it is today. Many actors also see the value of including the NDC reporting into such a process. It was also highlighted that the complexity and interest of different UN agencies might be a barrier.
A Transport SDG Report could include further indicators including rural transport
A Transport SDG Report should not only include current SDGs, but also further objectives and indicators, which are currently not part of the SDGs. This would allow further disaggregation including geographical. This would be a window for better recognition of rural transport. The International Association of Public Transport (UITP) is currently partnering with UNHABITAT to work on a new SDG 11.2 report, which will go beyond the current 11.2.1 indicator. They are aiming to bring together further disaggregated data on urban transport. While the project will only start at the beginning of next year, they are likely to present the concept at the Beijing Conference. They would be interested in using this report as an example for a part of a wider Transport SDG report.
A Transport SDG should not replace existing data collection and reporting
While all institutions see the value and benefit of a wider report, they argue that products like the ITF Transport Outlook had their own target group and value and should not be replaced. It would be important to guarantee the continuation of those products to get the buy-in from all stakeholders.
Regional data reporting could be a starting point
In conversations with regional UN agencies (United Nations Centre for Regional Development (UNCRD) and the Economic Commission for West African States, (ECOWAS)), there was an interest to explore such a reporting scheme first at a regional level. UNCRD would be very interested to develop such a reporting framework as a successor of their Bangkok Declaration, which will be renewed next year. Such a regional reporting framework should be accompanied by a data platform to improve access and transparency. ECOWAS shared their experience with a similar product on SDG 7 (Energy) for the Arab region supported by the ISDB.8 The report, launched at one of the ISDB hosted events, includes energy data reporting not only on SDG 7, but also 13 and 14. Furthermore, it includes an analysis of policy actions in the field, which is seen as particularly helpful for countries. The work of ECOWAS also included an NDC tracking on energy. ISDB expressed an interest to explore support for a similar transport document for the region.
Strong institutional ownership as a pre-condition
To enable such a global framework, most of the stakeholders see the need for an institutional buy-in from a UN agency. UNDESA (United nations Department of Economic and Social Affairs) as well as UNEP (United Nations Environmental Programme) were mentioned as potential hosts for such a report. However, recent experience from SLoCaT and the global network on renewable energy (REN21) with their global status reports on sustainable transport and renewable energy has shown that a bottom-up initiative might also create value.
2.3 Annual Review and Reporting The High-level Political Forum on Sustainable Development serves as the central UN platform for the follow-up and review of the SDGs. Every year in July the Forum holds its meeting in New York and reviews several selected targets as well as country reports. The so-called Voluntary National Reviews
8 See https://www.unescwa.org/sites/www.unescwa.org/files/publications/files/energy-progress-report-arab-region-english.pdf

ReCAP | Scoping Study to Explore the Suitability of SDG Indicator 9.1.2 for Rural Access 8
(VNR) include their latest developments on the SDG indicators. They also summarise key actions contributing to the global goals. Without a separate goal for transport, every year SLoCaT provides a review from a transport perspective.
Although the overall inclusion of transport in the reporting is constantly growing (in 2016 only 64% of the countries included transport in their VNRs and by 2019 this had increased to 95%), there is a lack of quantitative data provided. The information on different goals varies enormously as Figure 3 shows. In the first VNR cycle, only 18% provided specific sub-sector targets. Out of all 156 VNR submitted by 143 countries between 2016 and 2019 for rural transport only five countries set specific targets for the Rural Access Index (RAI) indicator. For example, Senegal in its 2018 VNR set the goal of “100% of rural population to live within 2 km to a practicable road all year.”
Figure 4: Number of VNRs (143 countries submitted 156 VNRs) with references to transport sub-sectors (2016-2019)
Source: SLoCaT 2019
Actions on rural all-season roads (Indicator 9.1.1) were reported by only 31 out of 156 submitted VNR by 143 countries during the period 2016 to 2019. This may be explained by the fact that the RAI was only approved as Tier II status in December 2018, hence the relatively low number in comparison to the other SDG indicators might be due to there being less attention on lower tier status indicators. Section 2.2 shares more of the background of the ReCAP programme and its work on SDG Indicator 9.1.1. funded by the Department for International Development (DFID).
Box 2. Tier Classification Criteria/Definitions
Tier I: Indicator is conceptually clear, has an internationally established methodology and standards are available. Data are regularly produced by countries for at least 50 per cent of countries and of the population in every region where the indicator is relevant.
Tier II: Indicator is conceptually clear, has an internationally established methodology and standards are available, but data are not regularly produced by countries.
Tier III: No internationally established methodology or standards are yet available for the indicator, but methodology/standards are being (or will be) developed or tested.
Source: UNSD, https://unstats.un.org/sdgs/iaeg-sdgs/tier-classification

ReCAP | Scoping Study to Explore the Suitability of SDG Indicator 9.1.2 for Rural Access 9
Overall, due to the wide distribution of transport related indicators within the SDG process and the lack of geographic disaggregation, transport as a whole and rural transport in particular, lacks recognition within the country reporting.
2.4 Management and Institutional Set Up The collection of the SDG data is undertaken annually, however, the majority of the countries have only shared their VNRs once between 2016 and 2019. Each country is responsible for the collection and national monitoring of their data via their National Statistical Office (NSO). The NSO submits the data collected via different line ministries and other national institutions. The detailed data stays with the national government; however there is a minimum requirement to provide one national aggregate figure per indicator. National governments are encouraged to share more details on the sub-components of the indicators and a higher level of disaggregation with the custodian agency and through their VNR.
The custodian agencies have responsibility for compiling and verifying country data as well as submitting those data to the United Nations Statistics Division (UNSD). Furthermore, the agencies are responsible for developing standards and recommending methodologies. Many of the agencies also use the data for their own databases and reporting.
In the case of missing country data, data collected through a different methodology, or inconsistency between different data sources, agencies “may need to do estimates or adjust the data together with the specific countries” (UN Water). Figure 5 summarises the data flow for SDG 6 as an example, in which the international agencies in the figure are equivalent to custodian agencies.
Figure 5: Data Flow in SDG Reporting – SDG 6 (UN Water)
Source: https://www.sdg6monitoring.org/activities/roles-and-responsibilities/
The Custodian Agencies for SDG 9.1.2 are the International Civil Aviation Organization (ICAO) and the International Transport Forum (ITF). United Nations Economic Commission for Europe (UNECE), UN Environment Program (UNEP) and Universal Postal Union (UPU) are the other partner agencies.9
9 See https://unstats.un.org/sdgs/metadata/files/Metadata-09-01-02.pdf

ReCAP | Scoping Study to Explore the Suitability of SDG Indicator 9.1.2 for Rural Access 10
The Inter-Agency and Expert Group on the Sustainable Development Goal Indicators (IAEG-SDGs) was set up by the United National Statistical Commission to develop and implement a global indicator framework. The indicators are classified into three tiers based on their methodological development and the availability of data. For details on the tier classification see Box 2. The metadata for Tier I and II indicators are made available in the metadata repository.10 Tier III indicators require work plans to be developed outlining the methodological development of the indicators for approval by the IAEG-SDGs. The current Tier III work plans are available on the UNSD website.11
Furthermore, IAEG-SDG is responsible for reviewing the methodology development of the indicators.12 The IAEG-SDG, up until September 2019 carried out an open consultation reviewing the current indicators and allowing suggestions for refinements, revisions, replacements, additions and deletions to present for decision to the UN Statistical Commission in March 2020. There were no suggestions tabled in the summary report for SDG indicator 9.1.2 or any other transport related indicators (https://unstats.un.org/sdgs/iaeg-sdgs/2020-comprev/UNSC-proposal/).
The next comprehensive review to present to the UN Statistical Commission is scheduled for 2025.
2.5 Data Collection and Sources for Indicator 9.1.2 Currently the key data sources for SDG 9.1.2. are provided by ICAO, ITF, UNECE and United Nations Conference on Trade and Development (UNCTAD). So far, the only disaggregation of transport volumes relates to passengers and freight, and mode of transport. In conversations with all custodian and partner agencies, all expressed an interest to explore the possibility to consider further geographical disaggregation, for example along the lines of rural/urban/interurban and international transport. While other SDGs have discernible policy objectives, such as SDG 3.6 on road safety, which has a clear target to reduce total fatalities from road crashes, the current reported data on SDG 9.1.2 lacks value in terms of targets to guide policy action. Considering the overall need to reduce the negative impact on climate, air pollution etc. through transport infrastructure, a growth of passenger kilometres by road might be considered negative by some. However, for most developing countries rural transport only contributes a very small proportion of transport related emissions and there would be strong poverty implications if rural transport volumes did not increase. The issues need to be considered further, including ways of decarbonising rural transport.
10 See https://unstats.un.org/sdgs/metadata/ 11 See https://unstats.un.org/sdgs/tierIII-indicators/ 12 For terms of reference for the Inter-Agency and Expert Group see: https://unstats.un.org/sdgs/files/IAEG-SDGs%20Terms%20of%20Reference_2017.pdf

ReCAP | Scoping Study to Explore the Suitability of SDG Indicator 9.1.2 for Rural Access 11
3 Definitions of Rural Transport and Rural Areas The measurement and quantification of rural transport volumes is dependent on which areas, which roads and which type of transport are considered rural. These definitions will differ considerably between countries but are essential in consideration of SDG 9.1.2.
3.1 Definition of Rural Areas The definition of how rural areas are characterised differs from country to country, and in some countries several definitions exist. Many countries define rural as being ‘not urban’. The criteria used by countries to decide whether to define a place as ‘urban’ include population size, population density, type of economic activity, physical characteristics, level of infrastructure, or a combination of these or other criteria. Some simply list their urban areas by name. Examples are given in Table 1.
Table 1: Examples for Definitions of rural areas
Country Rural Area Definition Source
England and Wales
Rural areas that are located outside of urban areas that have a population of more than 10,000 people.
Department of Transport, UK (2018) Road Lengths in Great Britain, Statistics: Notes and Definitions. Scotland Rural areas that are located outside of urban areas that have a
population of more than 3,000 people.
Germany Sparsely populated rural areas: Districts with population in towns < 50% and population densities < 100 per km2. Towns are defined by population > 5,000.
Bundesamt für Bauwesen und Raumordung, www.bbr.bund.de, 2019
USA Population < 2,500, Density < 1000 inhabitants/square mile, no large paved area
Ratcliffe (2016)
Brazil Rural areas are locations outside a municipality's urban development (i.e. buildings and streets).
https://en.wikipedia.org/wiki/Rural_area
India Population: < 15,000 Planning Commission
Population density < 400 per square kilometre, Villages with clear surveyed boundaries but no municipal board, > 75% of male working population involved in agriculture and allied activities
National Sample Survey Organisation India
Population: < 49,000 Reserve Bank of India
Ethiopia Rural areas are defined according to the following criteria: Rural areas comprise all areas not classified as urban. Urban areas: Population > 2000, Additionally (i) all administrative capitals (ii) localities with Urban Dweller's Association (UDAs) not included in (i), and (iii) all localities which are not included either in (i) or (ii) above having a population of 1000 or more persons, and whose inhabitants are primarily engaged in non-agricultural activities.
Country Survey
Nepal There is no definition of rural areas. Urban areas: (i) population above 10,000; (ii) annual income about USD 5,000; (iii) availability of motorable roads, piped drinking water, electricity and major market.
Country Survey
Tanzania Whatever is not urban is considered rural. Urban areas: An urban area is the region surrounding a city. A city is defined as: i) Minimum population of 500,000, ii) Self sustenance: (at least 95% of annual budget), iii) Any municipality can be designated as a city if it has some symbolic importance.
Country Survey
ReCAP | Scoping Study to Explore the Suitability of SDG Indicator 9.1.2 for Rural Access 12
A list compiled by the UN Population Division (2018) gathers the definitions of urban population used in censuses in 232 countries (see Annex 1). Only one criterion is used by 104 countries, the remaining countries use up to five criteria. Administrative criteria dominate (121 countries) followed by population size and density (108). The most frequently used threshold values are 2,000 inhabitants, and 5,000 inhabitants. The share of rural population for each country may be retrieved from this website: https://population.un.org/wup/DataQuery/.
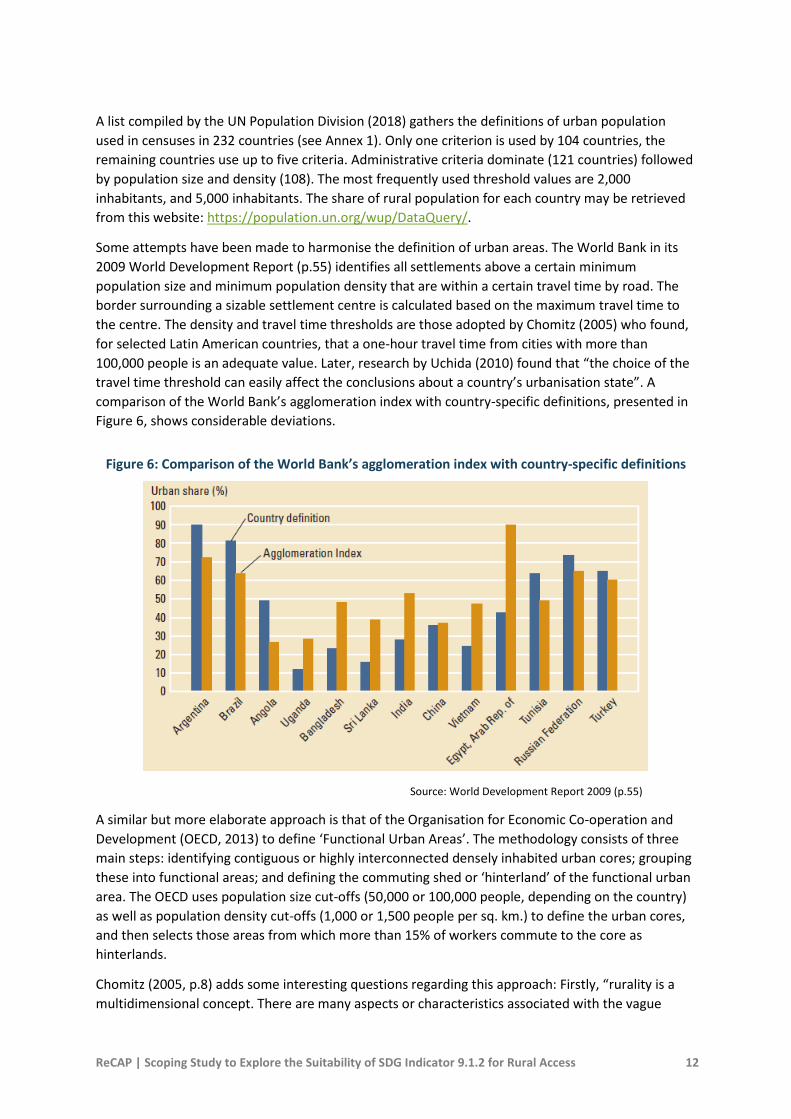
Some attempts have been made to harmonise the definition of urban areas. The World Bank in its 2009 World Development Report (p.55) identifies all settlements above a certain minimum population size and minimum population density that are within a certain travel time by road. The border surrounding a sizable settlement centre is calculated based on the maximum travel time to the centre. The density and travel time thresholds are those adopted by Chomitz (2005) who found, for selected Latin American countries, that a one-hour travel time from cities with more than 100,000 people is an adequate value. Later, research by Uchida (2010) found that “the choice of the travel time threshold can easily affect the conclusions about a country’s urbanisation state”. A comparison of the World Bank’s agglomeration index with country-specific definitions, presented in Figure 6, shows considerable deviations.
Figure 6: Comparison of the World Bank’s agglomeration index with country-specific definitions
Source: World Development Report 2009 (p.55)
A similar but more elaborate approach is that of the Organisation for Economic Co-operation and Development (OECD, 2013) to define ‘Functional Urban Areas’. The methodology consists of three main steps: identifying contiguous or highly interconnected densely inhabited urban cores; grouping these into functional areas; and defining the commuting shed or ‘hinterland’ of the functional urban area. The OECD uses population size cut-offs (50,000 or 100,000 people, depending on the country) as well as population density cut-offs (1,000 or 1,500 people per sq. km.) to define the urban cores, and then selects those areas from which more than 15% of workers commute to the core as hinterlands.
Chomitz (2005, p.8) adds some interesting questions regarding this approach: Firstly, “rurality is a multidimensional concept. There are many aspects or characteristics associated with the vague

ReCAP | Scoping Study to Explore the Suitability of SDG Indicator 9.1.2 for Rural Access 13
concept of rurality, including access to social and infrastructure services, linkages to employment and commodity markets, involvement with agriculture and natural resources. These characteristics are correlated, but not perfectly so.” Secondly the author remarks that “for many of the rural characteristics of interest, there does not appear to be a natural dividing line or break point between rural areas and urban areas. …Population density and remoteness from large cities constitute two useful ‘general purpose’ indicators of rurality.”
The SDG Indicator 9.1.1 is the Rural Access Index (RAI), which is defined as the percentage of the rural population that lives within 2 km of an all-season road. The rural-urban definition is critically important in calculating the RAI. Although the actual size of the population living further than 2 km of an all-season road will inevitably be ‘rural’ by almost any definition, the actual size of the rural population (i.e. the denominator of the RAI) could vary substantially according to the rural-urban definition. The investigation carried out in 2016 into the RAI (World Bank 2016) adopted the Global Rural Urban Mapping Project (GRUMP) v1 database from 1995. However new approaches have been recommended by the UN.
The current ReCAP investigations into the RAI recommend that where a country has consistent definition or the rural-urban boundary can be consistently mapped and is used for all national statistics, under these circumstances the National Statistics Office can decide to use these boundaries as a basis for the calculation of the RAI (Workman and McPherson, 2019a).
In summary, we have to recognise that definitions of rural and urban will vary between countries, and that inevitably rural traffic volumes will, in most instances, be defined by the local road classification system. Due to the difficulties and effort involved in defining a unique or separate classification system, the latest advice proposed by the United Nations Statistics division (UNSD)13 is to follow the local definition. This approach is adopted by Workman and McPherson (2019) for the RAI, and it is probably the most sensible course of action for our purposes.
3.2 Definition of Rural Transport In collecting data on rural traffic volumes, it is important that we have an unambiguous definition. Conceivably there are several different approaches we could adopt. Each definition may require different data collection and analysis procedures (see Figure 7).
Three possible approaches are as follows:
A. Traffic volumes on rural classified and unclassified roads.
B. Traffic volumes within rural districts, irrespective of road types.
C. Traffic volumes generated by, or attracted to, rural areas.
13 See https://unstats.un.org/unsd/demographic/sconcerns/densurb/densurbmethods.htm

ReCAP | Scoping Study to Explore the Suitability of SDG Indicator 9.1.2 for Rural Access 14
Figure 7: Rural transport according to different definitions
The different definitions of rural transport are depicted in Figure 7. Taking each definition in turn:
A. Traffic volumes on rural classified and unclassified roads. This approach assumes that the total road network is divided into different categories i.e. trunk roads, secondary roads, urban roads, rural classified and unclassified roads. To estimate rural traffic volumes according to this definition, classified traffic counts (i.e. broken down by vehicle type) are taken on a sample of roads across the country and the counts are then multiplied by the corresponding length of roads in each category.
This approach is used by the United States and the UK to obtain total vehicle travel, by different types of vehicles. It would be relatively easy to collect rural traffic volumes using this approach.
Only part of any journey starting in a rural area and going to town, or using a main road, would be recorded as ‘rural’. In fact, people living next to a main or secondary road in rural areas may not have their journeys classified as rural. To that extent the approach does not precisely match the Rural Access Index (RAI).
B. Traffic volumes within rural districts, irrespective of road types. This approach involves separating out the roads in urban areas from the rest of the network. All traffic flowing on trunk and secondary roads, not in an urban area, would be classified as ‘rural’ and added to traffic on lower level rural roads. Obviously much higher volumes of traffic would now be classified as ‘rural’ than in option A. The data could be collected via classified counts, but care would need to be taken to carefully separate out urban from rural counting stations on main and secondary roads.
C. Traffic volumes generated by, or attracted to, rural areas. With this approach traffic with an origin or a destination in rural areas would be classified as rural. To collect this data, detailed roadside origin and destination surveys would have to be undertaken to obtain a complete result. The data would then need to be carefully analysed

ReCAP | Scoping Study to Explore the Suitability of SDG Indicator 9.1.2 for Rural Access 15
to ensure that the origin or destination is rural. Journey length may be collected directly by the survey, or estimated afterwards from the origin and destination data. So agricultural produce or minerals travelling to a port, where the bulk of the distance is on main roads would be classified as rural.
Rural household surveys could be used to collect the passenger component of this traffic. However, because of the diversity and small-scale nature of most farms, and rural pickup points, in developing countries, it would be impossible to collect the freight component by surveying ‘farms’ or other rural based institutions.
All three approaches can provide data traffic volumes by vehicle type, including pedestrian and bicycle volumes. Estimates of rural ‘tonne-km’ and ‘passenger-km’ may be obtained from knowledge of typical loading patterns of different vehicles.
On balance, the most sensible course of action is to adopt definition A. This approach will be the easiest to match with existing road classification systems and is currently adopted by the United States and the UK to estimate rural traffic volumes.
It has to be emphasised that travel in and around the village, which is usually done on foot or using non-motorised means of transport is not included in this research, even though it constitutes a major share of rural household’s travel activities (Barwell, 1993). Travel within and round the village is not treated here since the research topic focusses on rural travel that interacts with the wider economy. However, longer distance walking and cycling should be included where traffic counts are to take place.

ReCAP | Scoping Study to Explore the Suitability of SDG Indicator 9.1.2 for Rural Access 16
4 International Transport Statistics A range of international sources of data have been found that provide land transport data, covering road lengths, vehicle fleet, vehicle kilometres, and passenger-kilometres and freight-kilometres, for both road and rail. None of the international data sources specifically identify ‘rural transport’ data. However rural traffic data is provided by individual countries, particularly the UK and the USA.
Detailed information on the number of countries covered by different statistics is provided in Table 2. Although other sources of data exist, the following sources were found to be the easiest to use and to make inter-country comparisons.
Table 2: The number of countries/territories covered by different international sources for Land Transport.
Within the international datasets most data is available from the higher income countries, particularly Europe, and other OECD countries such as the USA and Canada. The least data is available from low-income counties.
Unfortunately, there are wide discrepancies between the different data sources, particularly for country data outside Europe. For example, the UN SDG dataset indicates that there were 1.7 trillion (i.e. million million) road passenger-km for the United States (2017), while other figures are 6.9 trillion (IRF, 2014) and 5.4 trillion (UNECE, 2015). The US Bureau of Statistics gives the figure of 8.9
UN SDG list UNECE OECD,
ITF
AICD (World Bank)
IRF1 PIARC OICA UIC
Road length (categories) Date
41 (5)
2016
40 (5)
2010
96 (5)
2014
39 (1)
2014-2017
Vehicle fleet (categories) Date
42 (5)
2015
40 (1)
2010
131 (6)
2013
37 (6)
2014-2017
131 (2)
2015
Vehicle- km (road types) (vehicle types) Date
26
(4) 2014
40 (3)
2010
47 (4) (5)
2014
Road Freight tonne-km Date
191 2017
34 2014
502 2013
56 2014
Road Passenger-km Date
234
2017
34
2013
40
2013
32
2014
Rail freight Tonne-km Date
120
2017
36
2013
42
2018
79
2014
64
2018
Rail Passenger-km Date
233
2017
37
2013
41
2018
79
2014
67
2018

ReCAP | Scoping Study to Explore the Suitability of SDG Indicator 9.1.2 for Rural Access 17
trillion road passenger km for 2017. Some of the differences may relate to undisclosed definition problems. Major differences between data sources were also recorded for India, but fewer differences were found for major countries in Europe. The UN SDG data is supplied by the International Transport Forum (ITF), based at the OECD.
4.1 Africa Infrastructure Country Diagnostic (AICD). This data was collected to analyse and identify the shortfall in Africa’s infrastructure. The data (collected for 2010) relates to 40 African countries and covers road length, vehicle fleet and vehicle-kilometres. Although the data is now somewhat out-of-date it is useful because African data is substantially missing from other data sources. Estimates of average traffic volumes are provided for different road classes. The information was built up from link-by-link information from primary, secondary, and where possible tertiary data. Rural roads are not explicitly mentioned, but estimates of traffic on the classified tertiary network are given, together with lengths of both the classified and unclassified road networks. The traffic data was derived by use of the RONET model (RONET is discussed in Section 5) (Gwilliam et al, 2011).
4.2 International Civil Aviation Organization (ICAO) The International Civil Aviation Organization (ICAO) collects air transport data for the world’s airlines, and passenger and freight kilometre data are provided for 108 countries (2015) (https://www.icao.int/sustainability/Pages/Statistics.aspx).
4.3 International Road Federation (IRF) The IRF publishes the largest database of road transport data for different countries, covering road lengths, vehicle fleet, vehicle kilometres, passenger-km and freight tonne-km, including for both road and rail. The data is drawn from an annual questionnaire sent to over 200 countries, and the data is supplemented from national statistics and secondary sources. Efforts are made to ensure the data is consistent across countries and over time.
Despite its size there are still significant gaps in the dataset, particularly relating to smaller developing countries. For example, for 2014 passenger-km data are only provided for 32 countries. The vehicle-km data is disaggregated by both vehicle and road type. For the latter, data is provided in four classifications: motorways, highways and main roads, secondary and regional roads, and ‘other roads’. However, no distinction is made between urban and rural roads. The IRF have confirmed that transport volume data are supplied direct from the individual countries and are not modelled by the IRF14 (IRF World Road Statistics, 2017).
4.4 International Transport Forum, (ITF) The ITF provides an online database of road, rail and water transport passenger-km and freight tonne-km data. Data is collected from around 50 countries, including the 36 high-income countries in the OECD as well as from other middle income countries including China, India and the Russian Federation (https://www.oecd-ilibrary.org/transport/data/itf-transport-statistics_trsprt-data-en).
4.5 International Organisation of Motor Vehicle Manufacturers (OICA) The OICA provides an online database of commercial vehicles and motor cars in use for 131 countries.
(http://www.oica.net/production-statistics/)
14 Communication with Ms Julia Funk, Head of Statistics, IRF.

ReCAP | Scoping Study to Explore the Suitability of SDG Indicator 9.1.2 for Rural Access 18
4.6 International Union of Railways (UIC) Every year, the UIC publishes passenger-km and freight tonne-km data for 67 countries. This is available online.
(https://uic.org/support-activities/statistics/)
4.7 United Nations Economic Commission for Europe (UNECE) The UNECE provides an online database of a range of transport statistics from 56 European and central Asian countries, as well as from the United States. The data covers road length, vehicle fleet, vehicle-km, as well as passenger-km, freight tonne-km for both road and rail. The UNECE and the OECD, ITF share a common questionnaire.
(https://www.unece.org/trans/main/wp6/wp6.html)
4.8 United Nations SDG database The UN SDG database provides estimated data for the SDG Indicator 9.1.2 for national passenger-km and freight-km for road, rail and air transport. Air transport data is supplied by ICAO. The land transport data covers over 230 countries and territories. This data is derived from a model and supplied by ITF. The model is briefly discussed in Section 6.
(https://unstats.un.org/sdgs/indicators/database)
4.9 Sustainable Mobility for all (SuM4All) The SuM4All initiative is currently tracking global mobility. There are plans (currently in development) to present data for over 180 countries online in a user-friendly format via ‘country mobility’ snapshots. Currently data is available (by clicking on a World Map) on a range of transport related indicators including the Rural Access Index, road safety, transport emissions, logistics performance and a range of quality indicators of roads, rail, ports and air transport. In terms of transport volumes, only rail passenger-km is available for some countries. No data is presented on road lengths, vehicle populations, or vehicle-km.
(http://sum4all.org/gra-tool/country-performance/global)
4.10 World Road Association (PIARC) PIARC is another source of statistical information. It mostly collects data from Europe and Asia, with very little data from Africa or South America. Data is provided on motorway lengths and vehicle fleet populations. (World Road Association, 2018).
(https://www.piarc.org/en/order-library/29489-en-PIARC%20Data%20on%20Roads%20and%20Road%20Transport%20(2014-2018)

ReCAP | Scoping Study to Explore the Suitability of SDG Indicator 9.1.2 for Rural Access 19
5 Results of the Country Surveys The objective of this section is to give an overview of the surveys on data availability undertaken in Ethiopia, Nepal and Tanzania. The scope of this survey was not to collect data, but to find out which transport data are available at the country level, how they are generated, and to assess the data quality. The exercise was conducted through interviews with relevant institutions and country experts, as well as by internet research. The complete outputs of the surveys are provided in Annex 3 using a standardised questionnaire.
5.1 Data Collection and Institutions in Ethiopia In order to develop a sustainable transport system effectively, a methodology for the collection, collation and analysis of data for key indicators is required. The overall picture of road and transport data in Ethiopia shows that there is a lack of clearly defined objectives and functional institutional arrangements to support sector and sub-sector planning, operations, management and decision functions. In general, there have been weaknesses in assessing information needs (at different levels), selecting indicators, determining data requirements (type of data; quantitative and qualitative, uniformity and standardisation, source of data, method, verification), collating and aggregating data into a manageable and useful manner, data processing and analyses, interpretation of data, and data storage, reporting and dissemination.
While a wide range of raw data is collected, there is no harmonised system for coordination, data collection, analysis, reporting and dissemination. Of particular importance is that there are no standardised procedures for presentation of annual statistical reports for the transport sector as a whole. In general, there are apparent gaps in establishing the scope and purpose of transport sector data and information management, and institutional arrangements do not assign clearly defined responsibilities.
5.1.1 Main features of transport data collection in Ethiopia
There are important weaknesses in the design and organisation of transport data collection to ensure a regular flow of data and information. There is a multiplicity of organisations that lack coordination, and do not have clearly defined responsibilities. Much of the available data is collected by the Central Statistical Agency (CSA), the Ethiopian Roads Authority (ERA), the Transport Authority (TA), the Ethiopian Civil Aviation Authority (ECAA), the Ethiopian Railway Corporation (ERC), the Federal Police for road safety, Regional Road and Transport (MoT), the Ministry of Education (MoE), and the Ministry of Health (MoH). ERA, in particular, uses the services of independent consultants in collecting pertinent transport and transport-related data, as part of monitoring sector performance (Road Sector Development Program Performance and the SDGs Transport Indicators) as well as the impact evaluation of the Universal Rural Roads Access Program (URRAP), using a wide range of road, transport, and non-transport or welfare indicators. The methodology applied in relation to sources of data is summarised as follows.
i) Central Statistical Agency (CSA)
The CSA carries out a range of surveys including the socio-economic survey, the demographic and health survey, the agricultural sample survey, the household income, consumption and expenditure survey, and the welfare monitoring survey, as well as other types of surveys. In broad terms, the sample frames for these surveys contain Enumeration Areas (EAs) of all regions and respective households. Cartographic census frameworks are used to select the primary sampling units (PSU). Sample design involves stratified two-stage cluster sampling design, the

ReCAP | Scoping Study to Explore the Suitability of SDG Indicator 9.1.2 for Rural Access 20
Enumeration Areas (EA) as the primary sampling units (PSU) and the secondary sampling units (SSU) are the households.
The Ethiopian Socio-economic Survey (ESS) panel data covers a range of topics including demography, education, health, savings, labour, welfare, agriculture, food security and climatic shocks.
The Household Income, Consumption and Expenditure Survey Provides data on the proportion of household expenditure on transport by the urban and rural poor (‘extreme poor’ and ‘poor’, used as a ‘proxy’ to capture changes in the level of affordability of transport cost as percentage of income). A stratified two-stage sampling process is also used for data collection.
The Welfare Monitoring Survey (WMS) is carried out once every five years and generates basic indicators and data related to various socio-economic dimensions. These include health, education, and related non-income aspects of poverty. In addition, access to, utilisation of, and satisfaction with basic facilities and services are provided. The survey report presents data on the use of Intermediate Means of Transport (IMT), proximity to health services (<6 km, <11 km and <15 km), nearest pre/post-natal care, transport costs and time as major obstacles to employment. The perception of the quality of road infrastructure and transport services is also provided. Some of the SDG transport indicators have WMS as a data source. While the definition and categories of some of the data are not explicitly consistent with the specific requirements for the updating of the SDG indicators, it has been possible to adapt them without losing relevance and reliability.
ii) The Ethiopian Roads Authority (ERA)
The Ethiopian Roads Authority (ERA) provides data and information related to road access, mobility (traffic counts, vehicle-kilometres travelled, road condition, etc.) as part of its Annual Road Sector Development Program (RSDP) monitoring report. The Authority also procures the services of Consultants to collect and analyse road and transport, as well as transport-related data in connection with annual reporting of sector performance (this covers RSDP Performance and the SDG Transport Indicators).
With regard to rural access and mobility, a range of survey instruments and procedures are used. These include a household questionnaire, a passenger and public transport operator survey, a traders survey, sub-district (kebele) level key informant interviews, focus group discussions, a sub-district (kebele) level primary data market integration survey, and a motorised and non-motorised traffic count survey. Hand-held GPS data collection is an integral part of the survey process.
iii) Ministry of Transport and Sector Agencies
The Ministry of Transport (MoT) and sector agencies collect and compile large amounts of data on a routine basis, which, in most cases, are not fully analysed or published. In many cases, the data do not precisely fit specified purposes, but just form part of periodic progress reports.
iv) Ministry of Health and Ministry of Education
The two ministries provide data for selected and sector-specific indicators. Some of the indicators / data have relevance to access and mobility.
5.1.2 Major transport data gaps in Ethiopia
The major gaps in rural transport data collection in Ethiopia are related to a lack of coordination between responsible institutions and the absence of systematic surveying procedures. Too often, there is a reliance on “crude estimates”. Inconsistencies stem from:

ReCAP | Scoping Study to Explore the Suitability of SDG Indicator 9.1.2 for Rural Access 21
the poor selection and definition of relevant and valid indicators, the lack of a harmonised data collection methodology and data formats, gaps in the alignment of data collection at regional levels, the absence of the proper assignment of responsibilities, and low effectiveness and efficiency in tracking rural mobility behaviour (in terms of average number
of trips, total distance travelled, time spent travelling, average trip length, modal split) and missing aggregation to national and regional figures.
Usually, consultants are commissioned to collect access and mobility data, as part of assignments to determine feasibility of interventions (primarily road projects) and impact assessments. In 2019 the Government of Ethiopia extended consultants services for three more years to collect, process and analyse data for a wide range of indicators (transport and non-transport), and to track changes of the Universal Rural Access Roads Program (URRAP), an important step towards sustaining data collection, analysis and reporting.
Ethiopia, photo Teferra Mengesha
5.2 Data Collection and Institutions in Nepal Data on population and the economy are collected directly by the Central Bureau of Statistics (CBS) through enumerators. Transport related data are collected through the Department of Roads (DOR) and Department of Transport Management (DOTM). Other Departments of the government also generate data related to their specific sector. The National Planning Commission (NPC) compiles the data. In some cases, NPC organise stakeholder workshops to outline the data requirements for the SDGs and to validate the compiled data.

ReCAP | Scoping Study to Explore the Suitability of SDG Indicator 9.1.2 for Rural Access 22
National targets on the SDGs are not known to many middle level managers within the stakeholder agencies.15 Consequently, the targets are not clearly reflected in the 5-year plans, which are often drafted by the middle level managers, before being endorsed by senior management. Many are not clear on the need for data on passenger and freight volume by mode of transport. From the National Planning Commission (NPC) perspective, the Ministry of Physical Planning and Transport (MOPIT) is not a major player in providing data. MOPIT is expected to provide data on just two sources (passenger and freight volumes) out of 169 that NPC is responsible for. However, from MOPIT’s point of view it is not clear whether DOR or DOTM should generate data on the use of national highways and feeder roads. Collection of data on rural roads is not within MOPIT’s domain.
Although there has been support to prepare District Transport Masterplans (DTMP) and Provincial Transport Masterplans (PTMP), limited data is available from traffic counts on district and village roads. Usually village roads are developed from traditional trails in stages and sections over time and initially district roads do not have capacity constraints. Hence, feasibility studies with traffic counts and forecasts are not typically undertaken.
The present constitution has not defined an obligation for reporting by the municipalities and provinces. Consequently, it is reported that the flow of data from the local bodies to the Department of Local Infrastructure (DOLI) has largely stopped. The only legal way that remains is by the Prime Minister’s Office asking for it. As this is not practical, the laws need to be amended so that DOLI can obtain data from the municipalities directly.
Origin-Destination Surveys (OD-surveys) are considered to be too complex and they are not currently carried out by the staff of either DOR or DOLI. Although there are ways to simplify the process, the present priority of the agencies is to connect all district centres and municipalities. A lack of traffic forecasts is the cause of major congestion in the newly developed sections of Mid-Hill Highway which was constructed with a uniform width, without taking into account diverted traffic from other roads. An OD-survey could have anticipated these traffic deviations.
Many of the SDG targets are complementary to each other. This has not been considered in setting the parameters in the case of Nepal. For example, the spill-over effect of enhanced accessibility on poverty reduction, food security, healthy lives, quality education and loss of terrestrial ecosystems does not seem to have been considered. On the other hand, the targets on accessibility themselves are susceptible to climate change and may not be achievable unless due considerations are incorporated into design criteria.
Some of the national targets need to be revised to match the SDG targets so that adequate resources could be earmarked to achieve these goals. For example, the government has set the accessibility goal to provide motorable roads, which may not be paved, from settlements at a walking distance of 4 hours in the hills and 2 hours in the plains, whereas SDG Indicator 9.1.1 is only 2 km, or 20 minutes’ walk, to an all-season road. Similarly, no target has been set for aerial transport although this mode is a lifeline in mountainous areas: one local airline reported to have transported more than 150,000 passengers in 2018.
15 Probably, the department officials are guided by their own long-term plans that were ratified before the SDGs were introduced. Being the focal agency for the SDGs, the National Planning Commission is not verifying that the tasks are properly carried out.

ReCAP | Scoping Study to Explore the Suitability of SDG Indicator 9.1.2 for Rural Access 23
Customisation of targets by NPC has created confusion. For example, the other targets under SDG 11.2 are: Availability of safe roads, and Availability of safe public transport. However, the terms ‘safe road’ and ‘safe public transport’ are not yet defined for Nepal.
5.2.1 Main features of transport data collection in Nepal
Collection of data on transportation in Nepal is commissioned by the Department of Roads (DOR) and Department of Transport Management (DOTM), or Central Bureau of Statistics (CBS). Although some NGO and funding agencies collect some data as well, their coverage is spatially limited. Data collection is predominately manual. Except for the National Planning Commission (NPC), which compiles data from CBS, the data is mostly used for the collecting agency’s own purpose.
Problems occur as:
(i) The frequency of data collection varies from a year to a decade, and correlating them is difficult.
(ii) Many agencies generating data do not correct them for seasonal variations.
(iii) Databases are created solely for statistical purposes, not considering their use. For example, even though DOTM updates data on the number of registered buses and route allocation, it does not generate data on vehicle-kilometres.
(iv) Among many government agencies, there is no consistency in type of data collected and frequency of the collection.
(v) The data relevant for SDGs collected by the NGO is often limited to certain geographical or ecological belts and thus do not provide a nationwide overview.
5.2.1 Major transport data gaps in Nepal
The usage of different transport modes measured in vehicle-kilometres, as well as passenger-kilometres and freight-kilometres is not available in Nepal. However, this measuring unit might be used to assess the risk exposure for road accidents on different road links. All these parameters are important factors rationalising investment on road improvement, allocation of bus routes and frequency of buses, size and location of inland freight facilities.
Another considerable data gap concerns origin-destination (OD) matrices. Origin and destination of goods and passenger traffic and corresponding routes taken by the transporters, as well as the mode of transport is important information required to achieve many of the SDG goals.
No definite measures have been developed on the SDG target of climate resilient transport infrastructure. Design parameters and specifications for road embankments and drainage structures to make them climate resilient, have not changed over many years.

ReCAP | Scoping Study to Explore the Suitability of SDG Indicator 9.1.2 for Rural Access 24
Nepal, photo Sunil Kumar Poudyal
5.3 Data Collection and Institutions in Tanzania The overall picture of road and transport data in Tanzania shows that there is a lack of clearly defined objectives and functional institutional arrangements to support sector and sub-sector planning, operations, management and decision functions. In general, there have been weaknesses in assessing information needs, at different levels. These include the selection of indicators, determining data requirements (both quantitative and qualitative), the uniformity, standardisation and sources of data, as well as the methods of data collection and verification. Other challenges include collating and aggregating of data into ‘a manageable and useful manner’, data processing and analyses, interpretation of data, and data storage, reporting and disseminating.
In Tanzania there is no harmonised system and coordination of data collection, analysis, reporting and dissemination. Of particular importance is that there are no standardised procedures for presentation of annual statistical reports for the transport sector as a whole. In general, there are apparent gaps in establishing the scope and purpose of transport sector data and information management. Institutional arrangements do not assign clearly defined responsibilities. The Ministry of Works Transport and Communication intermittently compiles all data from different transport sector stakeholders and merges them into a single document; however, this seems to not be done in a consistent manner.
Key transport data frequently collected by the Tanzania National Roads Agency (TANROADS) are mostly those relating to traffic volume and road condition data, mainly for road maintenance

ReCAP | Scoping Study to Explore the Suitability of SDG Indicator 9.1.2 for Rural Access 25
planning. However, only about 25% of the TANROADS network is annually covered due to budget constraints. The newly established Tanzania Rural and Urban Roads Agency (TARURA) has for instance, a huge network length that is not in good condition. Thus, despite the importance of the collection of rural transport data, the focus is more on maintenance and road construction. However, because both road implementing agencies (TANROADS and TARURA) receive maintenance funding from the Roads Fund Board (RFB), it is vital for the RFB to fund, track and manage the collection of rural transport data.
5.3.1 Main features of transport data collection in Tanzania
The main features of transport data collection include weaknesses in designing and organising a regular flow of data and information, and the multiplicity of organisations without clearly defined responsibilities and coordination. Transport data is collected by a wide range of organisations, these include: the National Bureau of Statistics (NBS); the Tanzania National Roads Agency (TANROADS); the Tanzania Rural and Urban Roads Agency (TARURA); the Land Transport Regulatory Authority (LATRA); the Ministry of Works Transport and Communication (MoWTC); Tanzania Police Force, Traffic Unit; Presidents Office Regional Administration and Local Governments (PORALG); Tanzania Ports Authority (TPA); Tanzania Railways Corporation (TRC); Tanzania Airports Authority (TAA); Tanzania Civil Aviation Authority (TCAA) and Tanzania Meteorology Agency (TMA). Although some NGOs and funding agencies also collect data, their coverage is spatially limited. Data collection is predominately manual. With regard to rural access and mobility, a range of survey instruments and procedures is employed. These include household questionnaires, passenger and public transport operator surveys, traders’ surveys, sub-district level key informant interviews, focus group discussions, sub-district level primary data, market integration surveys and motorised and non-motorised traffic count surveys. In addition, hand-held GPS data is collected as part of the survey process.
5.3.2 Major transport data gaps in Tanzania
In Tanzania, the Tanzania National Roads Agency (TANROADS) and the Tanzania Rural and Urban Roads Agency (TARURA), mostly collect data related to traffic volume counts and road condition. However, a range of relevant data is mostly missing. This includes data related to the volume of passengers and freight transported by mode, freight cost/tkm, the number of operating transport modes and their frequency of service on normal and disrupted days. All these parameters are important factors in planning road investment, the allocation of bus routes and determining service frequency, as well the size and location of passenger terminals and inland freight facilities.

ReCAP | Scoping Study to Explore the Suitability of SDG Indicator 9.1.2 for Rural Access 26
Tanzania, photo John Hine
5.4 Rural Transport Data Collection This section provides the results of the Country Surveys on data collection for rural transport.
Ethiopia
A wide range of rural transport data is collected as part of impact evaluation of rural access roads by consultants. Such data include means of transport used, average distance to visit markets and other services/facilities, passenger fares and freight rates, average daily traffic by vehicle class, as well as the effect on asset ownership, health and educational outcomes, agricultural productivity, supply of agricultural inputs, use of means of transport, supply of credit, income and expenditure etc.
A number of rural access indicators have been developed in Ethiopia:
Areas and population more than 2 km away from all-weather roads (updated based on road inventory and GIS-based mapping)
Percentage of areas further than 5 km distant from an all-weather road Number of Kebeles with access to all-weather roads Percentage of Kebeles (Sub-districts or Sub-Weredas) served by regular passenger transport. Rural road densities.
Additionally, there are also other specific indicators related to access to means of transport and to social services, as well as access to the pick-up points for public transport.
Nepal
Except for length and horizontal alignment, data on urban roads, village roads, and to some extent District Roads are not routinely collected. Although in the discussions the need for the data is badly felt by the officials in DOR, DOTM and CBS, these agencies do not have the capacity to collect and manage the data on rural transport. In the view of political decision makers, data collection is not an

ReCAP | Scoping Study to Explore the Suitability of SDG Indicator 9.1.2 for Rural Access 27
appealing topic in contrast to road construction. Data collection is also difficult because district roads and village roads fall under the responsibility of Provincial Government and the Municipalities. These agencies, however, have not felt the need for the data. Consequently, many new village roads are being built with little regard to accessibility, engineering challenges, environmental considerations, maintenance requirements or sustainability.
The same nodes are used for collecting road traffic data on national highways and feeder roads year after year. Thus, these could be used for a national statistical publication. However, as the traffic data on district roads and village roads are only collected sporadically, data from these categories of roads might not find their place in statistical publications any time soon.
Tanzania
A wide range of rural transport data is collected as part of the impact evaluation of rural access roads by consultants. Such data includes means of transport used, average distance to visit markets and other services/facilities, passenger fares and freight cost, average daily traffic by vehicle class, as well as effect on asset ownership, health and educational outcomes, agricultural productivity, supply of agricultural inputs, use of means of transport, supply of credit, income and expenditure, etc. However, there is no continuity in the collection of these data.
Rural transport data are not collected and compiled systematically in Ethiopia, Nepal or Tanzania, and thus are not published on a consistent basis. Rather, data are generated by consultants or NGOs during specific rural projects or for feasibility and impact studies. With the exception of Ethiopia, once the roads are constructed, there is usually no attempt to verify the forecasts made by the feasibility studies on achievement of the intended degree of use. The data from the feasibility studies are not centrally available, but have to be collected from the agency commissioning the studies. However, a strong need is felt in the countries to have rural transport data available.
5.5 Transport Data Collection in the ReCAP Countries The main problems in collecting transport data are presented in Table 3. Interestingly, the authors independently reported similar problems in completely different countries. Generally, the lack of a central database is regarded as the salient challenge. With little quality control, no seasonal adjustment and irregular surveys, data are often inconsistent and thus not comparable. The lack of technical capacities, knowledge and resources can be named as the major causes.

ReCAP | Scoping Study to Explore the Suitability of SDG Indicator 9.1.2 for Rural Access 28
Table 3: Major challenges faced while collecting transport data in ReCAP Countries
Ethiopia Nepal Tanzania
Lack of central database
Databases are created solely for statistical purposes without considering their use
Lack of central database
Knowledge gap No adjustment of data for seasonal variations
Capacity and skills gap
Data inconsistency when compared with past trends
No consistency in type of data collected and frequency amongst government institutions
Lack of resources
Timely data availability Collection frequency varies from years to a decade
Technological gap
Data relevant for SDG collected by NGOs are often limited to certain geographical or ecological belts
The number of institutions collecting transport data is presented in Table 4. Data collection seems to be rather concentrated in a few institutions in Nepal and Ethiopia compared to Tanzania, however all countries collect some transport volume data, and more details are provided in Section 10. Apart from consultant surveys, rural transport volumes are not collected in Ethiopia, while Nepal collects no data on freight transport. Water transport does not exist in Nepal.
Table 4: Number of institutions collecting transport data in ReCAP Countries
Data collected Ethiopia Nepal Tanzania
Road based transport volume data 1 1 3
Rural transport volume data 0 1 2
Data for non-motorised transport 0 1 3
Data for water transport 1 n.a. 1
Data for freight transport 2 0 2
Data for public transport 2 1 1
Institutions with a budget for data collection
2 3 3
5.6 Road Classification and Length Table 5 lists the functional road classifications of the three ReCAP countries listed in the order of their importance. The exact definitions are given in Annex 3. Differences may be observed between Nepal, where feeder roads constitute part of the secondary road network and Tanzania and Ethiopia, where these are at the lower end of the list. Nepal classifies village roads that are smaller roads not falling under the District Core Road Network and include agriculture roads as well. In Tanzania ‘Community Roads’ is the lowest level of road classification.

ReCAP | Scoping Study to Explore the Suitability of SDG Indicator 9.1.2 for Rural Access 29
Table 5: Functional road classification in ReCAP Countries
Ethiopia Nepal Tanzania
Trunk roads National Highway Trunk Roads
Link Roads Feeder Road Regional Roads
Main Access Roads District Road District Roads
Feeder Roads Urban Road Urban Roads
Collector Roads Village Road Community Roads The road length is an important measure to assess transport volumes. Table 6 shows the lowest road class of rural roads for which the road length is available as well as the responsible government unit where these data are collected. While in Ethiopia and Nepal more than 750-900 government units report road length data, in Tanzania these are only 169 districts. Thus, the spatial differentiation of data is much lower in Tanzania.
Table 6: Data on rural road length available
Ethiopia Nepal Tanzania
Lowest class of rural roads where road length is available Collector Roads Village Road Feeder Road
Lowest government level on which road length is available
Woredas (District) Rural Municipality District
No of administrative units in the country 894 753 169
Classification of roads according to rural/urban
Based on municipal
boundaries 4 -
Data on unclassified network existent Estimate available - -
5.7 Design Standards Design Standards are available as part of the road engineering manuals in all ReCAP countries. Traffic influences road design in two ways, through pavement design and through geometric design. Axle loads (expressed in terms equivalent standard axle loads, (ESA)) are used to determine pavement design, while traffic volumes (particularly of four-wheel traffic) are used to determine geometric design. Within the general category of Low Volume Roads there are a range of design standards. In Ethiopia the lowest geometric standard is DC1 which is listed for feeder roads and provides reliable access where the traffic volume is above annual average daily traffic (AADT) 25. For Tanzania the lowest geometric standard for a feeder or community road is DC8 where the traffic volume is above AADT 20. The traffic volumes relate to the mid-life age of the road. Below these traffic volumes are tracks that do not have a specific design standard but may receive engineering attention and maintenance to keep them passable.
In Nepal (where mountainous terrain is a critical factor in road design), vehicle speed (15-30 km/h) is used to define the lowest design standard of a village road.

ReCAP | Scoping Study to Explore the Suitability of SDG Indicator 9.1.2 for Rural Access 30
Table 7: Design standards for rural roads in ReCAP Countries
Ethiopia Nepal Tanzania
No. of Design Standards existent
8 5 8
Lowest level standard Feeder Road: DC1
Village Road
Feeder/Community roads: DC8
Definition of the lowest level road design standard
Provision of reliable access.
AADT<25, (DC2 lies between
AADT 25 to 75)
Speed 15-30 km/h
AADT <20
(DC7 lies between AADT 20 and 50)
Lowest government level on which road design length is available
Regional Rural Road Authorities
Rural Municipality Local Government
This information is available in national statistics
Yes No No
In the absence of other information, the length of roads under different design standards could provide a useful indication of traffic volumes for the network.
5.8 Vehicle Fleet The number of registered vehicles is essential for cross-checking transport volume data generated by estimations or models (Table 8: Data on vehicle fleet available in ReCAP Countries). While in Nepal only newly registered vehicles are counted, in Ethiopia and Tanzania the number of vehicles actually in use are enumerated. Vehicle usage can be geographically differentiated by the region or province where the vehicle is registered. While Tanzania has 30 regions, Ethiopia has 11 and Nepal only 7. Thus, a distinction into rural/urban traffic is not feasible. Larger misrepresentations may occur since government vehicles are often registered in the capital even if they are used elsewhere.
The data collection process is explained using the Ethiopian example:
Steps 1 Regional Transport Authorities register vehicles within their area of administrative jurisdiction.
Step 2 The database system is used for access of data in SQL and Access format.
Step 3 The registered vehicle fleet from each region is submitted to the Federal Transport Ministry.
Motorcycles are included in all statistics; however, in Nepal they are used much less in the countryside, (although volumes are increasing) while buses and trucks tend to dominate in rural areas. In Tanzania, motorcycle data are collected manually through partnership with Local Governments. This shows the importance of the integration of various sources of administrative statistics on transport.

ReCAP | Scoping Study to Explore the Suitability of SDG Indicator 9.1.2 for Rural Access 31
Table 8: Data on vehicle fleet available in ReCAP Countries
Ethiopia Nepal Tanzania
Number of vehicle types
24 11 16
Data only for newly registered vehicles
no yes no
Data for all vehicles presently used
yes no yes
Registration indicates location of vehicle usage
11 Regions 7 Provinces 30 Regions
Motorcycles are included
yes Yes yes
5.9 Traffic Counts Traffic counts are conducted in all three ReCAP Countries either annually or biannually. Most of the counts are conducted on the main road network, with rural roads being excluded (see Table 9). Tanzania conducted a traffic count on 15 rural roads in 2017 as part of monitoring a specific donor funded programme. Most counts are conducted manually; automated traffic counters have only been used in Tanzania. Automatic number plate recognition occurs in none of the countries. Non-motorised transport (NMT) means are included in Tanzania’s 2017 rural road count. In Nepal, NMTs are counted because these vehicles are considered to hamper the flow of traffic.
Table 9: Traffic counting in ReCAP Countries
Ethiopia Nepal Tanzania
Last counting years 2013, 2014, 2015, 2016, 2017
2016, 2018 2019, 2017
Number of roads counted
195 (2013) 278 (2017)
160 330 (2019) 15 (2017)
Road types included Trunk roads, Link Roads, Main Access
Roads
National Highways Feeder Roads
All road classes (2019)
Rural roads (2017)
Regular traffic counts annual biannual annual
Rural road traffic counts For specific studies not known 2017
Automated traffic counters
As required for specific studies not known yes
Automatic Number Plate Recognition not known not known not known
Motorcycles are included yes Yes yes
Non-motorised transport counted yes Yes Yes
(2017)
Passenger Car Units used yes Yes yes

ReCAP | Scoping Study to Explore the Suitability of SDG Indicator 9.1.2 for Rural Access 32
The Ethiopian Roads Authority (ERA) carries out traffic counts based on traditional manual methods. All counting stations are located on federally administered roads. Counts at each of the stations are performed three times a year (February 1 - 7, July 1 - 7 and November 1 - 7) representing high, low and medium business activity seasons. Classified counts are conducted for seven consecutive days, supplemented by a full 24 hour count on two of the weekdays to determine night traffic volumes. The vehicle classification comprises small cars, large cars, small buses, large buses, small trucks, medium trucks, large trucks, and truck trailers.
Night count factors are applied to adjust the seven-day counts in order to determine the Average Seasonal Daily Traffic (ASDT), which is further averaged to determine the Annual Average Daily Traffic (AADT).
In Nepal, 3-day manual counts are contracted by the Department of Roads under Ministry of Physical Infrastructure and Transport Highway Management Information System Unit within. The surveys are conducted by a contractor biannually, when seasonal variation is lowest. The data are used to calibrate the HDM-4 model and to determine requirements for periodic maintenance.
The Tanzania National Roads Agency (TANROADS) and the Tanzania Rural and Urban Roads Agency (TARURA) carry out traffic counts based on traditional manual methods. However, automatic counting was once done by a consultant during a baseline traffic count in Tanzania to establish traffic adjustment factors. All counting stations are located on government administered roads. Counts at each of the stations are performed repeatedly per year representing high, low and medium business activity seasons. The counts are conducted for seven consecutive days – 12 hour counts for four days, and 24 hour counts for three days to determine night volumes. The vehicle classification comprises ten vehicle categories. A night count factor is applied by adjusting the seven-day counts to determine the ASDT. This is further averaged to determine the AADT.
5.10 Transport Volumes In Tanzania transport volume data, are not regularly collected by TANROADS or TARURA. However, as part of a specific AFCAP funded project (Willilo et.al. 2012; Willilo and Starkey 2013, Njenga et.al 2015) carried out in Coast, Iringa and Dodoma regions, transport volume data (passenger and vehicle kilometres) were collected. Tanzania provides information about transport volume data (passenger and vehicle kilometres) for all road types, even for rural roads. The project was carried out in 2012 and 2013 for 4 sampled roads.
The Ethiopian Transport Authority estimates transport volume data (number of passengers and tonnes of freight) by using average occupancy rates and load factors. Data for vehicle kilometres on the federal road network are provided through the annual traffic count report issued by the Ethiopian Roads Authority. There are gaps in estimating passenger-km and tonne-km, which requires data on average vehicle-km travelled, occupancy rates and load factors, disaggregated by vehicle category. There are no standardised and institutionalised methods. Since the data are often compiled as part of specific consultant studies, no longer time series exist. Regular data collection is not yet mandatory, as a prerequisite for trend estimations.
In Nepal, no transport volume data are collected and the assessment of the data quality is very poor. However, a comprehensive transport volume survey was undertaken in 2001, but the data are not relevant any more since the number of vehicles, roads and population at that time was 10%, 25% and 80% of the present values respectively.

ReCAP | Scoping Study to Explore the Suitability of SDG Indicator 9.1.2 for Rural Access 33
5.11 Household Surveys, Indicators and O/D matrices In Ethiopia, household surveys on transport and mobility were conducted in 2015/16. The survey included 32,000 sample households and included the whole country. It was conducted in urban and rural areas. The survey provides statistics on consumption and expenditure of households, while the Household Welfare Monitoring Survey provides data on access to basic facilities and mobility patterns (distance, travel time, affordability). Another survey was done in 2017 on the impacts of the Universal Rural Roads Access Program in four regions.
In Nepal, no nationwide survey has been done on transport and mobility. In the Social Survey only the number of different types of vehicles and number of road crashes are represented.
In Tanzania, no nationwide survey has been done on transport and mobility. In the Household Budget Survey, which is done every year, only economic indicators and non-economic indicators are represented. Transport is not amongst the indicators presented.
Table 10: Information on basic transport indicators
Ethiopia Nepal Tanzania
Estimates of household and trip generation in terms of passengers (Last survey)
2017 (URRAP)
2018 2015
Estimates of household and transport volumes in terms of passenger-km
4 4 4
Estimates trip generation in terms of tonnes transported 4 4 4
Estimates transport volumes in terms of tonne-km 4 4 -
Load factors in terms of passengers transported per vehicle 4 4 -
Load factors in terms of tonnes transported per vehicle 4 4 -
Adjustment factors used for data aggregation (hourly, daily, monthly, AADT)
4 4 4
Origin-Destination surveys
O-D surveys might be useful for the estimation of transport volumes. Usually the matrices are generated by transport models and further used to assess present and future transport volumes for the planning of investments. Presently, O-D surveys are not available in any of the ReCAP research countries.
In Ethiopia, there is no established system and assignment of responsibility for the regular collection of basic transport data. For major roads, estimates are derived to serve specific purposes without an appropriate methodology (e.g. O-D surveys). For rural areas, data that are available come from impact assessments of the Universal Rural Roads Access Program (URRAP) and other specific studies.
In Nepal, there is no countrywide O-D survey matrix. The most recent one was done in 1991 for road network planning in Kathmandu Valley and covered only the urban and rural area in the valley

ReCAP | Scoping Study to Explore the Suitability of SDG Indicator 9.1.2 for Rural Access 34
5.12 Public Transport This section gives an overview the number of public transport enterprises and the collection of data in the researched countries.
Table 11: Public transport
Ethiopia Nepal Tanzania
Number of public companies providing transport services
0 1 3
Number of private companies providing transport services
32 333 Not known
Estimate of the number of informal enterprises providing transport services
Not known 5000 Not Known
Data on Public Transport are collected by Districts Provinces LATRA
Data on motorcycle taxis are available Yes Yes yes
Data quality Reasonably Good
Very good Very good
Source Federal Transport Authority
DOTM, unpublished
Licensing Departments -
LATRA In Nepal and Tanzania public bus routes are known. However, their frequency of service is not recorded. The buses also carry goods, and trucks also carry passengers. The passenger/goods ratio is not recorded by any agency. The methodology to get such data in the context of Nepal could be:
i. manual counting of frequency of transport, number of passengers and volume of goods transported at terminals,
ii. 1st level of validation through traffic counts at different locations,
iii. 2nd level of validation through consumption of fuel.

ReCAP | Scoping Study to Explore the Suitability of SDG Indicator 9.1.2 for Rural Access 35
5.13 Freight Transport As shown by Table 12, in Nepal, there are no readily available data on freight transport. However, this could be estimated to some extent from agricultural production data published by CBS, export-import data compiled by the Trade Promotion Centre, or traffic counts conducted by DOR.
Table 12: Availability of data on freight transport
Data available Ethiopia Nepal Tanzania
Tonnes transported 4 - 4
Tonne-kilometres - - 4
Number of formal enterprises operating in rural areas
4 - 4
Number of informal enterprises operating in rural areas
4 - 4
5.14 Rail Transport Tanzania is the only country assessed with a network of railways. Two companies operate on the rail network, comprising 4,460 km of track. Rail tracks are in a bad condition. Data on rail transport are available for the number of vehicles, passengers transported, freight transported, passenger km and tonne-km. Rail Transport is very important in rural areas as it facilitates transportation of passengers and agricultural products from rural areas at a much lower cost than other modes of transport. While the goods transported by rail comprise agricultural produce from rural areas, the rail network represents interurban, rather than rural transport, as it connects major cities.
Ethiopia has only one railway line with 656 km of electrified standard gauge on the Addis Ababa–Djibouti track that was opened in 2018. Other tracks are under construction. Data are available for passengers and freight transport, passenger km and tonne km. The Addis Ababa – Djibouti rail link is part of Ethiopia’s external land transport corridor. It also provides passenger services between towns. Where there are access roads, it has the potential to have impact in the broader area of influence, extending to rural areas.
Nepal has no operating railway; however, there are 45 km rail tracks presently under construction.
5.15 Non-Motorised Transport In Ethiopia, data on non-motorised transport (NMT) are available from the impact assessment conducted within the Universal Rural Roads Access Program (URRAP). The purpose of the traffic surveys is to establish benchmark average daily vehicular movement at baseline and assess changes over two follow up surveys (over time), and in comparison with that of control areas. Counts do not take place on public holidays, or when there are extreme weather conditions. Classified traffic counts take place for two-days, on one market-day and on a non-market day. Vehicle classification comprises both motorised and non-motorised traffic and other intermediate forms of transport, such as walking and head loading/back loading. The non-motorised traffic consists of more than 8 means of transport, including walking with load/without load, bicycle with load, wheelbarrow, hand-cart, ox-cart, and animal-drawn cart. The data for non-motorised traffic is collected through roadside observation by enumerators in a sample of (village level) rural kebeles. The data are aggregated,

ReCAP | Scoping Study to Explore the Suitability of SDG Indicator 9.1.2 for Rural Access 36
summarised and presented in the form of percentages, and graphs for comparison with baseline and follow-up surveys. The sample allows scaling up and projection for the whole country.
In Nepal, a biannual traffic count takes place at 160 defined nodes on national highways and feeder roads, which includes counting of NMTs. As there is no registration of NMTs, their number in the country is not known. However, there is no restriction for the use of NMTs on National Highways or Feeder Roads. Traffic counts have been undertaken every alternate year since 2004.
In Tanzania, non-motorised transport data are available from normal classified traffic count data. NMTs are usually counted along with other traffic modes during traffic counts. At the local government level, NMT data are collected by TARURA, which is an Agency under the President’s Office Regional Administration and Local Government. NMT are collected for any traffic count data, so all traffic survey data mentioned include NMTs.
5.16 Inland Water Transport Tanzania has large, navigable, inland water bodies. Data on water transport relating to the number of vessels, passengers transported and goods transported are available. However, information on pkm and tkm are not available. There are also a significant number of unregistered informal ports. The government has tried to formalise some of the informal ports with some demand while trying to control those with limited demand.
Two of Nepal’s three major river systems, Koshi and Saptagandaki, flow down to the Indian plains and finally drain into the Ganges. However, massive investments are required to make them properly navigable, because the current in these rivers is too high (about 2m/sec) and the width of channel varies considerably. Up until now, only traditional rowing boats (and temporary pontoons to ferry bulky goods) have been used in Nepal, to ferry people across rivers. Until a few months back, there was no service for travelling along the rivers. In 2019, the government provided licenses to firms to run boats for up to 30 passengers (mainly for tourists and their luggage) along a 10 km stretch where the draft is adequate and the current is relatively low. Due to environmental considerations, dredging the rivers to make them navigable is not an option. However, a cell within Ministry of Physical Infrastructure and Transport is preparing to investigate the viability of waterway transport in Nepal and its linkage to the waterways in India.
Ethiopia does not have any major river ports. However, four smaller ports exist along the Baro River that belongs to the Nile basin. Data on water transport are available for the number of vessels and the freight transported.
5.17 Other Transport Information Transport fuel sales are collected annually in all ReCAP countries researched for this study. They may be used to calibrate transport models or verify the estimation of transport volume. Mobile phone data are not collected and are thus not used for transport planning. Here a conceivable potential exists that needs to be further researched.
In Nepal, satellite images have been used for planning of road alignment during feasibility studies but not for transport planning within the existing network. Drone data are used for surveying road alignment, road maintenance requirements, landslide hazards etc., but not for transport planning. In Tanzania, initiatives have started to use satellite photographs for planning of road alignment before construction.
In Ethiopia, the Ministry of Transport is currently using the services of consultants to establish and modernize a Transport Performance and Transport Impact Information System with the assistance of

ReCAP | Scoping Study to Explore the Suitability of SDG Indicator 9.1.2 for Rural Access 37
development partners. The tasks include the application of Intelligent Transport Systems, satellite imagery,, together with the installation of a data management system. Key indicators are to be identified, and validated. The programme also includes capacity building for database management.
Table 13: Other transport information
Data available Ethiopia Nepal Tanzania
Data on transport fuels sales are regularly collected
annual annual monthly
Mobile phone data have been collected and used for transport planning
- - -
Satellite images have been used for transport planning
- - -
Drone data have been collected - - -

ReCAP | Scoping Study to Explore the Suitability of SDG Indicator 9.1.2 for Rural Access 38
6 Model Based Transport Volume Estimations
6.1 Four-Step Transport Model One approach to assess transport volumes is a conventional 4-step transport model. The model comprises all modes of transport, is able to generate future traffic flows and identify bottlenecks and costs for transport investments. The model is mostly used for the modelling of urban passenger transport. However, it can be used for freight transport and modelling national transport flows. As with many transport models, it is primarily designed to predict transport flows in the future following major infrastructure or policy interventions. It is not primarily designed to accurately estimate current traffic flows, rather data from traffic surveys are required as an input to calibrate the model. The procedure is described in Figure 8.
Figure 8: Conventional four step model
This type of model requires specific expertise, a considerable amount of time, and data inputs in order to calibrate it. The following data inputs are required:
Table 14: Data requirements of a transport model
Model Step Data input Source
Trip Generation Socio-economic data Household surveys
Trip Distribution Distances, travel times Maps
Mode Choice Costs, travel time, Household surveys, road data
Route Assignment Road and rail networks Road and rail data, traffic counts, transport fuel sales

ReCAP | Scoping Study to Explore the Suitability of SDG Indicator 9.1.2 for Rural Access 39
Once rural transport has been defined, a four-step model would be able to generate rural transport volumes. VISUM16 would be one example of a fully-fledged transport model that is used in practice for transport planning. A VISUM licence can be bought for around US$25-30,000, which is considerably higher than the non-commercial transport models listed in Table 16, which are used in the three ReCAP countries. Some of these models, notably RED and RONET, have a stronger focus on rural roads.
Table 15: Transport Models used in the researched ReCAP countries
Ethi
opia
Nep
al
Tanz
ania
HDM 3 or 4 4 4 4
RONET 4
RED 4 4
STRADA 4
Accessibility Model 4
In conclusion, complex 4 stage models are not practical to solve the research problem. Their application for both passengers and freight would be far too complicated and costly.
6.2 System for Traffic Demand Analysis STRADA17 The Japan International Cooperation Agency (JICA) initiated the development of the System for Traffic Demand Analysis (STRADA) program to provide a common tool of transport planning, and to build up a common database, for its technical assistance programme in the transport sector for developing countries. The ten modules use a fully-fledged 4-step modelling approach and the cost for Version 4 of the software is more reasonable at 250,000 yen (US$2,325).
6.3 Highway Development and Management HDM-4 The Highway Development and Management System (HDM-4) is a software package18 that serves as the primary tool for the analysis, planning, management and appraisal of road maintenance, improvements and investment decisions. HDM-4 focusses on the optimisation of infrastructure, maintenance and transport costs for individual links or for the whole road network. The model relies on the direct input of traffic flow data for each link analysed and does not assign traffic flows based on trip generation, origins and destinations or the shape of the network. Traffic forecasts are usually based on simple extrapolation of growth trends. HDM-4 is typically used for project appraisal, project formulation, maintenance policy optimisation, road works programming, network strategic analysis, standards and policies. As the name implies, the focus of the model is on major road networks but it can also be used on rural roads. A single licence for the latest Version 2 costs US$2,415 for users in developing countries. The programme requires comprehensive calibration for local conditions and handling by trained modelling specialists.
16 https://www.ptvgroup.com/en/solutions/products/ptv-visum/ 17 https://www.vmi.co.jp/strada/en/ 18 http://www.hdmglobal.com/

ReCAP | Scoping Study to Explore the Suitability of SDG Indicator 9.1.2 for Rural Access 40
6.4 Road Network Evaluation Tools RONET19 The Road Network Evaluation Tools (RONET), developed under the Sub-Saharan Africa Transport Policy Program (SSATP) and the World Bank, is designed to assess the current characteristics of road networks and their future performance depending on different levels of interventions to the networks. It is a tool for assessing the performance of road maintenance and rehabilitation policies and the importance of the road sector to the economy. The model is used to demonstrate to stakeholders the need for continued support of road maintenance initiatives. The model is based on Excel spreadsheet calculations and assesses the performance of a national road network. Inputs are network length, road condition, vehicle fleet, topography and maintenance cost figures.
RONET version 2.0 was released in January 2009 and is available in English, Spanish and Russian and can be downloaded free of charge. RONET Version 2.0 implements three evaluation modules:
i. Current Condition Assessment Module that computes network statistics and monitoring indicators,
ii. Performance Assessment Module that estimates the network performance and budget requirements under different maintenance and rehabilitation standards, and
iii. Road User Revenues Module that evaluates revenues collected from road user charges and compares them with the funding requirements.
The length of the road network taken into consideration in the model may be the entire road system of the country (roads, highways, expressways, streets, avenues, and so forth), or a partial network - for example, the road network of a state or province of the country or the road network managed by the main road agency. Segments of the road network are classified according to:
• Five network types,
• Five surface types,
• Five traffic categories, and
• Five condition categories.
This gives a total of 625 road classes (Figure 9). Each surface type is subdivided into five possible traffic categories. Each network type, road type, and traffic category is further subdivided into five possible road condition categories. Since the road condition is not relevant for transport volume estimations, the number of categories may be reduced to 125.
Overall, the model is not designed to accurately capture traffic volumes of the network; rather it is a tool for maintenance management. The model was used for the Africa Infrastructure Diagnostic (AICD) mentioned above. In the absence of traffic survey data, it may be used to provide rough estimates of rural traffic volumes, based on the judgement of engineers and planners using the model. The lower level traffic categories, in terms of vehicles per day are: 0-10, 10-30, 30-100, 100-300, 300-1000, 1000-3000 etc. Hence, in any one category significant errors could arise.
19 https://collaboration.worldbank.org/content/sites/collaboration-for-development/en/groups/world-bank-road-software-tools/files.asset.html/content/usergenerated/asi/cloud/content/sites/collaboration-for-development/en/groups/world-bank-road-software-tools/files/jcr:content/content/primary/library1/ronet_version_2_0en-Oer3.html

ReCAP | Scoping Study to Explore the Suitability of SDG Indicator 9.1.2 for Rural Access 41
Figure 9: Matrix of road classes used in RONET
Source: RONET User Guide
6.5 Roads Economic Decision Model RED20 The Roads Economic Decision Model (RED) was developed under the Road Management Initiative (RMI), a key component of the Sub-Saharan Africa Transport Policy Program (SSATP) aimed at improving the decision-making process for the development and maintenance of low-volume roads. The model is a derivative of HDM-3 and HDM-4 models, and it also relies on the direct input of traffic volumes of each link being analysed. It does not assign traffic to roads based on origins and destinations or the shape of the network, however traffic predictions are based on simple traffic growth rates. It performs an economic evaluation of road investment options using the consumer surplus approach and is customised to the characteristics of low-volume roads. In comparison to RONET, which assesses road networks, RED is focussed on single roads, or sets of rural roads. RED is setup on a series of Excel spreadsheets with inputs required for road and vehicle types, road length and conditions. The current version of RED (Version 4.0), released in April 2018, which is available only in English, optionally adds CO2 emissions benefits or costs to the cost benefit analysis. RED version 3.2 is available in English, French and Spanish. With the same input data, both Version 3.2 and 4.0 produce the same results.
6.6 Freight Volume Estimations A range of freight modelling procedures has been developed including the four-step model outlined earlier. Techniques involved include input-output analysis, gravity models, regression analysis, spatial computable general equilibrium models (SCGE), trip generation and distribution, modal
20 https://collaboration.worldbank.org/content/sites/collaboration-for-development/en/groups/world-bank-road-software-tools/files.asset.html/content/usergenerated/asi/cloud/content/sites/collaboration-for-development/en/groups/world-bank-road-software-tools/files/jcr:content/content/primary/library1/red_version_4_0_engl-JM7A.html
Matrix of Road Classes: Overall Network Evaluation
Network Road TypeType Concrete Asphalt S.T. Gravel EarthMotorwaysPrimarySecondaryTertiaryUnclassified
Traffic Condition CategoryCategory Very Good Good Fair Poor Very PoorTraffic ITraffic IITraffic IIITraffic IVTraffic V

ReCAP | Scoping Study to Explore the Suitability of SDG Indicator 9.1.2 for Rural Access 42
choice models, logistics cost modelling and commodity flow analysis. However, as for the passenger modelling, overwhelmingly their purpose is to predict how changes in infrastructure and changes to demand and supply and trade policy will, in turn, impact upon traffic flows and economic growth. Apart from some limited examples, the models are not used to estimate current flows (other than for calibration purposes) which can be far more easily estimated directly from traffic surveys.
Freight modelling is, in many ways, much more problematic than passenger flow modelling. Patterns of passenger flows can be very similar, city to city, area to area, within the same country, taking into account the availability of infrastructure, housing density, income levels and vehicle ownership. In contrast, the diversity of commodity types, and the unique and diverse geographical nature of commodity supply and demand, is much more difficult to estimate commodity flows, without direct knowledge of the local area. Huge freight flows can be generated or attracted by mines, steel works, cement works, power stations, timber and pulp mills and ports. There is also a wide range in the production and yields of different agricultural commodities and forest products. It is for this reason that freight modelling may involve the separate analysis of a large range of commodities. For example, a study of freight flows in Oregon State involved an analysis of 40 separate commodities (Oregon Department of Transport, 2010) while a study of freight flows in 17 countries in Sub-Saharan Africa analysed the flow of 71 commodities (Havenga et al, 2012).
Since heavy traffic flows, even in rural areas, will be largely located on main, secondary and arterial roads, by restricting ourselves to assessing ‘rural roads’, heavy flows of freight traffic will be largely avoided.
6.7 The ITF Model The ITF Model is currently used to provide estimates of national road and rail, road and rail passenger-km, and freight tonne-km data for SDG 9.1.2 within the UN Database. Data for over 230 countries and territories are provided. Precise details of the model are not yet available; however, they should be published within the next year.
Building on nationally available data, the ITF model takes into account income, the extent of infrastructure and car ownership. Urban traffic is modelled separately from interurban and rural traffic. The model does not take account of motorcycle ownership and use – a key determinant of rural transport in many low-income countries.21
Due to the lack of data from low-income countries the model relationships are inevitably based on high and middle income, derived data. Although there is a relatively close fit for the statistics of several European countries between the published estimates within the UN database and sources such as the IRF, however four-fold differences have been found for passenger-km in the United States between the UN database and estimates published by the United States and other sources. Therefore, the ITF model may not be used for rural transport volume estimations on a short term basis.
6.8 Discussion on the Use of Transport Models As can be seen from this Section, a range of models are available that are used to manipulate traffic data and provide predictions. With the exception of the ITF model, for the most part the prime purpose of the models, is not to provide current estimates of traffic volumes, and some of the models, such as the four-step transport model are very complex and expensive to use. As with all models, the accuracy of the output data is dependent on the quality and extent of the input data. In
21 Based on communications with Mario Barreto, and Dimitrious Papionnou (ITF).

ReCAP | Scoping Study to Explore the Suitability of SDG Indicator 9.1.2 for Rural Access 43
low-income countries there is a particular shortage of both transport data and of knowledge and expertise of the more complex transport models.
In the absence of a comprehensive rural transport dataset only the RONET model and the ITF model (if suitably adjusted) might be useful for the purposes of estimating rural transport volumes.
For this purpose, RONET could be an appropriate tool since it:
i. has a network approach,
ii. is simple to handle,
iii. is familiar to many rural road engineers and
iv. is free of charge.
Even though it is not compelling to use RONET, it might provide a good classificaion to structure the road network. For the assessment of rural transport, only the parts of the network of tertiary and unclassified roads may be used and these would have to be restricted to the rural road network, i.e. excluding urban and secondary roads. In addition, further investigations would need to consider the very broad-based categorisation of traffic flows into simple traffic bands (i.e. 0-30, 30-100, 100-300, etc.) and the inclusion of non-motorised traffic.
In the absence of data from many countries, the ITF “macro” model approach may eventually be able to assist with providing traffic estimates. However, the approach would need to be specifically tailored to rural transport. For effective calibration a much wider dataset from low income countries is required.

ReCAP | Scoping Study to Explore the Suitability of SDG Indicator 9.1.2 for Rural Access 44
7 Practical Approaches towards Rural Transport Volume Estimations Presently, the most practical approach for moving forward for estimating rural transport volumes is possibly to adopt a dual approach. In countries such as the United States and United Kingdom that have comprehensive traffic counting programmes it is possible to estimate rural traffic volumes directly from their rural traffic classified counts, with knowledge of their rural road lengths and vehicle load factors. However, where rural traffic counting is less systematised, the RONET approach may be a more appropriate starting point. Here rural road engineers may make informed estimates based on the RONET classification system, with some adjustments to ensure that only ‘rural roads’, as defined in Section 2, are included.
Advice on setting up a comprehensive national traffic counting programme within low income countries has been provided by Howe (1970, 1971). Further advice on traffic counts is also given in Overseas Road Note 40 (TRL, 2004). Examples of rural (motorised) traffic composition in low income countries are given in Table 16.
Table 16: Average daily traffic composition and volumes from rural road surveys in six countries
Country Year Motorcycles1 Cars 4x4/pickups2 Buses3 Trucks Tractors4 Total
Vietnam
2008 90% 514
1% 5
3% 19
1% 4
2% 13
3% 14
100% 568
Cameroon 2013 93% 2013
0% 0
1.5% 6
0.5% 1
5% 10
0% 0
100% 217
Ethiopia
2016 85% 76
0% 0
2% 2
4% 3
9% 8
0% 0
100% 89
Kenya
2016 72% 700
11% 104
9% 90
6% 55
2% 17
0% 3
100% 967
Liberia
2017 76% 199
4% 11
8% 21
2% 4
6% 16
4% 10
100% 269
Tanzania
2017 81% 262
7% 23
5% 15
3% 10
3% 9
1% 4
100% 323
1 Motorcycle figures include three-wheelers in some countries, notably Ethiopia. 2 Utility vehicles, 4x4s, pickups and light trucks. 3 Minibuses, midi-buses and buses. 4Agricultural tractors and other vehicles. Data sources (rounded): Vietnam: Kaenzig et.al (2018). Cameroon: Kemtsop and Starkey, (2013). Ethiopia: WT Consult (2015) and Wabekbon (2017). Kenya: Hine and Bradbury (2016). Liberia: Starkey et al (2017). Tanzania: Cardo (2017). The importance of motorcycles is clearly demonstrated in Table 16. Bicycle transport and pedestrians should also be included. For example, traffic volumes in Tanzania also included around an average of 110 bicycles and 190 pedestrians per day on rural roads in 2017 (Cardno, 2017).
7.1 Rural Traffic in the United States and the United Kingdom Both the US and the UK have comprehensive traffic counting programmes, from which they calculate vehicle miles (or kilometres) travelled. The traffic counts are assigned to different classes of road and so traffic volumes are estimated by multiplying the counts by the respective road lengths.22 23
22 Federal Highway Administration, Highway Performance Monitoring System, Field Manual, 2016 23 Department for Transport, Road Traffic Estimates Methodology Note. Undated.
ReCAP | Scoping Study to Explore the Suitability of SDG Indicator 9.1.2 for Rural Access 45
In the US, the road network is divided into six categories (Rural Interstate, Rural Other Arterial, Other Rural, Urban Interstate, Urban Other Arterial and Other Urban). ‘Other Rural’ is perhaps the closest to our definition of rural, excluding main and arterial roads. In 2018 ‘Other Rural’ accounted for 338 billion motor vehicle miles, just over a tenth of the total for all roads in the country.24 In the United States the length of ‘Other Rural Roads’ comprised 2,261,000 miles and accounted for 54.6% of the total public road network.25
In the UK, traffic is divided between Motorways, Rural and Urban A roads, and Rural and Urban Minor Roads. In 2018 minor rural roads accounted for 45 billion motor vehicle miles, out of a total of 328 billion vehicle miles. Of this, car and taxis accounted for 78.9%, light commercial vehicles 18%, heavy goods vehicles 1.6%, motorcycles 1.1%, and buses and coaches 0.4%. In addition, it was estimated that minor rural roads accounted for 0.74 billion pedal cycle miles.26 Minor rural roads (129,000 miles) account for 54% of the total network but just 14% of traffic volumes.27
Based on the traffic volumes and vehicle classification it would be relatively easy to estimate rural passenger-km and rural freight tonne-km from these data.
7.1 Proposed Approaches for the ReCAP Research Countries This section describes the approaches and ideas developed during the country surveys. In each case a representative rural traffic counting programme needs to be set up in order to estimate traffic volumes.
Ethiopia
A variety of approaches can be pursued in order to capture data on the intensity of road passenger and freight movement in rural areas. The following briefly summarises a standard road side Origin-Destination survey, involving face-to face contacts:
Select sample areas (sub-regions), based on agro-ecological/farming system characteristics; Select a combined list of sample regional and rural access roads, based on variations in
population distribution, agricultural production (surplus/deficit), length, etc. Determine the number of survey stations and their location considering travel patterns; Prepare a questionnaire, covering number of occupants, trip purpose (O-D of trips), commodities
carried, etc. as appropriate; Pre-test the Origin-Destination (O-D) survey questionnaire; Prepare Origin-Destination (O-D) schedule, and train staff; Summarise and aggregate the data Derive O-D patterns (vehicle matrices, passenger matrices, and commodity matrices), as well as
average distances covered, average number of passengers, average load factor, etc.
It is considered to be useful to close gaps in understanding how data fit to a rural transport needs assessment (as part of rural transport planning) and to capture trends in performance, availability, frequency and other measures of rural transport service delivery.
24 US Department of Transportation Federal Highway Administration, Traffic Volume Trends March 2019 25 https://www.fhwa.dot.gov/policyinformation/statistics/2016/ 26 https://www.gov.uk/government/statistical-data-sets/road-traffic-statistics-tra 27 Department of Transport, Transport Statistics, Great Britain 2017

ReCAP | Scoping Study to Explore the Suitability of SDG Indicator 9.1.2 for Rural Access 46
Nepal
The importance of rural transport data needs to be recognised by different levels of Government. NPC needs to interact more intensively with the Provincial Governments and Municipalities (both Urban and Rural) to kindle this realisation not only at the decision-making level of these agencies but also at middle level management.
Secondly, the agency either recruits technical staff, or budgets to conduct vehicle-kilometre, passenger-kilometre, and goods-kilometre studies. Even for this, somebody with the appropriate skills needs to help these agencies to draft TOR and monitor the study, review and publish the received reports.
In the new federal structure, the municipalities need to coordinate with the Ministry of Federal Affairs and General Administration (MOFAGA) for their development needs and the budget. MOFAGA should develop a GIS based databank for the allocation of road construction budgets in order to facilitate SDG Goal 9.1.1. Under NPC’s insistence, MOFAGA could make it a precondition to Provinces and Municipalities to supply the required data, if their application for funds is to be considered.
Alternatively, the funding could come from the Nepal Roads Board. A major proportion of funds for road maintenance is channelled through the Board. The maintenance budget is allocated based on the length of roads, their hierarchy, maintenance history, and present condition. If the Board includes vehicle, as well as passenger and freight-kilometres as the budget allocation criteria, data could be generated. The method for collecting the data could be entirely manual in the beginning but move towards automation in the long run.
Tanzania
Despite the limited budget and the huge maintenance and road development requirements, there is a need for road implementing agencies to realise the importance of collecting rural transport data. In addition to the traffic counts and road condition data that are already collected, data related to passenger and freight volumes needs to be collected along with other related data such as passenger fare/km, freight cost/tkm, as well as information on transport modes and service frequency. In Tanzania, the implementing agencies apply for road funds from the Roads Fund Board (RFB), by justifying the required funds based on needs. The maintenance budget is usually allocated based on the length of roads, their hierarchy, maintenance history, asset value and present condition. However, the RFB should also consider the financing and management of the collection of rural transport volume data as an additional criterion for the allocation of maintenance funds to road implementing agencies. The method of collecting the data could be entirely manual in the beginning, moving towards automation in the long run.
7.2 A Basic Model to Assess Rural Transport Volumes In this section, based on the above findings a Basic Model is developed that may be applied with a minimum level of effort in terms of resources and time.
RONET, described in Section 6.4 might serve as a starting point for rural transport volume estimations. However, if RONET is not available a simple spreadsheet calculation may be used instead. RONET uses 625 classifications for roads, taking into account the network type, the kind of surfacing, the road condition and transport volumes. As we are only interested in traffic on ‘rural roads’ for the purposes of this study, the lengths of roads selected, and their associated traffic volumes both need to fall within this category. Hence, any existing RONET dataset will need to be

ReCAP | Scoping Study to Explore the Suitability of SDG Indicator 9.1.2 for Rural Access 47
adjusted to meet this criterion, based on the definition of rural roads given in Section 3. A simple sub-set of “n” relevant classes of rural roads will be selected for our purposes. In addition, all vehicles, passengers and tonnes transported on the selected road will be considered as rural transport.
In order to estimate rural traffic volumes, classified traffic counts (i.e. broken down by vehicle type) are taken on a sample of roads across the country and the counts are then multiplied by the corresponding length of roads in each category. In addition, a small number of roadside interview surveys should also be carried out to identify passenger occupancy rates and freight load factors.
Taking into account this assumption, the following methodology may be applied:
Vehicle kilometres
𝑇𝑇𝑇𝑇𝑇𝑇 = �𝑇𝑇𝑇𝑇𝑅𝑅𝑖𝑖 ∗ 𝐴𝐴𝐴𝐴𝐴𝐴𝑇𝑇𝑖𝑖 ∗ 365𝑛𝑛
𝑖𝑖=1
TVR = Transport volume on rural roads [vehicle km] RRLi = Rural Road length [km] on road type i AADTi = Annual average daily traffic [vehicles/day] on road type i i = Road type (e.g. according to RONET classification)
(1)
The analysis will be done for each of the n road categories identified. For this purpose, the road network needs to be classified into n road categories. Classification, road length and traffic volumes need to be updated regularly.
Passenger kilometres
𝑃𝑃𝑇𝑇𝑇𝑇 = �𝑇𝑇𝑇𝑇𝑇𝑇𝑗𝑗 ∗ 𝑂𝑂𝑇𝑇𝑗𝑗
𝑛𝑛
𝑖𝑖=1
PVR = Rural passenger transport volume [passenger km] TVRj = Rural transport volume for vehicle type j [vehicle km] ORj = Occupancy rate for vehicle type j [passengers/vehicle] J = Vehicle classification according to national statistics
(2)
The vehicle mileage TVRj is estimated as a share of freight transport of total transport volume:
Vehicle mileage for freight transport
𝑇𝑇𝑇𝑇𝑇𝑇𝑗𝑗 =𝐴𝐴𝐴𝐴𝐴𝐴𝑇𝑇𝑗𝑗𝐴𝐴𝐴𝐴𝐴𝐴𝑇𝑇
∗ 𝑇𝑇𝑇𝑇𝑇𝑇
(3)
For each type of vehicle, the average load factor LFj is estimated during road side surveys. If this is not possible, average national values may be used as well to compute the load factor. In combination with the rural freight vehicle mileage TVR the transport volume (tonne-km) is computed:

ReCAP | Scoping Study to Explore the Suitability of SDG Indicator 9.1.2 for Rural Access 48
Tonne kilometres
𝐹𝐹𝑇𝑇𝑇𝑇 = �𝑇𝑇𝑇𝑇𝑇𝑇𝑗𝑗 ∗ 𝑅𝑅𝐹𝐹𝑗𝑗
𝑛𝑛
𝑖𝑖=1
FVR = Rural freight volume [tonne km] TVRj = Rural freight mileage by vehicle type j [vehicle km] LFj = Load factor for vehicle type j [tonnes/vehicle]
(4)
For each type of vehicle, the average passenger occupancy rate or freight load factor is found through road side interview surveys. These methodologies are explained in the next section.
It might be argued that this methodology would give a broad estimate as although there is a correlation between road category and classification, the traffic volumes can vary significantly depending on economic activity in the area, e.g. tourism, agriculture, mining and forestry. Consequently, transport volumes might vary considerably between regions. However, this problem may be overcome by conducting road traffic surveys through a process of stratified random sampling on rural roads in regions (or areas) with different population densities and economic characteristics. At the country level, which is relevant for SDG Indicator 9.1.2, these regional differences will average out. Thus, a stratified random survey of rural roads should be adequate for the purpose.
The US and UK approach provides an example of how rural traffic volumes may be estimated and the methodology given above indicates how this may be extended to a wider range of countries and how rural passenger and freight volumes may be estimated. Nevertheless, the approach does need to be tested in practice, particularly in low and middle income with wide ranges of population density, and a diversity of economic activity, to identify the size of a suitable traffic counting programme to achieve a given level of accuracy.

ReCAP | Scoping Study to Explore the Suitability of SDG Indicator 9.1.2 for Rural Access 49
8 Methods for Transport Data Collection
8.1 General Approach
As with all indicators, an indicator of rural transport volumes needs a combination of field data and modelling. The latter may consist of simple grossing up field data, within a framework to provide a national figure, or the use of more complex modelling combined with relationships with other, more available, data.
In general, there is a clear trade-off between accuracy and costs. Approaches that require a great deal of new field data will be expensive but are more likely to provide an accurate result. While approaches that heavily rely on modelling and less new data, may be inexpensive and provide a quick answer, but can often be very inaccurate. The current UN SDG indicator of national passenger and freight volumes, covering over 200 countries and territories is based on an international model, where little direct traffic data has been collected for many of the countries, has been shown to be very inaccurate (see Section 4).
Given the resource constraints in many developing countries, the Basic Methodology (Section 7.2) was developed to assess rural transport volumes. The data inputs for this model are provided in Table 17. The data needs, their sources and collection methodologies are discussed in the following sections.
Table 17: Data inputs rural transport volume assessment
Data Unit Differentiation Sources
Rural road length km Classification of rural roads, e.g. RONET provides as set of 125 relevant types of which rural roads are selected.
Road Agency Transport Ministry GIS Databanks RONET Model
Annual average daily traffic
vehicles/day Road side traffic counts on representative rural road sections for each road type
Occupancy rate passengers/vehicle Passenger vehicles according to national statistics
Data may be derived from rural road side counts. Load factor tons/vehicle Freight vehicles according to
national statistics
8.2 Road Networks
8.2.1 Classified networks
Data relating to the road network are an important input to any assessment of transport volumes. Relevant data includes road length, functional classification (e.g. urban, trunk, feeder, etc.), design standards (width, surface, design speed, etc.) and road condition (very good to very bad). Data collection procedures in the three ReCAP countries Ethiopia, Nepal and Tanzania are described in Sections 5.1 to 5.3. Generally, the lack of a central database is regarded as a major challenge. With little quality control, no seasonal adjustments, and irregular surveys, data are often inconsistent and thus are not completely comparable. All countries collect some transport volume data, more details are presented in Section 10.

ReCAP | Scoping Study to Explore the Suitability of SDG Indicator 9.1.2 for Rural Access 50
Road classifications and design standards in the three researched countries are presented in Sections 5.6 and 5.7. The road length of the classified network is available on the lowest level of classification (Collector, Community, Village Roads) in all three countries (Table 6). Data are available at the local, level from 894 Districts in Ethiopia, 753 Rural Municipalities and 169 Districts in Tanzania. A major improvement would be the regular collection of data from the responsible administrations.
The networks are classified as ‘rural’, ‘interurban’ and ‘urban’ roads in Ethiopia and Nepal, while in Tanzania this has not been done. However, if the Basic Model given in Section 7.2 is applied, an estimate of the length of the rural road networks should be possible without large computation.
Design standards might give indications on the magnitude of transport volumes on rural roads. Two of the researched countries use AADTs for defining geometric road design standards, and, data relating to the road length with different design standards is available from rural administrations in all researched countries. A very rough estimate of rural traffic volumes, for the classified network, may be provided by multiplying provisional estimates of traffic volumes for each rural road standard by their respective road length. However, this estimate will be slow to change, and not reflect growing traffic volumes over time. A more accurate approach, using rural traffic counts is given below.
GIS Databases
Workman and McPherson (2019b) state that “most national roads agencies have good electronic mapping available for their network through GPS surveys, and have clear policies and guidelines in place for keeping the mapping of the network up-to-date as new roads are constructed or existing roads are reclassified. However, local roads agencies are typically less rigorous in keeping their maps up-to-date.”
Additionally, there are freely available sources of road mapping data, such as OpenStreetMap which is a collaborative project to create a free editable map of the world. However, Workman and McPherson (2019b) find that in OpenStreetMap “the main roads and urban roads tend to be better recorded than rural roads. However, that is changing as more and more countries become accustomed to working with online data”.
8.2.2 Unclassified road network
An important methodological problem is the inclusion of the unclassified network into transport volume estimations. Many countries have a large unclassified network. For example, currently the Kenya National Highway Authority reports a total road network for Kenya at 177,800 km; however, 46% of this is reported to be unclassified.28 Estimates of the unclassified network for 40 African countries were provided in an analysis carried out in 2010 by the World Bank. Out of a total road network of 1,735,000 km, 492,000 km (28%) was reported as unclassified (Gwilliam, 2011). Road authorities and local governments in different countries clearly do have estimates of the length, and knowledge of, the location of their unclassified road networks, however this data may be both imprecise and not be immediately available in a published form.
Most of the unclassified rural network will have very low traffic volumes, often less than 10 conventional vehicles per day. As with the classified network, to estimate rural traffic volumes requires an estimate of the road length together with an estimate of traffic. For most countries a
28 https://www.kenha.co.ke/index.php/road-network

ReCAP | Scoping Study to Explore the Suitability of SDG Indicator 9.1.2 for Rural Access 51
rough estimate of traffic volumes on the rural unclassified network could probably be put together relatively quickly using existing sources from road authorities and local government. However, to obtain a precise estimate a more detailed investigation is required, both in defining the network and in collecting relevant traffic data.
The question arises as to what information on the unclassified road network can be retrieved from other sources, such OpenStreetMap or satellite images. In order to give a first indication regarding this question, a test was made using the example of Makete District in rural South-East Tanzania. A comparison of OpenStreetMap with Google Earth’s satellite image reveals that most of the rural roads visible on the satellite image are as well captured by OpenStreetMap (Figure 10). None of the roads depicted are listed amongst the roads in Google Earth.
However, the usage of OpenStreetMap should not be overestimated. For example, in Nepal it cannot be used as a reliable source of information on Rural Roads. The country needs many more volunteers to supply GPS tracks of roads to OpenStreetMap. Therefore, OpenStreetMap may be an additional source for identifying unclassified roads.
Figure 10: Comparison of Google Earth and OpenStreetMap, Makete District, Tanzania
Google Earth
OpenStreetMap
However, this example does not prove that these data are available in all rural areas of Tanzania or other countries. ReCAP has recently completed research on road condition assessment using satellite imagery (Workman et al 2018), which was achieved through manual assessment of images. Manual compilation of unclassified road networks is only conceivable if it is done at the lowest government level using a large number of personnel.
Even though these data would greatly improve rural planning, it is not realistic to expect this work to be done in all countries. In this case Machine Learning could be a solution to define the remaining unclassified road network. Workman et al (2019c, p.13) claim “there is good potential for automation of the visual imagery assessment process. Many mapping algorithms already use Machine Learning to capture roads, but the process is not fully automated and still relies on human checking and revision to achieve the necessary accuracy”.

ReCAP | Scoping Study to Explore the Suitability of SDG Indicator 9.1.2 for Rural Access 52
8.2.3 Summary
Data on the unclassified network may be collected from road authorities and different government sources; however, for an accurate assessment this will need to be supplemented by other approaches to obtain a complete picture. In order to assess rural transport volumes, it is sufficient to calculate the length of the road networks and estimate the traffic load for each road type. For the assessment of the road network a step-wise procedure is proposed as depicted in Figure 11.
Figure 11: Procedure of road network assessment
8.3 Traffic Counts
The most popular way of estimating traffic volumes (in terms of passenger and freight vehicle kilometres) is via traffic counts. Many countries adopt this approach, and in fact the UK and the USA (UK Department of Transport, 2019; US Department of Transportation, 2019) use the method to separately estimate rural traffic vehicle volumes (see Section 7). The road network is divided up into categories of roads with similar characteristics, and then traffic counts are taken on a representative sample of roads. Gross traffic-distance volumes are then estimated by multiplying the count values by the length of road in each category. As most counts are done automatically (i.e. counting axles) this data needs to be supplemented with either video recordings or manual classified counts. Extensive research has been carried out in the UK’s Transport Research Laboratory to develop representative traffic counting programmes in developing countries.29
Because rural traffic is such a small proportion of total traffic volumes (most of which is interurban and urban) it is likely that standard traffic counting systems will not try to devote resources to achieve a particularly accurate picture. Traffic counts may reveal four essential data for transport volume calculation:
29 Howe (1971). Kenya 60-point census; design and results for 1970. RRL Report LR 398. Howe (1972). A review of rural traffic counting methods in developing countries. RRL Report LR 472. Jacobs and Blackmore (1974). Traffic Census Design in Malawi. SR 32UC.
Classified roads•official GIS databanks and maps
Unclassified roads
•OpenStreetMap
Unclassified roads
•Satellite images Google EarthIf road not included

ReCAP | Scoping Study to Explore the Suitability of SDG Indicator 9.1.2 for Rural Access 53
i. Number of vehicles passing the counting station
ii. Type of vehicles
iii. Occupancy rates of passenger vehicles
iv. Loads of freight vehicles
Section 5.9 provides an overview on traffic counting in the researched ReCAP countries. Ethiopia and Tanzania conduct annual traffic counts, Nepal biannually. Naturally, traffic counts are conducted in the main road networks; while rural roads are included in Tanzania, the other countries count on Main Access and Feeder Roads. All countries include motorcycles, NMT and use Passenger Car Units. Automated traffic counters and automatic number plate recognition is only used for special studies.
In order to estimate trends in traffic many countries carry out regular traffic counting programmes. These are sometimes referred to as a N-point census. In the UK a 50 point census approach was adopted, over 8 categories of roads, while in Kenya 60 points were adopted over 4 categories of roads. The programmes have been designed to be representative of the whole network (Jacobs and Blackmore, 1974).
An early approach adopted by the Transport Research Laboratory, and advocated for a number of countries was as follows:
i. determine the length of road in each road class,
ii. divide the number of counting stations 'N' between the various road classes in proportion to the length of the road in each class multiplied by the square route of the estimated traffic in each class; and
iii. allocate randomly the number of points in each class of road among that class.
The traffic counts in each class are then regarded as being representative on the length of road in each class.
Overall the procedure can be seen to be most representative of the higher volume roads, but at the same time not ignoring the more lightly traffic roads. Research is now needed to assess the accuracy of the approach in estimating rural traffic volumes for different number of counting stations and whether a more efficient approach would be suitable. it should also be borne in mind that in recent years most developing countries only tend to have regular national traffic counts on the their main road network.
Occupancy rates and load factors
Occupancy rates for passenger vehicles and load factors for freight vehicles are needed in order to estimate the overall transport volume in terms of passenger and tonne kilometres. Two options are available to retrieve these data:
i. National statistics may provide average rates for each vehicle type. This assumes that rates are similar for urban, interurban and rural transport. This assumption may not be justified, since loads on rural roads in low-income countries, are often higher than on urban or interurban roads. This is because drivers will attempt to maximise their loads and, in rural areas, police enforcement tends to be more limited. However, in high income countries passenger load factors on public transport will tend to be lower in rural areas, as subsidies are frequently required to sustain these services because of a lack of demand. The country

ReCAP | Scoping Study to Explore the Suitability of SDG Indicator 9.1.2 for Rural Access 54
survey revealed that national occupancy rates and load factors are calculated in Ethiopia and Nepal, but not in Tanzania.
ii. Therefore, it is preferred to calculate average passenger and freight loads based on rural road side counts. Since these factors are believed to be relatively stable over time, a frequent repetition of the assessment is not necessary. This is more time consuming but is no major problem, since rural counts are conducted on low volume roads.
Vehicle Classification
Generally, two options for the classification of vehicles are possible: (i) classification according to national standards, as laid down in the national statistics, and (ii) an international harmonised classification of vehicles. The latter approach would imply that transport volumes in terms of vehicle kilometres would be internationally comparable. Even though this approach would be desirable, the practical application of an international vehicle classification may cause additional difficulties since national vehicle classifications differ considerably. Section 5.8 shows some characteristics of the vehicle fleets in the researched ReCAP countries. While Ethiopia registers 24 types of vehicles, in Nepal only 11 types and Tanzania 16 types are classified.
8.4 Transport Model Usage The RONET model, which has already been mentioned in Section 6.4, may be used for rural transport volume estimations. The model classifies 125 segments of the road network that are relevant for this study. It has to be tested, if and how the national road categories can be converted into RONET categories. In a second step, the RONET model needs to be empirically tested if it is possible to generate rural transport volumes on this basis.
If it is not practical to use the RONET Model, a simple Excel spreadsheet calculation might be used alternatively. This is possible since the calculations are relatively basic (see Section 7.2). In order to estimate the work load and the size of the spreadsheets, this approach needs to be tested in practice as well.
If a fully-fledged-4-step transport model exists in the country, it may be used for cross-checking rural transport volume data (see below).
8.5 Vehicle Odometer Readings
Vehicle odometer readings can give an estimate of total distance travelled by different vehicle types. However, in the past they were rarely used for national travel surveys. It is believed that collecting data directly from the odometer is a rather cumbersome approach. However, In the UK, and other countries, the odometer reading must now be entered into the annual test certificate, and hence, with electronic registration and data collection, directly into a national vehicle database. Nevertheless, in many low income countries the vehicle population is relatively old. For much of Africa, the Middle East and Central America, most vehicles are imported second-hand, and it is common to find the odometer broken, –particularly for older commercial vehicles.
While, in principle, odometer readings can be used to estimate overall vehicle travel within a country it is not really suitable to estimate travel just on the rural network.

ReCAP | Scoping Study to Explore the Suitability of SDG Indicator 9.1.2 for Rural Access 55
8.6 Mobile Phone Data
Using mobile phone network data for transport planning is a new technological option that has so far not been used on a large scale. A wide range of data collection options are presently feasible:
Origin/Destination data, route choice, Transport volumes for passengers (pkm), Travel speeds, seasonal accessibility, Purpose of travel and modal choice (only in combination with a transport model, see below), Rural and urban transport activities.
For transport, mobile phone data have been used for a wide range of issues in Industrialised and developing countries.30
Box 3: Mobile phone data used for transport planning in Wales
The company Citi Logik has developed custom datasets using mobile phone data for over 100 transport and urban planning projects in the UK and abroad. The whole of Wales was analysed for one month with the aim at developing a database of trips that could be queried for different purposes. Data relating to about 8.7 million trips were collected for Wales, per average weekday. The data was processed at different levels, within census areas. The data were used to plan the M4 Newport bypass as well as for Welsh planning purposes.
Citi Logik Presentation for TRL, 2019
Hemmings (2016) provides a number of recommendations for usage of mobile network data. The author mentions that the “trip purpose is normally inferred by detecting the home and work end of trips to derive O/D purposes”. This requires a conversion of mobile network data to model matrices. “The segmentation and disaggregation process is used to split data by mode, vehicle type and trip purpose, and convert it from mobile data zoning into model zoning depending on the way the data is provided and the study requirement”. Consequently, trip purpose and modal split are only available in combination with a transport model.
For the assessment of rural transport in developing countries, there are surprisingly few constraints. Even if the net coverage in rural areas is patchy, travel data can be compiled by combining incomplete sections of the trips. The problem of limited network coverage will gradually be reduced in the future, since networks are constantly expanded in all countries. According to GSMA, mobile phone connections increased by 6.2% in 2019 (https://www.gsma.com).
30 Examples: commuting statistics in Estonia and Sri Lanka, urban traffic flows in Estonia, real-time traffic monitoring, traffic variability caused by holidays, urban spatial pattern analysis in the Netherlands, OD matrices for the whole country of Kuwait, and a traffic demand modelling project in Pune India (UN Global Working Group on Big Data for Official Statistics (2017).

ReCAP | Scoping Study to Explore the Suitability of SDG Indicator 9.1.2 for Rural Access 56
Box 4: Mobile phone coverage by GSMA
Mobile phone coverage can be retrieved from GSMA, an association that represents the interests of mobile network operators worldwide. More than 750 mobile operators are full GSMA members and a further 400 companies in the broader mobile ecosystem are associate members. GSMA’s information cover “every operator group, network and mobile virtual network operator in every country worldwide – from Afghanistan to Zimbabwe GSMA provides a paid for report which details all the mobile network statistics across the globe.”31 GSMA is active within the SDG process, claiming to contribute to all SDG goals, especially to goals 4 and 9.32
A major constraint is the distinction between passenger and goods transport. On roads allowing speeds above 80km/h, freight transport can be distinguished from passenger cars that usually travel faster. However, in rural areas where travel speeds are slower, mobile phone data cannot distinguish between passenger and freight transport. A similar constraint is the distinction between public and private transport. While travel by rail can be distinguished from travel by road because different pathways are used, bus travel - a common mode in rural areas – cannot be distinguished from travel in private cars. Both limitations show that mobile phone data cannot fully replace roadside counting.
The costs of mobile phone data are mainly determined by the costs which providers charge for their raw data, while the costs of computing travel data are comparatively low. On the one hand, the price for mobile phone data is high since there is a strong demand from other industries to use these data for marketing purposes. On the other hand, mobile phone providers use their oligopolies to generate extra income at minimal costs. The question arises which options network regulators have to receive data at lower costs if they are in the interest of the broader public, e.g. to achieve the SDGs.
Conclusion: Mobile phone data can be efficiently used for rural transport volume estimation, in the longer term, if the methods are further developed. While the movement of vehicles can be well captured, data gaps exist regarding passenger volumes in public transport and freight volumes.
8.7 Cross-Checking the Final Result Cross-checking of the calculated rural transport volumes is important, since the Basic Model includes various assumptions that might multiply to larger errors. Gross errors may be detected by:
i. Comparing estimated rural passenger volumes per head of the rural population with national transport volumes per head and with data derived from long distance trips from household surveys.
ii. Cross-checking estimated rural vehicle flows with available traffic count data from different sources.
iii. Cross-checking the passenger volumes with national transport models. iv. Cross checking rural vehicle-kilometres in different regions with estimates regional vehicle
kilometres. v. Using regional agricultural marketing figures to cross-check rural freight transported.
31 https://www.gsma.com/newsroom/gsmai, retrieved on December19, 2019. 32 GSMA 2019. Mobile Industry Impact Report: Sustainable Development Goals.

ReCAP | Scoping Study to Explore the Suitability of SDG Indicator 9.1.2 for Rural Access 57
8.7.1 Transport Fuel Sales
Fuel consumption data has been used to estimate and check vehicle traffic volumes, by some countries. Australia has taken this approach in the past, (Hossain and Gargett, 2011) it has also been used by the Ethiopian Roads Authority to help check and estimate national traffic volumes (ERA, 2004). However, although the approach is useful for estimating national transport volumes, it is far less useful estimating rural transport volumes, as fuel sales are not confined for use on particular sections of the road network. It is also necessary to carefully check on the non-transport use of vehicle fuels. An additional complication is the rise of electric vehicles.
8.7.2 Household surveys
Household surveys may be used to cross check outcomes of the Basic Model. Section 5.11 describes the conduct of household surveys in the three researched ReCAP countries. In Ethiopia household surveys on transport and mobility were conducted in 2015/16. The survey included 32,000 sample households over the whole country. In Nepal and Tanzania no nationwide surveys have been conducted. However, in all three countries recent local/regional surveys exist that estimate household and areal transport volumes and trip generation.
It has to be emphasised that the Basic Model does not capture the traffic in and around the village (see Section 3.2). One option would be to include these trips in the transport volume calculations. It is conceivable to add this short distance traffic to the generated data, but would imply significantly more efforts and costs. As data sources, rural household and travel surveys could be used.

ReCAP | Scoping Study to Explore the Suitability of SDG Indicator 9.1.2 for Rural Access 58
9 Conclusions This scoping study is designed to contribute to the development of the Sustainable Development Goal (SDG) 9.1 which seeks to ‘develop quality, reliable, sustainable and resilient infrastructure, including regional and trans-border infrastructure, to support economic development and human well-being, with a focus on affordable and equitable access for all’. The study investigated the feasibility of adapting the SDG Indicator 9.1.2 for rural mobility, with a view to identifying a measurement framework and data collection methodology based around the movement of rural passenger and freight road transport. This section summarises the findings.
9.1 International Sources for Transport Data A number of international sources provide data on land transport, covering both road and rail for many countries. The data include road lengths, vehicle fleet and traffic as well as passenger and freight volumes. The International Road Federation (IRF) is by far the most comprehensive source of up-to-date data for different countries.
Drawing on data supplied by the International Transport Forum (ITF) estimates of road and rail passenger and freight volumes are provided by the UN SDG list for over 200 countries and territories. However, this source is based on an international model with little data input for most countries, and major inaccuracies have been found.
None of the international listings separately identify rural transport. However, estimates of rural traffic volumes, by vehicle type are provided on a regular basis by both the United States and the United Kingdom.
9.2 Results of the Country Surveys Surveys in three ReCAP countries Ethiopia, Nepal and Tanzania were undertaken in order to assess the data availability and the institutional capacities related to data collection and management (see Section 5).
9.2.1 Data availability
First of all, it can be clearly stated that rural transport volume data, in terms of either vehicle kilometres or passenger-kilometre (pkm) or tonne-kilometre (tkm), were not readily available in any of the researched countries. The main challenges were the absence of central databases, large data inconsistencies, capacity and skill gaps, timely availability of data and lack of resources for data collection. The main features of transport data collection include weaknesses in designing and organising a regular flow of data and information, and the multiplicity of organisations involved, without clearly defined responsibilities and coordination. Often databases are created solely for statistical purposes without considering their use.
An additional major constraint is a lack of a uniform and consistent system of data collection and presentation (i.e. covering objectives/purpose, indicator choice, data requirements definition and categories of data, detailed and aggregated and how often target values, sources of data, database, data analysis procedures, etc.).
Knowledge on the length of rural roads is provided at district levels which differ in size considerably. Ethiopia and Nepal have spatial differentiation of 750-900 government units, and in Tanzania only 169 districts report about road length. A huge information gap exists regarding the unclassified network, for which some countries do not even publish estimates of unclassified network length.

ReCAP | Scoping Study to Explore the Suitability of SDG Indicator 9.1.2 for Rural Access 59
Most of the traffic counts are conducted on the main road network, with rural roads being excluded. Information on passenger transport volumes (pkm) are only available if separately (externally) funded projects are conducted. If freight transport volumes (tonnes, tkm) are available, they are only for major roads.
A national household survey on transport has been recently conducted in Ethiopia, but not in Nepal and Tanzania. If data exist, they stem from projects that do not cover the whole country. Although road inventory data does exist for both Nepal and Tanzania, no nationwide surveys have been conducted on transport and mobility. Currently, O/D surveys are not available in any of the researched ReCAP countries. They are considered to be too complex and expensive.
Data on public transport are scarce, especially since knowledge relating to informal transport services is very limited. Even for public bus services, operational frequency, the number of passengers and the freight transported are not recorded. Non-motorised transport data are available from both specific projects or from classified traffic counts. However, the local data have to be extrapolated before data at the national level can be presented.
9.2.2 Institutional set up, capacity of line ministries and NSOs
Besides the lack of availability of transport data, data within a country is often handled by many different ministries and agencies. As the case studies have shown, even if the data exists, no institution has a full overview or a complete database of collected data.
Additionally, in Low Income Countries (LIC) ministries often do not have the trained staff for handling transport data. There is a lack of human resources as well as capacity development for staff.
Finally, NSOs have to collect and submit the data but there is often no specific transport knowledge within their offices. Even when training is provided, there is a lack of technical understanding of the data that has been collected.
9.3 A Basic Model for Transport Volume Estimation Given the observed constraints in international data collection and in the three ReCAP countries, a Basic Model was developed, on how to compute rural transport volumes at the country level.
There is a strong nexus between complexity of the approach, the accuracy of the data and the costs for data collection and computation. Taking this into account, the resource constraints in many developing countries, a Basic Model (Section 7.2) with a low cost approach was developed: In order to estimate rural traffic volumes, classified traffic counts (i.e. broken down by vehicle type) need to be taken on a sample of rural roads across the country and the counts are then multiplied by the corresponding length of roads in each category.
More details on the mathematic calculations are given in Section 7.2. Additionally, the project found that using internationally standardised definitions would be too cumbersome to be implemented and not feasible in practice. Therefore, it is recommended that countries use their proper nomenclature, standards and definitions that refer to the classification of their country statistics. These are:
Definition of rural and urban areas, Functional road types and design standards, as well as Composition of the vehicle fleet.

ReCAP | Scoping Study to Explore the Suitability of SDG Indicator 9.1.2 for Rural Access 60
It is not necessary to make local standards directly comparable, since the output will be rural transport in terms of passengers and tonnes transported, as well as passenger kilometre and tonne kilometre.
9.3.1 Data collection for the Basic Model
The country survey revealed that data on the classified road network are generally available, since “most national roads agencies have good electronic mapping available for their network through GPS surveys” (Workman, 2019b). However, as stated above, data on the unclassified road network have to be generated. Rough estimates of the unclassified network should be available in most countries. For a more accurate assessment, technologies such as OpenStreetMap and Satellite images may be used to recognise unclassified rural roads (see Section 8.6). However, the application of these innovative technologies needs further elaboration.
In the Basic Model, the road network is divided up into categories of roads with similar characteristics, and then traffic counts are taken on a representative sample of roads. The country survey revealed that traffic counts are undertaken in all of the three researched ReCAP countries. However, most of the regular surveys are on major roads, with only occasional ad hoc surveys undertaken on minor roads. Thus, including rural transport volumes in Indicator 9.1.2 implies that many countries would need additional rural traffic counts to be undertaken on a systematic basis.
An innovative approach towards transport data collection, in the longer term, is the use of mobile phone data. The technology is already used for traffic volume assessments on high volume road networks in many countries. While the movement of vehicles can be well captured, data gaps exist regarding passenger volumes in public transport and freight volumes. Additionally, it needs to be assessed if the technology may be applied as well in rural areas of low income countries.
9.3.2 Quality control of the Basic Model
The proposed method is a rough ‘bottom-up’ approach that requires various assumptions. Therefore, cross-checking the aggregated results is imperative. This may be done by comparing the magnitude of the outcomes with:
National statistics, Travel data generated by household surveys, Data on fuel sales and consumption, Transport model calculations, and Agricultural marketing figures.
The survey in three ReCAP countries revealed that not all of the data sources are available, and some of them not reliable. Since qualified local staff is rare in public administrations of low income countries, this task would have to be overtaken by professional consultants. For further details see Section 5.
9.4 Further Research Needs The Basic Model was derived from the approaches of the US and the UK to estimate rural traffic volumes. Additionally, advice is provided to make the model more suitable for developing countries. Nevertheless, research is required to assess the validity of the RONET road classification system and the size of a suitable traffic counting programme to achieve a certain degree of accuracy for any given country. The study should evaluate as well, the minimum number and location of counting stations needed in order to produce a representative picture of the country’s rural transport volume.

ReCAP | Scoping Study to Explore the Suitability of SDG Indicator 9.1.2 for Rural Access 61
Research is also required to identify the most appropriate cross checking procedures with other sources of data, such as existing transport models, household surveys etc.
Other research needs:
• Usage of innovative technologies such as OpenStreetMap and satellite images to recognise unclassified rural roads.
• Usage of mobile phone data for the assessment of rural transport volumes in developing countries.
9.5 Alignment with the SDG Process This Section summarises the key findings and actions related to the SDG process. Through the expert interviews as well as the country analysis (see Section 5) seven key barriers for a geographical disaggregation were identified:
1. Lack of agreed methodology (including rural transport definition) 2. Limited data availability in countries 3. Limited capacity of line ministries and NSOs 4. Insufficient financial resources 5. Lack of alignment with the SDG process 6. A lack of interest in the importance of accurate data 7. Shortcomings in the legal framework for a mechanism to ask for the data, and report on it
The transport data collected for reporting to the custodian agency under the SDG requirements as well as for the VNR are collected for different SDGs, which leads to challenges for the NSO. At the same time, countries lack a coherent and integrated transport data collection process at the national level. Table 18 summarises the main barriers.
Table 18. Summary of major barriers to the inclusion of rural transport indicator in SDG 9.1.2
Methodology Data availability Capacity Financial Resources
Alignment with SDG Process
No accepted definition of rural transport Diversity of data collection between countries
Large data gaps for transport volume Timely availability No central database, Inconsistencies, Capacity gaps, Lack of resources
NSO often no specific transport knowledge Wide set of ministries and agencies collect transport data
Limited financial resources for data collection and management Limited international support
No one stop shop for national transport data collection Transport related SDGs widespread within the SDG framework
Even though in each of the researched ReCAP countries 2-3 institutions have a budget for transport data collection, low-income countries often lack financial resources for collecting, managing and analysing transport data. Some international support is provided to National Statistics Offices, however this has to cover all sectors, and support for transport sectors is likely to be limited. In addition, some support for data collection is often linked to donor supported road projects, and hence funding is likely to run out at the end of the programme. At the same time, there are financial constraints for supporting the training of staff and running surveys.

ReCAP | Scoping Study to Explore the Suitability of SDG Indicator 9.1.2 for Rural Access 62
9.5.1 Methodology
Within the SDG process, the custodian agency has to develop and discuss the methodological options. For example, for the SDG indicator 11.2.1., UNHABITAT established an expert group to help with the preparation of the methodology. Once a methodology is developed by the experts under the custodian agency leadership and is seen as sound, the custodian agency has to submit their proposal to the IAEG-SDG. They finally approve the methodology as well as the tier level. However, as in the case of rural transport, the disaggregation for SDG 9.1.2 was not part of the list of accepted new indicators. This work could therefore only be preparatory in nature until the next opportunity in 2025, when the next IAED-SDG comprehensive review will take place (see Section 2.3). One issue to consider here is, if the disaggregation would be part of a revised indicator for SDG 9.1.2, which would face the risk of dropping to Tier II or even III. Alternatively, a secondary indicator could be introduced as a voluntary option.
9.5.2 Recommendations
Based on the dialogues with the custodian and partner agencies, there are definite opportunities for rural transport data collection for SDG indicator 9.1.2, which would ensure better recognition of rural transport within the SDGs.
As a result of interviews with the custodian agencies, partner agencies and other experts in the field, two options might be considered to explore further:
a) Incremental development: Submission of a suggestion for a rural indicator within 9.1.2. for next consultation for IAED-SDG review 2025.
As described in Section 2.4 the next review of the global indicators is set for the year 2025. With the support of the custodian agency and the partner agencies, a working group could be set up to further reflect on the methodology. At the same time, initial country studies could include data collection efforts, which could be carried out to further test and provide evidence for the developed methodology. This could allow the working group and then finally the custodian agency to suggest the inclusion of a rural transport indicator for SDG 9.1.2 for the 2025 submission to the IAED-SDG.
b) Integrated report for all transport related SDGs as a special report.
An alternative pathway would be to eventually create a wider Transport SDG report, which would allow further disaggregation without the need for approval. The consultation during COP 25 showed a substantial interest by a broad set of stakeholders supporting the idea. The report could still be accepted as an official UN document.
Such a comprehensive global report could fill the gap of a sole global central database for transport related data. It would also have the advantage that the countries have one agreed data collection and reporting framework. At the same time, such a report could still pave the way to include rural transport within SDG Indicator 9.1.2, but the geographic disaggregation could also be applied to other indicators like 3.6 on road fatalities. These efforts could be aligned with SuM4All, which has brought together some SDG relevant transport data in its Global Mobility Report (2017).33 In the Global Mobility Report and the latest Global Roadmap of Action (GRA),34 four objectives (universal access, efficiency, safety and green) were created based on the existing SDGs. Table 19 shows the key principal indicators of those four objectives as well as
33 http://sum4all.org/publications/global-mobility-report-2017 34 http://www.sum4all.org/gra

ReCAP | Scoping Study to Explore the Suitability of SDG Indicator 9.1.2 for Rural Access 63
suggested values for a country assessment. Based on the results, a list of core policies is suggested. This approach will be tested in 2020 in South Africa. While a future Transport SDG could be created on the current work, it would need further disaggregation at the indicator level to acknowledge the key difference between rural and urban transport.
Table 19: SuM4All policy goals, principal indicators and country group thresholds
Source: http://www.sum4all.org/data/files/GRA-Tool/gra_country_groups.pdf
Furthermore, links could be explored between the plans from the United Nations Centre for Regional Development (UNCRD) for a future regional SDG and NDC reporting (National Determined Contribution – request through the Paris Agreement on Climate) as part of their future Environmental Sustainable Transport Forum (EST). UNCRD is planning to renew the Bangkok Declaration (2010), which asks its 53 members to report annually on their efforts on sustainable transport. The recent forum in Hanoi in October 2019 agreed to align the reporting with the SDGs. In addition, the Asian Development Bank is planning a national Transport Outlook, which would provide resources for data collection and capacity building for statistical offices.
Further consultation during the COP 25 in Madrid (see section 2.2) highlighted the interest of a broad variety of transport stakeholder to further explore such a concept. It is important that this report would not replace any existing initiative, but rather build on the existing work.
As the project ends in February 2020, the following next steps for further development of this work are recommended:
1. Development of detailed proposals of one or both options outlined above 2. Organise a workshop with selected experts and custodian agencies 3. Host side event at the 2nd Global Sustainable Transport Conference in Beijing in May 2020.
The institutional backing from DFID within this process is a key success factor and would require substantial resources.

ReCAP | Scoping Study to Explore the Suitability of SDG Indicator 9.1.2 for Rural Access 64
References
Archondo-Callao R. (2018). Roads Economic Decision Model (RED) for Economic Evaluation of Low Volume Roads, Version 4.00, April 26, 2018, The World Bank. Download: https://collaboration.worldbank.org/content/sites/collaboration-for-development/en/groups/world-bank-road-software-tools/files.asset.html/content/usergenerated/asi/cloud/content/sites/collaboration-for-development/en/groups/world-bank-road-software-tools/files/jcr:content/content/primary/library1/red_version_4_0_engl-JM7A.html
Barwell, I (1993): Local Level Rural Transport in Sub-Saharan Africa, Rural Travel and Transport Project, The World Bank.
Cardno (2017). IRAT Traffic Count, Draft Final Report. Cardno, Thame, UK for Improving Rural Access in Tanzania (IRAT) Project and President’s Office, Regional Administration and Local Government (PO-RALG), Dodoma, Tanzania. 66p. (Unpublished).
Chomitz K, Buys P, Thomas T (2005). Quantifying the rural-urban gradient in Latin America and the Caribbean, World Bank Policy Research Working Paper 3634.
Department of Transport (2017). Transport Statistics, Great Britain 2017
Department of Transport, UK (2018) Road Lengths in Great Britain, Statistics: Notes and Definitions.
Department of Transport, UK (undated). Road Traffic Estimates: Methodology Note.
Ethiopian roads Authority (2004) Road Funding and Road User Charges in Ethiopia, Addis Ababa.
Federal Highway Administration (2016), Highway Performance Monitoring System, Field Manual, United States.
Gwilliam K. et al (2011). Africa’s Transport Infrastructure, Mainstreaming Maintenance and Management, World Bank, Washington, DOI: 10.1596/978-0-8213-8456-5.
Handbook on the use of Mobile Phone data for Official Statistics 2017. UN Global Working Group on Big Data for Official Statistics, DRAFT
Havega,J. et al. (2012). Extending freight flow modelling to Sub-Saharan Africa to Inform Infrastructure Investments-Trade Data issues. Journal of Transport Supply and Chain Management.
Hemmings, Tobias and Goves, Carl 2016. Utilising Mobile Network Data for Transport Modelling, Recommendations Paper, Department for Transport Document, Ref: MV7/RPT001 Version No: D14.
Hine, J. and Bradbury, A. (2016). Ex-Post Evaluation of AFD/GOK Roads 2000: Final Report. TRL Report CPR 2314. Crowthorne: TRL Limited
Hine, J., Abedin, M., Stevens, R., Airy, T. and Anderson T. (2016). Does the extension of the rural road network have a positive impact on poverty reduction and resilience for the rural areas served? If so how, and if not why not? London: EPPI-Centre, Social Science Research Unit, UCL Institute of Education, University of London
Hossain, A. and D. Gargett (2011). Road vehicle-kilometres travelled estimated from state/territory fuel sales. Australasian Transport Research Forum 2011 Proceedings 28 - 30 September 2011, Adelaide.
Howe, J (1971). Kenya 60-point census; design and results for 1970. RRL Report LR 398. Road Re-search Laboratory, Crowthorne.

ReCAP | Scoping Study to Explore the Suitability of SDG Indicator 9.1.2 for Rural Access 65
Howe, J (1972). A review of rural traffic counting methods in developing countries. RRL Report LR 472. Road Research Laboratory, Crowthorne.
International Civil Aviation Organisation (2015). Annual Report, Montreal.
International Road Federation. IRF World Road Statistics (2017) Database. Geneva
International Union of Railways (2017). Railway Statistics, 2017 Synopsis. Paris
Jacobs, G and D. Blackmore (1974). Traffic Census Design in Malawi. Supplementary Report 32UC., Transport Research Laboratory. Crowthorne.
Kaenzig, R. Hine, J. and R. Petts (2019) Cost/Benefit Analysis of SEACAP Trials in Vietnam. ReCAP Project Reference RAS2110A. Cardno Emerging Market (UK), Thame
Kemtsop G A and Starkey P, (2013). Rural transport service indicators: report of the Pitoa–Djallou Road, Northern Cameroon. International Forum for Rural Transport and Development (IFRTD), London, UK for Crown Agents, Sutton, UK. 30p. Available at: http://www.ruraltransport.info/RTSi/resources/project_outputs.php
Kendat/IFRTD/TCP (2014). Rural Logistics for Smallholder Farmers to Meet New Agricultural Market Demands, Project AFCAP/GEN/060.
Njenga, P et.al (2015): Baseline study on rural transport service indicators Kidabaga-Boma LaNg’ombe Road, Kilolo District, Tanzania, Draft report, AFCAP Service Agreement Number: SC14060 Activity Number: TAN2015F.
OECD (2013). Definition of Functional Urban Areas (FUA) for the OECD metropolitan database.
Oregon Department of Transport (2010). Oregon Freight Plan Modelling Analysis Technical Memo. ODOT Transportation Planning Unit of Analysis.
Peet, K (2019): Low-carbon Transport for Development - Trends and Recommendations for Islamic Development Bank Member Countries, SLoCaT .
Ratcliffe, M, Burd, C, Holder, K and Fields, A. (2016). Defining Rural at the U.S. Census Bureau, American Community Survey and Geography Brief, United States Census Bureau.
Sieber, N (1996): Rural Transport and Regional Development, The Case of Makete District, Tanzania, Nomos Verlag, Baden-Baden.
Sieber, N (2019). Rural Access and the Sustainable Development Goals, in. Oortwijn, Dima (ed) Urban and Rural Poverty; Prevalence, Reduction Strategies and Challenges; New York.
Sieber, N. (2019). Rural Access and the Sustainable Development Goals, in: Oortwijn, Dima (ed) Urban and Rural Poverty; Prevalence, Reduction Strategies and Challenges; New York.
Sieber, N. and Allen, H. (2016). Impacts of Rural Roads on Poverty and Equity, in: Transport and Communications Bulletin for Asia and the Pacific. No.86 Sustainable Rural Access.
Sieber, Niklas and Peter Njenga (2019). Modern Logistics for High Value Products in Sub-Saharan Africa, in. Oortwijn, Dima (ed) Urban and Rural Poverty; Prevalence, Reduction Strategies and Challenges; New York.
SLoCaT (2019): Sustainable Transport: A Critical Driver to Achieve the Sustainable Development Goals. http://www.slocat.net/sites/default/files/u13/transport_and_vnrs_2014-2019_final_version.pdf
Starkey, P., Hine, J., Nyan, B. D. and Ziadee, T. C. (2017). Liberia Rural Transport Services: Final Report. Monrovia, Liberia. Cardno IT Transport for Ministry of Public Works and Ministry of Transport. 56p.

ReCAP | Scoping Study to Explore the Suitability of SDG Indicator 9.1.2 for Rural Access 66
Starkey, Paul and John Hine (2014): Poverty and sustainable transport, How transport affects poor people with policy implications for poverty reduction. A literature review.
SuM4All (2017). Global Mobility Report 2017: Tracking Sector Performance. Washington D.C.: Sustainable Mobility for All, http://sum4all.org/publications/global-mobility-report-2017
Sustainable Mobility for All 2017. Tracking Sector Performance
Transport and ICT. (2016). Measuring Rural Access. Using New Technologies. Washington DC. World Bank, License. Creative Commons Attribution CC BY 3.0
TRL Ltd (2004). Overseas Road Note 40. A guide to axle load surveys and traffic counts for determining traffic loading on pavements. Department for International Development, TRL Limited, Crowthorne.
Uchida H, Nelson A (2010). Agglomeration Index: Towards a New Measure of Urban Concentration, United Nations University Working Paper No. 2010/29
UN Global Working Group on Big Data for Official Statistics (2017): Handbook on the use of Mobile Phone data for Official Statistics, DRAFT November 2017
United Nations, Department of Economic and Social Affairs, Population Division (2018). World Urbanisation Prospects: The 2018 Revision, Methodology. Working Paper No. ESA/P/WP.252. New York: United Nations.
US Department of Transportation, Federal Highway Administration (2019). Traffic Volume Trends March 2019.
Vincent, S., Civil Design Solutions (2018). Status Review of the Updated Rural Access Index (RAI), Final Report, GEN2033C. London. ReCAP for DFID.
Wabekbon (2017). ERA Consultancy Services for Impact of Roads Constructed Under Universal Rural Roads Access Program (URRAP); Group 2: - Oromia, Harar and Gambella Regions, and Dire Dawa City Administration. Impact Evaluation Report Draft Final (2015-2017), Ethiopian Roads Authority
Willilo, S et.al. (2012). Rural Transport Service Indicators, Tanzania Country Report, Project AFCAP/GEN/060
Willilo, S; Starkey, P (2013). Rural Transport Service Indicators,Report of the Iringa-Kilolo Road, Tanzania, Project AFCAP/GEN/060.
Workman R, TRL Ltd (2018). The use of appropriate high-tech solutions for road network and condition analysis, with a focus on satellite imagery, Final Report: ReCAP for DFID.
Workman R., Starkey P., McPherson K., TRL (2018). Consolidation, Revision and Pilot Application of the Rural Access Index (RAI), Inception Report, GEN2033D. London. ReCAP for DFID
Workman, R. and McPherson, K., (2019a). Consolidation, Revision and Pilot Application of the Rural Access Index (RAI): TG2 Final Report. ReCAP GEN2033D. London: ReCAP for DFID.
Workman, R. & McPherson, K., TRL (2019b). Measuring Rural Access Using New Technologies: Supplemental Guidelines. ReCAP GEN2033D. London: ReCAP for DFID.
Workman, R. & McPherson, K., TRL (2019c). Consolidation, Revision and Pilot Application of the Rural Access Index (RAI): Progress Statement #1. ReCAP GEN2033D. London: ReCAP for DFID.
Workman, R. Starkey, P. McPherson, K. TRL (2018). Consolidation, Revision and Pilot Application of the Rural Access Index (RAI), Inception Report, GEN2033D. London: ReCAP for DFID.

ReCAP | Scoping Study to Explore the Suitability of SDG Indicator 9.1.2 for Rural Access 67
World Bank (2016). Measuring rural access: using new technologies (English). Washington, D.C.: World Bank Group.
WT Consult (2015). ERA consultancy services for impact assessment of the Universal Rural Road Access Program (URRAP): Ethiopia Group1: Amhara, Tigray, SNNP and Benishangul-Gumuz Regions Baseline Report (2014-15 EFY) Ethiopian Roads Authority.

ReCAP | Scoping Study to Explore the Suitability of SDG Indicator 9.1.2 for Rural Access 68
ANNEXES
Annex 1 Number of Countries or Areas According to the Criteria Used in Defining Urban Areas, 2018
Annex 2 Stakeholder Meetings
Annex 3 Country Reports

ReCAP | Scoping Study to Explore the Suitability of SDG Indicator 9.1.2 for Rural Access 69
Annex 1 Number of Countries or Areas According to the Criteria Used in Defining Urban Areas, 2018
Source: United Nations, Department of Economic and Social Affairs, Population Division (2018)

ReCAP | Scoping Study to Explore the Suitability of SDG Indicator 9.1.2 for Rural Access 70
Annex 2 Stakeholder Meetings
Name Position/Designation Organisation Toru Hasegawa, Sai Ananthanarayan
SDG Focal Point Chief Aviation Data and Analysis (ADA)
ICAO
Alex Blackburn
Economic Affairs Officer Secretary of the Working Party on Transport Statistics (WP.6), in UNECE's Sustainable Transport Division
UNECE
Dimitrios Papaioannou, Mario Barreto.
SDG Focal Point
ITF
Stefanie Holzwarth
Urban Mobility Unit Urban Basic Services Branch
UNHABITAT
Robert P Ndugwa, Chief, Global Urban Observatory Unit Research and Capacity Development Branch
UNHABITAT
Ahmed Ahmed Al Qabany Head of Climate Change ISDB
Karl Peet Alice Yiu
Research Director Research Fellow
SLoCAT
Phillip Turner Research Director UITP
Ms Julia Funk Head of Statistics, IRF

ReCAP | Scoping Study to Explore the Suitability of SDG Indicator 9.1.2 for Rural Access 71
Annex 3 Country Reports
Country Report Ethiopia
Country Report Nepal
Country Report Tanzania

ReCAP | Scoping Study to Explore the Suitability of SDG Indicator 9.1.2 for Rural Access 72
Scoping Study to Explore the Suitability of SDG Indicator
9.1.2 for Rural Access Project
Reference Number: GEN2173A
Country Report
on Data Availability
Ethiopia
Responsible: Teferra Mengesha
e-mail: [email protected]

ReCAP | Scoping Study to Explore the Suitability of SDG Indicator 9.1.2 for Rural Access 73
1 Institutions and Statistics
1.1 Most Important Institutions
Table 20 Institutions collecting transport data
No Institutions Transport data collected
1 Central Statistical Agency (CSA)
• Proportion of Rural Population within 2 km of All Season
Mode of Transport.
• Percentage of Increased Productivity in Agriculture and
Economic Activities.
• Level of Affordability of Transport cost as percent of Income
by the Urban and Rural Poor.
• Transport Constraint on Education by gender and area (rural,
Urban, Country total)
• Percentage Distribution of Households by Distance in
Kilometre to the Nearest Health Facility /Service (Rural and
Urban areas)
2 Transport Authority
• Percentage Increase in the Proportion of Modes of
Transportation in Good and Fair Condition.
• Total number of Operational Vehicles (Motorised)
3 Ethiopian Roads Authority (ERA)
• Ethiopian Road Network (Km)
• Traffic flow (VKM) for four Vehicle types
• Road Maintenance Budget and Expenditure
• Axle load
• Cost of Road Construction, Rehabilitation and Maintenance
• Annual Average Daily Traffic (AADT) by road segment
• Road Condition (Asphalt and Gravel)
• Employment opportunity, Income earned and Improvement
in skill
• Time for contract administration and payment of projects
4 Ethiopian Petroleum Supply Enterprise
• Volume, Value, Type and Origin of Oil Imported
5 Ethiopian Railway Corporation • Status of Rail Network in Addis Ababa by Route • Number of Trainees by Types of Fields

ReCAP | Scoping Study to Explore the Suitability of SDG Indicator 9.1.2 for Rural Access 74
No Institutions Transport data collected
6 Ethiopian Shipping and Logistics sector Enterprise-Shipping Sector
• Ship Travel Time one Direction (in days) • Ship Turn Around Time (in Days) • Unit Goods Transport Cost – Export
7 Office of the Road Fund
• Road Fund Allocation (Budget and Expenditure) by Class of Road for Federal, Regional (rural) and Urban Roads
• Source of Road Fund Collected • Budget Requirement and Actual Budget Allocation
8 Ethiopian Civil Aviation
• Employment opportunities and income generation • Existing Facilities at International and domestic airports • Implementation and enforcement of International
Convention in Air and Maritime Transport • List and capacity of Domestic Air transport Operators
8 Ethiopian Airlines
• Percentage Reduction in Passenger Fares (Domestic and International Routes)
• Number of New Air and Maritime Connections between Ethiopia and African Countries and Closed Routes
9 City Government of Addis Ababa Road and transport Bureau
• Passenger Fares for Mini Buses – Addis Ababa (passenger Kilometre)
10 National Plan Commission • GDP by sector (particularly Transport) 11 Ministry of Education • Access to school
12 Ethiopian Federal Police Commission
• Fatalities and Accidents
1.2 Data Collection
Table 21- Type of data Collected by the Institution
Institution* 1 2 3 4 5 6 7 8 9 10 The institution collects road based transport volume data
☐ ☐ ☒ ☐ ☐ ☐ ☐ ☐ ☐ ☐
The institution collects as well rural transport volume data
☐ ☐ ☐ ☐ ☐ ☐ ☐ ☐ ☐ ☐
The institution has a budget for data collection
☐ ☐ ☒ ☐ ☒ ☐ ☐ ☐ ☐ ☐
The institution collects data for non-motorised transport
☐ ☐ ☐ ☐ ☐ ☐ ☐ ☐ ☐ ☐
The institution collects data for water transport
☐ ☐ ☐ ☐ ☐ ☒ ☐ ☐ ☐ ☐
The institution collects data for freight transport
☐ ☒ ☐ ☐ ☐ ☒ ☐ ☐ ☐ ☐
The institution collects data for public transport
☐ ☒ ☐ ☐ ☐ ☐ ☐ ☐ ☒ ☐
* Institutions are listed in Table 20

ReCAP | Scoping Study to Explore the Suitability of SDG Indicator 9.1.2 for Rural Access 75
1.3 Key Transport Statistics
Table 22 - Key transport Statistics
Ref No
Title Institution Author Year Number Pages
1 Road Sector Development Program 21 Years Performance Assessment Ethiopian Roads Authority Ethiopian Roads Authority
2019 71
2 GTP II third year performance report (2015/16-2017/18)* Ethiopian Roads Authority Ethiopian Roads Authority
2019 112
3 2015/16 Ethiopian Household and Consumption Expenditure (HCE)** CSA CSA January 2018
272
4 Ethiopia Demographic and Health Survey (2016) ** CSA CSA July2017 549
5 Consultancy Services – for the Updating of the Road Sector Developme Program (RSDP) Performance And Sustainable Development Goals (SDGs)/Millennium Development Goals (MDGs) Transport Indicators
W.T Consult Plc. for Ethiopian Roads Authority
W.T Consult Plc. April 2019 147
6 Consultancy Services for Impact Assessment of the Universal Rural Road Access Program (URRAP): Ethiopia lot 1: Amhara, Tigray, SNNP, and Benishangul-Gummz regions (Second year follow-up report)
W.T Consult Plc. for Ethiopian Roads Authority
W.T Consult Plc. November 2017
250
7 Data on Intermediate Means of Transport (IMTs) Woreda/District Administrative Offices
Not known Annually Not known
Note:
*Amharic version of the report ** The survey reports include transport as one type data.

ReCAP | Scoping Study to Explore the Suitability of SDG Indicator 9.1.2 for Rural Access 76
2 Level of Government
Table 23 - Local Authorities
Level Description Local Denomination Number Units in Country
1 National (Federal) level Federal Government 1 2 Regional Level Regional States 9 3 City Administrations City Administration 2 4 Zone Zone 94 5 Wereda Wereda 894 6 Rural kebele (sub-wereda) Kebele (sub-District) About 15,000
3 Road Length
3.1 Functional Classification35
Table 24 - Functional Road Classification
No Class Denomination Description Source F1 Trunk roads Roads linking Addis Ababa (Capital
City) to centres of international importance and to international boundaries
F2 Link Roads Connecting centres of national and international importance such as principal towns and urban centres
F3 Main Access Roads Connecting centres of provincial importance
F4 Collector Roads Connecting locally important centres to each other or to a more important centre or to a higher class road
Woredas (Districts) (lowest level)
F5 Feeder Roads Connecting minor centres such as a market to other parts of the network
Regions
Source: ERA
35 Road Functional Classification is being prepared and the data provided for the section road length available for this level is for the year 2017/18.

ReCAP | Scoping Study to Explore the Suitability of SDG Indicator 9.1.2 for Rural Access 77
3.2 Classification according to design standards
Table 25 - Design Standards
No Denomination Description Road length available on this government level (lowest level)
D1 Low volume roads (Rural Roads)
Annual Average Daily Traffic less than 25 per annum
☐
D2 Low volume roads (Rural Roads)
Annual Average Daily Traffic between 25-75 per annum
☐
D3 Low volume roads (Rural Roads)
Annual Average Daily Traffic between 75-150 per annum
Woreda (District Offices)
D4 Low volume roads (Rural Roads)
Annual Average Daily Traffic between 150-300 per annum
Regional Rural Road Authorities
D5 High Volume roads Annual Average Daily Traffic between 300-1,000 per annum
☐
D6 High Volume roads Annual Average Daily Traffic between 1,000-3,000 per annum
☐
D7 High Volume roads Annual Average Daily Traffic between 3,000-10,000 per annum
☒
D8 High Volume roads Annual Average Daily Traffic >10,000 per annum
☒
Source: ERA

ReCAP | Scoping Study to Explore the Suitability of SDG Indicator 9.1.2 for Rural Access 78
3.3 Design Standards and traffic volumes
Table 26- Traffic Volumes included in Road design Standards
Design Standard
Average Volume
Minimum Volume
Maximum Volume
All vehicles ☐ ☐ ☐ 1 ☐ ☐ ☐ 2 ☐ ☐ ☐ 3 ☐ ☐ ☐ 4 ☒ ☒ ☒ 5 ☒ ☒ ☒ 6 ☒ ☒ ☒ 7 ☒ ☒ ☒
Source: ERA
4 Vehicle Fleet
Table 27 - Composition of Vehicle Fleet36
No Vehicle type Description 1 Automobile Carrying capacity of 4 persons 2 Bus Both >12 seats and <11 seats 3 Dry Cargo Both <=10 quintals and >10 quintals 4 Liquid Cargo Vehicles with liquid vessels for different
Purposes (like transport of fuel, water etc.) 5 Motor Bicycle Two wheel vehicles with carrying capacity of 2
persons 6 Truck 7 Three wheeler
(Bajaj) Three wheel vehicles used for public transport of short distances with a legally permitted carrying capacity of 3 persons
1 ton is equivalent to ten quintals
36 The operational Vehicle fleet data only encompasses vehicle compositions that takes the largest share for the recently available data (2017/18)

ReCAP | Scoping Study to Explore the Suitability of SDG Indicator 9.1.2 for Rural Access 79
Example1: - Operational Vehicle Fleet Registered for the Year 2018 by region and Type.37 Type of Vehicles and Number in the Regions Registration (2018)
Description AA AM AF BN DD SO TG GM HA SN OR Total Ambulance x x
Automobile Bajaj x x x x x
Tri Cycle x x x x x x x x x Bus(< 12 Seats) x x Bus(> 11 Seats)
Combiner x x x x Dozer x x x x x
Dry Cargo(<=10 Quintals) x Dry Cargo(>10 Quintals) x
Dual Purpose Vehicle x Field Vehicle x
Grader x x x x Forklift x x x x
Not Specified x x Gotach x x x x x x x
Liquid Cargo x Liquid Trailer x x x x x x x x Motor Bicycle -
Other Three wheel dry load x x x x
Three wheel public load x x x x x x x Tractor x x x Trailer x x x
Vehicle with Machinery x x x x Total
1)AA-Addis Ababa, Am-Amhara Region, Af-Afar Region, BN, Benishangul-Gumuz Region DD-Dire Dawa city Administration, GM-Gamebella, HA-Harari Region, OR-Oromia Region, SN-Southern Region, SO-Somali Region, TG-Tegray Region. 2) fleet record available 3) x - fleet record not available
Source: Federal Transport Authority

ReCAP | Scoping Study to Explore the Suitability of SDG Indicator 9.1.2 for Rural Access 80
5 Traffic Counts
Table 28 -Vehicle Counts
Year No of road sections counted
Road types included
Vehicle types counted [No in ]
Year Ref No
2013 195 1,2,3 8 2013 2014 195 1,2,3 8 2014 2015 195 1,2,3 8 2015 2016 254 1,2,3 8 2016 2017 278 1,2,3 8 2017
Table 29. Vehicle types
No Vehicle Categories Category 1 Car
Car 2 Land Rover (Four-Wheel drive) 3 Small Bus
Bus 4 Large Bus 5 Small truck
Truck 6 Medium Truck 7 Heavy Truck 8 Truck -Trailer Truck - Trailer
Source: Ethiopian Roads Authority
6 Transport Volumes
Table 30 - Existing data on transport volumes
Differentiation of data Vehicle km
Passengers transported
Passenger Km
Tonnes transported
Tonne-km
Vehicle types All vehicles ☐ ☐ ☐ ☐ ☐ Differentiation according to modes/vehicle types
☐ ☒ ☐ ☒ ☐
Road types Urban Roads ☐ ☐ ☐ ☐ ☐ Interurban Roads ☐ ☐ ☐ ☐ ☐ Rural Roads ☐ ☒ ☐ ☒ ☐ Other ☐ ☐ ☐ ☐ ☐ Road classification given in Table 2
☐ ☐ ☐ ☐ ☐

ReCAP | Scoping Study to Explore the Suitability of SDG Indicator 9.1.2 for Rural Access 81
7 Transport Modelling
Table 31 - Transport Models Available
Name of model Government Private enterprise
Other entity Quality of output
Highway Design Model (HDM) III
Ethiopian Roads Authority (ERA)
Planning and Design
Engineering Colleges
Very good
Red Model ERA Priority Ranking Rural Roads
- Good
Table 32 - Basic Transport Indicators*
Year Yes/No
Estimates of household and areal trip generation in terms of
passengers
☒
Estimates of household and areal transport volumes in terms of
passenger-km
☒
Estimates areal trip generation in terms of tonnes transported ☒
Estimates areal transport volumes in terms of ton-km ☒
Load factors in terms of passengers transported per vehicle ☒
Load factors in terms of tonnes transported per vehicle ☒
Adjustment factors used for data aggregation (hourly, daily, monthly,
AADT)
☒
Note: There is no established system and assignment of responsibility for the basic transport data. For major roads, estimates are derived to serve specific purposes without an appropriate methodology (e.g. O-D surveys). For rural areas, data that is available is from Impact Assessment of the Universal Rural Roads Access Program URRAP) and other specific studies. Sustainability is a key question. However, Impact Assessment of URRAP would be carried for another three years.

ReCAP | Scoping Study to Explore the Suitability of SDG Indicator 9.1.2 for Rural Access 82
8 References
Central Statistical Agency, Ethiopia Demographic and health Survey (DHS), 2016
Central Statistical Agency, Household income consumption and Expenditure Survey (HICE), 2016
Ethiopian Roads Authority, Introduction to Low Volume Road Design: Part A
Ethiopian Roads Authority (2013), Geometric Design Manual, 2013.
Ethiopian Transport Authority – Unpublished data
Ministry of Education,
WT Consult Plc. (2019). Consultancy Services – for the Updating of the Road Sector Development Program (RSDP) Performance and Sustainable Development Goals (SDGs)/Millennium Development Goals (MDGs) Transport Indicators, April 2019.
WT Consult Plc. (2015). Consultancy Services for Impact Assessment of the Universal Rural Road Access Program (URRAP): Ethiopia lot 1: Amhara, Tigray, SNNP, and Benishangul-Gummz regions (Baseline Report), October 2015.
WT Consult Plc. (2017) Consultancy Services for Impact Assessment of the Universal Rural Road Access Program (URRAP): Ethiopia lot 1: Amhara, Tigray, SNNP, and Benishangul-Gummz regions (Mid-term impact assessment Report), January 2017.
WT Consult Plc. (2017). Consultancy Services for Impact Assessment of the Universal Rural Road Access Program (URRAP): Ethiopia lot 1: Amhara, Tigray, SNNP, and Benishangul-Gummz regions (Second year follow-up Report), November 2017.
Webpages
https://www.ilo.org/wcmsp5/groups/public/---dgreports/---
stat/documents/genericdocument/ wcms_389373.pdf

ReCAP | Scoping Study to Explore the Suitability of SDG Indicator 9.1.2 for Rural Access 83
Scoping Study to Explore the Suitability of SDG Indicator 9.1.2 for
Rural Access Project
Reference Number: GEN2173A
Country Report
on Data Availability
Nepal
Responsible: Sunil Kumar Poudyal
e-mail: [email protected]

ReCAP | Scoping Study to Explore the Suitability of SDG Indicator 9.1.2 for Rural Access 84
1 Institutions and statistics
1.1 Most important institutions
Table 1: Institutions collecting transport data
No Institution Which transport data are collected? Collection of
SDG data 1 Department of Roads (i) Yearly traffic count at predetermined nodes
on National Highways and Feeder Roads;
(ii) Yearly traffic count at predetermined nodes on National Highways and Feeder Roads.
☒
2 Department of Local Infrastructure
Yearly updating of length of District Roads, Urban Roads and Village Roads.
☒
3 Department of Transport Management
(i) Yearly updating of number of vehicles registered at all of its 7 Provincial offices;
(ii) Number of public bus routes awarded by District Transport Committees.
☐
4 Department of Civil Aviation
(i) Yearly updating of flight permissions granted to airlines;
(ii) Number of approved flight schedules;
(iii) Number of approved charter flights.
☐
5 Nepal Police Road crashes and casualties ☐
1.2 Data collection
Table 2: Type of data collected by the institutions
Institution* 1 2 3 4 5 The institution collects road-based transport volume data
☒ ☐ ☐ ☐ ☐
The institution collects as well rural transport volume data
☐ ☒ ☐ ☐ ☐
The institution has a budget for data collection ☒ ☐ ☒ ☒ ☐ The institution collects data for non-motorised transport
☒ ☐ ☐ ☐ ☐
The institution collects data for water transport ☐ ☐ ☐ ☐ ☐ The institution collects data for freight transport ☐ ☐ ☐ ☐ ☐ The institution collects data for public transport ☐ ☐ ☒ ☐ ☐ Road crashes and casualties ☐ ☐ ☐ ☒ ☐ * Institutions are listed in Table 1

ReCAP | Scoping Study to Explore the Suitability of SDG Indicator 9.1.2 for Rural Access 85
1.3 Key transport statistics
Table 3: Key transport statistics
Ref No
Title Institution Year
1 Yearly traffic count (data for internal use) HMIS/DOR 2018 2 Number of buses assigned to different
public transport routes DOTM 2018
3 Number of registered vehicles (data for internal use)
DOTM 2018
2 Levels of government
Table 4: Local authorities
Level Description Local Denomination Number Units in
Country 1 National level Federal Government 1 2 Provincial level Provincial Government 7 3 Local Unit Local Government 753
3 Road Length
3.1 Functional classification
Table 5: Functional road classification
No Class
Denomination Description
Road length available on this
level (lowest government level,
Table 4)
Ref No
Table 3
F1 National Highway
National Highways (designated by letter H and two digits) are main arterial roads connecting East to West and North to South of the country, serving greater portion of longer distance travel, providing consistently higher level of service in terms of travel speeds, and bear the inter-community mobility.
Federal Government
1
F2 Feeder Road Feeder Roads (designated by letter F and three digits) are important roads of localised nature serving wide interests of the communities, connecting district headquarters, major economic centres, and
Federal Government
1

ReCAP | Scoping Study to Explore the Suitability of SDG Indicator 9.1.2 for Rural Access 86
No Class
Denomination Description
Road length available on this
level (lowest government level,
Table 4)
Ref No
Table 3
tourism centres to National Highways or other Feeder Roads.
F3 District Road District Roads are important roads within a district serving areas of production and markets, and connected to other District Roads, Feeder Roads or National Highways.
Provincial Government
2
F4 Urban Road Urban Roads are the roads serving within the Urban Municipalities.
Urban Municipality
2
F5 Village Road Smaller roads not falling under District Road (District Core Road Network) category are Village Roads and include Agricultural Roads.
Rural Municipality 2
3.2 Classification according to design standards
Table 6: Design standards
No Denomination Description Road
length available
Lowest government level
(Table 4)
Ref No Table 3
D1 National Highway
Design speed in km/h based on terrain: Plain: max 100 Rolling: 60, Mountainous: 50, Steep: 40
☒ Federal Government
1
D2 Feeder Road Design speed in km/h based on terrain: Plain: 60 Rolling: 50, Mountainous: max 40, Steep: max 30
☒ Federal Government
1
D3 District Road Design speed in km/h based on terrain: Plain: 50, Mountainous: 25
☒ Provincial Government
1
D4 Urban Road (Design Standards being drafted) ☒ Urban Municipality
1
D5 Village Road Design speed in km/h based on terrain: Plain: 30, Mountainous: 15
☒ Rural Municipality
1

ReCAP | Scoping Study to Explore the Suitability of SDG Indicator 9.1.2 for Rural Access 87
3.3 Design Standards and traffic volumes
Table 7: Traffic volumes included in Road Design Standards
Design Standard Average Volume
Minimum Volume
Maximum Volume
All standards ☐ ☐ ☐ D1 ☐ ☒ ☐ D2 ☐ ☒ ☐ D3 ☐ ☐ ☐ D4 ☐ ☐ ☐ D5 ☐ ☐ ☒ D6 ☐ ☐ ☐ D7 ☐ ☐ ☐
4 Vehicle Fleet
Table 8: Composition of the vehicle fleet
No Vehicle type Description Number of vehicles Year Ref No Table 3 1 Bus 40-seater and more 2,354 2018 3 2 Mini-bus/Mini-
truck for 5MT axle load 1,973 2018 3
3 Truck for 10MT axle load 12,154 2018 3 4 Car/ Jeep/ van for up to 8 passengers 10,342 2018 3 5 Pickup truck for 2~5 passengers 10,342 2018 3 6 Micro-bus for up to 14
passengers 1,934 2018 3
7 Three-wheeler for up to 10 passengers
16,209 2018 3
8 Motorcycle for up to 2 passengers 341,623 2018 3 9 tractor/ power tiller with attached cart 13,396 2018 3 10 Electrical rickshaw for up to 4 passengers 12,325 2018 3 11 Others construction
equipment 348 2018 3

ReCAP | Scoping Study to Explore the Suitability of SDG Indicator 9.1.2 for Rural Access 88
5 Traffic Counts Please list the last relevant vehicle counts. Use the numbers for road and vehicle types given above.
Table 9: Vehicle counts
Year No of road
sections counted
Road types included
[No in Table 5]
Vehicle types counted [No in Table 8]
Year Ref No Table 3
2018 160 1,2 1,2,3,4,5,6,7,8,9,10,11, NMT
2018 1
2016 160 1,2 1,2,3,4,5,6,7,8,9,10,11, NMT
2016 1
6 Transport Volumes
Table 10: Existing data on transport volumes
Differentiation of data Vehicle
km Passengers transported
Passenger Km
Tonnes transported
Tonne-km
Vehicle types All vehicles ☐ ☐ ☐ ☐ ☐ Differentiation according to modes/vehicle types
☐ ☐ ☐ ☐ ☐
Road types Urban Roads ☐ ☐ ☐ ☐ ☐ Interurban Roads ☐ ☐ ☐ ☐ ☐ Rural Roads ☐ ☐ ☐ ☐ ☐ Other ☐ ☐ ☐ ☐ ☐ Road classification as given in Table 5
☐ ☐ ☐ ☐ ☐
Tick, if data are existent

ReCAP | Scoping Study to Explore the Suitability of SDG Indicator 9.1.2 for Rural Access 89
7 Transport modelling
Table 11: Transport models available
Name of model
Government Private enterprise Other entity
Quality of output
HDM4 Department of Roads
Very good
STRADA Nippon Koei Consulting Engineers (for Department of Roads)
Very good
Accessibility Model
Abhiyan Consulting Engineers (for Department of Roads and Department of Local Infrastructure)
Very good
Table 12. Information on basic transport indicators
Year Yes/No Year, if
yes Ref No Table 3
Estimates of household and areal trip generation in terms of passengers
☒ 2018 1,2,3
Estimates of household and areal transport volumes in terms of passenger-km
☒ 2018 4
Estimates areal trip generation in terms of tonnes transported ☒ 2018 4 Estimates areal transport volumes in terms of ton-km ☒ 2018 4 Load factors in terms of passengers transported per vehicle ☒ 2018 1,2,3 Load factors in terms of tonnes transported per vehicle ☒ 2018 1,2,3 Adjustment factors used for data aggregation (hourly, daily, monthly, AADT)
☒ 2018
Other relevant: Nepal has not set any target for aerial transport.

ReCAP | Scoping Study to Explore the Suitability of SDG Indicator 9.1.2 for Rural Access 90
Scoping Study to Explore the Suitability of SDG Indicator 9.1.2 for Rural Access Project
Reference Number: GEN2173A
Country Report
on Data Availability
Tanzania
Responsible: Shedrack Willilo
e-mail: [email protected]

ReCAP | Scoping Study to Explore the Suitability of SDG Indicator 9.1.2 for Rural Access 91
1 Institutions and statistics
1.1 Most important institutions
Table 1: Institutions collecting transport data
No Institution Which transport data are collected? Collection of SDG data
1 Ministry of Works Transport & Communication
-Country Transport and Meteorology Sector Statistics
☒
2 Land Transport Regulatory Authority
-Number of registered Trucks in the county -Number of registered Public Transport in the country - Number of Road Transport Licenses Issued -Number of selected bus routes
☐
3 Tanzania Rural & Urban Roads Agency
-Information on the number of Urban Roads in the Country -Information on the number of Rural Roads in the Country -Transport Volume data on Urban and Rural roads -Traffic and Safety data on Urban and Rural Roads -Asset management data on urban and rural roads
☐
4 Tanzania Police Force-Traffic Unit
-Roads Traffic Accidents information -Road Trafficking information
☐
5 Tanzania National Roads Agency
-Number of trunk and regional roads in the country -Road Trafficking Information -Road Asset Management Information -Road networks length of Tanzania for Trunk and regional roads -Condition data on trunk and regional roads -Traffic and Safety data on Trunk and Regional Roads
☒
6 Tanzania Ports Authority -Information on Capacity Operations -Information on import and export commodities handled at ports in the country -Total Freight transported through ports -Information on transit freights -Number of Passengers transported on water ways -Traffic of Different Countries through Tanzania Ports
☐
7 Tanzania Railways Corporation
-Railways freight performance -Railways passenger traffic -Railways freight traffic - Railways Average Locomotive Availability (%) (Shunting & Mainline Locomotives) -Railways accidents Railways Domestic Freight
☐
8 Tanzania Shipping Agency Corporation
-Registered licensed shipping agencies in the country
☐

ReCAP | Scoping Study to Explore the Suitability of SDG Indicator 9.1.2 for Rural Access 92
9 Tanzania Airport Authority -Capacities of selected airports - Air trafficking -Incoming International Air Passengers -Aircraft movements
☐
10 Tanzania Bureau of Statistics - 11 Tanzania Civil Aviation
Authority -Passengers through all airports in the country--Licensed Commercial Air Services Operators -Air Transport Accidents & Incidents -Aircraft Movements at major airports
12 Roads Fund Board of Tanzania
-Roads Fund Allocation (Budget and Expenditure) - Roads Fund Collected every year from different sources -Budget Requirement and Actual Budget Allocation -Traffic counts data
13 President Office Regional Administration and Local Government
-Road Networks length of Tanzania on local government roads -Conditional on local government roads
14 Tanzania Petroleum Development Corporation
-Volume of transported Oil and Gas in the Country
15 Tanzania Metrological Agency
-Information on Annual rainfall in Tanzania -Annual Temperature - Flights served with meteorology services - Customers served with meteorology services -Gap between meteorological network requirements and current Situation in Tanzania
1.2 Data collection
Table 2: Type of data collected by the institutions
Institution 1 2 3 4 5 6 7 8 9 The institution collects road based transport volume data
☐ ☒ ☒ ☐ ☒ ☐ ☐ ☐ ☐
The institution collects as well rural transport volume data
☒ ☐ ☒ ☐ ☐ ☐ ☐ ☐ ☐
The institution has a budget for data collection ☐ ☒ ☒ ☐ ☒ ☐ ☐ ☐ ☐ The institution collects data for non-motorised transport
☐ ☒ ☒ ☐ ☒ ☐ ☐ ☐ ☐
The institution collects data for water transport
☐ ☐ ☐ ☐ ☐ ☒ ☐ ☐ ☐
The institution collects data for freight transport
☐ ☐ ☐ ☐ ☐ ☒ ☒ ☐ ☐
The institution collects data for public transport
☐ ☒ ☐ ☐ ☐ ☐ ☐ ☐ ☐
Other, please mention ☐ ☐ ☐ ☐ ☐ ☐ ☐ ☐ ☐ * Institutions are listed in Table 1

ReCAP | Scoping Study to Explore the Suitability of SDG Indicator 9.1.2 for Rural Access 93
1.3 Key transport statistics
Table 3: Key transport statistics
Ref No
Title Institution Author Year Number Pages
1 Statistical Abstract 2015 National Bureau of Statistics
National Bureau of Statistics
2014 214
2 Statistical Abstract 2015 National Bureau of Statistics
National Bureau of Statistics
2015 220
3 Tanzania Transport and Meteorology Sector Statistics
Ministry of Works Transport and Communication
Ministry of Works Transport and Communication
2016 70
4 Statistical Abstract 2016 National Bureau of Statistics
National Bureau of Statistics
2016 212
5 Improving Rural Access in Tanzania’ Traffic Count 2017
IRAT
IRAT
2017 30
6 Consultancy services for carrying out traffic count on TARURA network
Roads Fund Board M/S STET International (T) Ltd
2019 36
7 Sustainable Development Goals (SDGs) Booklet 2019
National Bureau of Statistics
National Bureau of Statistics
2019 54
5 Baseline traffic counts in Tanzania mainland and establishing a comprehensive traffic census methodology for TANROADS, 2009
Tanzania National Roads Agency (TANROADS)
Intercontinental Consultants and technocrats Pvt Ltd
2009 789
2 Levels of government
Table 4: Local authorities
Level Description Local Denomination Number Units in Country
1 National United Republic 1 2 Regional / City Council Regional / City 30 3 District Municipality District 169 4 Ward Ward 3,37 5 Street Street 3,741 6 Village Village 12,423

ReCAP | Scoping Study to Explore the Suitability of SDG Indicator 9.1.2 for Rural Access 94
3 Road Length
3.1 Functional classification
Table 5: Functional road classification
No Class Denomination
Description Road length available on this level (lowest government level, Table 4)
Ref No Table 3
F1 Trunk Roads
The primary national and international through routes that link several regions and provide access to important border posts and ports
National level
1 & 5
F2 Regional Roads
The secondary routes connecting district centres in a region or connecting another important centre to a trunk road
National level
1 & 5
F3 District
The tertiary route linking: (i) district headquarters with ward centres; (ii) important centres within the district; and (iii) important centres to a higher class road
District Level
3 & 13
F4 Urban
Within the urban centres: (i) Arterial Roads; (ii) Collector Roads; (iii) Local Collector Roads; and (iv) Access Roads.
District Level
3 & 13
F5 Feeder
The village access roads linking important centres within a ward to the rest of the network
District Level
3 & 13
F6 Community roads
Road within a village or a road which links villages District Level
3 & 13

ReCAP | Scoping Study to Explore the Suitability of SDG Indicator 9.1.2 for Rural Access 95
3.2 Classification according to design standards
Table 6: Design standards
No Denomination Description Road length available
Lowest government level (Table 4)
Ref No Table 3
D1 Low volume roads (Rural Roads)
Annual Average Daily Traffic less than 25 per annum
☒ Local Government
Level
13
D2 Low volume roads (Rural Roads)
Annual Average Daily Traffic between 25-75 per annum
☒ Local Government
Level
13
D3 Low volume roads (Rural Roads)
Annual Average Daily Traffic between 75-150 per annum
☒ Local Government
Level
13
D4 Low volume roads (Rural Roads)
Annual Average Daily Traffic between 150-300 per annum
☒ Local Government
Level
13
D5 High Volume roads
Annual Average Daily Traffic between 300-1,000 per annum
☒ District Level 1, 3, 5 & 13
D6 High Volume roads
Annual Average Daily Traffic between 1,000-3,000 per annum
☒ District Level 1, 3, 5 & 13
D7 High Volume roads
Annual Average Daily Traffic between 3,000-10,000 per annum
☒ National Level 1, 3, 5 & 13
D8 High Volume roads
Annual Average Daily Traffic >10,000 per annum
☒ National Level 1, 3, 5 & 13
3.3 Design Standards and traffic volumes
Table 7: Traffic volumes included in Road Design Standards
Design Standard
Average Volume
Minimum Volume
Maximum Volume
All standards
☐ ☐ ☐
D1 ☐ ☐ ☐ D2 ☐ ☐ ☐ D3 ☐ ☐ ☐ D4 ☒ ☒ ☒ D5 ☒ ☒ ☒ D6 ☒ ☒ ☒ D7 ☒ ☒ ☒

ReCAP | Scoping Study to Explore the Suitability of SDG Indicator 9.1.2 for Rural Access 96
4 Vehicle Fleet
Table 8: Composition of the vehicle fleet
No Vehicle type/License type
Description Number of vehicles
Year Ref No Table 3
1 A1 Buses with Passengers <=15 13576 2019 2 2 A2 Buses with Passengers 16-25 11202 2019 2 3 A3 Buses with Passengers 26-45 13322 2019 2 4 A4 Buses with Passengers 46-65 3471 2019 2 5 A5 Buses with Passengers >65 124 2019 2 6 B1 Tour buses with passengers
<=15 4484 2019 2
7 B2 Tour buses with passengers 16-25
433 2019 2
8 B3 Tour buses with passengers 26-45
282 2019 2
9 B4 Tour buses with passengers 46-65
3 2019 2
10 C1 Trucks 3-5 TONNES 4 2019 2 11 C2 Trucks 6-10 TONNES 0 2019 2 12 C3 Trucks 11-15 TONNES 0 2 13 C4 Trucks 16-20 TONNES 2 2019 2 14 C5 Trucks 21-25 TONNES 0 2019 2 15 C6 Trucks 26-30 TONNES 0 2019 2 16 C7 Trucks >30 TONNES 0 2018 2
5 Traffic Counts Please list the last relevant vehicle counts. Use the numbers for road and vehicle types given above.
Table 9: Vehicle counts
Year No of road sections counted
Road types included [No in Table 5]
Vehicle types counted [No in Table 8]
Year Ref No Table 3
2019 330 3,4,5 1,2,3,4, 5.6.7.8.9.10.11,
NMT
2019 3
2017 15 1,2,3,4,5 1,2,3,4, 5.6.7.8.9.10.11,
NMT
2017 5

ReCAP | Scoping Study to Explore the Suitability of SDG Indicator 9.1.2 for Rural Access 97
6 Transport Volumes
Table 10: Existing data on transport volumes
Differentiation of data Vehicle Km
Passengers transported
Passenger Km
Tonnes transported
Tonne-km
Vehicle types All vehicles ☒ ☒ ☒ ☐ ☐ Differentiation according to modes/vehicle types
☐ ☒ ☒ ☒ ☐
Road types Urban Roads ☒ ☒ ☒ ☐ ☐ Interurban Roads ☒ ☐ ☒ ☒ ☒ Rural Roads ☒ ☒ ☒ ☒ ☐ Other ☐ ☐ ☐ ☐ ☐ Road classification as given in Table 5
☒ ☐ ☐ ☐ ☐
7 Transport modelling
Table 11: Transport models available
Name of model Government Private enterprise
Other entity Quality of output
Highway Design and Management Model (HDM4)
Tanzania National Roads Agency
Planning and Design
Very good
Red Model Tanzania National Roads Agency
Priority Ranking Rural Roads
Good
RONET Model Road Fund Board Road works needs planning, Asset value assessment and allocation formula for roads fund
Very good

ReCAP | Scoping Study to Explore the Suitability of SDG Indicator 9.1.2 for Rural Access 98
Table 12 Information on basic transport indicators
Year Yes/No Year, if yes
Ref No Table 3
Estimates of household and areal trip generation in terms of passengers
☒ 2015 2
Estimates of household and areal transport volumes in terms of passenger-km
☒ 2015 2
Estimates areal trip generation in terms of tonnes transported ☒ 2015 1 Estimates areal transport volumes in terms of ton-km ☐ Load factors in terms of passengers transported per vehicle ☐ Load factors in terms of tonnes transported per vehicle ☐ Adjustment factors used for data aggregation (hourly, daily, monthly, AADT)
☒ 2009 5