Terms of Reference & Scope of Services Safety Audit Survey ...
SCOPE Work Package 7 Survey Report
Topic 1 Understanding national quality systems
Authors:
Melinda Pálfi and Zsuzsanna Cserjés
Assessment of survey results checked by:
Györgyi Fodor
Report reviewed by:
Júlia Pallós

SCOPE Work Package 7 Topic 1 Survey Report
Scope_Wp7_T1_Final_20151222 2
Purpose of the document
This document summarises the results of a survey that was conducted within the confines of the SCOPE Project (Strengthening Collaboration in Operating Pharmacovigilance in Europe – Joint Action of the European Commission; EC) by Work Package (WP) 7 on Topic 1, Understanding national quality systems. The survey was realised in the form of a questionnaire that was distributed to all participating member states (MS) of the SCOPE Project. Further to raw data gained from the questionnaire, an analysis and synthesis of results will be presented that led to some conclusions on challenges MSs may face and good practices they may apply. Besides discussing the present situation, areas for further investigation will be proposed in order to establish a quality toolkit and an introductory training material on the quality system of pharmacovigilance (PV) for MSs in the European Union (EU).
Anonymity and confidentiality of information collected
Information gathered from the questionnaire will only be referred to in general and will be anonymised in this report. Confidentiality of the information gained will be fully respected and any kind of association between pieces of information and a particular National Competent Authority (NCA) participating in this survey will be deleted. Unprocessed responses to the survey that may allow identification of any of the respondents will not be included.
Document Revision History
Version Revision date Summary of Changes Authors
1.0 05/06/2015 First version Melinda Pálfi
Zsuzsanna Cserjés
2.0 31/07/2015 Executive summary added
Report modified to include final deliverables as agreed by WP7 active partners
Editorial changes made to enhance quality and structure of the report
Melinda Pálfi
3.0 28/11/2015 Deletion of any annexes containing information that could compromise the anonymity of respondents and update of the text accordingly
Deletion of the Final questionnaire from the Annexes as all questions are included in the report text
Clarification of active and non-active SCOPE partners and the method of calculation of response rates. Results are adjusted accordingly
Melinda Pálfi

SCOPE Work Package 7 Topic 1 Survey Report
Scope_Wp7_T1_Final_20151222 3
Editorial changes
4.0 16/12/2015 Revision of content based on comments from active WP7 partners (UK, ES, IT, BG)
Removal of all annexes and including relevant information in text
Melinda Pálfi
Definitions and abbreviations
Terminology Description
ADR Adverse Drug Reaction
BEMA Benchmarking of European Medicines Agencies
CAPA Corrective And Preventive Actions
DHPC Direct Healthcare Professional Communication
EC European Commission
EMA European Medicines Agency
EU European Union
EV EudraVigilance
GVP Guideline on Good Pharmacovigilance Practices
HCP Healthcare Professional
ISO International Organisation for Standardisation
IT Information Technology
MAH Marketing Authorisation Holder
MS Member State
NCA National Competent Authority
PAFG Pharmacovigilance Audit Facilitation Group
PASS Post-authorisation Safety Study
PV Pharmacovigilance
PRAC Pharmacovigilance Risk Assessment Committee
PSUR Periodic Safety Update Report
SCOPE Work Package 7 Topic 1 Survey Report
Scope_Wp7_T1_Final_20151222 4
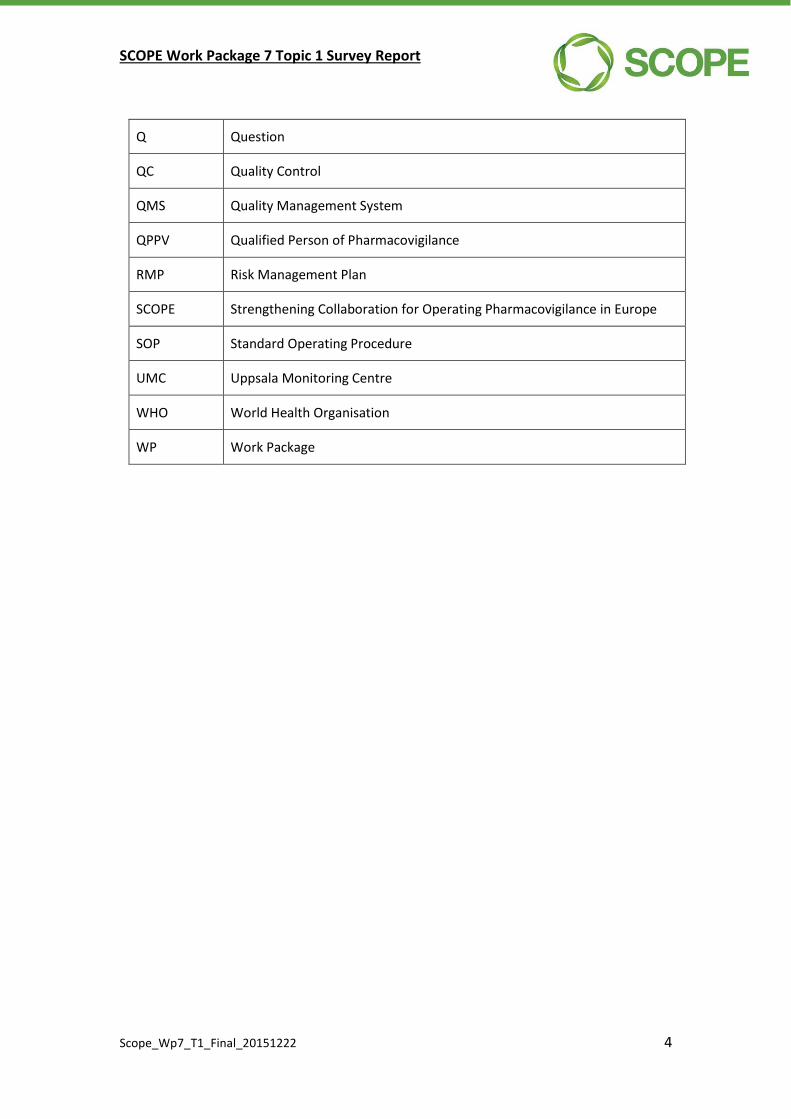
Q Question
QC Quality Control
QMS Quality Management System
QPPV Qualified Person of Pharmacovigilance
RMP Risk Management Plan
SCOPE Strengthening Collaboration for Operating Pharmacovigilance in Europe
SOP Standard Operating Procedure
UMC Uppsala Monitoring Centre
WHO World Health Organisation
WP Work Package

SCOPE Work Package 7 Topic 1 Survey Report
Scope_Wp7_T1_Final_20151222 5
Table of contents
1 Introduction ............................................................................................................... 7
1.1 Executive summary .................................................................................................... 7
1.2 Background ................................................................................................................ 7
1.3 Context and scope of report ...................................................................................... 9
1.3.1 Main goal ........................................................................................................... 9
1.3.2 Objectives .......................................................................................................... 9
1.3.3 Challenges .......................................................................................................... 9
2 Methodology ............................................................................................................ 11
2.1 Tool and survey method .......................................................................................... 11
2.1.1 Data collection methodology .......................................................................... 11
2.1.2 Preparing draft questionnaires ........................................................................ 11
2.1.3 Piloting draft questionnaires ........................................................................... 12
2.1.4 Development of final questionnaires .............................................................. 13
2.2 Setting and participants ........................................................................................... 14
2.2.1 Data capture .................................................................................................... 14
2.2.2 Information about responses .......................................................................... 14
2.2.3 Response rates of closed and open-ended questions ..................................... 16
2.2.4 Factors that contributed to the success of the project ................................... 16
2.2.5 Factors that limited the success of the survey ................................................ 17
2.3 Data analysis (quantitative and qualitative) ............................................................ 17
2.3.1 Methodology and display of results ................................................................ 17
2.3.2 Challenges in data interpretation .................................................................... 18
2.3.3 Definition of criteria for inclusion of topics for further investigation ............. 19
3 Findings/Results ....................................................................................................... 20
3.1 Quality standards and a systematic approach to quality management (Q1-Q6) .... 20
3.2 Quality management approach of pharmacovigilance (Q7-Q9) .............................. 23
3.3 Quality planning and definition of quality objectives (Q10-Q15) ............................ 26
3.4 Written procedures (Q16-Q19) ................................................................................ 32
3.5 IT systems – Document management and structured storage of data (Q20-Q26) . 34
3.6 Workflow tracking and compliance management (Q27-Q34) ................................. 41
3.7 Quality standards of assessment of pharmacovigilance data and scientific decision making (Q35-Q40) .................................................................................................... 49
3.8 Impact analysis and continuous improvement (Q41-Q43) ...................................... 52
3.9 Stakeholder feedback (Q44-Q47) ............................................................................ 58
SCOPE Work Package 7 Topic 1 Survey Report
Scope_Wp7_T1_Final_20151222 6
3.10 Overall evaluation of the quality system of pharmacovigilance at the National Competent Authority (Q48-Q49) ............................................................................. 61
4 Discussion of the results .......................................................................................... 64
4.1 Brief background on pharmacovigilance quality management in the EU ............... 64
4.2 Interpretation of survey results and identification of areas of further investigation/development as regards the deliverables of WP7, Topic 1 ............... 65
4.2.1 Quality standards and a systematic approach to quality management (Q1-Q6)
......................................................................................................................... 65
4.2.2 Quality management approach of pharmacovigilance (Q7-Q9) ..................... 67
4.2.3 Quality planning and definition of quality objectives (Q10-Q15) ................... 68
4.2.4 Written procedures (Q16-Q19) ....................................................................... 70
4.2.5 IT systems – Document management and structured storage of data
(Q20-Q26) ........................................................................................................ 71
4.2.6 Workflow tracking and compliance management (Q27-Q34) ........................ 73
4.2.7 Quality standards of assessment of pharmacovigilance data and scientific
decision making (Q35-Q40) ............................................................................. 76
4.2.8 Impact analysis and continuous improvement (Q41-Q43) ............................. 77
4.2.9 Stakeholder feedback (Q44-Q47) .................................................................... 78
4.2.10 Overall evaluation of the quality system of pharmacovigilance at the National
Competent Authority (Q48-Q49) ..................................................................... 79
4.3 Aims reached............................................................................................................ 81
4.4 Challenges faced/lessons learned ............................................................................ 81
5 Closing remarks ........................................................................................................ 83
6 Proposed deliverables .............................................................................................. 84

SCOPE Work Package 7 Topic 1 Survey Report
Scope_Wp7_T1_Final_20151222 7
1 Introduction
1.1 Executive summary
This document summarises the results of a survey that was conducted within the confines of the SCOPE Project by WP7 on Topic 1, Understanding national quality systems. In the SCOPE Project, WP7 is responsible for quality management of PV.
Main goal of the survey was to gather information on the practices of participating EU MSs concerning the extent and way of quality management principles introduced in everyday PV activities and operation of the national PV system, as required by the EU legislation. The survey was focusing on selected areas of quality management, based on experience gathered during site visits at a sample of EU NCAs and as agreed by the active participants of WP7 during a pilot phase.
The main objective of the survey was to gather information on PV quality systems operated by NCAs in order to identify areas that:
Are challenging for certain MSs and solutions to tackle the situation are welcome;
Require further clarification, harmonisation or guidance;
Are managed successfully and can be shared as good examples / practice for other MSs.
The survey was realised by an online survey tool, in the form of a questionnaire. Twenty-nine EU MSs (27 active SCOPE partners and 2 non-active ones) were invited to participate in the survey, and responses were obtained from 26 (25 active SCOPE partners and 1 non-active) of them.
Analysis of responses provided insight into the quality management practices of EU MSs and allowed the WP7 team to learn more about the challenges MSs are facing and good practices agencies are using to operate their PV quality systems.
Results of the survey have been translated to a proposal for specific items of the deliverables of WP7, i.e. a practical quality toolkit including tools, case studies, templates and guidance from selected areas of quality management applicable to PV activities, and a training material offered to induct new PV staff at NCAs to basic quality management principles supported by examples from PV.
1.2 Background
NCAs in the EU are obliged to maintain a national PV system in order to continuously monitor the benefit-risk balance of all medicinal products authorised in their territory. PV systems need to be operated on the basis of a stable, yet flexible quality system that enables robust and timely decision making and compliance with national and EU legislation. Nevertheless, NCAs may reside at varying degrees of maturity as regards their PV systems with diverse resources available both in quality and quantity that

SCOPE Work Package 7 Topic 1 Survey Report
Scope_Wp7_T1_Final_20151222 8
requires distinct strategies for further development. Still, improvement and maintenance of national quality systems needs to be guided by common principles, ensuring that the interpretation and understanding of the EU law is uniform and priorities in PV are unequivocal for all NCAs.
The legal requirement for quality systems was introduced by Directive 2010/84/EU and Regulation (EU) No 1235/2010 to strengthen PV in the EU. The minimum requirements of these quality systems are set out in the EC Implementing Regulation (EU) No 520/2012.
While there has to be compliance with legal requirements, the implementation of a quality system should be adapted to the respective organisation. Guideline on Good Pharmacovigilance Practices (GVP) Module I provides guidance on minimum quality requirements for stakeholders for which the Pharmacovigilance Audit Facilitation Group (PAFG) compiled a check-list for audit purposes.
In the SCOPE Project, WP7 is responsible for the area of quality management of PV. This WP accommodates 3 topics. The focus of Topic 1 is to gather knowledge on and understand the functioning of national quality systems at various degrees of maturity across the EU in order to share experience and good practices MSs have already been using and provide practical solutions for a number of challenges MSs are facing in quality management of PV.
As a result of data gathering exercises, analysis and synthesis of information, WP7 will develop joint deliverables for the 3 topics including an introductory training material on quality management for PV staff and a practical toolkit as a diverse collection of case studies presenting good practices from MSs, practical guidance documents, templates and specific tools to share expertise already cumulated across the EU.
Topic 1 of WP7 uses a variety of information sources to learn more about the operation of PV quality systems at NCAs.
The first data gathering exercise of WP7 – a cross-sectional survey – was performed in the course of May-June 2014 when a sample of NCAs had been visited. Information sought during site visits focused on how a PV quality system was run in practice at NCAs with different resources and maturity. Information shared during site visits served as a basis for a comprehensive questionnaire on the quality management practices of MSs focusing on the general structure and functioning of the Quality Management System (QMS) and that of PV, resource management and interface of PV assessors with PV inspectors.
The purpose of this report is to present the data collected by the survey on Topic 1 of WP7 and based on the results of the survey and the site visits to propose items for further elaboration for the two deliverables of WP7, the training material and the quality toolkit.

SCOPE Work Package 7 Topic 1 Survey Report
Scope_Wp7_T1_Final_20151222 9
1.3 Context and scope of report
This survey has been conducted in the frame of the SCOPE Project, a joint action in the area of PV, sponsored partially by the EC and the regulatory drug agencies across the EU. SCOPE aims at an EU wide collaboration among NCAs to share experience and effort in order to provide tools and guidance to maximise the effectiveness of regulatory activities in the network and in each MS regarding PV. As a consequence, SCOPE aims at strengthening and improving the protection of public health all across the EU. SCOPE is a voluntary initiative, with most but not all NCAs participating.1
This report has been prepared for the active participants of WP7 in order to summarise and analyse information obtained from the survey to contribute to the final deliverables of WP7. As such, it is primarily intended for NCA use; however, the report is publicly available for any interested parties.
1.3.1 Main goal
Main goal of the survey was to gather information on the practices of participating MSs concerning the extent and way of quality management principles introduced in everyday PV activities and operation of the national PV system, as required by the EU PV legislation. The survey was focusing on selected areas of quality management considered the most important, based on experience gathered during the site visits and as agreed by the active participants of WP7.
1.3.2 Objectives
The main objective of the survey was to gather information on PV quality systems operated by NCAs in order to identify areas that:
Are challenging for certain MSs and solutions to tackle the situation are welcome;
Require further clarification, harmonisation or guidance;
Are managed successfully and can be shared as good examples / practice for other MSs.
Information obtained from the survey will serve as a starting point for assembling the items of the deliverables for WP7, i.e. the quality toolkit and the training material.
1.3.3 Challenges
It was acknowledged by active participants of WP7 that a considerable amount of work had already been conducted via various forums (e.g. PAFG and BEMA) to bring quality management principles closer to PV. Additionally, other work packages of the SCOPE project were collecting information via questionnaires simultaneously with WP7 on
1 http://www.scopejointaction.eu/ downloaded: [2015/05/29]
SCOPE Work Package 7 Topic 1 Survey Report
Scope_Wp7_T1_Final_20151222 10
various topics increasing the burden of MSs by awaiting responses for hundreds of questions.
Active participants of WP7 paid specific attention not to duplicate the work already done, to accommodate data gathering exercises and the deliverables smoothly to the work of international bodies and keep the burden of NCAs as low as possible by selecting the most relevant subtopics and a reasonable amount of questions requiring reasonable time to respond to.
It should be emphasised that the informal information gathering on quality management practices was not intended to be an audit. Data would be handled confidentially and would not be disclosed in a way that associations to any of the NCAs were recognisable without the prior consent of the NCA.
Methodological challenges faced will be detailed elsewhere in this report.

SCOPE Work Package 7 Topic 1 Survey Report
Scope_Wp7_T1_Final_20151222 11
2 Methodology
2.1 Tool and survey method
WP7 team used questionnaires to get information from NCAs of MSs on the topics investigated.
A questionnaire, as a tool for collecting information, has advantages over other methods, like interviews:
Responses of questions are gathered in a standardized way;
They allow information to be collected quickly (via an online survey tool);
Information can be collected from a large portion of the target group (NCAs of EU MSs).
The following three questionnaires were developed in the frame of SCOPE WP7:
1. Quality Management Systems - General (49 questions)
2. Quality Management Systems - Resource management (28 questions)
3. Quality Management Systems - Pharmacovigilance inspections (27 questions)
2.1.1 Data collection methodology
In first step of the development phase, objectives and types of information to be collected for each questionnaire were defined and identified. Next, all possible questions were collected using brainstorming sessions with SCOPE WP7 team members. These collections were considered as source data for the three planned questionnaires.
2.1.2 Preparing draft questionnaires
In second step of the development phase the proposed questions were restructured using the following principles:
Keep questions as simple as possible;
Avoid ambiguous, leading questions or those asking two questions in one;
Avoid questions on overly sensitive topics in order to get accurate responses;
Limit the number of questions to those absolutely necessary so that questionnaires were not too long, but still able to fulfil their purpose.

SCOPE Work Package 7 Topic 1 Survey Report
Scope_Wp7_T1_Final_20151222 12
All the three questionnaires contained closed2 and open-ended3 (free text) questions. Closed and open-ended questions are appropriate in different context and provide different information. Closed questions should be used where alternative replies are known, limited in number and clear-cut. Open-ended questions are used where the issue is complex, where relevant dimensions are not known and where the process/issue is being explored.
The main advantage of closed questions is that they are less time consuming for a respondent to complete, and avoid misinterpretation. The main disadvantage of closed questions is that they may mislead if poorly designed.
The main advantage of open questions is their flexibility; however, the respondent may require more thought and time to answer.
As such, the three WP7 questionnaires primarily contained closed questions (type of Yes/No, Yes/No/Partially, single and multiple choice and rating scales). Nevertheless, to get as much information as possible from MSs and not to limit response options unnecessarily, an ‘Other’ option in closed questions was generally included to allow for additional information and for NCAs to provide context to their answer in case the selectable options were not appropriate. Furthermore, closed questions with a ‘Yes’ option were frequently accompanied by a gentle request to provide more details in free text to reduce misinterpretation and maintain short, to-the-point, flexible questions. Evidently, by giving respondents the option to fine tune their responses, questions became kind of transitions between open and closed. Nevertheless, it has not been evaluated whether adding these options carried any excess gain in the level of granularity of responses.
2.1.3 Piloting draft questionnaires
In the third step of the development all three questionnaires were tested using a PILOT trial, in order to avoid problems mentioned above and improve global quality.
Qualification of a questionnaire involves establishing that the questionnaire as a “measuring instrument” delivers data that are reliable and true. Testing a questionnaire prior to use is strongly advised following five general criteria:4
Purpose: One has to be absolutely clear about the purpose.
Directness: The questionnaire should ask questions that address as directly as possible the issue wished to be evaluated.
2Closed or closed-ended question with ranked answers: Questions in which all possible answers are identified and the respondent is asked to choose one or more of the answers.
3Open or open-ended question: Questions that allow the respondent to answer in any way they wish.
4M. Bloom and J. Fischer (1982) Evaluating practice: Guidelines for accountable professional, Englewood-Cliffs, Prentice–Hall, pp. 45-69, First Ed.
SCOPE Work Package 7 Topic 1 Survey Report
Scope_Wp7_T1_Final_20151222 13
Utility: This criterion relates to the practicalities of implementing and using the questionnaire.
Reliability (repeatability):
A questionnaire is reliable if similar results would be obtained by others using the same questions and using the same sampling criteria.
Validity: A questionnaire is valid if it actually measures what it sets out to measure. Validity much depends on the quality of questions themselves. Validity is not an absolute quality. A questionnaire can be valid to a certain degree in certain circumstances, and developers must decide (a priori) what degree of validity is considered sufficient.5
Testing reliability was not applicable by the PILOT trial as all members of the target group (NCAs of MSs) were involved in the WP7 surveys.
Regarding the validity of questionnaires the main purpose of the PILOT trial was to improve the content and linguistic validity of the three WP7 questionnaires. These two kinds of validity have an impact on internal validity of the questionnaire (a subject will respond to similar questions in a similar way). They also affect the likelihood of producing false positive or negative answers.
Nine MSs (BG, CZ, ES, HR, HU, IT, LT, PT, UK) were invited in the testing phase of the development including NCAs participating in WP7 and agencies involved in other work packages (PILOT trial). They were asked to complete all three questionnaires via the online survey tool and asked to give feedback via e-mail (comments and suggestions for modifications). Six complete responses to the questionnaires of Topic 1 were received. All comments and proposed modifications received by e-mail were analysed by the WP7 team and modifications/changes to the questionnaires were made.
2.1.4 Development of final questionnaires
As a result of this PILOT trial final versions of the three questionnaires were produced by 22 January 2015 through online survey tools.
In the final step of the development phase an introduction text was added to each questionnaire in order to support respondents. These texts described the purpose of the questionnaire together with simple instructions on how to complete them, the deadline of responding/completing and a note of thanks to respondents for completing.
5K. Howard (2008) Validating questionnaires, Kestrel Consultants, Inc.
SCOPE Work Package 7 Topic 1 Survey Report
Scope_Wp7_T1_Final_20151222 14
2.2 Setting and participants
2.2.1 Data capture
A single contact person was identified with his/her e-mail address for each NCA. Only one response was accepted from each NCA via SurveyMonkey.
Twenty-nine invitation e-mails were sent from SurveyMonkey to contact persons on 23-24 January 2015. Twenty-seven of those invites were sent to active SCOPE partners with two invites sent to non-active ones.
The questionnaires were also sent to the contact persons in pdf format by e-mails in order to discuss/delegate certain groups of questions with/to suitable person(s) within or outside a given NCA.
A one month period was left for respondents to complete the questionnaires. The deadline was set at 25 February 2015. Two reminder e-mails were sent to all contact persons on 16 and 23 February 2015. Requests were received from some NCAs via e-mails to modify the deadline of completing questionnaires (reasons included change of contact person). Therefore, the deadline was extended twice in order to collect as much information as possible. The second and third (final) deadlines were set at 15 March 2015 and 15 April 2015, respectively.
2.2.2 Information about responses
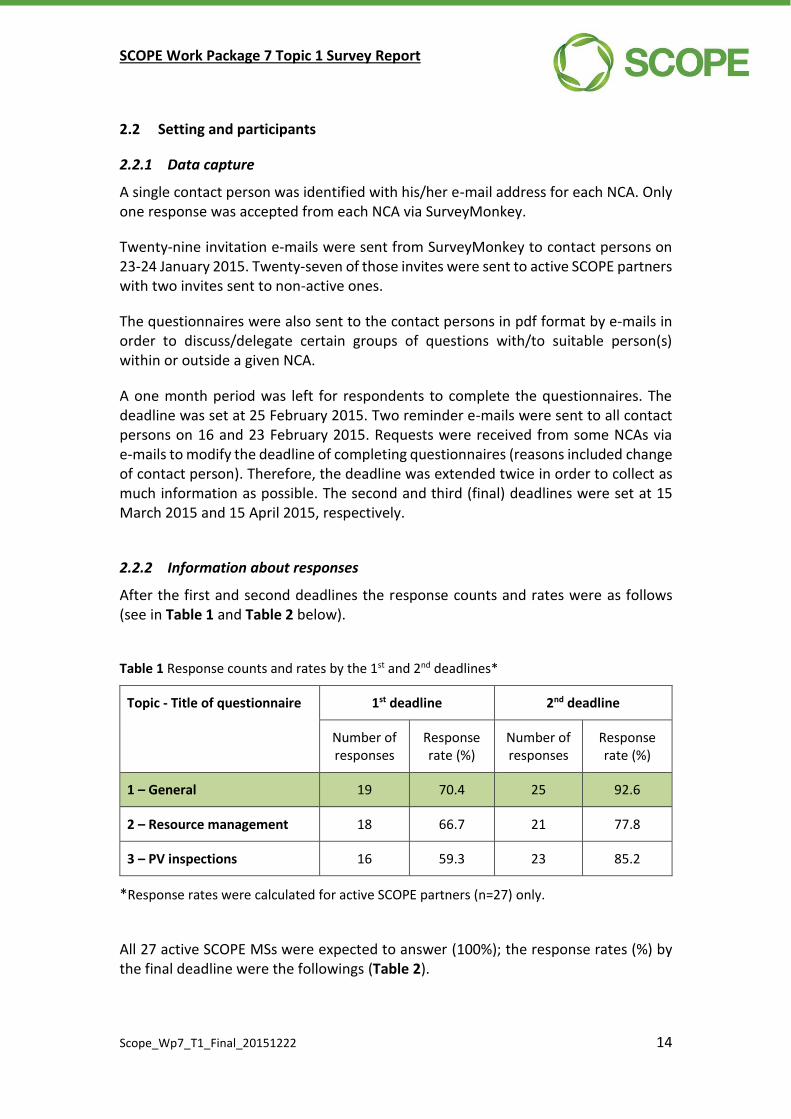
After the first and second deadlines the response counts and rates were as follows (see in Table 1 and Table 2 below).
Table 1 Response counts and rates by the 1st and 2nd deadlines*
Topic - Title of questionnaire 1st deadline 2nd deadline
Number of responses
Response rate (%)
Number of responses
Response rate (%)
1 – General 19 70.4 25 92.6
2 – Resource management 18 66.7 21 77.8
3 – PV inspections 16 59.3 23 85.2
*Response rates were calculated for active SCOPE partners (n=27) only.
All 27 active SCOPE MSs were expected to answer (100%); the response rates (%) by the final deadline were the followings (Table 2).

SCOPE Work Package 7 Topic 1 Survey Report
Scope_Wp7_T1_Final_20151222 15
Table 2 Response counts and rates by the final deadline
Topic - Title of questionnaire
Response count from 27 active
SCOPE partners
Response count from 2 non-active
SCOPE partners
Response count from all partners
Response rate (%)*
1 – General 25 1** 26 92.6
2 – Resource management
26 0 26 96.3
3 – PV inspections 26 1** 27 96.3
*Response rates were calculated for active SCOPE partners (n=27) only.
**Although Topic 1 had a total of 26 and Topic 3 of 27 responses, there were only 25 and 26 responses from active SCOPE partners, respectively, with 1 additional response from a non-SCOPE partner (Lichtenstein) in both cases. The additional response from a non-SCOPE partner is included in the survey discussions, but not in the response rate calculations, as this was not an anticipated respondent.
The trend of responses justified the extension of deadlines given the high response rates and allowed a large amount of information to be gathered by the final deadline. Figure 1 summarises these findings graphically.
Figure 1 Trend of responses with starting dates and deadlines of responding. Far left, red dotted line = start date, with the following three grey lines = 1st, 2nd and 3rd deadlines, respectively.

SCOPE Work Package 7 Topic 1 Survey Report
Scope_Wp7_T1_Final_20151222 16
The list of MSs who took part in the survey is displayed in Table 3.
Table 3 List of MSs who took part in the survey of WP7 Topic 1
Austria Finland Lichtenstein Romania
Belgium France Lithuania Slovakia
Bulgaria Greece Malta Slovenia
Croatia Hungary Netherlands Sweden
Czech Republic Ireland Norway UK
Denmark Italy Poland
Estonia Latvia Portugal
2.2.3 Response rates of closed and open-ended questions
Closed questions were mandatory to complete, but open-ended ones were not. Thus, the response rates were 100% regarding the closed questions but considerably less for open-ended. For example, the last two open questions (#48 and #49) in the Topic 1 questionnaire were completed by only 16 and 14 respondent, respectively. Nevertheless, success of the questionnaire was not judged on the rate of response to each question, as there were several questions linked and required a positive response for a lead question; NCAs responding negatively to the lead question were therefore expected to skip the remaining associated ones. Furthermore, response rates of mixed (open and closed) questions were difficult to assess. Finally, responding to a question did not imply that the response given was relevant to the question. Several examples were found where MSs indicated ‘Not applicable (NA)’ or ‘No’ instead of simply leaving the response blank.
2.2.4 Factors that contributed to the success of the project
One important factor that contributed to the success of the WP7 surveys was the high response rate across the three questionnaires. Another is the careful preparatory work together with a pilot phase allowing the exclusion of ambiguous questions. A third factor may be that with the mixture of closed and open questions allowed MSs to add items to lists most relevant to their situation, and thus give detailed explanations.
SCOPE Work Package 7 Topic 1 Survey Report
Scope_Wp7_T1_Final_20151222 17
2.2.5 Factors that limited the success of the survey
Overall the survey reached its intended objectives. Nevertheless, there could have been improvements, if some of the limitation had been eliminated or addressed.
Using too many free text questions may be risky, as the willingness of respondents to give detailed responses cannot be predicted, i.e. the level of granularity of responses cannot be communicated to respondents. More active contributions from respondents and more detailed explanations on potential good practices and examples were expected. Furthermore, free-text questions were skipped by a considerable amount of respondents (probably as they were defined as ‘not mandatory’).
Additionally, it was hard to control the content of free text answers, and keep respondents linked to the issue in question. Interpretation of responses may also be difficult, in particular when responses are brief. In order to overcome challenges, a consistent approach in data analysis was developed and is presented in the next section. Furthermore, when responses were ambiguous but essential to record, respondent NCA could be contacted to clarify answers.
2.3 Data analysis (quantitative and qualitative)
2.3.1 Methodology and display of results
SurveyMonkey was used for the WP7 questionnaires that has inbuilt plotting capabilities. However, for all of the analyses in this report, questionnaire responses were exported into excel, and downstream data processing performed here.
Files were extracted from SurveyMonkey with the responses of each NCAs, as identification of NCAs and linking them to their answers were necessary for assessors to have a deeper understanding and to present and discuss data in the most comprehensive way. Nevertheless, as already stated, data are presented and discussed in an anonymised way.
Data obtained from the questionnaire of WP7, Topic 1 has been analysed by 2 assessors independently to ensure an unbiased assessment and presentation of data, paying special attention to free text questions and questions where answers required adjustments (detailed later on). When assessors were not in agreement, issues were discussed. Both assessors had a background in PV with some knowledge of quality management for a better understanding and interpretation of responses. Assessors were cautious not to add any further meaning to any of the responses.
Closed questions
Basic statistics were used to evaluate the closed questions.
SCOPE Work Package 7 Topic 1 Survey Report
Scope_Wp7_T1_Final_20151222 18
Open-ended questions
There are many methods for evaluating open-ended (free text) questions, e.g. to extract important keywords and visualise relationship among sentences6 or to summarise results using hierarchical classification7.
Our approach to assessment of free text responses used the following principles:
Responses that were considered equivalent to leaving the question blank (i.e. responses of ‘-‘, ‘No’, ‘Not applicable’, No comments’, etc.) were excluded;
Content of responses were analysed by searching for keywords relevant to the question;
Responses that, based on content analysis, did not add any relevant information to the question were excluded;
Relevant information from responses were summarised and presented arbitrarily by assessors to the best of their knowledge. The cross-checking of assessor interpretations were performed in all cases.
Questions where free text responses are summarised are marked by an asterisk (*).
Mixed closed and open ended questions
Both approaches were applied as for open and closed questions. It was specific to mixed questions that they usually contained an ‘Other’ option, to add arbitrarily items to a list by the respondent NCAs. In these questions, ‘Other’ category was checked against the options provided in the closed part of the responses. It was not uncommon that responses in the ‘Other’ category could be reclassified to any of the predefined responses. If so, the assessors performed this reclassification. Questions with such reallocated responses have been marked by 2 asterisks (**).
2.3.2 Challenges in data interpretation
Assessors encountered a number of challenges while analysing the data including the following examples:
Concise, list-like responses or keywords were hard to interpret by assessors not familiar with the internal procedures of a given MS;
Analysis of a response where the question had been misinterpreted by the respondent;
6Y. Uchida et al. (2009) Extraction of important keywords in free text of questionnaire data and visualization of relationship among sentences, FUZZ-IEEE, pp. 1604-8.
7M. Garcia-Constantino, F. Coenen, PJ. Noble and A. Radford. (2012) Questionnaire free text summarisation using hierarchical classification. Research and Development in Intelligent Systems XXIX, Springer London. pp35-48
SCOPE Work Package 7 Topic 1 Survey Report
Scope_Wp7_T1_Final_20151222 19
Response was uninterpretable for the assessor.
Usually, such responses were rejected or included only to a limited extent in the analysis.
Furthermore, some questions might be interpreted only in context with other types of information that might or might not be available for the assessors. This was partially overcome by checking MSs’ responses to the WP1 general survey8 or other available sources.
2.3.3 Definition of criteria for inclusion of topics for further investigation
In line with Section 1.3.2 (objectives of the questionnaire), data obtained from the survey has been screened and analysed to identify any areas and information that could potentially be included in any of the three categories listed as objectives; i.e. good examples and practices, challenges and lack of unified understanding of quality concepts requiring further clarification and guidance.
No specific inclusion criteria were defined, to avoid loss of information by setting up unnecessary limitations. A higher weighting was allocated to the interpretation of questions where multiple MSs provided the same response. These were flagged for inclusion in the proposals for further investigation.
8Work Package 1 (Project Coordination) survey was conducted to ask general operational questions from NCAs participating in SCOPE. Results from this survey will not be published.
SCOPE Work Package 7 Topic 1 Survey Report
Scope_Wp7_T1_Final_20151222 20
3 Findings/Results
In this section data obtained from the survey is presented in subsections corresponding to that of the questionnaire.
3.1 Quality standards and a systematic approach to quality management (Q1-Q6)
In the first part of the survey that included Question (Q) 1 to Q6, MSs were asked whether they had obtained any certification according to a quality standard and on its potential impact on the implementation of the extended requirements of the new PV legislation. MSs were also asked to list and detail any organised activities further to a certification process that helped them assess and implement the new requirements to establish or adapt their PV quality systems.
Q1 Is your Agency accredited by any quality standard (e.g. ISO) for pharmacovigilance processes?
Answer Options (single choice) Response Percent Response Count
Yes 42.3% 11
No 57.7% 15
answered question 26
skipped question 0
Eleven NCAs (42.3%) indicated that their organisation was certified according to a quality standard.
Q2 Which quality standard?
Answer Options Response
Count
Free text 11
answered question 11
skipped question 15
Ten agencies are certified by ISO (International Organisation for Standardisation) 9001:2008. One MS indicated that its NCA was certified by ISO 17020. One NCA is certified by both ISO 9001:2008 (for the medicines agency) and ISO 17020 (for inspections) and another agency is certified by ISO 27001 besides ISO 9001:2008 (Table 4).
For a better understanding, ISO certifications referred to by MSs in responses to Q2 cover the following areas:
ISO 9001:2008 Quality management systems – Requirements

SCOPE Work Package 7 Topic 1 Survey Report
Scope_Wp7_T1_Final_20151222 21
ISO 17020:2012 Conformity assessment – Requirements for the operation of various types of bodies performing inspection
ISO 27001:2013 Information technology – Security techniques -- Information security management systems – Requirements
Table 4 Types of quality standards at certified NCAs
Answers No. of NCAs
ISO 9001:2008 10
ISO 17020 2
ISO 27001 1
Q3 When was accreditation received?
Answer Options Response
Count
Free text 11
answered question 11
skipped question 15
Most of the NCAs received their certification at the end of the 2000s and beginning of the 2010s. One NCA provided the date of last full certification which may not coincide with the date of first certification. Seven NCAs had had the ISO 9001:2008 quality standard formally implemented when the new PV legislation came into effect in July 2012.
Q4 Has the accreditation been helpful in the implementation of the extended requirements of the legislation concerning quality management of national pharmacovigilance systems?
Answer Options (single choice) Response Percent Response Count
Yes 90.9% 10
No 9.1% 1
answered question 11
skipped question 15
Ten NCAs (90.9%) in possession of an ISO certificate responded that the certification process was of help when implementing the extended requirements of the new PV legislation. Reasons for the relative ease of implementation were provided in Q5. The MS giving the negative answer did not have an ISO 9001:2008 certificate, rather an ISO 17020 certificate which provides guidance for the conduct of inspections, not quality management in general.

SCOPE Work Package 7 Topic 1 Survey Report
Scope_Wp7_T1_Final_20151222 22
Q5*9 How has it helped comply with implementing the pharmacovigilance legislation?
Answer Options Response Count
Free text 10
answered question 10
skipped question 16
MSs outlined that requirements of the new PV legislation as regards quality management were very similar to that of ISO 9001:2008. Therefore, all basic quality management requirements had already been in place when the new legislation came into force. Therefore, review and adjustment of procedures to the new requirements required a smaller effort than would have been required without prior implementation of relevant ISO principles.
Q6* Has any organised internal or external activity been helpful in the implementation of the extended requirements of the legislation concerning quality management of national pharmacovigilance systems? (E.g. internal working groups, audits, BEMA visits, etc.)
Answer Options (Single choice) Response Percent Response Count
Yes 92.3% 24
No 7.7% 2
If Yes is marked, please describe the activity and its value in the implementation of quality requirements of pharmacovigilance at your National Competent Authority: Free text
23
answered question 26
skipped question 0
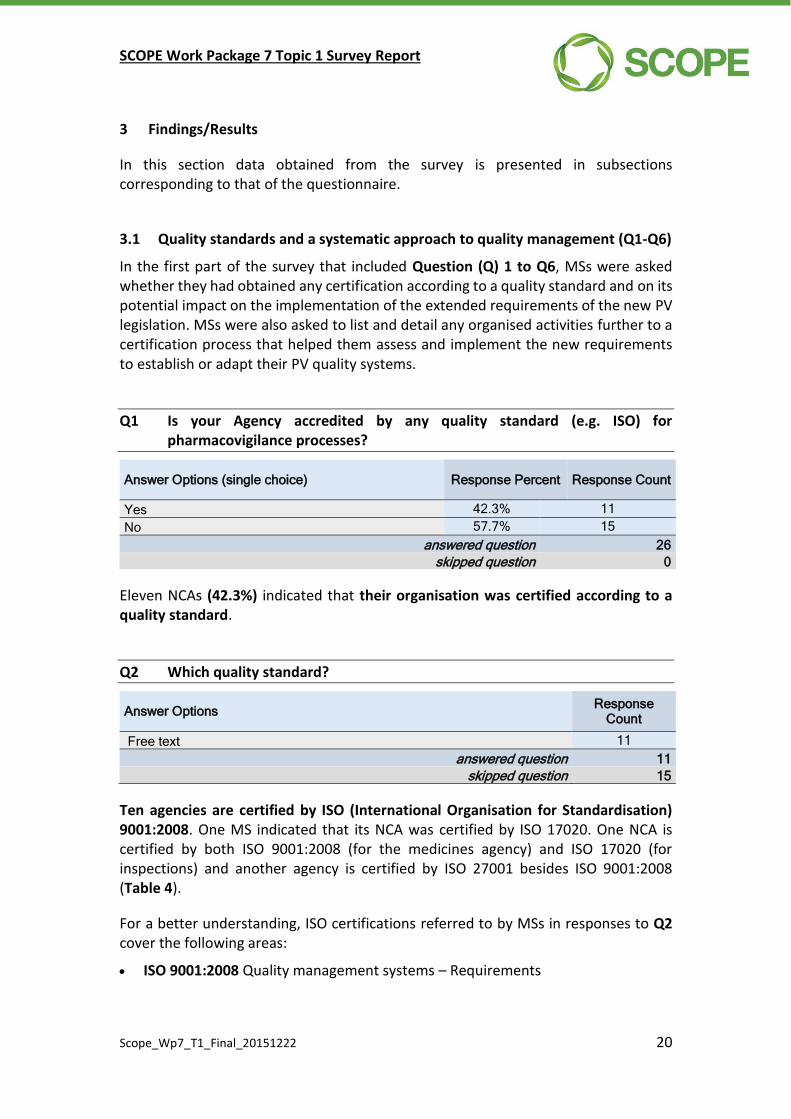
Two MSs responded that no other external or internal activity (other than potential existing ISO certification) was useful to prepare for and implement the requirements of the new PV legislation. However, majority of MSs (92.3%) undertook a variety of actions to prepare for the implementation of the changes in the legislation relying on both internal and external organizations, resources.
Relevant responses of MSs extracted from the free text fields are summarised in Table 5 and Figure 2 displaying the number and percentage of NCA responses in each category, respectively.
The most useful external activity was considered to be the third round of BEMA visits followed by internal audits.
9In questions marked with an asterisk relevant information has been extracted from free text responses and summarised.
SCOPE Work Package 7 Topic 1 Survey Report
Scope_Wp7_T1_Final_20151222 23
Table 5 Organised internal and external activities considered useful by NCAs to implement the extended requirements of the new PV legislation
Answers No. of NCAs
Preparation for BEMA visit 18
Internal audits 15
Gap analysis in internal working groups, projects 5
ISO principles implemented without applying for a certification 3
Checklists of PAFG 2
Quality Management Unit established 1
Communication with interested parties 1
Risk management system implemented 1
Seminars 1
Electronic QMS 1
Heads of Medicines Agencies checklist 1
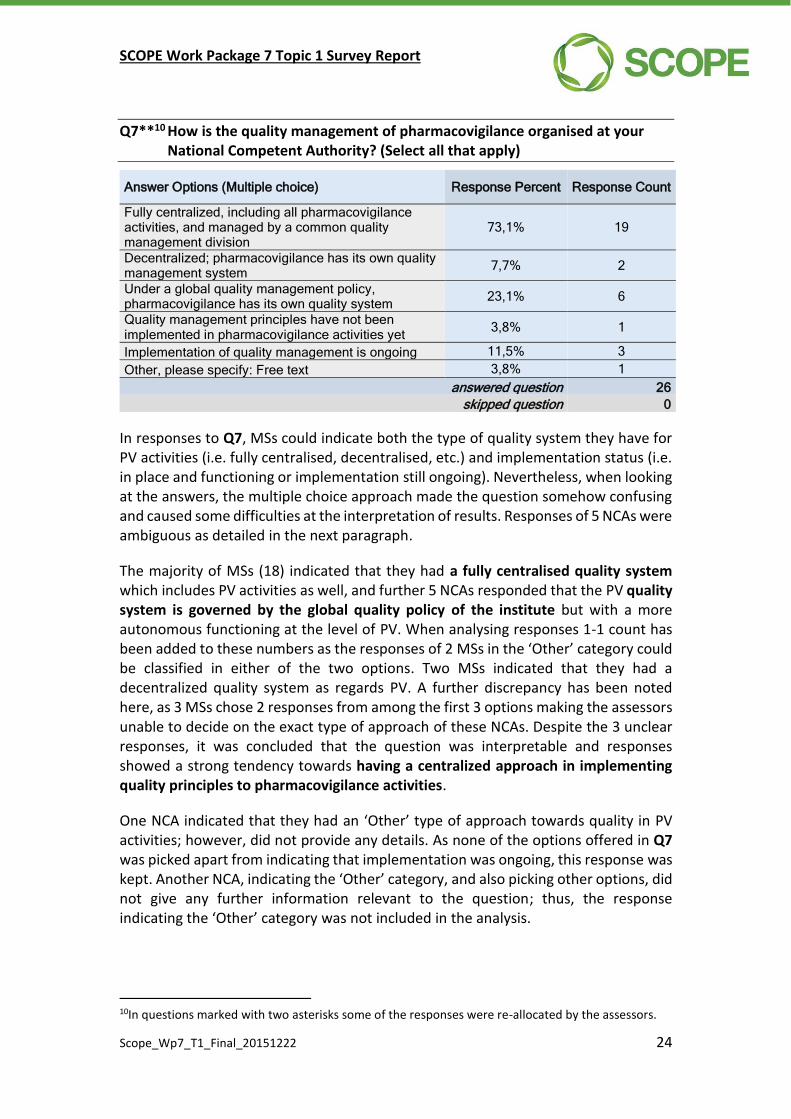
Figure 2 Organised activities considered useful by at least 2 NCAs to implement the extended requirements of the new PV legislation
3.2 Quality management approach of pharmacovigilance (Q7-Q9)
In this section of the survey from Q7 to Q9, MSs were asked to provide information on the extent to which PV activities were covered by the institutional or other QMS and the approach to quality management.
78.3%
65.2%
21.7%
13.0%
8.7%
0.0% 10.0% 20.0% 30.0% 40.0% 50.0% 60.0% 70.0% 80.0%
Preparation for BEMA visit
Internal audits
Gap analysis in internal working groups,projects
ISO principles without certification
PAFG checklist
SCOPE Work Package 7 Topic 1 Survey Report
Scope_Wp7_T1_Final_20151222 24
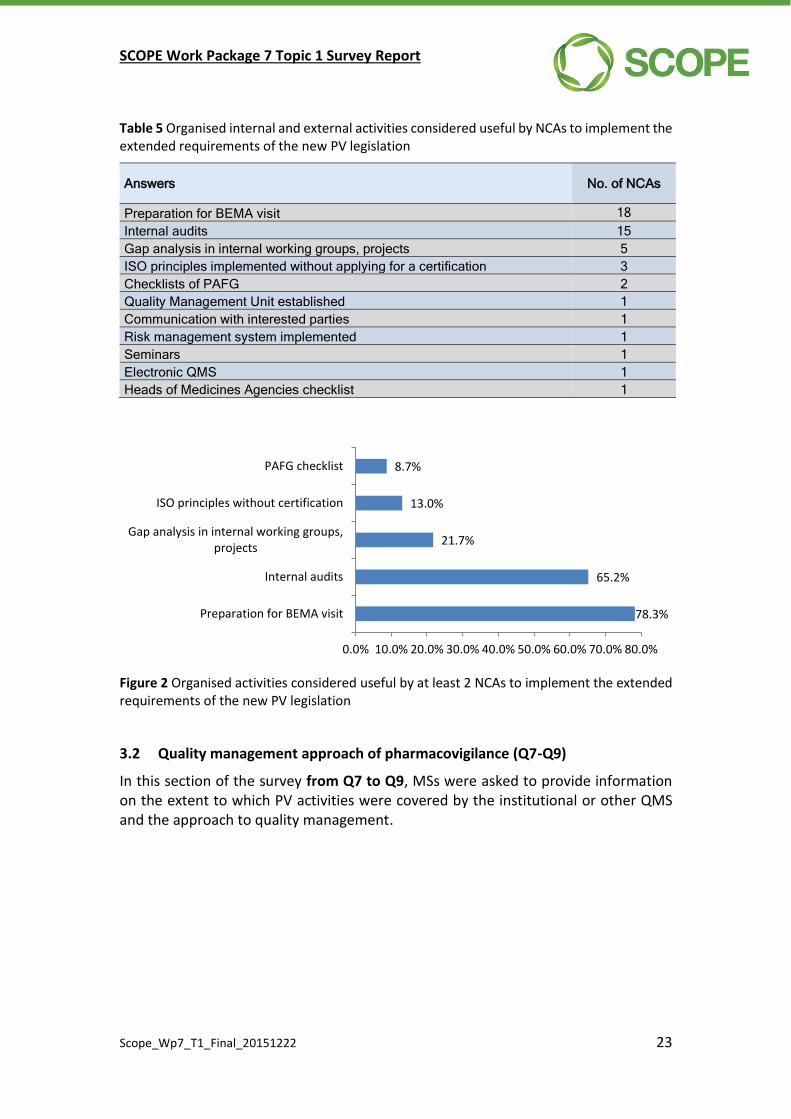
Q7**10 How is the quality management of pharmacovigilance organised at your National Competent Authority? (Select all that apply)
Answer Options (Multiple choice) Response Percent Response Count
Fully centralized, including all pharmacovigilance activities, and managed by a common quality management division
73,1% 19
Decentralized; pharmacovigilance has its own quality management system
7,7% 2
Under a global quality management policy, pharmacovigilance has its own quality system
23,1% 6
Quality management principles have not been implemented in pharmacovigilance activities yet
3,8% 1
Implementation of quality management is ongoing 11,5% 3
Other, please specify: Free text 3,8% 1
answered question 26
skipped question 0
In responses to Q7, MSs could indicate both the type of quality system they have for PV activities (i.e. fully centralised, decentralised, etc.) and implementation status (i.e. in place and functioning or implementation still ongoing). Nevertheless, when looking at the answers, the multiple choice approach made the question somehow confusing and caused some difficulties at the interpretation of results. Responses of 5 NCAs were ambiguous as detailed in the next paragraph.
The majority of MSs (18) indicated that they had a fully centralised quality system which includes PV activities as well, and further 5 NCAs responded that the PV quality system is governed by the global quality policy of the institute but with a more autonomous functioning at the level of PV. When analysing responses 1-1 count has been added to these numbers as the responses of 2 MSs in the ‘Other’ category could be classified in either of the two options. Two MSs indicated that they had a decentralized quality system as regards PV. A further discrepancy has been noted here, as 3 MSs chose 2 responses from among the first 3 options making the assessors unable to decide on the exact type of approach of these NCAs. Despite the 3 unclear responses, it was concluded that the question was interpretable and responses showed a strong tendency towards having a centralized approach in implementing quality principles to pharmacovigilance activities.
One NCA indicated that they had an ‘Other’ type of approach towards quality in PV activities; however, did not provide any details. As none of the options offered in Q7 was picked apart from indicating that implementation was ongoing, this response was kept. Another NCA, indicating the ‘Other’ category, and also picking other options, did not give any further information relevant to the question; thus, the response indicating the ‘Other’ category was not included in the analysis.
10In questions marked with two asterisks some of the responses were re-allocated by the assessors.
SCOPE Work Package 7 Topic 1 Survey Report
Scope_Wp7_T1_Final_20151222 25
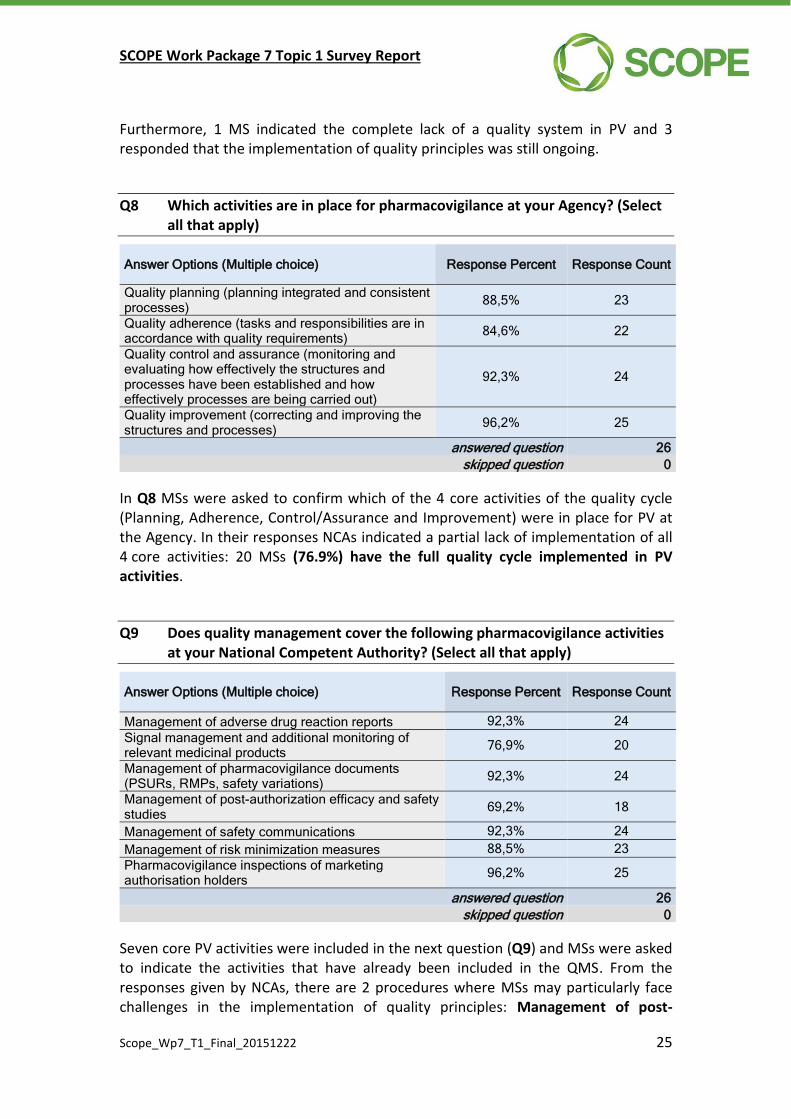
Furthermore, 1 MS indicated the complete lack of a quality system in PV and 3 responded that the implementation of quality principles was still ongoing.
Q8 Which activities are in place for pharmacovigilance at your Agency? (Select all that apply)
Answer Options (Multiple choice) Response Percent Response Count
Quality planning (planning integrated and consistent processes)
88,5% 23
Quality adherence (tasks and responsibilities are in accordance with quality requirements)
84,6% 22
Quality control and assurance (monitoring and evaluating how effectively the structures and processes have been established and how effectively processes are being carried out)
92,3% 24
Quality improvement (correcting and improving the structures and processes)
96,2% 25
answered question 26
skipped question 0
In Q8 MSs were asked to confirm which of the 4 core activities of the quality cycle (Planning, Adherence, Control/Assurance and Improvement) were in place for PV at the Agency. In their responses NCAs indicated a partial lack of implementation of all 4 core activities: 20 MSs (76.9%) have the full quality cycle implemented in PV activities.
Q9 Does quality management cover the following pharmacovigilance activities at your National Competent Authority? (Select all that apply)
Answer Options (Multiple choice) Response Percent Response Count
Management of adverse drug reaction reports 92,3% 24
Signal management and additional monitoring of relevant medicinal products
76,9% 20
Management of pharmacovigilance documents (PSURs, RMPs, safety variations)
92,3% 24
Management of post-authorization efficacy and safety studies
69,2% 18
Management of safety communications 92,3% 24
Management of risk minimization measures 88,5% 23
Pharmacovigilance inspections of marketing authorisation holders
96,2% 25
answered question 26
skipped question 0
Seven core PV activities were included in the next question (Q9) and MSs were asked to indicate the activities that have already been included in the QMS. From the responses given by NCAs, there are 2 procedures where MSs may particularly face challenges in the implementation of quality principles: Management of post-
SCOPE Work Package 7 Topic 1 Survey Report
Scope_Wp7_T1_Final_20151222 26
authorization efficacy (PAES) and safety studies (PASS) and Signal management and additional monitoring of relevant medicinal products.
At this point, responses given to the general WP1 questionnaire were investigated to check whether a NCA was responsible for a PV activity or not. It has been concluded that incomplete implementation of quality principles in the field of signal management and post-authorization safety and efficacy studies cannot be explained by the fact that the NCA is not responsible for that activity.
Finally, combining results from WP7 and WP1 questionnaires, it can be concluded that management of adverse drug reaction (ADR) reports and PV inspections are the 2 most completely covered areas among responding NCAs from the point of view of quality management.
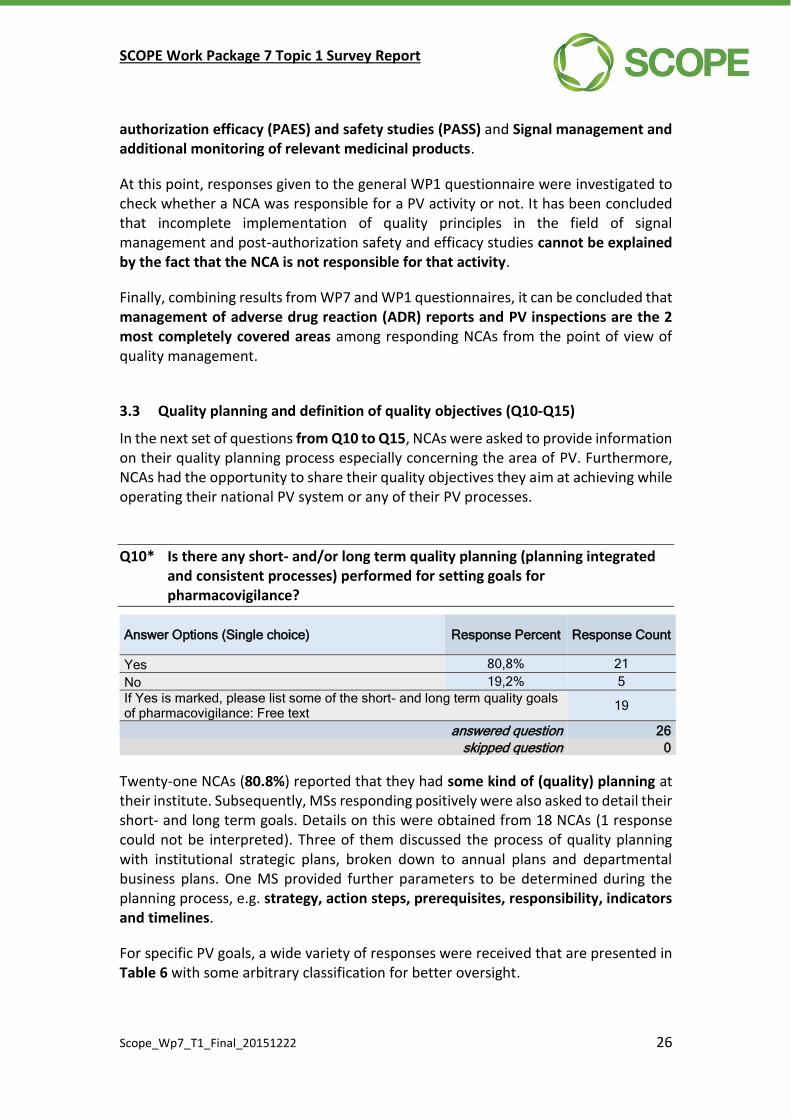
3.3 Quality planning and definition of quality objectives (Q10-Q15)
In the next set of questions from Q10 to Q15, NCAs were asked to provide information on their quality planning process especially concerning the area of PV. Furthermore, NCAs had the opportunity to share their quality objectives they aim at achieving while operating their national PV system or any of their PV processes.
Q10* Is there any short- and/or long term quality planning (planning integrated and consistent processes) performed for setting goals for pharmacovigilance?
Answer Options (Single choice) Response Percent Response Count
Yes 80,8% 21
No 19,2% 5
If Yes is marked, please list some of the short- and long term quality goals of pharmacovigilance: Free text
19
answered question 26
skipped question 0
Twenty-one NCAs (80.8%) reported that they had some kind of (quality) planning at their institute. Subsequently, MSs responding positively were also asked to detail their short- and long term goals. Details on this were obtained from 18 NCAs (1 response could not be interpreted). Three of them discussed the process of quality planning with institutional strategic plans, broken down to annual plans and departmental business plans. One MS provided further parameters to be determined during the planning process, e.g. strategy, action steps, prerequisites, responsibility, indicators and timelines.
For specific PV goals, a wide variety of responses were received that are presented in Table 6 with some arbitrary classification for better oversight.
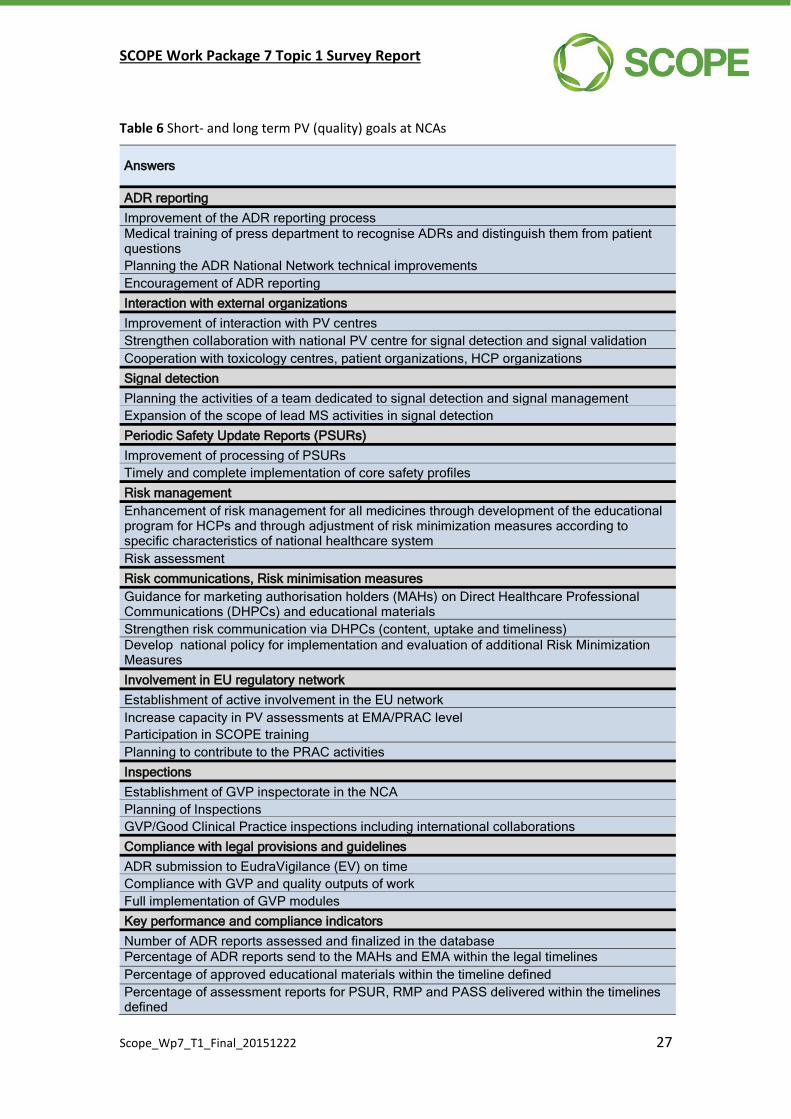
SCOPE Work Package 7 Topic 1 Survey Report
Scope_Wp7_T1_Final_20151222 27
Table 6 Short- and long term PV (quality) goals at NCAs
Answers
ADR reporting
Improvement of the ADR reporting process
Medical training of press department to recognise ADRs and distinguish them from patient questions
Planning the ADR National Network technical improvements
Encouragement of ADR reporting
Interaction with external organizations
Improvement of interaction with PV centres
Strengthen collaboration with national PV centre for signal detection and signal validation
Cooperation with toxicology centres, patient organizations, HCP organizations
Signal detection
Planning the activities of a team dedicated to signal detection and signal management
Expansion of the scope of lead MS activities in signal detection
Periodic Safety Update Reports (PSURs)
Improvement of processing of PSURs
Timely and complete implementation of core safety profiles
Risk management
Enhancement of risk management for all medicines through development of the educational program for HCPs and through adjustment of risk minimization measures according to specific characteristics of national healthcare system
Risk assessment
Risk communications, Risk minimisation measures
Guidance for marketing authorisation holders (MAHs) on Direct Healthcare Professional Communications (DHPCs) and educational materials
Strengthen risk communication via DHPCs (content, uptake and timeliness)
Develop national policy for implementation and evaluation of additional Risk Minimization Measures
Involvement in EU regulatory network
Establishment of active involvement in the EU network
Increase capacity in PV assessments at EMA/PRAC level
Participation in SCOPE training
Planning to contribute to the PRAC activities
Inspections
Establishment of GVP inspectorate in the NCA
Planning of Inspections
GVP/Good Clinical Practice inspections including international collaborations
Compliance with legal provisions and guidelines
ADR submission to EudraVigilance (EV) on time
Compliance with GVP and quality outputs of work
Full implementation of GVP modules
Key performance and compliance indicators
Number of ADR reports assessed and finalized in the database
Percentage of ADR reports send to the MAHs and EMA within the legal timelines Percentage of approved educational materials within the timeline defined
Percentage of assessment reports for PSUR, RMP and PASS delivered within the timelines defined
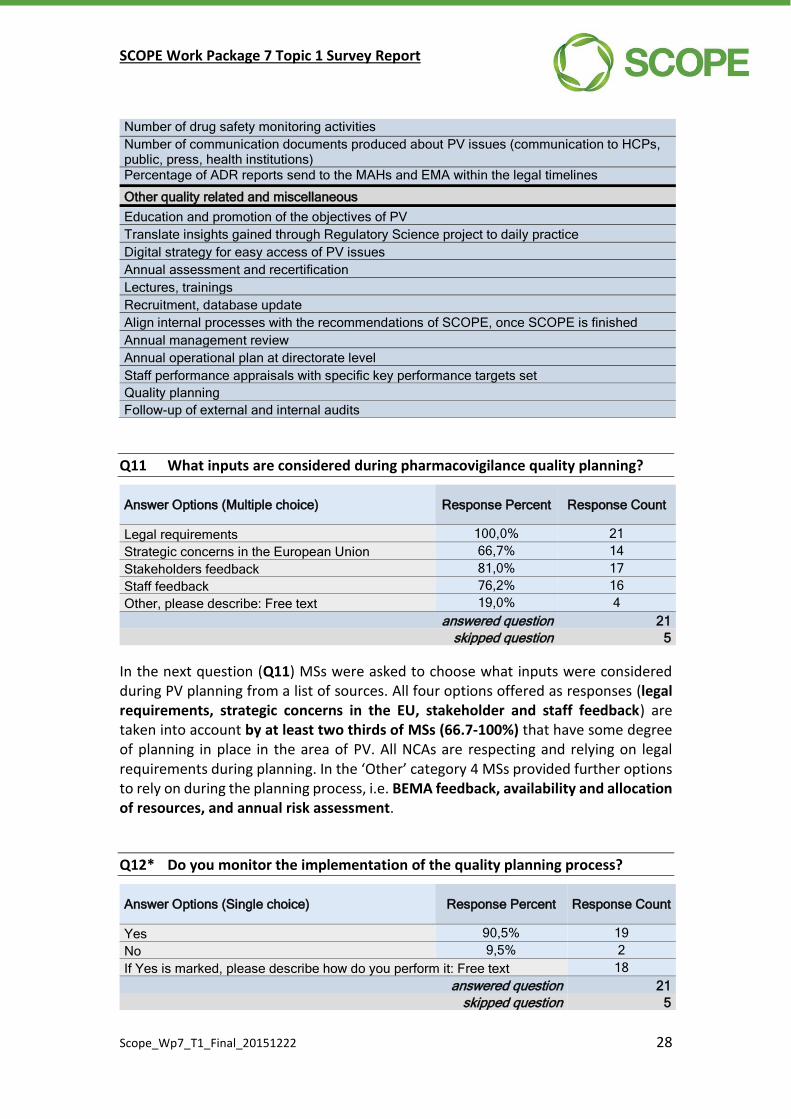
SCOPE Work Package 7 Topic 1 Survey Report
Scope_Wp7_T1_Final_20151222 28
Number of drug safety monitoring activities
Number of communication documents produced about PV issues (communication to HCPs, public, press, health institutions)
Percentage of ADR reports send to the MAHs and EMA within the legal timelines
Other quality related and miscellaneous
Education and promotion of the objectives of PV
Translate insights gained through Regulatory Science project to daily practice
Digital strategy for easy access of PV issues
Annual assessment and recertification
Lectures, trainings
Recruitment, database update
Align internal processes with the recommendations of SCOPE, once SCOPE is finished
Annual management review
Annual operational plan at directorate level
Staff performance appraisals with specific key performance targets set
Quality planning
Follow-up of external and internal audits
Q11 What inputs are considered during pharmacovigilance quality planning?
Answer Options (Multiple choice) Response Percent Response Count
Legal requirements 100,0% 21
Strategic concerns in the European Union 66,7% 14
Stakeholders feedback 81,0% 17
Staff feedback 76,2% 16
Other, please describe: Free text 19,0% 4
answered question 21
skipped question 5
In the next question (Q11) MSs were asked to choose what inputs were considered during PV planning from a list of sources. All four options offered as responses (legal requirements, strategic concerns in the EU, stakeholder and staff feedback) are taken into account by at least two thirds of MSs (66.7-100%) that have some degree of planning in place in the area of PV. All NCAs are respecting and relying on legal requirements during planning. In the ‘Other’ category 4 MSs provided further options to rely on during the planning process, i.e. BEMA feedback, availability and allocation of resources, and annual risk assessment.
Q12* Do you monitor the implementation of the quality planning process?
Answer Options (Single choice) Response Percent Response Count
Yes 90,5% 19
No 9,5% 2
If Yes is marked, please describe how do you perform it: Free text 18
answered question 21
skipped question 5

SCOPE Work Package 7 Topic 1 Survey Report
Scope_Wp7_T1_Final_20151222 29
Nineteen NCAs (90.5%) with quality planning in place indicated that they monitored the implementation of the planning process. Eighteen agencies were willing to describe what they meant by this activity. Relevant information extracted and grouped together from the free text responses are presented in Table 7.
Table 7 Means of monitoring the implementation of the quality planning process at NCAs
Answers No. of NCAs
Management reports/reviews at various time intervals 10
Internal and external audits, follow-up on audit findings 7
Checking against predefined responsibilities, milestones/targets/goals and timelines, quality indicators 8
Monitoring the implementation process (not specified how) 3
ISO recertification 2
Yearly reports to ministry 1
Meetings, working groups, monitoring charts 1
Review of performance, non-compliances, opportunities for improvement 1
Periodic control of documents 1
Annual program at the beginning of each year 1
Agencies in their responses provided information on both what to monitor (checking against predefined criteria, e.g. responsibilities, milestones, performance, goals, quality indicators, timelines, etc.) and the means of checking and reporting (e.g. in management reviews, during audits, in the process of obtaining ISO recertification, in reports to the ministry, etc.). Some responses were so concise that exact meaning might not be evident for the assessors at this stage.
One Agency provided a brief, yet very useful summary on their planning process that is presented here in its entirety and will be included as a good example:
‘The strategic objectives are the basis for defining operative annual goals, which lead to the yearly plan at organisational and department level (work programme). The process for the yearly plan development is described in a policy cycle document, which is revised every year. The management review is included in the yearly plan which addresses the progress made on the objectives defined in the strategic plan. For the development of the yearly plans and budget, standard formats are in place. The agency has a policy cycle in place at overall and department level. Policy cycle document includes deadlines for each stage of the annual planning process, the process owner and the deliverables. Every department provides a year plan containing the following elements.
Achievement of goals previous year and areas for improvement; management review
External and internal relevant influences
Goals for next year
SCOPE Work Package 7 Topic 1 Survey Report
Scope_Wp7_T1_Final_20151222 30
Means to achieve those goals
Risk management
Budget
Planning is bottom up and top down, through an iterative process. Department projects must show a link to the strategic goals. First draft of plans ensures that dependencies are known between departments. Dependencies are also discussed and agreed on in Management Team meetings.’
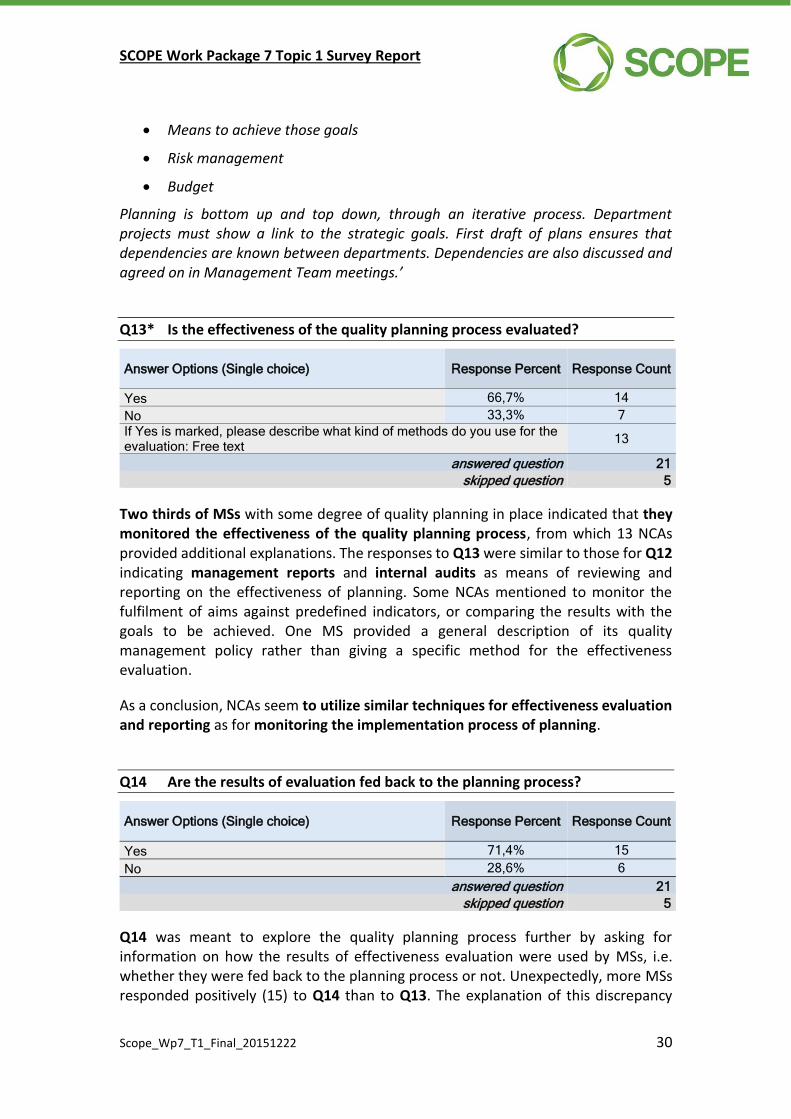
Q13* Is the effectiveness of the quality planning process evaluated?
Answer Options (Single choice) Response Percent Response Count
Yes 66,7% 14
No 33,3% 7
If Yes is marked, please describe what kind of methods do you use for the evaluation: Free text
13
answered question 21
skipped question 5
Two thirds of MSs with some degree of quality planning in place indicated that they monitored the effectiveness of the quality planning process, from which 13 NCAs provided additional explanations. The responses to Q13 were similar to those for Q12 indicating management reports and internal audits as means of reviewing and reporting on the effectiveness of planning. Some NCAs mentioned to monitor the fulfilment of aims against predefined indicators, or comparing the results with the goals to be achieved. One MS provided a general description of its quality management policy rather than giving a specific method for the effectiveness evaluation.
As a conclusion, NCAs seem to utilize similar techniques for effectiveness evaluation and reporting as for monitoring the implementation process of planning.
Q14 Are the results of evaluation fed back to the planning process?
Answer Options (Single choice) Response Percent Response Count
Yes 71,4% 15
No 28,6% 6
answered question 21
skipped question 5
Q14 was meant to explore the quality planning process further by asking for information on how the results of effectiveness evaluation were used by MSs, i.e. whether they were fed back to the planning process or not. Unexpectedly, more MSs responded positively (15) to Q14 than to Q13. The explanation of this discrepancy

SCOPE Work Package 7 Topic 1 Survey Report
Scope_Wp7_T1_Final_20151222 31
might be that there may be at least 1 MS that monitors only the implementation process (Q12) without checking the effectiveness and findings from the implementation process are fed back to planning.
Q15* Are overall quality objectives for the operation of the national pharmacovigilance system or any pharmacovigilance procedures defined? (A quality objective is an aim which is measured, reviewed, tracked and documented)
Answer Options (Single choice) Response Percent Response Count
Yes 61,5% 16
No 38,5% 10
If Yes is marked, please list them: Free text 17
answered question 26
skipped question 0
Sixteen MSs (61.5%) responded positively, but unexpectedly, 17 provided examples of their PV quality objectives.
Free text answers were very difficult to interpret as many of them did not strictly observe the definition of a quality objective, despite the fact that a brief definition was provided in the question itself. Some MSs reported that they defined their quality objectives in the (PV) Quality Manual, in Standard Operating Procedures (SOPs) or followed the quality objectives for each of their procedures as outlined in GVP Modules. Responses of 5 MSs could not be used for analysis. Summary of the answers are presented in Table 8.
One MS provided a brief outline of its SOPs with a concise summary of the quality objectives for each of the written procedures.
Table 8 Quality (and business) objectives concerning PV at NCAs
Answers
Continuous improvement of the quality of PV data
Quality of reports including format and content
Compliance with timelines
SMART (Specific, Measurable, Attainable, Realistic and Timely) annual plans
Compliance in ADR reporting
Complying with the legal requirements for PV tasks and responsibilities
Prevent harm from ADRs in patients/consumers arising from the use of authorized medicinal products within or outside the terms of marketing authorization or from occupational exposure Promoting the safe and effective use of medicinal products, in particular through providing timely information about the safety of medicinal products to patients, HCPs and the public
Contributing to the protection of patients’ and public health Number or percentage of planned procedures realised
SCOPE Work Package 7 Topic 1 Survey Report
Scope_Wp7_T1_Final_20151222 32
A discrepancy has been noted in the understanding of certain quality concepts, e.g. quality objectives, compliance and performance indicators used for controlling a procedure. Some MSs provided the measurement method, not the quality objective itself. In the final deliverables of WP7, clean-cut definitions of basic quality concepts should be provided and agreed on in order to harmonise terminology.
3.4 Written procedures (Q16-Q19)
In this section of the survey from Q16 to Q19, MSs were asked about their practices on written procedures including their development, maintenance and update.
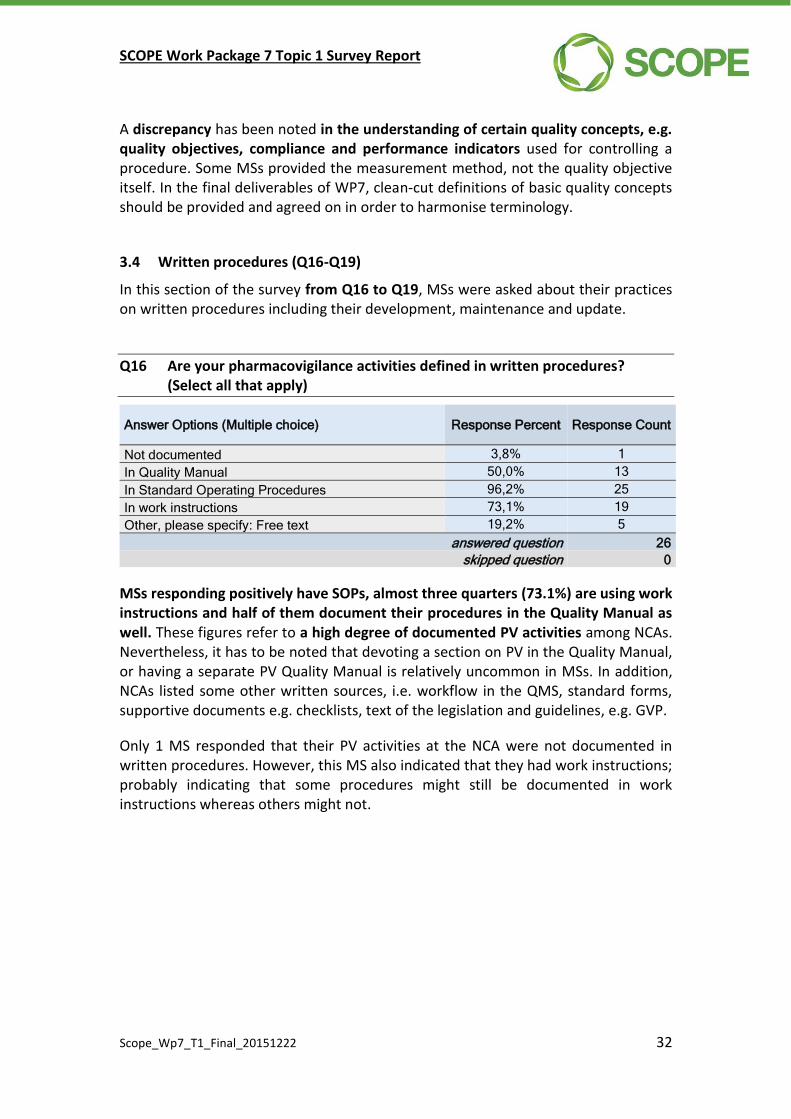
Q16 Are your pharmacovigilance activities defined in written procedures? (Select all that apply)
Answer Options (Multiple choice) Response Percent Response Count
Not documented 3,8% 1
In Quality Manual 50,0% 13
In Standard Operating Procedures 96,2% 25
In work instructions 73,1% 19
Other, please specify: Free text 19,2% 5
answered question 26
skipped question 0
MSs responding positively have SOPs, almost three quarters (73.1%) are using work instructions and half of them document their procedures in the Quality Manual as well. These figures refer to a high degree of documented PV activities among NCAs. Nevertheless, it has to be noted that devoting a section on PV in the Quality Manual, or having a separate PV Quality Manual is relatively uncommon in MSs. In addition, NCAs listed some other written sources, i.e. workflow in the QMS, standard forms, supportive documents e.g. checklists, text of the legislation and guidelines, e.g. GVP.
Only 1 MS responded that their PV activities at the NCA were not documented in written procedures. However, this MS also indicated that they had work instructions; probably indicating that some procedures might still be documented in work instructions whereas others might not.
SCOPE Work Package 7 Topic 1 Survey Report
Scope_Wp7_T1_Final_20151222 33
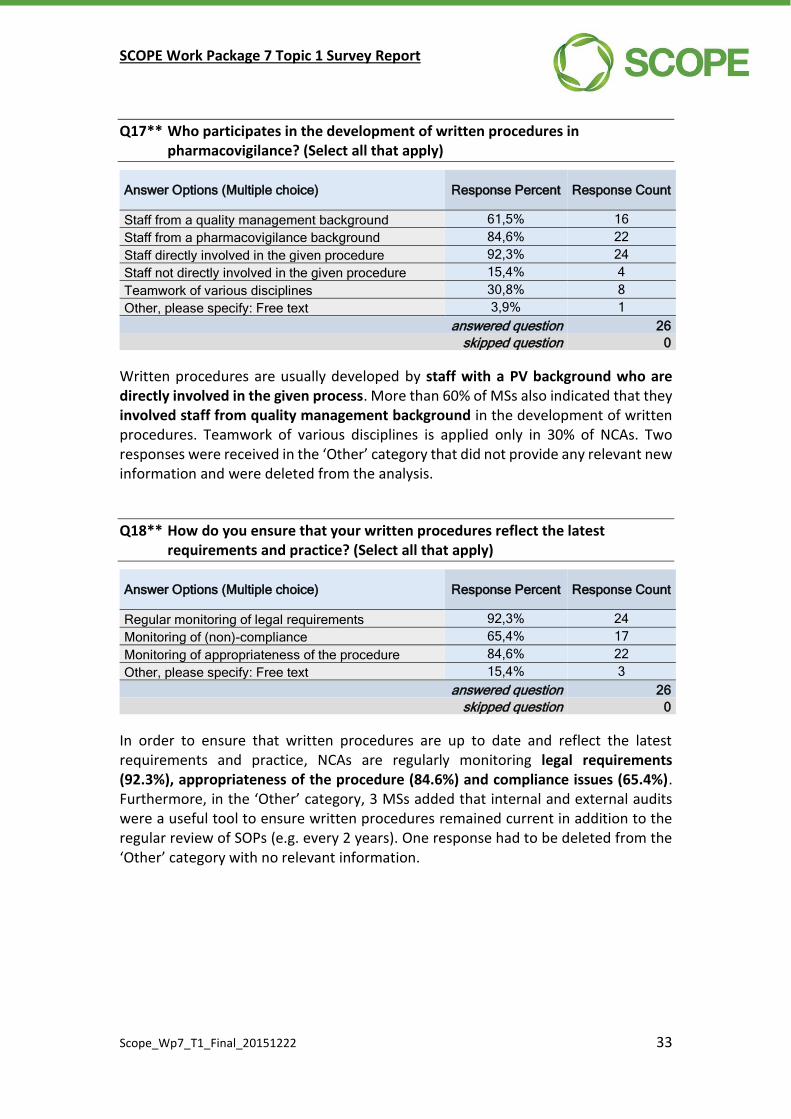
Q17** Who participates in the development of written procedures in pharmacovigilance? (Select all that apply)
Answer Options (Multiple choice) Response Percent Response Count
Staff from a quality management background 61,5% 16
Staff from a pharmacovigilance background 84,6% 22
Staff directly involved in the given procedure 92,3% 24
Staff not directly involved in the given procedure 15,4% 4
Teamwork of various disciplines 30,8% 8
Other, please specify: Free text 3,9% 1
answered question 26
skipped question 0
Written procedures are usually developed by staff with a PV background who are directly involved in the given process. More than 60% of MSs also indicated that they involved staff from quality management background in the development of written procedures. Teamwork of various disciplines is applied only in 30% of NCAs. Two responses were received in the ‘Other’ category that did not provide any relevant new information and were deleted from the analysis.
Q18** How do you ensure that your written procedures reflect the latest requirements and practice? (Select all that apply)
Answer Options (Multiple choice) Response Percent Response Count
Regular monitoring of legal requirements 92,3% 24
Monitoring of (non)-compliance 65,4% 17
Monitoring of appropriateness of the procedure 84,6% 22
Other, please specify: Free text 15,4% 3
answered question 26
skipped question 0
In order to ensure that written procedures are up to date and reflect the latest requirements and practice, NCAs are regularly monitoring legal requirements (92.3%), appropriateness of the procedure (84.6%) and compliance issues (65.4%). Furthermore, in the ‘Other’ category, 3 MSs added that internal and external audits were a useful tool to ensure written procedures remained current in addition to the regular review of SOPs (e.g. every 2 years). One response had to be deleted from the ‘Other’ category with no relevant information.
SCOPE Work Package 7 Topic 1 Survey Report
Scope_Wp7_T1_Final_20151222 34
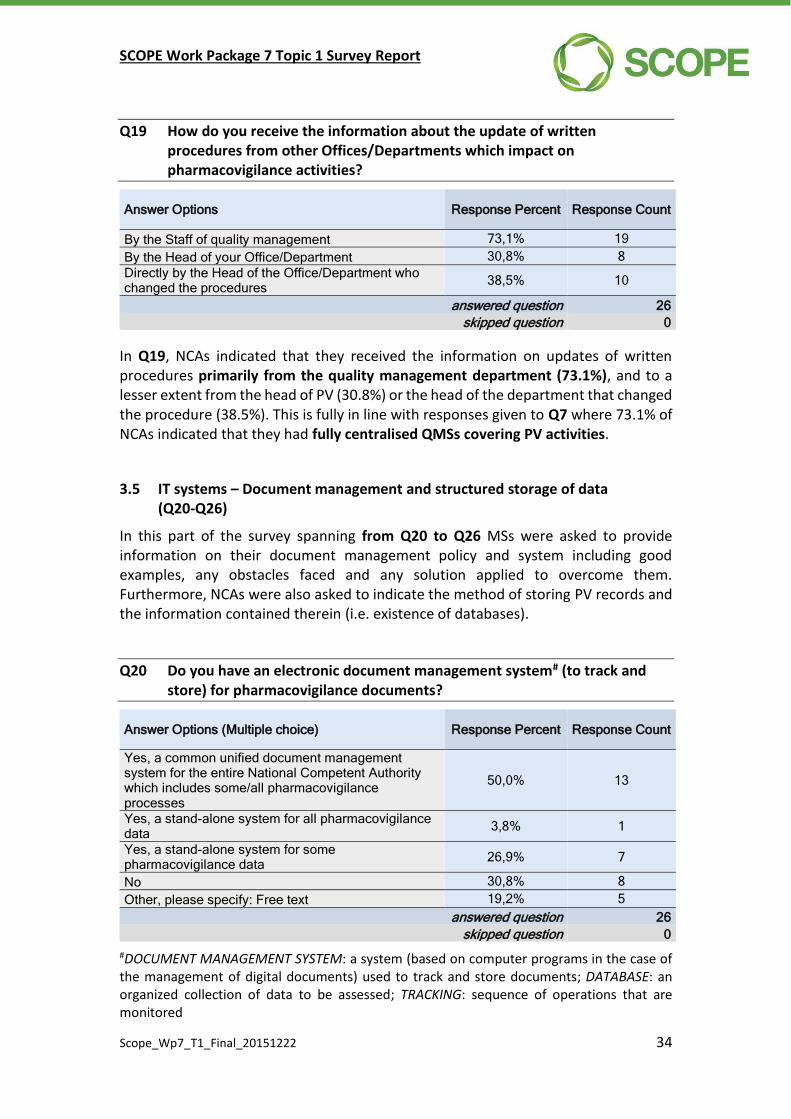
Q19 How do you receive the information about the update of written procedures from other Offices/Departments which impact on pharmacovigilance activities?
Answer Options Response Percent Response Count
By the Staff of quality management 73,1% 19
By the Head of your Office/Department 30,8% 8
Directly by the Head of the Office/Department who changed the procedures
38,5% 10
answered question 26
skipped question 0
In Q19, NCAs indicated that they received the information on updates of written procedures primarily from the quality management department (73.1%), and to a lesser extent from the head of PV (30.8%) or the head of the department that changed the procedure (38.5%). This is fully in line with responses given to Q7 where 73.1% of NCAs indicated that they had fully centralised QMSs covering PV activities.
3.5 IT systems – Document management and structured storage of data (Q20-Q26)
In this part of the survey spanning from Q20 to Q26 MSs were asked to provide information on their document management policy and system including good examples, any obstacles faced and any solution applied to overcome them. Furthermore, NCAs were also asked to indicate the method of storing PV records and the information contained therein (i.e. existence of databases).
Q20 Do you have an electronic document management system# (to track and store) for pharmacovigilance documents?
Answer Options (Multiple choice) Response Percent Response Count
Yes, a common unified document management system for the entire National Competent Authority which includes some/all pharmacovigilance processes
50,0% 13
Yes, a stand-alone system for all pharmacovigilance data
3,8% 1
Yes, a stand-alone system for some pharmacovigilance data
26,9% 7
No 30,8% 8
Other, please specify: Free text 19,2% 5
answered question 26
skipped question 0
#DOCUMENT MANAGEMENT SYSTEM: a system (based on computer programs in the case of the management of digital documents) used to track and store documents; DATABASE: an organized collection of data to be assessed; TRACKING: sequence of operations that are monitored
SCOPE Work Package 7 Topic 1 Survey Report
Scope_Wp7_T1_Final_20151222 35
In responses given to Q20 on the existence of electronic document management systems for PV documents, half of the MSs indicated that their Agencies had a common unified document management system for the entire NCA which covered at least partially the handling of PV records. Approximately 27% of NCAs responded that they had stand-alone systems for some PV data, and one MS had a stand-alone system for all PV records. Nearly one third (30.8%) of responding NCAs indicated that they did not have any electronic document management system in place.
As an ‘Other’ option, MSs were encouraged to add any further items to specify the type of document management system they were using. Responses included:
Construction of a unified system is ongoing;
Only letters with notifications for submissions are uploaded in the system;
PV records are registered in Excel spreadsheets, and Eurs is Yours is used for storage of documents related to marketing authorisations;
PV records are stored at the shared space of the Agency’s server;
A register is in place on the physical location of documents within the Agency.
One response of the ‘Other’ category could not be interpreted, and was not included in the analysis.
A very concise definition of document management, workflow tracking and database were provided along with Q20, also applicable to the next few questions; however, several misunderstandings in relation to the use of these concepts were noted. Clear, detailed definitions with examples might facilitate the understanding and use of these very basic principles of record management.
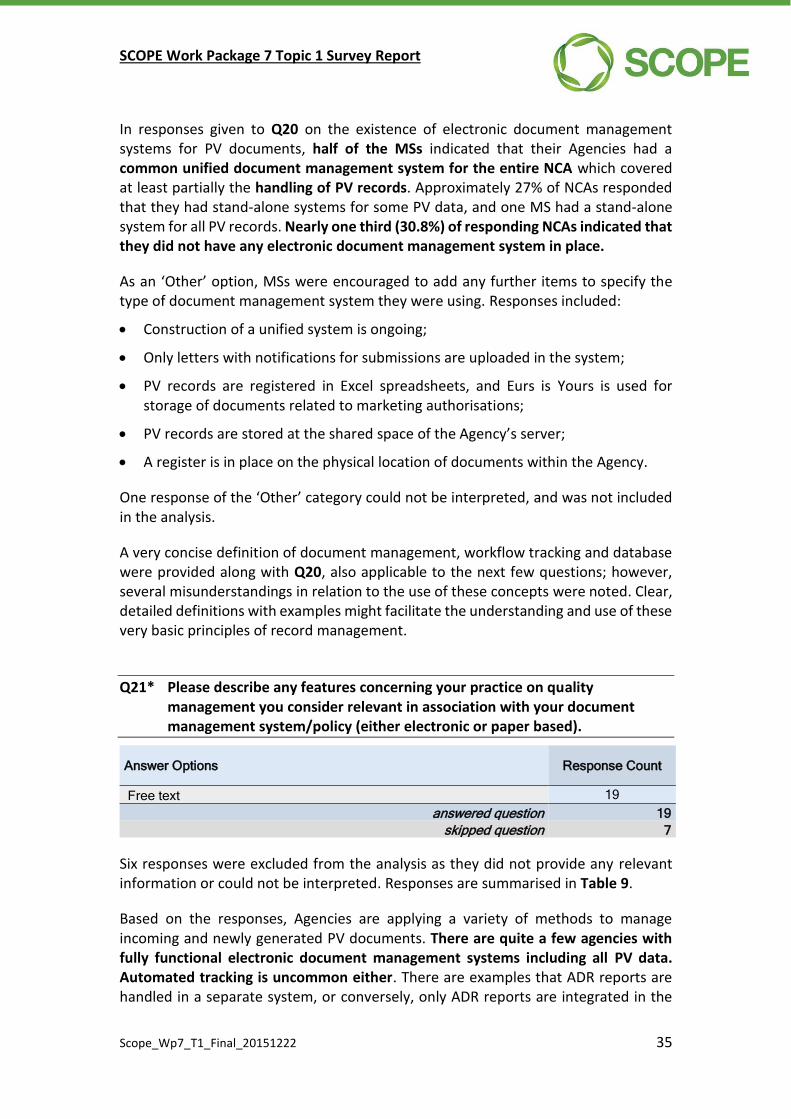
Q21* Please describe any features concerning your practice on quality management you consider relevant in association with your document management system/policy (either electronic or paper based).
Answer Options Response Count
Free text 19
answered question 19
skipped question 7
Six responses were excluded from the analysis as they did not provide any relevant information or could not be interpreted. Responses are summarised in Table 9.
Based on the responses, Agencies are applying a variety of methods to manage incoming and newly generated PV documents. There are quite a few agencies with fully functional electronic document management systems including all PV data. Automated tracking is uncommon either. There are examples that ADR reports are handled in a separate system, or conversely, only ADR reports are integrated in the

SCOPE Work Package 7 Topic 1 Survey Report
Scope_Wp7_T1_Final_20151222 36
common document management system of the Agency. It is also common that document management and tracking are performed on excel spreadsheets, registering incoming and outgoing documents and relevant steps of the procedure. Some Agencies indicated that they used both electronic and paper-based methods for document management, as electronic systems are not able to meet all needs, are incomplete or are under development.
Table 9 Document management of PV data at NCAs
Answers
ADR reports and other type of PV data are handled in a separate system.
The major advantage of a common unified document management system for the entire Agency is the detailed insight and overview of the assignments and their timeliness for each assessor.
Paper based and electronic systems run in parallel as electronic system is not yet able to meet all needs.
The Agency has a FileNet based Enterprise Content Management in place consisting of Document Management, Workflow Management and a Medicinal Product database. There are also a wide range of Management Reports available. This all helps with tracking for all activities the Agency is responsible for. The national PV centre has its own database for ADRs, which is separate from the Agency’s environment.
Registry of entries and outputs (type of documents and dates) Registry of the main steps of the workflow defined in the SOP (responsible, timelines, conclusions, etc.) Archive of the electronic documents in the internal network and/or webmail system (proxies, not personal e-mails) by type of procedures
Entry/exit document registries Excel files to register all types of pharmacovigilance documents
Either electronic or paper-based document management system with tracking functions linked to the medicines information system
Safety, traceability, document control ensured.
Quality control on what is stored in the electronic Document Management System
Full tracking and control of all documents including automatically reminders for updates and notifications of updates in documents from other departments relevant for PV practice.
The current system includes folders/subfolders for each procedure. Documents are saved electronically (paper copies are scanned into the system) and tracking is performed by the use of Excel spreadsheets. A unified electronic system is under development
The Agency has a custom developed document management system. An advantage is that it is linked with workflow tracking for a number of regulatory procedures (e.g. new authorisations, variations, management of ADRs). Also, a link is established with a number of databases, e.g. medicinal product and PV ADR database. A disadvantage is that the system is incomplete at this moment and from among PV activities, includes only the ADR management process. Furthermore, development and maintenance is very troublesome as both resources and financial background is lacking.
Archiving and retention times as set out in the legislation is challenging
SCOPE Work Package 7 Topic 1 Survey Report
Scope_Wp7_T1_Final_20151222 37
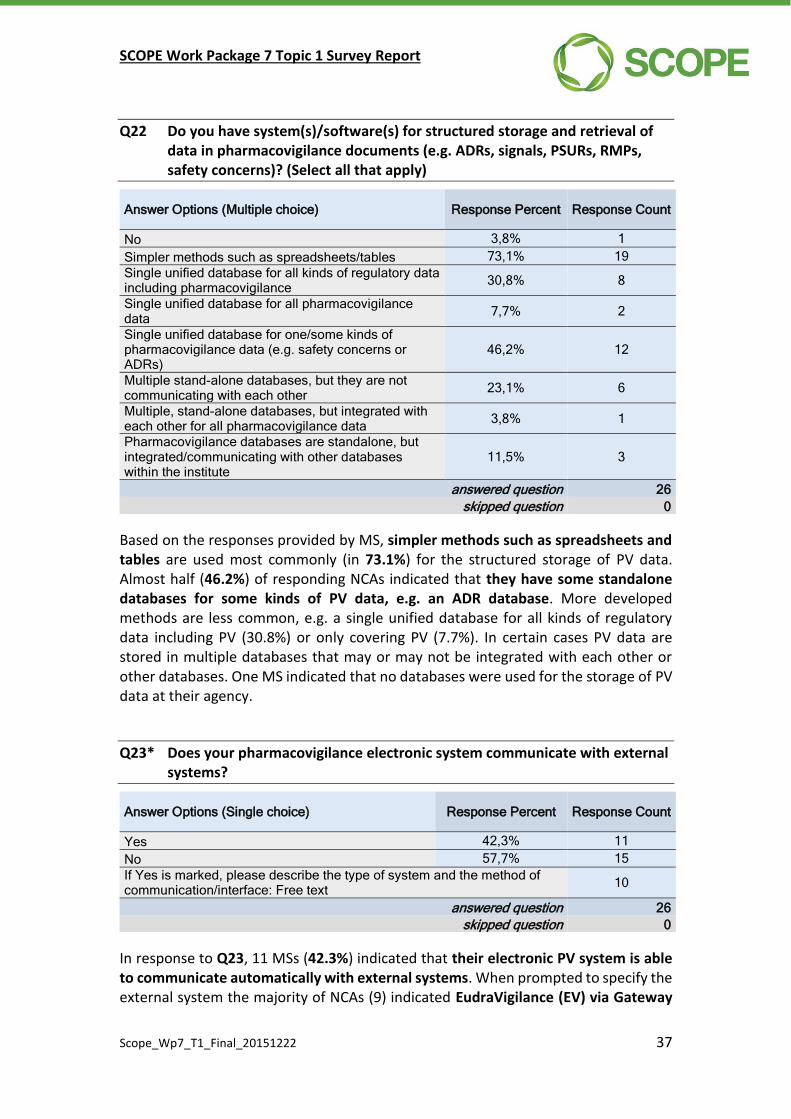
Q22 Do you have system(s)/software(s) for structured storage and retrieval of data in pharmacovigilance documents (e.g. ADRs, signals, PSURs, RMPs, safety concerns)? (Select all that apply)
Answer Options (Multiple choice) Response Percent Response Count
No 3,8% 1
Simpler methods such as spreadsheets/tables 73,1% 19
Single unified database for all kinds of regulatory data including pharmacovigilance
30,8% 8
Single unified database for all pharmacovigilance data
7,7% 2
Single unified database for one/some kinds of pharmacovigilance data (e.g. safety concerns or ADRs)
46,2% 12
Multiple stand-alone databases, but they are not communicating with each other
23,1% 6
Multiple, stand-alone databases, but integrated with each other for all pharmacovigilance data
3,8% 1
Pharmacovigilance databases are standalone, but integrated/communicating with other databases within the institute
11,5% 3
answered question 26
skipped question 0
Based on the responses provided by MS, simpler methods such as spreadsheets and tables are used most commonly (in 73.1%) for the structured storage of PV data. Almost half (46.2%) of responding NCAs indicated that they have some standalone databases for some kinds of PV data, e.g. an ADR database. More developed methods are less common, e.g. a single unified database for all kinds of regulatory data including PV (30.8%) or only covering PV (7.7%). In certain cases PV data are stored in multiple databases that may or may not be integrated with each other or other databases. One MS indicated that no databases were used for the storage of PV data at their agency.
Q23* Does your pharmacovigilance electronic system communicate with external systems?
Answer Options (Single choice) Response Percent Response Count
Yes 42,3% 11
No 57,7% 15
If Yes is marked, please describe the type of system and the method of communication/interface: Free text
10
answered question 26
skipped question 0
In response to Q23, 11 MSs (42.3%) indicated that their electronic PV system is able to communicate automatically with external systems. When prompted to specify the external system the majority of NCAs (9) indicated EudraVigilance (EV) via Gateway
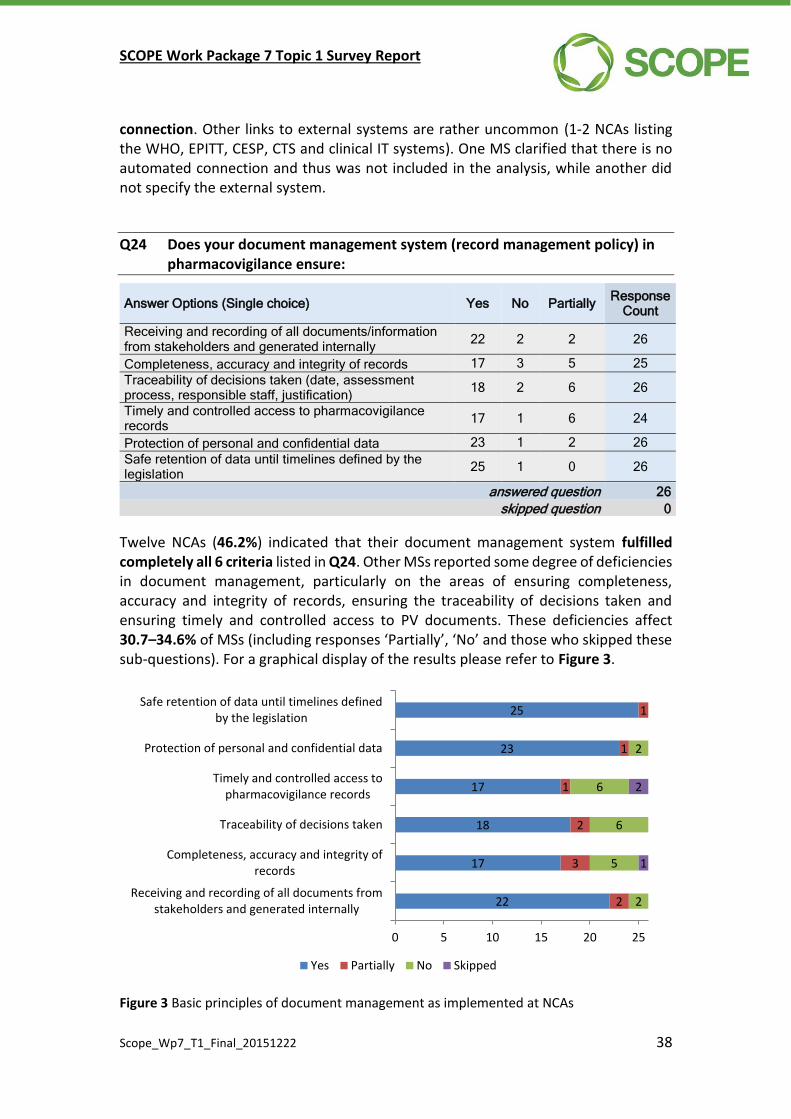
SCOPE Work Package 7 Topic 1 Survey Report
Scope_Wp7_T1_Final_20151222 38
connection. Other links to external systems are rather uncommon (1-2 NCAs listing the WHO, EPITT, CESP, CTS and clinical IT systems). One MS clarified that there is no automated connection and thus was not included in the analysis, while another did not specify the external system.
Q24 Does your document management system (record management policy) in pharmacovigilance ensure:
Answer Options (Single choice) Yes No Partially Response
Count
Receiving and recording of all documents/information from stakeholders and generated internally
22 2 2 26
Completeness, accuracy and integrity of records 17 3 5 25
Traceability of decisions taken (date, assessment process, responsible staff, justification)
18 2 6 26
Timely and controlled access to pharmacovigilance records
17 1 6 24
Protection of personal and confidential data 23 1 2 26
Safe retention of data until timelines defined by the legislation
25 1 0 26
answered question 26
skipped question 0
Twelve NCAs (46.2%) indicated that their document management system fulfilled completely all 6 criteria listed in Q24. Other MSs reported some degree of deficiencies in document management, particularly on the areas of ensuring completeness, accuracy and integrity of records, ensuring the traceability of decisions taken and ensuring timely and controlled access to PV documents. These deficiencies affect 30.7–34.6% of MSs (including responses ‘Partially’, ‘No’ and those who skipped these sub-questions). For a graphical display of the results please refer to Figure 3.
Figure 3 Basic principles of document management as implemented at NCAs
22
17
18
17
23
25
2
3
2
1
1
1
2
5
6
6
2
1
2
0 5 10 15 20 25
Receiving and recording of all documents fromstakeholders and generated internally
Completeness, accuracy and integrity ofrecords
Traceability of decisions taken
Timely and controlled access topharmacovigilance records
Protection of personal and confidential data
Safe retention of data until timelines definedby the legislation
Yes Partially No Skipped
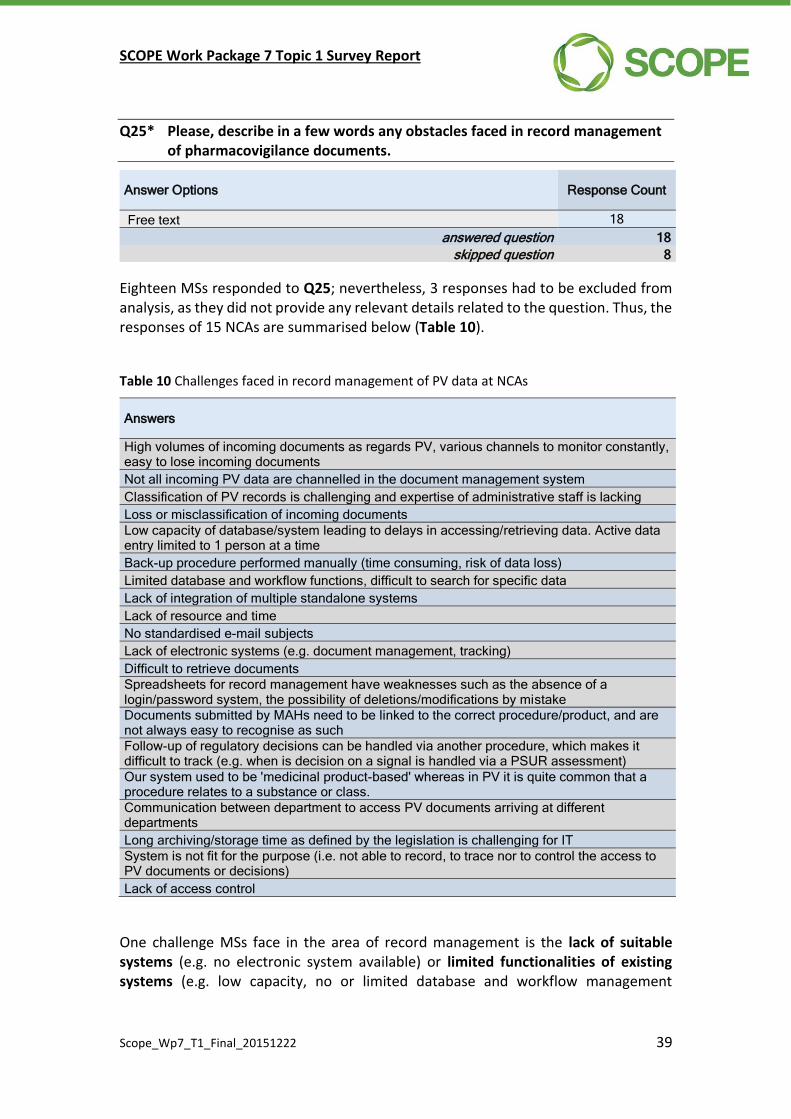
SCOPE Work Package 7 Topic 1 Survey Report
Scope_Wp7_T1_Final_20151222 39
Q25* Please, describe in a few words any obstacles faced in record management of pharmacovigilance documents.
Answer Options Response Count
Free text 18
answered question 18
skipped question 8
Eighteen MSs responded to Q25; nevertheless, 3 responses had to be excluded from analysis, as they did not provide any relevant details related to the question. Thus, the responses of 15 NCAs are summarised below (Table 10).
Table 10 Challenges faced in record management of PV data at NCAs
Answers
High volumes of incoming documents as regards PV, various channels to monitor constantly, easy to lose incoming documents
Not all incoming PV data are channelled in the document management system
Classification of PV records is challenging and expertise of administrative staff is lacking
Loss or misclassification of incoming documents
Low capacity of database/system leading to delays in accessing/retrieving data. Active data entry limited to 1 person at a time
Back-up procedure performed manually (time consuming, risk of data loss)
Limited database and workflow functions, difficult to search for specific data
Lack of integration of multiple standalone systems
Lack of resource and time
No standardised e-mail subjects
Lack of electronic systems (e.g. document management, tracking)
Difficult to retrieve documents
Spreadsheets for record management have weaknesses such as the absence of a login/password system, the possibility of deletions/modifications by mistake
Documents submitted by MAHs need to be linked to the correct procedure/product, and are not always easy to recognise as such
Follow-up of regulatory decisions can be handled via another procedure, which makes it difficult to track (e.g. when is decision on a signal is handled via a PSUR assessment)
Our system used to be 'medicinal product-based' whereas in PV it is quite common that a procedure relates to a substance or class.
Communication between department to access PV documents arriving at different departments
Long archiving/storage time as defined by the legislation is challenging for IT
System is not fit for the purpose (i.e. not able to record, to trace nor to control the access to PV documents or decisions)
Lack of access control
One challenge MSs face in the area of record management is the lack of suitable systems (e.g. no electronic system available) or limited functionalities of existing systems (e.g. low capacity, no or limited database and workflow management

SCOPE Work Package 7 Topic 1 Survey Report
Scope_Wp7_T1_Final_20151222 40
functions, lack of integration to other internal or external systems, no access control, etc.) This makes search and retrieval of documents troublesome.
A second challenge is the high volumes of incoming PV records. These documents are arriving at the Agency via a variety of channels and media that need to be monitored constantly consuming lot of resources. Many of these documents may not be channelled to the document management system. As there is no standardisation of e-mail subjects, automated download and classification is troublesome. Safety and timely receipt of information and may be at risk.
Thirdly, classification of PV records is challenging and requires expertise. Documents submitted by marketing authorisation holders (MAHs) need to be linked to the correct procedure and product. Misclassification of incoming documents may cause undue delay in data processing, similarly to PV documents arriving at different departments.
Procedures and systems are usually ‘medicinal product based’ whereas PV issues generally deal with active substances or encompass whole substance classes. This may require review of existing solutions and adjustment of the system. Nevertheless, this is resource demanding which may not be available. Follow-up of regulatory decisions may be handled via different procedures, and establishment of appropriate links to track compliance of MAHs with regulatory decisions is a challenge.
Furthermore, spreadsheets used for registration of documents have weak access control, and low capacity as compared to databases, and there is a possibility of unintended or deliberate deletions and/or modifications.
Q26* If you have a well-functioning system/policy that you would like to share with member states, please describe in detail:
Answer Options Response Count
Free text 8
answered question 8
skipped question 18
Eight responses were received to Q26; however, 5 had to be excluded as all indicated ‘No’ or ‘Not applicable’. From the 3 responses considered, 1 NCA attached an SOP on ‘The receipt and filing of documentation generated post-authorisation, clinical trial safety procedures and centralised procedures where the member state is not rapporteur.’ Another MS mentioned its PASS register as a good practice; nevertheless, details were not provided. A third NCA indicated that theoretically their custom-developed IT system would be very useful and meet all needs of document management, workflow tracking and database storage, but the system is incomplete and further development is troublesome at the time being.
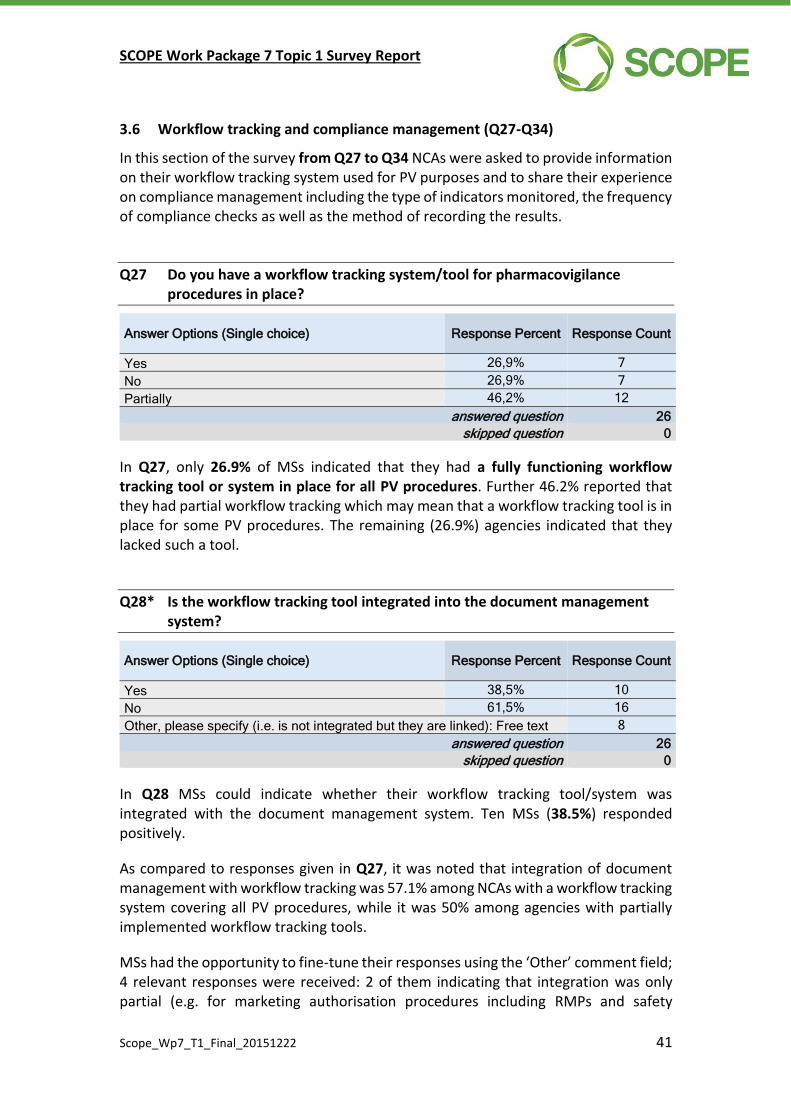
SCOPE Work Package 7 Topic 1 Survey Report
Scope_Wp7_T1_Final_20151222 41
3.6 Workflow tracking and compliance management (Q27-Q34)
In this section of the survey from Q27 to Q34 NCAs were asked to provide information on their workflow tracking system used for PV purposes and to share their experience on compliance management including the type of indicators monitored, the frequency of compliance checks as well as the method of recording the results.
Q27 Do you have a workflow tracking system/tool for pharmacovigilance procedures in place?
Answer Options (Single choice) Response Percent Response Count
Yes 26,9% 7
No 26,9% 7
Partially 46,2% 12
answered question 26
skipped question 0
In Q27, only 26.9% of MSs indicated that they had a fully functioning workflow tracking tool or system in place for all PV procedures. Further 46.2% reported that they had partial workflow tracking which may mean that a workflow tracking tool is in place for some PV procedures. The remaining (26.9%) agencies indicated that they lacked such a tool.
Q28* Is the workflow tracking tool integrated into the document management system?
Answer Options (Single choice) Response Percent Response Count
Yes 38,5% 10
No 61,5% 16
Other, please specify (i.e. is not integrated but they are linked): Free text 8
answered question 26
skipped question 0
In Q28 MSs could indicate whether their workflow tracking tool/system was integrated with the document management system. Ten MSs (38.5%) responded positively.
As compared to responses given in Q27, it was noted that integration of document management with workflow tracking was 57.1% among NCAs with a workflow tracking system covering all PV procedures, while it was 50% among agencies with partially implemented workflow tracking tools.
MSs had the opportunity to fine-tune their responses using the ‘Other’ comment field; 4 relevant responses were received: 2 of them indicating that integration was only partial (e.g. for marketing authorisation procedures including RMPs and safety
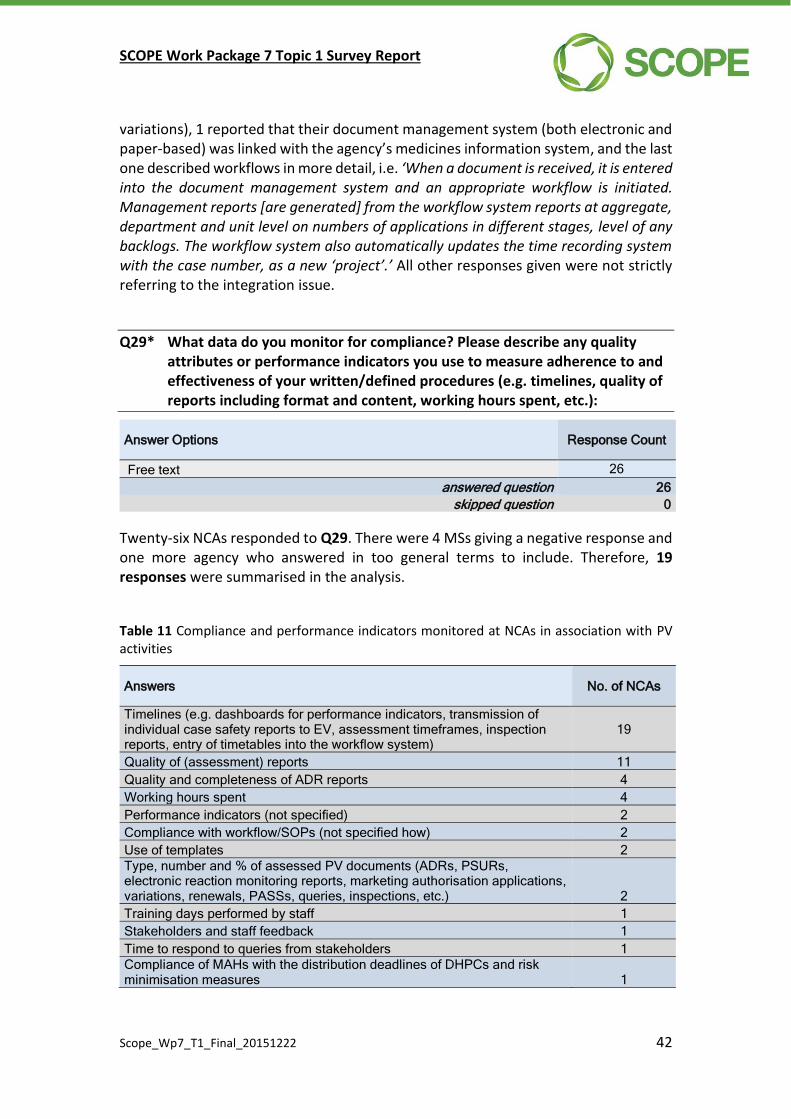
SCOPE Work Package 7 Topic 1 Survey Report
Scope_Wp7_T1_Final_20151222 42
variations), 1 reported that their document management system (both electronic and paper-based) was linked with the agency’s medicines information system, and the last one described workflows in more detail, i.e. ‘When a document is received, it is entered into the document management system and an appropriate workflow is initiated. Management reports [are generated] from the workflow system reports at aggregate, department and unit level on numbers of applications in different stages, level of any backlogs. The workflow system also automatically updates the time recording system with the case number, as a new ‘project’.’ All other responses given were not strictly referring to the integration issue.
Q29* What data do you monitor for compliance? Please describe any quality attributes or performance indicators you use to measure adherence to and effectiveness of your written/defined procedures (e.g. timelines, quality of reports including format and content, working hours spent, etc.):
Answer Options Response Count
Free text 26
answered question 26
skipped question 0
Twenty-six NCAs responded to Q29. There were 4 MSs giving a negative response and one more agency who answered in too general terms to include. Therefore, 19 responses were summarised in the analysis.
Table 11 Compliance and performance indicators monitored at NCAs in association with PV activities
Answers No. of NCAs
Timelines (e.g. dashboards for performance indicators, transmission of individual case safety reports to EV, assessment timeframes, inspection reports, entry of timetables into the workflow system)
19
Quality of (assessment) reports 11
Quality and completeness of ADR reports 4
Working hours spent 4
Performance indicators (not specified) 2
Compliance with workflow/SOPs (not specified how) 2
Use of templates 2
Type, number and % of assessed PV documents (ADRs, PSURs, electronic reaction monitoring reports, marketing authorisation applications, variations, renewals, PASSs, queries, inspections, etc.) 2
Training days performed by staff 1
Stakeholders and staff feedback 1
Time to respond to queries from stakeholders 1
Compliance of MAHs with the distribution deadlines of DHPCs and risk minimisation measures 1

SCOPE Work Package 7 Topic 1 Survey Report
Scope_Wp7_T1_Final_20151222 43
The two most commonly used attributes for compliance check are legally defined timelines (e.g. transmission of serious ADRs to EV and observing assessment timeframes) and the quality of reports (both assessment and ADR reports). On the third place, MSs monitor the working hours spent on a variety of PV activities. Further to these wide-spread indicators, MSs provided a wide variety of quality attributes or performance indicators. All of them will be given consideration when compiling the proposal for the deliverables of WP7 and are summarised in Table 11.
Q30* How do you monitor data? (E.g. by automated queries, statistics, manually, etc.)
Answer Options Response Count
Free text 26
answered question 26
skipped question 0
All MSs taking the survey responded to Q30. Three responses were excluded as they reported ‘Not applicable’ or the type of query was not indicated. Consequently, responses of 23 MSs were analysed and a summary is provided thereof in Table 12.
Table 12 Means of monitoring compliance and performance indicators at NCAs in association with PV activities
Answers No. of NCAs
Manual and automated queries 10
Only manual queries 8
Only automated queries 3
Statistics 4
No monitoring 1
As shown by the results, MSs are using both automated and manual queries, but manual queries are more wide-spread than automated ones. It has to be noted that automated techniques refer frequently to EV Data Analysis System queries, and MSs execute queries manually in their own systems. Therefore, the degree of automation may not be as high as suggestive from the graph above. No monitoring is in place in 1 MS.
Two MSs gave more detailed responses, e.g. use of a balanced score card and the availability of predefined automated queries with a wide selection criteria, which may be worth for further investigation.
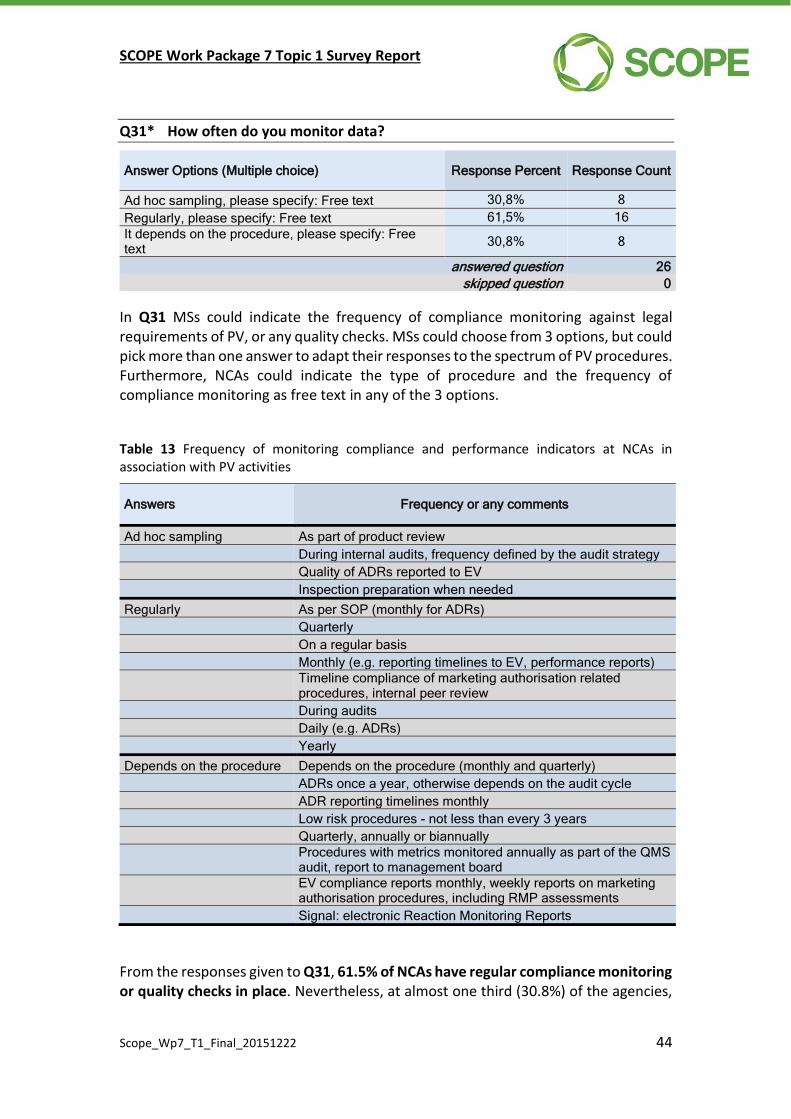
SCOPE Work Package 7 Topic 1 Survey Report
Scope_Wp7_T1_Final_20151222 44
Q31* How often do you monitor data?
Answer Options (Multiple choice) Response Percent Response Count
Ad hoc sampling, please specify: Free text 30,8% 8
Regularly, please specify: Free text 61,5% 16
It depends on the procedure, please specify: Free text
30,8% 8
answered question 26
skipped question 0
In Q31 MSs could indicate the frequency of compliance monitoring against legal requirements of PV, or any quality checks. MSs could choose from 3 options, but could pick more than one answer to adapt their responses to the spectrum of PV procedures. Furthermore, NCAs could indicate the type of procedure and the frequency of compliance monitoring as free text in any of the 3 options.
Table 13 Frequency of monitoring compliance and performance indicators at NCAs in association with PV activities
Answers Frequency or any comments
Ad hoc sampling As part of product review
During internal audits, frequency defined by the audit strategy
Quality of ADRs reported to EV
Inspection preparation when needed
Regularly As per SOP (monthly for ADRs)
Quarterly
On a regular basis
Monthly (e.g. reporting timelines to EV, performance reports)
Timeline compliance of marketing authorisation related procedures, internal peer review
During audits
Daily (e.g. ADRs)
Yearly
Depends on the procedure Depends on the procedure (monthly and quarterly)
ADRs once a year, otherwise depends on the audit cycle
ADR reporting timelines monthly
Low risk procedures - not less than every 3 years
Quarterly, annually or biannually
Procedures with metrics monitored annually as part of the QMS audit, report to management board
EV compliance reports monthly, weekly reports on marketing authorisation procedures, including RMP assessments
Signal: electronic Reaction Monitoring Reports
From the responses given to Q31, 61.5% of NCAs have regular compliance monitoring or quality checks in place. Nevertheless, at almost one third (30.8%) of the agencies,

SCOPE Work Package 7 Topic 1 Survey Report
Scope_Wp7_T1_Final_20151222 45
frequency of monitoring depends on the procedure itself and the same percentage of NCAs indicated that they applied ad hoc sampling in the monitoring procedure.
The fact that all MSs taking the survey responded despite that some NCAs had already indicated the lack of monitoring procedure may indicate that monitoring is done but is not documented.
When prompted to define frequency, very diverse responses were provided that are not easy to summarise in a systematic way. Twenty-three responses were analysed, as 3 contained no relevant information. The frequency of monitoring ranged from daily checks to annual, biannual or even less frequent controls (i.e. not less than every 3 years). Some MSs indicated that compliance checks are performed during audits, and low risk procedures are audited less frequently. Monthly check-ups were mentioned by most MSs followed by quarterly controls. Responses are summarised in Table 13.
Q32* How do you record the results of compliance checks?
Answer Options Response Count
Free text 26
answered question 26
skipped question 0
All MSs taking part in the survey responded, but 5 responses were not included in the analysis as they did not add any relevant information to the topic. Responses obtained from 21 NCAs are summarised in Table 14.
Table 14 Methods of recording compliance checks at NCAs in association with PV activities
Answers No. of NCAs
Report to Management Board, management reviews 6
Compliance reports 5
Audit reports 3
Agendas, minutes of meetings 3
Reports of non-compliance 2
Spreadsheets, tables 2
Annex in PV Manual, SOPs 2
Corrective action plans 1
Monitoring charts 1
Monthly performance indicator 1
Ad-hoc files, shared files 1
Dashboard with performance indicators 1
Performance reports 1
Presentations 1
Not recorded 1
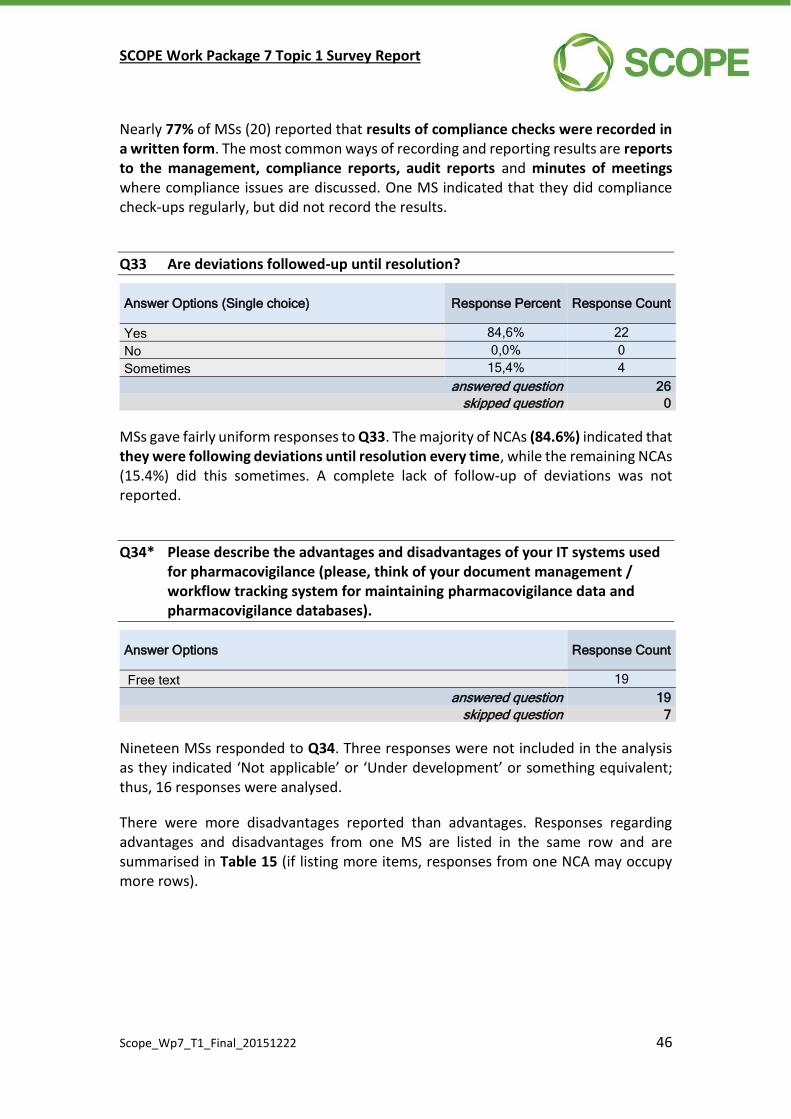
SCOPE Work Package 7 Topic 1 Survey Report
Scope_Wp7_T1_Final_20151222 46
Nearly 77% of MSs (20) reported that results of compliance checks were recorded in a written form. The most common ways of recording and reporting results are reports to the management, compliance reports, audit reports and minutes of meetings where compliance issues are discussed. One MS indicated that they did compliance check-ups regularly, but did not record the results.
Q33 Are deviations followed-up until resolution?
Answer Options (Single choice) Response Percent Response Count
Yes 84,6% 22
No 0,0% 0
Sometimes 15,4% 4
answered question 26
skipped question 0
MSs gave fairly uniform responses to Q33. The majority of NCAs (84.6%) indicated that they were following deviations until resolution every time, while the remaining NCAs (15.4%) did this sometimes. A complete lack of follow-up of deviations was not reported.
Q34* Please describe the advantages and disadvantages of your IT systems used for pharmacovigilance (please, think of your document management / workflow tracking system for maintaining pharmacovigilance data and pharmacovigilance databases).
Answer Options Response Count
Free text 19
answered question 19
skipped question 7
Nineteen MSs responded to Q34. Three responses were not included in the analysis as they indicated ‘Not applicable’ or ‘Under development’ or something equivalent; thus, 16 responses were analysed.
There were more disadvantages reported than advantages. Responses regarding advantages and disadvantages from one MS are listed in the same row and are summarised in Table 15 (if listing more items, responses from one NCA may occupy more rows).
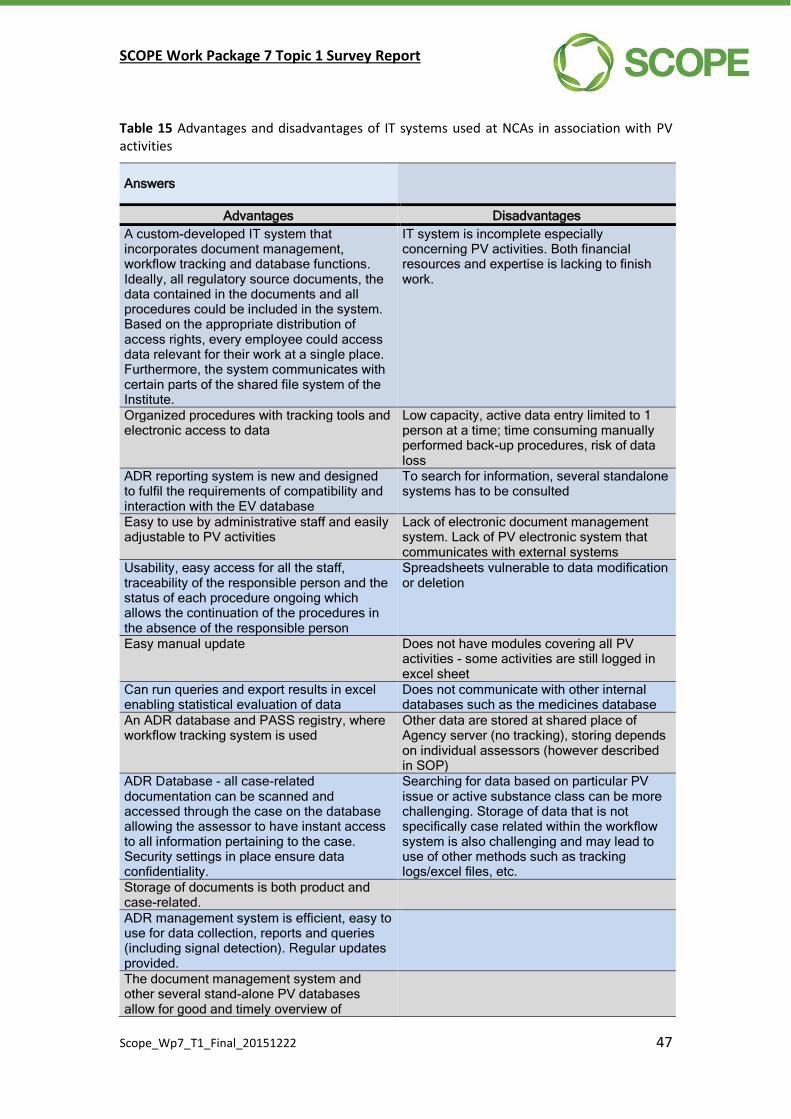
SCOPE Work Package 7 Topic 1 Survey Report
Scope_Wp7_T1_Final_20151222 47
Table 15 Advantages and disadvantages of IT systems used at NCAs in association with PV activities
Answers
Advantages Disadvantages
A custom-developed IT system that incorporates document management, workflow tracking and database functions. Ideally, all regulatory source documents, the data contained in the documents and all procedures could be included in the system. Based on the appropriate distribution of access rights, every employee could access data relevant for their work at a single place. Furthermore, the system communicates with certain parts of the shared file system of the Institute.
IT system is incomplete especially concerning PV activities. Both financial resources and expertise is lacking to finish work.
Organized procedures with tracking tools and electronic access to data
Low capacity, active data entry limited to 1 person at a time; time consuming manually performed back-up procedures, risk of data loss
ADR reporting system is new and designed to fulfil the requirements of compatibility and interaction with the EV database
To search for information, several standalone systems has to be consulted
Easy to use by administrative staff and easily adjustable to PV activities
Lack of electronic document management system. Lack of PV electronic system that communicates with external systems
Usability, easy access for all the staff, traceability of the responsible person and the status of each procedure ongoing which allows the continuation of the procedures in the absence of the responsible person
Spreadsheets vulnerable to data modification or deletion
Easy manual update Does not have modules covering all PV activities - some activities are still logged in excel sheet
Can run queries and export results in excel enabling statistical evaluation of data
Does not communicate with other internal databases such as the medicines database
An ADR database and PASS registry, where workflow tracking system is used
Other data are stored at shared place of Agency server (no tracking), storing depends on individual assessors (however described in SOP)
ADR Database - all case-related documentation can be scanned and accessed through the case on the database allowing the assessor to have instant access to all information pertaining to the case. Security settings in place ensure data confidentiality.
Searching for data based on particular PV issue or active substance class can be more challenging. Storage of data that is not specifically case related within the workflow system is also challenging and may lead to use of other methods such as tracking logs/excel files, etc.
Storage of documents is both product and case-related.
ADR management system is efficient, easy to use for data collection, reports and queries (including signal detection). Regular updates provided.
The document management system and other several stand-alone PV databases allow for good and timely overview of
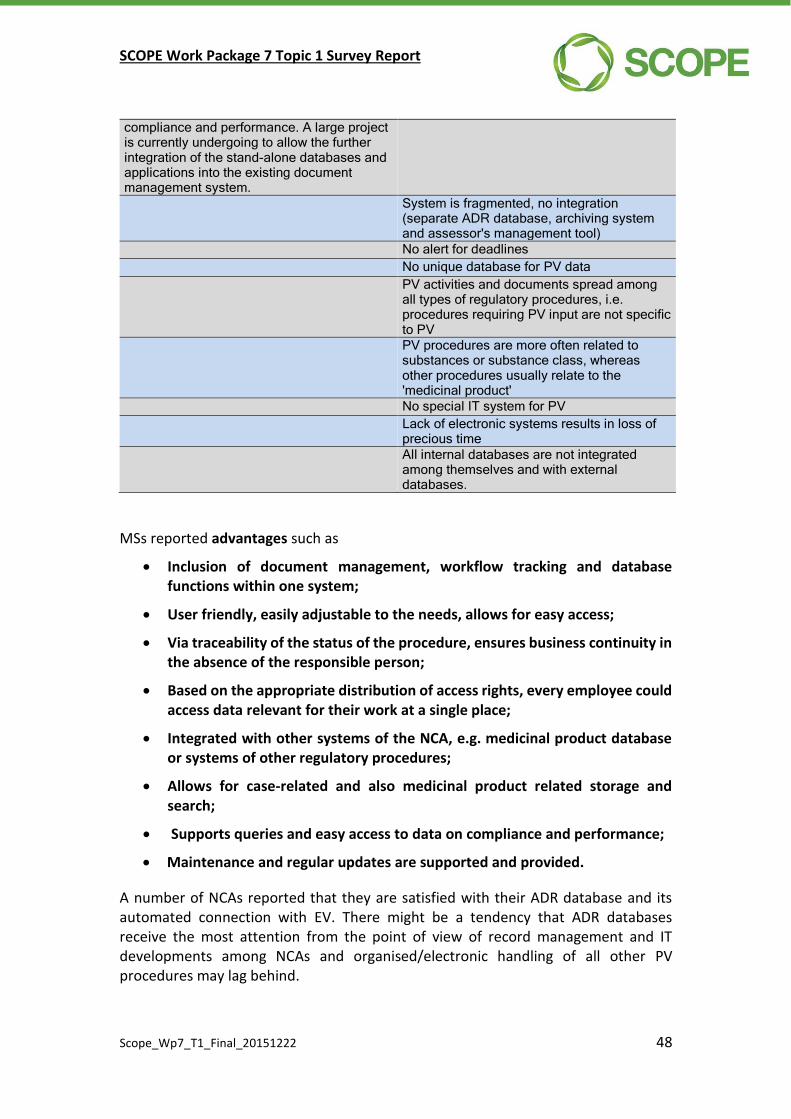
SCOPE Work Package 7 Topic 1 Survey Report
Scope_Wp7_T1_Final_20151222 48
compliance and performance. A large project is currently undergoing to allow the further integration of the stand-alone databases and applications into the existing document management system.
System is fragmented, no integration (separate ADR database, archiving system and assessor's management tool)
No alert for deadlines
No unique database for PV data
PV activities and documents spread among all types of regulatory procedures, i.e. procedures requiring PV input are not specific to PV
PV procedures are more often related to substances or substance class, whereas other procedures usually relate to the 'medicinal product'
No special IT system for PV
Lack of electronic systems results in loss of precious time
All internal databases are not integrated among themselves and with external databases.
MSs reported advantages such as
Inclusion of document management, workflow tracking and database functions within one system;
User friendly, easily adjustable to the needs, allows for easy access;
Via traceability of the status of the procedure, ensures business continuity in the absence of the responsible person;
Based on the appropriate distribution of access rights, every employee could access data relevant for their work at a single place;
Integrated with other systems of the NCA, e.g. medicinal product database or systems of other regulatory procedures;
Allows for case-related and also medicinal product related storage and search;
Supports queries and easy access to data on compliance and performance;
Maintenance and regular updates are supported and provided.
A number of NCAs reported that they are satisfied with their ADR database and its automated connection with EV. There might be a tendency that ADR databases receive the most attention from the point of view of record management and IT developments among NCAs and organised/electronic handling of all other PV procedures may lag behind.
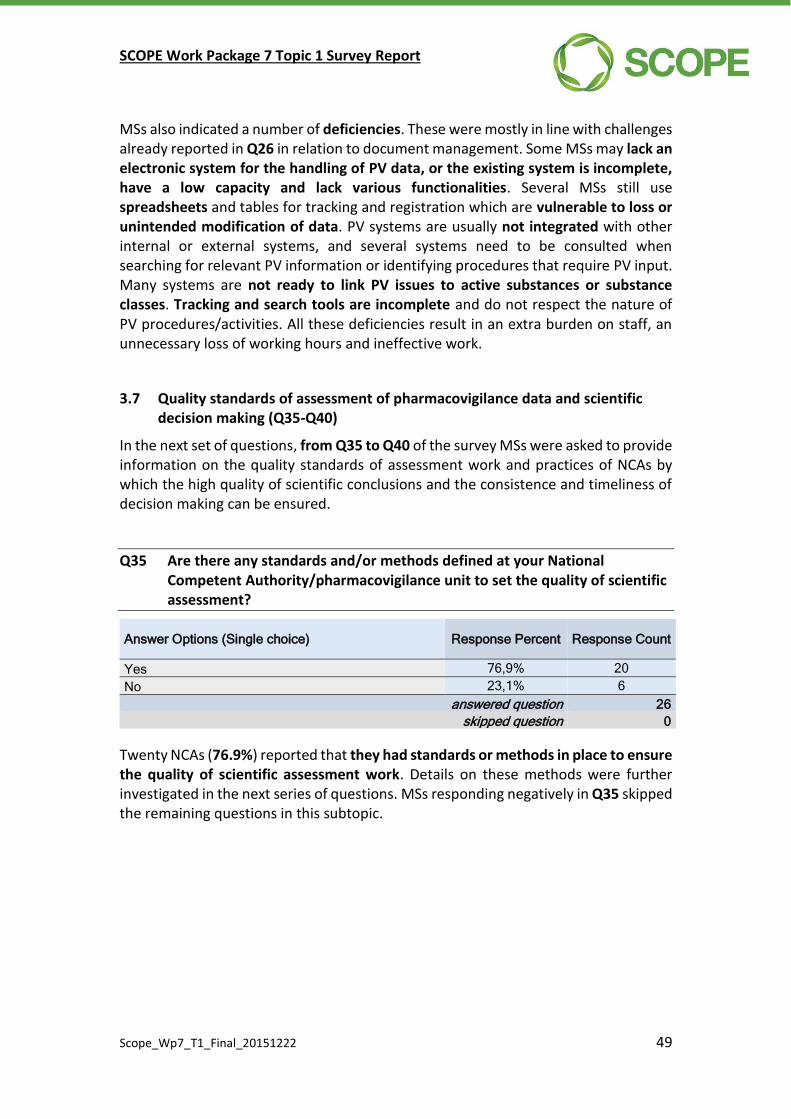
SCOPE Work Package 7 Topic 1 Survey Report
Scope_Wp7_T1_Final_20151222 49
MSs also indicated a number of deficiencies. These were mostly in line with challenges already reported in Q26 in relation to document management. Some MSs may lack an electronic system for the handling of PV data, or the existing system is incomplete, have a low capacity and lack various functionalities. Several MSs still use spreadsheets and tables for tracking and registration which are vulnerable to loss or unintended modification of data. PV systems are usually not integrated with other internal or external systems, and several systems need to be consulted when searching for relevant PV information or identifying procedures that require PV input. Many systems are not ready to link PV issues to active substances or substance classes. Tracking and search tools are incomplete and do not respect the nature of PV procedures/activities. All these deficiencies result in an extra burden on staff, an unnecessary loss of working hours and ineffective work.
3.7 Quality standards of assessment of pharmacovigilance data and scientific decision making (Q35-Q40)
In the next set of questions, from Q35 to Q40 of the survey MSs were asked to provide information on the quality standards of assessment work and practices of NCAs by which the high quality of scientific conclusions and the consistence and timeliness of decision making can be ensured.
Q35 Are there any standards and/or methods defined at your National Competent Authority/pharmacovigilance unit to set the quality of scientific assessment?
Answer Options (Single choice) Response Percent Response Count
Yes 76,9% 20
No 23,1% 6
answered question 26
skipped question 0
Twenty NCAs (76.9%) reported that they had standards or methods in place to ensure the quality of scientific assessment work. Details on these methods were further investigated in the next series of questions. MSs responding negatively in Q35 skipped the remaining questions in this subtopic.

SCOPE Work Package 7 Topic 1 Survey Report
Scope_Wp7_T1_Final_20151222 50
Q36 What are these standards? (Select all that apply)
Answer Options (Multiple choice) Response Percent Response Count
Assessment reports are delivered according to timelines
95,0% 19
Assessment report formats and content are in line with locally/internationally agreed guidance (e.g. templates)
95,0% 19
Assessment reports are in line with available scientific knowledge
95,0% 19
Assessment reports are reflecting on data presented in the dossier, submitted to or learned by the institute
95,0% 19
Assessment reports reflect on the questions, issues raised in the procedure and conclusions are presented in a clear, concise and logical manner
90,0% 18
Assessment reports are consistent with previous decisions concerning the same issue, or reflect upon previous decisions, and provide justification if opposing conclusions are reached
85,0% 17
Assessors are free from any interests in the given issue
95,0% 19
Any other criteria, please specify: Free text 0,0% 0
answered question 20
skipped question 6
In Q36, seven criteria were listed from which MSs could choose which were respected when conducting scientific assessment of PV data. Also, MSs were given the opportunity to complete the list with any other criteria they were using further to the aspects listed. From the responses it can be concluded that the majority of NCAs (16) have all 7 criteria in place, and only 4 MSs indicated partial deficiencies. The most critical aspects are consistency with previous decisions and presentation of conclusions reflecting upon the issues raised in the procedure in a clear, concise and logical manner. No other criteria were added by any of the responding MSs.
Q37** How is the implementation of these standards monitored? (Select all that apply)
Answer Options Response Percent Response Count
It is not monitored 0,0% 0
Peer review 80,0% 16
Review with all assessors of various disciplines concerned by the issue
70,0% 14
Review with external advisory groups 30,0% 6
Other, please specify: Free text 15,0% 3
answered question 20
skipped question 6
Peer review (80%) and review with all assessors concerned by a specific issue (e.g. reconciliation meetings) (70%) are common practice. Six NCAs (30%) indicated that
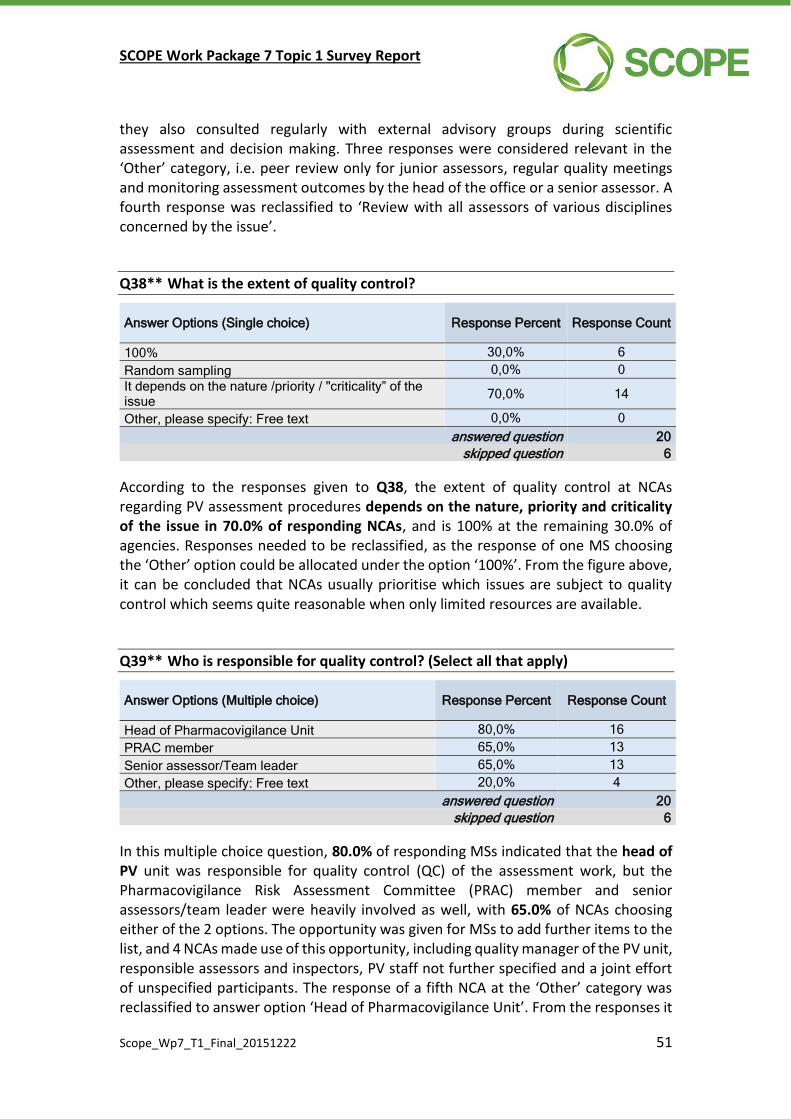
SCOPE Work Package 7 Topic 1 Survey Report
Scope_Wp7_T1_Final_20151222 51
they also consulted regularly with external advisory groups during scientific assessment and decision making. Three responses were considered relevant in the ‘Other’ category, i.e. peer review only for junior assessors, regular quality meetings and monitoring assessment outcomes by the head of the office or a senior assessor. A fourth response was reclassified to ‘Review with all assessors of various disciplines concerned by the issue’.
Q38** What is the extent of quality control?
Answer Options (Single choice) Response Percent Response Count
100% 30,0% 6
Random sampling 0,0% 0
It depends on the nature /priority / "criticality” of the issue
70,0% 14
Other, please specify: Free text 0,0% 0
answered question 20
skipped question 6
According to the responses given to Q38, the extent of quality control at NCAs regarding PV assessment procedures depends on the nature, priority and criticality of the issue in 70.0% of responding NCAs, and is 100% at the remaining 30.0% of agencies. Responses needed to be reclassified, as the response of one MS choosing the ‘Other’ option could be allocated under the option ‘100%’. From the figure above, it can be concluded that NCAs usually prioritise which issues are subject to quality control which seems quite reasonable when only limited resources are available.
Q39** Who is responsible for quality control? (Select all that apply)
Answer Options (Multiple choice) Response Percent Response Count
Head of Pharmacovigilance Unit 80,0% 16
PRAC member 65,0% 13
Senior assessor/Team leader 65,0% 13
Other, please specify: Free text 20,0% 4
answered question 20
skipped question 6
In this multiple choice question, 80.0% of responding MSs indicated that the head of PV unit was responsible for quality control (QC) of the assessment work, but the Pharmacovigilance Risk Assessment Committee (PRAC) member and senior assessors/team leader were heavily involved as well, with 65.0% of NCAs choosing either of the 2 options. The opportunity was given for MSs to add further items to the list, and 4 NCAs made use of this opportunity, including quality manager of the PV unit, responsible assessors and inspectors, PV staff not further specified and a joint effort of unspecified participants. The response of a fifth NCA at the ‘Other’ category was reclassified to answer option ‘Head of Pharmacovigilance Unit’. From the responses it

SCOPE Work Package 7 Topic 1 Survey Report
Scope_Wp7_T1_Final_20151222 52
is evident that quality control of scientific assessment work is usually not a single person responsibility, but a shared effort which also outlines the significance of high quality outputs.
Q40 Are there any procedures in place within your National Competent Authority to discuss with the PRAC member what position to represent in the Committee?
Answer Options (Single choice) Response Percent Response Count
Yes 85,0% 17
No 15,0% 3
answered question 20
skipped question 6
Eighty-five percent of MSs confirmed that they had a procedure in place to discuss with a PRAC member what position to represent at the Committee. Three member states do not have such procedure in place. Six member states skipped Q40, despite of the fact that this question was not in close logical relationship with the previous ones from Q35 to Q39. A negative response to Q35 does not necessarily imply that no procedure is in place to discuss and reconcile with the PRAC member. We assume that the questionnaire might have been ambiguous in this respect or responses to Q35 and Q40 are coinciding simply by chance. The first one seems to be more likely.
3.8 Impact analysis and continuous improvement (Q41-Q43)
In this section of the survey from Q41 to Q43 MSs were asked to share their experience and practices on activities related to continuous improvement of their PV systems and any impact analysis performed on actions or measures introduced concerning PV.
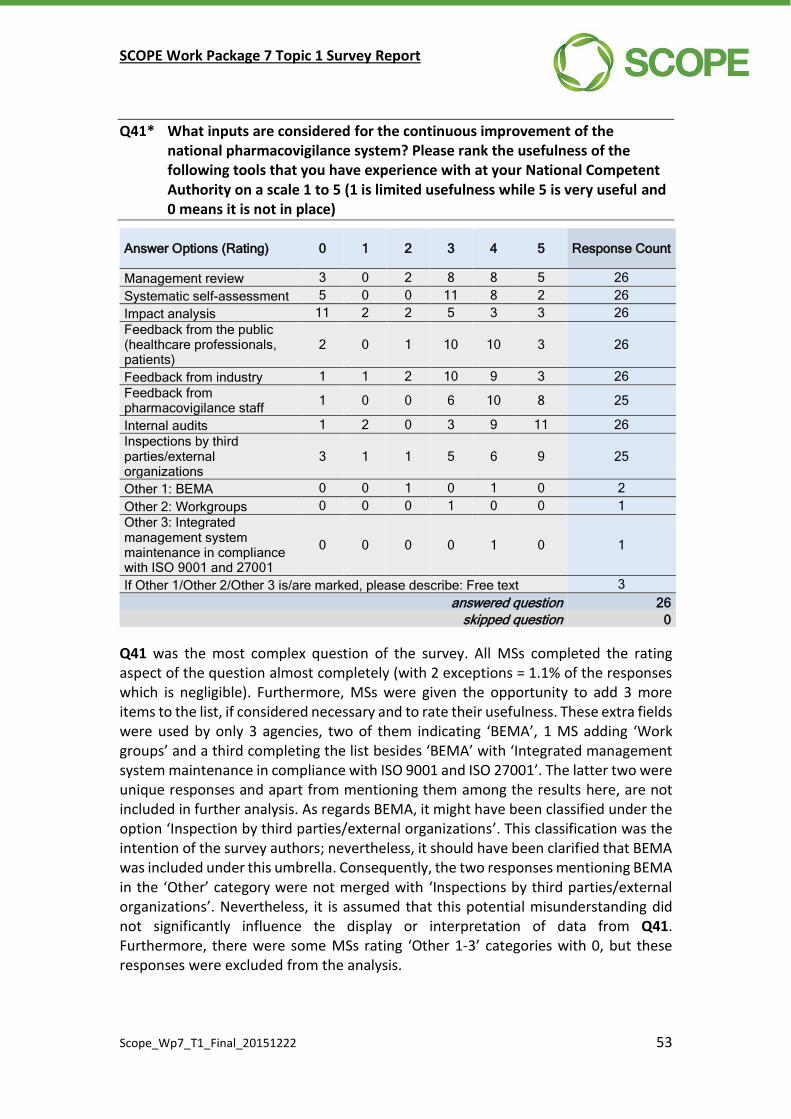
SCOPE Work Package 7 Topic 1 Survey Report
Scope_Wp7_T1_Final_20151222 53
Q41* What inputs are considered for the continuous improvement of the national pharmacovigilance system? Please rank the usefulness of the following tools that you have experience with at your National Competent Authority on a scale 1 to 5 (1 is limited usefulness while 5 is very useful and 0 means it is not in place)
Answer Options (Rating) 0 1 2 3 4 5 Response Count
Management review 3 0 2 8 8 5 26
Systematic self-assessment 5 0 0 11 8 2 26
Impact analysis 11 2 2 5 3 3 26
Feedback from the public (healthcare professionals, patients)
2 0 1 10 10 3 26
Feedback from industry 1 1 2 10 9 3 26
Feedback from pharmacovigilance staff
1 0 0 6 10 8 25
Internal audits 1 2 0 3 9 11 26
Inspections by third parties/external organizations
3 1 1 5 6 9 25
Other 1: BEMA 0 0 1 0 1 0 2
Other 2: Workgroups 0 0 0 1 0 0 1
Other 3: Integrated management system maintenance in compliance with ISO 9001 and 27001
0 0 0 0 1 0 1
If Other 1/Other 2/Other 3 is/are marked, please describe: Free text 3
answered question 26
skipped question 0
Q41 was the most complex question of the survey. All MSs completed the rating aspect of the question almost completely (with 2 exceptions = 1.1% of the responses which is negligible). Furthermore, MSs were given the opportunity to add 3 more items to the list, if considered necessary and to rate their usefulness. These extra fields were used by only 3 agencies, two of them indicating ‘BEMA’, 1 MS adding ‘Work groups’ and a third completing the list besides ‘BEMA’ with ‘Integrated management system maintenance in compliance with ISO 9001 and ISO 27001’. The latter two were unique responses and apart from mentioning them among the results here, are not included in further analysis. As regards BEMA, it might have been classified under the option ‘Inspection by third parties/external organizations’. This classification was the intention of the survey authors; nevertheless, it should have been clarified that BEMA was included under this umbrella. Consequently, the two responses mentioning BEMA in the ‘Other’ category were not merged with ‘Inspections by third parties/external organizations’. Nevertheless, it is assumed that this potential misunderstanding did not significantly influence the display or interpretation of data from Q41. Furthermore, there were some MSs rating ‘Other 1-3’ categories with 0, but these responses were excluded from the analysis.

SCOPE Work Package 7 Topic 1 Survey Report
Scope_Wp7_T1_Final_20151222 54
Items added in the ‘Other’ category (as being scarce in number) will not be included in the presentation of results and further analysis.
Figure 4 Tools in place at NCAs used as sources for continuous improvement of their PV systems
It was investigated whether the items listed in Q41 were in place at NCAs or not. Results are displayed in Figure 4. Most of the items are implemented in the majority of NCAs (80.8-96.1%). Impact analysis is the only tool that is used less frequently in NCAs (57.7%).
A graphical display of all the ratings is presented in Figure 5. Looking at the rating of each source of input average scores were calculated for every item, as presented in Figure 6. ‘Impact analysis’ received the lowest score (3.20±1.32), while ‘Feedback from pharmacovigilance staff’ and ‘Internal audit’ the highest (4.08±0.78 and 4.08±1.15, respectively). Nevertheless, it should be noted that differences were small, and are not significant even between the lowest and the highest values (concluding from the standard deviations calculated for each average score) and only some tendencies can be observed.
23
21
15
24
25
24
25
22
3
5
11
2
1
1
1
3
1
1
0 5 10 15 20 25
Management review
Systematic self-assessment
Impact analysis
Feedback from the public (healthcareprofessionals, patients)
Feedback from industry
Feedback from pharmacovigilance staff
Internal audits
Inspections by third parties/externalorganizations
In place Not in place Skipped
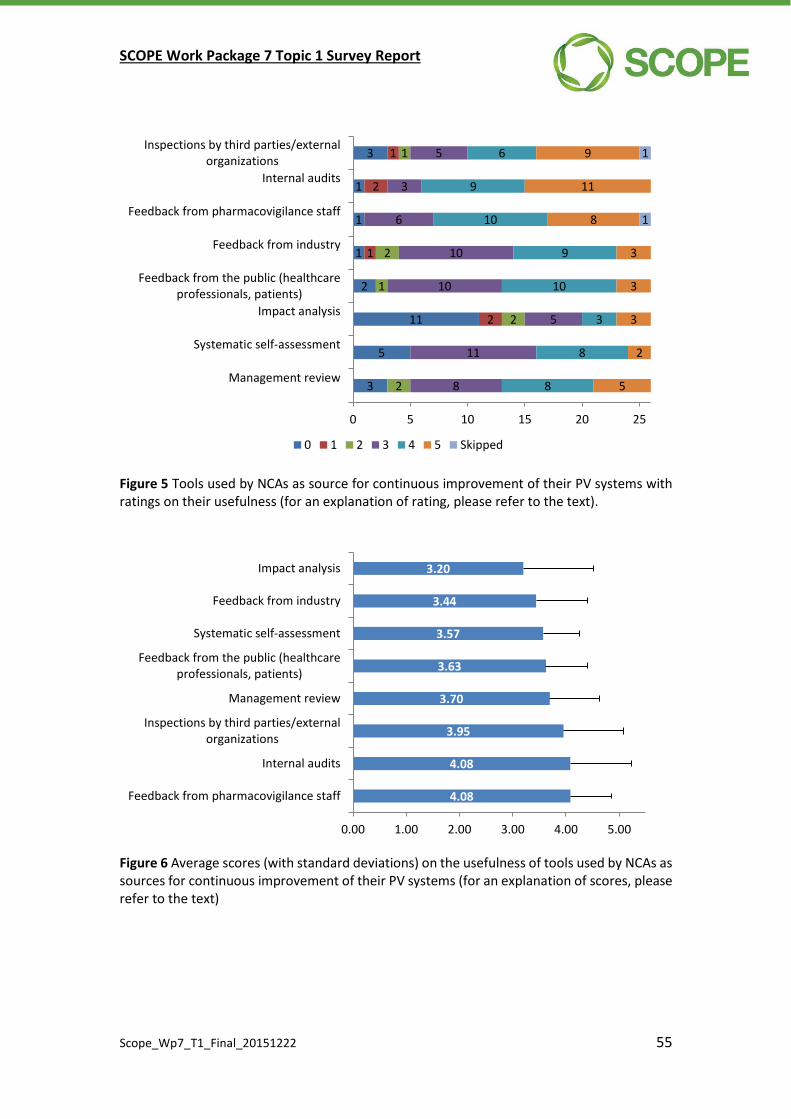
SCOPE Work Package 7 Topic 1 Survey Report
Scope_Wp7_T1_Final_20151222 55
Figure 5 Tools used by NCAs as source for continuous improvement of their PV systems with ratings on their usefulness (for an explanation of rating, please refer to the text).
Figure 6 Average scores (with standard deviations) on the usefulness of tools used by NCAs as sources for continuous improvement of their PV systems (for an explanation of scores, please refer to the text)
3
5
11
2
1
1
1
3
2
1
2
1
2
2
1
2
1
8
11
5
10
10
6
3
5
8
8
3
10
9
10
9
6
5
2
3
3
3
8
11
9
1
1
0 5 10 15 20 25
Management review
Systematic self-assessment
Impact analysis
Feedback from the public (healthcareprofessionals, patients)
Feedback from industry
Feedback from pharmacovigilance staff
Internal audits
Inspections by third parties/externalorganizations
0 1 2 3 4 5 Skipped
4.08
4.08
3.95
3.70
3.63
3.57
3.44
3.20
0.00 1.00 2.00 3.00 4.00 5.00
Feedback from pharmacovigilance staff
Internal audits
Inspections by third parties/externalorganizations
Management review
Feedback from the public (healthcareprofessionals, patients)
Systematic self-assessment
Feedback from industry
Impact analysis

SCOPE Work Package 7 Topic 1 Survey Report
Scope_Wp7_T1_Final_20151222 56
Q42* Are performance indicators defined to evaluate the overall effectiveness of the pharmacovigilance system?
Answer Options (Single choice) Response Percent Response Count
Yes 53,8% 14
No 46,2% 12
If Yes is marked: What are these? Please, list some examples and provide the frequency of monitoring. Free text
13
answered question 26
skipped question 0
Approximately half of the NCAs (53.8%) responding to Q42 indicated that they had performance indicators in place to evaluate the overall effectiveness of the operation of their PV systems. In case of a positive answer, MSs were prompted to give examples of such performance indicators. Three MSs did not specify any performance indicators, and were excluded from the analysis. As a consequence, 11 responses were included in the assessment.
Based on the responses given, an effective PV system operates in accordance with legally or internally defined timelines and efficiency may be indicated by the number of applications processed and approved or the percentage of applications assessed as compared to an initial plan. This approach may include a variety of PV documents, e.g. RMPs and safety variations as part of marketing authorisation applications, approval of risk minimisation measures and DHPCs, assessment and transmission of ADR reports to EV and other stakeholders, assessment of PSURs, PASS, etc. In case of ADR management, quality and completeness of reports are useful indicators, as assessed by external parties (EMA, WHO) with regular feedback provided to NCAs. Also, rate of ADR reporting per million inhabitants as compared to other EU MSs and changes in such rates may serve as useful indicators on the effectiveness of spontaneous reporting systems. Involvement in the EU network may be judged by the number of rapporteurships, or procedures managed as reference or lead MSs. Performance of the PV system may further be indicated by the number of non-compliance issues identified and also, whether corrective and preventive activities were put in place to eliminate and avoid future deficiencies, whether these actions were completed by predefined timelines and whether they were effective or not. Another important point is the continuous communication with stakeholders, e.g. the effectiveness of handling queries and complaints and the number of documents produced for the information or education of the public on drug safety issues.
The number of training days for staff may be indicative of an increment in expertise, while financial revenues achieved may allow for decisions on improvement, development or resource reallocation to maintain or improve the capacity and efficiency of the national PV system. For a summary of NCA responses, please refer to Table 16.
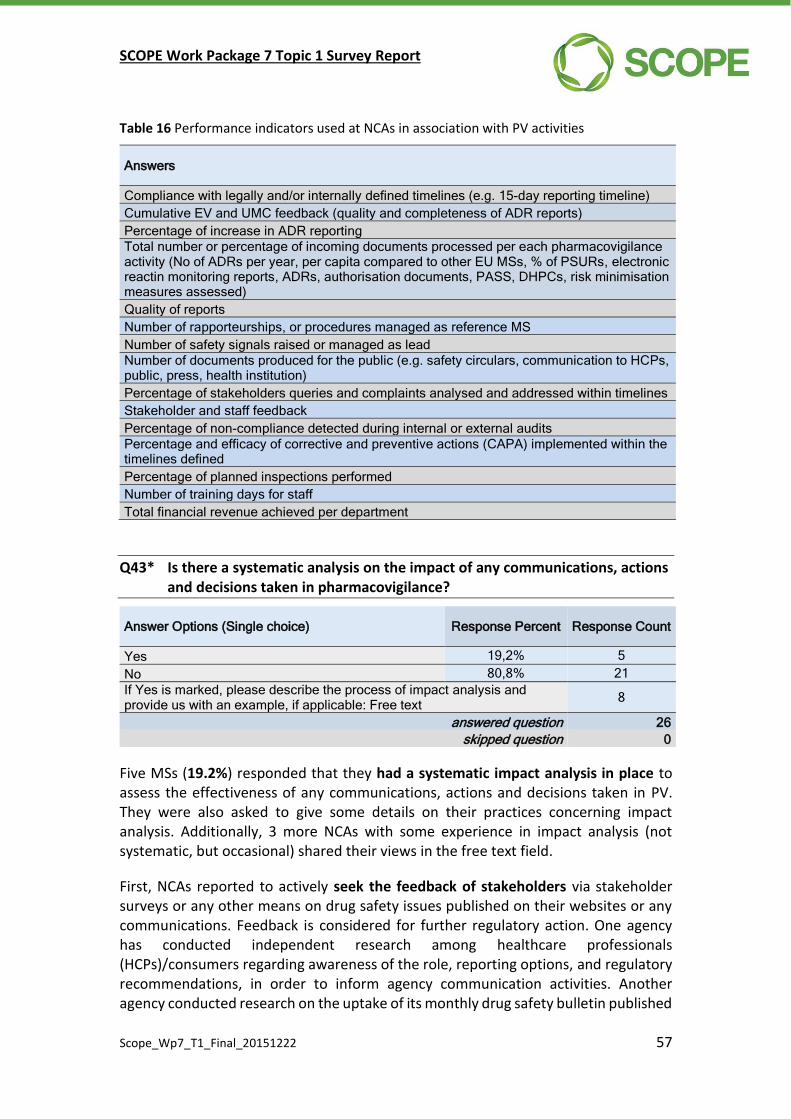
SCOPE Work Package 7 Topic 1 Survey Report
Scope_Wp7_T1_Final_20151222 57
Table 16 Performance indicators used at NCAs in association with PV activities
Answers
Compliance with legally and/or internally defined timelines (e.g. 15-day reporting timeline)
Cumulative EV and UMC feedback (quality and completeness of ADR reports)
Percentage of increase in ADR reporting
Total number or percentage of incoming documents processed per each pharmacovigilance activity (No of ADRs per year, per capita compared to other EU MSs, % of PSURs, electronic reactin monitoring reports, ADRs, authorisation documents, PASS, DHPCs, risk minimisation measures assessed)
Quality of reports
Number of rapporteurships, or procedures managed as reference MS
Number of safety signals raised or managed as lead
Number of documents produced for the public (e.g. safety circulars, communication to HCPs, public, press, health institution)
Percentage of stakeholders queries and complaints analysed and addressed within timelines
Stakeholder and staff feedback
Percentage of non-compliance detected during internal or external audits
Percentage and efficacy of corrective and preventive actions (CAPA) implemented within the timelines defined
Percentage of planned inspections performed
Number of training days for staff
Total financial revenue achieved per department
Q43* Is there a systematic analysis on the impact of any communications, actions and decisions taken in pharmacovigilance?
Answer Options (Single choice) Response Percent Response Count
Yes 19,2% 5
No 80,8% 21
If Yes is marked, please describe the process of impact analysis and provide us with an example, if applicable: Free text
8
answered question 26
skipped question 0
Five MSs (19.2%) responded that they had a systematic impact analysis in place to assess the effectiveness of any communications, actions and decisions taken in PV. They were also asked to give some details on their practices concerning impact analysis. Additionally, 3 more NCAs with some experience in impact analysis (not systematic, but occasional) shared their views in the free text field.
First, NCAs reported to actively seek the feedback of stakeholders via stakeholder surveys or any other means on drug safety issues published on their websites or any communications. Feedback is considered for further regulatory action. One agency has conducted independent research among healthcare professionals (HCPs)/consumers regarding awareness of the role, reporting options, and regulatory recommendations, in order to inform agency communication activities. Another agency conducted research on the uptake of its monthly drug safety bulletin published
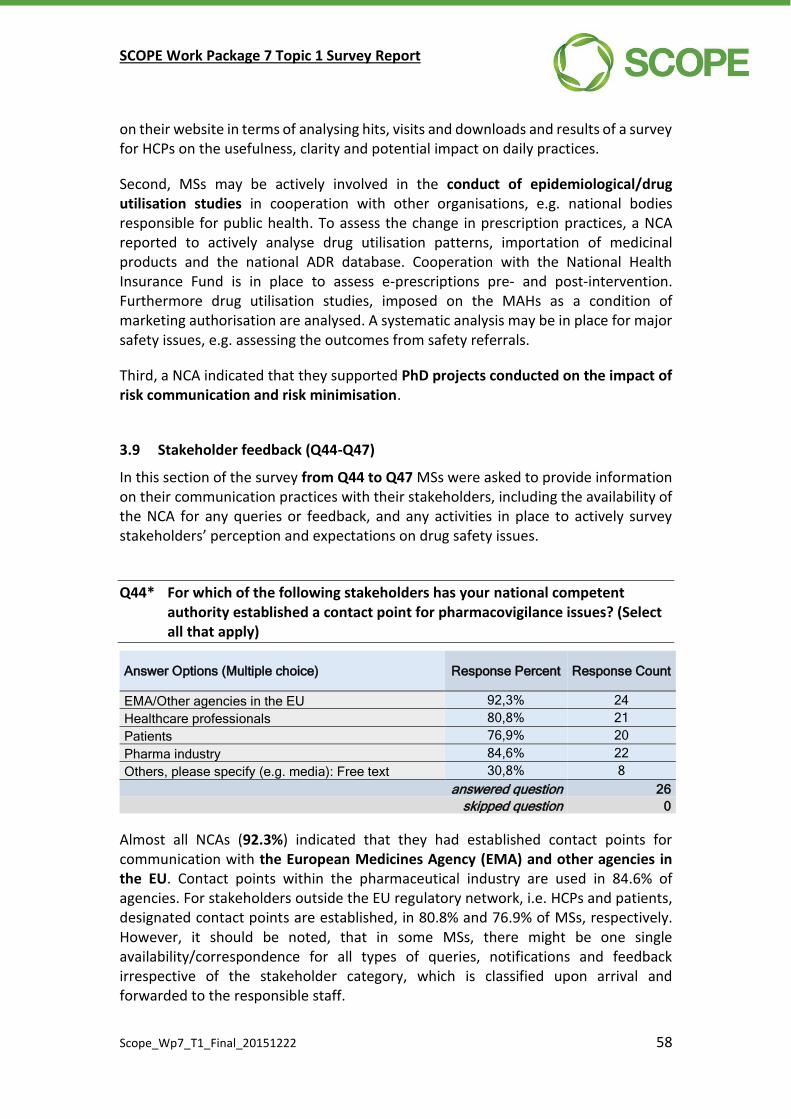
SCOPE Work Package 7 Topic 1 Survey Report
Scope_Wp7_T1_Final_20151222 58
on their website in terms of analysing hits, visits and downloads and results of a survey for HCPs on the usefulness, clarity and potential impact on daily practices.
Second, MSs may be actively involved in the conduct of epidemiological/drug utilisation studies in cooperation with other organisations, e.g. national bodies responsible for public health. To assess the change in prescription practices, a NCA reported to actively analyse drug utilisation patterns, importation of medicinal products and the national ADR database. Cooperation with the National Health Insurance Fund is in place to assess e-prescriptions pre- and post-intervention. Furthermore drug utilisation studies, imposed on the MAHs as a condition of marketing authorisation are analysed. A systematic analysis may be in place for major safety issues, e.g. assessing the outcomes from safety referrals.
Third, a NCA indicated that they supported PhD projects conducted on the impact of risk communication and risk minimisation.
3.9 Stakeholder feedback (Q44-Q47)
In this section of the survey from Q44 to Q47 MSs were asked to provide information on their communication practices with their stakeholders, including the availability of the NCA for any queries or feedback, and any activities in place to actively survey stakeholders’ perception and expectations on drug safety issues.
Q44* For which of the following stakeholders has your national competent authority established a contact point for pharmacovigilance issues? (Select all that apply)
Answer Options (Multiple choice) Response Percent Response Count
EMA/Other agencies in the EU 92,3% 24
Healthcare professionals 80,8% 21
Patients 76,9% 20
Pharma industry 84,6% 22
Others, please specify (e.g. media): Free text 30,8% 8
answered question 26
skipped question 0
Almost all NCAs (92.3%) indicated that they had established contact points for communication with the European Medicines Agency (EMA) and other agencies in the EU. Contact points within the pharmaceutical industry are used in 84.6% of agencies. For stakeholders outside the EU regulatory network, i.e. HCPs and patients, designated contact points are established, in 80.8% and 76.9% of MSs, respectively. However, it should be noted, that in some MSs, there might be one single availability/correspondence for all types of queries, notifications and feedback irrespective of the stakeholder category, which is classified upon arrival and forwarded to the responsible staff.
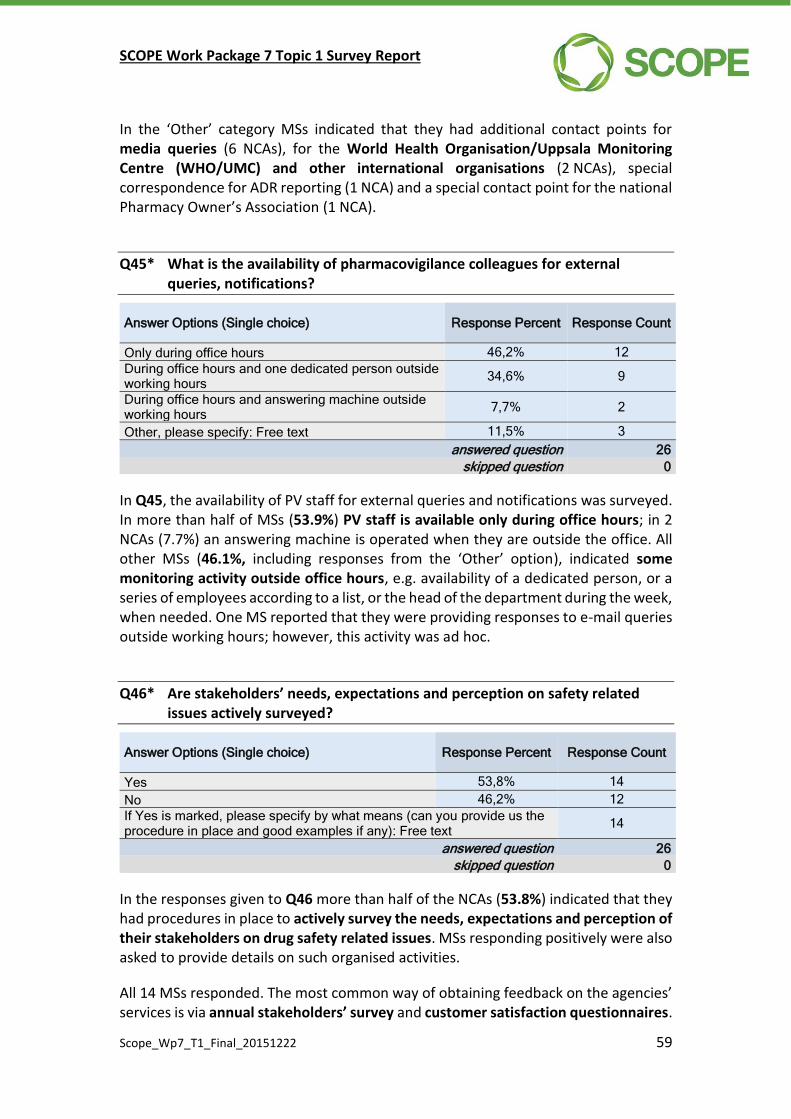
SCOPE Work Package 7 Topic 1 Survey Report
Scope_Wp7_T1_Final_20151222 59
In the ‘Other’ category MSs indicated that they had additional contact points for media queries (6 NCAs), for the World Health Organisation/Uppsala Monitoring Centre (WHO/UMC) and other international organisations (2 NCAs), special correspondence for ADR reporting (1 NCA) and a special contact point for the national Pharmacy Owner’s Association (1 NCA).
Q45* What is the availability of pharmacovigilance colleagues for external queries, notifications?
Answer Options (Single choice) Response Percent Response Count
Only during office hours 46,2% 12
During office hours and one dedicated person outside working hours
34,6% 9
During office hours and answering machine outside working hours
7,7% 2
Other, please specify: Free text 11,5% 3
answered question 26
skipped question 0
In Q45, the availability of PV staff for external queries and notifications was surveyed. In more than half of MSs (53.9%) PV staff is available only during office hours; in 2 NCAs (7.7%) an answering machine is operated when they are outside the office. All other MSs (46.1%, including responses from the ‘Other’ option), indicated some monitoring activity outside office hours, e.g. availability of a dedicated person, or a series of employees according to a list, or the head of the department during the week, when needed. One MS reported that they were providing responses to e-mail queries outside working hours; however, this activity was ad hoc.
Q46* Are stakeholders’ needs, expectations and perception on safety related issues actively surveyed?
Answer Options (Single choice) Response Percent Response Count
Yes 53,8% 14
No 46,2% 12
If Yes is marked, please specify by what means (can you provide us the procedure in place and good examples if any): Free text
14
answered question 26
skipped question 0
In the responses given to Q46 more than half of the NCAs (53.8%) indicated that they had procedures in place to actively survey the needs, expectations and perception of their stakeholders on drug safety related issues. MSs responding positively were also asked to provide details on such organised activities.
All 14 MSs responded. The most common way of obtaining feedback on the agencies’ services is via annual stakeholders’ survey and customer satisfaction questionnaires.
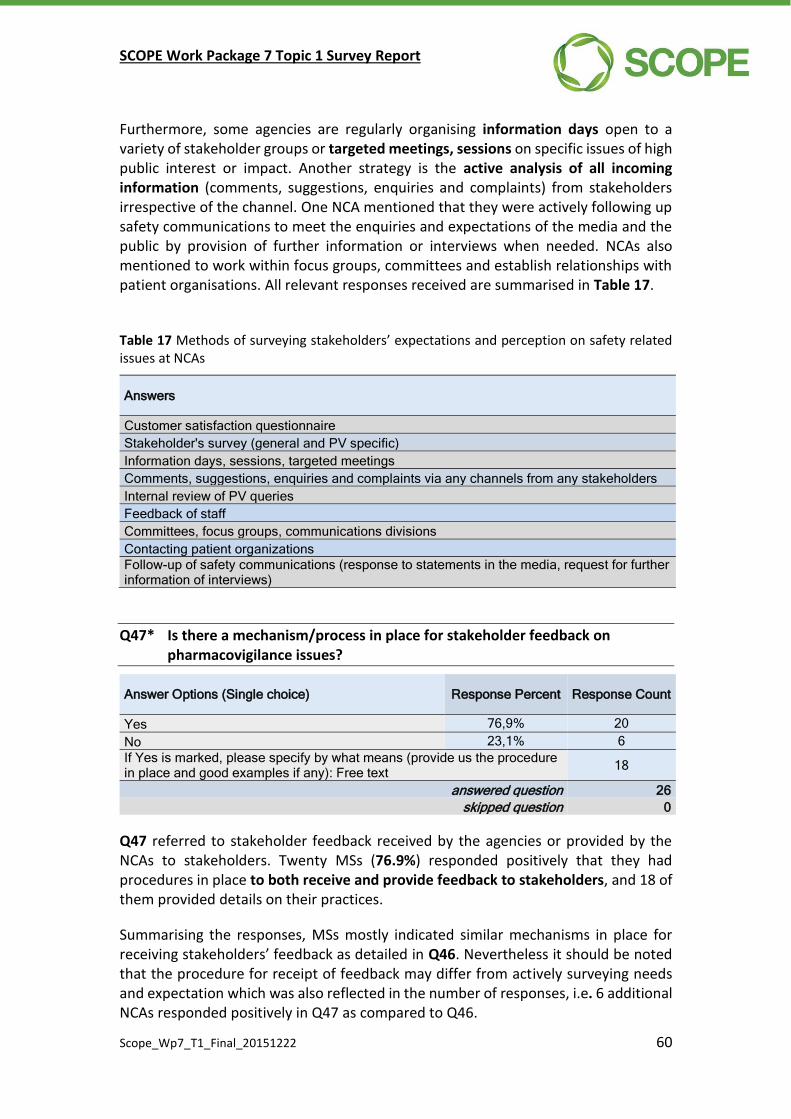
SCOPE Work Package 7 Topic 1 Survey Report
Scope_Wp7_T1_Final_20151222 60
Furthermore, some agencies are regularly organising information days open to a variety of stakeholder groups or targeted meetings, sessions on specific issues of high public interest or impact. Another strategy is the active analysis of all incoming information (comments, suggestions, enquiries and complaints) from stakeholders irrespective of the channel. One NCA mentioned that they were actively following up safety communications to meet the enquiries and expectations of the media and the public by provision of further information or interviews when needed. NCAs also mentioned to work within focus groups, committees and establish relationships with patient organisations. All relevant responses received are summarised in Table 17.
Table 17 Methods of surveying stakeholders’ expectations and perception on safety related issues at NCAs
Answers
Customer satisfaction questionnaire
Stakeholder's survey (general and PV specific)
Information days, sessions, targeted meetings
Comments, suggestions, enquiries and complaints via any channels from any stakeholders
Internal review of PV queries
Feedback of staff
Committees, focus groups, communications divisions
Contacting patient organizations
Follow-up of safety communications (response to statements in the media, request for further information of interviews)
Q47* Is there a mechanism/process in place for stakeholder feedback on pharmacovigilance issues?
Answer Options (Single choice) Response Percent Response Count
Yes 76,9% 20
No 23,1% 6
If Yes is marked, please specify by what means (provide us the procedure in place and good examples if any): Free text
18
answered question 26
skipped question 0
Q47 referred to stakeholder feedback received by the agencies or provided by the NCAs to stakeholders. Twenty MSs (76.9%) responded positively that they had procedures in place to both receive and provide feedback to stakeholders, and 18 of them provided details on their practices.
Summarising the responses, MSs mostly indicated similar mechanisms in place for receiving stakeholders’ feedback as detailed in Q46. Nevertheless it should be noted that the procedure for receipt of feedback may differ from actively surveying needs and expectation which was also reflected in the number of responses, i.e. 6 additional NCAs responded positively in Q47 as compared to Q46.
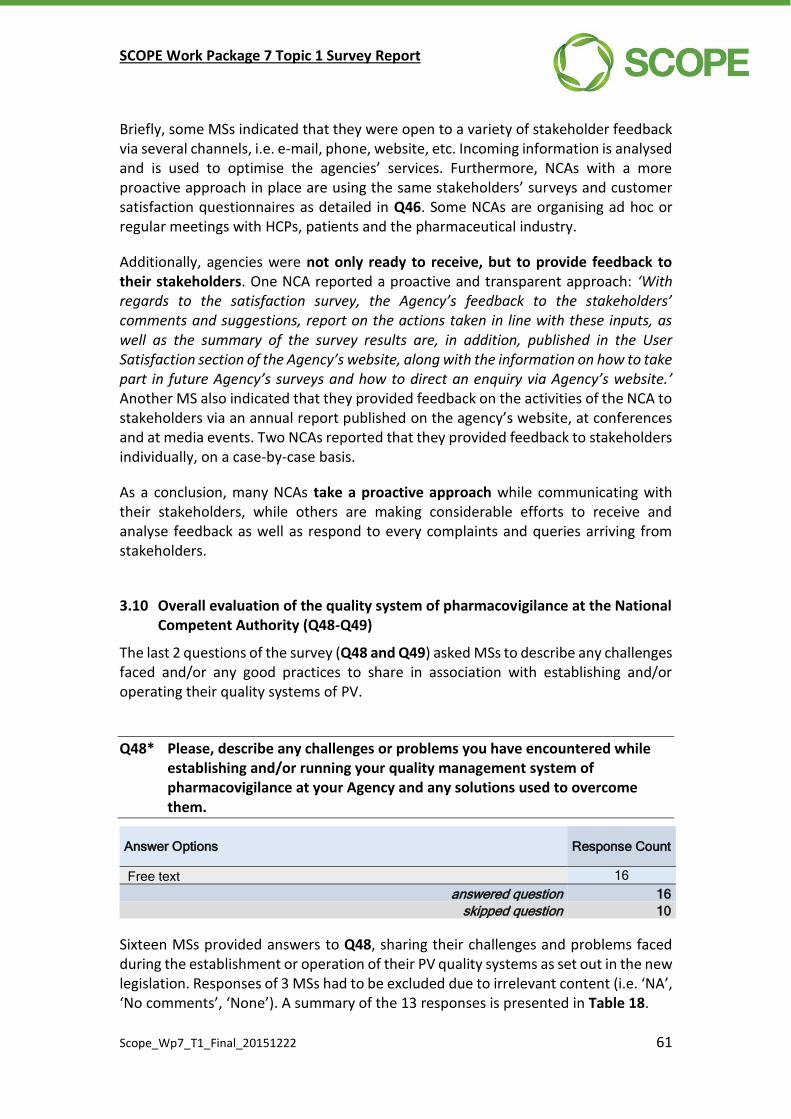
SCOPE Work Package 7 Topic 1 Survey Report
Scope_Wp7_T1_Final_20151222 61
Briefly, some MSs indicated that they were open to a variety of stakeholder feedback via several channels, i.e. e-mail, phone, website, etc. Incoming information is analysed and is used to optimise the agencies’ services. Furthermore, NCAs with a more proactive approach in place are using the same stakeholders’ surveys and customer satisfaction questionnaires as detailed in Q46. Some NCAs are organising ad hoc or regular meetings with HCPs, patients and the pharmaceutical industry.
Additionally, agencies were not only ready to receive, but to provide feedback to their stakeholders. One NCA reported a proactive and transparent approach: ‘With regards to the satisfaction survey, the Agency’s feedback to the stakeholders’ comments and suggestions, report on the actions taken in line with these inputs, as well as the summary of the survey results are, in addition, published in the User Satisfaction section of the Agency’s website, along with the information on how to take part in future Agency’s surveys and how to direct an enquiry via Agency’s website.’ Another MS also indicated that they provided feedback on the activities of the NCA to stakeholders via an annual report published on the agency’s website, at conferences and at media events. Two NCAs reported that they provided feedback to stakeholders individually, on a case-by-case basis.
As a conclusion, many NCAs take a proactive approach while communicating with their stakeholders, while others are making considerable efforts to receive and analyse feedback as well as respond to every complaints and queries arriving from stakeholders.
3.10 Overall evaluation of the quality system of pharmacovigilance at the National Competent Authority (Q48-Q49)
The last 2 questions of the survey (Q48 and Q49) asked MSs to describe any challenges faced and/or any good practices to share in association with establishing and/or operating their quality systems of PV.
Q48* Please, describe any challenges or problems you have encountered while establishing and/or running your quality management system of pharmacovigilance at your Agency and any solutions used to overcome them.
Answer Options Response Count
Free text 16
answered question 16
skipped question 10
Sixteen MSs provided answers to Q48, sharing their challenges and problems faced during the establishment or operation of their PV quality systems as set out in the new legislation. Responses of 3 MSs had to be excluded due to irrelevant content (i.e. ‘NA’, ‘No comments’, ‘None’). A summary of the 13 responses is presented in Table 18.
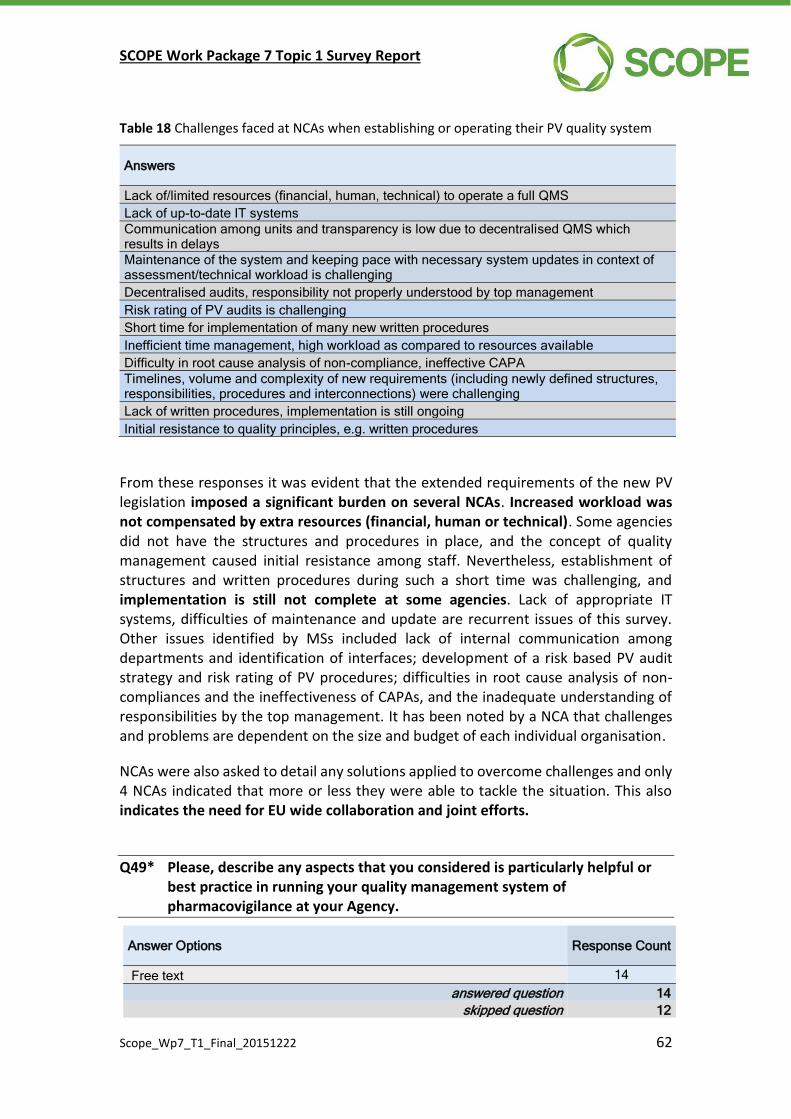
SCOPE Work Package 7 Topic 1 Survey Report
Scope_Wp7_T1_Final_20151222 62
Table 18 Challenges faced at NCAs when establishing or operating their PV quality system
Answers
Lack of/limited resources (financial, human, technical) to operate a full QMS
Lack of up-to-date IT systems
Communication among units and transparency is low due to decentralised QMS which results in delays
Maintenance of the system and keeping pace with necessary system updates in context of assessment/technical workload is challenging
Decentralised audits, responsibility not properly understood by top management
Risk rating of PV audits is challenging
Short time for implementation of many new written procedures
Inefficient time management, high workload as compared to resources available
Difficulty in root cause analysis of non-compliance, ineffective CAPA
Timelines, volume and complexity of new requirements (including newly defined structures, responsibilities, procedures and interconnections) were challenging
Lack of written procedures, implementation is still ongoing
Initial resistance to quality principles, e.g. written procedures
From these responses it was evident that the extended requirements of the new PV legislation imposed a significant burden on several NCAs. Increased workload was not compensated by extra resources (financial, human or technical). Some agencies did not have the structures and procedures in place, and the concept of quality management caused initial resistance among staff. Nevertheless, establishment of structures and written procedures during such a short time was challenging, and implementation is still not complete at some agencies. Lack of appropriate IT systems, difficulties of maintenance and update are recurrent issues of this survey. Other issues identified by MSs included lack of internal communication among departments and identification of interfaces; development of a risk based PV audit strategy and risk rating of PV procedures; difficulties in root cause analysis of non-compliances and the ineffectiveness of CAPAs, and the inadequate understanding of responsibilities by the top management. It has been noted by a NCA that challenges and problems are dependent on the size and budget of each individual organisation.
NCAs were also asked to detail any solutions applied to overcome challenges and only 4 NCAs indicated that more or less they were able to tackle the situation. This also indicates the need for EU wide collaboration and joint efforts.
Q49* Please, describe any aspects that you considered is particularly helpful or best practice in running your quality management system of pharmacovigilance at your Agency.
Answer Options Response Count
Free text 14
answered question 14
skipped question 12

SCOPE Work Package 7 Topic 1 Survey Report
Scope_Wp7_T1_Final_20151222 63
In the last question, MSs were asked to share their experiences on procedures, tools or techniques in association with the quality management of PV that they are proud of and consider as working well at their agencies. Fourteen answers were received, but 5 of them did not contain any relevant information and are not presented in Table 19. Consequently, 9 responses were included in the analysis.
Table 19 Good practices developed at NCAs when establishing or operating their PV quality system
Answers
Business continuity, risk management, communications, highly documented procedures, training, and development of a vigilance competency framework for PV scientists.
Prudence
Electronic document handling system
Regional Centres of PV linked to the Central National Agency, useful to patrol a large territory with many Hospitals and Health local units.
Maintenance of the Integrated Management System in compliance with ISO 9001 and ISO 27001 requirements is helpful for us.
Quality managers at each department that have at least quarterly meetings with the quality management division in order to discuss transversal issues and harmonized approaches to solve the problems and improve the QMS
ISO certification
Feedback to ADR reporter HCPs on the results of assessment, also accredited as part of the continuous professional education program
Education strategy to encourage and facilitate ADR reporting via workshops for HCPs and the pharmaceutical industry (over 90 workshops organised by the agency up till the present)
Public education program and campaign for patients on raising awareness on the importance of ADR reporting and reading the package leaflet. Results of these campaigns brought a stable and sustained increase in both HCP and patient reports.
Transparency towards and communication with learned societies and HCPs
Good examples were listed by MSs concerning both quality management and other areas of PV. The latter cases are not strictly within the scope of WP7; therefore, these good practices will not be analysed further. Quality systems established according to ISO principles were once again brought up, in line with the usefulness of ISO noted in the first part of the survey. Electronic document management, transparency and communications, cooperation with stakeholders and internal reconciliation among departments were mentioned, also referring back to previous sections of the questionnaire.
Responses provided by MSs were very brief, the reason for which might be that all good practices have already been detailed in other sections.
SCOPE Work Package 7 Topic 1 Survey Report
Scope_Wp7_T1_Final_20151222 64
4 Discussion of the results
4.1 Brief background on pharmacovigilance quality management in the EU
The new EU PV legislation sets out that ‘quality systems should form an integral part of the pharmacovigilance system [of marketing authorisation holders, national competent authorities and the European Medicines Agency] that are adequate and effective for the performance of their pharmacovigilance activities.’ [Quality systems] ‘should ensure that all pharmacovigilance activities are conducted in such a way that they are likely to produce the desired results or quality objectives for the fulfilment of pharmacovigilance tasks, as well as provide for an effective monitoring of compliance and an accurate and proper documentation of all measures taken.’11 ‘In order to harmonise the performance of the pharmacovigilance activities provided for [in the new legislation], the Commission adopted implementing measures to set the minimum requirements for the quality system for the performance of pharmacovigilance activities by the national competent authorities, the European Medicines Agency and the marketing authorisation holder’.12
In order to interpret the content of the new legislation, explain in detail and offer some technical help, EMA undertook the project of revising former guidance known as Volume 9A, to develop Guidelines on Good Pharmacovigilance Practices. GVP Module I offers guidance for MSs in the establishment and operation of PV quality systems.
At the time the new legislation was announced in the EU, NCAs were at different stages regarding the extent to which PV activities had already been pulled under the umbrella of quality management principles in their institutes. Therefore, new requirements resulted in varying degrees of burden on national agencies.
Well before the announcement of the new PV legislation, in 2004, the Heads of Medicines Agencies established an initiative called the Benchmarking of European Medicines Agencies (BEMA) ‘to contribute to the development of a world-class pharmaceutical regulatory system, based on a network of agencies, operating to best practice standards’. The BEMA exercise is based on the principles of quality and performance management and the methodology of assessment is in accordance with ISO 9004 (Managing for the sustained success of an organisation – A quality management approach). The benchmarking exercise includes self-assessment of NCAs against a set of questions from four selected areas, PV being one of them. Self-assessment is followed by a site visit and peer review of MS practices by specifically trained BEMA inspectors. Evaluation is performed against a set of predefined
11Commission Implementing Regulation (EU) No 520/2012 of 19 June 2012 on the performance of pharmacovigilance activities provided for in Regulation (EC) No 726/2004 of the European Parliament and of the Council and Directive 2001/83/EC of the European Parliament and of the Council
12Directive 2010/84/EU of the European Parliament and of the Council of 15 December 2010 amending, as regards pharmacovigilance, Directive 2001/83/EC on the Community code relating to medicinal products for human use
SCOPE Work Package 7 Topic 1 Survey Report
Scope_Wp7_T1_Final_20151222 65
performance indicators. BEMA facilitates agencies to identify strengths and weaknesses to set directions for further improvement.13 The third round of BEMA assessment started at the time of the new legislation entering into force and preparation for BEMA and the establishment of new and modification of existing PV activities might have run in parallel at a series of agencies with particularly beneficial outcomes. Although not an audit, preparation for BEMA visits and targeted questions from the self-assessment questionnaires and assessors may facilitate the improvement of PV activities including the operation of national PV quality systems.
Furthermore, to aid MSs to develop their audit strategies in line with the new requirements, PAFG was set up under the BEMA Steering Group. With a network perspective, PAFG had already performed a precious work by developing checklists for audit purposes in line with GVP Modules and a risk rating of core PV, management and support processes to determine the criticality of processes and to assign an audit frequency.14 Both the checklists and the risk rating method are offered to MSs for use and adjustment to their individual needs.
Despite of the enormous work performed by BEMA and PAFG at individual agencies and at the level of the network, NCAs may still struggle under the burden the new legislation imposed on them. SCOPE establishes a direct and voluntary collaboration among NCAs, a channel to communicate good practices and share expertise to overcome challenges and difficulties faced in a variety of PV activities. Topic 1 of WP7 aims at understanding the operation of national PV quality systems and offers a toolkit and training material to better understand quality management and maximise its efficiency in PV.
4.2 Interpretation of survey results and identification of areas of further investigation/development as regards the deliverables of WP7, Topic 1
4.2.1 Quality standards and a systematic approach to quality management (Q1-Q6)
Minimum requirements of the quality system for the performance of PV activities are laid down in EU law15 and detailed guidance is provided for MSs in GVP Module I. Although guidance on quality systems in GVP Module I is consistent with the general principles of the ISO 9000 Standards on good quality management practices,
13http://www.hma.eu/bema.html; downloaded: [2015/05/23]
14WGQM Pharmacovigilance Audit Facilitation Group: Guidance on Network Risk Ratings of
Pharmacovigilance Process Areas.
15Commission Implementing Regulation (EU) No 520/2012 of 19 June 2012 on the performance of
pharmacovigilance activities provided for in Regulation (EC) No 726/2004 of the European Parliament
and of the Council and Directive 2001/83/EC of the European Parliament and of the Council
SCOPE Work Package 7 Topic 1 Survey Report
Scope_Wp7_T1_Final_20151222 66
specifically the ISO 9001:2008 Standards on quality management systems16, the legislation does not impose any quality standards to follow in order to meet those requirements and seeking certification is a voluntary decision of NCAs. Some NCAs decided to follow available international standards to assist them in the development of their quality systems. As requirements set in the PV legislation and in the ISO principles for Quality Systems are similar; EU NCAs might have benefited from being aware of such principles in advance to the implementation of the new legislation.
Based on the above grounds, the first 5 questions of the survey aimed at exploring the potential impact of certification according to one or more quality standards agencies might have acquired and extended to their PV quality systems. Less than half of the NCAs (42.3%) indicated that they obtained such a certification (almost exclusively ISO 9001:2008) which was judged to be beneficial (by 90.9% of responding member states) when implementing the extended requirements of the new PV legislation. From the survey, a tendency has been observed that agencies working in accordance with ISO principles have the minimum quality system requirements implemented and as of today, have achieved a more mature state. However, it has to be noted that ISO principles may still be followed even in lack of a certification and its benefits can be exploited. For the basic principles of ISO 9001, please refer to the footnote17.
Furthermore, MSs were asked (Q6) to mention any other organised activities that were of help when drawing up a PV quality system. Any organised activity as a systematic approach to implementation was assumed to be helpful. A considerable number of agencies indicated that preparation for and participation in BEMA visits (78.3%) and internal audits (65.2%) were helpful for the implementation of quality principles in PV. Inevitable advantages the BEMA program offers for member states have already been outlined and discussed in Section 4.1 above. It is now mandatory to report on internal PV audits to the EC every 2 years. No doubt that this activity will be of considerable help to enhance the PV QMSs.
Areas identified for further investigation from the input of member states given in Q1 to Q6 are further justified that both working in line with ISO principles and the activities in association with the BEMA program were continuously recurring among the responses of NCAs as considerable examples of good practice. Based on the above,
16In September 2015, a revised version of ISO 9001 (i.e. ISO 9001:2015) has been released which replaces the previous 2008 version. 17ISO 9001:2008 specifies requirements for a quality management system where an organization
Needs to demonstrate its ability to consistently provide product that meets customer and applicable statutory and regulatory requirements, and
Aims to enhance customer satisfaction through the effective application of the system, including processes for continual improvement of the system and the assurance of conformity to customer and applicable statutory and regulatory requirements.
All requirements of ISO 9001:2008 are generic and are intended to be applicable to all organizations, regardless of type, size and product provided.
Source: http://www.iso.org/iso/catalogue_detail?csnumber=46486; downloaded: [2015/05/24]
SCOPE Work Package 7 Topic 1 Survey Report
Scope_Wp7_T1_Final_20151222 67
final deliverables of WP7 will take into consideration relevant ISO guidance, whenever this adds value.
Contribution to the deliverables of WP7
The toolkit and the training material will take advantage of the ISO principles and other international quality standards where applicable. WP7 will focus on presenting the subject in lay language with examples taken from the area of PV. Further efforts will be given to the investigation of current legislative requirements as regards quality and how ISO or other standards can contribute to achieve them. Practical examples or case studies will be collected from NCAs.
4.2.2 Quality management approach of pharmacovigilance (Q7-Q9)
In the next series of questions MSs could indicate the general approach of their agencies towards quality management of PV activities and implementation of QM in 7 core PV processes and application of the quality cycle (plan-do-check-act).
The most common approach towards quality management is a fully centralised system, which integrates all PV activities at the NCA. At some agencies, operation of a PV quality system may be more autonomous but needs to observe the global quality management policy of the institute or is completely decentralised. The less integrated the QMS of PV is, the more cumbersome is communication and cooperation across departments, resulting in difficulties in task completion.
An effective QMS is generally governed by a common global institutional approach, integrates all relevant processes of the organisation, interfaces and interdependencies, and relies on the support of the top management.
The Commission Implementing Regulation sets out that agencies shall run their PV quality systems with the following activities in place:
‘(a) quality planning: establishing structures and planning integrated and consistent processes;
(b) quality adherence: carrying out tasks and responsibilities in accordance with quality requirements;
(c) quality control and assurance: monitoring and evaluating how effectively the structures and processes have been established and how effectively the processes are being carried out;
(d) quality improvements: correcting and improving the structures and processes where necessary.’18
18Commission Implementing Regulation (EU) No 520/2012 of 19 June 2012 on the performance of pharmacovigilance activities provided for in Regulation (EC) No 726/2004 of the European Parliament and of the Council and Directive 2001/83/EC of the European Parliament and of the Council
SCOPE Work Package 7 Topic 1 Survey Report
Scope_Wp7_T1_Final_20151222 68
Quality management may be envisaged as a cycle of PLAN – DO – CHECK – ACT.19 Any ‘section’ of the cycle missing or operating defectively compromises the effective and efficient functioning of the whole system.
The majority of MSs taking the survey (76.9%) indicated that they had the full quality cycle implemented in the quality management of PV activities.
Concerning the 7 core PV activities (for the list, refer to Q9 of the Results/Findings section), MSs indicated that they had challenges in implementing quality principles for Signal management and the Management of post-authorisation safety and efficacy studies. These are relatively new obligations of the 2010 PV legislation, with completely new, significantly revised or extended requirements. Lacking expertise with these activities may result in a difficulty of establishing consistent structures and procedures; furthermore, with the limited resources available to NCAs, some MSs may find very difficult to allocate sufficient resources to these procedures.
On the other hand, well-established activities with considerable past experience, e.g. ADR management and Pharmacovigilance inspections are efficiently fit into the QMS.
Contribution to the deliverables of WP7
The concept and importance of the quality cycle will be presented in the training material. Furthermore, there will be items in the toolkit related to the quality cycle which will present case studies and good examples from NCA practices, e.g. planning, compliance and performance management.
4.2.3 Quality planning and definition of quality objectives (Q10-Q15)
In this section of the survey, practices of MSs on the quality planning procedure and the definition of any quality objectives were investigated.
When MSs were prompted to list some of their quality objectives, some discrepancies have been noted in the understanding of certain quality concepts (e.g. quality objectives, performance indicators and quality attributes used for controlling a procedure (compliance check). To deal with this different perception, information available to date has been searched and assessed.
The Commission Implementing Regulation, as already referred to in the previous section, defines quality planning as ‘establishing structures and planning integrated and consistent processes’. This definition of planning may be somewhat restrictive and extremely concise and may not reflect its real importance. GVP Module I is not more informative either: ‘A quality plan documents the setting of quality objectives and sets out the processes to be implemented to achieve them.’20 Nevertheless, it points to a
19http://9001quality.com/plan-do-check-act-pcda-iso-9001/ downloaded: [2015/06/01]
20Guideline on good pharmacovigilance practices: Module I – Pharmacovigilance systems and their quality systems EMA/541760/2011, 22 June 2012

SCOPE Work Package 7 Topic 1 Survey Report
Scope_Wp7_T1_Final_20151222 69
very important relationship between quality planning and the setting of quality objectives.
To have a better understanding of quality planning a search was performed. WebFinance Inc’s Business Dictionary states: [Quality planning is a] ‘systematic process that translates quality policy into measurable objectives and requirements, and lays down a sequence of steps for realizing them within a specified timeframe’.21 It is clear from the definition that a plan has to define the outputs/outcomes (objectives) to be delivered, the tasks and activities (i.e. a process) to be carried out and in what order to achieve the objectives and what timeframe is reasonable to achieve the desired outcome. The process itself should be documented in writing and its effectiveness checked. To complete the requirements mentioned in the definition, allocation of responsibilities, authority and resources is fundamental to the success of the planning process.22
Objectives are crucial to the planning process, as they represent the goals to be achieved in the form of measurable indicators. In ISO 9001, ‘quality objectives are used to determine conformity to (regulatory and customer) requirements, and facilitate effective deployment and improvement of the quality management system’.23
Translated to the language of PV, GVP Module I defines overall objectives of a PV system as:
‘complying with the legal requirements for pharmacovigilance tasks and responsibilities;
preventing harm from adverse reactions in humans arising from the use of authorised medicinal products within or outside the terms of marketing authorisation or from occupational exposure;
promoting the safe and effective use of medicinal products, in particular through providing timely information about the safety of medicinal products to patients, healthcare professionals and the public; and
contributing to the protection of patients’ and public health.’
Quality objectives can be set at various functional levels. Overall objectives may be broken down to each PV activity or process to establish measurable outcomes to check for performance and achievements. Nevertheless, quality objectives should always support the overall strategic plans and objectives of the organisation, and quality may be integrated into business strategies.
21http://www.businessdictionary.com/definition/quality-planning.html; downloaded: [2015/05/25]
22http://asq.org/learn-about-quality/quality-plans/index.html; downloaded: [2015/05/25]
23http://askartsolutions.com/quality-objectives.html downloaded: [2015/05/25]
SCOPE Work Package 7 Topic 1 Survey Report
Scope_Wp7_T1_Final_20151222 70
Quality management is an iterative activity, therefore, a plan should incorporate strategies for corrective actions and improvement, i.e. developing the next cycle of planning.
MSs with quality planning in place shared their experiences on their actual plans, on the inputs of the planning process, indicators used for monitoring the implementation and measuring effectiveness and feedback to correct and improve the (planning) process. Experienced NCAs demonstrated that besides the above detailed criteria of a successful planning process, plenty of other factors need to be consulted, e.g. external and internal influencing factors, interfaces and dependencies, budget and risk management.
As a conclusion, a planning process and definition of what has to be achieved is the first step of the quality cycle; thus successful operation of any of the PV processes is hardly imaginable without consistent planning and clear definition of objectives/anticipated outcomes/indicators. Although many MSs plan their targets of PV, the process of planning is very diverse and may seem ad hoc in certain cases. A clear and feasible methodology to plan, monitor, feedback and improve would be useful.
Contribution to the deliverables of WP7
Guidance on quality planning will be developed as an item in the toolkit, supported by case studies from MSs, where the planning process is well-established and functional. The placement of quality will be discussed in the context of strategic business planning processes and a breakdown of strategic goals into PV, will be highlighted.
Definitions of basic quality concepts (i.e. quality objectives, performance and compliance indicators) will be clarified in the training material.
4.2.4 Written procedures (Q16-Q19)
The Commission Implementing Regulation sets out that ‘all elements, requirements and provisions adopted for the quality system shall be documented in a systematic and orderly manner in the form of written policies and procedures, such as quality plans, quality manuals and quality records.’24
MSs were asked about their policies on the creation, maintenance and update of written procedures. Responses pointed towards a high degree of documented PV activities among responding NCAs. Among the written procedures the use of a Quality Manual to document PV activities is not a common practice. Written PV procedures are usually developed by staff with a PV background who are directly involved in the given process. More than 60% of MSs also indicated that staff from a quality management background is also involved in the development of written procedures.
24Commission Implementing Regulation (EU) No 520/2012 of 19 June 2012 on the performance of pharmacovigilance activities provided for in Regulation (EC) No 726/2004 of the European Parliament and of the Council and Directive 2001/83/EC of the European Parliament and of the Council
SCOPE Work Package 7 Topic 1 Survey Report
Scope_Wp7_T1_Final_20151222 71
Teamwork of various disciplines is not as widespread; of note, a process approach and the identification of interfaces most probably requires the collaboration of experts from various disciplines to determine how the procedure should be developed. All MSs having written procedures are monitoring changes in the legal environment to adapt procedures as fast as possible; additionally, monitoring compliance issues and the appropriateness of the established procedures are also common inputs to updates.
To refer back to site visits, one NCA indicated that although quality documents are reviewed and revised from time-to-time to reflect changes in legal environment and regulatory guidelines, information overload represents a key challenge; therefore, prioritisation is needed to keep the most important procedures up-to-date. Nevertheless, prioritisation criteria are not well established. Additionally, the level of documentation has also been debated, as putting everything in writing can make structures and processes too rigid and may thwart the adaptation of written procedures in a rapidly changing environment and ultimately hinder work if unexpected circumstances evolve. Therefore, documentation should be limited to an extent that allows for flexibility and a use of common sense. This is also in line with ISO principles, stating that documentation must be limited to important issues, and must be kept as simple and straightforward as possible.
Contribution to the deliverables of WP7
A PV Quality Manual Template will be developed as an item of the quality toolkit. A PV Quality Manual is suitable to summarise the PV relevant aspects of quality management, refer to special PV procedures and indicate the relationship and place of PV in the organisational matrix.
Furthermore, a section on written procedures will be assembled in the training material, emphasising process based approach and a simple, straightforward documentation.
4.2.5 IT systems – Document management and structured storage of data (Q20-Q26)
Document management ensures that all NCA records arriving at, or leaving the agency, as well as all relevant internal documents generated, are registered and stored in a way that such records are available or retrievable until retention times defined in the legislation. It also ensures that relevant steps of decision making are documented and tracked and that all evidence is retained for every decision made. Thus, document management is strongly linked to tracking functionalities.
GVP Module I outlines that ‘A record management system shall be put in place for all documents used for pharmacovigilance activities, ensuring their retrievability as well as traceability of the measures taken to investigate safety concerns, of the timelines
SCOPE Work Package 7 Topic 1 Survey Report
Scope_Wp7_T1_Final_20151222 72
for those investigations and of decisions on safety concerns, including their date and the decision-making process’.25
As suggested in Q24 of the survey, the record management system should ensure:
Receiving and recording of all documents/information from stakeholders and generated internally;
Completeness, accuracy and integrity of records;
Traceability of decisions taken (date, assessment process, responsible staff, justification);
Timely and controlled access to pharmacovigilance records;
Protection of personal and confidential data;
Safe retention of data until timelines defined by the legislation.
Databases are used for the structured storage and easy retrieval of certain predefined pieces of information contained in records. Database storage facilitates search through a huge amount of records meaning that users do not have to look at all records one by one, thus enabling the establishment of links among data and documents in one or numerous types of PV activities.
In their survey responses MSs indicated, that the management of PV documents, including receiving, recording, tracking, storage and archival imposed significant burden. Among the reasons for the difficulties the following were included:
Lack of appropriate IT systems or limited functionalities of existing systems;
High volumes of incoming PV documents via a variety of channels;
Lack of expertise in proper classification of PV records, linking them to the appropriate procedure and monitoring the outcome or the fulfilment of measures imposed on MAHs;
Challenges of adapting active-substance focused PV procedures to medicinal product-based record and database management; and
Concerns raised on long term data integrity with simpler methods, such as spreadsheets.
It is also of concern that databases are usually not connected or integrated to one another, and MSs are lacking powerful techniques or systems to link data for easy and efficient search.
There are quite a few agencies with fully functional electronic document management systems including all PV data and automated tracking function. Simpler methods such as spreadsheets and tables are used most commonly both for record management
25Guideline on good pharmacovigilance practices: Module I – Pharmacovigilance systems and their quality systems EMA/541760/2011, 22 June 2012
SCOPE Work Package 7 Topic 1 Survey Report
Scope_Wp7_T1_Final_20151222 73
and for structured storage of PV data. This approach is useful but may lack several advantages that real database storage could offer, further to the concerns of access control and risk of unintended data modification.
More than half of the responding NCAs indicated some degree of deficiencies with regards to the basic (and above listed) criteria of record management, which may be considered as a serious issue, as loss or inappropriate tracking or retrieval of documents may undermine timely and consistent decision making.
Given the diversity of NCAs size, availability of resources, and expertise, a standardised approach to record management systems may not be appropriate. Gathering possible solutions of reliable techniques and methods of record management including both simpler and more complex methods could allow NCAs to choose solutions most suited to their size, budget and resources. Nevertheless, consideration should be given to how a system, irrespective of its complexity, may observe basic quality principles during operation.
Finally, some degree of discrepancy was noted on what record management, workflow tracking and databases meant among the respondents. A clear description of these concepts will be provided in the final deliverables of WP7.
Contribution to the deliverables of WP7
Basic concept and minimum requirements of record management with examples from PV (e.g. case studies) will be developed as a toolkit item including document management, workflow tracking and database storage. Concepts will be clarified in the training material.
4.2.6 Workflow tracking and compliance management (Q27-Q34)
A comprehensive definition of workflow management/tracking is as follows:
‘A workflow describes the movement of documents or tasks through a sequence of processing steps during which work is performed on the content. It is the operational aspect of a work procedure and controls the way that tasks are structured. It also determines where and who performs them, and in what order. The synchronization of tasks might be controlled with auxiliary information flowing in to support the activity. The system tracks the work as it is done, and a journal of who did what, as well as when and how they did it, is maintained. The information recorded in the journal may be analysed later on to calculate throughput as a measurable value.’26
Besides capturing and storing all documents coming in or going out from an organisation, and structuring and linking content for easy search and retrieval, incoming information should generally go through an assessment process which
26http://searchdatamanagement.techtarget.com/feature/Developing-quality-metadata-and-
designing-workflow; downloaded: [2015/05/28]

SCOPE Work Package 7 Topic 1 Survey Report
Scope_Wp7_T1_Final_20151222 74
outputs in decisions, actions, and measures to be taken. This procedure is summarised in the concept of a workflow. In line with the definition provided above, workflows need to be strongly controlled to produce high quality outputs and to reach the desired outcome.
The workflow management system should feature:
An order of steps to be completed during the process, responsibilities and timelines are defined;
Integration of interrelated procedures are established;
A display of status of tasks/documents, and alerts for deadlines in place;
Tracking of work performed by logging key events with date and author;
Indicators that measure control and performance;
Queries and statistics on the work performed that allow analysis of compliance and performance/throughput.
From the responses of MSs given to questions on workflow management, it could be concluded that a fully functional workflow tracking tool or system for all PV processes was uncommon among MSs (26.9%). Partial solutions are more widespread (46.2%), although some NCAs (26.9%) do not have a workflow tracking system in place. Integration of the workflow tracking tool with document management is present in slightly more than half of the surveyed NCAs with a complete or partial tracking system in place.
Compliance and performance management are tightly coupled to workflow management/tracking as data feeding in such activities derives from the workflow by recording and evaluating pre-defined indicators of effectiveness and quality.
NCAs were asked to provide information on the most commonly monitored quality attributes in association with PV activities. The top three answers indicated the monitoring of (1) legally defined timelines, (2) the quality and completeness of assessment and ADR reports, and (3) working hours spent on each activity. Here, we encountered the difficulty of distinguishing between compliance and performance indicators; the former providing information on observation of legally or otherwise defined requirements while the latter is indicating the effectiveness of work performed, establishment of structures and the conduct of activities. These concepts are linked but do not have the same content.27 Taking the example from the report, working hours spent to solve a task may be indicative of the performance of the
27Compliance management ensures that activities of an organisation are in accordance with guidelines, regulations and/or legislation.
Performance management includes activities which ensure that goals are consistently being met in an effective and efficient manner.
Source: http://en.wikipedia.org/wiki/Performance_management; downloaded: [2015/05/28]
SCOPE Work Package 7 Topic 1 Survey Report
Scope_Wp7_T1_Final_20151222 75
system than the compliance with guidelines or any written procedures. Further examples can be found at the Results section of this report. As a conclusion, clear definitions on compliance and performance management, as well as indicators for both activities will be defined among the deliverables of WP7.
In Q42 of the survey, MSs were asked whether they were using any performance indicators28 to evaluate the overall effectiveness of the operation of their PV systems. More than half of the NCAs responded positively and confirmed the application of performance indicators and gave further examples on the type of performance indicators they were using.
MSs indicated that data monitoring for compliance and performance checks were conducted both via manual and automated queries, with manual methods prevailing over automated techniques. Two MSs gave more detailed responses on the use of queries suggestive of good practices (e.g. use of a balanced score card and the availability of predefined automated queries with a wide selection criteria) which may be worth further investigation.
Frequency of compliance (and performance) checks varied on a wide spectrum. Considerable variance observed may be explained by the fact that the frequency of compliance checks may be dependent on the characteristics of each process and activity. Still, emphasis should be laid on the periodicity of monitoring which depends on how stable the process is and the controls already in place. On the other hand, performance measurements are more valuable for evaluation of the effectiveness of the process and at what cost.
Results of QC are usually documented in writing (in 77% of MSs), most commonly in reports to the management or internal audit reports. All responding MSs indicated that there were some degree of CAPA put in place and followed up until resolution of deficiencies. This CAPA procedure was fully functional in 84.6% of MSs.
Many MSs are satisfied with their ADR database and its automated connection with EV via Gateway. Due to the long history and experience accumulated with ADR reporting, this area may be more developed, even from the aspect of IT solutions applied in record and compliance management, and handling of other PV activities may lag behind. Additionally, it is of note that the EMA supports NCAs in the implementation of legislative requirements on ADR reporting, which emphasises the importance of EU wide collaborations.
28A performance indicator or key performance indicator (KPI) is a type of performance measurement. KPIs evaluate the success of an organization or of a particular activity in which it engages. Often success is simply the repeated, periodic achievement of some levels of operational goal (e.g. zero defects, 10/10 customer satisfaction, etc.), and sometimes success is defined in terms of making progress toward strategic goals. Accordingly, choosing the right KPIs relies upon a good understanding of what is important to the organization.’
Source: http://en.wikipedia.org/wiki/Performance_indicator; downloaded: [2015/05/29]

SCOPE Work Package 7 Topic 1 Survey Report
Scope_Wp7_T1_Final_20151222 76
In conclusion, IT systems are fundamental in managing documents, tracking workflow and storing selected information in databases allowing for smart searching. Well-functioning systems save a large amount of time and effort and improve the quality of activities. NCAs in Europe are facing considerable challenges regarding this area.
Contribution to the deliverables of WP7
Definitions and clear distinction between compliance and performance management will be provided in the training material. Key performance and compliance indicators will be defined in a chapter of the PV Quality Manual Template or as a separate toolkit item. Case studies will provide insight into the use of pre-defined queries of performance and compliance management included in the quality toolkit.
4.2.7 Quality standards of assessment of pharmacovigilance data and scientific decision making (Q35-Q40)
It is of primary importance that high quality assessment reports are produced by NCAs in association with PV activities, particularly in procedures concerning the whole EU regulatory network. A unified set of criteria to establish and control for the quality of assessment reports would help improve the scientific decision making process.
As already mentioned in the Results/Findings section, considering all NCAs taking the survey, only 61.5% have a fully functional QC in place in terms of the 7 criteria listed in Q36.
Peer review29 is the most commonly used practice of QC. Consultation with a group of experienced assessors of the same field or reconciliation in team meetings of various disciplines affected by the issue may be very useful to control bias and strengthen the robustness of decision making. Some NCAs even indicated that they consulted external advisory groups; criteria for such consultations to take place and the specific bodies approached are worth further investigation. Additionally, NCAs indicated that QC of scientific assessment work is usually not a single person responsibility, but a shared effort highlighting the significance of high quality outputs.
The extent of QC at NCAs regarding PV assessment procedures depends generally on the nature, priority and criticality of the issue. This approach presumes from a quality management point of view that a well-defined prioritisation method is in place in order to be able to decide which procedures and outputs are subject to QC and which are not.
There might be various approaches at NCAs as to the position that delegates of the EMA Committees (including the PRAC) should take; i.e. are they free to express their own views, should they listen to an advisory body, or should they deliver what they
29Peer review is the evaluation of work by one or more people of similar competence to the producers of the work (peers).
Source: http://en.wikipedia.org/wiki/Peer_review downloaded: [2015/05/28]

SCOPE Work Package 7 Topic 1 Survey Report
Scope_Wp7_T1_Final_20151222 77
were told to. Almost two thirds of MSs taking the survey indicated that they had a procedure in place to discuss with the PRAC member what position to represent at the Committee. A negative response to this question does not necessarily imply that no procedure is in place to discuss and reconcile with the PRAC member, if necessary. Nevertheless, it can be assumed that regular meetings to discuss issues prior to Committee meetings and organised dissemination of outcomes of discussions following the sessions may raise the level of awareness of assessors on drug safety issues which contributes to higher quality assessments.
Contribution to the deliverables of WP7
Basic standards on the quality management of PV assessment reports will be discussed in the training material. Furthermore, as WP8 deals with the competencies of assessors and PSUR/RMP templates, but not the quality of the reports; this activity could be supported by WP7 from a quality aspect (e.g. development of a checklist for QC) that could be included in the toolkit.
4.2.8 Impact analysis and continuous improvement (Q41-Q43)
A basic principle of all OMSs is aimed at continuous improvement. To be able to improve, many factors have to be considered, information needs to be gathered, analysed and fed back to the system. Active data collection on the performance of the system is recommended to be in place, including the measurement of pre-defined parameters indicative of compliance and performance of the system, the consequences of any measures or actions implemented and feedback from all interested parties including management, staff and customers. Input for the assessment of the need of any corrective actions and initiations on improvement can be obtained from regular or ad hoc self-assessment but also from monitoring activities of independent parties via internal audits or inspections.
In the survey, NCAs were asked to provide information on the type and usefulness of sources they use as inputs for continuous improvement and corrective actions.
Feedback from PV staff and internal audits were the most rated actions, followed by inspections, management review, stakeholders’ feedback, systematic self-assessment and impact analysis.
Although differences in rating among the options chosen were not statistically significant, it was observed that impact analysis received the lowest score. Impact analysis is a relatively new activity and not yet fully developed in PV; thus, MSs may lack or have limited experience. Conclusions derived from Q41 were further supported by the results obtained from Q43, which directly asked whether systematic impact analysis was in place for the evaluation of any communications, actions or decisions taken in PV. Only 19.2% of member states responded positively, with a further 11.5% indicating some examples of occasional impact analysis.
SCOPE Work Package 7 Topic 1 Survey Report
Scope_Wp7_T1_Final_20151222 78
Impact analysis – as quoted from the OECD homepage and the WebFinance Inc’s Business Dictionary with some modifications – is a ‘systemic approach to critically assessing the positive and negative effects of proposed and existing actions, measures and decisions in light of its possible consequences or the extent and nature of change it may cause’.30,31
Impact analysis aims at assessing the full consequences that an action might have, and may refer to both future actions by analysing and preparing for the management of all foreseen and ‘unforeseen’ consequences as well as assessing the impact of measures already taken. Impact analysis may be challenging as it may be demanding on resources and expertise, and may require the conduct of well-designed studies which may be expensive. Nevertheless, impact analysis is a tool to ensure that proposed actions are successful and meet the expectations of stakeholders.
Currently, the EMA has taken the lead in producing a reflection paper on the strategy for impact evaluation of PV systems.32 This includes an initiative to evaluate the influence of measures taken on drug safety issues at the network level. Impact analysis of major PV measures taken nationally is most probably a task of the whole organisation.33
Contribution to the deliverables of WP7
The basic concept of impact analysis and methods of continuous improvement will be highlighted in the training material and will be supported with examples, focusing primarily on the impact/consequences of not following the requirements of a QMS.
4.2.9 Stakeholder feedback (Q44-Q47)
The primary goal of PV activities is to ensure that marketed medicines are safe and they meet the needs and expectations of its customers. In order to achieve this goal there should be a constant exchange of information between the organisation and its customers (broadly speaking, stakeholders) to receive feedback on whether expectations have been met and what is the perception of stakeholders on the performance of the organisation.
An organisation has to be open for queries, complaints, or any type of feedback by establishing and making publicly available the channels via which stakeholders can reach the organisation and must ensure that no incoming information is lost e.g. due
30http://www.oecd.org/gov/regulatory-policy/ria.htm downloaded: [2015/05/29]
31http://www.businessdictionary.com/definition/impact-analysis.html downloaded: [2015/05/29]
32Draft EMA reflection paper ‘Strategy for impact evaluation of the pharmacovigilance system’ EMA/38214/2015 (2015/06/05)
33WP7 active partners agreed at their 3rd face-to-face meeting that the activity of impact analysis of drug safety measures goes beyond the scope of the current project and no good practices will be sought.
SCOPE Work Package 7 Topic 1 Survey Report
Scope_Wp7_T1_Final_20151222 79
to the unavailability of services. To focus on these issues MSs were asked to provide information on the availability of contact points for a variety of stakeholders and the availability of PV colleagues or any other solutions to register incoming information either inside or outside working hours. MSs confirmed the existence of contact points for the EU regulatory network, the pharmaceutical industry and the public (including HCPs and patients). Some of them indicated that they had dedicated contact points for media queries. As resources are a critical aspect across EU agencies, it is not surprising that PV colleagues, at approximately half of the responding agencies, were available for receiving feedback, queries or notifications only during office hours. This may be set against the requirement of continuous availability (7/7 days, 24/24 hours) of EU-QPPVs as defined by the legislation. Constant availability of regulatory agencies to catch drug safety issues may well be justified.
There are active and passive approaches in getting feedback from stakeholders to assess their level of satisfaction. Using the proactive approach, several MSs compile and conduct stakeholder surveys and customer satisfaction questionnaires, making results available on their websites. Organisation of regular targeted meetings and information days and sessions is another effective way of exchanging experience and addressing the needs of stakeholders. Nevertheless, apart from the proactive methods, MSs should also operate a reactive system, to be open for any ‘spontaneously’ incoming feedback, complaint and query, to have procedures in place for the analysis of such information and to timely and effectively address them.
The survey has shown that some NCAs with more mature PV systems have more experience with the proactive approach of surveying customers’ needs and expectations. Sharing experience with MSs where only the reactive approach is in place is a useful approach; therefore, case studies may be provided among the deliverables of WP7.
Contribution to the deliverables of WP7
The basic concept of measuring customer satisfaction and information exchange with stakeholders will be highlighted in the training material. Furthermore, a customer satisfaction survey will be included in the toolkit on the perception of PV and the organisation’s performance in association with PV as a case study which will be suitable for NCAs to use as an online survey tool (via their website).
4.2.10 Overall evaluation of the quality system of pharmacovigilance at the National Competent Authority (Q48-Q49)
In the last section of the survey MSs were asked to provide any further feedback on challenges faced and solutions applied to tackle the situation during the establishment and operation of their PV quality system. NCAs were also asked to share any good practices or activities they considered to be successful at their agencies concerning PV quality management.
SCOPE Work Package 7 Topic 1 Survey Report
Scope_Wp7_T1_Final_20151222 80
MSs more readily outlined challenges compared to providing examples on good practices. This may reflect that NCAs have a lot of challenges in running a PV quality system due to lack of essential resources, facilities and equipment, in addition to lack of expertise from a quality management background. Running a PV quality system is very challenging to accomplish in isolation, separated from other processes of the organisation. The new legislation significantly increased the complexity of PV activities that cannot be run successfully without the establishment of interfaces and interdependencies and handling tasks as processes spanning through various units of an organisation. Understanding and support from top management to aid the development of such a structure is the key to effective work. Another explanation of the balance shifting towards reporting of negative rather than positive practice examples may be that MSs are focusing efforts on procedures causing issues and not on well implemented activities, i.e. they are more interested in receiving solutions and improving their practice. Lack of time may not favour reporting on good solutions while bringing up troublesome issues always deserves attention.
An enormous challenge MSs are facing is that the increasingly complex PV procedures are not backed by effective and proper IT systems. Many IT systems are not handling the special characteristics of PV activities and adjustment is lacking. This increases the relative workload at several agencies. Ineffective document management, tracking and searching may result in loss or delayed assessment of information compromising timely, evidence-based decision making.
As availability of limited resources is a general challenge, prioritisation of activities is a key step in order to allocate resource to the most critical areas. Prioritisation shall follow a risk based approach; however, criteria of prioritisation are not always obvious or well defined. Work has already started in this area both from the network and from the MS perspective, e.g. on risk rating of PV procedures to schedule audits. Still, there is a lot to be done and the approach has to be generalised and expanded to all PV activities. Risk-based classification of PV activities at a NCA is strongly associated with resource management, another WP7 topic (Topic 2: Resource management).
Challenges may not only be identified from directly requesting MSs give examples, but also indirectly, from questions where NCAs could indicate whether an activity had been covered by their system or had been in place and well-functioning. Negative answers to such questions may indicate troubles with implementation. Such activities identified from the survey are for quality planning and the definition of quality objectives, workflow tracking, performance management and the use of performance indicators, setting the standards of assessments and a systematic QC of assessment reports, impact analysis in PV, and a proactive approach to assess the needs and expectations of HCPs and patients. Reflecting on the challenges MSs reported directly or indirectly in the deliverables of WP7 is a main objective, and offering solutions on selected issues will be a basic approach in the next stage of work.
Finally, as regards challenges, the questionnaire was capable of pointing out some areas where discrepancies and inconsistencies exist as per the understanding of the

SCOPE Work Package 7 Topic 1 Survey Report
Scope_Wp7_T1_Final_20151222 81
terminology of the legislation. WP7 will make efforts to clarify concepts and activities to facilitate a common understanding across the EU.
The last question of the survey asked about good examples and practices.
Standardisation of activities, continuous monitoring and improvement of PV quality systems recurred throughout the survey. Many activities are ready for use (BEMA, internal audit, gap analysis, local or international standards, e.g. ISO principles on quality management). MSs were also reporting on good examples from the area of quality planning, document management and workflow tracking, pre-defined queries on monitoring compliance and performance of the system, PV impact analysis and proactive communication with stakeholders. MSs were also providing useful examples on quality objectives, compliance and performance indicators, i.e. smaller pieces of information which may still be worth gathering and sharing with all NCAs.
It was noted that areas where some MSs face considerable challenges largely coincided with the areas where other MSs offered good examples and practices. Establishing the channel between the ‘providers’ and the ‘receivers’ is the most important task of WP7.
Apart from the above, responses provided by MSs were generally very succinct when reporting on successes, which do not allow the one-to-one transfer of examples to the deliverables of WP7 without further investigation and an increase in the level of details. Nevertheless, a good impression of promising practice at certain NCAs has been obtained which will facilitate the selection of agencies to be contacted for follow-up where further discussions on case studies or good practices were considered necessary by the WP7 team.
Contribution to the deliverables of WP7
Deliverables will reflect on challenges MSs face by sharing good solutions from other MSs or elaboration of further guidance. Good practices will be incorporated to any of the previously proposed specific topics of the toolkit or training material.
4.3 Aims reached
The main objective of the WP7 Topic 1 survey was to gather information on PV quality systems operated by EU NCAs in order to identify challenging areas for certain MSs; areas that may require further clarification or guidance, and area that can be shared as good examples for other MSs. It has been concluded by the WP7 team that the survey fulfilled its overall objectives and represents a firm background for the development of the final deliverables of WP7.
4.4 Challenges faced/lessons learned
The general level of details provided by NCAs was lower than expected and often did not allow for the direct inclusion of good practices in the deliverables of WP7;
SCOPE Work Package 7 Topic 1 Survey Report
Scope_Wp7_T1_Final_20151222 82
therefore, further investigation/follow-up is required. This should be kept in mind for any similar future exercises. Nevertheless, most questions were well structured and easy to interpret and no criticism has been formulated by any of the participating MSs concerning the content or format of the survey.

SCOPE Work Package 7 Topic 1 Survey Report
Scope_Wp7_T1_Final_20151222 83
5 Closing remarks
This report summarised and presented the results of the second data gathering exercise of SCOPE WP7 (Topic 1), a survey conducted on the quality management practices of EU NCAs in respect to PV activities. Finalisation of the survey report is a significant milestone in the progress of WP7.
Analysis of responses provided insight into the quality management practices of EU MSs and allowed the WP7 team to learn more about the challenges MSs are facing and good practices agencies are using to operate their PV quality systems. WP7 is dedicated to establish a connection between NCAs with challenges and NCAs offering good solutions via the dissemination of case studies, good examples, templates and the provision of further guidance and training in the operation of quality systems.
Finally, results of the survey have been translated to a proposal for the items of the deliverables of WP7, i.e. the quality toolkit and the introductory training material which will serve as a well-established basis for the third and final activity of WP7 (development of deliverables). The proposal is summarised in the ‘Proposed Deliverables’ section below.

6 Proposed deliverables
Items proposed for further investigation and inclusion among the deliverables of WP7 based on the survey (from Topic 1) are summarised in Table 20.
Table 20 Outline of the proposal for the final deliverables of WP7 Topic 1
Item Toolkit Training material Sources of further
investigation
1. Basic ISO principles of quality management
Not a separate item in the toolkit, but a guiding principle for all items where relevant
Case studies, if applicable
Yes FU with NCAs certified by ISO or working in accordance with ISO principles for case studies, examples
ISO 9001 guidance (also ISO 9001:2015)
BEMA III KPI, if relevant
2. Quality cycle No Basic principles Literature
3. Quality planning with definition of the concept of quality objectives and outcomes
Guidance document with case studies (consider two levels, strategic and operational)
Definition of basic concepts, e.g. quality objective
FU with NCAs indicative of good practices
BEMA III, KPI 1.1, if relevant
Literature
4. Written procedures
PV Quality Manual Template
Purpose and level of details of QM, SOPs, WIs, update frequencies
Simple, straight-forward documentation
Process approach
Literature
PV Quality Manual of active members of WP7
FU with other MSs with a QM including PV
5. Record management and IT systems (including document management, workflow tracking and databases, minimum requirements)
Guidance document on basic principles and minimum requirements of record management and workflow tracking systems with examples from PV (case studies)
Basic concepts of record management including document management, workflow tracking and database storage
Literature
FU with experienced NCAs,
BEMA III KPIs 9.1 and 9.2
6. Compliance and performance management, pre-defined queries and indicators
KPIs will be defined in a chapter of the PV Quality Manual Template
Application of predefined queries in compliance and performance
Definitions and clear distinctions between compliance and performance management
FU with NCAs indicative of good practices
Literature
BEMA III KPI, if relevant
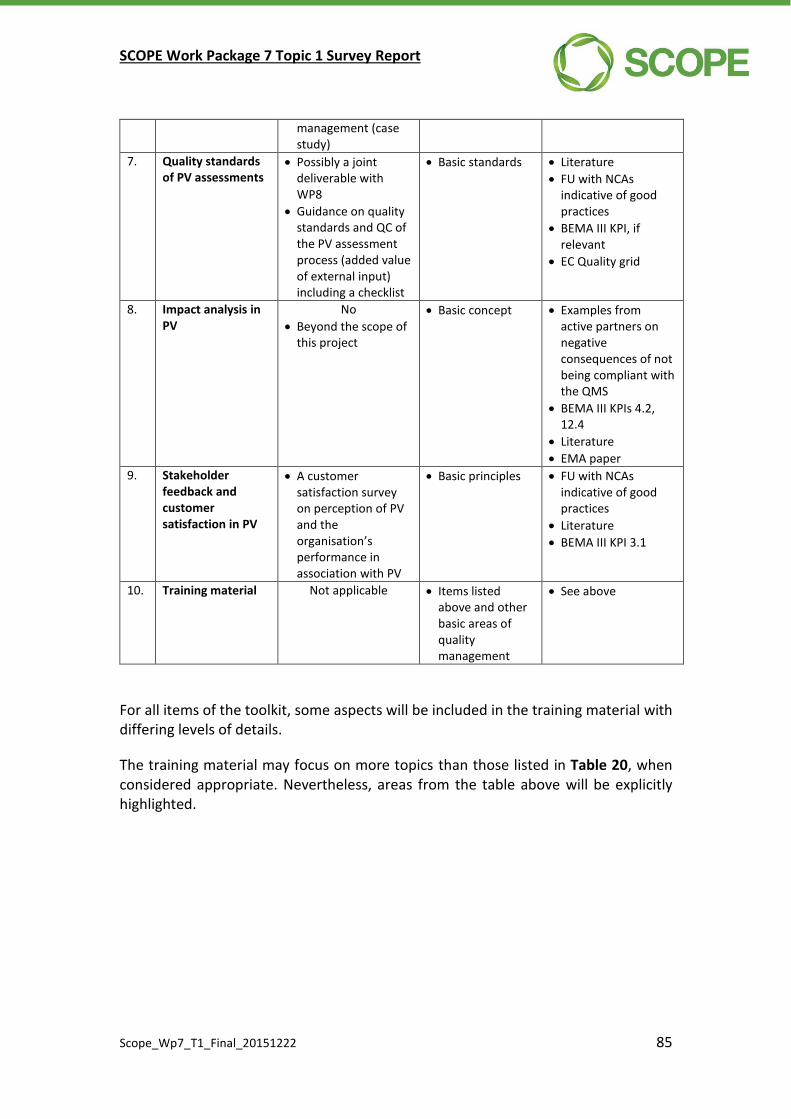
SCOPE Work Package 7 Topic 1 Survey Report
Scope_Wp7_T1_Final_20151222 85
For all items of the toolkit, some aspects will be included in the training material with differing levels of details.
The training material may focus on more topics than those listed in Table 20, when considered appropriate. Nevertheless, areas from the table above will be explicitly highlighted.
management (case study)
7. Quality standards of PV assessments
Possibly a joint deliverable with WP8
Guidance on quality standards and QC of the PV assessment process (added value of external input) including a checklist
Basic standards Literature
FU with NCAs indicative of good practices
BEMA III KPI, if relevant
EC Quality grid
8. Impact analysis in PV
No
Beyond the scope of this project
Basic concept Examples from active partners on negative consequences of not being compliant with the QMS
BEMA III KPIs 4.2, 12.4
Literature
EMA paper
9. Stakeholder feedback and customer satisfaction in PV
A customer satisfaction survey on perception of PV and the organisation’s performance in association with PV
Basic principles FU with NCAs indicative of good practices
Literature
BEMA III KPI 3.1
10. Training material Not applicable Items listed above and other basic areas of quality management
See above