SciTech Strategies, Inc. BETTER MAPS BETTER DECISIONS Science Mapping and Applications: Choices and...
25
SciTech Strategies, Inc. BETTER MAPS BETTER DECISIONS Science Mapping and Applications: Choices and Trade-offs Kevin W. Boyack, SciTech Strategies Standards Workshop August 11, 2011
-
Upload
spencer-porter -
Category
Documents
-
view
216 -
download
0
Transcript of SciTech Strategies, Inc. BETTER MAPS BETTER DECISIONS Science Mapping and Applications: Choices and...
SciTech Strategies, Inc.BETTER MAPS BETTER DECISIONS
Science Mapping and Applications: Choices and Trade-offs
Kevin W. Boyack, SciTech Strategies
Standards WorkshopAugust 11, 2011

Better Maps Better DecisionsSciTech Strategies
Agenda
Background Applications Choices and Trade-offs SciTech Choices SciTech Mapping Process Applications Enabled by SciTech Process Additional Findings Related to Choices Summary
2
Better Maps Better DecisionsSciTech Strategies
Science Mapping
Most common definition: visualizing or creating a visual map of scientific information» Documents, journals, authors, words …
This requires» Data acquisition and cleaning» Defining elements and similarity» Partitioning and/or layout of the data
And then one creates the visual
3
Better Maps Better DecisionsSciTech Strategies
Why Do We Map Science?
Basic understanding» Structure and dynamics of science
High level, all of science Discipline, specialty Researchers and groups
Search and retrieval» “More like this”, “related articles”
Metrics» Research» Evaluation
Policy / Decision Making
4
Better Maps Better DecisionsSciTech Strategies
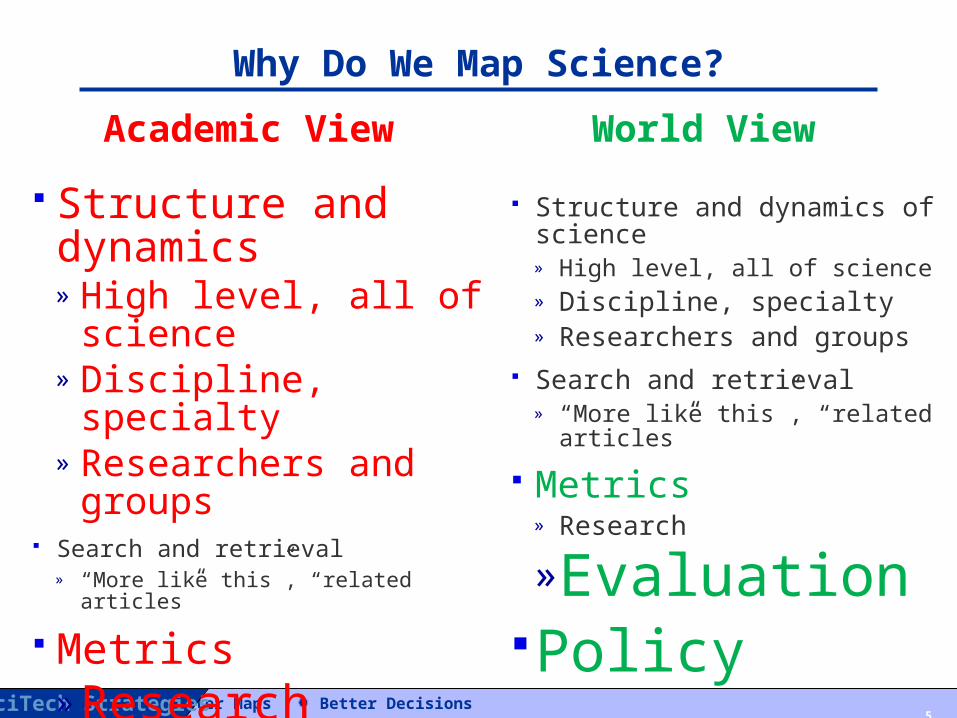
Why Do We Map Science?
Structure and dynamics » High level, all of science» Discipline, specialty» Researchers and groups
Search and retrieval» “More like this”, “related articles”
Metrics» Research» Evaluation
Policy
5
Academic View
Structure and dynamics of science» High level, all of science» Discipline, specialty» Researchers and groups
Search and retrieval» “More like this”, “related articles”
Metrics» Research
»EvaluationPolicy
World View
Better Maps Better DecisionsSciTech Strategies
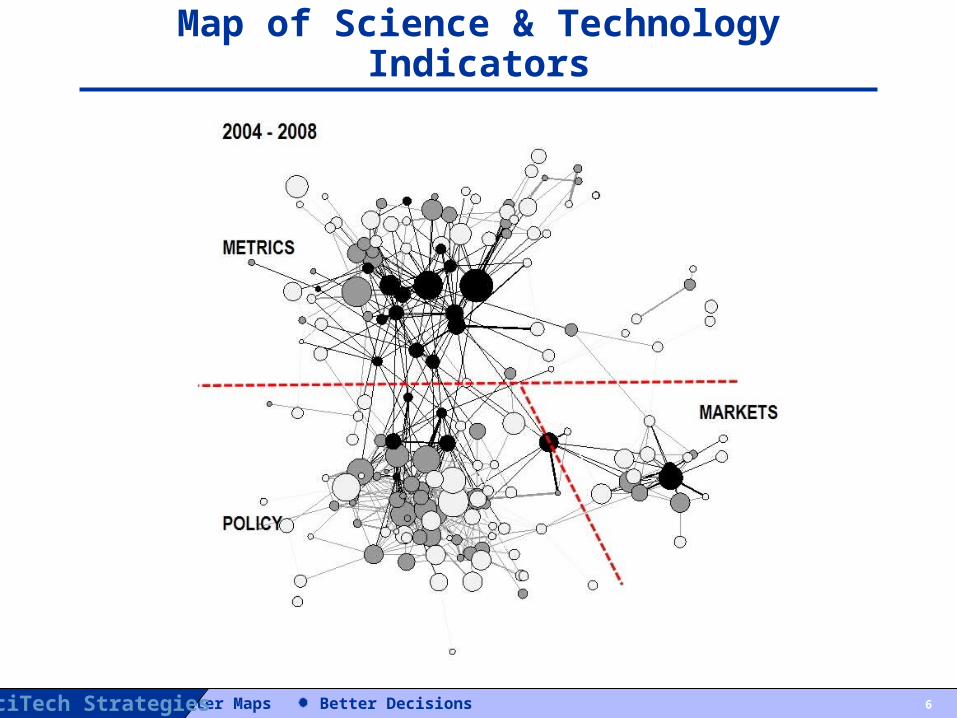
Map of Science & Technology Indicators
6
Better Maps Better DecisionsSciTech Strategies
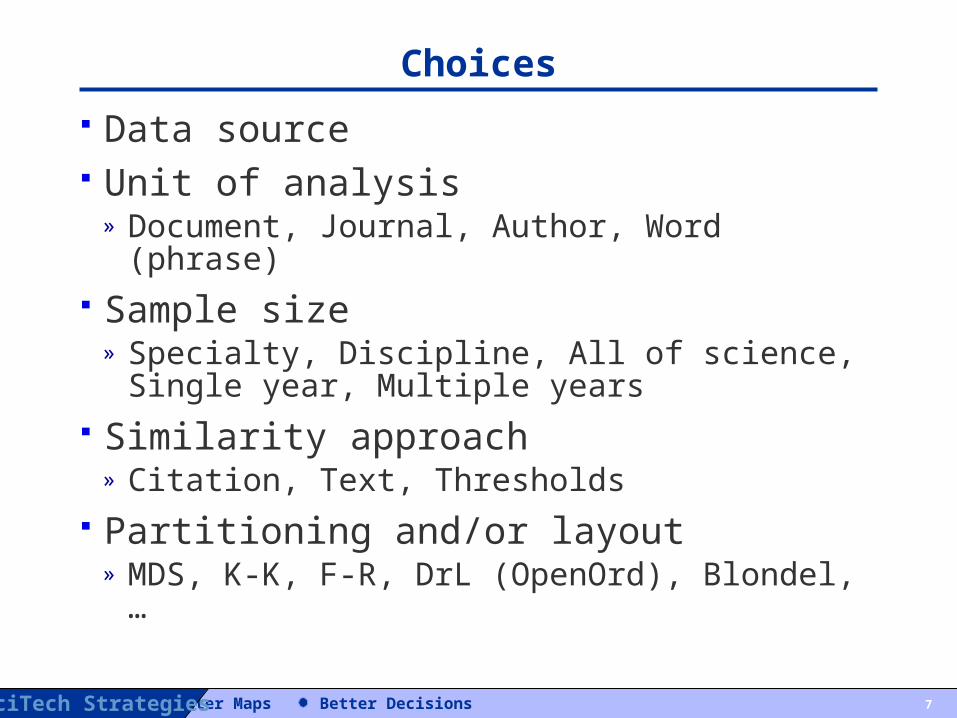
Choices
Data source Unit of analysis
» Document, Journal, Author, Word (phrase) Sample size
» Specialty, Discipline, All of science, Single year, Multiple years Similarity approach
» Citation, Text, Thresholds Partitioning and/or layout
» MDS, K-K, F-R, DrL (OpenOrd), Blondel, …
7
Better Maps Better DecisionsSciTech Strategies
Trade-offs
8
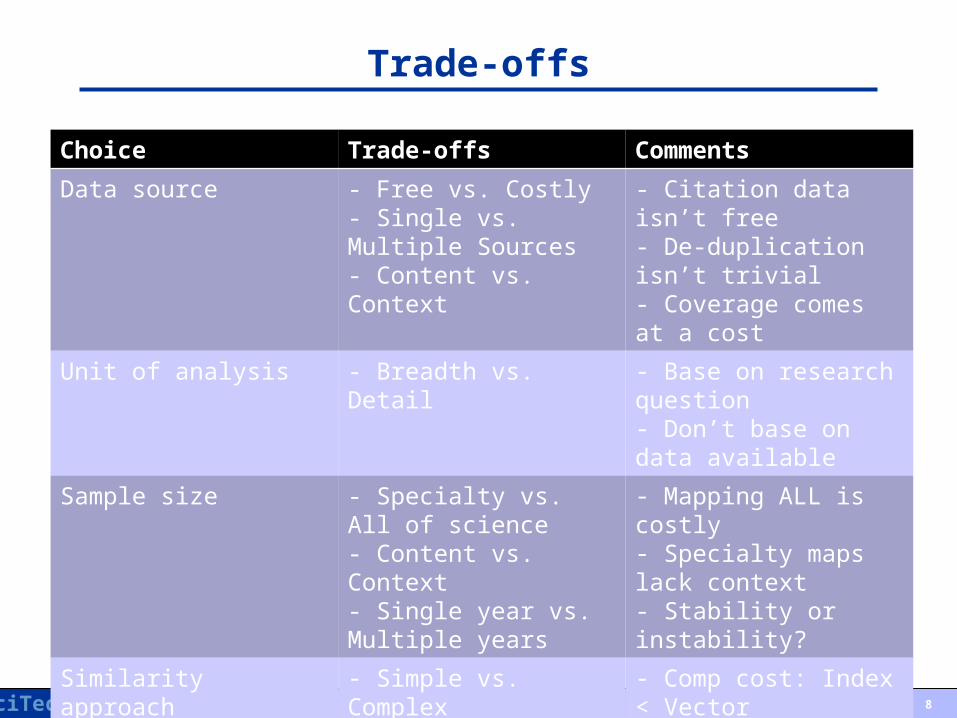
Choice Trade-offs Comments
Data source - Free vs. Costly- Single vs. Multiple Sources- Content vs. Context
- Citation data isn’t free- De-duplication isn’t trivial- Coverage comes at a cost
Unit of analysis - Breadth vs. Detail - Base on research question- Don’t base on data available
Sample size - Specialty vs. All of science- Content vs. Context- Single year vs. Multiple years
- Mapping ALL is costly- Specialty maps lack context- Stability or instability?
Similarity approach - Simple vs. Complex- Citation vs. Text vs. Hybrid- Threshold vs. Accuracy
- Comp cost: Index < Vector- Hybrid costly, but likely best- How much is really needed?
Partitioning / Layout - Simple vs. Complex- Accuracy vs. Useability
- Simple often size limited- Is intuition satisfied?- Are distributions reasonable?- Useful levels of aggregation?
Better Maps Better DecisionsSciTech Strategies
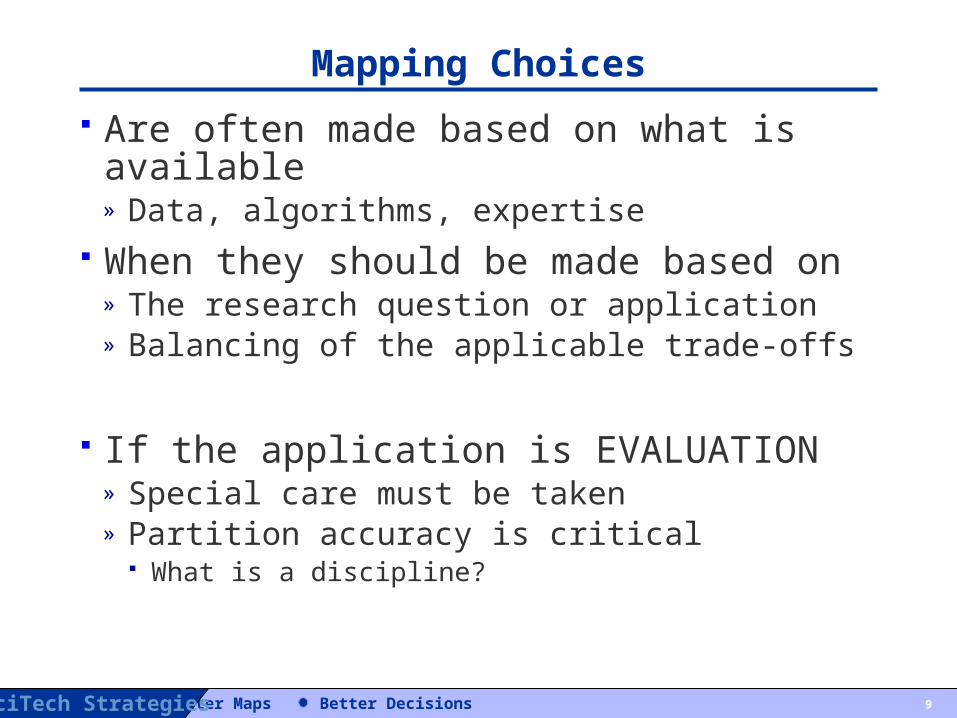
Mapping Choices
Are often made based on what is available» Data, algorithms, expertise
When they should be made based on» The research question or application» Balancing of the applicable trade-offs
If the application is EVALUATION» Special care must be taken» Partition accuracy is critical
What is a discipline?
9
Better Maps Better DecisionsSciTech Strategies
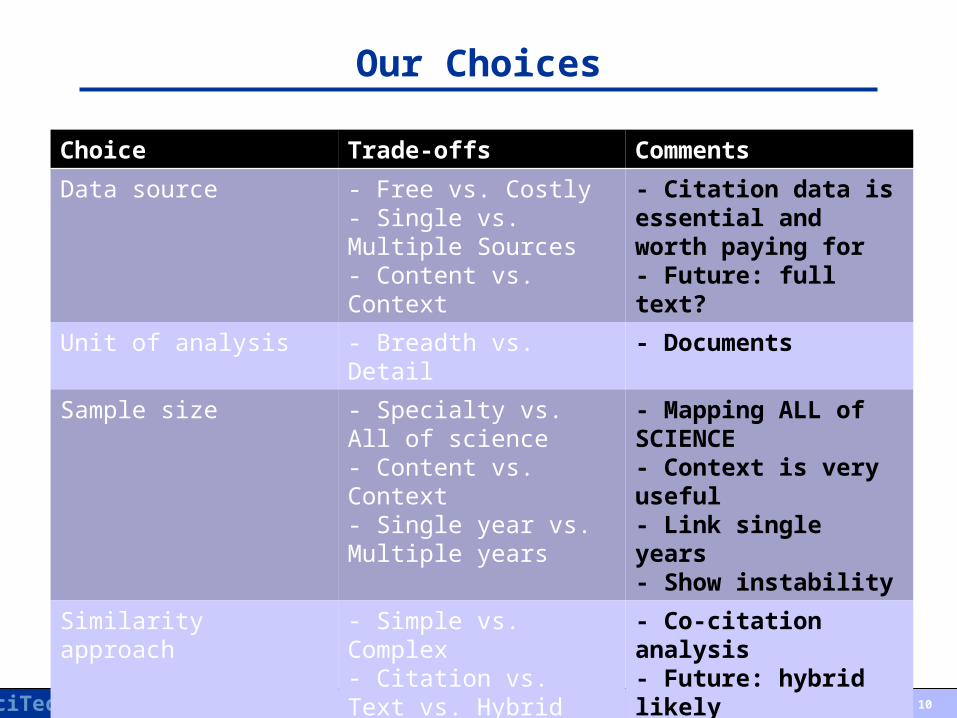
Our Choices
10
Choice Trade-offs Comments
Data source - Free vs. Costly- Single vs. Multiple Sources- Content vs. Context
- Citation data is essential and worth paying for- Future: full text?
Unit of analysis - Breadth vs. Detail - Documents
Sample size - Specialty vs. All of science- Content vs. Context- Single year vs. Multiple years
- Mapping ALL of SCIENCE- Context is very useful- Link single years- Show instability
Similarity approach - Simple vs. Complex- Citation vs. Text vs. Hybrid- Threshold vs. Accuracy
- Co-citation analysis- Future: hybrid likely- Top-n only, rest is noise
Partitioning / Layout - Simple vs. Complex- Accuracy vs. Useability
- Complex (DrL x 10), robust- Small clusters
- We are continually testing, refining, and improving our processes
Better Maps Better DecisionsSciTech Strategies
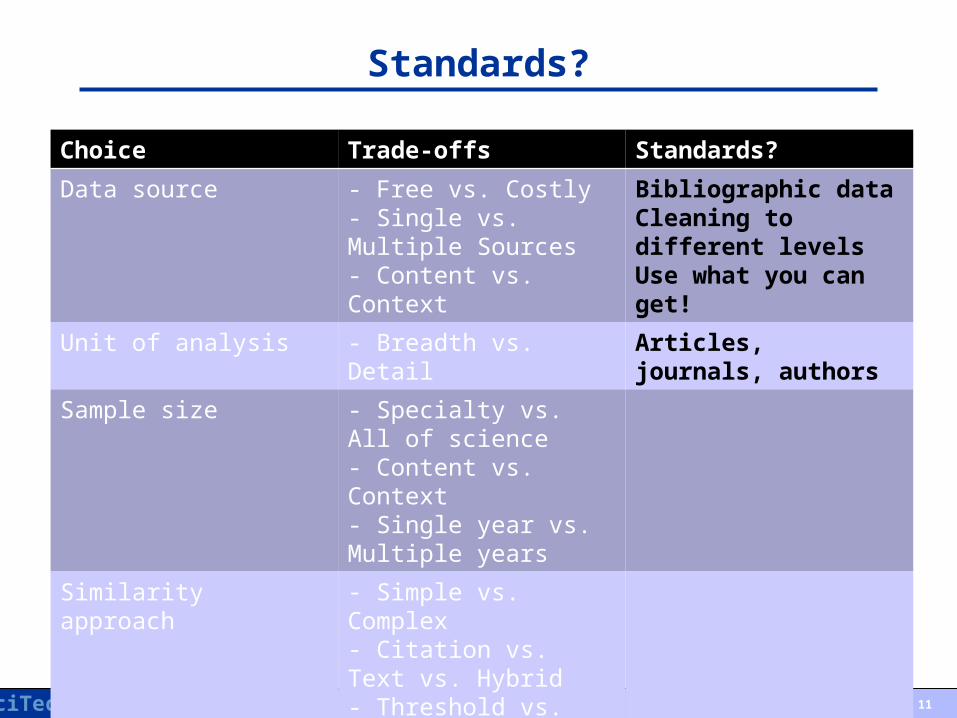
Standards?
11
Choice Trade-offs Standards?
Data source - Free vs. Costly- Single vs. Multiple Sources- Content vs. Context
Bibliographic dataCleaning to different levelsUse what you can get!
Unit of analysis - Breadth vs. Detail Articles, journals, authors
Sample size - Specialty vs. All of science- Content vs. Context- Single year vs. Multiple years
Similarity approach - Simple vs. Complex- Citation vs. Text vs. Hybrid- Threshold vs. Accuracy
Partitioning / Layout - Simple vs. Complex- Accuracy vs. Useability
Anecdotal validation in most cases

Better Maps Better DecisionsSciTech Strategies
Possible Standards
Units Data sources Data cleanliness Workflows Validation Datasets Products (e.g. reference maps?) …
12
Better Maps Better DecisionsSciTech Strategies
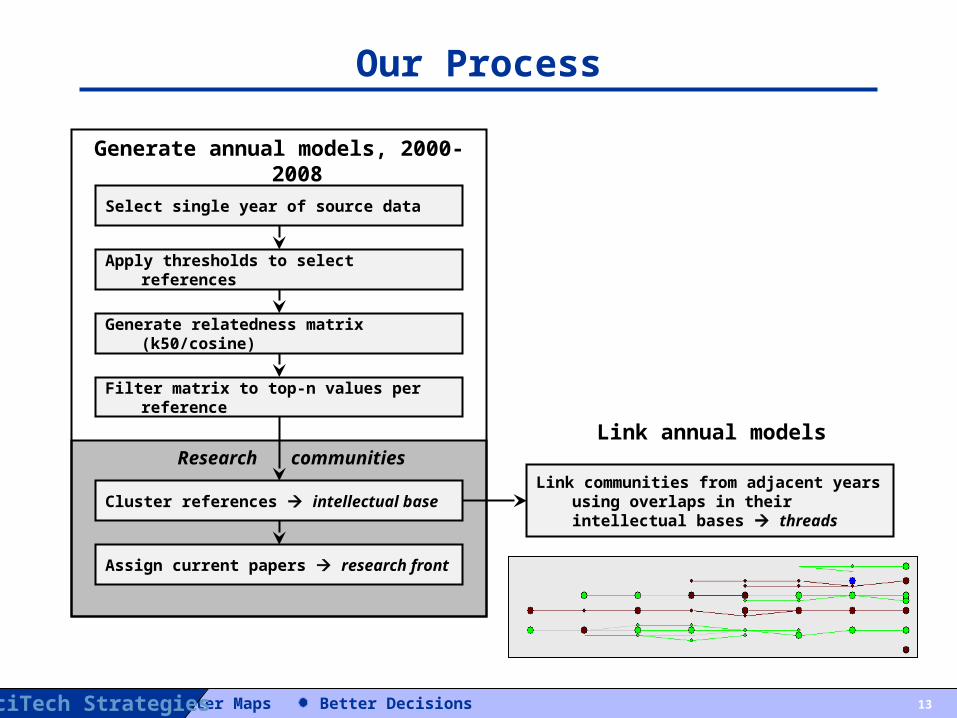
Our Process
13
Generate annual models, 2000-2008
Select single year of source data
Apply thresholds to select references
Generate relatedness matrix (k50/cosine)
Filter matrix to top-n values per reference
Cluster references intellectual base
Assign current papers research front
Link communities from adjacent years using overlaps in their intellectual bases threads
Link annual modelsResearch communities
Better Maps Better DecisionsSciTech Strategies
Process-Specific Applications
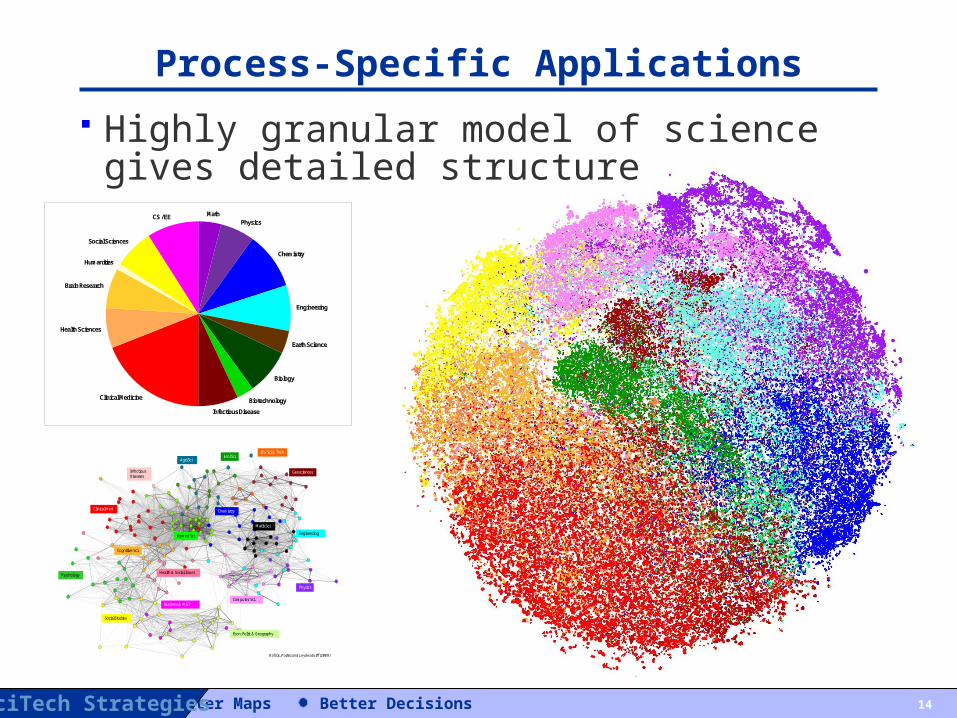
Highly granular model of science gives detailed structure
14
MathPhysics
Chemistry
Engineering
Earth Science
Biology
Biotechnology
Infectious Disease
Clinical Medicine
Health Sciences
Brain Research
Humanities
Social Sciences
CS / EE
Rafols, Porter and Leydesdorff (2009)
Cognitive Sci.
Agri Sci
Biomed Sci
Chemistry
Physics
Engineering
Env Sci & Tech
Matls Sci
Infectious Diseases
Psychology
Social Studies
Clinical Med
Computer Sci.Business & MGT
Geosciences
Ecol Sci
Econ. Polit. & Geography
Health & Social Issues
Better Maps Better DecisionsSciTech Strategies
Process-Specific Applications
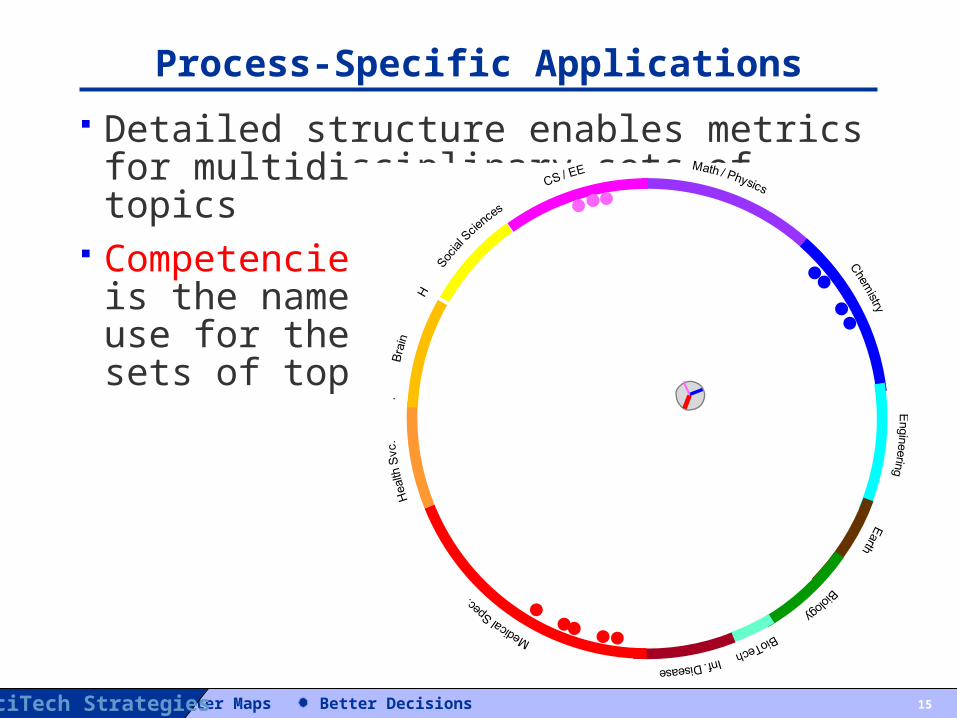
Detailed structure enables metrics for multidisciplinary sets of topics
Competencies is the name we use for thesesets of topics
15
Better Maps Better DecisionsSciTech Strategies
Process-Specific Applications
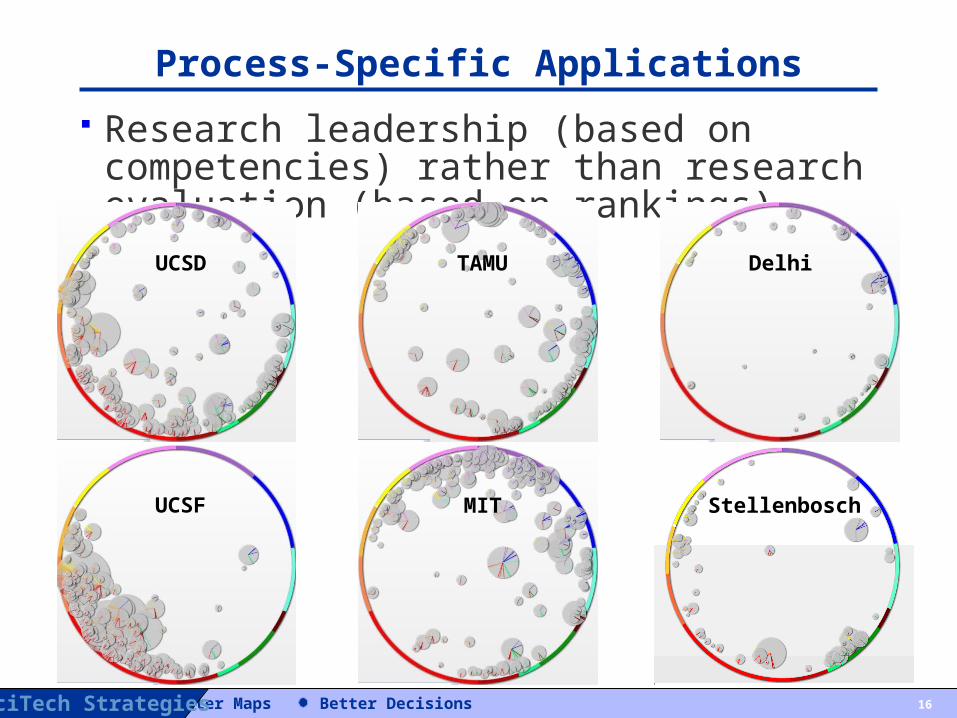
Research leadership (based on competencies) rather than research evaluation (based on rankings)
16
UCSD TAMU
UCSF MIT Stellenbosch
Delhi
Better Maps Better DecisionsSciTech Strategies
Process-Specific Applications
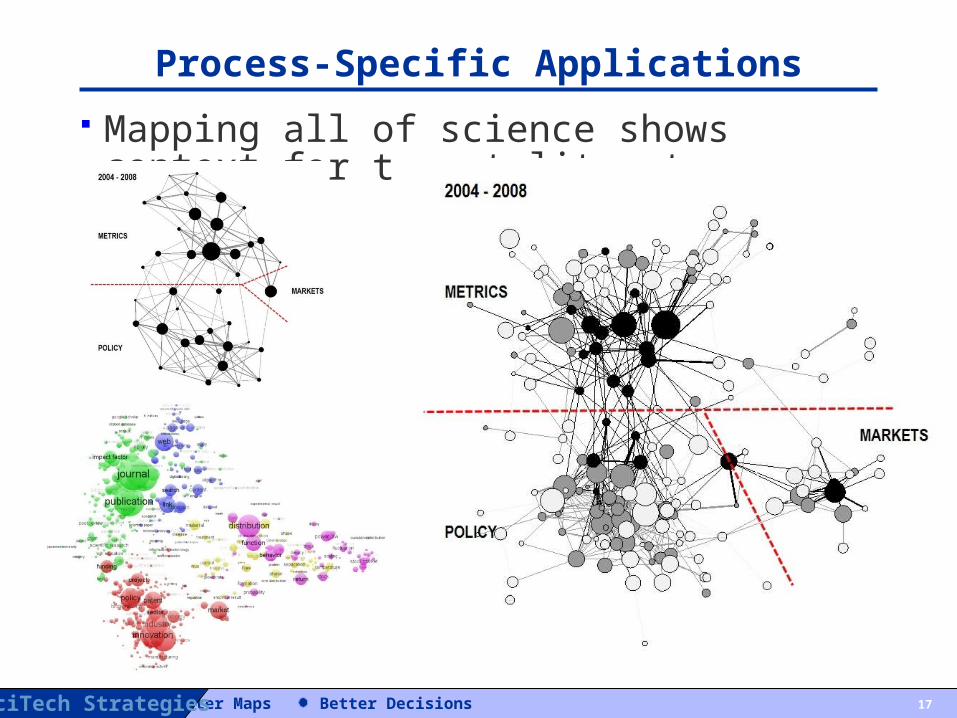
Mapping all of science shows context for target literature
17
Better Maps Better DecisionsSciTech Strategies
Process-Specific Applications
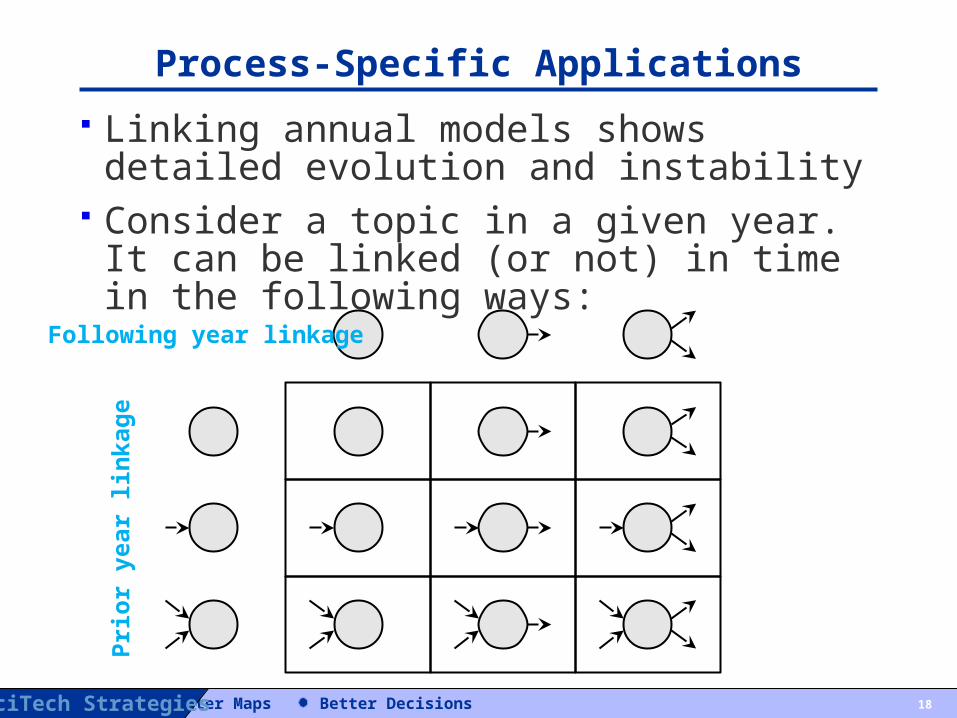
Linking annual models shows detailed evolution and instability
Consider a topic in a given year. It can be linked (or not) in time in the following ways:
18
Prio
r yea
r lin
kage
Following year linkage
Better Maps Better DecisionsSciTech Strategies
Process-Specific Applications
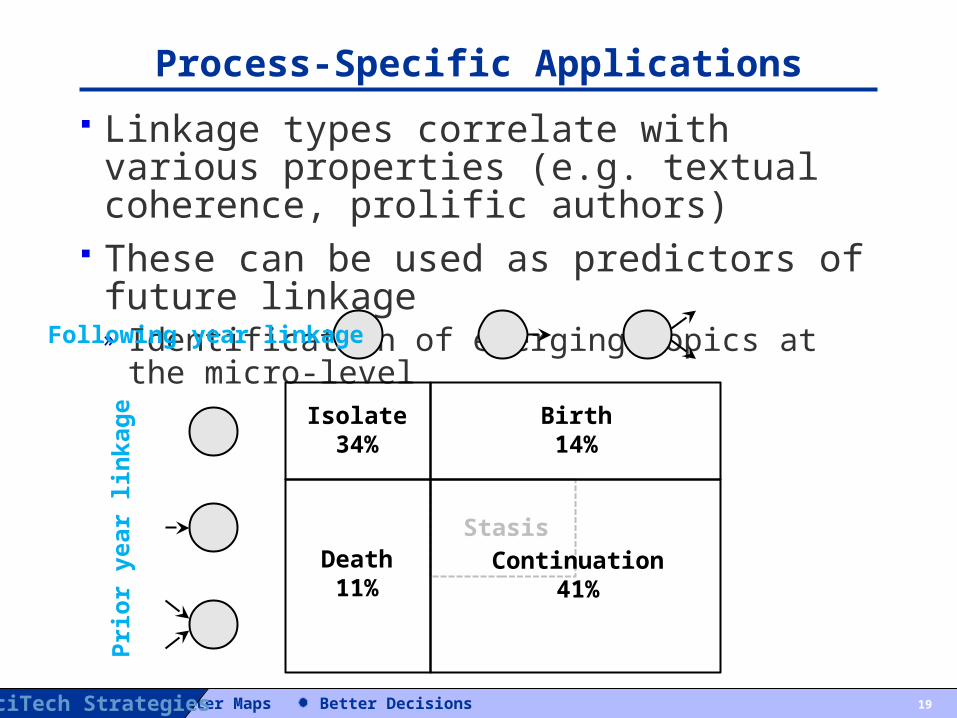
Linkage types correlate with various properties (e.g. textual coherence, prolific authors)
These can be used as predictors of future linkage» Identification of emerging topics at the micro-level
19
Prio
r yea
r lin
kage
Following year linkage
Isolate34%
Death11%
Birth14%
Continuation41%
Stasis
Better Maps Better DecisionsSciTech Strategies
Process-Specific Applications
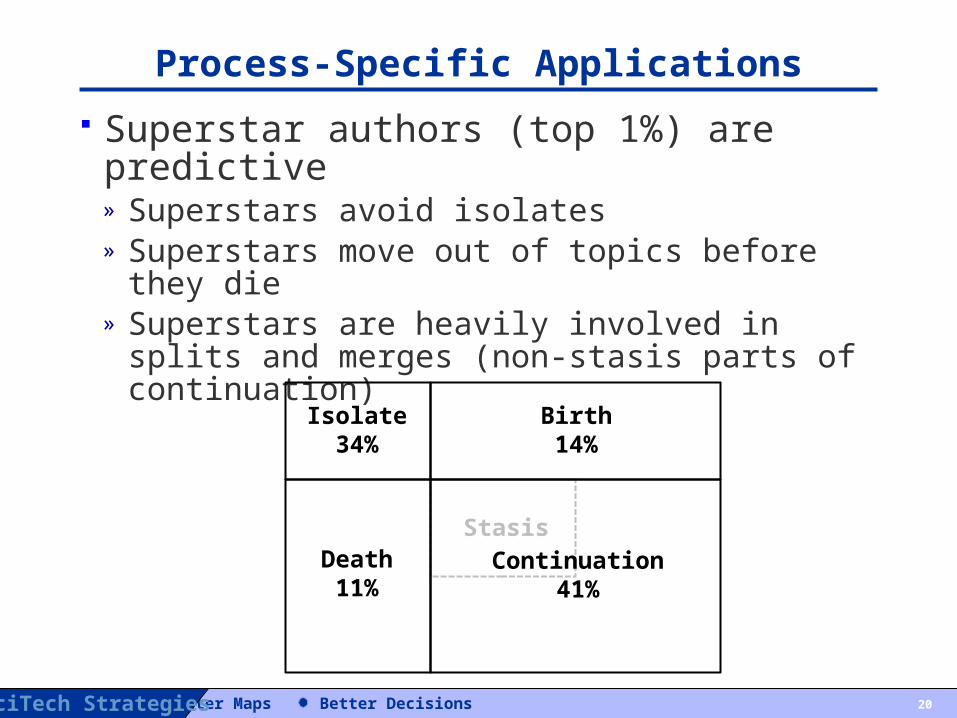
Superstar authors (top 1%) are predictive» Superstars avoid isolates» Superstars move out of topics before they die» Superstars are heavily involved in splits and merges (non-stasis
parts of continuation)
20
Isolate34%
Death11%
Birth14%
Continuation41%
Stasis
Better Maps Better DecisionsSciTech Strategies
Accuracy of Similarity Approaches
Identified a large data corpus (2.15M articles)» Textual information (abstracts, MeSH) from Medline» Citation information from Scopus
Compare 13 approaches – 3 citation, 9 text, 1 hybrid For each approach
» Calculate article-article similarities» Filter similarities to reduce the number to a similarity file of
reasonable size (2.15M articles, 20M sim pairs)» Cluster the articles» Measure accuracy of the cluster solution using multiple metrics
Coherence (Jensen-Shannon divergence) Grant-to-article linkage concentration
Analyze results
21

Better Maps Better DecisionsSciTech Strategies
Results
22
Method Comp Cost % Coverage Coherence (combined)
Herfindahl Pr80 (all grants)
Co-word MeSH Medium 95.77% 0.0758 0.1631 0.2216
LSA MeSH Very high 98.22% 0.0479 0.1124 0.2127
SOM MeSH Very high 99.97% 0.0409 0.1106 0.2203
bm25 MeSH Medium 93.39% 0.0759 0.1570 0.2167
Co-word TA High 83.41% 0.0685 0.1299 0.1571
LSA TA Very high 90.92% 0.0715 0.1255 0.2003
Topics TA High 94.40% 0.0875 0.1584 0.2379
bm25 TA High 93.91% 0.0979 0.2393 0.2578
pmra Low 94.23% 0.1055 0.2410 0.2637
Bib coupling Low 96.62% 0.1001 0.2849 0.2706
Co-citation Low 98.37% 0.0947 0.2378 0.2621
Direct citation Low 92.68% 0.0702 0.2037 0.2480
Hybrid Medium 96.83% 0.1014 0.2893 0.2752

Better Maps Better DecisionsSciTech Strategies
Summary
Science mapping involves a great number of choices» There are many trade-offs to consider» Choices constrain or enable analysis types
SciTech has made a set of mapping choices, and developed a methodology that enables» Development of a detailed, multi-year model of science for
structure and evolution» Metrics on competencies (sets of topics) that are important at
the institutional level» Context to be mapped along with any target literature» Prediction of continuance» Identification of emerging topics
We continue to explore accuracy and usefulness of maps
23

Better Maps Better DecisionsSciTech Strategies
Relevant Literature Boyack, K. W., Newman, D., Duhon, R. J., Klavans, R., Patek, M., Biberstine, J. R., Schijvenaars, B., Skupin, A., Ma, N., &
Börner, K. (2011). Clustering more than two million biomedical publications: Comparing the accuracies of nine text-based similarity approaches. PLOS One, 6(3): e18029.
Klavans, R., & Boyack, K. W. (2011). Using global mapping to create more accurate document-level maps of research fields. Journal of the American Society for Information Science and Technology, 62(1), 1-18.
Boyack, K. W., & Klavans, R. (2010). Co-citation analysis, bibliographic coupling, and direct citation: Which citation approach represents the research front most accurately? Journal of the American Society for Information Science and Technology, 61(12), 2389-2404.
Klavans, R., & Boyack, K. W. (2010). Toward an objective, reliable, and accurate method for measuring research leadership. Scientometrics, 82(3), 539-553.
Klavans, R., & Boyack, K. W. (2009). Toward a consensus map of science. Journal of the American Society for Information Science and Technology, 60(3), 455-476.
Boyack, K. W. (2009). Using detailed maps of science to identify potential collaborations. Scientometrics, 79(1), 27-44.
Klavans, R., & Boyack, K. W. (2006). Quantitative evaluation of large maps of science. Scientometrics, 68(3), 475-499.
Klavans, R., & Boyack, K. W. (2006). Identifying a better measure of relatedness for mapping science. Journal of the American Society for Information Science and Technology, 57(2), 251-263.
Boyack, K. W., Klavans, R., & Börner, K. (2005). Mapping the backbone of science. Scientometrics, 64(3), 351-374.
Boyack, K. W. (2004). Mapping knowledge domains: Characterizing PNAS. Proceedings of the National Academy of Sciences, 101, 5192-5199.
Börner, K., Chen, C., & Boyack, K. W. (2003). Visualizing knowledge domains. Annual Review of Information Science and Technology, 37, 179-255.
24
Better Maps Better DecisionsSciTech Strategies
Thank you!
25


![, Allen, C., & Rendall, T. (2019). Efficient Aero-Structural Wing AIAA Scitech … · In AIAA Scitech 2019 Forum [AIAA 2019-1701] (AIAA Scitech 2019 Forum). American Institute of](https://static.fdocuments.in/doc/165x107/6089b44b26d0b4646a6cbe59/-allen-c-rendall-t-2019-efficient-aero-structural-wing-aiaa-scitech.jpg)