
Scientific Research Southeastern Imbrium Crater Age Dating and Ejecting Data March 30, 2011.
45
Mrs. Keith- Houle 11:00 E 10:00 C RB Lunar-tics! Scientific Research Southeastern Imbrium Crater Age Dating and Ejecting Data March 30, 2011
-
date post
19-Dec-2015 -
Category
Documents
-
view
217 -
download
2
Transcript of Scientific Research Southeastern Imbrium Crater Age Dating and Ejecting Data March 30, 2011.

Mrs. Keith-Houle
11:00 E10:00 C
RB
Lunar-tics!
Scientific Research
Southeastern Imbrium Crater Age Dating and Ejecting Data
March 30, 2011

Objectives Covered
What we covered for Phase II Moon rocks from Houston, TX on loan Moon Zoo training GIS Imagery hits Red Bank High School How we set up our GIS Format Map analysis/craters Technical issue overcome in gaining imagery Cross section in Archimedes Trask method for Imbrium (Archimedes Crater) and
Sea of Serenity Data Collection Conclusions

Moon rocks take out Red Bank High School-NASA mania hits

Lunar Sample from Apollo 16 Mission
• Launch Pad: Florida, USA (Kennedy Space Center)
• Launch Date: April 16, 1972
• Lunar Landing: April 21, 1972
• Mission Duration: 11 d 01 h 51 mins.
• The astronauts brought back 94.7 kg of lunar samples from the moon.
Moon Rocks

We used MoonZoo to help train our eyes to learn to identify craters. We mapped over 1251 images in 8 days.

To start: Imagery- how to capture the image, where to capture the image, and how to use the image.
We downloaded imagery from “LROC” and LO orbiters- this took a while and a lot of false starts. We finally found on the internet.We used NASA Article technical paper from NASA to aid in our choice of imagery and how to proceed.
How We Got the Imagery
Eureka!

The Image!!! Imbrium, you never looked so beautiful!

- We used 24 memory flash drives to divide up the swathes.
- 19 swathes covering 9,630.4754304 square kilometers in the Southeastern Imbrium Basin
How We Stored Our Imagery Data
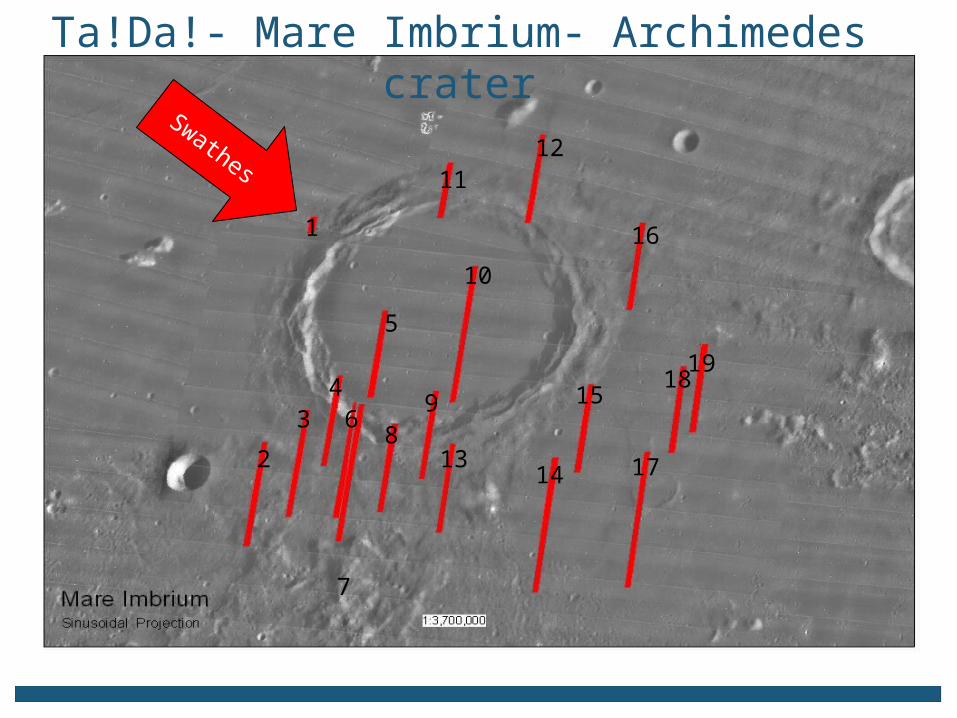
Ta!Da!- Mare Imbrium- Archimedes crater
1
1112
16
10
5
2
34
6
7
89
1314
15
17
1819
Swathes

Distance covered in 1 swathe is about 120 mileor 72 Km
120 miles
Area Covered

Geospatial Analyst at
North River Geographic Systems Inc.
Vice President at Georgia URISAMember of the Board at TNGIC
1st Vice President at ASPRSOwner at North River Geographic
Systems, Inc
Randy Hale- GIS Guru that helped!

How we set up our GIS format
• Includes the name of our swathe, which is our work base
• Also includes different names of objects found on the swathe
• Includes names of objects found, distinguished in colors.
• Names are selected to identify objects of focus.
Table of Contents
Create Features

• Used to identify craters detailed features • Used to shape certain
objects in the way they are formed
Describes the object and its features
Attr ibutesConstruct ion Tools
Descr ipt ion
GIS Format – Part 2

How To Edit a Compound Crater

This is Crater Analysis!
This is a compound crater. The rim walls are connected.
CompoundSimple

With all of this information we created these!!!
Swathe #4With cratersmarked
Swathe #7 with only craters marked
Swathe #6 with imagerybehind itSwathe 6
Left Right
Combination to make corrected shift with GIS
imagery

How We Worked!!
Mrs. Keith is a real task master!
Over 3 weeks 23 students (Scientific Research) & 1 teacher put in 30 hours- we mapped over 55,000 craters
At times it seemed like all we did at Red Bank was map craters on the moon.
WORK! WORK! WORK!

GIS Hits Red Bank
But mayhem soon followed:1. GIS crashed twice, and had to
reload(which took 8 hours each).2. We thought we had lost $30,000
of GIS Software-the search was on!3. Power went out4. Data crashed laptop5. Data when printed took up over
1,100 sheets of paper, we stopped at 460.
6. Twitter knows about us! In England and Canada.
7. Data corruption on ‘stick’ 248. Can we take a picture and not
have theCamera stolen!9. 4 months of begging to get free
softwarefrom Virginia GIS.

Technical Issues We Faced With Imagery
1.) Lining up pictures with dots to make swaths2.) Issues when we were downloading data from LROC was compression data to make swathes and from them not to pixilate or become fuzzy3.) Last 2 swathes from Sea of Serenity had Long and Lat problems
1.
Figure 1

When we downloaded the crater imagery in order to use the images we had to first turn
pictures 90° Clockwise
Then we had to turn
an additional 90° Clockwise again until the original image had been rotated a total of
180° Clockwise from its original position
Original Image Image after 1st rotation
Final Image
Download Flipping

Projection Issues matter: We put swathes in the southern part of the Imbrium basin
to make the projection more rectangular. Better data in the long run!
Still swathes were smaller at the top and wider at the bottom more due to curvature of the moon even with cylindrical projections to lessen long/lat issues.
Sinusoidal Projections allow us to have true and accurate diameters of craters.
Eart
h C
ylin
dri
cal
Pro
ject
ion
Moon
Sin
uso
idal
Pro
jectio
n

Imbrium


Ileminite Rock
(Fe² TiO³) - Formula+Has a melting point of 1800ºC or 3272ºF
The name for the place of the discovery is Ilem mountains in Russia Metallic to sub metallic metal generally iron black meaning that the lava that formed the south eastern portion of Imbrium had to be around 1800ºC or greater during eruption.

Cross sectional Data for Archimedes Crater
3 4 5
1 2
6 7

Cross Sections

Overall Data Table Read Out Trask 1 – Imbrium
Type of Crater Total Number Square Meters
Compound 865 109,935,726.105555
Bright Compound 102 17,070,670.00716
Dark Compound 21 25,131,823.880641
Compound Heavy Eroded
28 17,733,033.61608
Compound Light Eroded
565 32,980,290.983086
Simple 11468 **highest concentration**
456,327,831.5276
Simple Bright 4180 260,828,060.8237
Dark Simple 2165 89,358,083.170547
Simple Heavy Eroded 1520 79,469,488.0927
Simple Light Eroded 20073 **highest concentration**
964,838,198.3933
Total of all the craters Combined
40987 2,053,673,206.600369
So, what is
trask?......

What is the Trask Method?
The Trask Method is a way of determining the ages of craters based on these assumptions: Newly formed craters appear sharp
with raised rims and rayed ejecta. Craters are subdued and destroyed
eventually by meteorite impacts. Small craters are eroded faster and
disappear in less time than large craters.
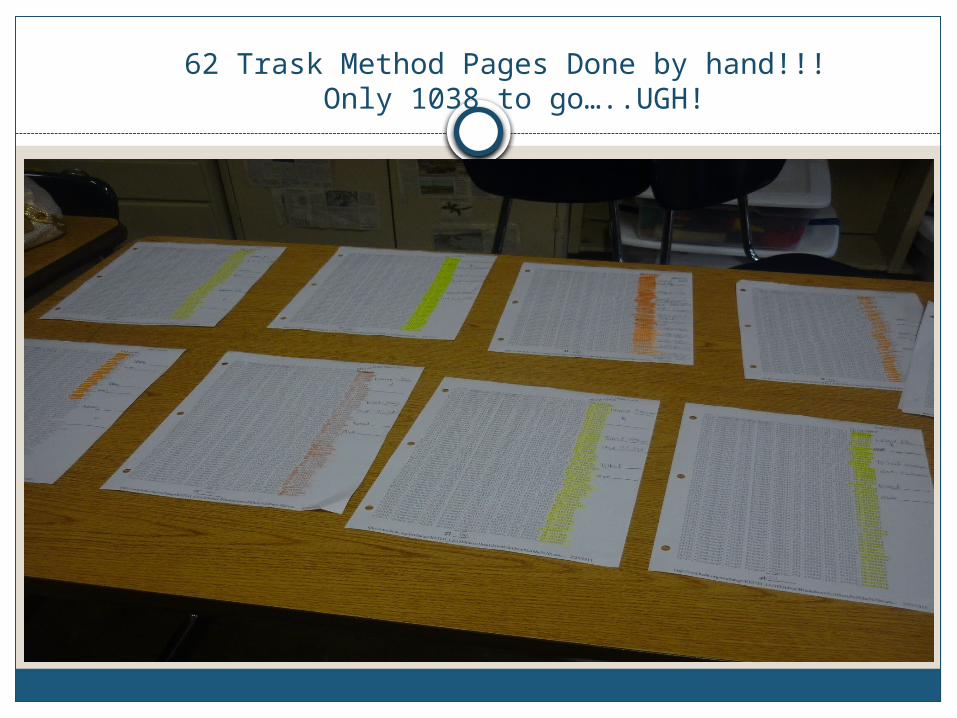
62 Trask Method Pages Done by hand!!! Only 1038 to go…..UGH!

A Trasking We Will Go!!! (Counting Crater Diameters)
We added,Counted,Divided,Rechecked
Then 62 Pages in we Found The MicrosoftExcel Program

Trask Method 1 Data-Via Excel
Diameter (ft) Diameter (m) Amount
0-32.8 0-10 20
32.8-164 10-50 7,316
164-328 50-100 14,572
328-1640.4 100-500 17,435
1640.4-3280.8 500-1000 1277
3280.8-16,404.2 1000-5000 361
16,404.2-32,808.4 5000-10,000 6
The Relative date of our swathes was: we found craters in the Copernican time interval of 1 and 3. the majority of our impact craters (32,007) were between 50 and 500 meters in diameter at 78.1%. 17.9% of our craters fell between 10 to 50 meters.
(Interior Imbrium/ Archimedes / Archimedes)
Percentages
.049
17.85
35.55
42.53
3.11
.88
.014

Crater Diameters
Diameter of Craters
Am
ou
nt
of
Cra
ters
Trask 1 Crater Diameters

Summary of GIS Trask 1 Data – Imbrium Crater
Object ID in meters Frequency SUM Diameter
MEAN Diameter MIN Diameter
MAX Diameter RANGE Diameter
COUNT Diameter
10-50m 7282 267931.7848 36.791236 10.115496 49.998206 39.88271 7282
50-100m 14556 1062589.975 73.000135 50.004989 99.995138 49.0149 14556
100-500m 17435 3423917.212 196.38183 100.01442 499.95944 399.94502 17435
500-1000m 1277 848423.892 664.389 500.246 997.025 496.779 1277
1000-5000m 361 579381.532 1654.796 1000.258 4835.843 3835.584 361
5000-10000m 6 37005.17863 6167.529771 5192.508224 8873.401565 3680.893341 6

Trask 1 Data

Trask 2 Data

New Trask Images

Two Swathes Red - Imbrium

Two Blue Swathes - Serenity

Two Red Swathes – Inbrium Trask 2
Object ID in Meters
Frequency SUM Diameter
MEAN Diameter
MIN Diameter
MAX Diameter
RANGE Diameter
COUNT Diameter
10-50m 293 10833.039 36.972 6.305 49.925 43.619 293
50-100m 1003 75321.4 75.096 9.608 99.955 90.346 1003
100-500m 1717 331161.074 192.87 100.34 499.4 399.06 1717
500-1000m 94 62756.743 667.625 503.306 997.025 493.71 94
1000-5000m 38 74044.464 1948.539 1003.458 4835.843 3832.385 38
5000-10000m 1 5698.2002 5698.2002 5698.2002 5698.2002 0 1

Two Blue Swathes – Serenity Trask 2
Object ID in meters Frequency
SUM Diameter
MEAN Diameter
MIN Diameter
MAX Diameter
RANGE Diameter
COUNT Diameter
10-50 m 4616 160715.7 34.82 10.06 49.999 39.94 4616
50-100 m 6107 435917.6 71.38 50 49.995 49.992 6107
100-500 m 3867 670878.7 173.49 100 499.76 399.76 3867
500-1000 m 191 129632.3 678.7 500.31 996.06 445.75 191
1000-5000 m 72 110372.6 1532.95 1003.26 3569.09 2565.82 72
5000-10000 m 2 0 0 0 0 0 2

New Swathe’s Location

What Did We Learn?
The age of the Archimedes crater inside the south eastern Imbrium 1.8-2.75 Copernican
The age of the western Serenity crater 2.5-4.3 Copernican 55,000 craters mapped The different types of craters: Bright Whites, Dark Haloed,
Compound, Simple. Area mapped totals: Imbrium 9,630.46 sq Km (5,778.4 sq. miles) Serenity 2,156.5 sq Km (1,293.9 sq miles) All areas mapped total: 11,786.9 sq Km (7,o72.11 sq miles) The type of rocks in the Archimedes crater is ILeminite The melt temperature of rocks on the moon in Archimedes 1800ºC
or 3272ºF How to use GIS to map the moon Most craters in both areas fell between 50-500m-wih 78.1% in
Imbrium and 67.1% in serenity Cross Sections: 1,500 ft rim walls in the southern portion of Imbrium Comparing like areas for best data: Old Area: 2012.4 km New
Area:2156.5 km

Where do we go from here?
1. Develop a DM Model of swathes that went through the rim wall of Archimedes to see elevation and slump patterns
2. Get Data for 3-D Modeling, 50% overlap needed
3. Get swathes outside the Imbrium. The whole perimeter! We had to stop at 2! For times sake
4. Look at statistical data for more trends to answer questions of why so few craters in 500-1000m? 1000m-5000m?
5. the 0-10 – we think our resolution or picture would not let us see and the 5000-10000m are really rare.

Bibliography
http://www.lpi.usra.edu http://www.the-moon.wikispaces.com http://www.apollo.sese.edu http://www.tappedin.org http://www.thunderbolts.info/tpod/2006/archog/060315/srille.html http://www.homepage.ntlworld.com/peterlloyd3/moon/craters/membrium050
423.html http://www.nasa.gov http://www.moontoday.net http://www.moonzoo.org http://www.onlinecharttool.com (slide 36) http://astrogeology.usgs.gov/Projects/LunarOrbiterDigitization/Pilot/lunorbWe
bovervu.html http://www.galleries.com/minerals/oxides/ileminite/ileminite.html Http://www.mindat.org
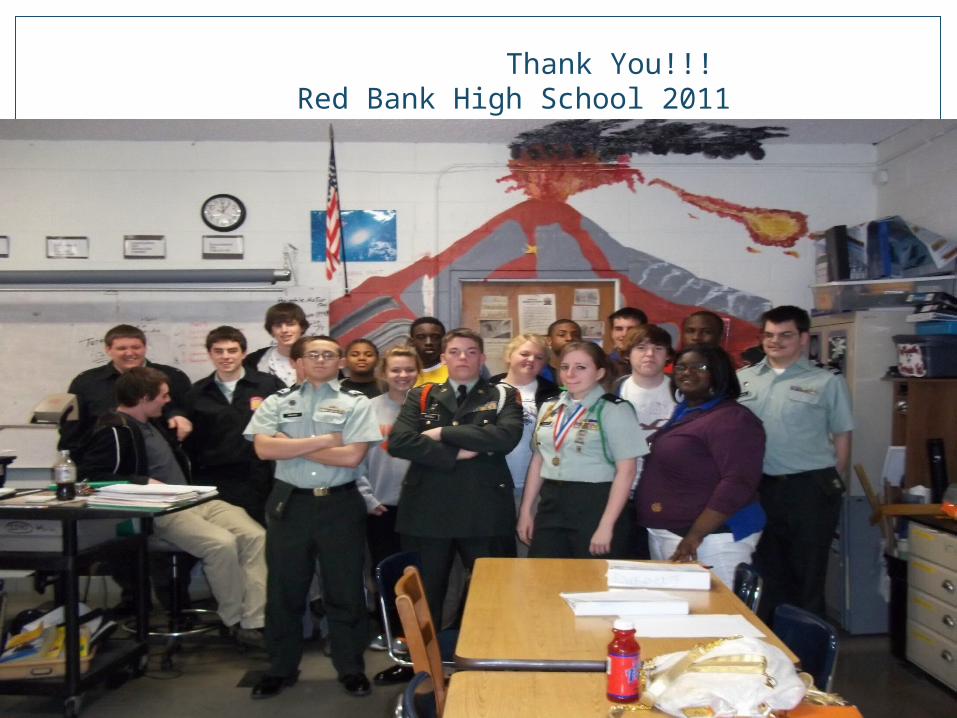
Thank You!!! Red Bank High School 2011


![SCIENTIFIC EXPLORATION OF MARE IMBRIUM WITH … · within Mare Imbrium are colored with respect to age, where older terrains are in blues and younger terrains are in grays[4]. Overall,](https://static.fdocuments.in/doc/165x107/5f0a934c7e708231d42c4eb0/scientific-exploration-of-mare-imbrium-with-within-mare-imbrium-are-colored-with.jpg)
