SCIENTIFIC IRRIGATION SCHEDULING in PERMANENT …cekern.ucanr.edu/files/98834.pdf · SCIENTIFIC...
22
Kern Count y i 1031 S. Mt. Vernon Ave i Bakersfield CA 93307 i Tele p hone: ( 661 ) 868-6218 SCIENTIFIC IRRIGATION SCHEDULING in PERMANENT CROPS: PROCESS, PLANNING, PROGRAMS & PRESSURE BOMB Blake Sanden, Irrigation & Agronomy Kern County 2010 UCCE Kern Spring Irrigation Workshop Bakersfield, CA 4/8/10 SCIENTIFIC (definition): “Pertaining to science – systematic knowledge of the physical or material world gained through observation and experimentation.” PROCESS: Understand the essential water processes and constraints that affect your crop. 1. SOIL/WATER: Optimizing all factors / knowledge that affect irrigation uniformity, scheduling and water use efficiency. 2. CROP: Adjust crop rotation choices to fit water supply / quality. 3. TECHNOLOGY: Adopt techniques to track changes in soil/plant water status. IRRIGATION FOUNDATION STONES TO OPTIMIZE PRODUCTION & PROFIT • AVAILABLE WATER / ROOTZONE AERATION (available oxygen) • SUFFICIENT ROOTED VOLUME FOR ANCHORING AND NUTRIENTS • AVAILABLE NUTRIENTS – N, P, K, Zinc, Boron, Iron, proper salt balance • AVOID SATURATION & HIGH HUMDITY TO DECREASE DISEASE • CROP STRUCTURE for MAX PHOTOSYNTHESIS & FRUIT DEVELOPMENT • EQUIPMENT FOR TIMELY OPERATIONS & OPTIMUM CROP WATER USE System Crop Soil Water TOPOGRAPHY TEXTURE INFILTRATION RATE DRAINAGE SALTS / QUALITY AMENDMENTS / COST LIFE CYCLE & WATER USE (ET) ROOTING CHARACTERISTICS DESIRED STRUCTURE / SPACING HARVEST REQUIREMENTS FIELD TRAFFIC SOURCE / SUPPLY SALTS / QUALITY REQUIRED AMENDMENTS COST IRRIGATION METHOD DISTRIBUTION PATTERN IRRIGATION FREQUENCY MONITORING MAINTENANCE / REPAIR OPERATING COST CAPITAL COST System System Crop Crop Soil Soil Water Water California crops sit most firmly on a chair with 4 legs! 1
-
Upload
phungduong -
Category
Documents
-
view
216 -
download
4
Transcript of SCIENTIFIC IRRIGATION SCHEDULING in PERMANENT …cekern.ucanr.edu/files/98834.pdf · SCIENTIFIC...

Kern County i 1031 S . Mt. Vernon Ave i Bakersf ie ld CA 93307 i Te lephone: (661) 868-6218
SCIENTIFIC IRRIGATION SCHEDULING in PERMANENT CROPS: PROCESS, PLANNING, PROGRAMS & PRESSURE BOMB
Blake Sanden, Irrigation & Agronomy Kern County 2010 UCCE Kern Spring Irrigation Workshop Bakersfield, CA 4/8/10
SCIENTIFIC (definition): “Pertaining to science – systematic knowledge of the physical or material world gained through observation and experimentation.” PROCESS: Understand the essential water processes and constraints that affect your crop.
1. SOIL/WATER: Optimizing all factors / knowledge that affect irrigation uniformity, scheduling and water use efficiency.
2. CROP: Adjust crop rotation choices to fit water supply / quality. 3. TECHNOLOGY: Adopt techniques to track changes in soil/plant water status.
IRRIGATION FOUNDATION STONES TO OPTIMIZE PRODUCTION & PROFIT • AVAILABLE WATER / ROOTZONE AERATION (available oxygen) • SUFFICIENT ROOTED VOLUME FOR ANCHORING AND NUTRIENTS • AVAILABLE NUTRIENTS – N, P, K, Zinc, Boron, Iron, proper salt balance • AVOID SATURATION & HIGH HUMDITY TO DECREASE DISEASE • CROP STRUCTURE for MAX PHOTOSYNTHESIS & FRUIT DEVELOPMENT • EQUIPMENT FOR TIMELY OPERATIONS & OPTIMUM CROP WATER USE
TOPOGRAPHYTEXTURE
INFILTRATION RATEDRAINAGE
SALTS / QUALITYAMENDMENTS / COST
TOPOGRAPHYTEXTURE
INFILTRATION RATEDRAINAGE
SALTS / QUALITYAMENDMENTS / COST
LIFE CYCLE & WATER USE (ET)ROOTING CHARACTERISTICS
DESIRED STRUCTURE / SPACINGHARVEST REQUIREMENTS
FIELD TRAFFIC
LIFE CYCLE & WATER USE (ET)ROOTING CHARACTERISTICS
DESIRED STRUCTURE / SPACINGHARVEST REQUIREMENTS
FIELD TRAFFIC
SOURCE / SUPPLYSALTS / QUALITY
REQUIRED AMENDMENTSCOST
SOURCE / SUPPLYSALTS / QUALITY
REQUIRED AMENDMENTSCOST
IRRIGATION METHODDISTRIBUTION PATTERN IRRIGATION FREQUENCY
MONITORINGMAINTENANCE / REPAIR
OPERATING COSTCAPITAL COST
IRRIGATION METHODDISTRIBUTION PATTERN IRRIGATION FREQUENCY
MONITORINGMAINTENANCE / REPAIR
OPERATING COSTCAPITAL COST
System
Crop
Soil
Water
TOPOGRAPHYTEXTURE
INFILTRATION RATEDRAINAGE
SALTS / QUALITYAMENDMENTS / COST
TOPOGRAPHYTEXTURE
INFILTRATION RATEDRAINAGE
SALTS / QUALITYAMENDMENTS / COST
LIFE CYCLE & WATER USE (ET)ROOTING CHARACTERISTICS
DESIRED STRUCTURE / SPACINGHARVEST REQUIREMENTS
FIELD TRAFFIC
LIFE CYCLE & WATER USE (ET)ROOTING CHARACTERISTICS
DESIRED STRUCTURE / SPACINGHARVEST REQUIREMENTS
FIELD TRAFFIC
SOURCE / SUPPLYSALTS / QUALITY
REQUIRED AMENDMENTSCOST
SOURCE / SUPPLYSALTS / QUALITY
REQUIRED AMENDMENTSCOST
IRRIGATION METHODDISTRIBUTION PATTERN IRRIGATION FREQUENCY
MONITORINGMAINTENANCE / REPAIR
OPERATING COSTCAPITAL COST
IRRIGATION METHODDISTRIBUTION PATTERN IRRIGATION FREQUENCY
MONITORINGMAINTENANCE / REPAIR
OPERATING COSTCAPITAL COST
SystemSystem
CropCrop
SoilSoil
WaterWater
California crops sit most firmly on a chair with 4 legs!
California crops sit most firmly on a chair with 4 legs!
1
PLANNING: QUANTIFYING SOIL WATER CHARACTERISTICS
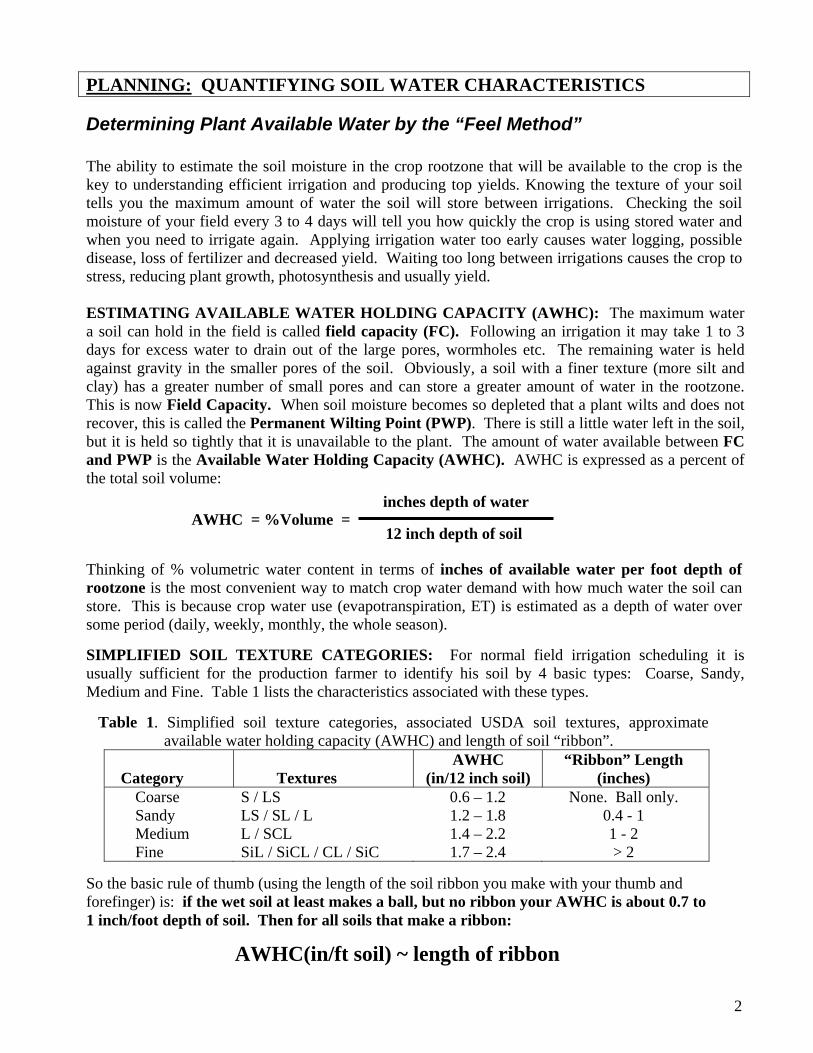
Determining Plant Available Water by the “Feel Method” The ability to estimate the soil moisture in the crop rootzone that will be available to the crop is the key to understanding efficient irrigation and producing top yields. Knowing the texture of your soil tells you the maximum amount of water the soil will store between irrigations. Checking the soil moisture of your field every 3 to 4 days will tell you how quickly the crop is using stored water and when you need to irrigate again. Applying irrigation water too early causes water logging, possible disease, loss of fertilizer and decreased yield. Waiting too long between irrigations causes the crop to stress, reducing plant growth, photosynthesis and usually yield. ESTIMATING AVAILABLE WATER HOLDING CAPACITY (AWHC): The maximum water a soil can hold in the field is called field capacity (FC). Following an irrigation it may take 1 to 3 days for excess water to drain out of the large pores, wormholes etc. The remaining water is held against gravity in the smaller pores of the soil. Obviously, a soil with a finer texture (more silt and clay) has a greater number of small pores and can store a greater amount of water in the rootzone. This is now Field Capacity. When soil moisture becomes so depleted that a plant wilts and does not recover, this is called the Permanent Wilting Point (PWP). There is still a little water left in the soil, but it is held so tightly that it is unavailable to the plant. The amount of water available between FC and PWP is the Available Water Holding Capacity (AWHC). AWHC is expressed as a percent of the total soil volume:
AWHC = %Volume =
inches depth of water
12 inch depth of soil Thinking of % volumetric water content in terms of inches of available water per foot depth of rootzone is the most convenient way to match crop water demand with how much water the soil can store. This is because crop water use (evapotranspiration, ET) is estimated as a depth of water over some period (daily, weekly, monthly, the whole season). SIMPLIFIED SOIL TEXTURE CATEGORIES: For normal field irrigation scheduling it is usually sufficient for the production farmer to identify his soil by 4 basic types: Coarse, Sandy, Medium and Fine. Table 1 lists the characteristics associated with these types.
Table 1. Simplified soil texture categories, associated USDA soil textures, approximate available water holding capacity (AWHC) and length of soil “ribbon”.
AWHC “Ribbon” Length (inches) Category Textures (in/12 inch soil)
Coarse S / LS 0.6 – 1.2 None. Ball only. Sandy LS / SL / L 1.2 – 1.8 0.4 - 1 Medium L / SCL 1.4 – 2.2 1 - 2 Fine SiL / SiCL / CL / SiC 1.7 – 2.4 > 2
So the basic rule of thumb (using the length of the soil ribbon you make with your thumb and forefinger) is: if the wet soil at least makes a ball, but no ribbon your AWHC is about 0.7 to 1 inch/foot depth of soil. Then for all soils that make a ribbon:
AWHC(in/ft soil) ~ length of ribbon
2
3
What this means is a field with sandy loam, (SL) has an AWHC of 1.2 to 1.6 in/ft. If this field is planted to blackeye beans or cotton rooted to a depth of 6 feet the soil can store a 7 to 9.5 inch depth of available water in the rootzone. A fine soil, like a silty clay loam (SiCL), can store 11 to 12 inches of water to 6 feet. For practical field irrigation scheduling you only want to use 50% to 60% of this total storage to avoid crop stress – about 4 inches for the SL and 6 inches for the SiCL. If the summer crop water use runs about 0.31 in/day then the sandy field needs water about every 12 to 15 days and the finer textured field needs water every 18 to 22 days. Soils with infiltration problems require more frequent irrigation. Table 2 shows the total AWHC for soils making different lengths of “ribbon” for coarse to fine soils for different rooting depths.
Table 2. Total available water holding capacity (AWHC) for different rootzone depths and length of soil ribbon.
Soil "Ribbon" AWHC (inches) for Rootzone Depth Length (in) 1.5 ft 3.0 ft 5.0 ft Ball Only 0.9 1.8 3.0
0.5 0.8 1.5 2.5 1.0 1.5 3.0 5.0 1.5 2.3 4.5 7.5 2.0 3.0 6.0 10.0 2.5 3.8 7.5 12.5
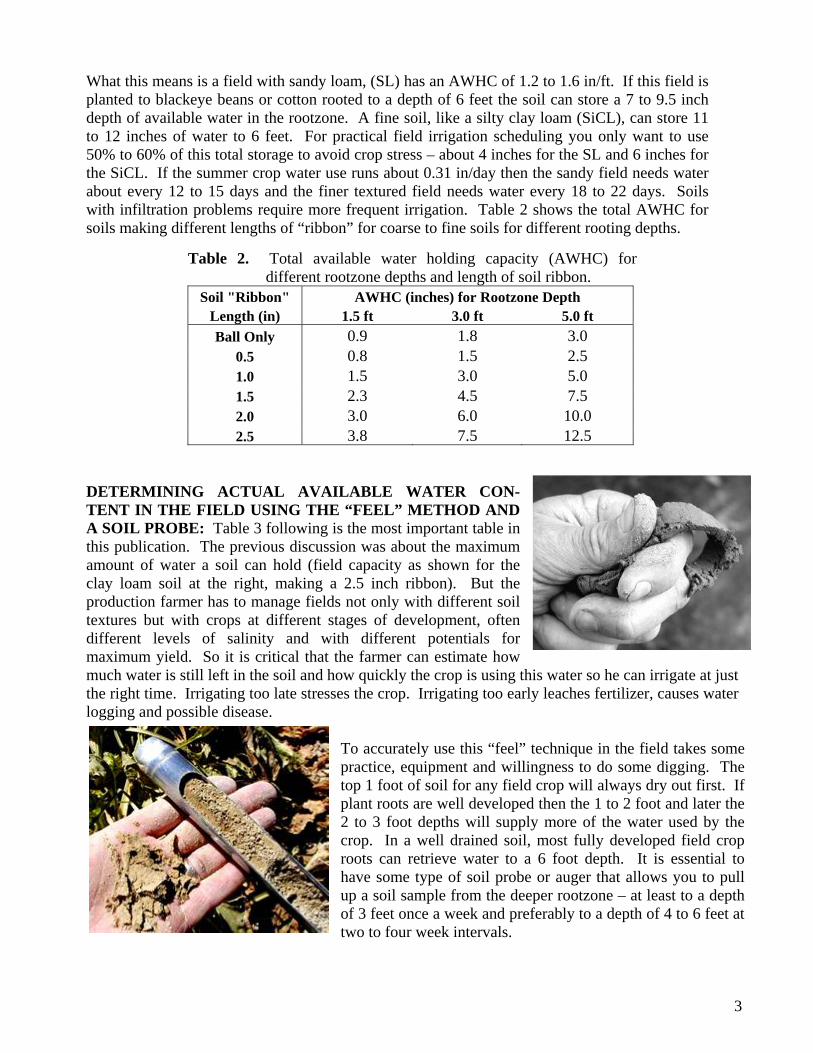
DETERMINING ACTUAL AVAILABLE WATER CON-TENT IN THE FIELD USING THE “FEEL” METHOD AND A SOIL PROBE: Table 3 following is the most important table in this publication. The previous discussion was about the maximum amount of water a soil can hold (field capacity as shown for the clay loam soil at the right, making a 2.5 inch ribbon). But the production farmer has to manage fields not only with different soil textures but with crops at different stages of development, often different levels of salinity and with different potentials for maximum yield. So it is critical that the farmer can estimate how much water is still left in the soil and how quickly the crop is using this water so he can irrigate at just the right time. Irrigating too late stresses the crop. Irrigating too early leaches fertilizer, causes water logging and possible disease.
To accurately use this “feel” technique in the field takes some practice, equipment and willingness to do some digging. The top 1 foot of soil for any field crop will always dry out first. If plant roots are well developed then the 1 to 2 foot and later the 2 to 3 foot depths will supply more of the water used by the crop. In a well drained soil, most fully developed field crop roots can retrieve water to a 6 foot depth. It is essential to have some type of soil probe or auger that allows you to pull up a soil sample from the deeper rootzone – at least to a depth of 3 feet once a week and preferably to a depth of 4 to 6 feet at two to four week intervals.
4
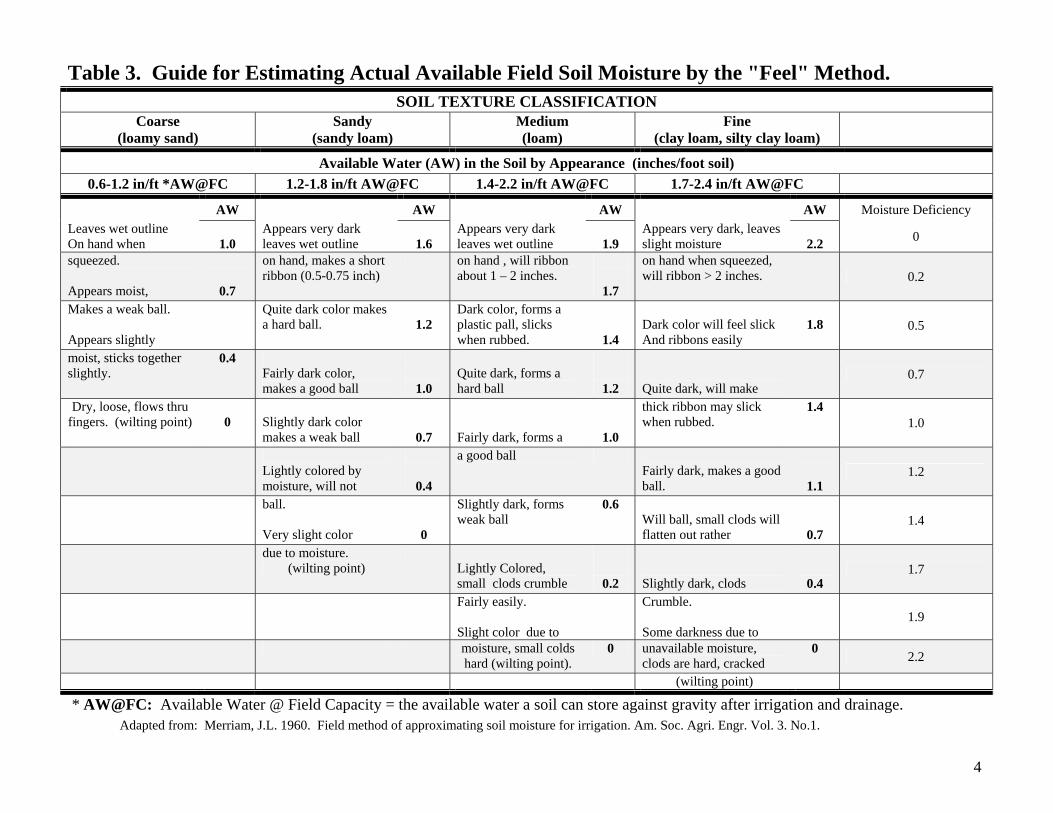
Table 3. Guide for Estimating Actual Available Field Soil Moisture by the "Feel" Method. SOIL TEXTURE CLASSIFICATION
Coarse (loamy sand)
Sandy (sandy loam)
Medium (loam)
Fine (clay loam, silty clay loam)
Available Water (AW) in the Soil by Appearance (inches/foot soil) 0.6-1.2 in/ft *AW@FC 1.2-1.8 in/ft AW@FC 1.4-2.2 in/ft AW@FC 1.7-2.4 in/ft AW@FC
AW AW AW AW Moisture Deficiency Leaves wet outline On hand when
1.0
Appears very dark leaves wet outline
1.6
Appears very dark leaves wet outline
1.9
Appears very dark, leaves slight moisture
2.2 0
squeezed. Appears moist,
0.7
on hand, makes a short ribbon (0.5-0.75 inch)
on hand , will ribbon about 1 – 2 inches.
1.7
on hand when squeezed, will ribbon > 2 inches.
0.2
Makes a weak ball. Appears slightly
Quite dark color makes a hard ball.
1.2
Dark color, forms a plastic pall, slicks when rubbed.
1.4
Dark color will feel slick And ribbons easily
1.8 0.5
moist, sticks together slightly.
0.4
Fairly dark color, makes a good ball
1.0
Quite dark, forms a hard ball
1.2
Quite dark, will make
0.7
Dry, loose, flows thru fingers. (wilting point)
0
Slightly dark color makes a weak ball
0.7
Fairly dark, forms a
1.0
thick ribbon may slick when rubbed.
1.4 1.0
Lightly colored by moisture, will not
0.4
a good ball
Fairly dark, makes a good ball.
1.1 1.2
ball. Very slight color
0
Slightly dark, forms weak ball
0.6 Will ball, small clods will flatten out rather
0.7 1.4
due to moisture. (wilting point)
Lightly Colored, small clods crumble
0.2
Slightly dark, clods
0.4 1.7
Fairly easily. Slight color due to
Crumble. Some darkness due to
1.9
moisture, small colds hard (wilting point).
0 unavailable moisture, clods are hard, cracked
0 2.2
(wilting point)
* AW@FC: Available Water @ Field Capacity = the available water a soil can store against gravity after irrigation and drainage. Adapted from: Merriam, J.L. 1960. Field method of approximating soil moisture for irrigation. Am. Soc. Agri. Engr. Vol. 3. No.1.

5
is too wet.
There are many different styles of probes available. In general, an open-faced “push probe” is the quickest to use when the soil is moist, but you are limited to a depth of 3 feet and it doesn’t work in rocky soils. Using an auger or screw probe with extension handles every 2 to 3 weeks will allow you to sample to a depth greater than 4 feet. This will tell you if you are losing your deep moisture too quickly (usually because of limiting infiltration that does not refill the rootzone every irrigation) or if the field Before probing, scrape the loose dirt back from the edge of the bed so it doesn’t fall down the hole. Then insert the probe near the edge of the wetted area in the furrow and pull out a sample for every 1 foot depth. Use Table 3 to estimate the available
water for each depth. The following guidelines provide a very quick, rough estimate of the % available moisture:
1. Ribbons easily: 90 – 100% 2. Plastic ball: 70 – 80% 3. Hard ball: 50 – 60% 4. Crumbly ball: < 50% Crop will begin to stress!
PLANNING: Using “hand feel soil texture” to estimate irrigation intervals for flood irrigation Table 4 shows the different irrigation intervals for flood almonds over the season appropriate for a given soil texture and average daily ET by month. This table shows that for most SL to CL soils that DO NOT have an infiltration problem a traditional 10 to 12 day irrigation interval during June and July is just about right for replacing 50% of the available soil moisture reserve to avoid stress. This is about 3 to 4 inches of water per irrigation. For sealing or saline soils the irrigation must be more frequent.
Table 4. Calculated almond flood irrigation interval (days of moisture reserve) by month and soil texture.
Apr May Jun Jul AugSoil Texture Avg Daily ET 0.15 0.23 0.28 0.33 0.25
Sand 1.4 9 6 5 4 6Loamy Sand 2.2 15 10 8 7 9Sandy Loam 2.8 19 12 10 8 11Loam 3.6 24 16 13 11 14Silt Loam 3.6 24 16 13 11 14Sandy Clay Loam 2.6 17 11 9 8 10Sandy Clay 3.2 21 14 11 10 13Clay Loam 3.4 23 15 12 10 14Silty Clay Loam 3.8 25 17 14 12 15Silty Clay 4.8 32 21 17 15 19Clay 4.4 29 19 16 13 18
Available Soil Moisture to 4 feet @ 50% depletion (in)
Mature Almonds(S. San Joaquin Valley)
Days of Moisture Reserve for Average Daily ET by Month
Assume managed rooting depth of 4 feet
After Ratliff LF, Ritchie JT, Cassel DK. 1983. Field-measured limits of soil water availability as related to laboratory-measured properties. Soil Sci Soc Am. 47:770-5.
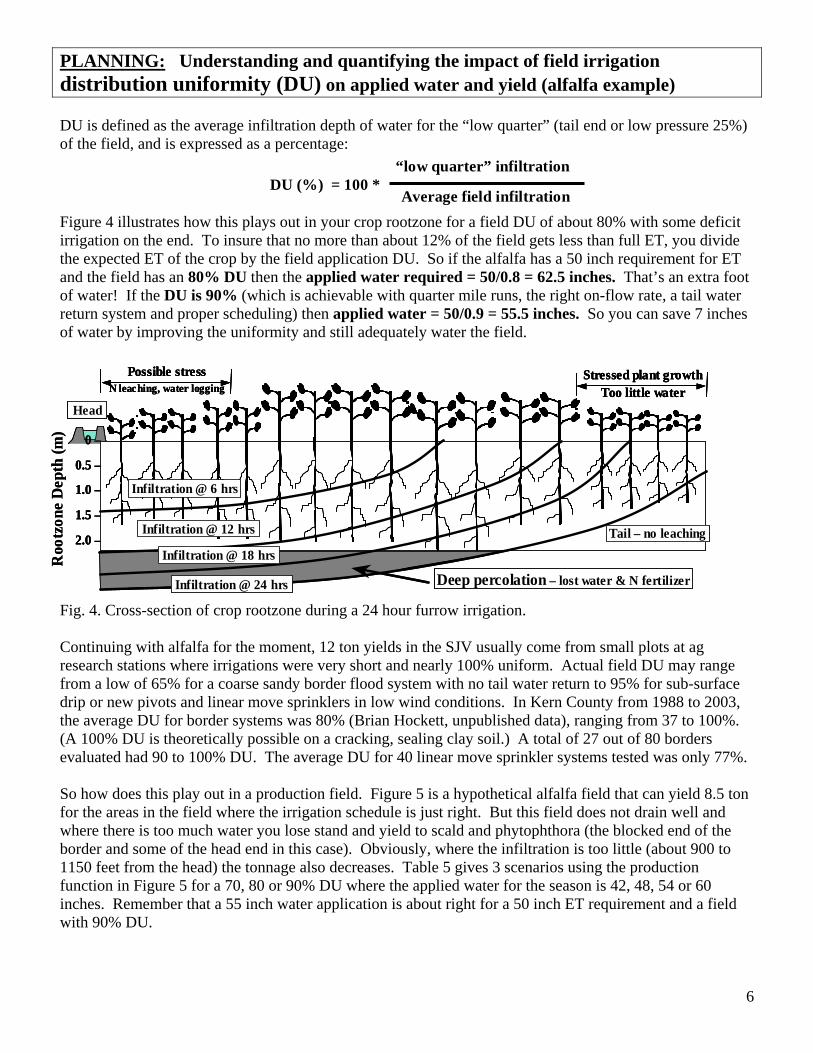
PLANNING: Understanding and quantifying the impact of field irrigation distribution uniformity (DU) on applied water and yield (alfalfa example) DU is defined as the average infiltration depth of water for the “low quarter” (tail end or low pressure 25%) of the field, and is expressed as a percentage:
DU (%) = 100 *
“low quarter” infiltration
Average field infiltration
Figure 4 illustrates how this plays out in your crop rootzone for a field DU of about 80% with some deficit irrigation on the end. To insure that no more than about 12% of the field gets less than full ET, you divide the expected ET of the crop by the field application DU. So if the alfalfa has a 50 inch requirement for ET and the field has an 80% DU then the applied water required = 50/0.8 = 62.5 inches. That’s an extra foot of water! If the DU is 90% (which is achievable with quarter mile runs, the right on-flow rate, a tail water return system and proper scheduling) then applied water = 50/0.9 = 55.5 inches. So you can save 7 inches of water by improving the uniformity and still adequately water the field.
0 –
0.5 –
1.0 –
1.5 –
2.0 –
Stressed plant growthToo little water
Possible stressN leaching, water logging
Infiltration @ 6 hrs
Infiltration @ 12 hrs
Infiltration @ 18 hrs
Infiltration @ 24 hrs
Head
Tail – no leaching
Roo
tzon
e D
epth
(m)
Deep percolation – lost water & N fertilizer
0 –
0.5 –
1.0 –
1.5 –
2.0 –
0 –
0.5 –
1.0 –
1.5 –
2.0 –
Stressed plant growthToo little water
Stressed plant growthToo little water
Possible stressN leaching, water logging
Possible stressN leaching, water logging
Infiltration @ 6 hrs
Infiltration @ 12 hrs
Infiltration @ 18 hrs
Infiltration @ 24 hrs
Head
Tail – no leaching
Roo
tzon
e D
epth
(m)
Deep percolation – lost water & N fertilizer
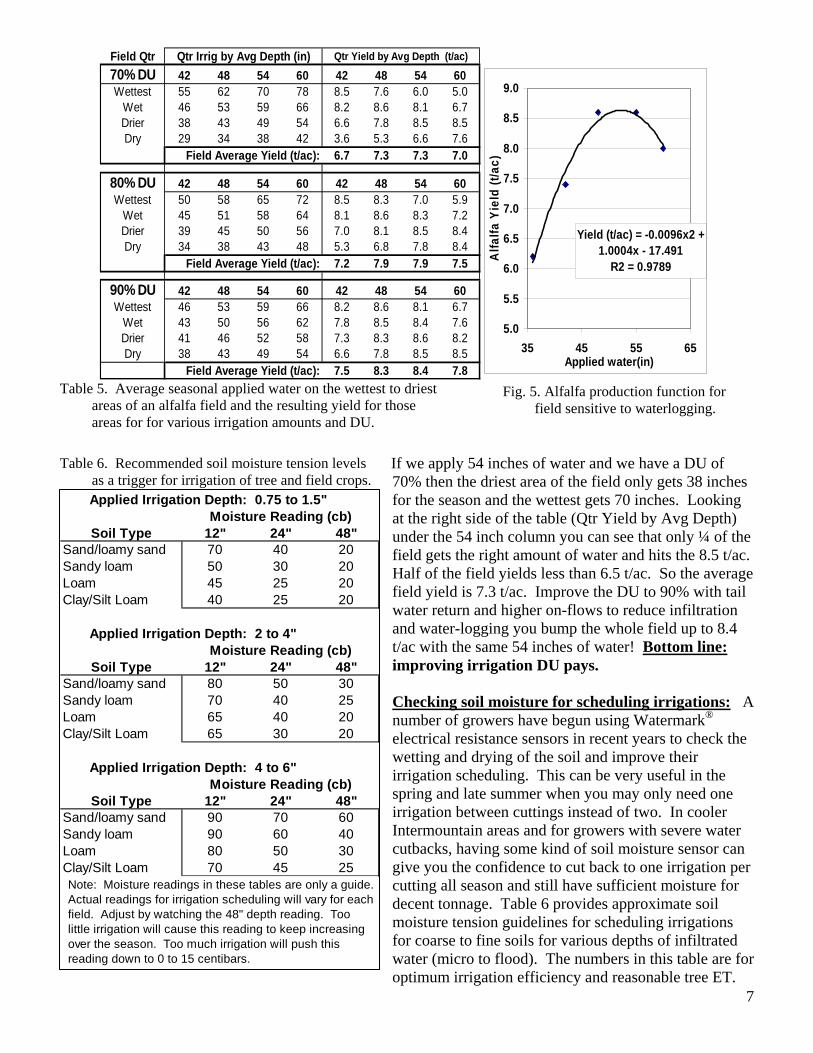
Fig. 4. Cross-section of crop rootzone during a 24 hour furrow irrigation. Continuing with alfalfa for the moment, 12 ton yields in the SJV usually come from small plots at ag research stations where irrigations were very short and nearly 100% uniform. Actual field DU may range from a low of 65% for a coarse sandy border flood system with no tail water return to 95% for sub-surface drip or new pivots and linear move sprinklers in low wind conditions. In Kern County from 1988 to 2003, the average DU for border systems was 80% (Brian Hockett, unpublished data), ranging from 37 to 100%. (A 100% DU is theoretically possible on a cracking, sealing clay soil.) A total of 27 out of 80 borders evaluated had 90 to 100% DU. The average DU for 40 linear move sprinkler systems tested was only 77%. So how does this play out in a production field. Figure 5 is a hypothetical alfalfa field that can yield 8.5 ton for the areas in the field where the irrigation schedule is just right. But this field does not drain well and where there is too much water you lose stand and yield to scald and phytophthora (the blocked end of the border and some of the head end in this case). Obviously, where the infiltration is too little (about 900 to 1150 feet from the head) the tonnage also decreases. Table 5 gives 3 scenarios using the production function in Figure 5 for a 70, 80 or 90% DU where the applied water for the season is 42, 48, 54 or 60 inches. Remember that a 55 inch water application is about right for a 50 inch ET requirement and a field with 90% DU.
6
Field Qtr70% DU 42 48 54 60 42 48 54 60 36 6.2Wettest 55 62 70 78 8.5 7.6 6.0 5.0 42 7.4
Wet 46 53 59 66 8.2 8.6 8.1 6.7 48 8.6Drier 38 43 49 54 6.6 7.8 8.5 8.5 55 8.6Dry 29 34 38 42 3.6 5.3 6.6 7.6 60 8.000
6.7 7.3 7.3 7.0
80% DU 42 48 54 60 42 48 54 60Wettest 50 58 65 72 8.5 8.3 7.0 5.9
Wet 45 51 58 64 8.1 8.6 8.3 7.2Drier 39 45 50 56 7.0 8.1 8.5 8.4Dry 34 38 43 48 5.3 6.8 7.8 8.4
7.2 7.9 7.9 7.5
90% DU 42 48 54 60 42 48 54 60Wettest 46 53 59 66 8.2 8.6 8.1 6.7
Wet 43 50 56 62 7.8 8.5 8.4 7.6Drier 41 46 52 58 7.3 8.3 8.6 8.2Dry 38 43 49 54 6.6 7.8 8.5 8.5
7.5 8.3 8.4 7.8
Qtr Irrig by Avg Depth (in) Qtr Yield by Avg Depth (t/ac)
Field Average Yield (t/ac):
Field Average Yield (t/ac):
Field Average Yield (t/ac):
Yield (t/ac) = -0.0096x2 + 1.0004x - 17.491
R2 = 0.9789
5.0
5.5
6.0
6.5
7.0
7.5
8.0
8.5
9.0
35 45 55 65Applied water(in)
Alfa
lfa Y
ield
(t/a
c)
Table 5. Average seasonal applied water on the wettest to driest
areas of an alfalfa field and the resulting yield for those areas for for various irrigation amounts and DU.
Fig. 5. Alfalfa production function for field sensitive to waterlogging.
If we apply 54 inches of water and we have a DU of 70% then the driest area of the field only gets 38 inches for the season and the wettest gets 70 inches. Looking at the right side of the table (Qtr Yield by Avg Depth) under the 54 inch column you can see that only ¼ of the field gets the right amount of water and hits the 8.5 t/ac. Half of the field yields less than 6.5 t/ac. So the average field yield is 7.3 t/ac. Improve the DU to 90% with tail water return and higher on-flows to reduce infiltration and water-logging you bump the whole field up to 8.4 t/ac with the same 54 inches of water!
Table 6. Recommended soil moisture tension levels as a trigger for irrigation of tree and field crops.
Applied Irrigation Depth: 0.75 to 1.5"Moisture Reading (cb)
Soil Type 12" 24" 48"Sand/loamy sand 70 40 20Sandy loam 50 30 20Loam 45 25 20Clay/Silt Loam 40 25 20
Applied Irrigation Depth: 2 to 4"Moisture Reading (cb)
Soil Type 12" 24" 48"Sand/loamy sand 80 50 30Sandy loam 70 40 25Loam 65 40 20Clay/Silt Loam 65 30 20
Applied Irrigation Depth: 4 to 6"Moisture Reading (cb)
Soil Type 12" 24" 48"Sand/loamy sand 90 70 60Sandy loam 90 60 40Loam 80 50 30Clay/Silt Loam 70 45 25Note: Moisture readings in these tables are only a guide. Actual readings for irrigation scheduling will vary for each field. Adjust by watching the 48" depth reading. Too little irrigation will cause this reading to keep increasing over the season. Too much irrigation will push this reading down to 0 to 15 centibars.
Bottom line: improving irrigation DU pays. Checking soil moisture for scheduling irrigations: A number of growers have begun using Watermark®
7
electrical resistance sensors in recent years to check the wetting and drying of the soil and improve their irrigation scheduling. This can be very useful in the spring and late summer when you may only need one irrigation between cuttings instead of two. In cooler Intermountain areas and for growers with severe water cutbacks, having some kind of soil moisture sensor can give you the confidence to cut back to one irrigation per cutting all season and still have sufficient moisture for decent tonnage. Table 6 provides approximate soil moisture tension guidelines for scheduling irrigations for coarse to fine soils for various depths of infiltrated water (micro to flood). The numbers in this table are for optimum irrigation efficiency and reasonable tree ET.
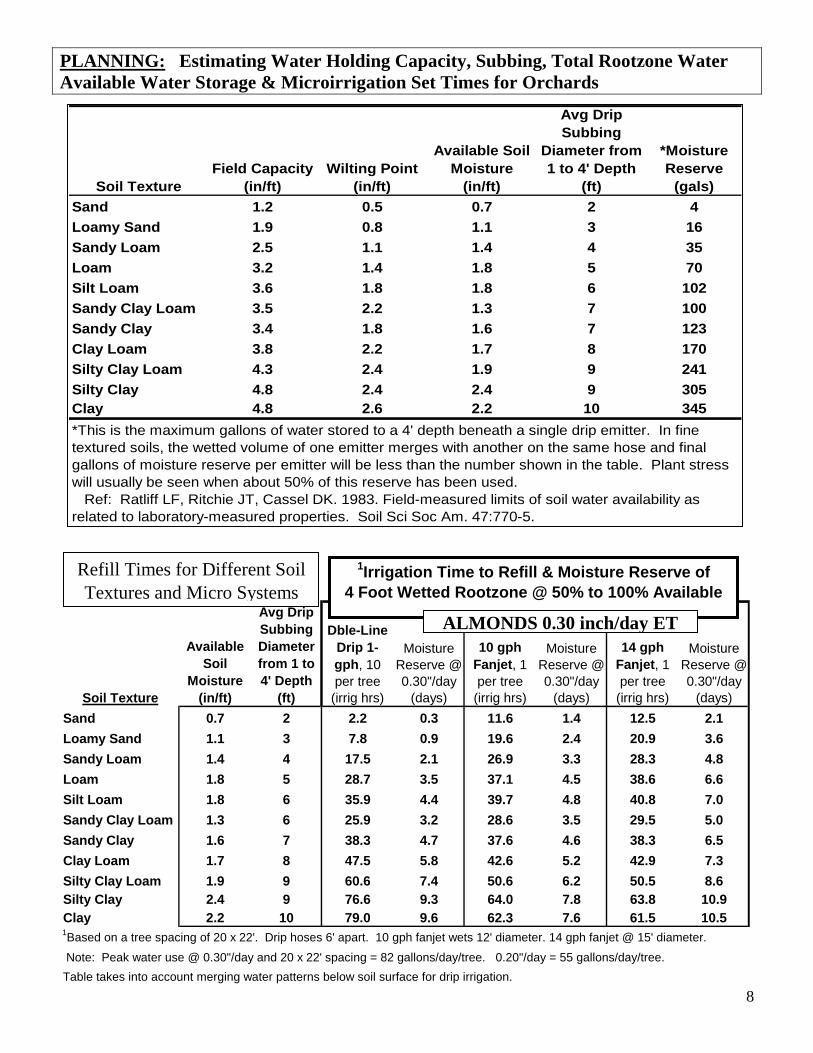
PLANNING: Estimating Water Holding Capacity, Subbing, Total Rootzone Water Available Water Storage & Microirrigation Set Times for Orchards
Soil TextureField Capacity
(in/ft)Wilting Point
(in/ft)
Available Soil Moisture
(in/ft)
Avg Drip Subbing
Diameter from 1 to 4' Depth
(ft)
*Moisture Reserve
(gals)Sand 1.2 0.5 0.7 2 4Loamy Sand 1.9 0.8 1.1 3 16Sandy Loam 2.5 1.1 1.4 4 35Loam 3.2 1.4 1.8 5 70Silt Loam 3.6 1.8 1.8 6 102Sandy Clay Loam 3.5 2.2 1.3 7 100Sandy Clay 3.4 1.8 1.6 7 123Clay Loam 3.8 2.2 1.7 8 170Silty Clay Loam 4.3 2.4 1.9 9 241Silty Clay 4.8 2.4 2.4 9 305Clay 4.8 2.6 2.2 10 345*This is the maximum gallons of water stored to a 4' depth beneath a single drip emitter. In fine textured soils, the wetted volume of one emitter merges with another on the same hose and final gallons of moisture reserve per emitter will be less than the number shown in the table. Plant stress will usually be seen when about 50% of this reserve has been used. Ref: Ratliff LF, Ritchie JT, Cassel DK. 1983. Field-measured limits of soil water availability as related to laboratory-measured properties. Soil Sci Soc Am. 47:770-5.
Soil Texture
Available Soil
Moisture (in/ft)
Avg Drip Subbing Diameter from 1 to 4' Depth
(ft)
Dble-Line Drip 1-gph, 10 per tree
(irrig hrs)
Moisture Reserve @ 0.30"/day
(days)
10 gph Fanjet, 1 per tree
(irrig hrs)
Moisture Reserve @ 0.30"/day
(days)
14 gph Fanjet, 1 per tree
(irrig hrs)
Moisture Reserve @ 0.30"/day
(days)Sand 0.7 2 2.2 0.3 11.6 1.4 12.5 2.1Loamy Sand 1.1 3 7.8 0.9 19.6 2.4 20.9 3.6Sandy Loam 1.4 4 17.5 2.1 26.9 3.3 28.3 4.8Loam 1.8 5 28.7 3.5 37.1 4.5 38.6 6.6Silt Loam 1.8 6 35.9 4.4 39.7 4.8 40.8 7.0Sandy Clay Loam 1.3 6 25.9 3.2 28.6 3.5 29.5 5.0Sandy Clay 1.6 7 38.3 4.7 37.6 4.6 38.3 6.5Clay Loam 1.7 8 47.5 5.8 42.6 5.2 42.9 7.3Silty Clay Loam 1.9 9 60.6 7.4 50.6 6.2 50.5 8.6Silty Clay 2.4 9 76.6 9.3 64.0 7.8 63.8 10.9Clay 2.2 10 79.0 9.6 62.3 7.6 61.5 10.51Based on a tree spacing of 20 x 22'. Drip hoses 6' apart. 10 gph fanjet wets 12' diameter. 14 gph fanjet @ 15' diameter.
Note: Peak water use @ 0.30"/day and 20 x 22' spacing = 82 gallons/day/tree. 0.20"/day = 55 gallons/day/tree.Table takes into account merging water patterns below soil surface for drip irrigation.
1Irrigation Time to Refill & Moisture Reserve of4 Foot Wetted Rootzone @ 50% to 100% Available
Refill Times for Different Soil Textures and Micro Systems
ALMONDS 0.30 inch/day ET
8

Kern County � 1031 S. Mt. Vernon Ave, Bakersf ie ld CA 93307 � Telephone: (661) 868-6218 PLANNING: Using technology to monitor soil moisture
The best key to unlock efficient irrigation practice is to know exactly how much water your crop uses and replace it in a timely fashion that matches your irrigation system capacity and avoids crop stress and water logging. We have good “normal year” estimates of citrus water use (evapotranspiration, ET) for the San Joaquin Valley, but as any grower knows very few blocks are “normal”. The Frost Nucellar on the Cajon loamy sand and fanjets in Edison doesn’t behave the same as the Fukumotos planted to double-line drip on an Exeter clay loam.
So what’s the trick for hitting optimum water management for a particular block? You have to keep account of your soil moisture reservoir in the crop rootzone. Tracking soil moisture tells you whether you’re putting on too much or too little water to meet crop needs. It’s also the key to increasing fruit set and quality in many crops such as canning tomatoes, improving flavor in most wine grape varieties and possibly help control puff and crease in citrus.
But any farmer and most ag consultants will tell you that checking soil moisture is not for the faint of heart because it requires auguring holes, pounding a soil probe, and/or installing moisture monitoring instruments to depths of 2 to 6 feet depending on the crop. Checking instruments or hand probing needs to be done on at least a weekly basis to be useful.
After pushing, twisting, pounding and digging thousands of holes in hundreds of fields around the San Joaquin Valley I can testify to the fact that this is only slightly more fun than shoveling manure, and it’s a whole lot harder on your shoulders and wrists. The result is that it’s not done very often, if at all, and farmers tend to stick to a traditional irrigation schedule. Given all the other decisions and details growers have to see to on a daily basis it’s not surprising this activity gets pushed to the side. At the same time, the years of experience a farmer has with a crop and with a particular field often give him an intuitive sense of how to run the water and end up being 75 to 90% efficient anyway! So if you’re already this efficient why check moisture anyway?
There are two reasons: 1) You’re not really sure that you’re at the optimum point of the crop water use curve until you check, and 2) The simple math of cost versus benefit. Water monitoring consulting services run around $15/acre/season depending on total acreage and what degree of technology and reporting you want done. If this is the only cost you incur to get the extra 5% out of a 3-bale cotton crop then you’ve made an extra $22/acre even if cotton is only 50 cents/lb. Even at just $2 net/box, an extra 15 boxes of grapes or extra fancy oranges is a 100% return on your $15 investment.
Many growers have tried tensiometers in the past and usually get fed up with the maintenance. A new generation of medium and high technology sensors are now available to growers and consultants. The huge diversity sensors can be intimidating at first glance but these systems can make this job easier, more accurate and even more affordable. The biggest advantage to the new technology is the use of a continuously recording data logger coupled to responsive soil moisture sensors.
A series of irrigation management/monitoring demonstrations by UC Cooperative Extension over the last 3 years in Kern County has looked at using a combination of 6 granular matrix electrical resistance blocks (Watermark®) coupled to a logger with a graphic display (Hansen AM400®, pictured above) to allow growers a “push button” look at 5 weeks of soil moisture history at any time during the season. The cost of this system is about $600 and should be good for 3 to 5 years. This gives growers a look at the dynamic changes in soil moisture due to actual crop water use and subsequent recharge of the profile during irrigation. The pattern of the peaks and rate of change of these readings is more useful than the actual numbers themselves. Many different sensors and loggers provide this type of information but the AM400/Watermark system is the only combination providing a graphic display in the field without having to download to a computer. Computer downloads can also be done anytime during the season to develop charts such as those shown below.
9
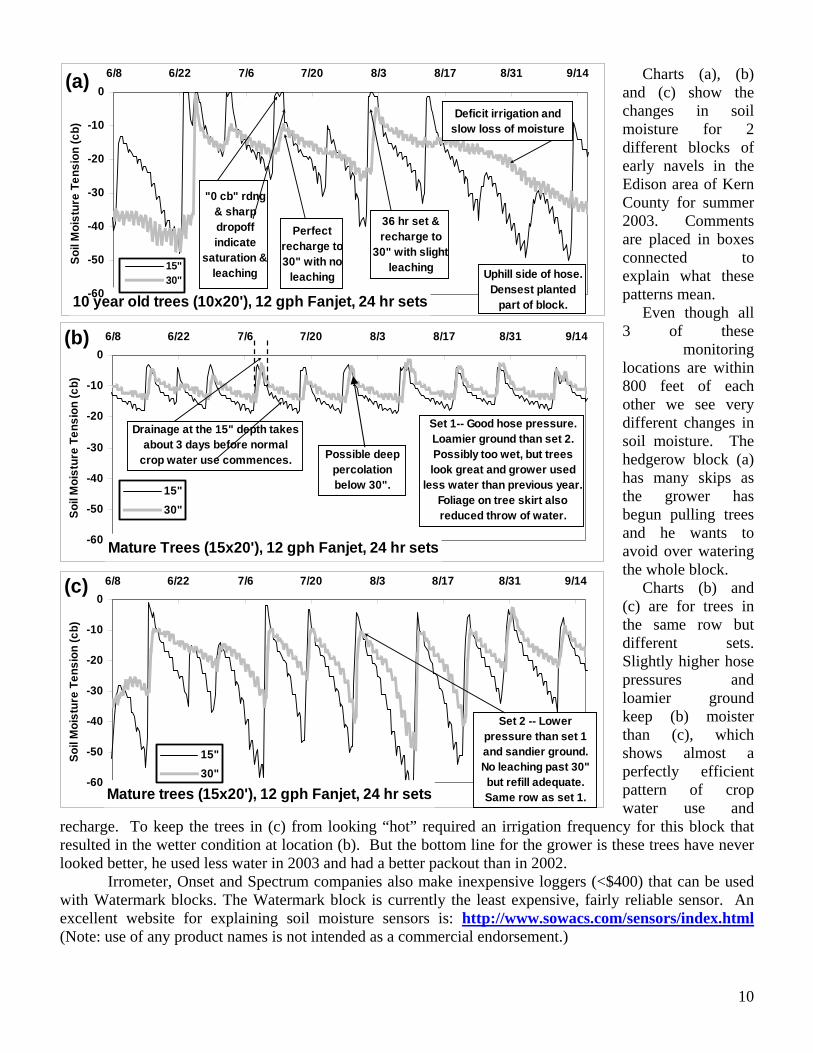
Charts (a), (b) and (c) show the changes in soil moisture for 2 different blocks of early navels in the Edison area of Kern County for summer 2003. Comments are placed in boxes connected to explain what these patterns mean.
10
Even though all 3 of these
monitoring locations are within 800 feet of each other we see very different changes in soil moisture. The hedgerow block (a) has many skips as the grower has begun pulling trees and he wants to avoid over watering the whole block. Charts (b) and (c) are for trees in the same row but different sets. Slightly higher hose pressures and loamier ground keep (b) moister than (c), which shows almost a perfectly efficient pattern of crop water use and
recharge. To keep the trees in (c) from looking “hot” required an irrigation frequency for this block that resulted in the wetter condition at location (b). But the bottom line for the grower is these trees have never looked better, he used less water in 2003 and had a better packout than in 2002.
10 year old trees (10x20'), 12 gph Fanjet, 24 hr sets-60
-50
-40
-30
-20
-10
06/8 6/22 7/6 7/20 8/3 8/17 8/31 9/14
Soil
Moi
stur
e Te
nsio
n (c
b)
15"30"
"0 cb" rdng & sharp dropoff indicate
saturation & leaching
Perfect recharge to30" with no
leaching
36 hr set & recharge to
30" with slight leaching
Deficit irrigation and slow loss of moisture
Uphill side of hose. Densest planted
part of block.
(a)
Mature Trees (15x20'), 12 gph Fanjet, 24 hr sets-60
-50
-40
-30
-20
-10
06/8 6/22 7/6 7/20 8/3 8/17 8/31 9/14
Soil
Moi
stur
e Te
nsio
n (c
b)
15"30"
Set 1-- Good hose pressure. Loamier ground than set 2. Possibly too wet, but trees look great and grower used
less water than previous year. Foliage on tree skirt also reduced throw of water.
Drainage at the 15" depth takes about 3 days before normal
crop water use commences. Possible deep percolation below 30".
(b)
Mature trees (15x20'), 12 gph Fanjet, 24 hr sets-60
-50
-40
-30
-20
-10
06/8 6/22 7/6 7/20 8/3 8/17 8/31 9/14
Soil
Moi
stur
e Te
nsio
n (c
b)
15"30"
Set 2 -- Lower pressure than set 1 and sandier ground. No leaching past 30" but refill adequate. Same row as set 1.
(c)
Irrometer, Onset and Spectrum companies also make inexpensive loggers (<$400) that can be used with Watermark blocks. The Watermark block is currently the least expensive, fairly reliable sensor. An excellent website for explaining soil moisture sensors is: http://www.sowacs.com/sensors/index.html (Note: use of any product names is not intended as a commercial endorsement.)
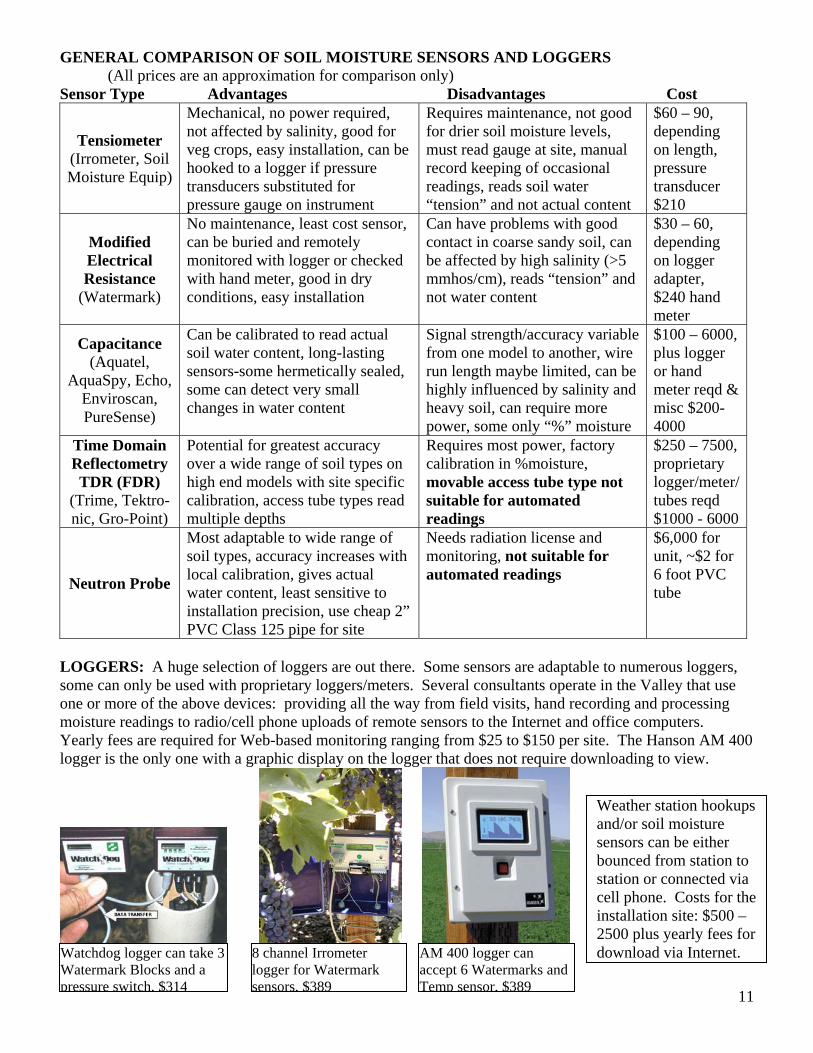
GENERAL COMPARISON OF SOIL MOISTURE SENSORS AND LOGGERS (All prices are an approximation for comparison only) Sensor Type Advantages Disadvantages Cost
Mechanical, no power required, not affected by salinity, good for veg crops, easy installation, can be hooked to a logger if pressure transducers substituted for pressure gauge on instrument
Requires maintenance, not good for drier soil moisture levels, must read gauge at site, manual record keeping of occasional readings, reads soil water “tension” and not actual content
$60 – 90, depending on length, pressure transducer $210
Tensiometer (Irrometer, Soil Moisture Equip)
No maintenance, least cost sensor, can be buried and remotely monitored with logger or checked with hand meter, good in dry conditions, easy installation
Can have problems with good contact in coarse sandy soil, can be affected by high salinity (>5 mmhos/cm), reads “tension” and not water content
$30 – 60, Modified Electrical Resistance
depending on logger adapter, $240 hand meter
(Watermark)
Can be calibrated to read actual soil water content, long-lasting sensors-some hermetically sealed, some can detect very small changes in water content
Signal strength/accuracy variable from one model to another, wire run length maybe limited, can be highly influenced by salinity and heavy soil, can require more power, some only “%” moisture
$100 – 6000, plus logger or hand meter reqd & misc $200-4000
Capacitance (Aquatel,
AquaSpy, Echo, Enviroscan, PureSense)
Time Domain Reflectometry TDR (FDR)
Potential for greatest accuracy over a wide range of soil types on high end models with site specific calibration, access tube types read multiple depths
Requires most power, factory calibration in %moisture, movable access tube type not suitable for automated readings
$250 – 7500, proprietary logger/meter/ tubes reqd $1000 - 6000
(Trime, Tektro-nic, Gro-Point)
Most adaptable to wide range of soil types, accuracy increases with local calibration, gives actual water content, least sensitive to installation precision, use cheap 2” PVC Class 125 pipe for site
Needs radiation license and monitoring, not suitable for automated readings
$6,000 for unit, ~$2 for 6 foot PVC tube Neutron Probe
LOGGERS: A huge selection of loggers are out there. Some sensors are adaptable to numerous loggers, some can only be used with proprietary loggers/meters. Several consultants operate in the Valley that use one or more of the above devices: providing all the way from field visits, hand recording and processing moisture readings to radio/cell phone uploads of remote sensors to the Internet and office computers. Yearly fees are required for Web-based monitoring ranging from $25 to $150 per site. The Hanson AM 400 logger is the only one with a graphic display on the logger that does not require downloading to view.
11
Weather station hookups and/or soil moisture sensors can be either bounced from station to station or connected via cell phone. Costs for the installation site: $500 – 2500 plus yearly fees for download via Internet. Watchdog logger can take 3
Watermark Blocks and a pressure switch, $314
8 channel Irrometer logger for Watermark sensors, $389
AM 400 logger can accept 6 Watermarks and Temp sensor, $389
12
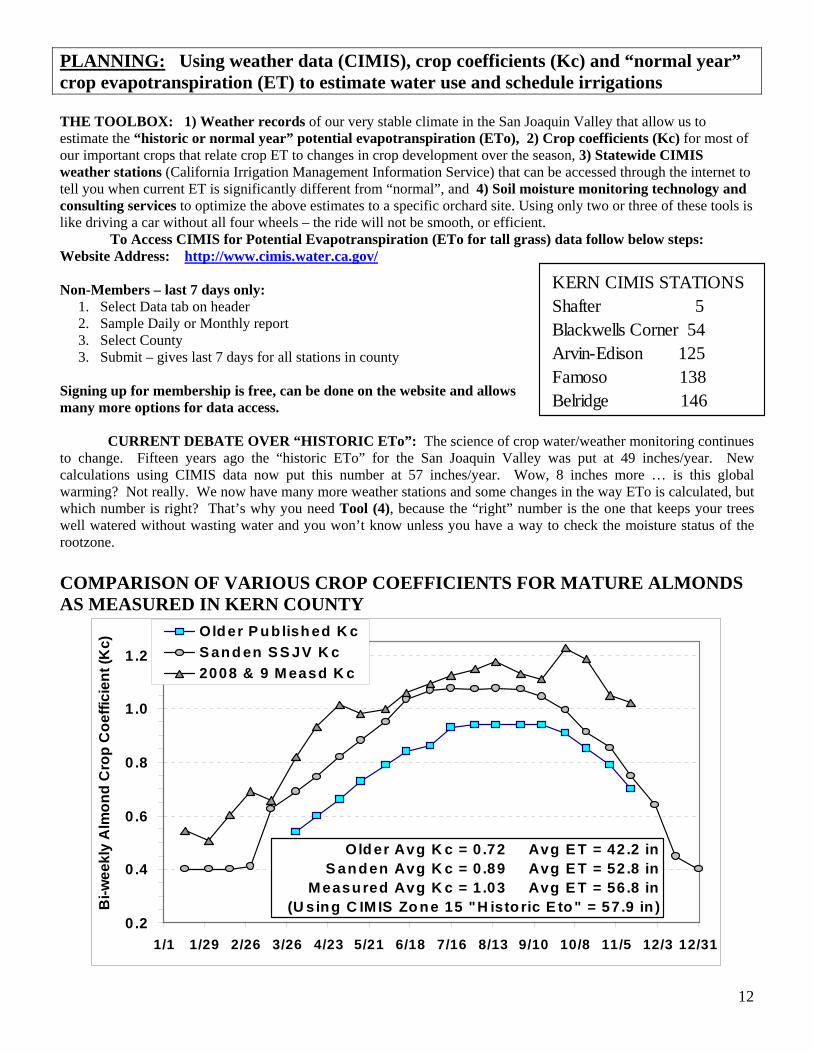
PLANNING: Using weather data (CIMIS), crop coefficients (Kc) and “normal year” crop evapotranspiration (ET) to estimate water use and schedule irrigations THE TOOLBOX: 1) Weather records of our very stable climate in the San Joaquin Valley that allow us to estimate the “historic or normal year” potential evapotranspiration (ETo), 2) Crop coefficients (Kc) for most of our important crops that relate crop ET to changes in crop development over the season, 3) Statewide CIMIS weather stations (California Irrigation Management Information Service) that can be accessed through the internet to tell you when current ET is significantly different from “normal”, and 4) Soil moisture monitoring technology and consulting services to optimize the above estimates to a specific orchard site. Using only two or three of these tools is like driving a car without all four wheels – the ride will not be smooth, or efficient.
To Access CIMIS for Potential Evapotranspiration (ETo for tall grass) data follow below steps: Website Address: Non-Members – last 7 days only:
http://www.cimis.water.ca.gov/
1. Select Data tab on header 2. Sample Daily or Monthly report 3. Select County 3. Submit – gives last 7 days for all stations in county Signing up for membership is free, can be done on the website and allows many more options for data access. CURRENT DEBATE OVER “HISTORIC ETo”: The science of crop water/weather monitoring continues to change. Fifteen years ago the “historic ETo” for the San Joaquin Valley was put at 49 inches/year. New calculations using CIMIS data now put this number at 57 inches/year. Wow, 8 inches more … is this global warming? Not really. We now have many more weather stations and some changes in the way ETo is calculated, but which number is right? That’s why you need Tool (4), because the “right” number is the one that keeps your trees well watered without wasting water and you won’t know unless you have a way to check the moisture status of the rootzone.
COMPARISON OF VARIOUS CROP COEFFICIENTS FOR MATURE ALMONDS AS MEASURED IN KERN COUNTY
0.2
0 .4
0 .6
0 .8
1 .0
1 .2
1/1 1/29 2/26 3/26 4/23 5/21 6/18 7/16 8/13 9/10 10/8 1
Bi-w
eekl
y A
lmon
d C
rop
Coe
ffici
ent (
Kc)
1 /5 12/3 12/31
2008 & 9 M easd K cS and en S S JV K cOlder P ub lish ed K c
Old er Avg K c = 0 .72 Avg E T = 4S anden Avg K c = 0 .89 Avg E T =
M easured Avg K c = 1 .03 Avg E T =(U sing C IM IS Zo ne 15 "H istoric E to" = 5
2 .2 in 52 .8 in 56 .8 in
7 .9 in )
KERN CIMIS STATIONSShafter 5Blackwells Corner 54Arvin-Edison 125Famoso 138Belridge 146
13
0%
20%
40%
60%
80%
100%
120%
2/21
3/14 4/
4
4/25
5/16 6/
6
6/27
7/18 8/
8
8/29
9/19
10/1
0
10/3
1
11/2
1
Ava
ilabl
e W
ater
Sto
red
in R
ootz
one
0.5
1.0
1.5
2.0
2.5
3.0
3.5
Wat
er C
onte
nt @
Dep
th (i
n/ft)
5'Entire Rootzone 1' 3'
STORED SOIL MOISTURE0%
20%
40%
60%
80%
100%
120%
2/21
3/14 4/
4
4/25
5/16 6/
6
6/27
7/18 8/
8
8/29
9/19
10/1
0
10/3
1
11/2
1
Ava
ilabl
e W
ater
Sto
red
in R
ootz
one
0.5
1.0
1.5
2.0
2.5
3.0
3.5
Wat
er C
onte
nt @
Dep
th (i
n/ft)
Entire Rootzone 1' 3' 5'
STORED SOIL MOISTURE
Nonpareil AlmondFull Irrigation -- 57.6 inches
Millham Sandy Loam-200
-175
-150
-125
-100
-75
-50
-25
01/19 2/16 3/16 4/13 5/11 6/8 7/6 8/3 8/31 9/28 10/26 11/23
Soil
Moi
stur
e Te
nsio
n (c
b)
18"36"60"
Nonpareil AlmondReduced Irrigation -- 47.1 inches
Millham Sandy Loam
-200
-175
-150
-125
-100
-75
-50
-25
01/19 2/16 3/16 4/13 5/11 6/8 7/6 8/3 8/31 9/28 10/26 11/23
Soil
Moi
stur
e Te
nsio
n (c
b)
18"36"60"
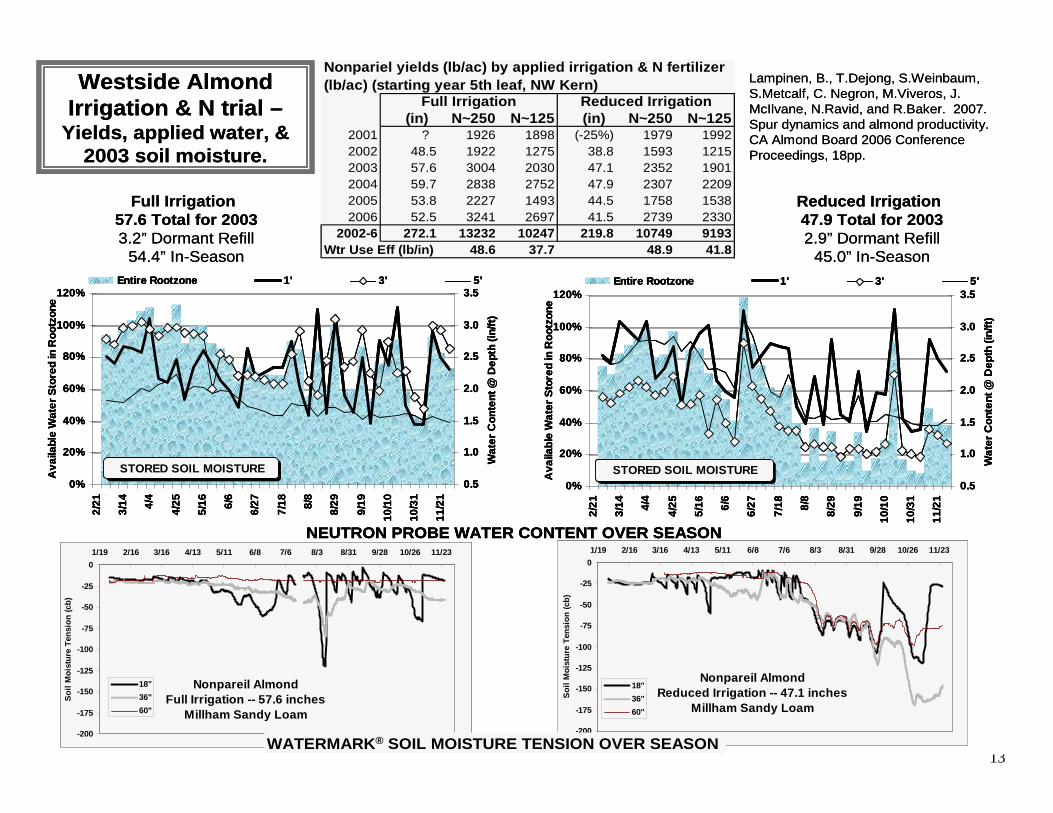
WATERMARK® SOIL MOISTURE TENSION OVER SEASON
NEUTRON PROBE WATER CONTENT OVER SEASON
Lampinen, B., T.Dejong, S.Weinbaum, S.Metcalf, C. Negron, M.Viveros, J. McIlvane, N.Ravid, and R.Baker. 2007. Spur dynamics and almond productivity. CA Almond Board 2006 Conference Proceedings, 18pp.
Westside Almond Irrigation & N trial –
Yields, applied water, & 2003 soil moisture.
Reduced Irrigation 47.9 Total for 2003 2.9” Dormant Refill
45.0” In-Season
Full Irrigation 57.6 Total for 2003 3.2” Dormant Refill
54.4” In-Season
(in) N~250 N~125 (in) N~250 N~1252001 ? 1926 1898 (-25%) 1979 19922002 48.5 1922 1275 38.8 1593 12152003 57.6 3004 2030 47.1 2352 19012004 59.7 2838 2752 47.9 2307 22092005 53.8 2227 1493 44.5 1758 15382006 52.5 3241 2697 41.5 2739 2330
2002-6 272.1 13232 10247 219.8 10749 9193Wtr Use Eff (lb/in) 48.6 37.7 48.9 41.8
Nonpariel yields (lb/ac) by applied irrigation & N fertilizer (lb/ac) (starting year 5th leaf, NW Kern)
Full Irrigation Reduced Irrigation
0%
20%
40%
60%
80%
100%
120%
2/21
3/14 4/
4
4/25
5/16 6/
6
6/27
7/18 8/
8
8/29
9/19
10/1
0
10/3
1
11/2
1
Ava
ilabl
e W
ater
Sto
red
in R
ootz
one
0.5
1.0
1.5
2.0
2.5
3.0
3.5
Wat
er C
onte
nt @
Dep
th (i
n/ft)
5'Entire Rootzone 1' 3'
STORED SOIL MOISTURE0%
20%
40%
60%
80%
100%
120%
2/21
3/14 4/
4
4/25
5/16 6/
6
6/27
7/18 8/
8
8/29
9/19
10/1
0
10/3
1
11/2
1
Ava
ilabl
e W
ater
Sto
red
in R
ootz
one
0.5
1.0
1.5
2.0
2.5
3.0
3.5
Wat
er C
onte
nt @
Dep
th (i
n/ft)
Entire Rootzone 1' 3' 5'
STORED SOIL MOISTURE
Nonpareil AlmondFull Irrigation -- 57.6 inches
Millham Sandy Loam-200
-175
-150
-125
-100
-75
-50
-25
01/19 2/16 3/16 4/13 5/11 6/8 7/6 8/3 8/31 9/28 10/26 11/23
Soil
Moi
stur
e Te
nsio
n (c
b)
18"36"60"
Nonpareil AlmondReduced Irrigation -- 47.1 inches
Millham Sandy Loam
-200
-175
-150
-125
-100
-75
-50
-25
01/19 2/16 3/16 4/13 5/11 6/8 7/6 8/3 8/31 9/28 10/26 11/23
Soil
Moi
stur
e Te
nsio
n (c
b)
18"36"60"
WATERMARK® SOIL MOISTURE TENSION OVER SEASON
NEUTRON PROBE WATER CONTENT OVER SEASON
WATERMARK® SOIL MOISTURE TENSION OVER SEASON
NEUTRON PROBE WATER CONTENT OVER SEASON
Lampinen, B., T.Dejong, S.Weinbaum, S.Metcalf, C. Negron, M.Viveros, J. McIlvane, N.Ravid, and R.Baker. 2007. Spur dynamics and almond productivity. CA Almond Board 2006 Conference Proceedings, 18pp.
Westside Almond Irrigation & N trial –
Yields, applied water, & 2003 soil moisture.
Reduced Irrigation 47.9 Total for 2003 2.9” Dormant Refill
45.0” In-Season
Full Irrigation 57.6 Total for 2003 3.2” Dormant Refill
54.4” In-Season
(in) N~250 N~125 (in) N~250 N~1252001 ? 1926 1898 (-25%) 1979 19922002 48.5 1922 1275 38.8 1593 12152003 57.6 3004 2030 47.1 2352 19012004 59.7 2838 2752 47.9 2307 22092005 53.8 2227 1493 44.5 1758 15382006 52.5 3241 2697 41.5 2739 2330
2002-6 272.1 13232 10247 219.8 10749 9193Wtr Use Eff (lb/in) 48.6 37.7 48.9 41.8
Nonpariel yields (lb/ac) by applied irrigation & N fertilizer (lb/ac) (starting year 5th leaf, NW Kern)
Full Irrigation Reduced Irrigation
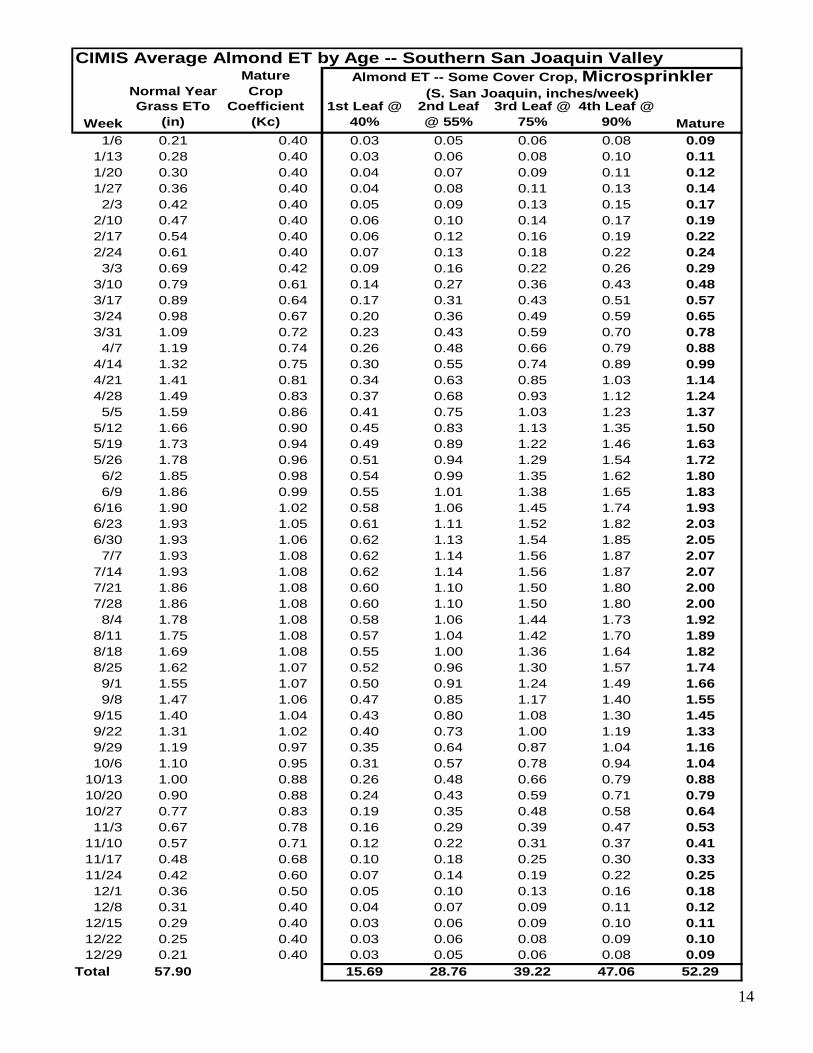
CIMIS Average Almond ET by Age -- Southern San Joaquin Valley
Normal YearMature Crop
WeekGrass ETo
(in)Coefficient
(Kc)1st Leaf @
40%2nd Leaf @ 55%
3rd Leaf @ 75%
4th Leaf @ 90% Mature
1/6 0.21 0.40 0.03 0.05 0.06 0.08 0.091/13 0.28 0.40 0.03 0.06 0.08 0.10 0.111/20 0.30 0.40 0.04 0.07 0.09 0.11 0.121/27 0.36 0.40 0.04 0.08 0.11 0.13 0.142/3 0.42 0.40 0.05 0.09 0.13 0.15 0.17
2/10 0.47 0.40 0.06 0.10 0.14 0.17 0.192/17 0.54 0.40 0.06 0.12 0.16 0.19 0.222/24 0.61 0.40 0.07 0.13 0.18 0.22 0.243/3 0.69 0.42 0.09 0.16 0.22 0.26 0.29
3/10 0.79 0.61 0.14 0.27 0.36 0.43 0.483/17 0.89 0.64 0.17 0.31 0.43 0.51 0.573/24 0.98 0.67 0.20 0.36 0.49 0.59 0.653/31 1.09 0.72 0.23 0.43 0.59 0.70 0.784/7 1.19 0.74 0.26 0.48 0.66 0.79 0.88
4/14 1.32 0.75 0.30 0.55 0.74 0.89 0.994/21 1.41 0.81 0.34 0.63 0.85 1.03 1.144/28 1.49 0.83 0.37 0.68 0.93 1.12 1.245/5 1.59 0.86 0.41 0.75 1.03 1.23 1.37
5/12 1.66 0.90 0.45 0.83 1.13 1.35 1.505/19 1.73 0.94 0.49 0.89 1.22 1.46 1.635/26 1.78 0.96 0.51 0.94 1.29 1.54 1.726/2 1.85 0.98 0.54 0.99 1.35 1.62 1.806/9 1.86 0.99 0.55 1.01 1.38 1.65 1.83
6/16 1.90 1.02 0.58 1.06 1.45 1.74 1.936/23 1.93 1.05 0.61 1.11 1.52 1.82 2.036/30 1.93 1.06 0.62 1.13 1.54 1.85 2.057/7 1.93 1.08 0.62 1.14 1.56 1.87 2.07
7/14 1.93 1.08 0.62 1.14 1.56 1.87 2.077/21 1.86 1.08 0.60 1.10 1.50 1.80 2.007/28 1.86 1.08 0.60 1.10 1.50 1.80 2.008/4 1.78 1.08 0.58 1.06 1.44 1.73 1.92
8/11 1.75 1.08 0.57 1.04 1.42 1.70 1.898/18 1.69 1.08 0.55 1.00 1.36 1.64 1.828/25 1.62 1.07 0.52 0.96 1.30 1.57 1.749/1 1.55 1.07 0.50 0.91 1.24 1.49 1.669/8 1.47 1.06 0.47 0.85 1.17 1.40 1.55
9/15 1.40 1.04 0.43 0.80 1.08 1.30 1.459/22 1.31 1.02 0.40 0.73 1.00 1.19 1.339/29 1.19 0.97 0.35 0.64 0.87 1.04 1.1610/6 1.10 0.95 0.31 0.57 0.78 0.94 1.04
10/13 1.00 0.88 0.26 0.48 0.66 0.79 0.8810/20 0.90 0.88 0.24 0.43 0.59 0.71 0.7910/27 0.77 0.83 0.19 0.35 0.48 0.58 0.64
11/3 0.67 0.78 0.16 0.29 0.39 0.47 0.5311/10 0.57 0.71 0.12 0.22 0.31 0.37 0.4111/17 0.48 0.68 0.10 0.18 0.25 0.30 0.3311/24 0.42 0.60 0.07 0.14 0.19 0.22 0.25
12/1 0.36 0.50 0.05 0.10 0.13 0.16 0.1812/8 0.31 0.40 0.04 0.07 0.09 0.11 0.12
12/15 0.29 0.40 0.03 0.06 0.09 0.10 0.1112/22 0.25 0.40 0.03 0.06 0.08 0.09 0.1012/29 0.21 0.40 0.03 0.05 0.06 0.08 0.09
Total 57.90 15.69 28.76 39.22 47.06 52.29
Almond ET -- Some Cover Crop, Microsprinkler(S. San Joaquin, inches/week)
14
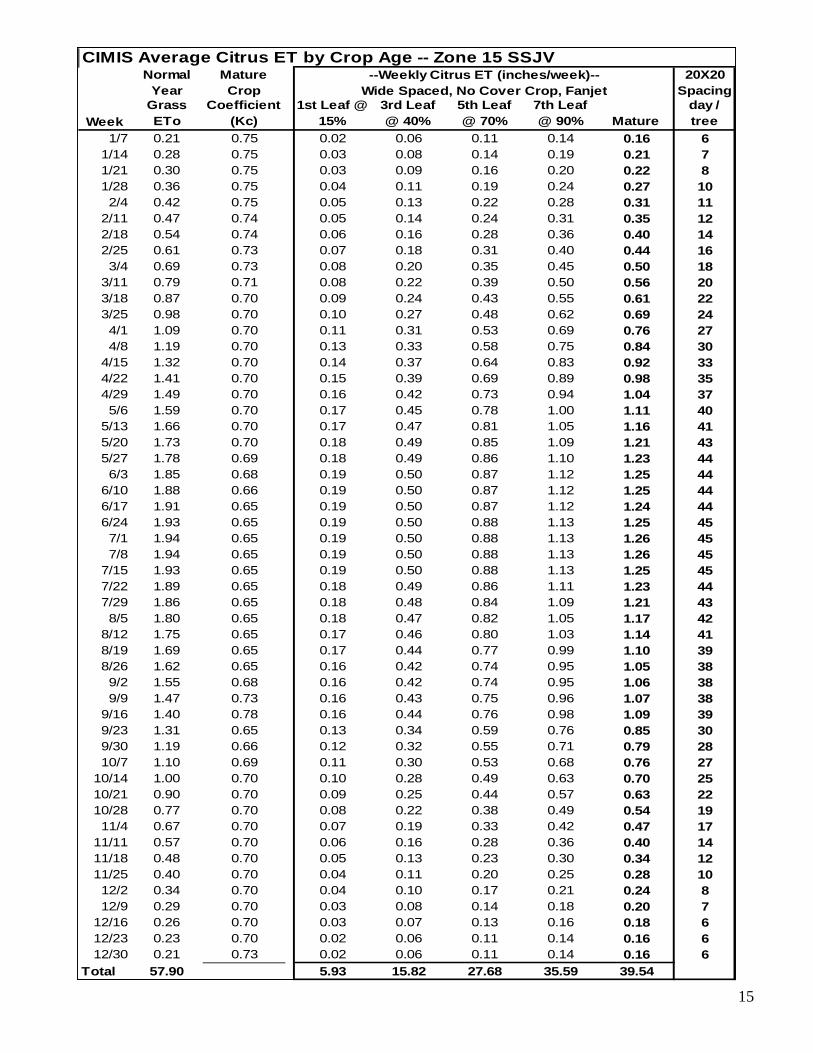
CIMIS Average Citrus ET by Crop Age -- Zone 15 SSJVNormal
Year Mature Crop
20X20 Spacing
WeekGrass ETo
Coefficient(Kc)
1st Leaf @ 15%
3rd Leaf @ 40%
5th Leaf @ 70%
7th Leaf @ 90% Mature
day / tree
1/7 0.21 0.75 0.02 0.06 0.11 0.14 0.16 61/14 0.28 0.75 0.03 0.08 0.14 0.19 0.21 71/21 0.30 0.75 0.03 0.09 0.16 0.20 0.22 81/28 0.36 0.75 0.04 0.11 0.19 0.24 0.27 102/4 0.42 0.75 0.05 0.13 0.22 0.28 0.31 11
2/11 0.47 0.74 0.05 0.14 0.24 0.31 0.35 122/18 0.54 0.74 0.06 0.16 0.28 0.36 0.40 142/25 0.61 0.73 0.07 0.18 0.31 0.40 0.44 163/4 0.69 0.73 0.08 0.20 0.35 0.45 0.50 18
3/11 0.79 0.71 0.08 0.22 0.39 0.50 0.56 203/18 0.87 0.70 0.09 0.24 0.43 0.55 0.61 223/25 0.98 0.70 0.10 0.27 0.48 0.62 0.69 244/1 1.09 0.70 0.11 0.31 0.53 0.69 0.76 274/8 1.19 0.70 0.13 0.33 0.58 0.75 0.84 30
4/15 1.32 0.70 0.14 0.37 0.64 0.83 0.92 334/22 1.41 0.70 0.15 0.39 0.69 0.89 0.98 354/29 1.49 0.70 0.16 0.42 0.73 0.94 1.04 375/6 1.59 0.70 0.17 0.45 0.78 1.00 1.11 40
5/13 1.66 0.70 0.17 0.47 0.81 1.05 1.16 415/20 1.73 0.70 0.18 0.49 0.85 1.09 1.21 435/27 1.78 0.69 0.18 0.49 0.86 1.10 1.23 446/3 1.85 0.68 0.19 0.50 0.87 1.12 1.25 44
6/10 1.88 0.66 0.19 0.50 0.87 1.12 1.25 446/17 1.91 0.65 0.19 0.50 0.87 1.12 1.24 446/24 1.93 0.65 0.19 0.50 0.88 1.13 1.25 457/1 1.94 0.65 0.19 0.50 0.88 1.13 1.26 457/8 1.94 0.65 0.19 0.50 0.88 1.13 1.26 45
7/15 1.93 0.65 0.19 0.50 0.88 1.13 1.25 457/22 1.89 0.65 0.18 0.49 0.86 1.11 1.23 447/29 1.86 0.65 0.18 0.48 0.84 1.09 1.21 438/5 1.80 0.65 0.18 0.47 0.82 1.05 1.17 42
8/12 1.75 0.65 0.17 0.46 0.80 1.03 1.14 418/19 1.69 0.65 0.17 0.44 0.77 0.99 1.10 398/26 1.62 0.65 0.16 0.42 0.74 0.95 1.05 389/2 1.55 0.68 0.16 0.42 0.74 0.95 1.06 389/9 1.47 0.73 0.16 0.43 0.75 0.96 1.07 38
9/16 1.40 0.78 0.16 0.44 0.76 0.98 1.09 399/23 1.31 0.65 0.13 0.34 0.59 0.76 0.85 309/30 1.19 0.66 0.12 0.32 0.55 0.71 0.79 2810/7 1.10 0.69 0.11 0.30 0.53 0.68 0.76 27
10/14 1.00 0.70 0.10 0.28 0.49 0.63 0.70 2510/21 0.90 0.70 0.09 0.25 0.44 0.57 0.63 2210/28 0.77 0.70 0.08 0.22 0.38 0.49 0.54 1911/4 0.67 0.70 0.07 0.19 0.33 0.42 0.47 17
11/11 0.57 0.70 0.06 0.16 0.28 0.36 0.40 1411/18 0.48 0.70 0.05 0.13 0.23 0.30 0.34 1211/25 0.40 0.70 0.04 0.11 0.20 0.25 0.28 1012/2 0.34 0.70 0.04 0.10 0.17 0.21 0.24 812/9 0.29 0.70 0.03 0.08 0.14 0.18 0.20 7
12/16 0.26 0.70 0.03 0.07 0.13 0.16 0.18 612/23 0.23 0.70 0.02 0.06 0.11 0.14 0.16 612/30 0.21 0.73 0.02 0.06 0.11 0.14 0.16 6
Total 57.90 5.93 15.82 27.68 35.59 39.54
--Weekly Citrus ET (inches/week)-- Wide Spaced, No Cover Crop, Fanjet
15

WeekKern ETo
1/7 0.211/14 0.281/21 0.301/28 0.362/4 0.42
2/11 0.472/18 0.542/25 0.613/4 0.69
3/11 0.79Crop Coeff.
Weekly ET
Gals/wk/vine
Gals/wk/vine
Crop Coeff.
Weekly ET
Gals/wk/vine
Gals/wk/vine
Crop Coeff.
Weekly ET
Gals/wk/vine
Gals/wk/vine
3/18 0.87(Kc) (inch) (100%
Effic)(85% Effic) (Kc) (inch) (100%
Effic)(85% Effic) (Kc) (inch) (100%
Effic)(85% Effic)
3/25 0.98 0.13 0.12 6 7 0.13 0.12 6 7 0.15 0.15 7 84/1 1.09 0.14 0.15 7 8 0.14 0.15 7 8 0.13 0.14 7 84/8 1.19 0.16 0.19 9 11 0.16 0.19 9 11 0.20 0.24 12 14
4/15 1.32 0.23 0.30 14 17 0.23 0.30 14 17 0.30 0.39 19 224/22 1.41 0.40 0.56 27 32 0.40 0.56 27 32 0.22 0.32 15 184/29 1.49 0.50 0.74 36 42 0.50 0.74 36 42 0.51 0.75 36 425/6 1.59 0.58 0.91 44 52 0.58 0.91 44 52 0.31 0.49 23 27
5/13 1.66 0.63 1.04 50 59 0.63 1.04 50 59 0.49 0.81 39 465/20 1.73 0.68 1.17 56 66 0.68 1.17 56 66 0.56 0.98 47 555/27 1.78 0.71 1.27 61 72 0.71 1.27 61 72 0.60 1.08 52 616/3 1.85 0.50 0.92 44 52 0.75 1.38 66 78 0.73 1.35 65 76
6/10 1.88 0.50 0.94 45 53 0.79 1.48 71 84 0.87 1.63 78 926/17 1.91 0.50 0.96 46 54 0.81 1.55 74 88 0.97 1.85 89 1046/24 1.93 0.50 0.96 46 54 0.83 1.59 76 90 1.09 2.09 100 1187/1 1.94 0.50 0.97 47 55 0.83 1.60 77 90 1.17 2.28 109 1287/8 1.94 0.50 0.97 47 55 0.83 1.60 77 90 1.24 2.41 116 136
7/15 1.93 0.50 0.96 46 54 0.83 1.59 76 90 1.30 2.50 120 1417/22 1.89 0.50 0.95 45 53 0.83 1.56 75 88 1.33 2.52 121 1427/29 1.86 0.50 0.93 45 52 0.83 1.53 73 86 1.35 2.51 121 1428/5 1.80 0.50 0.90 43 51 0.83 1.49 71 84 1.37 2.47 118 139
8/12 1.75 0.50 0.88 42 50 0.83 1.45 69 82 1.38 2.42 116 1368/19 1.69 0.50 0.85 41 48 0.80 1.35 65 76 1.39 2.35 113 1338/26 1.62 0.50 0.81 39 46 0.76 1.24 59 70 1.39 2.25 108 1279/2 1.55 0.50 0.77 37 44 0.66 1.03 49 58 1.40 2.17 104 1229/9 1.47 0.50 0.73 35 41 0.61 0.90 43 51 1.40 2.05 98 116
9/16 1.40 0.50 0.70 34 39 0.53 0.73 35 41 1.40 1.96 94 1109/23 1.31 0.50 0.65 31 37 0.45 0.59 28 33 1.40 1.83 88 1039/30 1.19 0.50 0.60 29 34 0.38 0.45 21 25 1.40 1.67 80 9410/7 1.10 0.25 0.28 13 16 0.25 0.28 13 16 1.40 1.54 74 87
10/14 1.00 0.25 0.25 12 14 0.25 0.25 12 14 1.40 1.40 67 7910/21 0.90 0.25 0.22 11 13 0.25 0.22 11 13 1.40 1.25 60 7110/28 0.77 0.25 0.19 9 11 0.25 0.19 9 11 1.40 1.09 52 61
11/4 0.67 0.25 0.17 8 9 0.25 0.17 8 9 0.50 0.34 16 1911/11 0.57 0.25 0.14 7 8 0.25 0.14 7 8 0.50 0.29 14 1611/18 0.48 0.25 0.12 6 7 0.25 0.12 6 7 0.50 0.24 11 1411/25 0.40 0.25 0.10 5 6 0.25 0.10 5 6 0.50 0.20 10 11
12/2 0.3412/9 0.29
12/16 0.2612/23 0.2312/30 0.21 (inch) (gal) (gal) (inch) (gal) (gal) (inch) (gal) (gal)
TOTAL 57.90 (inch) 23.38 1122 1320 31.04 1490 1753 49.97 2398 28221Irrigation studies by UC Specialist Larry Williams found berry size was not reduced as long as table grapes got at least 75% ET.2This total of 49 inches is close to the 45 inches of water use documented in 2003 by Kern UCCE in gabled Crimsons near Arvin.
TOTALS TOTALS TOTALS
SHORT SEASON TABLEFLAME/THOMPSON
(DWR Published Values)
2LONG SEASON TABLECRIMSON/RED GLOBE
(Full cover trellis, Kc estimate of Larry Williams for gabled trellis, Kearney Ag Center
2002)
WINE GRAPES(Irrigated at 50% of ETo starting June 1 to end of
September)
CIMIS "NORMAL YEAR" ETo AND CROP WATER USE (ETc)1 FOR GRAPES IN THE SSJV (7'x11' spacing, inches/week)
16
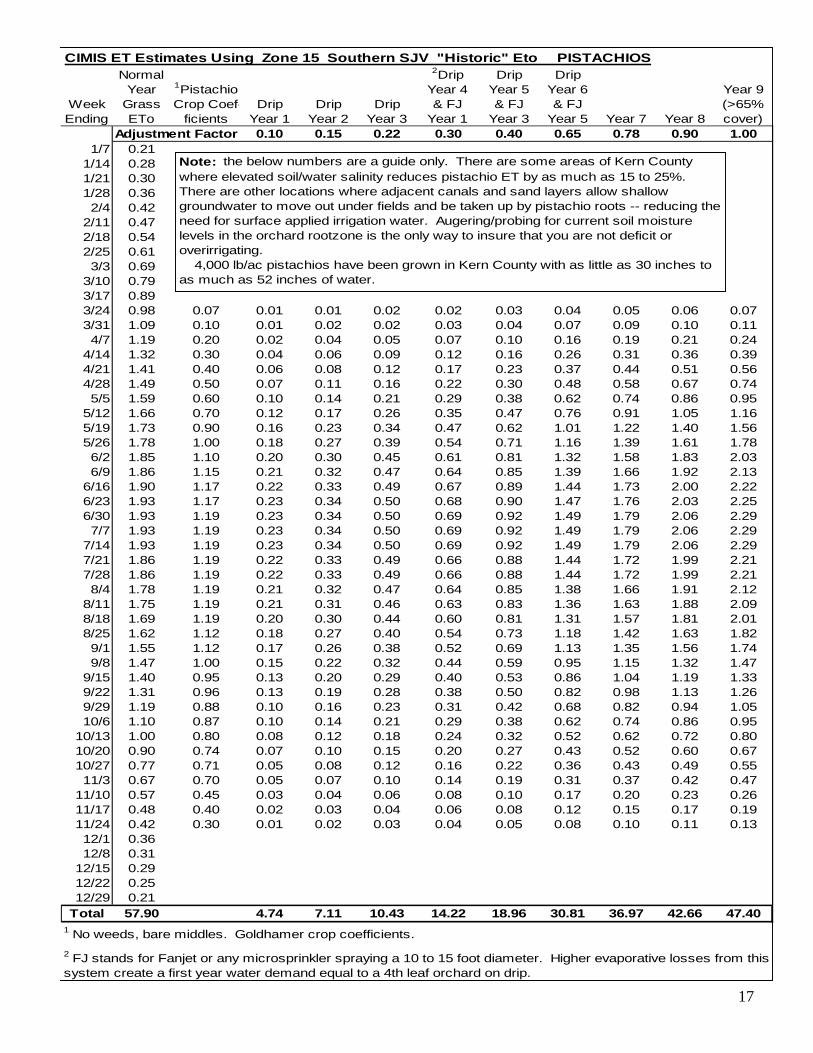
CIMIS ET Estimates Using Zone 15 Southern SJV "Historic" Eto PISTACHIOS
Week Ending
Normal Year
Grass ETo
1Pistachio Crop Coef-
ficientsDrip
Year 1Drip
Year 2Drip
Year 3
2DripYear 4& FJ
Year 1
DripYear 5& FJ
Year 3
DripYear 6& FJ
Year 5 Year 7 Year 8
Year 9(>65% cover)
Adjustment Factor 0.10 0.15 0.22 0.30 0.40 0.65 0.78 0.90 1.001/7 0.21
1/14 0.281/21 0.301/28 0.362/4 0.42
2/11 0.472/18 0.542/25 0.613/3 0.69
3/10 0.793/17 0.893/24 0.98 0.07 0.01 0.01 0.02 0.02 0.03 0.04 0.05 0.06 0.073/31 1.09 0.10 0.01 0.02 0.02 0.03 0.04 0.07 0.09 0.10 0.114/7 1.19 0.20 0.02 0.04 0.05 0.07 0.10 0.16 0.19 0.21 0.24
4/14 1.32 0.30 0.04 0.06 0.09 0.12 0.16 0.26 0.31 0.36 0.394/21 1.41 0.40 0.06 0.08 0.12 0.17 0.23 0.37 0.44 0.51 0.564/28 1.49 0.50 0.07 0.11 0.16 0.22 0.30 0.48 0.58 0.67 0.745/5 1.59 0.60 0.10 0.14 0.21 0.29 0.38 0.62 0.74 0.86 0.95
5/12 1.66 0.70 0.12 0.17 0.26 0.35 0.47 0.76 0.91 1.05 1.165/19 1.73 0.90 0.16 0.23 0.34 0.47 0.62 1.01 1.22 1.40 1.565/26 1.78 1.00 0.18 0.27 0.39 0.54 0.71 1.16 1.39 1.61 1.786/2 1.85 1.10 0.20 0.30 0.45 0.61 0.81 1.32 1.58 1.83 2.036/9 1.86 1.15 0.21 0.32 0.47 0.64 0.85 1.39 1.66 1.92 2.13
6/16 1.90 1.17 0.22 0.33 0.49 0.67 0.89 1.44 1.73 2.00 2.226/23 1.93 1.17 0.23 0.34 0.50 0.68 0.90 1.47 1.76 2.03 2.256/30 1.93 1.19 0.23 0.34 0.50 0.69 0.92 1.49 1.79 2.06 2.297/7 1.93 1.19 0.23 0.34 0.50 0.69 0.92 1.49 1.79 2.06 2.29
7/14 1.93 1.19 0.23 0.34 0.50 0.69 0.92 1.49 1.79 2.06 2.297/21 1.86 1.19 0.22 0.33 0.49 0.66 0.88 1.44 1.72 1.99 2.217/28 1.86 1.19 0.22 0.33 0.49 0.66 0.88 1.44 1.72 1.99 2.218/4 1.78 1.19 0.21 0.32 0.47 0.64 0.85 1.38 1.66 1.91 2.12
8/11 1.75 1.19 0.21 0.31 0.46 0.63 0.83 1.36 1.63 1.88 2.098/18 1.69 1.19 0.20 0.30 0.44 0.60 0.81 1.31 1.57 1.81 2.018/25 1.62 1.12 0.18 0.27 0.40 0.54 0.73 1.18 1.42 1.63 1.829/1 1.55 1.12 0.17 0.26 0.38 0.52 0.69 1.13 1.35 1.56 1.749/8 1.47 1.00 0.15 0.22 0.32 0.44 0.59 0.95 1.15 1.32 1.47
9/15 1.40 0.95 0.13 0.20 0.29 0.40 0.53 0.86 1.04 1.19 1.339/22 1.31 0.96 0.13 0.19 0.28 0.38 0.50 0.82 0.98 1.13 1.269/29 1.19 0.88 0.10 0.16 0.23 0.31 0.42 0.68 0.82 0.94 1.0510/6 1.10 0.87 0.10 0.14 0.21 0.29 0.38 0.62 0.74 0.86 0.95
10/13 1.00 0.80 0.08 0.12 0.18 0.24 0.32 0.52 0.62 0.72 0.8010/20 0.90 0.74 0.07 0.10 0.15 0.20 0.27 0.43 0.52 0.60 0.6710/27 0.77 0.71 0.05 0.08 0.12 0.16 0.22 0.36 0.43 0.49 0.5511/3 0.67 0.70 0.05 0.07 0.10 0.14 0.19 0.31 0.37 0.42 0.47
11/10 0.57 0.45 0.03 0.04 0.06 0.08 0.10 0.17 0.20 0.23 0.2611/17 0.48 0.40 0.02 0.03 0.04 0.06 0.08 0.12 0.15 0.17 0.1911/24 0.42 0.30 0.01 0.02 0.03 0.04 0.05 0.08 0.10 0.11 0.1312/1 0.3612/8 0.31
12/15 0.2912/22 0.2512/29 0.21
Total 57.90 4.74 7.11 10.43 14.22 18.96 30.81 36.97 42.66 47.401 No weeds, bare middles. Goldhamer crop coefficients.2 FJ stands for Fanjet or any microsprinkler spraying a 10 to 15 foot diameter. Higher evaporative losses from this system create a first year water demand equal to a 4th leaf orchard on drip.
Note: the below numbers are a guide only. There are some areas of Kern County where elevated soil/water salinity reduces pistachio ET by as much as 15 to 25%. There are other locations where adjacent canals and sand layers allow shallow groundwater to move out under fields and be taken up by pistachio roots -- reducing the need for surface applied irrigation water. Augering/probing for current soil moisture levels in the orchard rootzone is the only way to insure that you are not deficit or overirrigating. 4,000 lb/ac pistachios have been grown in Kern County with as little as 30 inches to as much as 52 inches of water.
17
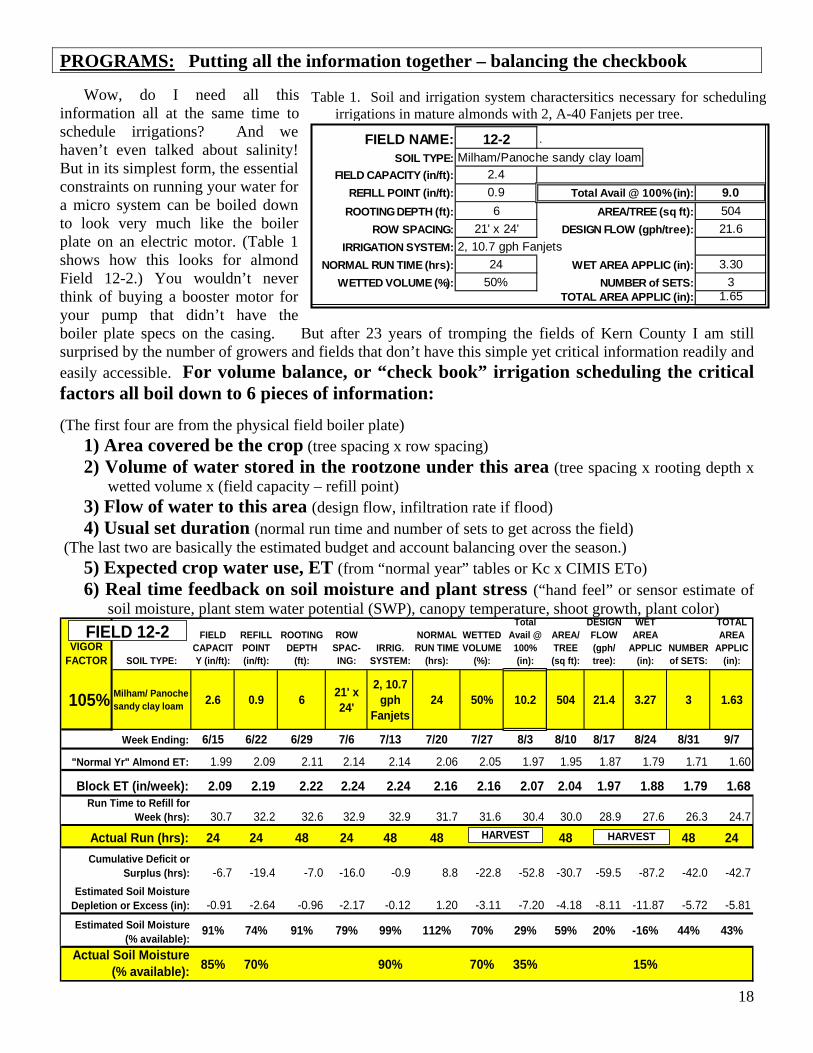
PROGRAMS: Putting all the information together – balancing the checkbook
Wow, do I need all this information all at the same time to schedule irrigations? And we haven’t even talked about salinity! But in its simplest form, the essential constraints on running your water for a micro system can be boiled down to look very much like the boiler plate on an electric motor. (Table 1 shows how this looks for almond Field 12-2.) You wouldn’t never think of buying a booster motor for your pump that didn’t have the boiler plate specs on the casing. But after 23 years of tromping the fields of Kern County I am still surprised by the number of growers and fields that don’t have this simple yet critical information readily and easily accessible. For volume balance, or “check book” irrigation scheduling the critical factors all boil down to 6 pieces of informa
Table 1. Soil and irrigation system charactersitics necessary for schedulingirrigations in mature almonds with 2, A-40 Fanjets per tree.
FIELD NAME: 12-2 .
SOIL TYPE: Milham/Panoche sandy clay loamFIELD CAPACITY (in/ft): 2.4
REFILL POINT (in/ft): 0.9 Total Avail @ 100% (in): 9.0ROOTING DEPTH (ft): 6 AREA/TREE (sq ft): 504
ROW SPACING: 21' x 24' DESIGN FLOW (gph/tree): 21.6IRRIGATION SYSTEM: 2, 10.7 gph Fanjets
NORMAL RUN TIME (hrs): 24 WET AREA APPLIC (in): 3.30WETTED VOLUME (%): 50% NUMBER of SETS: 3
TOTAL AREA APPLIC (in): 1.65
tion:
(The first four are from the physical field boiler plate) 1) Area covered be the crop (tree spacing x row spacing) 2) Volume of water stored in the rootzone under this area (tree spacing x rooting depth x
wetted volume x (field capacity – refill point) 3) Flow of water to this area (design flow, infiltration rate if flood) 4) Usual set duration (normal run time and number of sets to get across the field)
(The last two are basically the estimated budget and account balancing over the season.) 5) Expected crop water use, ET (from “normal year” tables or Kc x CIMIS ETo) 6) Real time feedback on soil moisture and plant stress (“hand feel” or sensor estimate of
soil moisture, plant stem water potential (SWP), canopy temperature, shoot growth, plant color)
VIGOR FACTOR SOIL TYPE:
FIELD CAPACITY (in/ft):
REFILL POINT (in/ft):
ROOTING DEPTH
(ft):
ROW SPAC-ING:
IRRIG. SYSTEM:
NORMAL RUN TIME
(hrs):
WETTED VOLUME
(%):
Total Avail @ 100% (in):
AREA/ TREE (sq ft):
DESIGN FLOW (gph/ tree):
WET AREA
APPLIC (in):
NUMBER of SETS:
TOTAL AREA
APPLIC (in):
105% Milham/ Panoche sandy clay loam 2.6 0.9 6 21' x
24'
2, 10.7 gph
Fanjets24 50% 10.2 504 21.4 3.27 3 1.63
Week Ending: 6/15 6/22 6/29 7/6 7/13 7/20 7/27 8/3 8/10 8/17 8/24 8/31 9/7
"Normal Yr" Almond ET: 1.99 2.09 2.11 2.14 2.14 2.06 2.05 1.97 1.95 1.87 1.79 1.71 1.60
Block ET (in/week): 2.09 2.19 2.22 2.24 2.24 2.16 2.16 2.07 2.04 1.97 1.88 1.79 1.68
30.7 32.2 32.6 32.9 32.9 31.7 31.6 30.4 30.0 28.9 27.6 26.3 24.7
Actual Run (hrs): 24 24 48 24 48 48 0 0 48 0 0 48 24
-6.7 -19.4 -7.0 -16.0 -0.9 8.8 -22.8 -52.8 -30.7 -59.5 -87.2 -42.0 -42.7
-0.91 -2.64 -0.96 -2.17 -0.12 1.20 -3.11 -7.20 -4.18 -8.11 -11.87 -5.72 -5.81
91% 74% 91% 79% 99% 112% 70% 29% 59% 20% -16% 44% 43%
85% 70% 90% 70% 35% 15%Actual Soil Moisture
(% available):
Estimated Soil Moisture (% available):
Estimated Soil Moisture Depletion or Excess (in):
Run Time to Refill for Week (hrs):
Cumulative Deficit or Surplus (hrs):
HARVEST HARVEST
FIELD 12-2
18

19
So now all 6 pieces of information are contained in the above Excel Table (available at http://cekern.ucdavis.edu/Irrigation%5FManagement/, click IRRIGATION CHECKBOOK SCHEDULER in the list of files. The file has separate worksheets for mature almonds, citrus, late season table grapes and pistachios.) The budget part of the checkbook simply uses “NORMAL YEAR” ET, multiplies it by a VIGOR FACTOR and using the system characteristics on the top calculates the hours of RUN TIME needed for that week. If you have a well you might just want to irrigate that number of hours/set, but most operations have to work on a 24 hour rotation so the checkbook will forward any deficit to the next week. You will notice that the entries for ACTUAL SOIL MOISTURE are not entered every week over the season (kind of like what happens on a real farm with otherwise the best of intentions). This checkbook updates for the actual soil moisture number (if one is entered) so that extra irrigation hours will be added to make up the deficit from the previous weeks calculated value. If the calculated %AVAILABLE is consistently higher than the actual value consider increasing the % WETTED VOLUME as it may be larger than you think and therefore require more run time to refill. Alternatively, you can increase the VIGOR FACTOR if it looks like you have a heavy load on and your soil moisture always seems on the dry side. If the block is salt affected you want to stay in the 70% + range to keep water more available to the crop. One of the deficiencies of the simple checkbook method is it does not accurately account for a slower rate of moisture extraction when you drop below 50% available and will overestimate the actual depletion (look at the week ending 8/24 as an example). MORE CHECKBOOKS ON THE WEB: There are plenty of irrigation scheduling aids/programs on-line. A Google search of “free irigation scheduling programs” returns more than 80,000 hits. The list will make your head hurt – even before you start to use them. Links to a few of these sites that I have looked at and can recommend as completely free and sponsored by worthy organizations are below:
http://www.cimis.water.ca.gov/cimis/infoIrrSoftware.jsp Concise list of free and pay-for scheduling software. Some tutorials on basic scheduling. State of CA, Sacramento.
http://www.wateright.org/ Checkbook type schedule, all on-line, mostly crop water demand based on CIMIS weather and standard crop coefficients. Cal State Fresno, CATI,
http://biomet.ucdavis.edu/irrigation_scheduling/bis/BIS.htm Multi-worksheet Excel file, completely downloadable, soil moisture estimation but no feedback adjustment. Most comprehensive list of crop coefficients. Calculator for estimating daily crop coefficients. Rick Snyder, UC Davis
http://cesanjoaquin.ucdavis.edu/files/14724.xls Simple one-page worksheet checkbook for winegrape irrigation scheduling.
PROGRAMS: Putting all the information together – EXPERT SYSTEMS for
RANCH-WIDE IRRIGATION MANAGEMENT At this time I know of only one truly “free” expert system available online offered by Oregon State University Ag Extension called “Irrigation Management On-line (IMO for short). We have been doing a beta test with 4 Kern growers over 2009 and continuing into 2010. It still has some bugs in it and is difficult to initially set up the fields, but it has some great automated weather and crop coefficient retrieval features, built in soil moisture stress curves that more accurately calculate field moisture than the check book method. We will keep you posted. An easier version is supposed to be available this month. Access the program at: http://oiso.bioe.orst.edu/RealtimeIrrigationSchedule/index.aspx Perhaps the most comprehensive integrated commercial package available to growers at this time that is close to being an expert system is the software/hardware package offered by PureSense. This is not a commercial endorsement, but just the state of the art as I know it at this time. Other old-line reputable companies like Irrometer, Netafim, Decagon and newer ones like Ranch Systems are coming up with new platforms and software all the time. But one thing is for sure: no one has the perfect system!
Simplified Stem & Leaf Water Potential Guidelines for Almonds, Citrus and Pistachio
(Note: The following guidelines assume that irrigation water is excellent quality and salinity is not accumulating to damaging levels.)
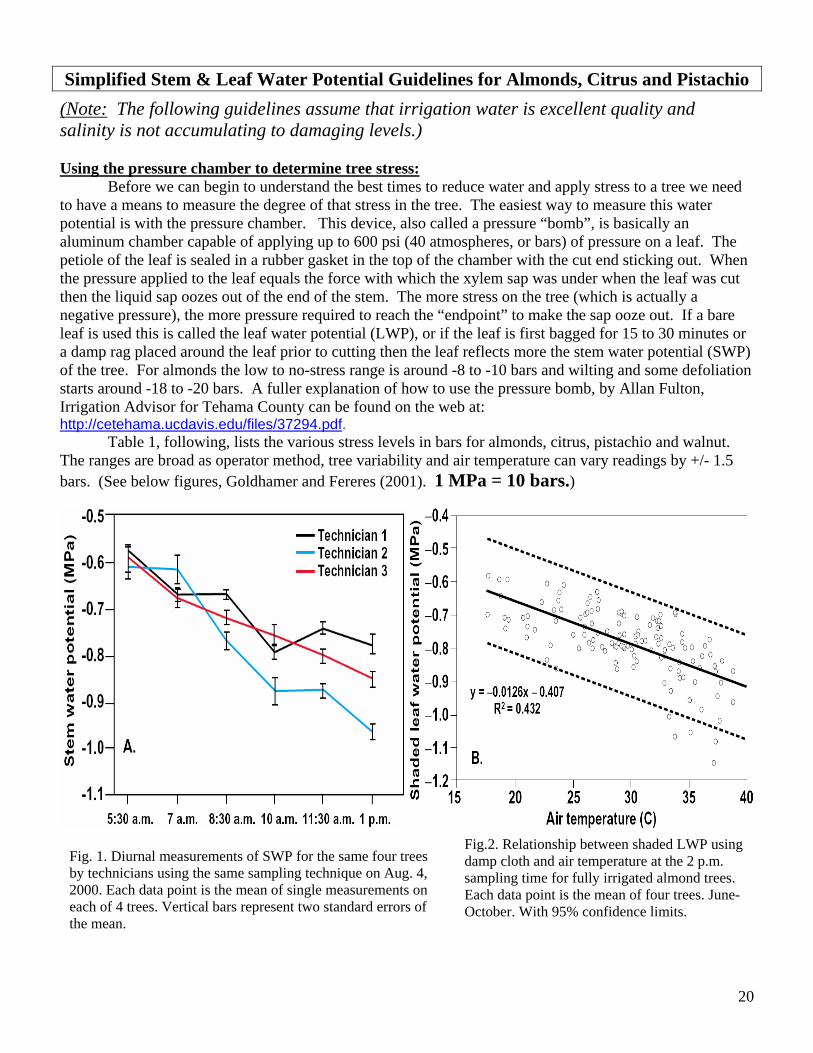
Using the pressure chamber to determine tree stress: Before we can begin to understand the best times to reduce water and apply stress to a tree we need to have a means to measure the degree of that stress in the tree. The easiest way to measure this water potential is with the pressure chamber. This device, also called a pressure “bomb”, is basically an aluminum chamber capable of applying up to 600 psi (40 atmospheres, or bars) of pressure on a leaf. The petiole of the leaf is sealed in a rubber gasket in the top of the chamber with the cut end sticking out. When the pressure applied to the leaf equals the force with which the xylem sap was under when the leaf was cut then the liquid sap oozes out of the end of the stem. The more stress on the tree (which is actually a negative pressure), the more pressure required to reach the “endpoint” to make the sap ooze out. If a bare leaf is used this is called the leaf water potential (LWP), or if the leaf is first bagged for 15 to 30 minutes or a damp rag placed around the leaf prior to cutting then the leaf reflects more the stem water potential (SWP) of the tree. For almonds the low to no-stress range is around -8 to -10 bars and wilting and some defoliation starts around -18 to -20 bars. A fuller explanation of how to use the pressure bomb, by Allan Fulton, Irrigation Advisor for Tehama County can be found on the web at: http://cetehama.ucdavis.edu/files/37294.pdf.
Table 1, following, lists the various stress levels in bars for almonds, citrus, pistachio and walnut. The ranges are broad as operator method, tree variability and air temperature can vary readings by +/- 1.5 bars. (See below figures, Goldhamer and Fereres (2001). 1 MPa = 10 bars.)
Fig.2. Relationship between shaded LWP using
damp cloth and air temperature at the 2 p.m. sampling time for fully irrigated almond trees. Each data point is the mean of four trees. June-October. With 95% confidence limits.
20
Fig. 1. Diurnal measurements of SWP for the same four trees by technicians using the same sampling technique on Aug. 4, 2000. Each data point is the mean of single measurements on each of 4 trees. Vertical bars represent two standard errors of the mean.

Pressure Chamber Reading(- bars) ALMOND CITRUS PISTACHIO WALNUT
0 to -2
Not commonly observed Not commonly observed Not commonly observed Not commonly observed
-2to -4
Fully irrigated, mild spring conditions, rapid shoot expansion. Excellent for early season flush. Avoid saturation on heavy soils.
Fully irrigated using CIMIS ETc estimates, low stress, phytophthora may be a concern, especially on California Black rootstock.
-4to -6
Low to mild stress, high rate of shoot growth visible, suggested level from leaf-out until mid June when nut sizing is completed.
-6to -8
Low stress, indicator of fully irrigated conditions, ideal conditions for shoot growth. Suggest maintaining these levels from leaf-out through mid June.
Low stress, indicator of fully irrigated conditions, ideal conditions for shoot growth. Excellent for early season flush.
Low stress, indicator of fully irrigated conditions, ideal conditions for shoot growth.
Mild to moderate stress, shoot growth in non-bearing and bearing trees has been observed to decline. These levels do not appear to affect kernel development.
-8 to -10
Moderate stress, may slightly reduce shoot growth.
Moderate to high stress, shoot growth may stop, nut sizing may be reduced in bearing trees and bud development for next season may be negatively affected.
-10 to -12
Mild to moderate stress, these levels of stress may be appropriate during the phase of growth just before the onset of hull split (late June).
Mild to moderate stress, puff and crease in navels still occurs in this range.
Leaves can "harden" and slightly cup, shell splitting/nut size can be reduced during nutfill (Jul-Aug).
High stress, temporary wilting of leaves has been observed. New shoot growth may be sparse or absent and some defoliation may be evident. Nut size likely to be reduced.
-12to -14
Relative high levels of stress, moderate to severe defoliation, should be avoided.
-14 to -18
Moderate stress in almond. Suggested stress level during hull split, Help control diseases such as hull rot and alternaria, if present. Hull split occurs more rapidly
Moderate stress, can accelrate color in early Becks (Sep-Oct), control puff and crease/size in Frost Nucellar, Washington (5/16-7/15)
Increasing stress, slight defoliation, may reduce shell hardness/increase splits Stage 2 (May-Jun).
Severe defoliation, trees are likely dying.
-18to -20
Transitioning from moderate to higher crop stress levels
Stress prominent, leaf cupping obvious and can feel "warm" to the touch. Yield/size loss in early Becks (Sep-Oct). Controlled granulation Lane Late/best packout (Jul-Sep).
Stress prominent, leaf hardening and cupping obvious and can feel "warm" to the touch.
Not observed at these levels in English walnut
-20 to -30
High stress, wilting observed, some defoliation
High stress, severe cupping, some defoliation High stress, significant defoliation.
Less than -30
Extensive defoliation has been observed Significant defoliation
ALMOND & WALNUT: Allan Fulton/Richard Buchner-UCCE Tehama; Joe Grant-UCCE San Joaquin; Terry Prichard, Bruce Lampinen, Larry Schwankl, Ken Shackel Extension Specialists, UC Davis.
CITRUS & PISTACHIO: Dave Goldhamer-UCCE Kearney Ag Center; Craig Kallsen/Blake Sanden UCCE Kern County
GUIDELINES FOR INTERPRETING PRESSURE CHAMBER READINGS (midday stem water potential (SWP) for almonds, pistahcio and walnuts, and midday shaded leaf water potential (LWP) for citrus)
21

REFERENCES Crop Water Use – A Guide for Scheduling Irrigations in the Southern San Joaquin Valley. 1977-1991. Dept of Water Resources. (Published 1993)
Doorenbos, J. and Pruitt, W. O., 1977. Crop water requirements. Irrigation and Drainage Paper No. 24, (rev.) FAO, Rome, Italy. 144 p.
Drought Irrigation Strategies for Deciduous Orchards. UC Publication 21453. Drought Tips for Vegetable and Field Crop Production. UC Publication 21466. Grattan, S.R., Bowers, W., Dong, A., Snyder, R., Carroll, J. J. and George, W. 1998. New crop coefficients estimate water use of vegetables, row crops. California Agriculture, Vol 52, No. 1. Irrigation Scheduling: A Guide for Efficient On-Farm Water Management. UC Publication 21454. Jones, D.W., R.L. Snyder, S. Eching and H. Gomez-McPherson. 1999. California Irrigation Management Information System (CIMIS) Reference Evapotranspiration. Climate zone map, Dept. of Water Resources, Sacramento, CA. Merriam, J.L. 1960. Field method of approximating soil moisture for irrigation. Am. Soc. Agri. Engr. Vol. 3. No.1. Pruitt, W.O., Fereres, E., Kaita, K. and Snyder, R.L. 1987. Reference Evapotranspiration (ETo) for California. UC Bulletin 1922. Ratliff LF, Ritchie JT, Cassel DK. 1983. Field-measured limits of soil water availability as related to laboratory-measured properties. Soil Sci Soc Am. 47:770-5. Using Reference Evapotranspiration (ETo) and Crop Coefficients to Estimate Crop Evapotranspiration (ETc) for Agronomic Crops, Grasses, and Vegetable Crops. UC Publication 21427. Using Reference Evapotranspiration (ETo) and Crop Coefficients to Estimate Crop Evapotranspiration (ETc) for Trees and Vines. UC Publication 21428. (Also unpublished data and personal experience collected by Blake Sanden, Irrigation & Agronomy Advisor, UCCE Kern County.) Excellent website explaining soil moisture sensors: http://www.sowacs.com/sensors/index.html New UC DROUGHT MANAGEMENT WEBSITE http://ucmanagedrought.ucdavis.edu/index.cfm
http://www.ams-samplers.comSoil Probes: Art’s Manufacturing Part 401.07 7/8 in. x 33 in. Chrome Soil Probe with Cross Handle
and Slide Hammer
22