Scientific Inquiry and Skills
47
Scientific Inquiry and Skills
-
Upload
madeson-kaufman -
Category
Documents
-
view
47 -
download
7
description
Scientific Inquiry and Skills. What is Science?. Science is like a never ending mystery-people observe, ask questions, and uncover clues as they look for answers to our questions. Knowledge in science is not written in stone- it can change. - PowerPoint PPT Presentation
Transcript of Scientific Inquiry and Skills
Scientific Inquiry and Skills
What is Science?
Science is like a never ending mystery-people observe, ask questions, and uncover clues as they look for answers to our questions.
Knowledge in science is not written in stone- it can change.
Theories, ideas, and explanations are constantly revised as scientists learn more.
What is Science?
The goal of science is to:– Investigate and understand the natural world.– Explain events in the natural world.– Use the explanations to make predictions.
The Scientific Method
Have you ever timed two different routes to school or compared two kinds of shampoo? If you have, you have performed a simple experiment. You probably did not plan out your experiment on paper before you performed it. Scientists, however, design experiments carefully before they actually perform them.
Designing an experiment is making an organized plan to test a hypothesis.
The Scientific Method
Scientific Method- a series of steps that are used to answer a question or to solve a problem
The Scientific Method
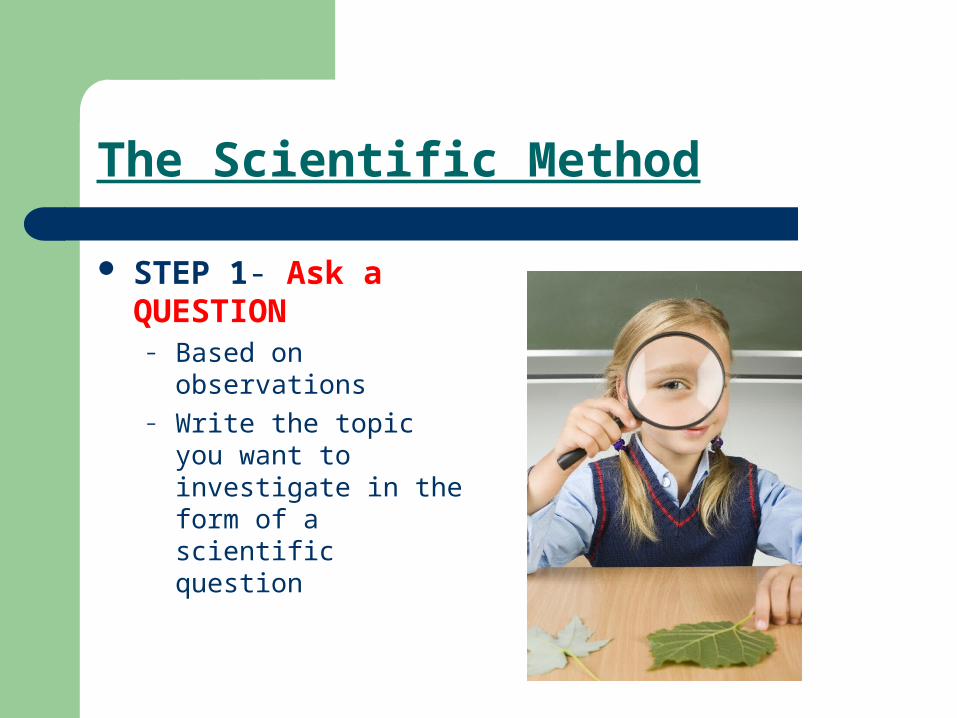
STEP 1- Ask a QUESTION
– Based on observations– Write the topic you want
to investigate in the form of a scientific question
The Scientific Method
STEP 2- Form a HYPOTHESIS– Which is a possible explanation for what you
observed– A hypothesis is an educated guess or a prediction
about the outcome of an experiment– Start your hypothesis with “I think that…”
The Scientific Method
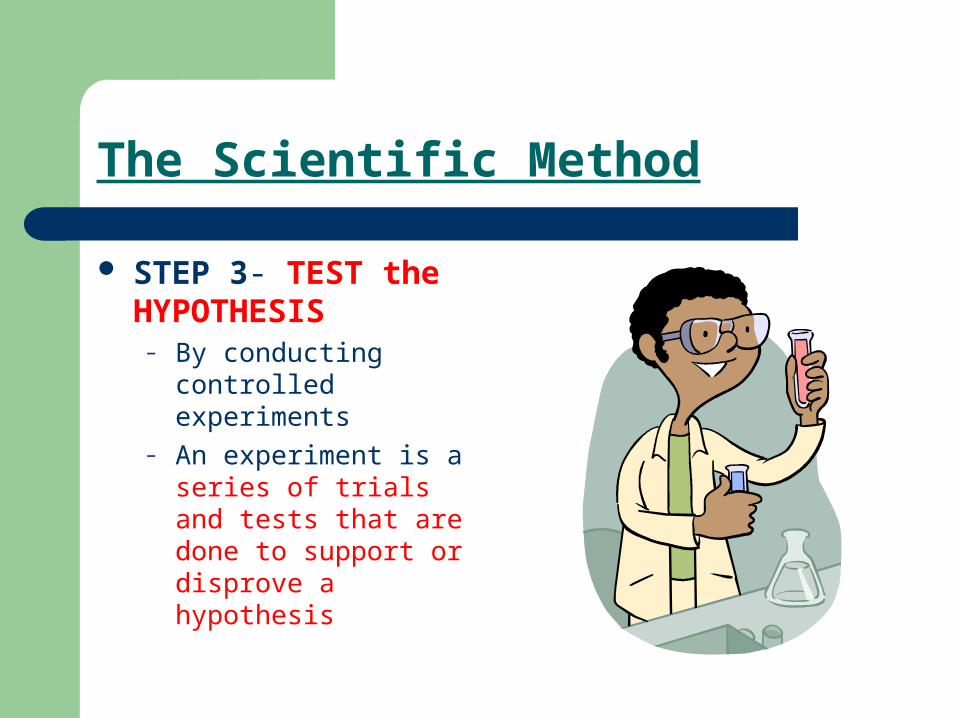
STEP 3- TEST the HYPOTHESIS
– By conducting controlled experiments
– An experiment is a series of trials and tests that are done to support or disprove a hypothesis
The Scientific Method
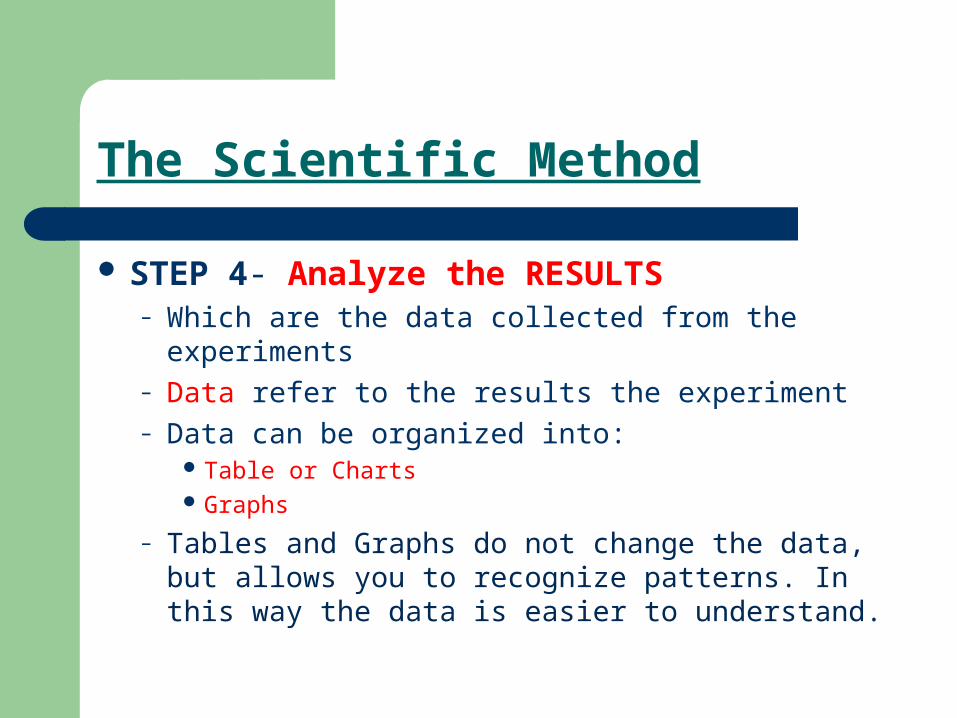
STEP 4- Analyze the RESULTS– Which are the data collected from the experiments– Data refer to the results the experiment– Data can be organized into:
Table or Charts Graphs
– Tables and Graphs do not change the data, but allows you to recognize patterns. In this way the data is easier to understand.
The Scientific Method
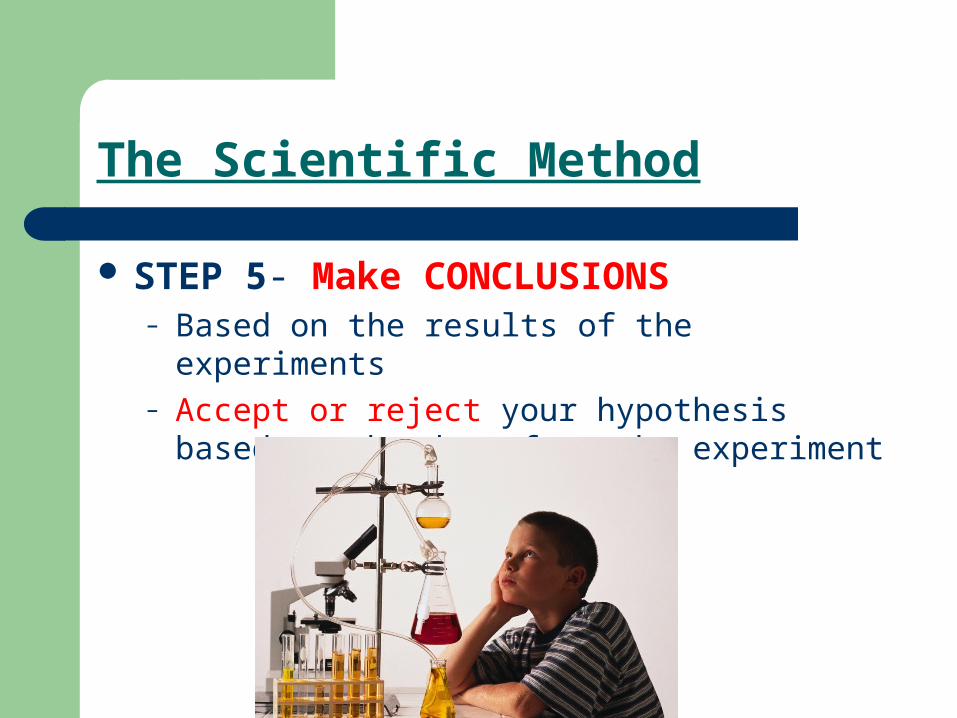
STEP 5- Make CONCLUSIONS – Based on the results of the experiments– Accept or reject your hypothesis based on the
data from the experiment
The Scientific Method
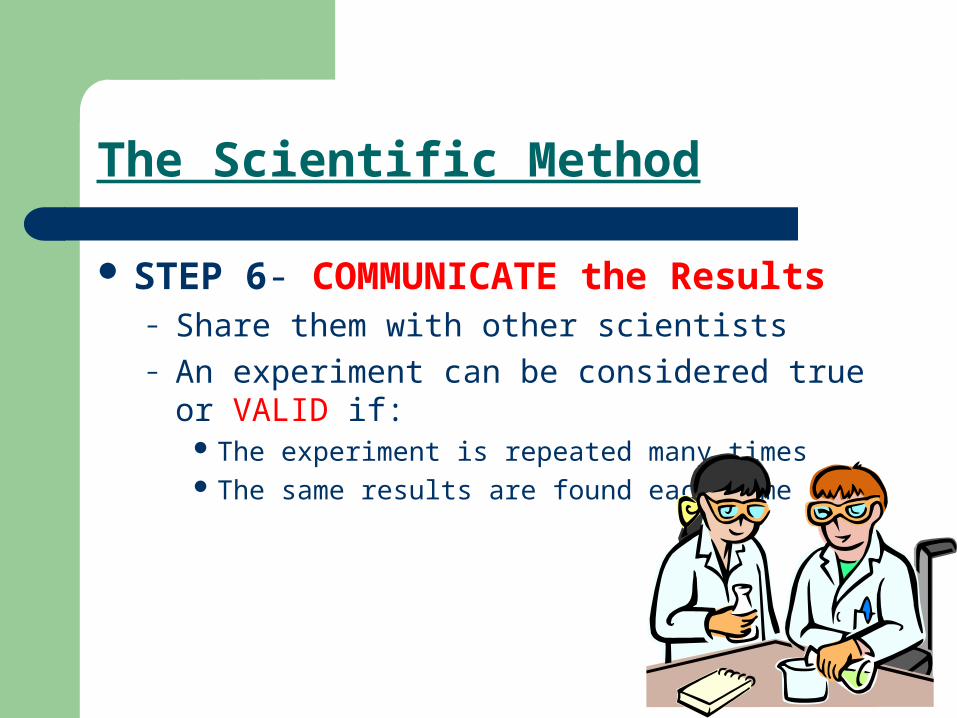
STEP 6- COMMUNICATE the Results– Share them with other scientists– An experiment can be considered true or VALID
if: The experiment is repeated many times The same results are found each time
Question 1
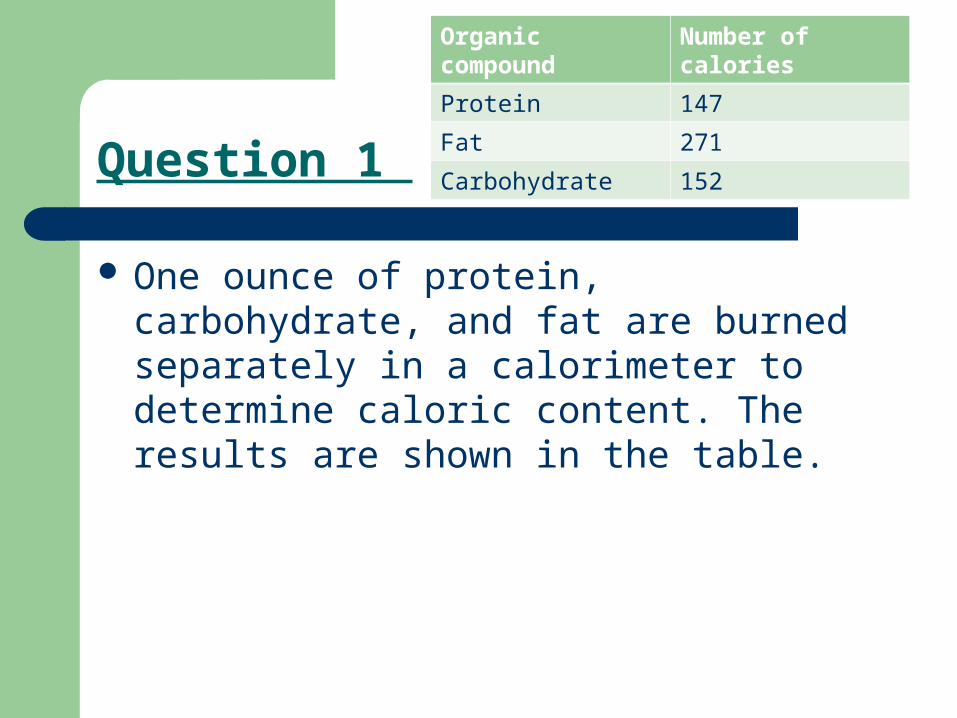
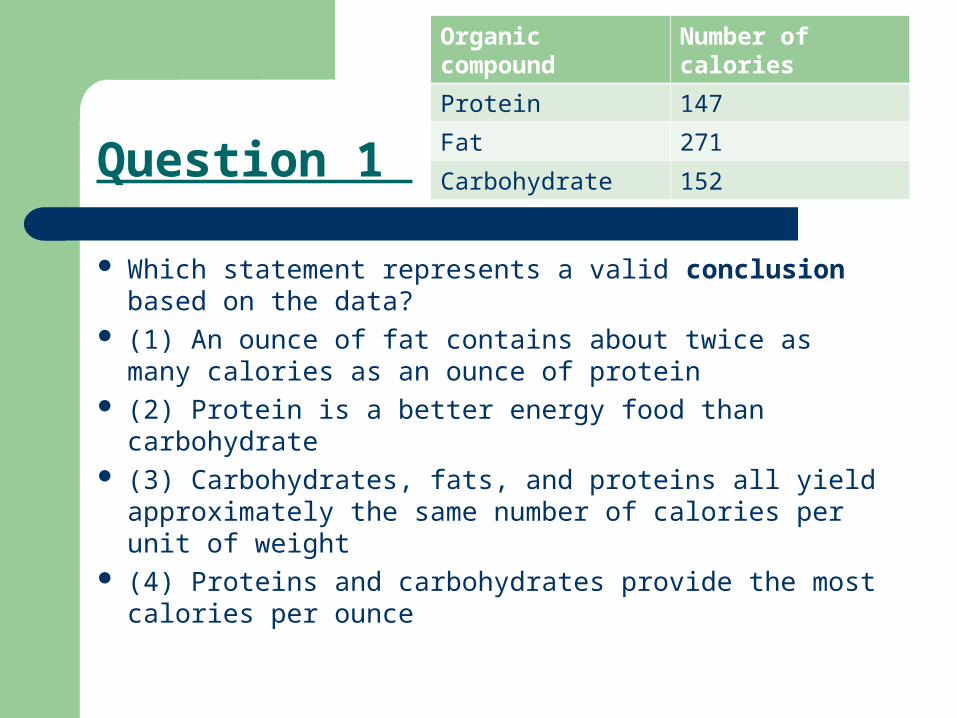
One ounce of protein, carbohydrate, and fat are burned separately in a calorimeter to determine caloric content. The results are shown in the table.
Organic compound Number of calories
Protein 147
Fat 271
Carbohydrate 152
Question 1
Which statement represents a valid conclusion based on the data?
(1) An ounce of fat contains about twice as many calories as an ounce of protein
(2) Protein is a better energy food than carbohydrate (3) Carbohydrates, fats, and proteins all yield
approximately the same number of calories per unit of weight
(4) Proteins and carbohydrates provide the most calories per ounce
Organic compound Number of calories
Protein 147
Fat 271
Carbohydrate 152
Experimental Design
Control/Constants- Things that stay the SAME during an experiment
Variables- Things that CHANGE during the experiment
You can only change 1 thing at a time to have a controlled experiment!
Experimental Design
There are two groups in an experiment:– Experimental Group- The group in an
experiment that contains the variable you are testing called the independent variable
– Control Group- The group in an experiment that is used a comparison. It does not contain the variable being tested
– Sometimes contains a placebo such as a sugar pill
Independent vs. Dependent Variables
Independent Variable- the FACTOR THAT IS CHANGED in an experiment– Something “SPECIAL” in an experiment– Always belongs to the Experimental Group
Dependent Variable- the FACTOR THAT IS FORCED TO CHANGE in an experiment because the independent variable was changed – Something that you are MEASURING in an experiment
Experimental Design
Question: Do plants that are given plant food grow taller than those that are not?
Control:– Type of plant– Amount of sunlight– Amount of water
Independent Variable: Soil → with plant food OR without plant food
Dependent Variable: Height of the plant
Question 2
Which laboratory procedure would be best for demonstrating the effect of light intensity on the production of chlorophyll in pea plants?
(1) using 10 plants of different species, each grown in the same intensity of light
(2) using 10 plants of different species, each grown in a different intensity of light
(3) using 10 plants of the same species, each grown in the same intensity of light
(4) using 10 plants of the same species, each grown in a different intensity of light
Question 3
In an early trial of the Salk vaccine for polio, 1,830,000 school children participated. This original trial was an attempt to determine whether the Salk vaccine was effective in preventing polio. Of the 1,830,000 children involved, only 440,000 received the vaccine.

Question 3
The remainder were not given the vaccine because they
(1) had a natural immunity (2) already had polio (3) served as a control (4) were allergic to the vaccine
Experimental Design
Observation- something you recognize with your senses and that you can describe
Measurements- using scientific instruments to give you exact values
We use both observations and measurements as data during science experiments
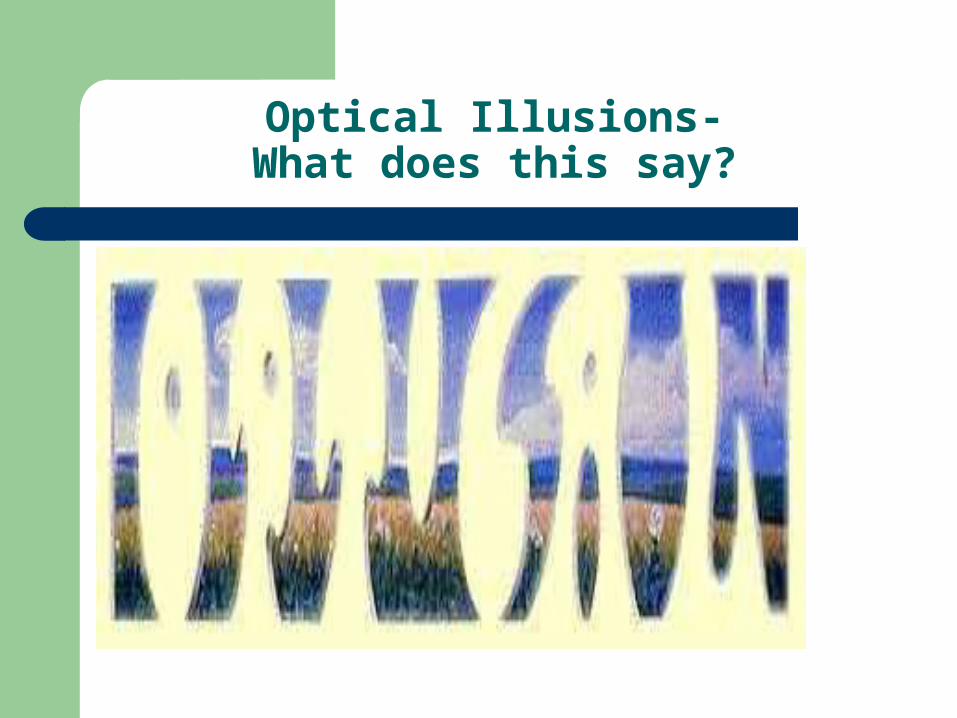
Optical Illusions-What does this say?
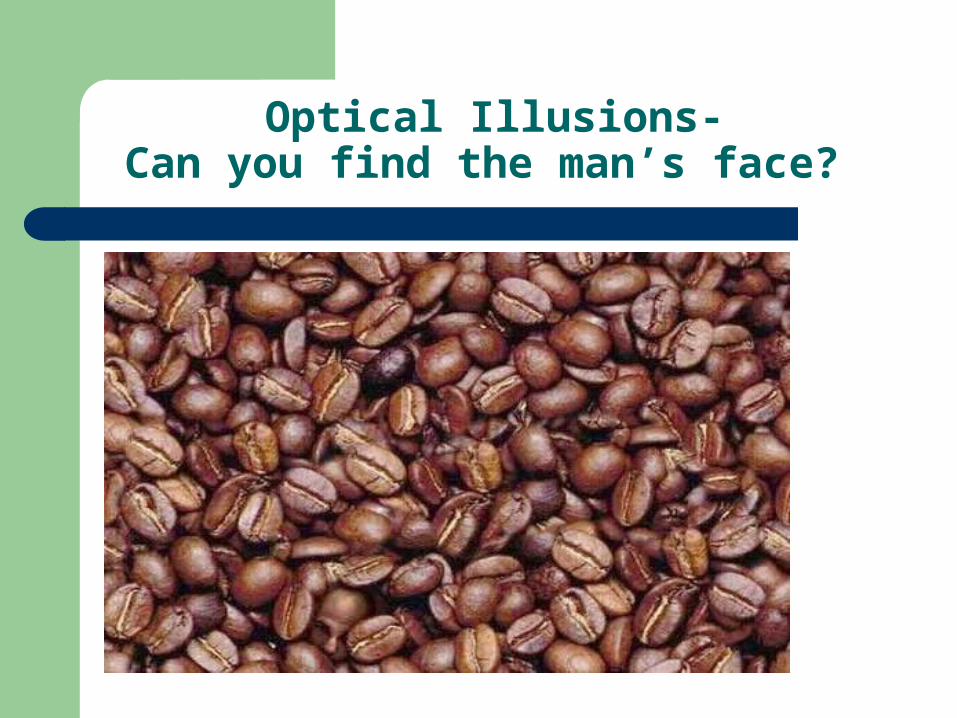
Optical Illusions-Can you find the man’s face?

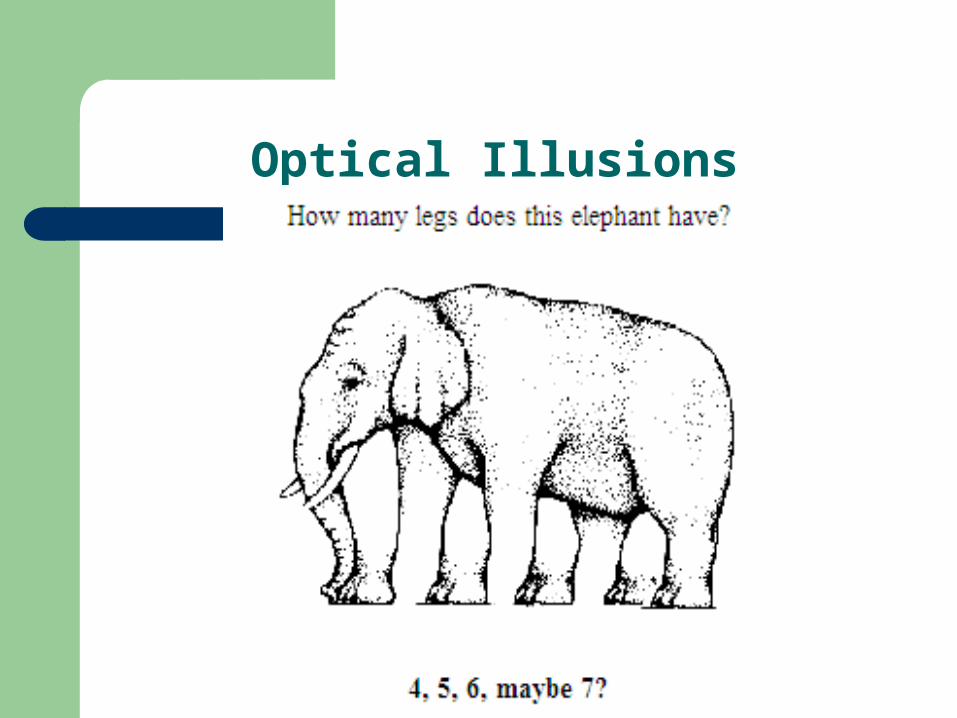
Optical Illusions
What is this a picture of?
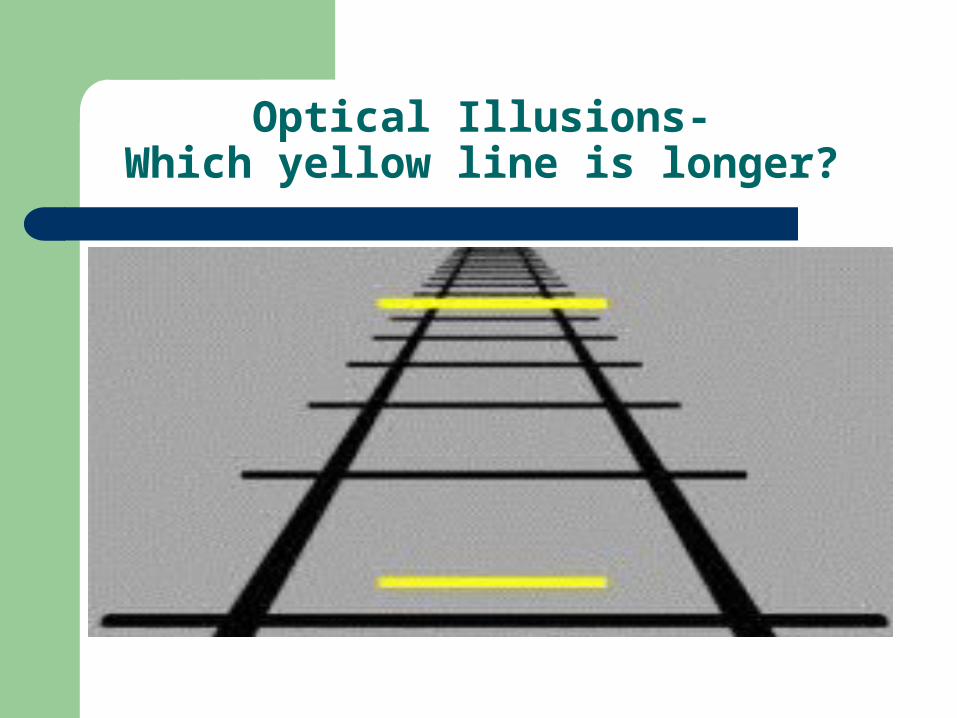
Optical Illusions- Which yellow line is longer?
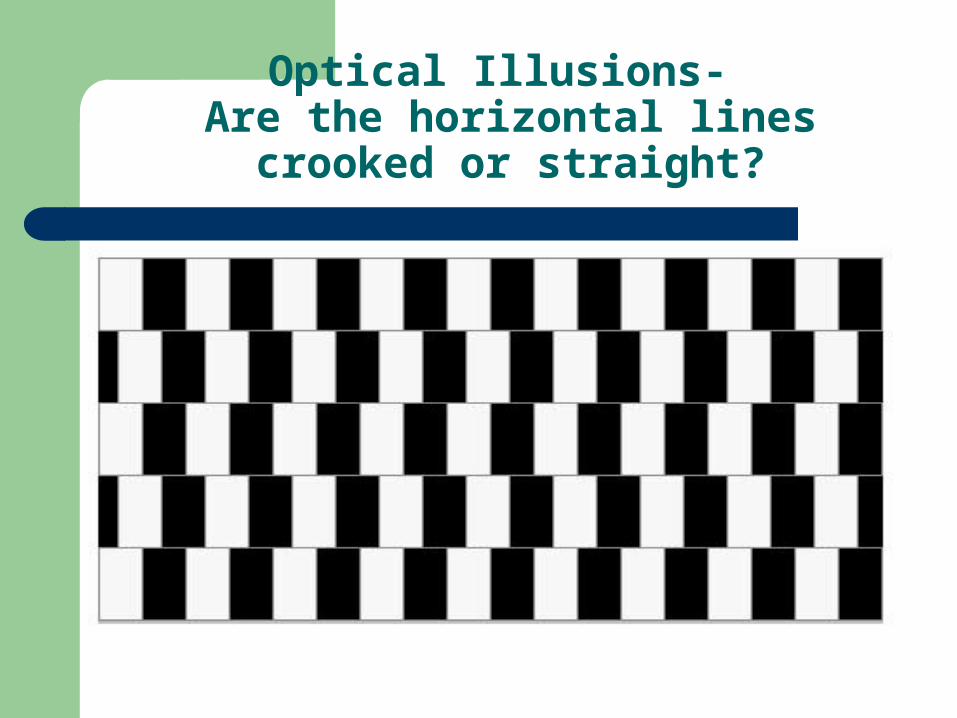
Optical Illusions- Are the horizontal lines crooked or
straight?
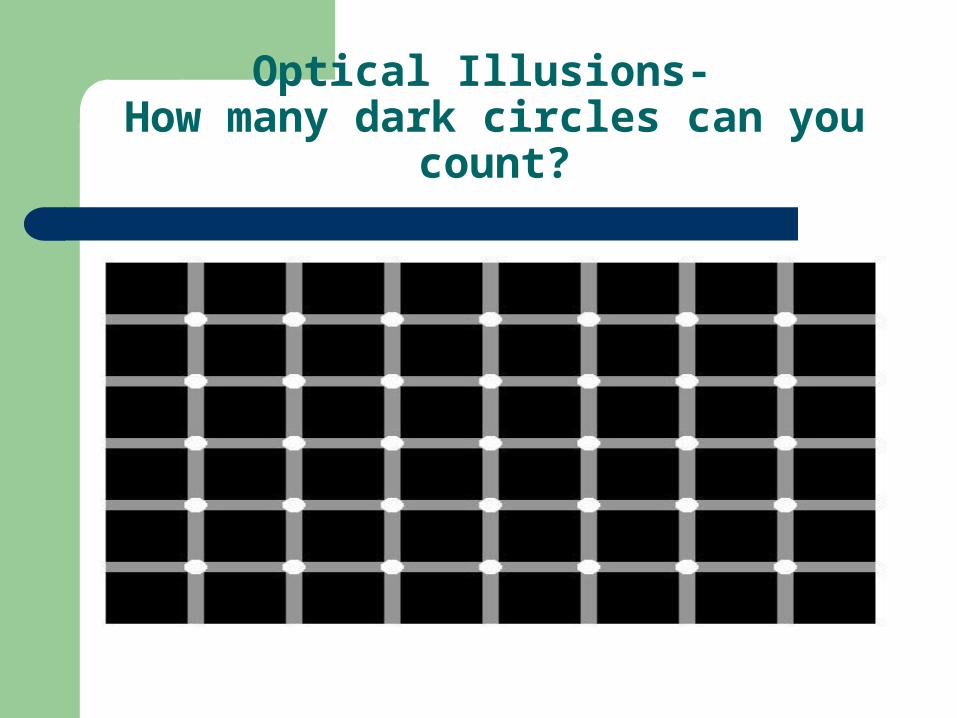
Optical Illusions- How many dark circles can you count?
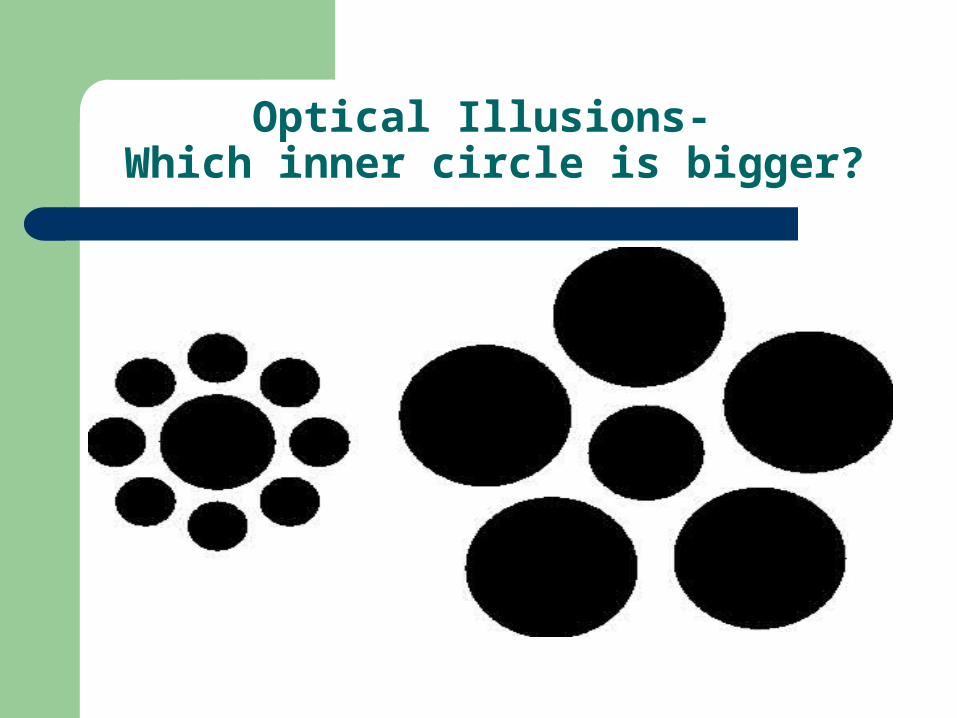
Optical Illusions- Which inner circle is bigger?
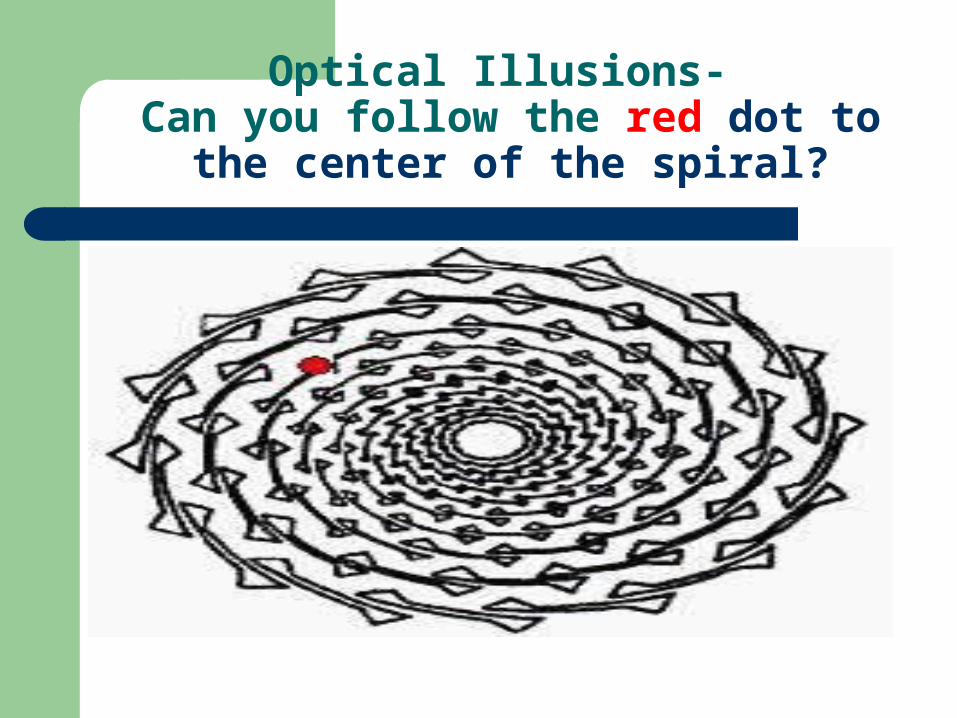
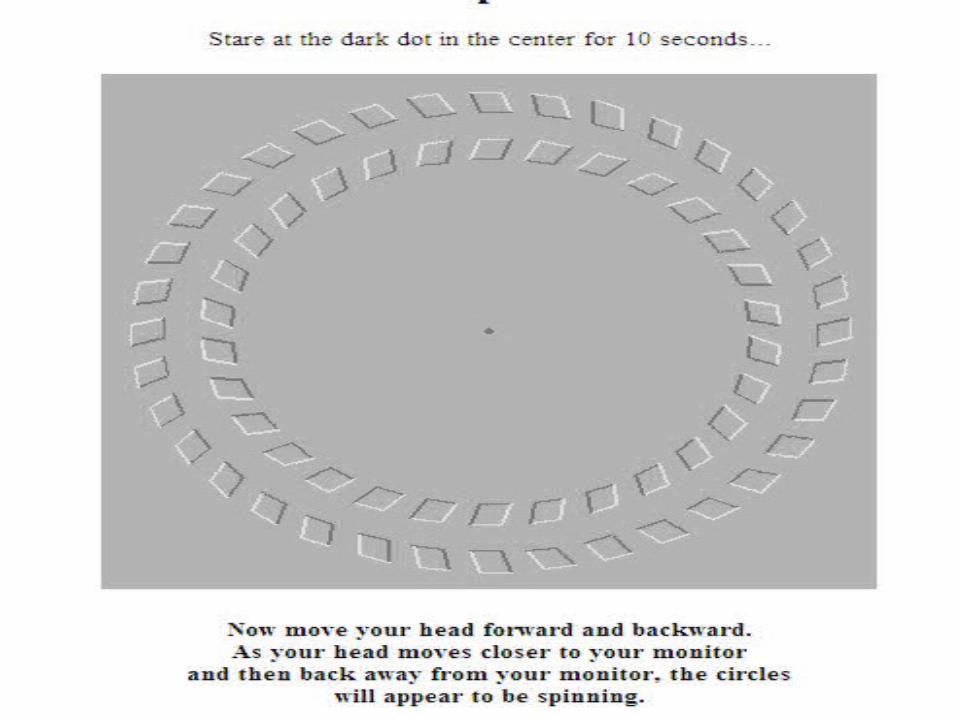
Optical Illusions- Can you follow the red dot to the
center of the spiral?
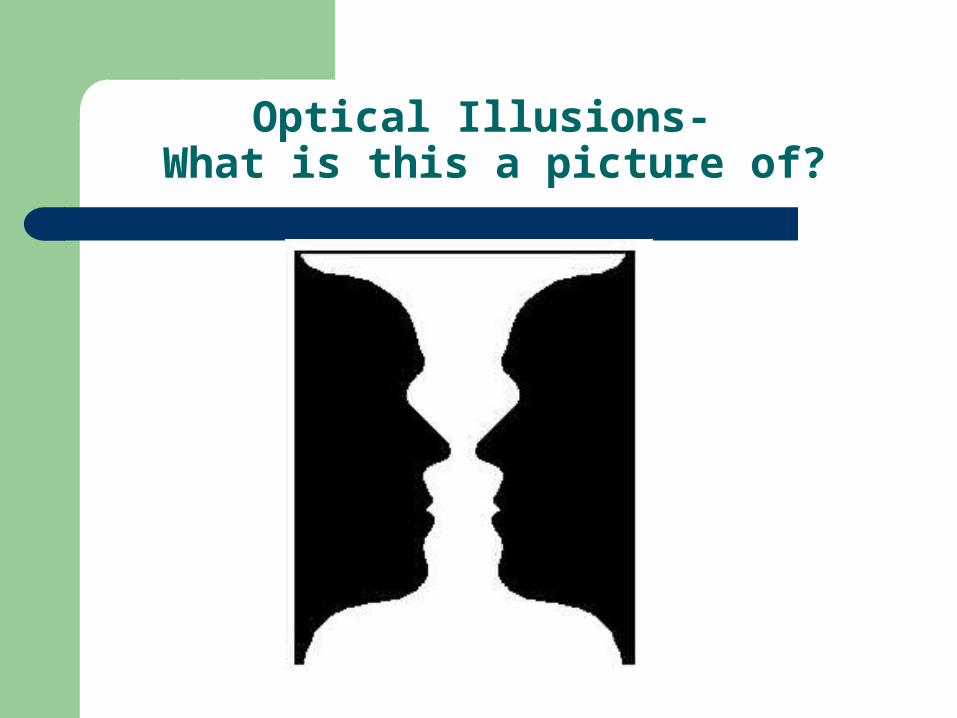
Optical Illusions- What is this a picture of?
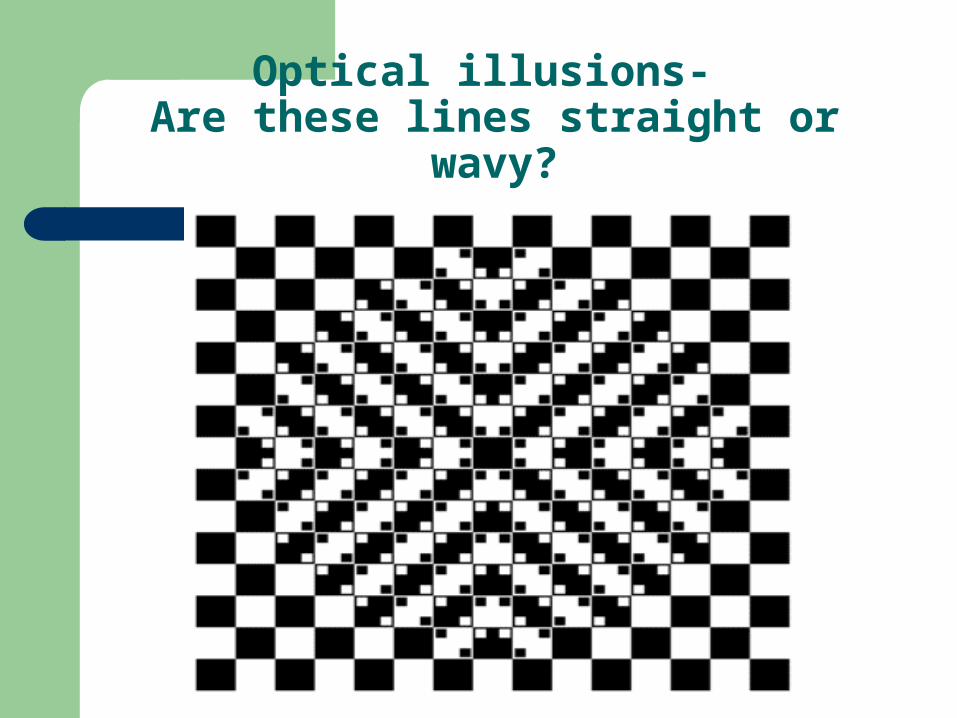
Optical illusions- Are these lines straight or wavy?
Optical Illusions
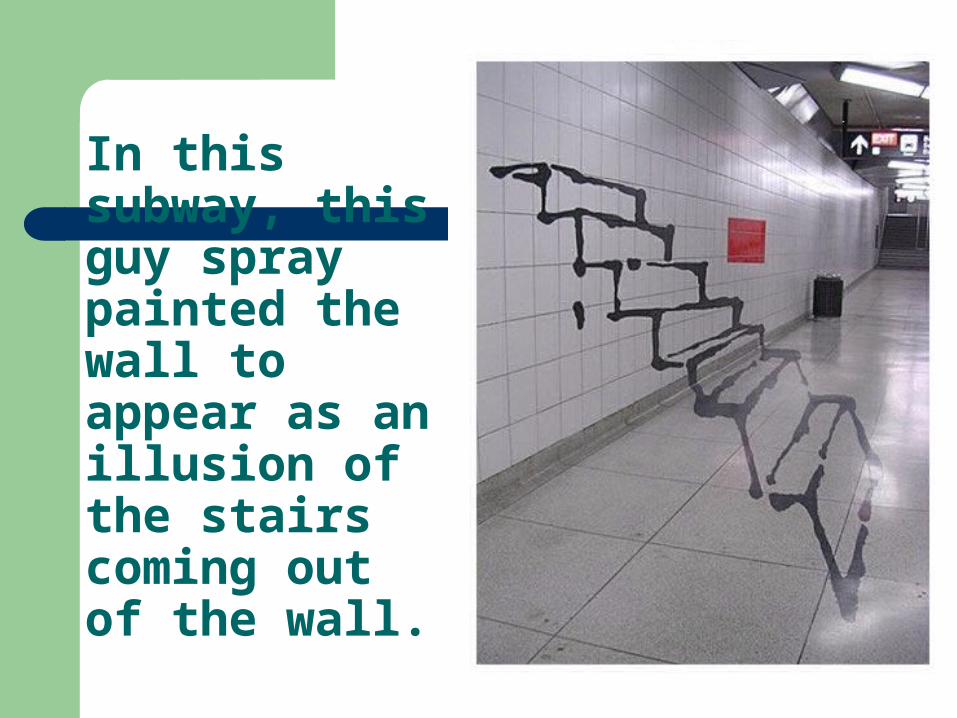
In this subway, this guy spray painted the wall to appear as an illusion of the stairs coming out of the wall.
Optical Illusions
Pac Man Illusion
Graphing
Graphing– A visual display of information or data– Helps to make information easier to see and read
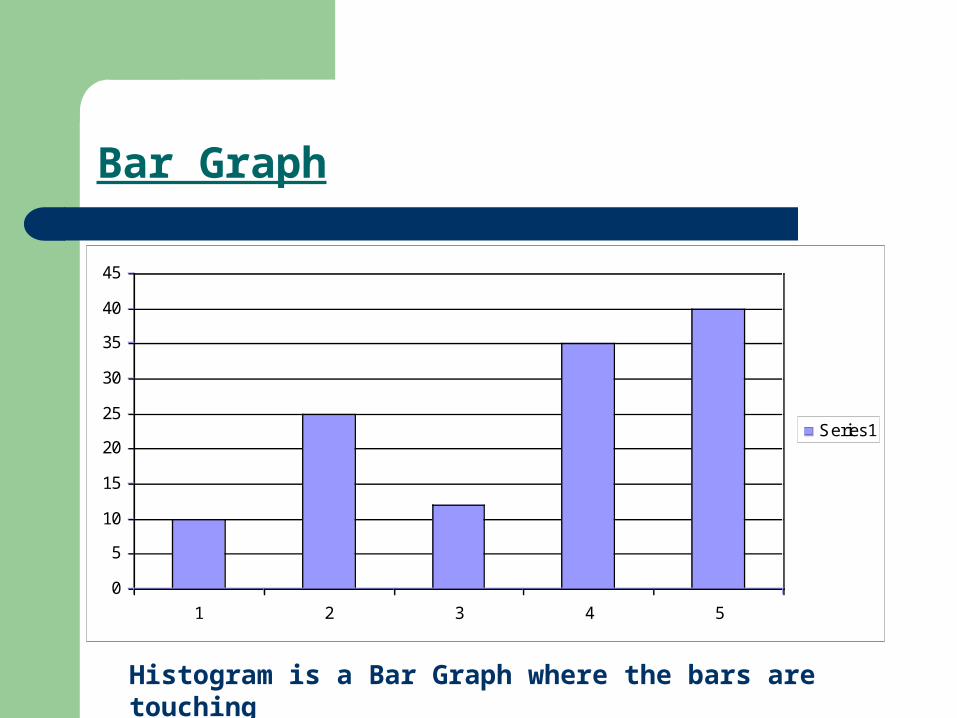
Bar Graph
0
5
10
15
20
25
30
35
40
45
1 2 3 4 5
Series1
Histogram is a Bar Graph where the bars are touching
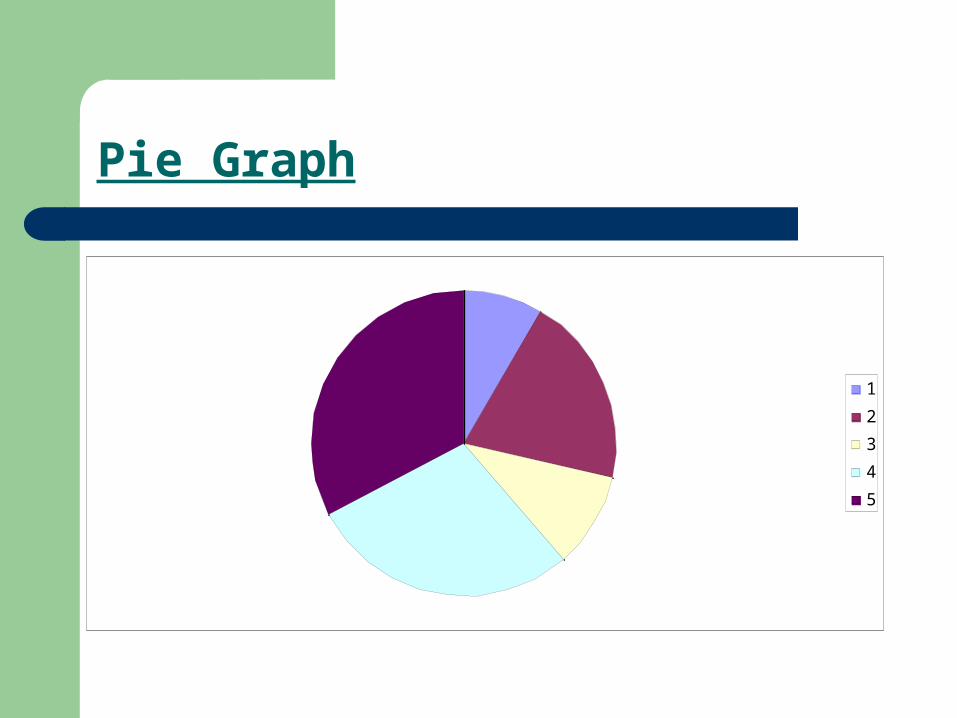
Pie Graph
1
2
3
4
5
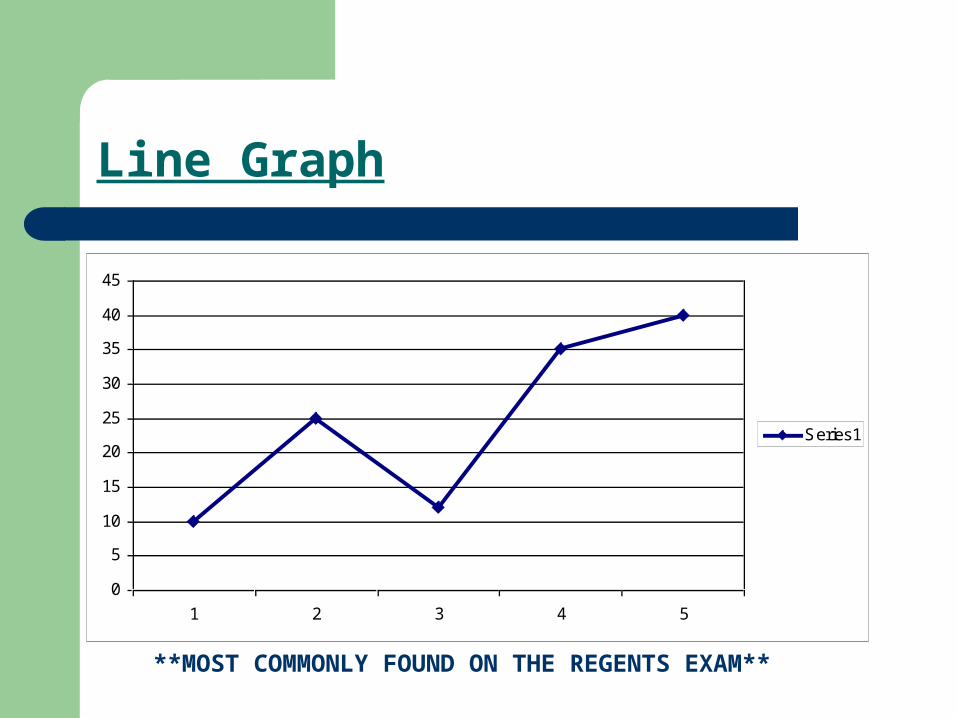
Line Graph
0
5
10
15
20
25
30
35
40
45
1 2 3 4 5
Series1
**MOST COMMONLY FOUND ON THE REGENTS EXAM**
Graphing
ALL GRAPHS NEED:– Data (numbers, measurement)– Labels on each axis– Title– Appropriate scale (the space between each
number must be the same)
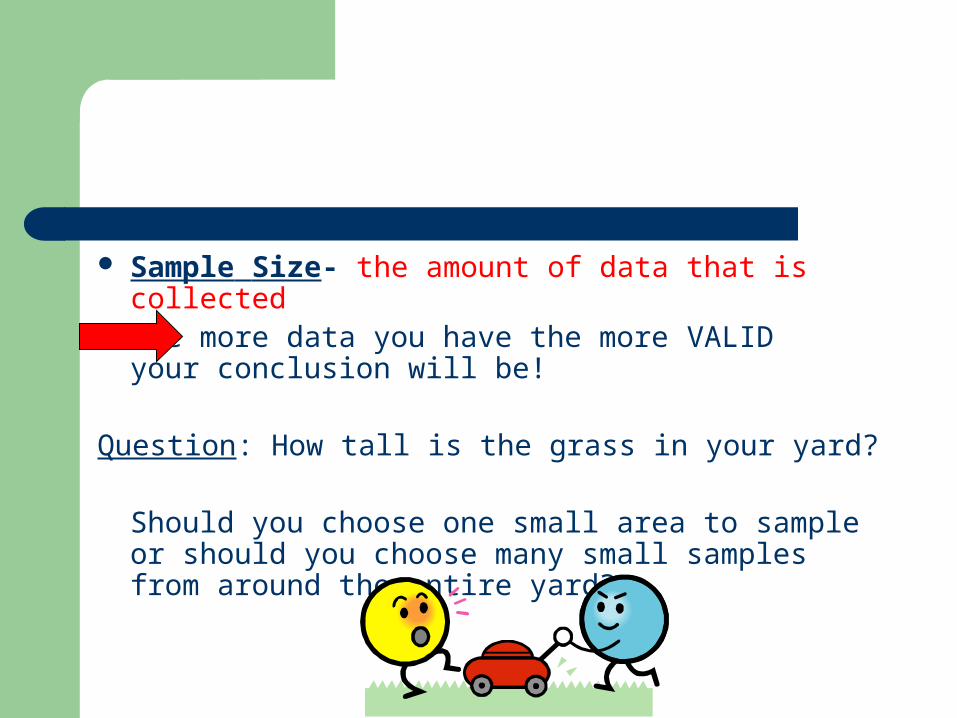
Sample Size- the amount of data that is collectedThe more data you have the more VALID your conclusion will be!
Question: How tall is the grass in your yard?
Should you choose one small area to sample or should you choose many small samples from around the entire yard?
Validity of an Experiment
There are two ways that you can make an experiment more VALID:1. Repeat the experiment and get the
same results
2. Increase the sample size
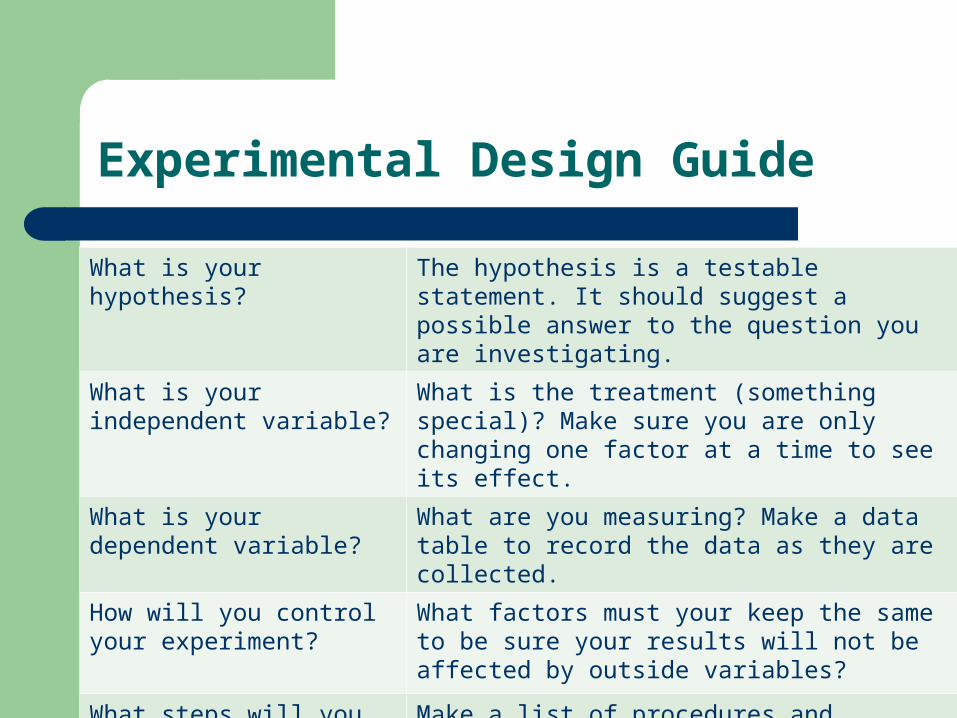
Experimental Design Guide
What is your hypothesis? The hypothesis is a testable statement. It should suggest a possible answer to the question you are investigating.
What is your independent variable?
What is the treatment (something special)? Make sure you are only changing one factor at a time to see its effect.
What is your dependent variable?
What are you measuring? Make a data table to record the data as they are collected.
How will you control your experiment?
What factors must your keep the same to be sure your results will not be affected by outside variables?
What steps will you take to conduct this experiment?
Make a list of procedures and materials needed to conduct the experiment.
Question 4
A scientific study showed that the depth at which some microscopic plants were found in a lake varied from day to day. On clear days, the plants were found as far as 6 meters below the surface of the water but were only 1 meter below the surface on cloudy days.
Question 4
Which hypothesis would these observations support? (1) Light intensity affects the growth of microscopic
plants (2) Wind intensity affects the growth of microscopic
plants (3) Nitrogen concentration affects the growth of
microscopic plants (4) Precipitation affects the growth of microscopic
plants
Question 5
Tomato plants in a garden are not growing well. The gardener hypothesizes that the soil is too acidic. To test the hypothesis accurately, the gardener could
(1) plant seeds of a different kind of plant (2) move the tomato plants to an area with less
sunlight (3) change the pH of the soil (4) reduce the amount of water available to the plant
How does the Scientific Method work?
Scientific Method Video