SCIENTIFIC COMMITTEE - WCPFC MC_sharks Rev 2.pdf · SCIENTIFIC COMMITTEE ELEVENTH REGULAR SESSION...
30
SCIENTIFIC COMMITTEE ELEVENTH REGULAR SESSION Pohnpei, Federated States of Micronesia 5–13 August 2015 Monte Carlo simulation modelling of possible measures to reduce impacts of longlining on oceanic whitetip and silky sharks WCPFC-SC11-2015/EB-WP-02 Rev 2 (30 July 2015) Shelton Harley 1 , Bruno Caneco 2 , Carl Donovan 2 , Laura Tremblay-Boyer 1 and Stephen Brouwer 1 1 Oceanic Fisheries Programme, Secretariat of the Pacific Community 2 DMP Statistical Solutions UK Limited
Transcript of SCIENTIFIC COMMITTEE - WCPFC MC_sharks Rev 2.pdf · SCIENTIFIC COMMITTEE ELEVENTH REGULAR SESSION...
SCIENTIFIC COMMITTEE
ELEVENTH REGULAR SESSION
Pohnpei, Federated States of Micronesia
5–13 August 2015
Monte Carlo simulation modelling of possible measures to reduce impacts of
longlining on oceanic whitetip and silky sharks
WCPFC-SC11-2015/EB-WP-02Rev 2 (30 July 2015)
Shelton Harley1, Bruno Caneco2, Carl Donovan2 , Laura Tremblay-Boyer1 and
Stephen Brouwer1
1 Oceanic Fisheries Programme, Secretariat of the Pacific Community2 DMP Statistical Solutions UK Limited

Revision 2: 30 July 2015
In Rev 1 the result plot for the additional scenario had been included for oceanic whitetip shark,
but not silky shark. It has been included here now (Figure 6).
Revision 1: 29 July 2015
In response to a comment on the initial version of this paper we have added an additional scenario
(prohibiting both wire traces and shark lines) to assist with consideration of the current shark
CMM, in particular the consequences of allowing CCMs to choose which measure to apply (shark
line or wire trace restrictions).
This scenario has been added to the text, figures, and tables as appropriate.
2

Executive Summary
The paper develops and applies a model for how oceanic whitetip shark and silky shark might
interact with longline gear; using it to quantify potential sources of fishing-related mortality. It
integrates available information of gear characteristics, spatial differences in the density of the
two species, and the results of previous studies on catchability and survival. With this model we
evaluate four simple potential management measures: (1) removal of shallow hooks; (2) removal of
shark lines; (3) requirement for circle hooks; and (4) requirement for monofilament leaders.
The analyses, and measures considered, represent an example of what can be undertaken with the
simulation model developed and we anticipate examining other scenarios at the request of SC11 or
CCMs.
The key conclusions of the analyses are:
1. There are still critical gaps in our knowledge of longline gear configurations – with respect
to the key variables important to sharks – for almost all Distant Water longline fleets due to
the paucity or absence of observer data;
2. Collection of data on hook location (i.e., whether the hook was swallowed, or the shark was
hooked in the lip), and how oceanic whitetip shark and silky shark are released (e.g., cut-
off on the line in water or brought on-board and hook retrieved) will be critical for better
understanding the potential fishing-related mortality and the effectiveness of the current
Conservation and Management Measures (CMMs). We recommend that collection of these
data by observers be considered;
3. There are few relevant scientific studies of likely rates of release mortality for oceanic whitetip
shark and silky shark caught and released under commercial fishing conditions. This should
be a priority for field studies, but the design of such studies should consider information under
(2) above, particularly how sharks are released; and
4. Given available data and assumptions made in the analyses - the following results were ob-
tained from application of the model through Monte Carlo simulation testing:
• The initial interaction of silky shark and oceanic whitetip shark with longline gear can
be reduced by both the banning of shark lines or the removal of “shallow-hooks”, which
we defined as the three hooks closest to the start/end of the basket;
• Banning shark lines has the potential to reduce fishing mortality by 14.7% and 23.3%
for silky shark and oceanic whitetip shark respectively, and removing shallow hooks has
the potential to reduce fishing mortality by 11.7% and 6.7% respectively;
• Banning wire trace – while unlikely to influence initial interaction – lead to increased
bite-offs which resulted in the greatest reductions in fishing mortality of the measures
3

considered – 17.6% and 23.3% for silky shark and oceanic whitetip shark respectively;
• Prohibiting both shark lines and wire trace is predicted to reduce mortality by 29.4%
and 40% for silky shark and oceanic whitetip shark respectively.
• The tendency for greater lip-hooking with circle hooks and therefore fewer bite-offs meant
little predicted benefit from requiring circle hooks; and
• Given the high levels of fishing mortality experienced by these two species, it is unlikely
that the options under the shark CMM (2014-05) of either banning shark lines or wire
traces will result in sufficient reductions in fishing mortality. Strengthening this measure
may be necessary.
We invite SC11 to consider the specific recommendations of this work and the preliminary results
from the model. We particularly invite comments on the model assumptions, potential sources of
information to better support the model, and potential mitigation measures that could be examined.
1 Introduction
MSY -based reference points from stock assessments for oceanic whitetip shark (Rice and Harley,
2012) and silky shark (Rice and Harley, 2013) indicated that the stocks were experiencing overfishing
(Fcurrent/FMSY > 1) and in an overfished state (SB current/SBMSY < 1). As a consequence the
Western and Central Pacific Fisheries Commission (WCPFC) prohibited the retention of these
species (WCPFC, 2011, 2013), and initiated analytical work of existing longline observer data to
determine factor relating to the capture and life status of these species. Following the analyses
provided in Bromhead et al. (2013) and Caneco et al. (2014), the WCPF Commission banned the
use of shark lines (WCPFC, 2014) and then requested that we use the results from this work, and
other relevant work, to examine the potential impacts of different mitigation measures on total
fishing related mortality for oceanic whitetip shark and silky shark.
This paper describes the development of a model of the capture and handling of sharks by long-
lines, describes how the various model inputs were derived, then describes the results of a set of
evaluations where we compare the performance of different potential mitigation measures. This
analysis encountered several data issues and data gaps which are then described within the context
of suggested recommendations for the SC to consider.
2 Methods
This analysis was comprised of several steps which are briefly outlined below and then expanded
on in the follow sections:
4

1. Development of a process model of how oceanic whitetip shark and silky shark can interact
with a longline fishing gear, including the key factors likely to influence life status;
2. Development of a spatial surface of total longline fishing effort in terms of hooks deployed
with particular gear configurations;
3. Development of a spatial surface of oceanic whitetip shark and silky shark abundance so that
the location of deployment of fishing gear relative to the density of the two shark species
can be taken into account, e.g., fishing patterns in areas of highest abundance will be more
important to the overall longline impact than fishing in areas of low density;
4. Use information from previous analyses and the literature to parameterise the model in (1)
in terms of values (or probability distributions) for catchability and survival etc.;
5. Develop several management intervention scenarios, e.g., a total prohibition on the use of
shark lines, wire traces, and shallow hooks etc.; and
6. Evaluate the scenarios with the model and compare key outcomes.
2.1 Development of the process model
The first step in the analysis was to develop a model that describes how the two species encounter
longline fishing gear and how different aspects of the way in which the longline gear is configured
can impact on encounter rates and subsequent fishing mortality.
In developing the model we considered models developed by others (e.g., Patterson et al., 2014),
reviews of shark mitigation (e.g., Clarke, 2011; Curran, 2014) and the results of our own previous
analyses of the impacts of longline gear characters on catch rates and fate (e.g., Bromhead et al.,
2013; Caneco et al., 2014).
The model was separated into two parts:
The catch component: what were the factors that determined how many sharks would encounter
and be at least briefly hooked on the gear (Figure 1); and
The fate component: what happens to those sharks that are hooked (Figure 2).
The catch model (Figure 1) firstly required a determination of effort: a spatial surface where effort
was weighted based on the estimated relative abundance at that location (see Section 2.4). Caneco
et al. (2014) showed differential catching efficiency of shark lines, shallow hooks (defined here as
the 3 hooks at the start/end of the basket), and deep hooks (the remainder of hooks in the basket),
so effort was characterized by these three categories and this was used to predict the catch. We
also monitored whether the shark was caught on a wire or monofilament trace. We assumed that
leader material did not impact of catchability (Afonso et al., 2012), but was important to follow
for the fate model.
5

The fate model was more complex and started with a ‘fork’ as to whether the sharks the had been
caught on the line were hooked in the mouth area (i.e., lip hooked) or whether they had swallowed
the hook (i.e., gut hooked). In our model this break down was dependent on the hook types
used, and hooking location determined the likelihood of a shark biting off the line, and subsequent
survival probabilities at different stages of the process (i.e., gut-hooked fish are less likely to survive
release or escape than lip-hooked fish).
The first step for hooked fish was the ‘bite-off’ where fish potentially escape from the line. We
assume that hooking location and leader material influences the probability of biting off, with
minimal bite-offs assumed for wire leaders, and higher bite-offs for gut hooked fish as the leader is
exposed to contact with their teeth.
For those that remain on the line, we have estimates of the probability that they will be dead once
they are retrieved to the side of the boat. For those that are alive at the time of retrieval, they can
either be released while in the water, or brought on-board and then returned to the water. Their
subsequent mortality depends again on hooking location and where they were released.
2.2 Data
Two data sets were used for this analysis.
The first was raised 5×5◦ longline effort data by vessel-flag for the years 2008–2013 were aggregated
over time to give a spatial surface of hooks set by vessel-flag. We excluded effort outside the
equatorial region (20◦ N–20◦ S) as the abundance of the two species was generally highest in this
area.
The second data set was observer records by vessel-flag again covering 2008–2013 and the same
equatorial region. These data were used for two purposes (1) The relative abundance surface
described in Section 2.4; and (2) to characterize the gear characteristics for each flag. We were
specifically interested in shark line use, and the leader materials, and hook types used. While there
is likely some spatial and temporal differences within a fleet in these variables, the data are so sparse
that even a description at the flag-level (without including a spatial component) was uncertain for
some fleets.
2.3 Effort spatial surface
We applied the flag-specific gear characteristics (probabilities of different gear use) from the observer
data3 to the flag-based 5 × 5◦ longline effort data (Table 1) to give a spatial breakdown on hooks
set with different gear configurations. Once this was done for all of the major fleets (we covered
3For Japan we assumed the same gear characteristics as for Korea due to the lack of observer data for JapaneseDW vessels and the values for the United States were provided by Dr Keith Bigelow
6
those fleets comprising 95% of the effort in the region), we then aggregated the data set over flags
(i.e., once we had split out the effort into gear configurations, then flag was no longer important)
so we had a spatial surface with effort by different gear configurations.
At this stage we then applied the species-specific relative abundance surface so that effort was
scaled relative to abundance of the species in the location, e.g., a shark line set in a location with
high shark abundance will yield a higher expected catch than a shark line set in an area of low
shark abundance.
Once this spatial rescaling had occurred, we then aggregated the effort over space to leave a single
vector of the number of effective (correcting for abundance) hooks set with different gear configu-
rations.
2.4 Relative abundance surface
As noted above, if the use of particular gear configurations differs in space (e.g., different flagged
vessels go fishing in different areas) and the abundance of the two species is not uniform, then we
want to account for the overlap between gear-types and shark abundance. The first part is taken
into account in the construction of a spatially explicit layer of effort by gear-configuration, and the
second we describe here.
The approach taken is very similar to the construction of a relative weight surface for the MULTIFAN-
CL stock assessments (see Tremblay-Boyer et al., 2015). We use all available observer data for the
period 2008–2013 for this analysis.
We constructed a simple model of relative abundance where catch in counts were fitted against the
absolute value of latitude with an effort offset (in hooks). We used thin-plate splines from the mgcv
package (Wood, 2006) and assumed a negative binomial error distribution. We then predicted
relative abundance for 5-degree latitudinal bands and standardized to have the maximum value
equal to 1.
In considering the best spatial model to predict over, there were three models considered: (a)
predicting a two-dimensional spatial surface; (b) predicting a latitude surface and assuming abun-
dance was constant across longitude, and (c) predicting an absolute latitude surface where we
assume that relative abundance is mirrored north and south of the equator, and constant across
longitude. While we considered all three models, in the end we felt that the simplest model (c) was
the best to use because the more complex models were biased by the spatial coverage of observer
data. Predicted surfaces for oceanic whitetip shark (OCS) and silky shark (FAL) for models (a)
and (c) are provided in Figure 3.
7

2.5 Parameterizing the catch and fate models
Below we describe the inputs to the fate and catch models and the species-specific values are
provided in Tables 2 and 3 and Figures 4 and 5.
2.5.1 Catch model
Total numbers of hooks: see Sections 2.3 and 2.4 above.
Basket size: Determined from WCPO longline data underpinning Caneco et al. (2014). Expressed
here as an average size, although there are a range of sizes observed.
Hook position: Determined from WCPO long-line data as per Caneco et al. (2014). Three posi-
tions considered, Shark lines/shallow hooks/deep hooks, as previously defined. Parameterised
as log-normal distributions, with parameters estimated from models fitted within Caneco et al.
(2014). Catch rates and their uncertainty were estimated via Generalized Additive Models
(GAMs) using log-link, Tweedie-errors models. Parameters and their standard errors are used
directly. These are the means and SE’s of the estimated coefficients of the linear predictor.
2.5.2 Fate model
Probability of lip- or gut-hooking: Only the style of hook is considered to influence hooking
location. Afonso et al. (2011) offer species-specific estimates for J versus C hook types.
Probability of bite-off: Afonso et al. (2012) estimated shark bite-off rates. However they ex-
cluded hooks where > 20cm of the line was removed. This suggests that they excluded all
gut hooked fish. Their analysis was used to estimate bite-off rates of lip-hooked fish, esti-
mates for gut-hooked fish were inferred from Ward et al. (2008) who calculated catch rate
differences between wire trace and monofilament line under the assumption of zero bite-offs
for the former.
Probability of mortality given bite-off: No information – expert opinion.
Probability of mortality at time of retrieval: Estimated from SPC data (Caneco et al., 2014).
Probability release in water (vs. brought-on, then released): No information – broad dis-
tribution assumed with mean of 0.5.
Probability of mortality upon release: Post-release mortality for blue sharks has been esti-
mated to range from 15–19% (cited in Curran, 2014). In this analysis the low end of the
range (15%) (Musyl et al., 2011) was used to estimate in-water lip-hooked fish as these are
likely to have the highest survival rates. Mortality of in-water released gut hooked fish (19%)
8
was estimated from Campana et al. (2009). There is no information to inform specific mortal-
ity rates of silky or oceanic whitetip sharks landed on the vessel and released. Clarke (2011)
estimated reductions in mortality when considering the effectiveness of management mea-
sures that require sharks to be released. Without any clear guidance on post-release survival
a mid-point of the available data (34% mortality) was used for on board released lip-hooked
fish and the top end of the range (44% mortality) for on-board gut hooked fish released.
2.6 Management scenarios examined
In this preliminary examination we have compared the implementation of four sets of rules regarding
longline gear specifications and compared these to our best estimate of “current” longline gear
specifications (“status-quo”). For our analysis, current, is prior to to implementation of the shark
CMM (WCPFC, 2014), which required CCMs to prohibit either the use of shark lines or wire
leaders.
The five options considered are listed below. We stress that this model is being developed to
consider a range of options and even combinations of options, but we have kept the scenarios
simple here in the first instance:
Shark lines: Here we assume that all shark lines are removed.
Wire leaders: We assume that all wire leaders are switched to monofilament.
Shallow hooks: After Watson and Bigelow (2014) we reduced the fishing power of a longline set
based on the catchability for the three hooks closest to the start/end of the basket. The hooks
were not redistributed.
Circle hooks: We assumed that only circle hooks were used. These are reported to reduce gut
hooking which may increase release survival, but decreases bite-offs.
Shark lines and wire traces: Here we assume that all shark lines are removed and all wire
leaders are switched to monofilament.
We note that none of these options specifically model the choices that exist within the shark CMM.
At this stage we do not know the choice the individual CCMs will take. If it is assumed that those
that use shark lines, prohibit their use, while those that don’t use them, also prohibit their use,
then the ‘shark line’ scenario represents the closest approximation to the likely implementation of
the measure.
2.7 Monte Carlo simulations
All of the Monte Carlo simulations were implemented using R (R Core Team, 2013). The steps for
undertaking the simulations are described below:
9
• Apply the ‘management scenario’ to the base fishing effort to create a new effort layer. In
each scenario, hooks from a ‘restricted’ gear category were redistributed to permissible gear
categories, e.g., if wire trace was restricted then all wire trace effort was transferred to monofil-
ament leaders and other characters such as hook-type were not changed.
• Apply the catch and fate models 10,000 times – each simulation has different draws from each
input distribution.
• Keep track of catch, mortality, and survival at every stage of the catch and fate models.
We compared absolute values of total catch and total mortality across scenarios, and also the
different mortality options (i.e., where you can die in the process) and the relative change in fishing
related mortality from the status-quo option.
3 Results
Silky shark
Of the four measure considered, only removal of shallow hooks and shark lines were ‘allowed’ to
impact on the total catch (i.e., sharks initially hooked) of sharks and removal of shark lines had
slightly larger catch reductions for silky shark than removal of shallow hooks (Figure 6). For silky
shark all four measures resulted in a reduction in total fishing-related mortality (Figures 6, 7, and 8,
and Table 4).
When comparing total mortality from a scenario, to catch from the status-quo we have an estimate
of relative fishing mortality (Table 4 and Figure 4). Banning wire traces (17.6% reduction) had a
slightly greater reduction in mortality than removal of shark lines (14.7% reduction). They achieved
their reductions in different ways, removal of wire traces through increased bite-offs which suffered
low assumed escapee mortality and removal of shark lines through reduced catches (Figures 6
and 7). Removing both wire and shark lines resulted in a 29.4% reduction. Removal of shallow
hooks had an 11.7% reduction in mortality through the same mechanisms as removing shark lines
(i.e., reduced catch), while use of circle hooks had only a very small benefit (2.9% reduction) as
improvements in survival through lip-hooking were offset by increases in mortality associated with
less shark being able to bite-off the line and therefore being retained by the gear (Figure 7).
Oceanic whitetip shark
The results for oceanic whitetip shark were generally similar to those of silky shark with slight
differences due to catchability and other parameter values that differed between species (see Tables 2
and 3).
10

Removal of shallow hooks had a relatively smaller impact on overall catch for oceanic whitetip
shark than for silky shark because oceanic whitetip shark are more vulnerable to shark lines than
shallow hooks when compared to silky shark (Figures 5 and 4; panel a). Unlike for silky shark,
not all measures reduced mortality for oceanic whitetip shark. In particular the use of circle hooks
resulted in a predicted 3.3% increase in mortality which is driven by its higher lip-hooking tendency
(and therefore lower bite-off rate). Banning of wire traces and banning shark lines both had 23.3%
reductions in mortality, while removal of shallow hooks only had a 6.7% reduction due to the lower
catchability of oceanic whitetip shark on these hooks. Removing both wire and shark lines resulted
in a 40% reduction.
4 Discussion
This exercise is particularly useful for better understanding a complex problem, aside from the
actual examination of potential management measures, it has the benefit of requiring one to specify
the nature of the interactions between the two species and longlines though a model, and examine
whether the necessary data/information exist to parameterize the model. We discuss these issues
below.
4.1 Data / information issues
There were two general types of data/information problems encountered in this analysis, firstly
those relating to data which should exist, but does not, and the second relating to new information
that should be collected.
In terms of the first challenge, the analysis was again hampered by low levels of observer cov-
erage and close to zero observer coverage for several key distant water fleets. Despite new rules
regarding observer coverage, no recent observer data was available for distant water vessels from
China, Chinese Taipei, Korea, and Japan. The reasons for these data gaps include data not being
submitted to WCPFC, to data only recently submitted that is being entered / migrated into the
data bases. Data that were available for China and Chinese Taipei, was primarily from off-shore
vessels that were based in the EEZs of Pacific Island countries and therefore these data may not be
representative of the larger distant-water vessels. Improved coverage of observer data will also al-
low the development of more fine-scale abundance surfaces. This will allow consideration of spatial
management measures.
For the second issue, the development of the model highlighted some key areas where data collec-
tion should be initiated and/or particular experiments undertaken. Some of these are specifically
required for better determining the likely fishing-related mortality of the two shark species for
which retention is now prohibited. We recommend that, where practical, observers on longline
11

vessels collect hooking location, specifically whether the hook is visible (i.e. lip-hooked) or not-
visible (i.e., gut-hooked) as this is an important factor in release mortality. We also recommend
that information be collected on how these two species are released, specifically whether they were
released while in the water or whether they were brought on-aboard the vessel first, and whether
an attempt was made to remove the hook. In conjunction with this information, it is recommended
that a set of experiments be undertaken to estimate release survival under the types of conditions
of pre-release ‘treatment’ received (e.g., after Campana et al., 2009).
4.2 Model
We developed a two-step model building on previous studies of factors impacting shark catch
rates and mortality (Clarke, 2011; Bromhead et al., 2013; Caneco et al., 2014) and other models
(Patterson et al., 2014). The model made quite strong assumptions about what factors impact
catch rates (e.g., location and hook depth) and what impacts on release mortality (e.g., hooking
location and how released). This model can be expanded to include new processes and factors that
are likely to be important. These could include shark size, bait type, location/water temperature
(for release survival), but the main limitation will be the development of the effort surface that
contains these characteristics.
Further development in the model and/or the results of any experiments could result in new poten-
tial data needs. One benefit of a model such as this is that it can be used to assess the sensitivity
of mortality estimates to uncertainty in particular parameters and processes. Such analyses could
be used to help prioritize observer data collection and research experiments.
This model was developed in the R software (R Core Team, 2013) which makes it relatively acces-
sible to other scientists, but we are particularly interested in implementing the model using Shiny4
which is a set of libraries within R that allow the development of web-based applications. It is
possible to develop the application so that it runs on a website accessible to all, and users have the
ability to change model inputs and build new scenarios to test. We welcome the consideration of
SC11 as to whether this is considered a priority at this time.
4.3 Mitigation measures
Notwithstanding the concerns raised above, we have used available data to evaluate some measures
and the main goal of the exercise was to compare different mitigation measures for silky shark
and oceanic whitetip shark. Both species are assessed to be below SBMSY and experiencing levels
of fishing mortality well in excess of FMSY. It is now prohibited to retain either of these species
(WCPFC, 2011, 2013). From 2015, the use of either shark lines or wire trace has been prohibited
(WCPFC, 2014), so evaluation of this measure was one of the major undertakings in this analysis.
4http://shiny.rstudio.com/
12

Based on observer estimates of shark line use, the banning of this approach does have scope to
have a significant impact on overall mortality of these two species, with estimates of reductions in
fishing-related mortality of 14.7% for silky shark and 23.3% for oceanic whitetip shark. What is
promising about this measure is that there should be minimal impact on the catch of other species
which are likely to be of value (Bromhead et al., 2013). A similar measure is the removal of shallow
hooks, i.e., the three hooks closest to the start/end of the basket. This is likely to have a greater
impact on catch of other species (Watson and Bigelow, 2014), and from our analysis could result
in reductions in fishing-related mortality of 11.7% for silky shark and 6.7% for oceanic whitetip
shark. As noted by Watson and Bigelow (2014) the reductions in catch of desirable species could
be itself mitigated by redistributing the shallow hooks in the middle of the basket (i.e., make them
deep hooks), but we have not considered this here.
Both of those measures directly reduce the catch of the longline gear, i.e., by reducing hooks placed
in the shallow water inhabited by these two species (Musyl et al., 2011), while other measures
examined attempted to improve the ‘fate’ of a shark once it was hooked. Removal of wire traces
had the greatest impact on fishing mortality for both silky shark (17.6% reduction) and oceanic
whitetip shark (23.3% reduction). This was primarily driven by the increase in sharks biting-off
and escaping, assuming these fish experienced low mortality relating to the bite-off process.
The requirement to use circle hooks had very little impact on overall fishing mortality and in fact
predicted an increase in mortality for oceanic whitetip shark. The key driver of this result is the
expectation that circle hooks lead to more lip-hooked sharks and these are less able to bite-off the
gear and therefore suffer higher mortality. This result is will be sensitive to the relative release
mortality experienced by lip- and gut-hooked individuals and will hopefully be addressed in any
release mortality experiments.
The current CMMs have the following requirement for releasing captured silky shark and oceanic
whitetip shark: “to release any silky shark that is caught in the Convention Area as soon as possible
after the shark is brought alongside the vessel, and to do so in a manner that results in as little
harm to the shark as possible”. This does not make specific requirements around removal of hooks
and whether sharks can be brought on-board. Further experimental work and simulation modelling
could inform further consideration of these provisions to obtain better reductions in mortality for
these two shark species.
As noted above, the levels of fishing mortality experienced by these two species is well in excess
of FMSY and the first impression from the analysis conducted here is that giving the option of
prohibiting shark lines or wire traces is unlikely to be sufficient to reduce fishing mortality to levels
that will rebuild these populations – though at the time of this analysis we do not know which
options CCMs have taken. Banning both would have considerable stronger benefits. SC11 should
consider whether further measures are warranted at this time and/or whether the results of this
analysis be incorporated into projection runs for the two shark species integrating both current
levels of fishing effort and the likely impact of the ban on shark lines.
13
Acknowledgements
The authors would like to than Dr Shelley Clarke for useful discussions around the development of
the model and possible approaches to overcome gaps in observer data for key fleets. Dr Sam (aka
Bob) McKechnie reviewed an earlier draft of the paper.
References
Afonso, A., Santiago, R., Hazin, H., and Hazin, F. (2012). Shark bycatch and mortality and hook
bite-offs in pelagic longlines: interactions between hook types and leader materials. Fisheries
Research, 131–133:9–14.
Afonso, A. S., Hazin, F. H., Carvalho, F., Pacheco, J. C., Hazin, H., Kerstetter, D. W., and Burgess,
G. H. (2011). Fishing gear modifications to reduce elasmobranch mortality in pelagic and bottom
longline fisheries off Northeast Brazil. Fisheries Research, 108(2):336–343.
Bromhead, D. B., Rice, J., and Harley, S. J. (2013). Potential approaches to mitigate bycatch
of oceanic whitetip and silky sharks from longline fisheries. WCPFC-SC9-2013/EB-WP-02,
Pohnpei, Federated States of Micronesia, 6–14 August 2013.
Campana, S., Joyce, W., and Manning, M. (2009). Bycatch and discard mortality on commercially
caught blue sharks Prionace glauca assessed using archival satellite pop-up tags. Marine Ecology
Progress Series, 387:241–253.
Caneco, B., Donovan, C., and Harley, S. J. (2014). Analysis of WCPO longline observer data to
determine factors impacting catchability and condition on retrieval of oceanic white-tip, silky,
blue, and thresher sharks. WCPFC-SC10-2014/EB-WP-01, Majuro, Republic of the Marshall
Islands, 6–14 August 2014.
Clarke, S. (2011). A status snapshot of key shark species in the western and central pacific and
potential mitigation options. WCPFC-SC7-2011/EB-WP-04.
Clarke, S., Harley, S. J., Hoyle, S. D., Rice, J., and Clarke, S. C. (2011). An indicator-based analysis
of key shark species based on data held by SPC-OFP. WCPFC-SC7-2011/EB-WP-01, Pohnpei,
Federated States of Micronesia, 9–17 August 2011.
Curran, D. (2014). Shark catch in pelagic longline fisheries: A review of mitigation measures.
WCPFC-SC10-2014/EB-IP-11, Majuro, Republic of the Marshall Islands, 6–14 August 2014.
Musyl, M., Brill, R., Curran, D., Fragoso, N., McNaughton, L., Nielsen, A., Kikkawa, B., and
Moyes, C. (2011). Post release survival, vertical and horizontal movements and thermal habitats
of five species of pelagic shark in the central Pacific Ocean. Fisheries Bulletin, 109(4):341–368.
14

Patterson, H., Hansen, S., and Larcombe, J. (2014). A review of shark bycatch mitigation in tuna
longline fisheries. WCPFC-SC10-2014/ EB-WP-05, Majuro, Republic of the Marshall Islands,
6–14 August 2014.
R Core Team (2013). R: A language and environment for statistical computing. R Foundation for
Statistical Computing, Vienna, Austria.
Rice, J. and Harley, S. J. (2012). Stock assessment of oceanic whitetip sharks in the western and
Central Pacific Ocean. WCPFC-SC8-2012/SA-WP-06, Busan, Republic of Korea, 7–15 August
2012.
Rice, J. and Harley, S. J. (2013). Updated stock assessment of silky sharks in the western and
Central Pacific Ocean. WCPFC-SC9-2013/SA-WP-03, Pohnpei, Federated States of Micronesia,
6–14 August 2013.
Tremblay-Boyer, L., McKechnie, S., and Harley, S. J. (2015). Spatial and fisheries structure and re-
gional weights for the 2015 south Pacific albacore tuna (Thunnus alalunga) assessment. WCPFC-
SC11-2015/SA-IP-07, Pohnpei, Federated States of Micronesia, 5–13 August 2015.
Ward, P., Lawrence, E., Darbyshire, R., and Hindmarsh, S. (2008). Large-scale experiment shows
that nylon leaders reduce shark bycatch and benefit pelagic longline fisheries. Fisheries Research,
90:100–108.
Watson, J. T. and Bigelow, K. A. (2014). Trade-offs among catch, bycatch, and landed value in
the American Samoa longline fishery. Conservation Biology, 28(4):1012–1022.
WCPFC (2011). Conservation and Management Measure for oceanic whitetip sharks. Conservation
and Management Measure 2011–04, Eighth Regular Session of the WCPF Commission, Guam,
USA, 26–30 March 2012.
WCPFC (2013). Conservation and Management Measure for silky sharks. Conservation and Man-
agement Measure 2013–08, Tenth Regular Session of the WCPF Commission, Cairns, Australia,
2–6 December 2013.
WCPFC (2014). Conservation and management measure for sharks. Conservation and Manage-
ment Measure 2014-05, Eleventh Regular Session of the WCPF Commission, Apia, Samoa, 1–5
December 2014.
Wood, S. N. (2006). Generalize Additive Models: An introduction with R. Chapman and Hall/CRC.
Yokota, K., Kiyota, M., and Minami, H. (2006). Shark catch in a pelagic longline fishery: Com-
parison of circle and tuna hooks. Fisheries Research, 81(2–3):337–341.
15

Table 1: Proportion of longline gear use characteristics by vessels for the flags considered in thisanalysis.
Wire Mono J Tuna Circle ShkLn NoShkLn Shllw NoShllw
CK 0.005 0.995 0.383 0 0.617 0 1 1 0CN 0.140 0.860 0.369 0 0.631 0.142 0.858 1 0FJ 0.269 0.731 0.198 0 0.802 0.264 0.736 1 0FM 0.129 0.871 0 0 1 0.289 0.711 1 0JP 0.834 0.166 0.503 0 0.497 0.018 0.982 1 0KR 0.834 0.166 0.503 0 0.497 0.018 0.982 1 0MH 0.608 0.392 1 0 0 1 0 1 0PF 0.418 0.582 0.680 0 0.320 0.002 0.998 1 0PG 1 0 1 0 0 0.943 0.057 1 0TW 0.168 0.832 0.380 0 0.620 0.402 0.598 1 0US 0.900 0.100 0 0 1 0 1 1 0VU 0.350 0.650 0.867 0 0.133 0.868 0.132 1 0WS 0 1 0 0 1 1 0 1 0
16

Table 2: Parameters and distributions underpinning the simulations for oceanic whitetip shark.Lognormal distribution parameters are expressed on the log-scale. Beta parameters are expressedas a mean (p conceptually probability of success) and n which controls variance (conceptually thenumber of trials). Large n implies high-precision low-variance.
Silky shark (FAL)
Simulation component Distribution Params. Notes
Effort/Numberof hooks
N/A N/A SPC provisioned
Basket size N/A 30 Est SPC data (Canecoet al., 2014)
Catch rate(per 100 hooks):
Shark lines Lognormal µ = −0.78330σ = 0.05189
Est SPC data (Canecoet al., 2014)
Shallow hooks Lognormal µ = −4.56537σ = 0.03520
Est SPC data (Canecoet al., 2014)
Deep hooks Lognormal µ = −3.98790σ = 0.02983
Est SPC data (Canecoet al., 2014)
Prob. lip-hook(else gut) given:
J-hook Beta p = 0.2n = 14
Afonso et al. (2011)est. from plot
T-hook Beta p = 0.33n = 14
Little informationSPC prelim est.
C-hook Beta p = 0.7n = 14
Afonso et al. (2011)est. from plot
Prob. bite-offgiven:
Mono leader andlip-hooked
Beta p = 0.33n = 190
Afonso et al. (2012) 5
Mono leader andgut-hooked
Beta p = 0.40n = 32
Ward et al. (2008)
Wire leader N/A Assume negligibleProb. mort.given bite-off:
Lip-hooked Beta p = 0.0323n = 20
Little informationSPC prelim est.
Gut-hooked Beta p = 0.0625n = 20
Little informationSPC prelim est.
Prob. mort. atlanding:
Lip-hooked Beta p = 0.1974n = 11, 470
Est. SPC data(Caneco et al., 2014)6
Gut-hooked Beta p = 0.1974n = 11, 470
Est. SPC data(Caneco et al., 2014)
Prob. release in wa-ter (vs. brought-on,then released)
Beta p = 0.5n = 10
Little informationspeculative & broad
Prob. mort. given: Water release andlip-hooked
Beta p = 0.15n = 100
Musyl et al. (2011)
Water release andgut-hooked
Beta p = 0.19n = 100
Campana et al. (2009)
Landed release andlip-hooked
Beta p = 0.34n = 100
Clarke et al. (2011)
Landed release andgut-hooked
Beta p = 0.44n = 100
Clarke et al. (2011)
17

Table 3: Parameters and distributions underpinning the simulations for oceanic whitetip shark.Lognormal distribution parameters are expressed on the log-scale. Beta parameters are expressedas a mean (p conceptually probability of success) and n which controls variance (conceptually thenumber of trials). Large n implies high-precision low-variance.
Oceanic whitetip shark (OCS)
Simulation component Distribution Params. Notes
Effort/Numberof hooks
N/A N/A SPC provisioned
Basket size N/A 30 Est SPC data (Canecoet al., 2014)
Catch rate(per 100 hooks):
Shark lines Lognormal µ = −0.47969σ = 0.04487
Est SPC data (Canecoet al., 2014)
Shallow hooks Lognormal µ = −4.94498σ = 0.03262
Est SPC data (Canecoet al., 2014)
Deep hooks Lognormal µ = −4.16491σ = 0.02528
Est SPC data (Canecoet al., 2014)
Prob. lip-hook(else gut) given:
J-hook Beta p = 0.3n = 12
Afonso et al. (2011)est. from plot
T-hook Beta p = 0.33n = 12
Little informationSPC prelim est.
C-hook Beta p = 0.9n = 12
Afonso et al. (2011)est. from plot
Prob. bite-offgiven:
Mono leader andlip-hooked
Beta p = 0.33n = 190
Afonso et al. (2012) 7
Mono leader andgut-hooked
Beta p = 0.72n = 14
Ward et al. (2008)
Wire leader N/A Assume negligibleProb. mort.given bite-off:
Lip-hooked Beta p = 0.0323n = 20
Little informationSPC prelim est.
Gut-hooked Beta p = 0.0625n = 20
Little informationSPC prelim est.
Prob. mort. atlanding:
Lip-hooked Beta p = 0.1867n = 6, 361
Est. SPC data(Caneco et al., 2014)8
Gut-hooked Beta p = 0.1867n = 6, 361
Est. SPC data(Caneco et al., 2014)
Prob. release in wa-ter (vs. brought-on,then released)
Beta p = 0.5n = 10
Little informationspeculative & broad
Prob. mort. given: Water release andlip-hooked
Beta p = 0.15n = 100
Musyl et al. (2011)
Water release andgut-hooked
Beta p = 0.19n = 100
Campana et al. (2009)
Landed release andlip-hooked
Beta p = 0.34n = 100
Clarke et al. (2011)
Landed release andgut-hooked
Beta p = 0.44n = 100
Clarke et al. (2011)
18

Table 4: Overall mortality rate (deaths/catch) for silky shark for the status quo and each manage-ment scenario in terms of percentiles from Monte Carlo distributions.
Percentile10 50 90
Status-quo 0.31 0.34 0.38No Shark lines 0.26 0.29 0.33
No wire 0.25 0.28 0.32Only circle hooks 0.30 0.33 0.37No shallow hooks 0.27 0.31 0.34
No Shark lines or wire trace 0.21 0.24 0.27
Table 5: Overall mortality rate (deaths/catch) for oceanic whitetip shark for the status quo andeach management scenario in terms of percentiles from Monte Carlo distributions.
Percentile10 50 90
Status-quo 0.27 0.30 0.34No Shark lines 0.21 0.23 0.26
No wire 0.20 0.23 0.27Only circle hooks 0.27 0.31 0.35No shallow hooks 0.25 0.28 0.31
No Shark lines or wire trace 0.15 0.18 0.21
19

Figure 1: Part 1 of the theoretical model: the catch component.
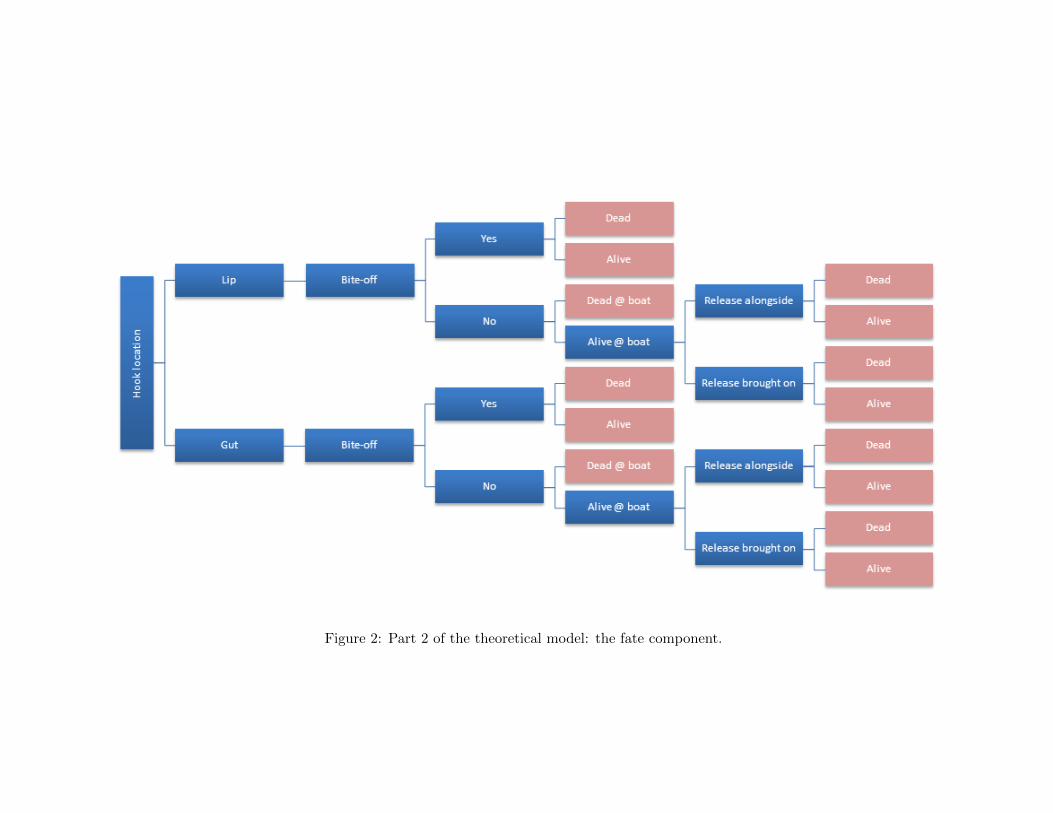
Figure 2: Part 2 of the theoretical model: the fate component.
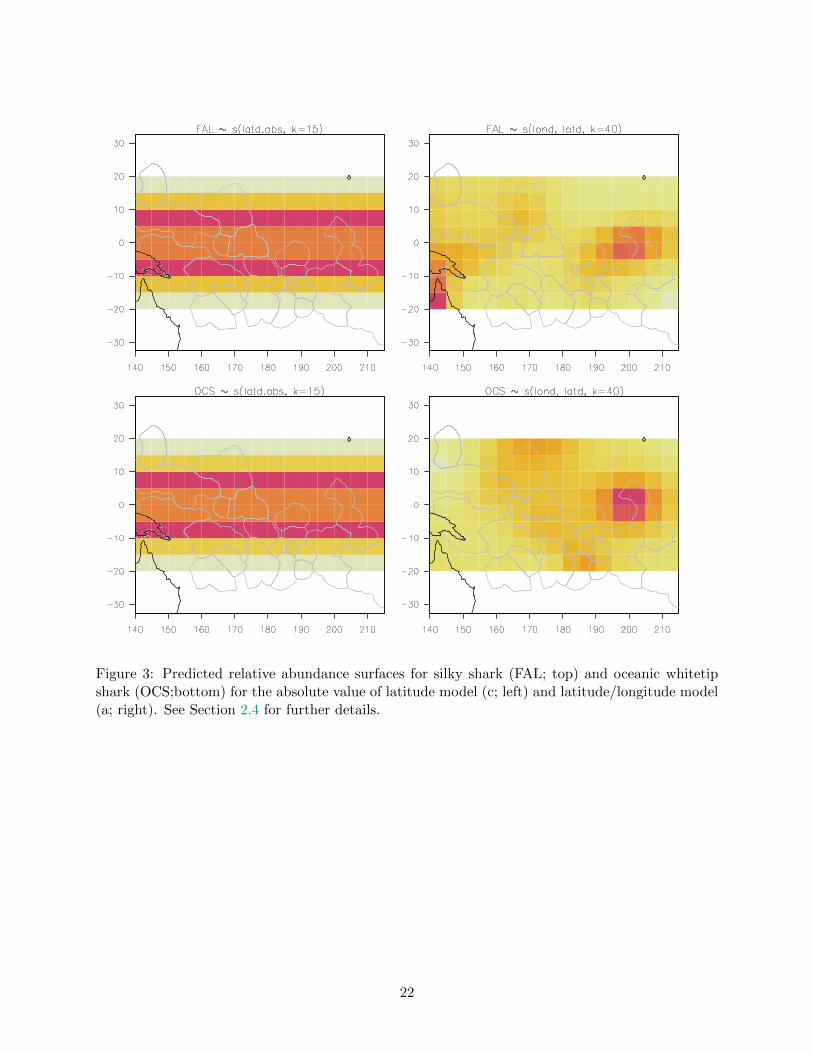
Figure 3: Predicted relative abundance surfaces for silky shark (FAL; top) and oceanic whitetipshark (OCS;bottom) for the absolute value of latitude model (c; left) and latitude/longitude model(a; right). See Section 2.4 for further details.
22
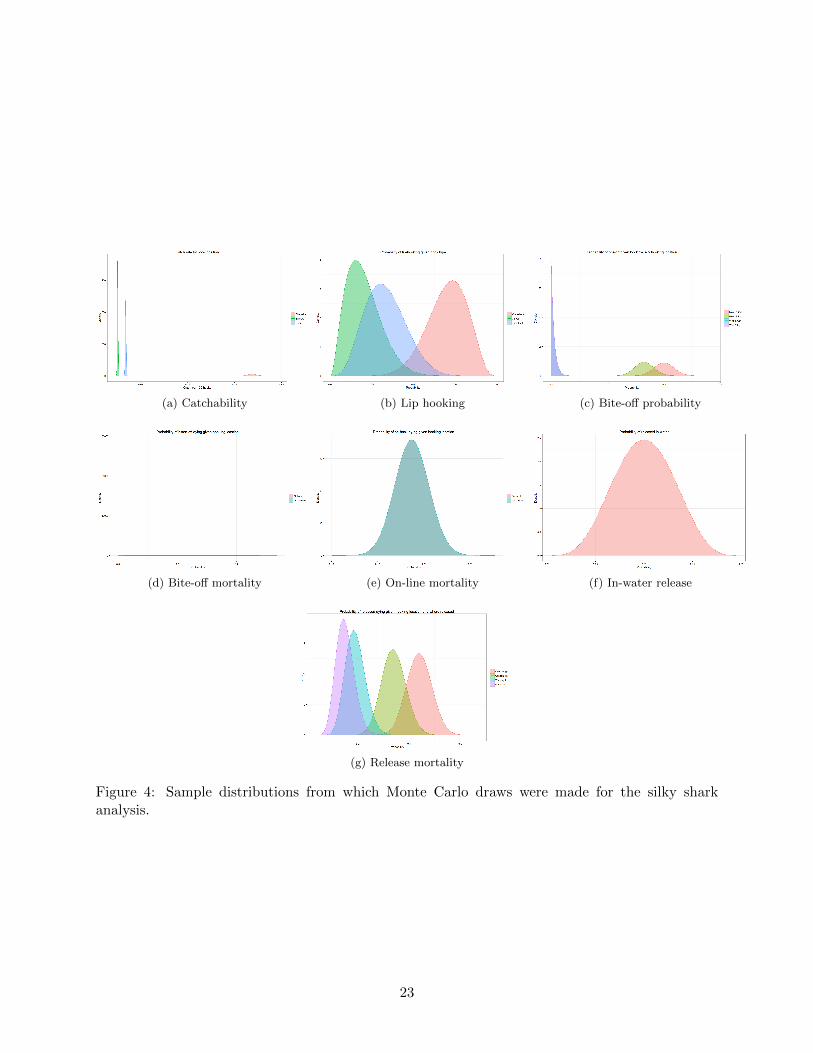
(a) Catchability (b) Lip hooking (c) Bite-off probability
(d) Bite-off mortality (e) On-line mortality (f) In-water release
(g) Release mortality
Figure 4: Sample distributions from which Monte Carlo draws were made for the silky sharkanalysis.
23

(a) Catchability (b) Lip hooking (c) Bite-off probability
(d) Bite-off mortality (e) On-line mortality (f) In-water release
(g) Release mortality
Figure 5: Sample distributions from which Monte Carlo draws were made for the oceanic whitetipshark analysis.
24
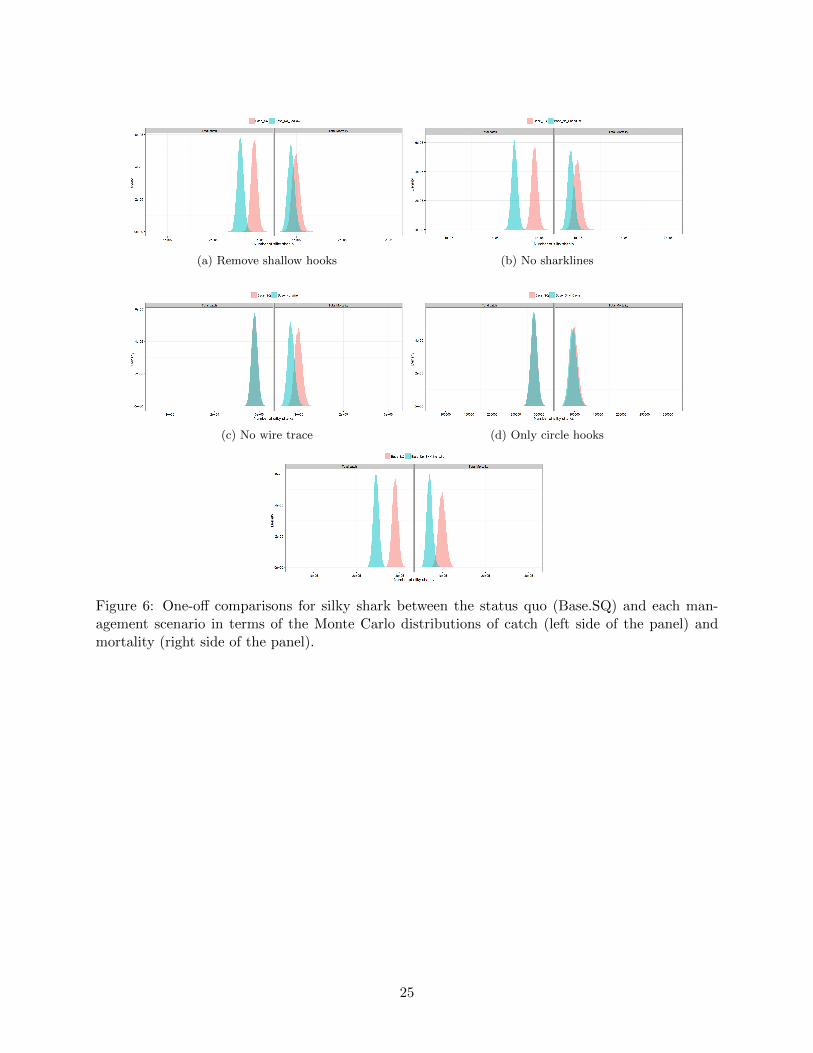
(a) Remove shallow hooks (b) No sharklines
(c) No wire trace (d) Only circle hooks
Figure 6: One-off comparisons for silky shark between the status quo (Base.SQ) and each man-agement scenario in terms of the Monte Carlo distributions of catch (left side of the panel) andmortality (right side of the panel).
25

Figure 7: Median (across 10,000 simulations) mortality components for the status quo and each management scenario for silky shark.

Figure 8: Monte Carlo distribution of mortality rates for the status quo and each managementscenario for silky shark.
27

(a) Remove shallow hooks (b) No sharklines
(c) No wire trace (d) Only circle hooks
(e) No shark lines or wire trace
Figure 9: One-off comparisons for oceanic whitetip shark between the status quo (Base.SQ) andeach management scenario in terms of the Monte Carlo distributions of catch (left side of the panel)and mortality (right side of the panel).
28

Figure 10: Median (across 10,000 simulations) mortality components for the status quo and each management scenario for oceanic whitetipshark.
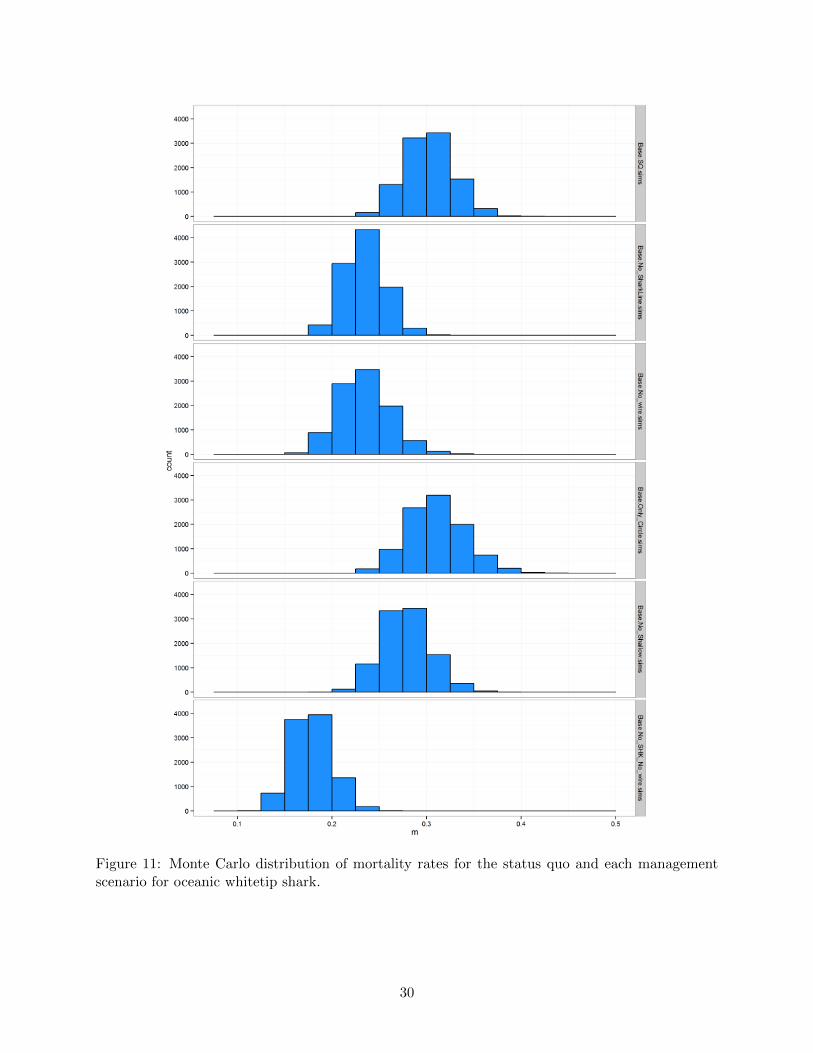
Figure 11: Monte Carlo distribution of mortality rates for the status quo and each managementscenario for oceanic whitetip shark.
30