Scientific Assessment on Livestock Predation in...
39
1 Scientific Assessment on Livestock Predation in South Africa 1 2 CHAPTER 3 3 THE SOCIO-ECONOMIC IMPACTS OF LIVESTOCK DEPREDATION AND ITS 4 PREVENTION IN SOUTH AFRICA 5 Lead author: Jane Turpie 6 Contributing author: Babatope Akinyemi 7 Introduction 8 Livestock predation occurs in nearly all rangelands around the world, and usually leads to 9 some level of investment in predator control in order to minimise economic losses. These 10 measures are often controversial due to uncertainty about their effectiveness and concerns 11 about their impacts on animal welfare, biodiversity, ecosystem functioning and populations of 12 endangered species. 13 14 The management of predators on private rangelands in South Africa has changed 15 dramatically over time. Changes in management practices have been driven by changes in 16 technology as well as changes in scientific understanding and public sentiment. Boreholes 17 were introduced around the turn of the 20 th century, which enabled commercial livestock 18 farmers to change from a kraal system to one where sheep were kept in camps. 19 Government introduced programmes to facilitate jackal-proof fencing and the extermination 20 of predators from camps (Nattrass et al. 2017). Predator removal was achieved through a 21 bounty-hunting system that persisted until the 1950s, and then by district hunting clubs that 22 employed professional hunters, supplied hunting dog packs and trained farmers in trapping 23 and poisoning. These state-supported measures led to high rates of culling of a number of 24 species including non-predatory species that competed for grazing such as dassies Procavia 25 capensis. With this support, farmers were able to employ ‘fence and clean-up’ methods to 26 great effect (Nattrass & Conradie 2015, Nattrass et al. 2017). Problems were reportedly 27 greatly diminished between the 1920s and the 1960s, but caracals Caracal caracal and later 28 black-backed jackals Canis mesomelas started to increase again thereafter. Government 29 support of the agricultural sector started to diminish in the late 1980s and along with it, public 30 assistance for the control of predators. This effectively put the situation back in the hands of 31 the farmers, who complained of a resurgence of predators on their lands (Nattrass & 32 Conradie 2015). At the same time, increasing awareness and concern about animal welfare, 33 endangered species and effectiveness of certain methods led to greater restrictions on the 34 species that could be culled as well as the methods of control, which meant that the way in 35
Transcript of Scientific Assessment on Livestock Predation in...
1
Scientific Assessment on Livestock Predation in South Africa 1
2
CHAPTER 3 3
THE SOCIO-ECONOMIC IMPACTS OF LIVESTOCK DEPREDATION AND ITS 4
PREVENTION IN SOUTH AFRICA 5
Lead author: Jane Turpie 6
Contributing author: Babatope Akinyemi 7
Introduction 8
Livestock predation occurs in nearly all rangelands around the world, and usually leads to 9
some level of investment in predator control in order to minimise economic losses. These 10
measures are often controversial due to uncertainty about their effectiveness and concerns 11
about their impacts on animal welfare, biodiversity, ecosystem functioning and populations of 12
endangered species. 13
14
The management of predators on private rangelands in South Africa has changed 15
dramatically over time. Changes in management practices have been driven by changes in 16
technology as well as changes in scientific understanding and public sentiment. Boreholes 17
were introduced around the turn of the 20th century, which enabled commercial livestock 18
farmers to change from a kraal system to one where sheep were kept in camps. 19
Government introduced programmes to facilitate jackal-proof fencing and the extermination 20
of predators from camps (Nattrass et al. 2017). Predator removal was achieved through a 21
bounty-hunting system that persisted until the 1950s, and then by district hunting clubs that 22
employed professional hunters, supplied hunting dog packs and trained farmers in trapping 23
and poisoning. These state-supported measures led to high rates of culling of a number of 24
species including non-predatory species that competed for grazing such as dassies Procavia 25
capensis. With this support, farmers were able to employ ‘fence and clean-up’ methods to 26
great effect (Nattrass & Conradie 2015, Nattrass et al. 2017). Problems were reportedly 27
greatly diminished between the 1920s and the 1960s, but caracals Caracal caracal and later 28
black-backed jackals Canis mesomelas started to increase again thereafter. Government 29
support of the agricultural sector started to diminish in the late 1980s and along with it, public 30
assistance for the control of predators. This effectively put the situation back in the hands of 31
the farmers, who complained of a resurgence of predators on their lands (Nattrass & 32
Conradie 2015). At the same time, increasing awareness and concern about animal welfare, 33
endangered species and effectiveness of certain methods led to greater restrictions on the 34
species that could be culled as well as the methods of control, which meant that the way in 35

2
which farmers could deal with problem animals became restricted. Meanwhile, new 36
legislation and the opening up of South Africa to international tourism also encouraged the 37
proliferation of game farming from the early 1990s, which markedly changed the nature of 38
the landscape and which has also been blamed for contributing to increases in problem 39
animals. Therefore, by all accounts, today’s commercial farmers are faced with a very 40
different situation than at any previous time. Their current situation has been fairly well 41
documented in a series of recent studies of small-stock, large-stock and game farmers 42
throughout South Africa. 43
44
Communal areas have never had the same level of support as the commercial farmers, and 45
the problem in these areas has received considerably less attention. There is relatively little 46
information on the effect of predation and on farmer responses in these areas in South 47
Africa, though much more is known from comparable areas in other parts of the southern 48
Africa. 49
50
It is now up to both commercial and subsistence farmers to take their own decisions as to 51
how much to invest in predator control. As a rational ‘Homo economicus’, a farmer’s 52
decision would be based on an assumed relationship between the level of investment in anti-53
predator measures, the value of the losses avoided and their budget constraint. Their 54
implicit decision model would be based on past experience and reports of predation rates in 55
the area and understanding or beliefs of the effectiveness and costs of different measures. 56
However, in reality, farmer decisions are also likely to be driven by cultural tradition and 57
beliefs, lifestyle choices, ethical stance, risk profile and tendency for compliance, as well as 58
consideration of neighbour behaviour. These decisions may also be expected to differ 59
between private and communal lands. Unlike private farmers whose decisions take place in 60
the relatively closed-system context of fenced land, communal farmers are not likely to be 61
able to control predation risk without strong co-operation within their communities. 62
Therefore, communal-land farmer decisions in this regard would be likely to be driven 63
primarily by the need to protect stock rather than eliminate predators. This recalls the strong 64
sentiment among commercial farmers that being able to move from herding and kraaling as 65
a result of fencing, water and other advancements has been an important determinant of 66
commercial success. Communal farmers do not have the same choices. 67
68
While private and communal farmers act in their own interest, the hypothetical social planner 69
that guides policy will also take the costs and benefits to other members of society, including 70
future generations, into account. If a farmer’s actions impose external costs on the rest of 71
society, such as loss of biodiversity, these will need to be internalised. In a nutshell, 72
3
livestock losses should be weighed against the value of biodiversity losses. Since it is 73
difficult to obtain satisfactory estimates of the latter, policy relies on well-informed value 74
judgements to some extent. Unless ways are found to identify and achieve the optimal level 75
of co-existence, farmers may suffer excessive losses, ecosystems may be out of balance 76
with cascading consequences, and conservation managers may fail to achieve the levels of 77
biodiversity protection that society desires. What is clear is that scientists and policy makers 78
in these two spheres of interest will need to work together to better understand the impacts 79
of predation and the effectiveness of different measures in reducing these risks. This 80
understanding is crucial in order to determine the optimal path for society and the policy 81
measures required to get there. 82
83
The chapter draws on the international literature to achieve a broad understanding of the 84
economic and social aspects of predator-livestock issues, and summarises current 85
understanding of the situation in South Africa. We review information from commercial 86
livestock and wildlife-based enterprises on private lands, as well as small-scale and 87
subsistence farming areas of communal lands. We then focus on synthesising current 88
understanding on the costs incurred to farmers in preventing and succumbing to livestock 89
depredation, and the broader economic and social implications of this. The attitudes and 90
investment decisions of farmers are also discussed. The impacts on biodiversity and overall 91
policy implications are discussed in subsequent chapters. 92
93
Overview of the livestock and wildlife farming sectors 94
With very little land area being arable and 91% of the land being classified as arid or semi-95
arid, the majority of South Africa’s land area (69%) is under rangeland. Livestock farming is 96
therefore the largest agricultural sector and contributes substantially to food security. 97
Livestock accounts for 47% of South Africa’s agricultural GDP and employs some 245 000 98
workers (Meissner et al. 2013). 99
100
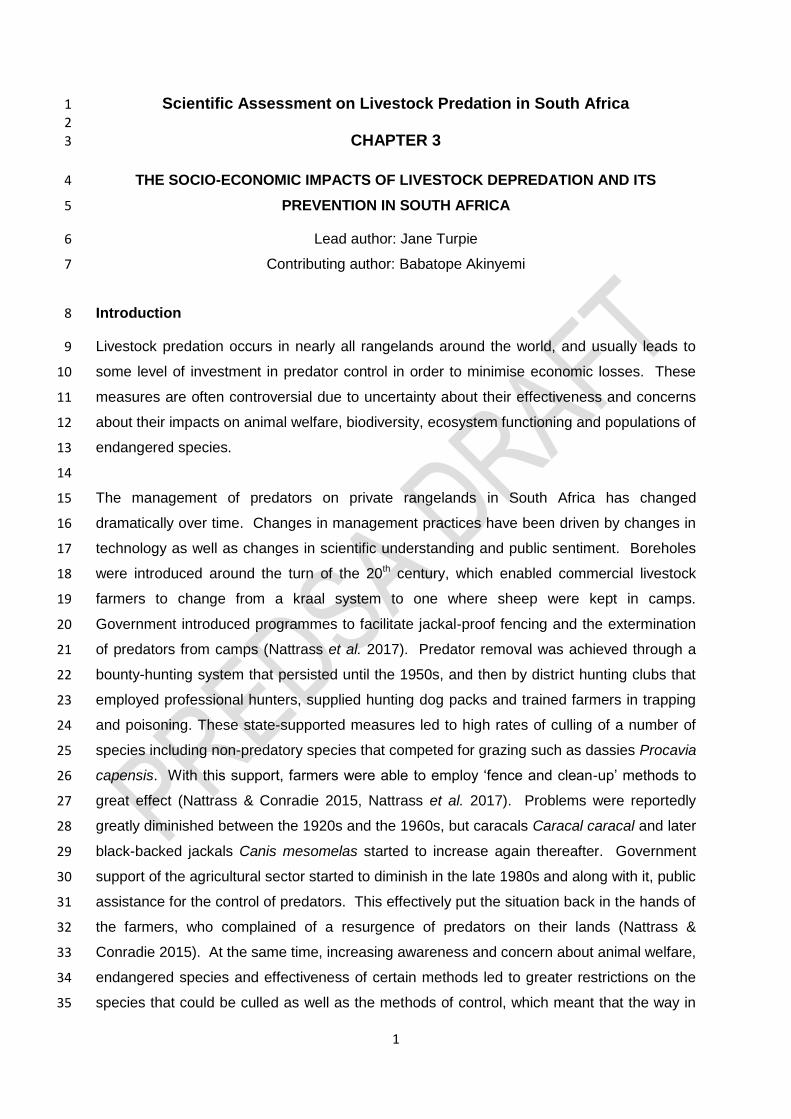
Livestock carrying capacity increases from west to east with increasing rainfall (Figure 1). 101
Sheep are the main stock in the drier western and central areas, while cattle tend to 102
dominate in the wetter eastern rangelands. However, many rangeland areas are stocked 103
beyond their long-term carrying capacity, particularly in the communal rangelands of 104
Limpopo, KwaZulu-Natal and the Eastern Cape. These small scale/communal farming 105
areas support more than half of South Africa’s cattle (Meissner et al. 2013) and are 106
important for rural livelihoods, but they contribute comparatively little to marketed production. 107
4
Game farming occurs throughout, but is more prevalent in the more mesic eastern and 108
northern areas. 109
110
111
Figure 1. Livestock grazing capacity (ha/LSU). Source: Meissner 2013. 112
113
114
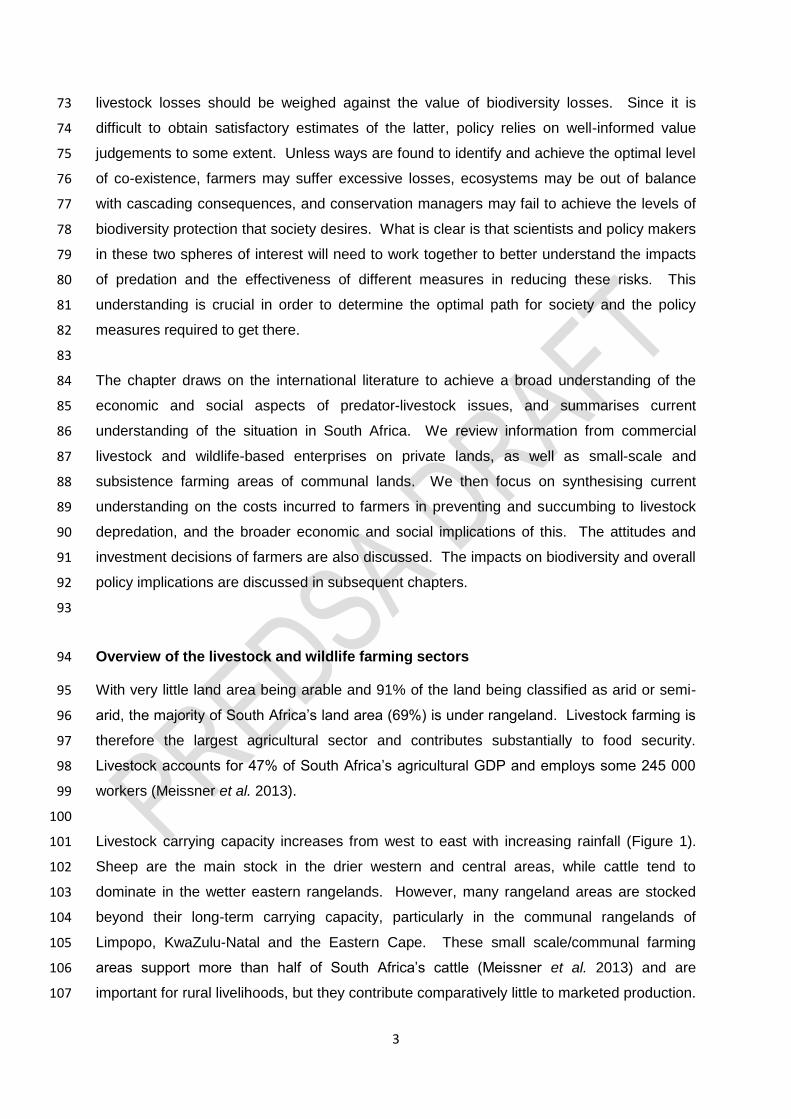
As of 2010, South Africa had an estimated 13.6 million beef cattle, 1.4 million dairy cattle, 115
24.6 million sheep, 7 million goats, 3 million farmed game animals, 1.1 million pigs and 1.6 116
million ostriches in addition to poultry (Meissner et al. 2013; Figure 2). These are raised on 117
about 38 500 commercial farms and intensive units and by some two million small-118
scale/communal farmers (Meissner et al. 2013). 119
120
5
121
Figure 2. Estimated cattle, sheep, goat and game numbers in South Africa (2010) (in 122
thousands). This excludes 21 000 dairy goats and 1 million Angora goats. 123
Source: Meissner et al. (2013). 124
125
126
Sheep and goats are farmed extensively, particularly in the drier regions of the country. 127
These include mutton sheep, particularly the Dorper, which is adapted to harsh conditions, 128
and wool sheep, mainly Merinos. Overall numbers of sheep have decreased to 68% of their 129
numbers in 1980 (DAFF, 2016), and the proportion of Merinos has also declined, from 65% 130
to 52% of total sheep. Goat numbers have diminished to 72% of their numbers in 1980. 131
Commercially-farmed goats are dominated by Angoras and Boer goats, with indigenous 132
goats being farmed in the emerging/communal sector. Ostriches are also important in some 133
areas. 134
135
Declines in sheep numbers are a worldwide trend (Morris 2009), and relate to decreasing 136
prices of products such as wool, as well as increased input prices, reduced subsidies and 137
labour market reforms. However, it is important to note that small ruminants are relatively 138
resilient to higher temperatures, and their importance may increase again under future 139
climate change conditions (Rust & Rust 2013). Globally, the sheep farming industry had 140
undergone major efforts to improve productivity and profitability, for example through 141
adaptive management. In New Zealand reproductive efficiency improved from a lambing 142
percentage of less than 100% in the late 1980s to 125% by 2008 (Morris 2009). However, 143
6
there was little technical progress in South Africa’s sheep farming districts during 1952 to 144
2002 (Conradie et al. 2009) while in the rest of agriculture there was technical progress of 1-145
1.5% per year over a similar period (Thirtle et al. 1993). Furthermore, past attempts to 146
accelerate technical progress in sheep farming areas (Archer 2000) might have led to over 147
exploitation (Dean et al. 1995, Archer 2004, Conradie et al. 2013). Thus the small stock 148
sector is particularly vulnerable and is in urgent need of innovation in the areas of genetics 149
and breeding, nutrition and research on pasture management, strategies to improve 150
reproductive efficiency and deal with labour constraints. Strategies to improve prices such 151
as the Karoo Lamb certification initiative are also very important. 152
153
In contrast to small stock, the national cattle herd increased since the 1970s along with 154
increasing domestic demand for beef (Palmer & Ainslie 2006), but has remained fairly stable 155
since 1980 (DAFF 2016). These cattle are not entirely supported by rangelands, as 75% of 156
South Africa’s cattle spend a third of their lives in feedlots (WWF undated). 157
158
Whereas wildlife ranching was still fairly rare in the 1960s the industry started growing in the 159
1970s and 1980s (Van der Waal & Dekker 2000, Smith and Wilson 2002, Carruthers 2008, 160
Taylor et al. 2016), and then increased exponentially in response to the increasing demand 161
for wildlife-based and trophy-hunting tourism following South Africa’s transition to a 162
democracy, as well as increasing problems of stock theft. This was facilitated by the 163
promulgation of the Game Theft Act of 1991, which made provision for rights over wildlife 164
held in adequately enclosed areas. Wildlife farming is now common in most provinces, 165
replacing both small- and large-stock farming, but the extent of the activity has not been 166
quantified. 167
168
Meanwhile, the numbers of farmers and farm workers have decreased markedly over time. 169
Largely as a result of farm consolidation, there has been a 31% decline in the number of 170
farmers since 1993, and the number of farms (including crop farms) has decreased by 171
40 000 (WWF undated). Small and marginal farmers that had been reliant on subsidies and 172
soft funding from institutions such as the Land Bank started to suffer as support was 173
withdrawn, markets opened up and competition increased. These farms were bought out, 174
farms were consolidated and farming net incomes grew considerably as a result of 175
economies of scale (WWF undated). The decrease in agricultural labour is likely to have 176
resulted from both the consolidation of farms and the development of stricter labour laws 177
(Turpie et al. 2003). These changes are particularly relevant in the broader socio-economic 178
context in which South Africa finds itself in the 21st century. Declines in income and 179
employment in the livestock sectors and associated declines in the economies of small 180
7
towns have probably contributed to the high levels of poverty and inequality in the country. 181
The challenges faced in these areas also have an important bearing on land reform and the 182
establishment of emerging black farmers. 183
184
The nature of livestock depredation 185
Livestock predation in South Africa is predominantly by the black-backed jackal and caracal 186
which are common throughout. In the main small-stock farming areas, these account for 187
over 65% and 30% of predation losses overall (Van Niekerk 2010). Large predators such as 188
lions Panthera leo, African wild dogs Lycaon pictu, and spotted hyaena Crocuta crocuta 189
occasionally occur on private lands in the northern and eastern parts of the country, but are 190
only resident inside protected areas and private reserves with predator-proof fencing (Thorn 191
et al. 2013). Other mammal species that take livestock include leopard Panthera pardus, 192
cheetah Acinonyx jubatus, brown hyaena Hyaena brunnea, dogs Canis familiaris and 193
baboons Papio ursinus. Leopards, cheetahs and brown hyaenas are mostly found outside 194
protected areas (Marnewick et al. 2007; Mills and Hofer 1998) and are threatened by 195
persecution in farmlands (Friedmann and Daly 2004). Leopards now tend to be largely 196
confined to mountainous terrain. Baboons occur throughout, but do not commonly kill 197
livestock. Domestic dogs can be a significant problem, however, particularly near towns 198
(Davies 1999, Thorn et al. 2013). 199
200
Black-backed jackal and caracal account for most predation on small stock throughout the 201
main farming provinces (Figure 3; van Niekerk 2010). Jackal are also the main predator on 202
cattle farms throughout all cattle provinces apart from Limpopo (Figure 3; Badenhorst 2014). 203
While caracal are also the second most important predator of cattle, a number of other 204
predators play an important role, notably leopard, which was the most important predator in 205
Limpopo province, and brown hyaena. Studies of unselected farm types in Limpopo and 206
North West which both had a high proportion of game farmers showed that jackal, caracal 207
and leopard were the main predators, with leopard being the most important in North West 208
(Figure 3; Thorn et al. 2012, 2013). 209
210

8
211
Figure 3. Relative extent of predation on commercial farms by different predator 212
species in the provinces in which farmers were surveyed. Sources: Small 213
stock farms – van Niekerk (2010); cattle farms – Badenhorst (2014); all types 214
of farms - Thorn et al. (2012, 2013). 215
216
It is interesting to note that eagles were not mentioned in any of these studies. The larger 217
eagle species such as Martial Eagle Polemaetus bellicosus, Verreaux’s Eagle Aquila 218
verreauxii and Crowned Eagles Stephanoaetus coronatus are quite capable of killing small 219
livestock, and can take sheep up to half of adult size. Because of this, large numbers of 220
Black and Martial Eagles were hunted in the Karoo in the 1960s (Siegfried 1963). Livestock 221
do not form a major part of their diets, however. Studies of prey remains in the Karoo have 222
shown that sheep comprise less than 2% of Black Eagle diets, and that a Black Eagle pair 223
consumed about 3 lambs per year on Karoo farmland (Davies 1999). These predation 224

9
events were too rare to be picked up in observations. However, in denser vegetation of the 225
Eastern Cape, lambs have been found to comprise 8% of prey remains of Black Eagles 226
(Boshoff et al. 1991 in Davies 1999). Farmers give highly variable accounts of losses to 227
eagles: Davies (1999) reported that half of 37 farmers interviewed reported no lamb losses 228
to eagles, 2 7% reported occasional losses and 24% reported significant losses. It is likely 229
that whereas most eagles do not actively hunt livestock, a few pairs may take to doing so. 230
The cost of having eagles on a farm is probably negligible (Davies 1999). Based on 231
necroscopy studies, Davies (1999) found that eagles were responsible for only 1% of kills in 232
South Africa, whereas their role was far more significant in other countries, especially the UK 233
(16% of kills). 234
235
With most of the predators being relatively small, it is generally reported that livestock 236
depredation is almost entirely of very young animals. In a study of small-stock farmers 237
across the country, van Niekerk (2010) found that the majority of losses were of animals less 238
than one month old. De Waal (2007) also reported predation on sheep farms to be mainly of 239
young lambs before weaning, and Viljoen (2016) reports that 89% of all predation mortalities 240
of wool sheep occur before weaning age. In the North West, 57% of farmers (all types) 241
claimed that most of the game and livestock animals preyed upon were <12 months old, with 242
game animals predated being species with adult female body weight between 23 and 70 kg 243
(Thorn et al. 2013). Goats and sheep were the preferred livestock and cattle were less 244
affected (Thorn et al. 2013). It is important to note that predation losses can be reported in 245
various ways, e.g. relative to the numbers of lambs born, breeding ewes or total stock or for 246
limited age categories (e.g. lambs only). In this assessment we have attempted to collate 247
data on total losses as a proportion of total stocks as far as possible, but deviations from this 248
are made clear where appropriate. 249
250
The extent of livestock depredation 251
Private rangelands 252
While livestock depredation has always been a concern for farmers in South Africa (Beinart 253
1998), there have been very few quantitative estimates of the problem until relatively 254
recently. Early studies have been criticised as being overestimates. In some cases, this 255
was thought to be due to exaggeration of the problem by farmers (Nesse et al. 1976, 256
Armentrout 1980, Boshoff 1980, Hewson 1981 in Davies 1999), or their tendency to ascribe 257
unknown causes of losses to predation. In other cases, this is due to sampling bias. For 258
example, Brand (1993) calculated that losses from black-backed jackal ranged from 3.9% to 259
10
18%, but these estimates were probably biased towards high predation areas and farmers 260
that encountered losses (van Niekerk 2010). In a 19-month study of 8 farms, Rowe-Rowe 261
(1975) estimated that jackals resulted in annual losses of only 0.05% of the total sheep 262
population in KwaZulu-Natal. 263
264
It can be difficult to assess the quality of farmer responses in studies of predator losses. Not 265
all losses are actually observed, as some animals go missing. Some lambs may be 266
scavenged after death, and usually only parts of carcasses are found, so that cause of death 267
is uncertain (Strauss 2009). Also, determining the type of predator responsible may not 268
always be easy, and kills by less common predators might be wrongly assigned. Farmers 269
may also bias their responses for strategic reasons. A more reliable way to determine the 270
causes of livestock deaths is through necroscopy studies undertaken by independent 271
observers. Based on data from a number of such studies collated from sheep farms around 272
the world, Davies (1999) found that predators were responsible for a much lower proportion 273
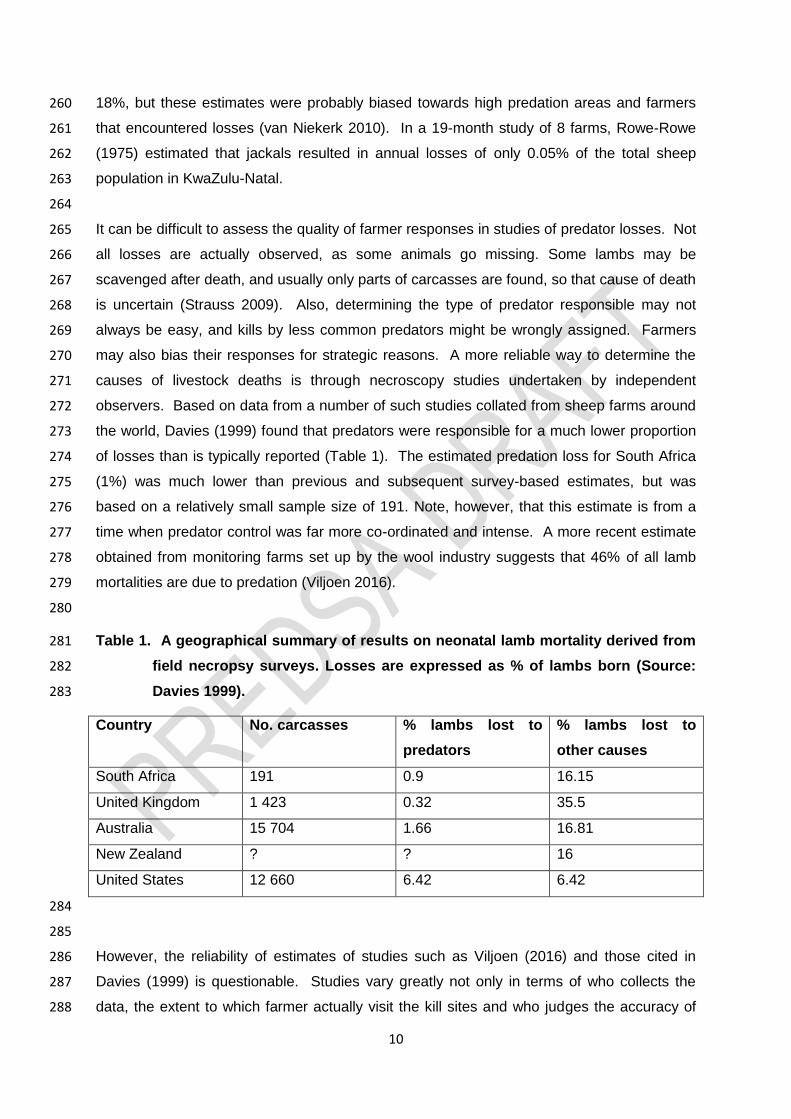
of losses than is typically reported (Table 1). The estimated predation loss for South Africa 274
(1%) was much lower than previous and subsequent survey-based estimates, but was 275
based on a relatively small sample size of 191. Note, however, that this estimate is from a 276
time when predator control was far more co-ordinated and intense. A more recent estimate 277
obtained from monitoring farms set up by the wool industry suggests that 46% of all lamb 278
mortalities are due to predation (Viljoen 2016). 279
280
Table 1. A geographical summary of results on neonatal lamb mortality derived from 281
field necropsy surveys. Losses are expressed as % of lambs born (Source: 282
Davies 1999). 283
Country No. carcasses % lambs lost to
predators
% lambs lost to
other causes
South Africa 191 0.9 16.15
United Kingdom 1 423 0.32 35.5
Australia 15 704 1.66 16.81
New Zealand ? ? 16
United States 12 660 6.42 6.42
284
285
However, the reliability of estimates of studies such as Viljoen (2016) and those cited in 286
Davies (1999) is questionable. Studies vary greatly not only in terms of who collects the 287
data, the extent to which farmer actually visit the kill sites and who judges the accuracy of 288
11
predator identification, but also in their sample sizes and representativeness. Some of the 289
earliest datasets come from the hunting clubs that were established to control predators in 290
the past. Hunting club data provide information on kills in Karoo farming areas during the 291
1970s and 1980s, such as the Cooper Hunt Club in the Mossel Bay area for 1976-1981, and 292
the Ceres South Hunting Club data for 1979-1987 analysed by Bailey & Conradie (2013) and 293
Conradie & Piesse (2013). However, these datasets do not include numbers of livestock on 294
the monitored farms, so could not be used to estimate predation rates as a percentage of 295
stock. Systematically-collected data have only started to emerge in recent years. 296
297
Growing concerns about livestock depredation in South Africa led to a couple of estimates of 298
the scale of the problem. For example, Bekker (2001, cited in Stannard 2005) estimated that 299
1 million sheep were being lost annually, and the National Woolgrowers Organisation 300
(NWGA) estimated a loss of 8% (2.8 million head of small stock, 2007) of stock per year (De 301
Waal 2007, in van Niekerk 2010). These concerns have recently led to a series of studies to 302
quantify the problem more accurately, all based on interviews with commercial farmers. Van 303
Niekerk (2010) telephonically interviewed 1424 farmers in the five major small livestock 304
producing provinces – the Western Cape (published in van Niekerk et al. 2014), Northern 305
Cape, Free State, Mpumalanga and Eastern Cape. Another smaller study was conducted on 306
58 farmers in the Laingsberg area in 2012 by Conradie & Landman (2013). Badenhorst 307
(2014) reported on a study of 1344 cattle farmers in seven provinces. Another study 308
involved telephonic interviews with 99 farmers in Northwest Province (Thorn et al. 2012) and 309
the managers of 95 farms in Limpopo province (Thorn et al. 2013). Scheepers (2016) 310
undertook a survey of 201 wildlife ranchers (all members of the Wildlife Ranchers of South 311
Africa – WRSA) in Limpopo Province. Other studies are ongoing, including a large multi-312
year study in the Cape, and another study of a set of monitoring farms set up by the wool 313
industry. 314
315
Van Niekerk (2010) and van Niekerk et al. (2014) estimated that predators were responsible 316
for the losses of 6.2% to 13% of sheep and goats in the five provinces of their study (Table 317
2). These estimates are consistent with data obtained by Conradie & Landman (2013) for 318
the Laingsberg area of the Karoo, which suggested that 9% of stock were lost to predation 319
(12% were lost to all causes). Interestingly, the predation percentage for mutton sheep was 320
greater than for wool sheep (6% on smaller farms, n=8 to 19% on larger farms, n=12) 321
compared with 7% (n=12). This is possibly because wool sheep tend to be more actively 322
managed (Conradie & Landman 2013). Lawson (1989) reported a lower predation rate of 323
3% for sheep farming in KwaZulu-Natal. 324
325
12
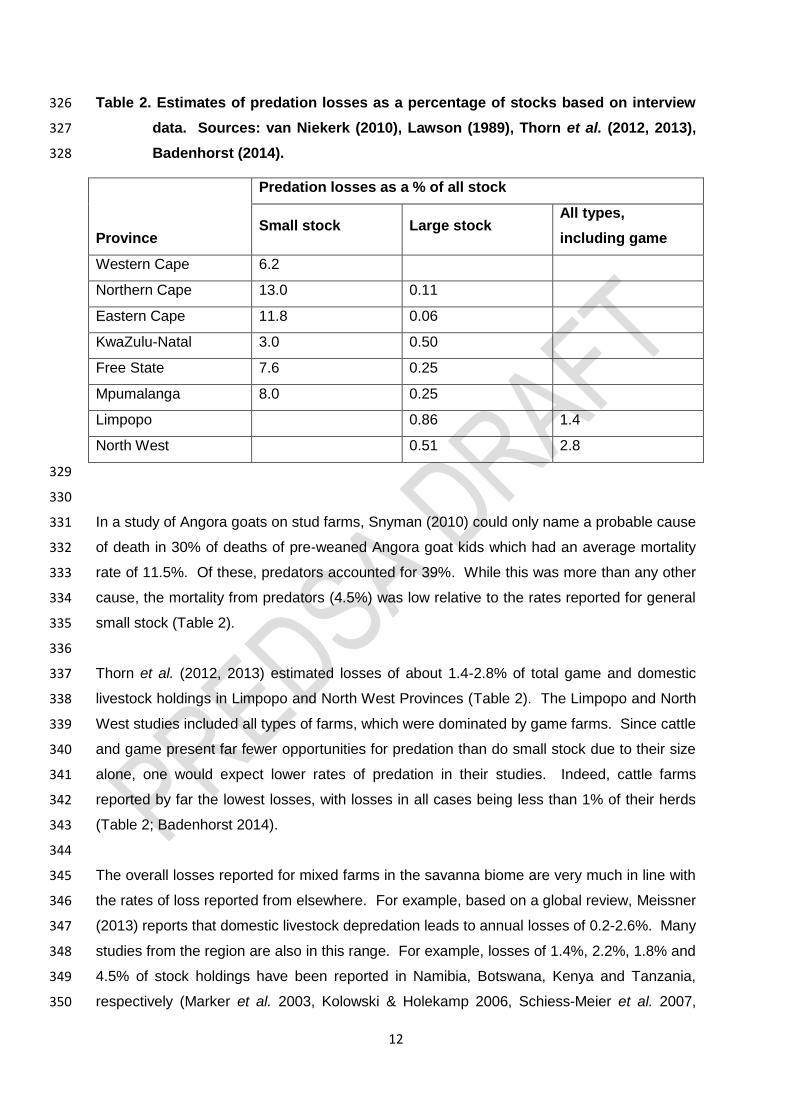
Table 2. Estimates of predation losses as a percentage of stocks based on interview 326
data. Sources: van Niekerk (2010), Lawson (1989), Thorn et al. (2012, 2013), 327
Badenhorst (2014). 328
Province
Predation losses as a % of all stock
Small stock Large stock All types,
including game
Western Cape 6.2
Northern Cape 13.0 0.11
Eastern Cape 11.8 0.06
KwaZulu-Natal 3.0 0.50
Free State 7.6 0.25
Mpumalanga 8.0 0.25
Limpopo 0.86 1.4
North West 0.51 2.8
329
330
In a study of Angora goats on stud farms, Snyman (2010) could only name a probable cause 331
of death in 30% of deaths of pre-weaned Angora goat kids which had an average mortality 332
rate of 11.5%. Of these, predators accounted for 39%. While this was more than any other 333
cause, the mortality from predators (4.5%) was low relative to the rates reported for general 334
small stock (Table 2). 335
336
Thorn et al. (2012, 2013) estimated losses of about 1.4-2.8% of total game and domestic 337
livestock holdings in Limpopo and North West Provinces (Table 2). The Limpopo and North 338
West studies included all types of farms, which were dominated by game farms. Since cattle 339
and game present far fewer opportunities for predation than do small stock due to their size 340
alone, one would expect lower rates of predation in their studies. Indeed, cattle farms 341
reported by far the lowest losses, with losses in all cases being less than 1% of their herds 342
(Table 2; Badenhorst 2014). 343
344
The overall losses reported for mixed farms in the savanna biome are very much in line with 345
the rates of loss reported from elsewhere. For example, based on a global review, Meissner 346
(2013) reports that domestic livestock depredation leads to annual losses of 0.2-2.6%. Many 347
studies from the region are also in this range. For example, losses of 1.4%, 2.2%, 1.8% and 348
4.5% of stock holdings have been reported in Namibia, Botswana, Kenya and Tanzania, 349
respectively (Marker et al. 2003, Kolowski & Holekamp 2006, Schiess-Meier et al. 2007, 350
13
Holmerna et al. 2007 – in Thorn et al. 2012). However, it is clear that the type of farming is a 351
very important factor. The above findings suggest that stock losses on South African 352
commercial cattle farms are relatively small, whereas those on commercial small stock farms 353
are high. If there is any accuracy to the perception that these predation rates are rising, then 354
small-stock farmers in particular may be facing significant difficulties. 355
356
Communal rangelands 357
Livestock kept in unfenced communal grazing areas are also major targets of predators. 358
This is evidenced from the numerous studies that have taken place in communal rangeland 359
areas of eastern and southern Africa (Rasmussen 1999, Butler 2000, Patterson et al. 2004, 360
Woodroffe et al. 2005, Kolowski 2006, Holmern et al. 2007, Lagendijk & Gusset 2008, 361
Chaminuka et al. 2012. Sikhweni and Hassan 2013). Again, several authors caution that the 362
extent of damage caused may be exaggerated, because local people affected by livestock 363
loss fail to take into consideration other threats to livestock including disease, accidents and 364
theft (Holmern et al. 2007, Kissui 2008, Dar et al. 2009, Dickman 2009, Atickem et al. 2010, 365
Harihar et al. 2014). Thus studies that account for all these causes are likely to be more 366
reliable. It is also important to note that because livestock holdings are far from normally-367
distributed in most cases, with a few people owing a large proportion of the overall herd, the 368
estimates of overall, average and individual losses may differ substantially. 369
370
Many of the studies on communal rangelands have been concerned with predation levels in 371
the areas surrounding protected areas. For example, Butler (2000) found that predators 372
killed 5% of livestock (dominated by goats and cattle) in the Gokwe communal land area 373
adjacent to Sengwa Wildlife Research Area, with losses amounting to 12% of income among 374
livestock-owning households. Most of these losses were due to baboons (52%), lions (34%) 375
and leopards (12%), and almost all predation was on goats and sheep. Similarly, losses due 376
to livestock depredation were estimated to amount to 25% of the per capita income of 377
farmers in Nepal (Oli et al. 1994). In Tanzania, stock loss to carnivores was reported by 378
Western Serengeti villagers as two thirds of the average annual income (Borge, 2003). 379
Around the Makgadikgadi Pans National Park in Botswana, where cattle are let out of their 380
kraals in the morning and left unattended all day, overall losses to predators amounted to 381
2.2% and average losses were 5.5% (Hemson et al. 2009). This was mainly due to stray 382
cattle taken at night by lions. Farmers also suffered overall losses of 3% to disease and 1% 383
to theft. In Kenya, Patterson et al. (2004) estimated the predation of livestock to represent 384
2.6% of the herd’s value. 385
386

14
Relatively few studies have been carried out in South African communal lands. Communal 387
farmers in South Africa also farm under widely variable conditions, ranging from arid Karoo 388
veld to the more mesic areas of the north east of the country. Studies have focused on the 389
arid communal rangelands of the Northern Cape, the areas surrounding the Kruger and 390
Hluhluwe-iMfolozi Park in the north east of the country, and around the Blouberg Mountains 391
in Limpopo Province. 392
393
In the communal lands of the Paulshoek area in the Northern Cape, farmers keep Boer 394
goats and a variety of sheep breeds including Dorper, Damara, Karakul, Persian and 395
indigenous Afrikaner breeds (Samuels 2013). The stock are minded by herdsmen and 396
moved between stock-posts where they are kraaled, and their grazing areas and water 397
sources on a daily basis. Based on a study which involved data collection for several years 398
using monthly interviews with 47 farmers in communal land area in Paulshoek between 1998 399
and 2013, Lutchminarayan (2014) found that 0.5-9.7% of goats and 2.3-19.4% of sheep 400
were lost to predation every year. On average, 3.1 (2.4)% of goats and 5.4 (4.2)% of sheep 401
in all Paulshoek herds were reported as being lost to predators each year over the study 402
period. Numbers varied significantly between years. 403
404
In the same area, Hawkins (2012) investigated the outcome of a pilot study that placed 405
eleven EcoRangers on farms to demonstrate the effects of shepherding results in low small 406
stock losses. Unfortunately, the pilot study did not employ an experimental approach, and 407
there was no control. However, over the one year period from August 2011 to 2012, the 408
rangers reported 17 livestock losses, none of which were due to wild predators. Using the 409
figures at face value, there was a loss of one small livestock unit out of total of 4496 small 410
stock units (sheep and goats) over an area of 14852 ha (6552 ha private and 8300 ha 411
communal land), i.e. 0.02% loss. The loss from an area of 3 290 790 ha in the Northern 412
Cape, where shepherding was not used, was 320 times more, i.e. 6.4% loss. 413
414
Studies on cattle farmers in South African communal farming areas adjacent to parks have 415
also reported significant losses. Chaminuka et al. (2012) found that 32% of households 416
close to the Kruger National Park reported livestock predation, compared to 13% in more 417
distant households. Based on the reported average herd size and losses of cattle owning 418
households, the study found that 8% of cattle were lost to predation in the study area. 419
These were attributed to nocturnal raids by lions. Farmers in this area were frustrated with 420
the slow response of the authorities in repairing park fences, and wanted to be allowed to kill 421
predators. 422
423

15
In another study of communities near Kruger National Park, in the Mhinga District, Limpopo 424
Province, Sikhweni & Hassan (2013) reported cattle losses to predation to be 11% of stocks. 425
Both livestock predation and disease were attributed to the wildlife from the park. Without 426
efficient game proof fence and lack of compensation scheme, the costs of owning livestock 427
were claimed to outweigh the benefits to farmers. Measures to provide protection against 428
livestock predation and wildlife-livestock disease transmission will greatly reduce livestock 429
losses and in turn enhance the welfare of this group of farmers. 430
431
Similarly, people living around the Hluhluwe-iMfolozi Park (HiP) also complain of high levels 432
of predation (Gusset et al. 2008). An electrified fence that separates the park from the 433
densely human populated surroundings encloses HiP; however, wild dogs and other large 434
carnivores are notoriously difficult to contain within the perimeter fence. The human 435
population around HiP consists of Zulu villagers on communal land and farmers on private 436
land whose livelihoods largely depend on livestock and ranched wildlife, including hunting 437
and ecotourism. Gusset et al. (2008) interviewed 165 villagers about introducing more wild 438
dogs to the park. Members of the Zulu communities around the park apparently continue to 439
persecute them outside HiP, despite formal legal protection. Similar results have been 440
obtained in recent comparable studies on wild dogs in many parts of Africa (Kock et al. 1999; 441
Breuer 2003; Davies and Du Toit 2004; McCreery and Robbins 2004; Dutson and Sillero-442
Zubiri 2005; Lindsey et al. 2005a). 443
444
Apart from the studies around protected areas, there is little information on the level of 445
depredation of wildlife in communal land areas in the eastern half of South Africa. Given the 446
findings of decreased predation rates with increasing distance from parks, it is likely that 447
losses in the areas away from parks are considerably lower. Studies of these areas would 448
make an interesting comparison with those of commercial farmers, given the differences in 449
methods of livestock husbandry. A recent study of a small sample of 19 commercial and 23 450
communal farmers in Limpopo, found that commercial farms lost 1.4% of their livestock to 451
predators (excluding game losses), compared with a loss of 0.63% in communal areas 452
(Constant 2014). However, communal farmers reportedly lost more cattle to leopards than 453
the commercial farmers. It should be borne in mind that the study adopted a purposive 454
sampling strategy and snowball sampling to identify villages where communal farmers were 455
likely to graze their livestock in leopard habitat. These two sampling techniques would have 456
been prone to sampling bias. 457
458

16
Variation in livestock depredation 459
The statistical distributions of these estimates are also important to consider, inasmuch as 460
this can be done given the reliability of the data. In general most farmers experience very 461
few losses, some experience modest losses and a few unfortunate farmers experience high 462
losses for any given survey period (usually one or two years). For example, in Limpopo 463
province, the proportion of stock holdings reportedly predated per farm had a skewed 464
distributed with a median of 1.23% (25th percentile = 0%, 75th percentile = 5.75%). Some 465
17% of farmers reported high losses of 10–51% and one reported a loss of 89% (Thorn et al. 466
2013). It is unknown whether this type of pattern persists spatially or whether different 467
farmers will be unlucky in other years. 468
469
Spatio-temporal patterns in predation are likely to be governed by both stochastic factors, 470
such as rainfall and drought, and deterministic factors, such as vegetation, distance to 471
protected areas or towns, stock type and management practices. If stochastic factors 472
dominate spatio-temporal patterns, then it is reasonable to use the average as an estimate 473
of the level of losses. If not, i.e. if a few farms are consistently the sufferers of high predation 474
rates, then the figures must be very carefully interpreted. 475
476
There has been considerable effort in the international and local literature to unravel the 477
factors that influence predation rates. Several anecdotal accounts and statistical analyses 478
have found that inter-annual variation in predation levels are influenced by rainfall, with most 479
finding increases during drought and low rainfall seasons (Butler 2000, Beinart 2003, in 480
Nattrass et al. 2017, Bailey & Conradie 2013, Badenhorst 2014), and others finding a 481
positive relationship with rainfall (Patterson et al., 2004). The explanation for these and other 482
temporal patterns is usually linked to the availability of wild prey (e.g. Patterson et al., 2004, 483
Mishra et al., 2003, Bagchi & Mishra, 2006). 484
485
Spatial patterns are also influenced by factors such as broad habitat types and distance from 486
protected areas. Thorn et al. (2013) found that predation rates on private farmlands 487
increased with distance from protected areas. This is the opposite of findings on large 488
predators from communal and small-scale farming areas in other countries (Azlan & 489
Sharma, 2006, Holmern et al., 2007), and could be explained on the basis of medium-sized 490
predators such as jackal becoming more abundant in the absence of large predators such as 491
lion (“mesopredator release”, see chapter 8). Nevertheless, there is a strong perception 492
among many South African farmers that the proliferation of game farms has led to increased 493

17
predator numbers. Stannard (2003) found that both topography and surrounding farm 494
practice influenced predation rates. 495
496
In Limpopo Province, the risk of leopard predation on livestock was found to be most 497
significantly influenced by distance to villages (contribution = 30.9%), followed by distance to 498
water (23.3%), distance to roadways (21.2%), distance to nature reserves (15.4%) and 499
elevation (9.2%) (Constant 2014). In the communal land areas, predation of cattle by 500
leopards was found to be higher in the dry season when farmers were forced to take their 501
cattle to the mountainous areas where leopards were present. Breeding was reportedly less 502
seasonal on communal lands, which meant births were also taking place while the cattle 503
were in these risky areas. 504
505
Van Niekerk (2010) found considerable geographic variation in small stock predation within 506
and between provinces which suggest that biome types may play an important role. Their 507
estimates suggest that predation rates are particularly high in the Karoo. This could well be 508
linked to the very large farm sizes in this biome, where human presence would be lower. If 509
this is the case, then the perception that predation rates have been increasing may also be 510
linked to the trend for consolidation of farms in the Karoo, which ironically has occurred in 511
order to maintain viability of farming as subsidies have diminished and employment costs 512
have risen. 513
514
Within areas such as the Karoo, there is also likely to be some degree of variation between 515
farms due to habitat which may make some farmers more vulnerable to predation losses 516
than others. For example, Conradie & Turpie (2003) found that Karoo farmers recognise the 517
different risks associated with different habitats. They tend to keep their ewes with young 518
lambs or kids in the open plains and valleys (“vlaktes”) and larger animals on the hillsides 519
(“rantjies”), because the latter provide more dens for predators such as caracal. Indeed, 520
many studies have found that landscape features such as steep, rocky slopes (Stahl et al., 521
2002), cliffs (Jackson, 1996), water bodies (Michalski et al., 2006) and distance to riparian 522
corridors and forested areas (Michalski et al., 2006, Palmeira et al., 2008, Thorn et al., 2012) 523
have an influence on livestock predation rates. Depredation rates may also decrease with 524
increasing proximity to human habitation including urban centres (Michalski et al., 2006) and 525
villages (Kolowski & Holekamp, 2006). If these factors are indeed significant, they are likely 526
to be reflected in farm prices. 527
528

18
Predation losses in relation to other threats 529
Livestock and game farmers face a range of threats, including poisoning, theft, disease and 530
drought. For example, over 600 species of plants are known to cause poisoning of livestock 531
in Southern Africa. Livestock losses due to plant poisoning have been estimated to amount 532
to some 37 665 cattle (10% of expected cattle deaths) and 264 851 small stock per year 533
(Kellerman et al. 1996), at a cost to the industry of about ZAR 150 million (Kellerman et al. 534
2005, Penrith et al. 2015). 535
536
Figures from the South African Police Service’s National Stock Theft Unit (SAPS) indicate 537
that around 15 000 - 16 000 cattle, 20 000 - 24 000 sheep and between 8 000 - 14 500 538
goats are stolen annually (NERPO, 2009). However, based on survey data, Scholtz & 539
Bester 2010 estimated that these numbers are probably much higher (Table 3), with a large 540
proportion being stolen in communal land areas. Mortality was found to be several times 541
higher than stock theft, but sheep suffered a higher proportion of losses to stock theft. 542
Unfortunately their survey did not distinguish depredation from other causes of mortality. 543
544
Table 3. The number of animals that die or are stolen annually on a national scale in 545
South Africa, estimated from the results of the survey; on private and 546
communal land. Source: Scholtz & Bester 2010 547
Cattle Sheep Goats
Land type Dead Stolen Dead Stolen Dead Stolen
Private 177 120 9 846 439 350 143 550 1 900 300
Communal 259 600 66 550 56 225 59 800 40 950 9 750
Total animals 436 720 76 396 495 575 203 350 42 850 10 050
548
549
Nevertheless, Scholtz & Bester (2010) argued that stock theft, problem animals and vermin 550
were the main reasons for the decline in livestock numbers over the previous decade, by 551
causing farmers to invest in other agricultural enterprises. However it is likely that the 552
introduction of social welfare grants and changing culture are the primary reasons for 553
reduction of farming activities in communal land areas, and that stringent labour laws have 554
played a major role in private land areas. This decrease in the numbers of livestock is in 555
itself important to consider, as it means that decreasing numbers of households are affected 556
by stock losses. 557
558
19
The three main threats that are faced by South African small livestock producers are 559
drought, theft, and predators (De Waal & Avenant 2008). Among the mixed sample of 560
mainly game farmers interviewed by Thorn et al. (2012), 32% considered poaching the most 561
costly source of economic loss, followed by drought (30%), predation (19%), fire (11%) and 562
game or livestock diseases (8%). Among small stock farmers interviewed by Stannard 563
(2003), on the other hand, losses due to livestock theft were considered to be relatively small 564
in comparison to the predation on small livestock. 565
566
In communal areas, the overall losses, including from other causes, are particularly high. 567
Around Kruger Park, the predation losses of 8% reported by (Chaminuka et al. 2012) added 568
to the reported 12.7% of cattle that died from disease, while the losses of 11% in Mhinga 569
District were one of myriad problems faced by the farmers, who also suffered high losses to 570
disease (23%) and theft (3%). In Limpopo, while predation was the main cause of livestock 571
losses (65%), significant numbers were also lost to disease (18%), theft (13%) and 572
accidental deaths (3%), with no significant differences in the proportions of these between 573
communal and commercial farms. 574
575
In light of the above, one of the shortcomings of estimates of predation impacts is that they 576
do not consider the counterfactual: what losses would have been incurred in the absence of 577
predators? At the very least, it might be expected that there would have been some natural 578
mortality among the animals that had been predated, especially given that these are often 579
the weaker or sicker animals. While no work has been done to answer this question per se, 580
perhaps the best indication comes from work done on an experimental farm set up by 581
government, academic institutions and the wool industry. Strauss (2009) analysed predation 582
data from the Free State Wool Sheep Project established in 1998. Set up to compare 583
different production strategies, it was realised fairly early in the project that predation by 584
jackal, caracal and stray dogs was a significant problem. The findings showed that both 585
merino and dorper sheep suffered heavy losses when kept in the veld, though these 586
appeared to be ameliorated by kraaling at night. Predation losses were close to zero for the 587
sheep kept on planted pastures for part of the year (Strauss 2009, Error! Reference source 588
not found.). Overall merino post-weaning losses to predation ranged from 6.7 to 26.3% per 589
annum (average 18.6%), compared to 0.9%, 3.0% and 1.3% losses to disease, metabolic 590
disorder and accident, and theft, respectively. Most of the post-weaned losses were 4-12 591
months, but older, and especially pregnant, ewes were also vulnerable. The results of this 592
study suggest that when management actions reduce the risk of predation, a substantial 593
proportion of the avoided predation losses become lost to other causes. This substantiates 594
the hypothesis that a 10% reduction in predation will not result in a 10% reduction in losses. 595

20
In this example, a 23% reduction in predation losses resulted in a net reduction in overall 596
losses of 10%, and 51-54% reduction in predation led to net reductions in losses of 27-37% 597
(net losses = 0.727*reduction in predation losses - 5.8871, n=4, R2 = 0.95). 598
599
600
Figure 4. Percentage of lambs lost to predation or other causes before weaning in five 601
experimental areas of the Free State Wool Sheep Project (Data extracted from 602
Strauss 2009) 603
604
605
Farmer’s options and responses 606
Farmers can opt to try and eliminate predators through lethal methods, or to protect their 607
stock from predators using non-lethal methods, or they can use a combination of these. 608
Lethal methods include shooting, hunting with dogs, setting snares, trapping and poisoning 609
(Arnold 2001, Moberly 2002, van Deventer 2008, Van Niekerk et al. 2014). Shooting can be 610
done by the farmers themselves or by professional hunters that are paid by the farmer. 611
Hunting with dogs is also effective, but is more costly because of the costs of acquiring, 612
training and maintaining the dogs. Poisoning is cheap and easy, but it is not species-specific 613
and results in the unnecessary and painful deaths of non-problem animals. A variety of 614
traps is also used, including cages, boxes, leg-hold traps and snares. Use of traps is also 615
widespread and considered to be cost-effective, but is somewhat more labour-intensive if 616
farmers are concerned about preventing unnecessary suffering, as the traps have to be 617
checked regularly. Legal restrictions on the use of lethal methods are discussed in Chapter 618
X. This includes not only the methods but the species targeted. For example, cheetahs, 619
leopards, lions, spotted hyaena, brown hyaenas and African wild dogs were listed as 620
protected species in 2005 and can only be captured or destroyed under permit from the 621
provincial conservation authorities. 622

21
Non-lethal methods include kraaling of small stock (or indoor housing), use of herders, 623
predator-proof fencing, bells, guard dogs or protective collars. In the past, farmers invested 624
heavily in jackal-proof fencing (and later electric fencing) to deter predators from entering 625
camps. These fenced areas need to be checked continually for breaches, but the system 626
works well if managed properly. Without the subsidies of the past, fences are now costly to 627
erect (Snow 2006), and include ongoing investment in labour time which is becoming more 628
expensive. Nevertheless, they are still considered to be cost-effective (Badenhorst 2014). 629
630
The practices of herding and kraaling diminished in commercial rangelands as boreholes 631
and affordable fencing allowed farmers to create relatively predator-free camps, and as 632
ideas about veld management practices changed (Davies 1999). Minimum wages have also 633
increased since the 1990s, and labour legislation has also made it difficult to lay off staff. As 634
a result, farmers have tried to minimise their use of hired labour and to use other methods, 635
including sheep dogs. However, human presence in the lambing (or calving) area is still 636
considered by some to be by far the simplest and most effective way of deterring predators 637
in the Karoo, and some farmers have returned to this tradition (Davies 1999). 638
639
The use of guarding animals has been posed as a labour-saving solution to protecting 640
livestock, and has been tested with varying success. Anatolian dogs are the most popular 641
choice, but are expensive to obtain and are only effective against smaller predators (Snow 642
2006). Nevertheless, the results of trial programmes in Namibia, Australia and South Africa 643
suggest that this is a highly effective method (Marker et al. 2005, van Bommel & Johnson 644
2011, McManus et al. 2015). One of the main drawbacks is that the dogs do need to be fed 645
and monitored. 646
647
Apart from hunting with dogs, the costs of lethal methods as currently practiced are generally 648
relatively low, whereas the costs of non-lethal methods vary greatly (Figure 5). Most collars 649
and warning systems are cheap, and might offer some level of protection that makes it 650
worthwhile, but some more sophisticated systems are highly expensive. These still rely on 651
an appropriate response by the farmer. Electrical fences are costly to put up, but costs are 652
relatively low over five years, and are comparable to guard animals. The costs of guard 653
animals over 5 years were similar to the costs of professional hunting. Human guards are 654
the most expensive option overall. 655
656
657

22
658
Figure 5. Relative costs of lethal and non-lethal methods for a typical Karoo farm of 659
6000 ha with 1000 ewes in three herds (dry, laming and replacement). Source: 660
http://www.pmfsa.co.za/home/detection-prevention. 661
662
663
It is not surprising therefore, that most commercial farmers still employ lethal methods in 664
their efforts to reduce predation risk. Nevertheless, the majority of farmers that engage in 665
predator management do use some non-lethal methods as well. Predator control in general 666
is more prevalent among small stock farmers than cattle farmers and game farmers. 667
Badenhorst (2014) found that the proportion of cattle farmers engaging in any form of 668
predator control ranged from 37% and 66% in six provinces (average 52%), but was only 4% 669
in the Eastern Cape. Most small stock farmers, on the other hand, engage in practices to 670
reduce predation risk. Between 60 and 90% of small-stock farmers in 5 provinces (average 671
74%) practice lethal methods, while 44-87% (average 67%) practice non-lethal methods 672
(Figure 6). 673
674

23
675
Figure 6. % small stock farmers using lethal and non-lethal methods in 5 provinces 676
(Source: van Niekerk et al. 2010) 677
678
Shooting has tended to be the most popular option on both small-stock and cattle farms 679
(Figure 7), although it is no longer considered as effective as it used to be (B. Conradie, 680
pers. comm.). Poisoning, despite being illegal was still commonly practiced at the time of 681
the surveys, particularly in the Northern Cape. 682
683
684
Figure 7. Indications of the relative use of different types of lethal methods on small-685
stock and cattle farms, based on data in van Niekerk et al. (2010) and 686
Badenhorst (2014) 687
688
689

24
Herding and kraaling are the most common non-lethal methods used to protect wildlife 690
against predators, both among small-stock and cattle farmers (Figure 8). 691
692
693
694
Figure 8. Indications of the relative use of different types of non-lethal methods by 695
small stock farmers (above), and cattle farmers, based on data in van Niekerk 696
(2010) and Badenhorst (2014) 697
698
699
In Limpopo province, Thorn et al. (2013) found that lethal and non-lethal methods were 700
practiced at 47% and 79% of farms respectively (35% using both), and 15% of farms (all 701
extensive game farmers) used neither. Non-lethal methods included fenced enclosures, 702
moving potential prey animals to open areas with a lower risk of predation and natural anti-703
predator adaptations (stocking native, predator-adapted breeds and not dehorning livestock). 704
In the North West Province 67% of farmers practiced lethal control of carnivores (Thorn et al. 705
2012), while 63% used non-lethal methods, and 32% used both. A greater range of lethal 706
methods was reported, including poisoning and trapping. Non-lethal deterrents included 707
protective enclosures, guard dogs and human guards. 16% of farmers did not use any 708
methods. In this context it is important to note that there has also been a rise in “weekend 709
25
farmers” (Reed & Kleynhans 2006, Wessels & Willemse 2013) who may be less inclined to 710
take action against predators. 711
712
Thorn et al. (2013) found that lethal control tended to be practiced to a much greater extent 713
by certain cultural groups, which was a much greater determinant than actual financial 714
losses. They found that the odds of a farmer practicing lethal control were about 19 times 715
greater among Afrikaans-speaking farmers and about 7 times greater among English-716
speaking farmers, compared to Setswana-speaking farmers. Lindsey et al. (2005) also found 717
that Afrikaans-speaking farmers and older people were less tolerant of carnivores. However, 718
in these areas it is quite possible that these farmers happened to be the small-stock farmers 719
and therefore had more reason to be less tolerant. 720
721
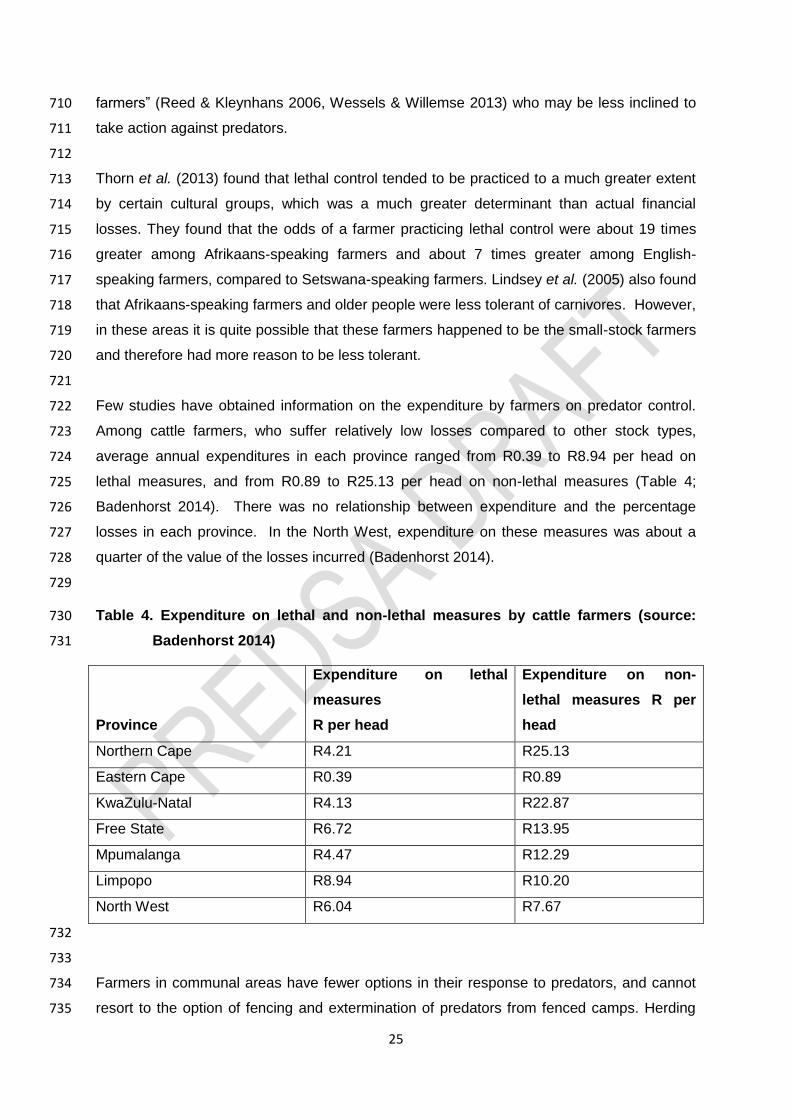
Few studies have obtained information on the expenditure by farmers on predator control. 722
Among cattle farmers, who suffer relatively low losses compared to other stock types, 723
average annual expenditures in each province ranged from R0.39 to R8.94 per head on 724
lethal measures, and from R0.89 to R25.13 per head on non-lethal measures (Table 4; 725
Badenhorst 2014). There was no relationship between expenditure and the percentage 726
losses in each province. In the North West, expenditure on these measures was about a 727
quarter of the value of the losses incurred (Badenhorst 2014). 728
729
Table 4. Expenditure on lethal and non-lethal measures by cattle farmers (source: 730
Badenhorst 2014) 731
Province
Expenditure on lethal
measures
R per head
Expenditure on non-
lethal measures R per
head
Northern Cape R4.21 R25.13
Eastern Cape R0.39 R0.89
KwaZulu-Natal R4.13 R22.87
Free State R6.72 R13.95
Mpumalanga R4.47 R12.29
Limpopo R8.94 R10.20
North West R6.04 R7.67
732
733
Farmers in communal areas have fewer options in their response to predators, and cannot 734
resort to the option of fencing and extermination of predators from fenced camps. Herding 735

26
and kraaling are the most sensible and common response in these areas, and form very 736
much part of cultural tradition in these pastoral areas. Killing predators is less likely to be 737
effective in communal rangelands but is still pursued. This is consistent with communal 738
areas in other parts of the world. To some extent this is driven by socio-economic 739
circumstances. Where livestock are the main livelihood strategy, people are more likely to 740
be antagonistic towards wild predators (Dickman, 2010). Conversely, wealth, income 741
diversification and social reciprocity within families and communities may provide adequate 742
coping mechanisms for buffering the impacts of damage-causing animals (Naughton-Treves 743
et al. 2003, Naughton-Treves & Treves 2005). For example, high rates of depredation in 744
Nepal by snow leopards Panthera uncial encourage pastoralists in Asia to perceive the 745
extermination of the snow leopard as the only solution (Oli et al. 1994). 746
747
Cost effectiveness of predator management 748
Farmers undoubtedly make their choices on the basis of perceived cost-effectiveness as 749
well as affordability. There is little scientific evidence, however, on the relationship between 750
investment in these practices and the losses avoided, or the relative cost-effectiveness of 751
different lethal and non-lethal methods. This will require experimental or quasi-experimental 752
analysis, both of which rely on a substantial amount of monitoring data. It is clear that the 753
sector urgently needs to invest in such co-ordinated action. Meanwhile there have been a 754
handful of studies in South Africa that have examined the effectiveness of different lethal and 755
non-lethal methods, including the cost-effectiveness of these methods. These studies 756
suggest that a significant proportion of both lethal and non-lethal methods are not very 757
effective. 758
759
For example, analyses of hunting club records, which span multiple farms over multiple 760
years, have suggested that caracal culling actually increased subsequent livestock losses 761
when compared to farms where fewer caracals were culled (Bailey & Conradie 2012; 762
Conradie & Piesse 2013), whereas culling vagrant dogs would reduce the likelihood of future 763
losses. Van Niekerk et al. (2013) found that use of professional hunters was ineffective, and 764
that kraaling small stock at night in the Western Cape had a significant positive effect on the 765
level of predation on a farm. The latter was thought to be due to the fact that damage-766
causing animals learn to infiltrate closed areas and cause major losses, especially where 767
fences are not up to standard. However, a high level of success was experienced when non-768
lethal methods are used in combination or in rotation with one another, probably due to the 769
adaptability of predators (van Niekerk et al. 2013). In a study of cattle farms in the North 770
27
West Province, Badenhorst (2014) found that specialist hunter, hunting with dogs and 771
guarding animals, all had a positive relationship with occurrence of predation, while other 772
lethal methods had no significant effects. Even if this signifies a retaliatory response, it does 773
call into question the effectiveness of these methods. Nevertheless, limited conclusions can 774
be drawn from these studies, and the issue is examined in more detail in Chapter 6. 775
776
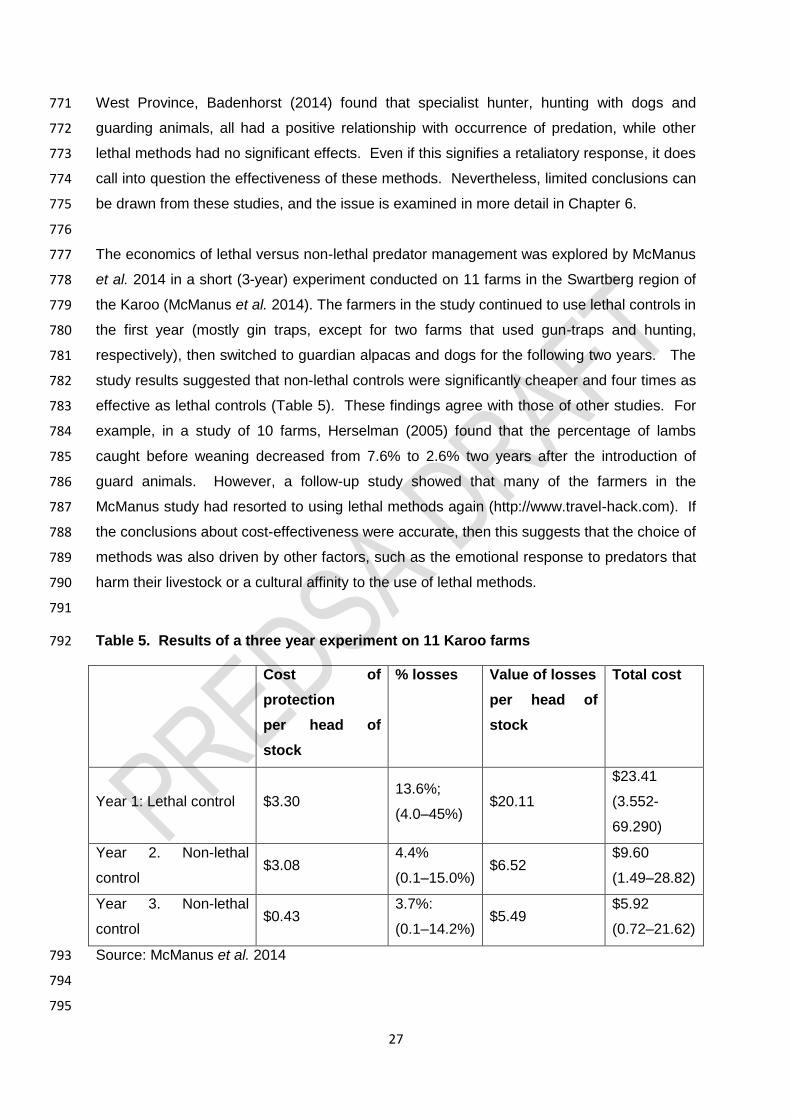
The economics of lethal versus non-lethal predator management was explored by McManus 777
et al. 2014 in a short (3-year) experiment conducted on 11 farms in the Swartberg region of 778
the Karoo (McManus et al. 2014). The farmers in the study continued to use lethal controls in 779
the first year (mostly gin traps, except for two farms that used gun-traps and hunting, 780
respectively), then switched to guardian alpacas and dogs for the following two years. The 781
study results suggested that non-lethal controls were significantly cheaper and four times as 782
effective as lethal controls (Table 5). These findings agree with those of other studies. For 783
example, in a study of 10 farms, Herselman (2005) found that the percentage of lambs 784
caught before weaning decreased from 7.6% to 2.6% two years after the introduction of 785
guard animals. However, a follow-up study showed that many of the farmers in the 786
McManus study had resorted to using lethal methods again (http://www.travel-hack.com). If 787
the conclusions about cost-effectiveness were accurate, then this suggests that the choice of 788
methods was also driven by other factors, such as the emotional response to predators that 789
harm their livestock or a cultural affinity to the use of lethal methods. 790
791
Table 5. Results of a three year experiment on 11 Karoo farms 792
Cost of
protection
per head of
stock
% losses Value of losses
per head of
stock
Total cost
Year 1: Lethal control $3.30 13.6%;
(4.0–45%) $20.11
$23.41
(3.552-
69.290)
Year 2. Non-lethal
control $3.08
4.4%
(0.1–15.0%) $6.52
$9.60
(1.49–28.82)
Year 3. Non-lethal
control $0.43
3.7%:
(0.1–14.2%) $5.49
$5.92
(0.72–21.62)
Source: McManus et al. 2014 793
794
795

28
Another issue that should be taken into consideration is the impact of predator control on 796
grazing resources, through its indirect impact on other grazers. The extermination of 797
predators in the Karoo is thought to have been the reason for irruptions of rock hyrax 798
Procavia capenisis that have occurred in the past leading to significant damage to vegetation 799
(Thomas 1946, Kolbe 1967, Rubidge in Kolbe 1983, Davies 1999). However, these 800
relationships are still poorly understood. 801
802
Economic impacts of livestock depredation 803
The presence of predators in rangelands translates into two types of costs for farmers: the 804
cost of taking action to reduce the threats to livestock, and the losses due to livestock 805
depredation. Both of these are direct costs that impact on the farmer’s bottom line, or 806
profits. Farmers’ profits form part of the value added to agricultural GDP, along with the 807
wages paid to their labour and taxes paid to government. Thus an impact on farmer profits 808
translates into an impact on agricultural GDP, being a measure of aggregate income in the 809
sector. Furthermore, the expenditure by farmers on their inputs (“intermediate expenditure”) 810
generates income in other sectors, such as manufacturing and transport. Impacts on farm-811
level production may also be felt through the value chain, affecting feedlots, abattoirs, 812
tanneries, wholesalers, retailers, processors and the like. Therefore negative impacts on 813
farm output could also have knock-on effects in a variety of other sectors and subsectors. 814
815
Recent studies of predation losses in South Africa’s commercial farms are relatively 816
comprehensive in their coverage, and suggest that aggregate losses of livestock amount to 817
R2.8 billion per annum, with losses of at least R2.34 billion to small stock farmers (1.39 818
billion in 2007), and R479 million to cattle farmers (R383 million in 2012). In addition, losses 819
from South Africa’s 11 500 game farms (DAFF 2016) and from small-scale and communal 820
farming areas could also be substantial, and likely to bring the total to over R3 billion. 821
Estimates still vary, however. For example, Thorn et al. (2012) estimated total losses of R68 822
million to all farm types in North West Province, whereas Badenhorst (2014) estimated 823
losses of R84 million for cattle farms alone in the same province. McManus et al (2014) also 824
questioned the disparity between estimates of Statistics South Africa (2010) based on the 825
2007 agricultural census, and those of van Niekerk (2010), which were nearly eight times 826
higher. Nevertheless, van Niekerk was conservative in his estimates of value: whereas 827
some authors advocate using the value of the “finished product” (sensu Mclnerney 1987, 828
Moberly 2002), i.e. the income that would have been derived from the animal had it survived, 829

29
van Niekerk used the replacement value of animals lost - (R600 for young stock and R1000 830
for older animals). 831
832
The Agriculture, Forestry and Fisheries sector contributed R94.4 billion to GDP in 2016, or 833
2.4% of GDP1 (DAFF 2017). Agriculture makes up about 80% of this (Stats SA 2013). 834
Animal production makes up about 49% of the gross value of agriculture production, with 835
crops and horticulture making up the balance. Free-ranging livestock contributed about 33% 836
of animal production value and therefore about 16% of gross agriculture production value. 837
The gross production value of free ranging livestock was about R39.75 billion in 2016. 838
Based on these figures, the direct contribution to GDP would be in the order of R12.3 – 14.7 839
billion2 to GDP. Overall impacts on GDP, taking economic linkages and induced spending 840
effects into account, are about double this. Therefore losses in the formal livestock sector 841
(~R3 billion) amount to an estimated 7% of its gross production value. Assuming that in the 842
absence of predators about 50% of these animals would be lost to other causes (see 843
above), the loss amounts to about 0.5% of the Agriculture Forestry and Fishing Sector GDP 844
and 0.01% of national GDP, or 0.02% if multiplier effects are included. Even if game losses 845
and livestock losses in the small scale and subsistence sectors were taken into account, and 846
if expenditures on predator control were also included, the overall impacts would be fairly 847
small when viewed in the context of the national economy. 848
849
Nevertheless, in a struggling economy, such losses count, and may be important in local 850
contexts. Livestock farming is the backbone of the economy in large parts of rural South 851
Africa. Meissner (2013) estimated that in the region of 245 000 employees with 1.45 million 852
dependants could be employed on 38 500 commercial farms and intensive units, with wages 853
amounting to R 6.1 billion. This suggests that impacts on the profitability of livestock farming 854
could affect many people involved in commercial farming. 855
856
Impacts on the viability of farming are likely to vary among different types of farms as well as 857
individual farms, depending on their geographical and social context. Thorn et al. (2012, 858
2013) found that livestock predation losses were generally not sufficient to threaten farming 859
livelihoods or the economies of the North West and Limpopo provinces. In the North West, 860
predation losses amounted to a very low proportion of annual net operating profits for farms 861
in the North West (0.22–0.29% for game farms, 0.46–0.73% for cattle farms and 0.37% for 862
1 Contribution to VAD has been 2-2.1 from 2010 to 2015, but rose to 2.4 in 2016 2 Lower estimate is 16% of sectoral contribution, upper estimate based on most recent estimate of multipliers
for livestock products (Conningarth Economists 2015)
30
sheep farms, and only 0.2% of provincial agricultural GDP; Thorn et al. 2012). Stannard 863
(2003) felt that the predator problem was not a general threat to small livestock production in 864
South Africa. However, van Niekerk (2010) concluded that the high losses reported on small 865
stock farms constituted a threat to their viability. Most studies suggest that predation is 866
highly variable, and may be a significant problem for a small proportion of farmers. In 867
addition, game farms stocking high value ungulates might suffer disproportionately high 868
financial losses from relatively low predation frequencies. 869
870
These are the areas over which farmers have (constrained) choices in the long run (stock 871
type), medium run (non-lethal control practices like fencing) and short run (lethal predator 872
control practices like hunting). In the short to medium run, farmers make decisions about 873
how much to invest in lethal and non-lethal control methods based on the information they 874
have at hand. But in the longer run, if losses are persistently high, this could have an impact 875
on the nature of farming. Where certain types of farming have become unviable in the past, 876
this has led to changes in land use. For example, high rates of stock theft led to a change 877
from beef to dairy farming in KwaZulu-Natal (Turpie et al. 2003). Predation may also have 878
played some role in the rapid and extensive transition to game farming that has taken place 879
in South Africa, along with other market forces and the introduction of legislation to 880
encourage this activity. The impacts of these changes have not been properly studied, but 881
they do not appear to have resulted in catastrophic losses in production or employment, and 882
may even have had positive impacts on GDP, since game ranching tends to be more 883
profitable than livestock farming (Bothma 2005). 884
885
Social consequences 886
Given the above findings, it is probably true to say that the human-wildlife conflict that has 887
arisen on commercial and communal farmlands is more of a social problem than an 888
economic one. On commercial farms, the increasing problem not only threatens the 889
livelihoods of the poorer farmers but is also becoming an issue of much discontent among 890
the farming community, and leading to a fair amount of blame and antagonism among those 891
with opposing views. 892
893
While much attention has been given to the plight of commercial farmers and the increasing 894
difficulties that they face in the absence of government intervention, very little is known about 895
how livestock depredation impacts on previously-disadvantaged small-scale and subsistence 896
farming communities. While livestock production contributes very little to the formal 897
31
economies of communal areas in South Africa (Mmbengwa et al. 2015), they have 898
significant social value, contributing to multiple livelihood objectives and offering ways out of 899
poverty (Becker 2015; FAO 2009; Randolph et al. 2007). In these areas, livestock may be 900
used for meat, milk, ritual slaughter and bridal payment, and are a valuable asset as a store 901
of wealth that can be utilized as collateral for credit in difficult times ((Hoffman & Ashwell 902
2001, Jones & Barnes 2006, DAFF 2010, Chaminuka 2012). Thus the loss of livestock 903
assets has more than just a financial impact. However, it is important to note that the 904
dependence on cattle in communal areas has diminished as a result of the increased 905
provision of government support to poor households in the form of welfare grants, as well as 906
a gradual change in technology and culture that also makes banking easier. Nevertheless, 907
for those farmers that are still engaged in livestock husbandry, predation is still a real issue 908
and a threat to this livelihood. In South Africa this threat appears to be greatest in the 909
communal areas around wildlife parks. There is clearly a need for conservation authorities 910
to pay attention to human-wildlife conflict issues in these areas. 911
912
Studies elsewhere have found that human-wildlife conflict can have significant impacts on 913
households, families or individuals (Hill 2004). There are hidden impacts, defined as “costs 914
uncompensated, temporally delayed, psychological or social in nature” (Barua et al. 2013, p. 915
311). These include diminished states of wellbeing due to negative impacts on livelihoods 916
and food security. Some of the problems that arise include the restriction of movement due 917
to increased guarding effort to protect livestock from predators, the costs of pursuing 918
compensation for livestock losses due to bureaucratic inadequacies and delays and mental 919
stress arising from social ruptures and loss of paid employment (Barua et al., 2013). Hidden 920
costs are rarely investigated in studies involving human-wildlife conflicts (some exceptions 921
being: Inskip et al. 2013; Dickman et al. 2008; Ogra et al. 2008 Huzzah et al. 2006; Hill 922
2004). 923
924
Another hidden cost is that felt by society more generally. The impact of predator 925
management in livestock farming areas on biodiversity also needs to be considered, since 926
this affects society too. Farmer responses to wildlife damage are considered by many to be 927
disproportionate or even extreme, especially by those members of society that derive a 928
sense of wellbeing from the existence of wild nature. For example, in the 1980s, 7000 929
cheetahs were killed in Namibia to protect livestock, even though reports of livestock 930
depredation were rare (Marker 2002, Marker et al. 2003). In South Africa, the killing of 931
leopards by farmers has also unleashed public outcry. The funding provided to non-profit 932
organisations that promote non-lethal methods of predator control in South Africa are an 933
expression of this publicly-held value. 934
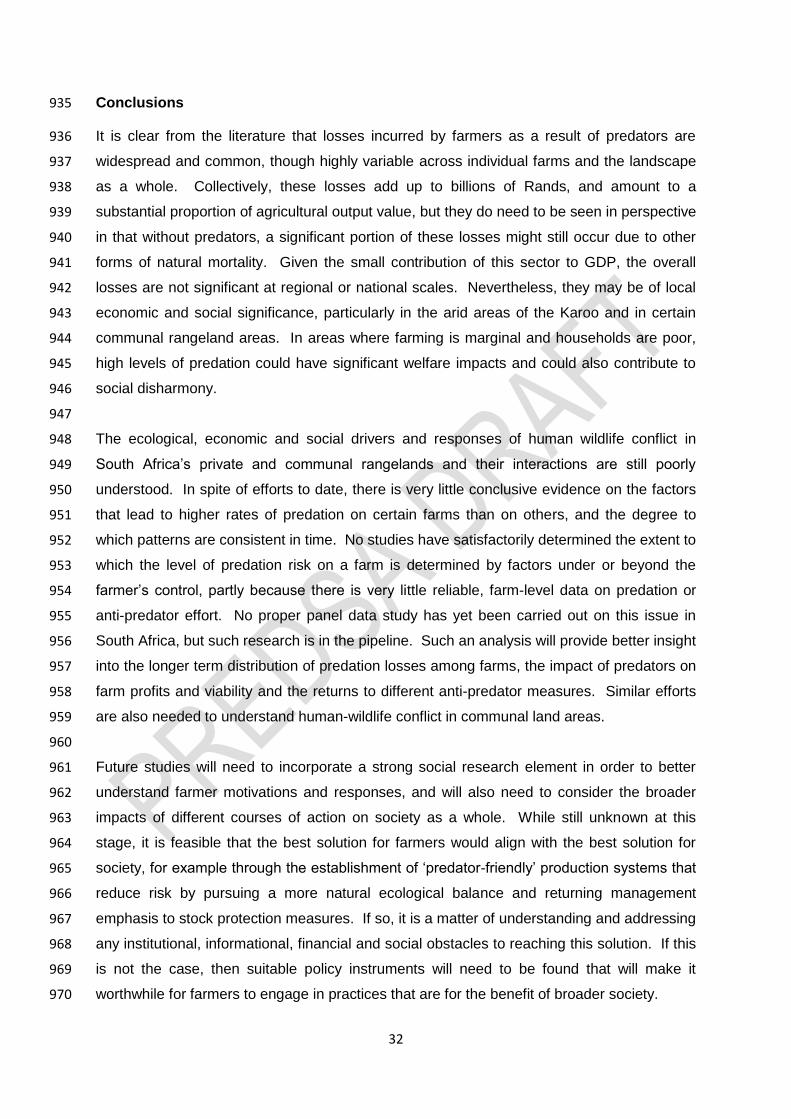
32
Conclusions 935
It is clear from the literature that losses incurred by farmers as a result of predators are 936
widespread and common, though highly variable across individual farms and the landscape 937
as a whole. Collectively, these losses add up to billions of Rands, and amount to a 938
substantial proportion of agricultural output value, but they do need to be seen in perspective 939
in that without predators, a significant portion of these losses might still occur due to other 940
forms of natural mortality. Given the small contribution of this sector to GDP, the overall 941
losses are not significant at regional or national scales. Nevertheless, they may be of local 942
economic and social significance, particularly in the arid areas of the Karoo and in certain 943
communal rangeland areas. In areas where farming is marginal and households are poor, 944
high levels of predation could have significant welfare impacts and could also contribute to 945
social disharmony. 946
947
The ecological, economic and social drivers and responses of human wildlife conflict in 948
South Africa’s private and communal rangelands and their interactions are still poorly 949
understood. In spite of efforts to date, there is very little conclusive evidence on the factors 950
that lead to higher rates of predation on certain farms than on others, and the degree to 951
which patterns are consistent in time. No studies have satisfactorily determined the extent to 952
which the level of predation risk on a farm is determined by factors under or beyond the 953
farmer’s control, partly because there is very little reliable, farm-level data on predation or 954
anti-predator effort. No proper panel data study has yet been carried out on this issue in 955
South Africa, but such research is in the pipeline. Such an analysis will provide better insight 956
into the longer term distribution of predation losses among farms, the impact of predators on 957
farm profits and viability and the returns to different anti-predator measures. Similar efforts 958
are also needed to understand human-wildlife conflict in communal land areas. 959
960
Future studies will need to incorporate a strong social research element in order to better 961
understand farmer motivations and responses, and will also need to consider the broader 962
impacts of different courses of action on society as a whole. While still unknown at this 963
stage, it is feasible that the best solution for farmers would align with the best solution for 964
society, for example through the establishment of ‘predator-friendly’ production systems that 965
reduce risk by pursuing a more natural ecological balance and returning management 966
emphasis to stock protection measures. If so, it is a matter of understanding and addressing 967
any institutional, informational, financial and social obstacles to reaching this solution. If this 968
is not the case, then suitable policy instruments will need to be found that will make it 969
worthwhile for farmers to engage in practices that are for the benefit of broader society. 970

33
References 971
Archer, E.R.M. 2004. Beyond the “climate versus grazing” impasse: using remote sensing to 972
investigate the effects of grazing system choice on vegetation cover in the eastern 973
Karoo. Journal of Arid Environments. 57:381–408. 974
Archer, S. 2000. Technology and ecology in the Karoo: A century of windmills, wire and 975
changing farming practice. Journal of Southern African Studies 26(4):675–696 976
(Special Issue: African Environments: Past and Present). 977
Badenhorst, C.G. 2014. The economic cost of large stock predation in the North West 978
Province of South Africa. MSc thesis, Department of Agricultural Economics, 979
University of the Free State. 980
Bailey, A. & Conradie, B. 2012. The effect of predator culling on livestock losses: caracal 981
control in Cooper Hunting Club, 1976-1981. CSSR Working Paper No. 320, 982
University of Cape Town. 983
Becker, S. 2015. The Communal Idea in the 21st Century. Contemporary Sociology: A 984
Journal of Reviews, 44(3), 342-344. 985
Beinart, W. 1998. The Night of the Jackal: Sheep, Pastures and Predators in the Cape. Past 986
& Present, No. 158:172-206. 987
Borge, A. 2003. Essays on the economics of African wildlife and utilization and 988
management. PhD Thesis, Norwegian University of Science and Technology, 989
Trondheim, Norway,187pp. 990
Butler, J.R.A. 2000. The economic costs of wildlife predation on livestock in Gokwe 991
communal land, Zimbabwe. African Journal of Ecology 38: 23–30. 992
Carruthers, J. 2008. “Wilding the farm or farming the wild?” The evolution of scientific game 993
ranching in South Africa from the 1960s to the present. Transactions of the Royal 994
Society of South Africa 63(2):160–181. 995
Chaminuka, P. McCrindle, C.M.E. & Udo, H.M.J. 2012. Cattle Farming at the 996
Wildlife/Livestock Interface: Assessment of Costs and Benefits Adjacent to Kruger 997
National Park, South Africa, Society & Natural Resources 25: 235-250. DOI: 998
10.1080/08941920.2011.580417. 999
Conningarth Consultants. 2015. Sectoral multipliers – National and Western Cape: 2006 at 1000
2014 prices, and 2014 at 2014 prices. Report and spreadsheet submitted to 1001
GreenCape. 1002
Conradie, B. & Landman, A. 2013. A comparison of the performance under field conditions 1003
of woolled and mutton sheep flocks in a low rainfall region of South Africa. CSSR 1004
Working Paper No. 331, University of Cape Town. 1005
34
Conradie, B. 2012 Are hunting clubs the solution to small stock depredation? The case of 1006
Ceres, 1979 and 1980, Agrekon 51:96 – 113 1007
Conradie, B.I.& Piesse, J. 2013. The effect of predator culling on livestock losses: Ceres, 1008
South Africa, 1979 – 1987. CSSR Working Paper No. 319, University of Cape Town. 1009
Conradie, B., Piesse, J. & Thirtle, C. 2009. District level total factor productivity in agriculture: 1010
Western Cape Province, South Africa, 1952–2002. Agricultural Economics 40:265–1011
280 1012
Conradie, B., Piesse, J., Thirtle, C., Vink, N. & Winter, K. 2013. Explaining declining 1013
agricultural total factor productivity in the Karoo districts of the Western Cape, 1952 1014
to 2002, Agrekon: Agricultural Economics Research, Policy and Practice in Southern 1015
Africa 52:sup1, 1-23, DOI: 10.1080/03031853.2013.770950. 1016
Conradie, B. & Turpie, J. 2003. Livestock and conservation farming in the Karoo arid 1017
rangelands, South Africa. Pp. 191-212 In Turpie, J.K. (Ed.). An ecological-economic 1018
appraisal of conservation on commercial farm land in four areas of South Africa. 1019
Report of the SANBI Conservation Farming Project. 1020
Constant, N. L. (2014). socio-ecological approach towards understanding conflict between 1021
leopards (Panthera pardus) and humans in South Africa: Implications for leopard 1022
conservation and farming livelihoods. Durham theses, Durham University. Available 1023
at Durham E-Theses Online: http://etheses.dur.ac.uk/10807/. 1024
DAFF 2010c. A profile of the South African Beef Market value chain. Directorate: Marketing, 1025
Department of Agriculture, Forestry and Fisheries, Pretoria. 1026
DAFF 2016. Abstract of agricultural statistics 2016. Department of Agriculture, Fisheries and 1027
Forestry, Republic of South Africa. 1028
DAFF 2017. Economic review of South African Agriculture 2016. Department of Agriculture, 1029
Fisheries and Forestry, Republic of South Africa. 1030
Davies, R.A.G. 1999. The extent, cost and control of livestock predation by eagles with a 1031
case study on Black Eagles (Aquila verreauxii) in the Karoo. Journal of Raptor 1032
Research 33: 67-72. 1033
Dean, W.R.J., Hoffman, M.T., Meadows, M.E. & Milton, S.J. 1995. Desertification in the 1034
semi-arid Karoo, South Africa: review and reassessment. Journal of Arid 1035
Environments. 30:247–264. 1036
De Beer, S. 2006. Produsente en Probleemdiere. Paper presented to the Resolving Human-1037
Wildlife: Conflict Prevention is the Cure Workshop. 1038
De Waal, H.O., 2009. Recent advances in co-ordinated predator management in South 1039
Africa. African Large Predator Research Unit, Department of Animal, Wildlife and 1040
Grassland Science (70). University of the Free State, Bloemfontein . 1041
35
De Wet, T. 2006. Vermin>Problem Animal>Damage Control – A Wake-Up Call. Paper 1042
presented to the Resolving Human-Wildlife: Conflict Prevention is the Cure 1043
Workshop 1044
Dickman, A.J., Macdonald, E.A. & Macdonald, D.W. (2011) A review of financial instruments 1045
to pay for predator conservation and encourage human–carnivore coexistence. 1046
Proceedings of the National Academy of Sciences of the United States of America, 1047
108, 13937–13944. 1048
FAO, 2009. The state of food and agriculture – Livestock in the balance. Food and 1049
Agricultural Organization of the United Nations, Rome. ISBN 978-92-5-1062 15-9. 1050
Friedmann Y. & Daly B. 2004. Red data book of the mammals of South Africa: a 1051
conservation assessment. CBSG Southern Africa, Conservation Breeding Specialist 1052
Group (SSC/IUCN), Endangered Wildlife Trust, South Africa, pp. 147- 1053
Constant, N. L. (2014). socio-ecological approach towards understanding conflict between leopards 1054
(Panthera pardus) and humans in South Africa: Implications for leopard conservation and 1055
farming livelihoods. Durham theses, Durham University. Available at Durham E-Theses 1056
Online: http://etheses.dur.ac.uk/10807/. 1057
Game Ranch Economics. (2017, May 22). The Trend Towards Game Ranching in South Africa. 1058
Retrieved from Wildlife Campus: 1059
http://www.wildlifecampus.com/Courses/GameRanchEconomics/IntroductiontoGameRanch1060
ing/TheTrendTowardsGameRanchinginSouthernAfrica/891.pdf 1061
1062
Gusset, M., Maddock, A.H., Gunther, G.J., Szykman, M., Slotow, R., Walters, M. & Somers, 1063
M.J. 2008. Conflicting human interests over the re-introduction of endangered wild 1064
dogs in South Africa. Biodiversity Conservation 17: 83-101. 1065
Hawkins, H. 2012. A year of EcoRangers: Does the EcoRangers model have the potential to 1066
reduce livestock losses while improving farm management and skills in rangelands? 1067
Unpublisehd report, Conservation South Africa. 15pp. 1068
Hemson, G., Maclennan, S., Mills, G., Johnson, P. & Macdonald, D. 2009. Community, lions, 1069
livestock and money: A spatial and social analysis of attitudes to wildlife and the 1070
conservation value of tourism in a human–carnivore conflict in Botswana. Biological 1071
Conservation 142: 2718–2725. 1072
Hoffman, M., & Ashwell, A. (2001). Nature Divided. Land Degradation in South Africa. Cape 1073
Town: University of Cape Town Press. 1074
Lutchminarayan, K. 2014. Predation Impacts on Livestock in a Communal Area of 1075
Namaqualand, Northern Cape, South Africa. BSc Honours thesis, University of Cape 1076
Town, 51pp. 1077

36
Marker, L., Dickman, A., Mills, G. & Macdonald, D.W. 2005. Perceived effectiveness of 1078
livestock-guarding dogs placed on Namibian farms. Rangeland ecology and 1079
management 58:329-336. 1080
Marker, L., Dickman, A., Mills, G. & Macdonald, D.W. 2010. Cheetahs and ranchers in 1081
Namibia: a case study. In Biology and Conservation of Wild Felids (eds D.W. 1082
Macdonald & A.J. Loveridge), pp. 353–372. Oxford University Press,Oxford, UK. 1083
Marnewick, K., Beckhelling, A. Cilliers, D., Lane, E., Mills, G., Hering, K., Caldwell, P., Hall, 1084
R. and S. Meintjies. 2007. The status of cheetah in South Africa. Cat News Special 1085
Edition: The status and conservation needs of the cheetah in Southern Africa (pp. 1086
22–31). IUCN Cat Specialist Group, Gland, Switzerland. 1087
McManus, J. 2012. A profit and loss accounting of lethal predator control and non-lethal 1088
livestock protection on commercial farms in the Eastern Cape South Africa: 1089
Comparing economic efficacy and economic viability. Paper presented to the IVth 1090
International Wildlife Management Congress 2012. Durban, July. 1091
McManus, J.S. Dickman, A.J., Gaynor, D, Smut, B.H. & MacDonald, D.W. 2015. Dead or 1092
alive? Comparing costs and benefits of lethal and non-lethal human–wildlife conflict 1093
mitigation on livestock farms. Oryx, 49: 687–695. 1094
Meissner, H.H., Scholtz, M.M. & Palmer, A.R. 2013. Sustainability of the South African 1095
Livestock Sector towards 2050 Part 1: Worth and impact of the sector. South African 1096
Journal of Animal Science 43: 282–297. 1097
Mills, G. and Hofer, H. 1998. Hyaenas: status survey and conservation action plan. 1098
IUCN/SSC 1099
Hyaena Specialist Group, Gland. 1100
Mmbengwa, V., Nyhodo, B., Lindikhaya, M., & van Schalkwyk, H. (2015). Communal 1101
livestock farming in South Africa: Does this farming system create jobs for poverty 1102
stricken rural areas. SYLWAN Poland Journal. 1103
Moberly, R.L., 2002. The cost of fox predation to agriculture in Britain. PhD Thesis, 1104
Environment Department,University of York. 1105
Moberly, R.L., White P.C.L., Webbon C.C., Baker P.J., Harris S., 2003. Modelling the cost of 1106
fox predation and preventive measures on sheep farms in Britain. Enviromment 1107
Department, University of York, York Y010 5DD, UK. 1108
Morris, S.T. 2009. Economics of sheep production. Small Ruminant Research 86: 59–62. 1109
Nattras, N., Conradie, B., Drouilly, M., & O’Riain, M.J. 2017. A brief history of predators, 1110
sheep farmers and government in the Western Cape, South Africa. CSSR Working 1111
Paper No. 398, University of Cape Town. 1112
37
Nattrass, N. & B. Conradie. 2015. Jackal Narratives: Predator Control and Contested 1113
Ecologies in the Karoo, South Africa. Journal of Southern African Studies, 41(4): 753-1114
771. 1115
Oli, M. K., I. R. Taylor, and M. E. Rogers. 1994. Snow leopard (Panthera uncia) predation of 1116
livestock - an assessment of local perceptions in the Annapurna Conservation Area, 1117
Nepal. Biological Conservation 68(1):63-68. 1118
Palmer, T. & Ainslie, A., 2006. Country pasture/forage resource profiles: South Africa. 1119
Department of Agriculture, Republic of South Africa 1120
Patterson, B. D., S. M. Kasiki, E. Selempo, R. W. Kays. 2004. Livestock predation by lions 1121
(Panthera leo) and other carnivores on ranches neighbouring Tsavo National Park, 1122
Kenya. Biological Conservation 119: 507-516. 1123
Penrith, M., Botha, C.J. & Tustin, R.C. 2015. Plant poisonings in livestock in Brazil and 1124
South Africa. Journal of the South African Veterinary Association 86(1), Art. #1200, 3 1125
pages. http://dx.doi.org/10.4102/ jsava.v86i1.1200. 1126
Randolph, T.H., Schelling, E., Grace, D., Nicholson, C.F., Leroy, J.L., Cole, D.C., Demment, 1127
M.W., Omore, A., Zinsstag, J. & Ruel, M., 2007. Invited Review: Role of livestock in 1128
human nutrition and health for poverty reduction in developing countries. J. Anim. 1129
Sci. 85, 2788-2800. 1130
Reed, L.L. & Kleynhans, T.E. 2009. Agricultural land purchases for alternative uses – 1131
evidence from two farming areas in the Western Cape Province, South Africa. 1132
Agrekon 48(3): 332-351. 1133
Rowe-Rowe, D.T. 1975. Predation by black-backed jackals in a sheep farming area of Natal. 1134
Journal of the Southern African Wildlife Management Association 5:79-81. 1135
Rust, J.M. & Rust, T. 2013. Climate change and livestock production: A review with 1136
emphasis on Africa. South African Journal of Animal Science 43: 255-267. 1137
Schiess-Meier, M., Ramsauer, S., Gabanapelo, T. & König, B.(2007) Livestock predation—1138
insights from problem animal control registers in Botswana. The Journal of Wildlife 1139
Management, 71, 1267–1274. 1140
Schoeman, L. 2011. Predation killing red meat production’, Farmers Weekly 23 September. 1141
Scholtz, M.M. & Bester, J. 2010.The effect of stock theft and mortalities on the livestock 1142
industry in South Africa. Applied Animal Husbandry & Rural Development 2010, 1143
Volume 3; Peer-reviewed paper: 43rd Congress of the South African Society of 1144
Animal Science. 1145
Shwiff, S. & R. Merrell. 2004. Coyote predation management: An economic analysis of 1146
increased antelope recruitment and cattle production in South Central Wyoming. 1147
Sheep and Goat Research Journal, vol.19: 29-33. 1148
38
Smith, N. & S. L. Wilson. 2002. Changing land use trends in the thicket biome: pastoralism 1149
to game farming. Report Number 38. Terrestrial Ecology Research Unit, University of 1150
Port Elizabeth, Port Elizabeth, South Africa. 1151
Snow, T. 2006. Advantages and disadvantages of various control methods. Southern Africa, 1152
Endangered Wildlife Trust, Johannesburg. 1153
Snyman, M.A. 2010. Factors affecting pre-weaning kid mortality in South African Angora 1154
goats. South African Journal of Animal Science 40: 54-64. 1155
Stadler, H. 2006. Historical Perspective on the Development of Problem Animal 1156
Management in the Cape Province, in Resolving Human-Wildlife Conflict: Prevention 1157
is the Cure. 1158
Stats SA 2013 Statistics Release PO441. Republic of South Africa. 1159
Stannard, C. 2003. A survey on the effectiveness of different problem animal control 1160
methods in the small stock producing areas of South Africa. Grootfontein Agricultural 1161
Development Institute. AP5/15. 1162
Stannard, C.G. 2005. Breeding program for livestock guarding dogs. P39 in: Research report 1163
of the Grootfontein Agricultural Development Institute. Department of Agriculture, 1164
South Africa. 1165
Stuart-Hill, G., & Aucamp, A. 1993. Carrying capacity of the succulent bushveld of the 1166
Eastern Cape. Afri. J. Range Forage Science, 10, 1-10. 1167
Thirtle, C., Sartorius von Bach, H. & van Zyl, J. 1993. Total factor productivity in South 1168
African agriculture, 1947–91, Development Southern Africa 10(3):301–318. 1169
Thorn, M., Green M., Scott, D. & Marnewick, K. 2013. Characteristics and determinants of 1170
human-carnivore conflict in South African farmland. Biodiversity Conservation 22: 1171
1715-1730. 1172
Thorn, M., Green, M., Dalerum, F., Batement, P.W., Scott, D.M. 2012. What dives human-1173
carnivore conflict in the North West Province of South Africa? Biological 1174
Conservation 150: 23-32. 1175
Treves, A., KIrofel, M. & McManus, J. 2016. Predator control should not be a shot in the 1176
dark. Frontiers in Ecology and the Environment 2016; 14(7): 380–388, 1177
doi:10.1002/fee.1312. 1178
Van Bommel, L. & Johnson, C.N. 2011. Good dog! Using livestock guardian dogs to protect 1179
livestock from predators in Australia’s extensive grazing systems, Wildlife Research 1180
39(3) 220-229 https://doi.org/10.1071/WR11135 1181
Van der Waal, C. & Dekker, B. 2000. Game ranching in the Northern Province of South 1182
Africa. South African Journal of Wildlife Research 30: 151-156. 1183

39
van Niekerk, H.N. 2010. The cost of predation on small livestock in South Africa by medium-1184
sized predators. MSc thesis, Department of Agricultural Economics, University of the 1185
Free State. 110 pp. 1186
van Niekerk, H.N., Taljaard, P.R., Grové, B. & de Waal, H.O. 2013.Factors affecting small 1187
livestock predation in the Western Cape Province of South Africa. Proceedings of 1188
the19th International Farm Management Congress, SGGW, Warsaw, Poland. 1189
Viljoen, N. 2016. Train for gain. Wolboer/Wool Farmer 3(6): 28-29. 1190
Wessels, J.S.F & Willemse, B.J. 2013. The impact of changed land use on farmland values 1191
and farmland valuations: An example from the South Eastern Nama Karoo. Agrekon 1192
52(S1): 133-151 1193
WWF (undated) Agriculture: facts and trends, South Africa. 32pp. 1194