SCIENTIFIC AND TECHNICAL WORKSHOP - JODCjdoss.jodc.go.jp/info/ioc_doc/JCOMM_Tech/TR16.pdfGeoffrey K...
116
WORLD METEOROLOGICAL ORGANIZATION _____________ INTERGOVERNMENTAL OCEANOGRAPHIC COMMISSION (OF UNESCO) ___________ SCIENTIFIC AND TECHNICAL WORKSHOP OF THE JCOMM SHIP OBSERVATIONS TEAM Presentations at the first session of the Ship Observations Team (Goa, India, 26 February 2002) WMO/TD-No. 1118 2002 JCOMM Technical Report No. 16
Transcript of SCIENTIFIC AND TECHNICAL WORKSHOP - JODCjdoss.jodc.go.jp/info/ioc_doc/JCOMM_Tech/TR16.pdfGeoffrey K...

WORLD METEOROLOGICAL ORGANIZATION
_____________
INTERGOVERNMENTAL OCEANOGRAPHICCOMMISSION (OF UNESCO)
___________
SCIENTIFIC AND TECHNICAL WORKSHOP OFTHE JCOMM SHIP OBSERVATIONS TEAM
Presentations at the first session of theShip Observations Team
(Goa, India, 26 February 2002)
WMO/TD-No. 1118
2002
JCOMM Technical Report No. 16

N O T E
The designations employed and the presentation of material in this publication do not imply theexpression of any opinion whatsoever on the part of the Secretariats of the IntergovernmentalOceanographic Commission (of UNESCO), and the World Meteorological Organization concerning thelegal status of any country, territory, city or area, or of its authorities, or concerning the delimitation of itsfrontiers or boundaries.

FOREWORD
A Scientific and Technical Workshop was held as a part of the first session of the ShipObservations Team (Goa, India, 25 February - 2 March 2002), to provide an opportunity toexchange information related to observations on board ships, communications facilities andtechnology, and the applications of ship-board observations. The workshop concept and structurewere modelled on the very successful workshops which have been conducted for a number ofyears now as an integral part of the annual sessions of the Data Buoy Cooperation Panel (DBCP).
The workshop took place during the second day (26 February 2002) of the session, when15 papers were read to more than 50 participants. Extended abstracts/ power pointpresentations/abstracts of the papers presented are included in this JCOMM Technical Report,which is published only electronically, as agreed by the meeting. In all cases, thepapers/presentations have been included as received, without any editorial intervention.
TABLE OF CONTENTS
FOREWORD
TABLE OF CONTENTS
AGENDA
PRESENTATIONS
1. Yukihiro Nojiri1, Maria Hood2 and Yves Dandonneau3
1 National Institute for Environmental Studies, Japan2 Intergovernmental Oceanographic Commission3 Laboratoire d'Océanographie Dynamique et de ClimatologieVOS/SOOP Measurements of Carbon and Related Variables
2. Tom Houston, Geoffrey K. Morrison, Cynthia Moore and Rod G. ZikaThe International SeaKeepers SocietyAn Automated Ocean and Weather Monitoring System for Use on Volunteer Observing Ships
3. Robert Caplikas1, Simon Harrod1 and Ross Hibbins2
1 Vaisala Melbourne2 Bureau of Meteorology, AustraliaShip Automatic Weather Stations
4. Errki Jarvinen, VaisalaDevelopment in Vaisala's ASAP equipment
5. Geoffrey K Morrison1, Frank Millero 1, Flavio Graziottin 2, Walter Varda3, Regis Cook3,Richard Wood3 and Rod G. Zika1
1 International Seakeepers Society2 Idonaut Srl,Italy, 3 General Oceanics, USAReport on the Development of CO2 Monitoring Systems to be Included in an AutonomousData Gathering System
6. Ron Fordyce 1 and Tom Vandall 21 Environment Canada, 2 AXYS Environmental Systems, CanadaImproving the frequency and reliability of global meteorological observations at sea
7. Tadashi Ando , Japan Meteorological AgencyThe new OBSJMA
8. Christian Ortega,.Collecte Localisation SatellitesArgos System, Applications and Enhancements
9. Vladimir Maksimov, Inmarsat, LtdNew Maritime Safety and Commercial Service in 2002
10. Tomowo Watanabe 1, Michio Sekimoto 21 Tohoku National Fisheries Research Institute, Japan, 2 Tsurumi Seiki Co., LTDResults of field tests of the new XCD-2

11. Edward J. Kearns1, Steven Browdy2, Rupert Minnett2, Christine Caruso-Magee2, Geoffrey K.Morrison2 and Rod G. Zika2
1 University of Miami, USA, 2 International Seakeepers SocietyCollection and evaluation of marine observations from the International SeaKeepers SocietyAutonomous VOS Fleet
12. Elizabeth C. Kent and Peter K. Taylor , Southampton Oceanography Centre, UKThe Accuracy of Voluntary Observing Ships' Marine Meteorological Observations
13. François Gérard, Météo-FranceAn Observation Strategy over the Atlantic
LIST OF PARTICIPANTS

AGENDA FOR SCIENTIFIC AND TECHNICAL WORKSHOPOF THE SHIP OBSERVATIONS TEAM
VENUE … Goa, IndiaDATE … 26 February 2002
Workshop chairman: Dr G. Narayana Swamy
Session 1 New Programmes (Chair: Dr G. Narayana Swamy)
1. PRACTICE OF OCEAN CO2 OBSERVATIONS USING TRANS-OCEAN CARGO SHIPSYukihiro Nojiri, Carbon Cycle Research Team, National Institute for Environmental StudiesEmail: [email protected]
ABSTRACT:
CGER-NIES (Center for Global Environmental Research belonging to National Institute forEnvironmental Studies) started monitoring of oceanic CO2 and related parameters utilizing North Pacificcargo ships from 1995. The activity was combined with existed atmospheric sampling program using Japan-Australia line container ships. Summary of the history is shown in Table 1.
The daily operation of on board CO2 instruments is one of most important and difficult issues for thelong-term maintenance of VOS observation. Even by the advanced technologies, suction of seawater intothe ship is indispensable for the accurate measurement of oceanic CO2 parameters, such as partial pressureof CO2 (pCO2), total dissolved carbon (DIC), pH and alkalinity. The measurement of pCO2 is most practicaland popular CO2 measurement as an underway mode. Because the measurement uses seawater in theship, safe installation of the intake and exhaust system for surface seawater and care during the cruise aretruly necessary. A complete automatic system may not be enough safe. Asking a regular seaman to watchthe water system is usually very difficult under the recent trend of reducing number of crew on board.
In the history of CGER-NIES CO2 monitoring program using Pacific VOS, the on board systemoperator was changed from laboratory technicians to a seaman, employed by the research budget. Seamanemployment can save the operational cost of the monitoring work. Ship operator also can have benefit ofaddition of a seaman sharing his working hours. The on board seaman can be responsible about the safetyof on board monitoring system, especially for safety of the seawater use.
We made effort for automation of on board CO2 system, and data networking of equipments, such asair CO2 system at ship bow, ocean pCO2 system at ship bottom, and navigation/meteorological system atbridge. On board operator can remotely watch the measurement results at bridge through on board LAN byour update instrumentation. Less necessity of daily on board maintenance facilitates operation by seamanwithout scientific carrier. The similar type of pCO2 system has recently been installed on board a NorthAtlantic VOS under cooperation with Institute für Meereskunde, Germany and NIES.
The oceanic pCO2 measurement needs SST and SSS information. A thermosalinograph is usuallyoperated simultaneously with the pCO2 system. The CO2 VOS program can cooperate with the continuoussurface SST and SSS measurement network by VOS.
The integration of global data set of oceanic CO2 parameters, assurance of analytical accuracy isalso an important issue. About DIC and alkalinity, Scripps CRM (certified reference material) is playing agreat part. Unfortunately CRM is not so useful for accuracy control of pCO2. Inter-calibration of on boardpCO2 system and common use of certified CO2 system are recommended. We are also making effort for thequality control work in this field.

Table 1. History of NIES VOS monitoring including air and ocean CO2 measurement
North Pacific VOS monitoring (Japan-US/Canada west coast line)Ship Flag Started Ended Air CO2 Ocean. CO2 System
operationSkaugran Norway 1995/03 1999/10 hourly minutely on board
technicianAlligatorHope
Liberia 1999/11 2001/05 10 sec. 10 sec.dual system
employedseaman
Pyxis Panama 2001/11 active 10 sec. 10 sec.(2002/06-)
employedseaman
Western Pacific VOS monitoring (Japan-Australia line)Ship Flag Started Ended Air CO2 Ocean. CO2 System
operationHakuba Japan 1992/06 1996/01 flask none unmannedSouthernCross
Japan 1996/03 2001/05 flask none unmanned
MOL GoldenWattle
Liberia 2001/05 active 10 sec. 10 sec.(2002/10-)
employedseaman
2. COORDINATION OF VOS AND SOOP PROGRAMMES MEASURING OCEAN CARBON ANDRELATED PARAMETERSMaria Hood, Intergovernmental Oceanographic Commission of UNESCO, Technical Secretary,SCOR – IOC Advisory Panel on Ocean CO2Email: [email protected]
ABSTRACT:
The SCOR-IOC Advisory Panel on Ocean CO2 has recently created an email and web-basedcommunications forum for scientists making measurements of ocean carbon and related parameters.(http://www.ioc.unesco.org/iocweb/co2panel) In October 2001, the Panel initiated the development of aninventory of programmes and principle investigators to determine the routes and measurements being made,and to share this information with the wider community. To date, the Panel has identified 21 programmes(8 Atlantic, 9 Pacific, 1 Atlantic-Pacific, and 4 Indian and Southern Ocean) measuring a wide range of oceanand atmospheric variables, including SST, SSS, pCO2, fluorescence, pigments, optical properties, Total CO2,Alkalinity, and atmospheric CO2, 13C, 14C, 18O, CH4, N2O, O2/N2, O3, air temperature, humidity, solarradiation, and wind velocity and direction. The vessels used are approximately 50% research or resupplyvessels, and 50% industry vessels. Countries sponsoring programmes include Norway, Germany, UK,Spain, US, Japan, Australia, Canada, and France. A number of these programmes work together to createcombined data sets and products. There is a need, expressed by several of the principle investigators, forgreater communication between these programmes to improve the coordination and data sharing, and forintercalibration exercises, standardization of techniques, and agreement on and use of certified referencematerials and data formats. The Panel discussed the way forward at its 2nd Session meeting, 9-10 February,2002. The initial inventory and plans for continued coordination and communication with this group ofinvestigators will be presented.
3. BIOGEOCHEMICAL MEASUREMENTS OF SHIPS OF OPPORTUNITY- ONGOINGPROGRAMMES AND FEASIBILITYYves Dandonneau, Laboratoire d’Oceanographie Dynamique et de Climatologie, Universite Pierre etMarie Curie, Paris
ABSTRACT:
The marine ecosystems that control the biological carbon sink are complex, including primaryproducers, grazers, predators, and bacteria, and produce a large variety of dead particles and dissolvedorganic matter. Their study implies measurements of many kinds of biomass and fluxes, and is possible onlyduring devoted cruises onboard of oceanographic research vessels. Hence, only a limited number of suchstudies can be made, and these are generally organized in provinces where carbon fluxes are important andover which the dominant processes are considered to be homogeneous and can be predicted.

On the other hand, sea color sensors on satellites deliver data that can be converted into chlorophyllconcentration, making it possible to obtain weekly global maps of chlorophyll concentration at the seasurface, i.e., information that is very close to the carbon flux which corresponds to gross photosynthesis.
Between these two approaches, there is a large gap, as global chlorophyll fields derived fromsatellites cannot be used accurately for the determination of global biogeochemical fluxes unless we knowhow the ecosystems operate these fluxes in all provinces. Ships of opportunity can help to describe thevariability of the ecosystems which is mostly at large scale (regional, seasonal). Programs already exist thatare based on sampling by ships of opportunity and that address oceanic biogeochemistry. They can bedivided into two categories according to their objectives. Some of them aim to improve the estimates ofsurface seawater chlorophyll content from reflectance measured at the top of the atmosphere. For this,atmospheric correction represents 90% of the signal, making it a major difficulty. In order to validate thealgorithms that estimate the seawater reflectance from reflectance at the top of the atmosphere,measurements of the former must be repeated in many places, covering the wide variability of aerosols andatmospheric conditions. For these measurements, three difficulties must be solved: avoiding the sun glitter,avoiding the white caps, and avoiding surfaces where the irradiance field is affected by the ship. The twolast ones are especially difficult to solve. Two radiometers have been developed: the SIMBADA (Laboratoired’Optique Atmosphérique in Lille, France) is a portable easy to use radiometer, that has 11 wavelengthsnear or close to those of SeaWiFS or MERIS sea color sensors and can be operated by the officers of shipsof opportunity, and the Shadow Band Radiometer, developed at Brookhaven (New York), that is fullyautomatic and additionally measures the radiation from the sky (without direct sun radiation) using a rotatingscreen (the ‘shadow band’). Other ones aim to describe the variability of biogeochemical conditions at sea,and can include the measurement of a very large number of parameters. Among these, photosyntheticpigments are especially interesting : they offer a way to validate the products of sea color satellite sensors,and they make it possible to characterize the ecosystems, because many of these pigments are indicators ofphytoplankton groups. Great care must be taken for the sampling of photosynthetic pigments, especially forstorage that must be done at temperature less than minus 40°C. Depending on the measurements to bemade, presence of a scientific observer onboard of the ship is often necessary. Examples of such programsare the Atlantic Meridional Transect (AMT) managed from Plymouth, England, and the Geochemistry,Phytoplankton and Color of the Ocean project (GeP&CO) operated from LODyC, France.
Session 2 Observational equipment and telecommunication facilities (Chair: Ms Sarah North)
4. AN AUTOMATED OCEAN AND WEATHER MONITORING SYSTEM FOR USE ON VOLUNTARYOBSERVING SHIP (VOS)Tom Houston, Geoffrey K Morrison, Cynthia Moore, and Rod G. Zika, International SeaKeepersSocietyEmail: [email protected]
ABSTRACT:
The International SeaKeepers Society has developed an autonomous ocean and weather monitoringsystem. Systems are currently deployed on private superyachts, and commercial cruise ships, whichparticipate in the Volunteer Observing Ship (VOS) program. Wind speed and direction, air temperature,barometric pressure, relative humidity, and sea surface temperature (SST), along with ship’s position, arereported automatically to the United States National Weather Service via INMARSAT C email at regularintervals.
In addition to its “weather sensors”, the SeaKeepers system is designed to accommodate a widevariety of oceanographic sensors as well. At present all participating vessels carry a suite of ocean sensorsthat measure, log and transmit data on SST and salinity. Other aqueous sensors such as dissolved oxygen,pH and Eh and optical sensors for chlorophyll and CDOM fluorescence and turbidity are being developed forinclusion in the system and are currently completing field tests. Sensors for pCO2, total CO2 and trace metalsare also in development. A nutrient monitoring package is also planned.
This process represents a unique collaboration between:
The International SeaKeepers Society, a not for profit organizationThe National Oceanographic and Atmospheric Administration, US governmentThe University of Miami, Rosenstiel School of Marine and Atmospheric ScienceGeneral Oceanics Inc. a US corporationIdronaut Srl an Italian manufacturer

SeaPoint Corporation a US corporationWS Envirotech a UK manufacturer
5. RELIABLE WIND DATA FROM SHIPBOARD AWSR Caplikas, Manager, Vaisala Melbourne, AustraliaR Hibbins, Instrument Engineering, Bureau of Meteorology, AustraliaEmail: [email protected]
ABSTRACT:
Truly representative information about wind direction and speed at sea cannot be obtained byobserving the weather on the coast. Australia’s Bureau of Meteorology has installed a small number ofAutomatic Weather Station (AWS) on its Australian Volunteer Observing Fleet (AVOF) ships to assist inobtaining maritime weather observations. These ships report generally on a three hourly Synoptic schedule,and relay the conventional weather parameters such as wind speed and direction, pressure, temperatureand humidity.
An INMARSAT-C satellite transmitter with an internal GPS receiver is used to transmit observationsback to the Bureau’s network. The GPS receiver provides information on the ship’s position and speed andits course over the water. A laptop PC on the bridge displays real-time information on the AWSmeasurements. It also enables manual entry of observations such as visibility and sea state.
Data transmission costs from the AVOF ships is an important consideration. For this reason, thestandard Synop message is converted to a short binary report prior to transmission and then decoded backto the standard Ship Synop code at the Bureau. This enables the use of very short data transmissions. Thebenefits are two-fold, observations can be made as frequently as once per hour, and costs are significantlylower compared with other communication options.
AWS data from these ships will significantly contribute to improve accuracy of marine forecasts. Forexample, the first Ship AWS was fitted to the Spirit of Tasmania to assist in the study of wind patterns acrossBass Strait, as part of an effort to enhance the Bureau’s computer derived forecasts and improve forecastingfor Bass Strait.
At present the Bureau has installed this system on five AVOF ships and is currently planning toinstall a further five to ten over the next three years. In summary, the Ship AWS system providesautomatically accurate, around the clock, information on the marine weather situation. The weatherinformation collected is proving to be an extremely useful contribution for forecasts, and model input both inthe Australian area, and also for input into the worldwide NWP models.
6. DEVELOPMENTS IN VAISALA'S ASAP EQUIPMENTErkki Jarvinen, VaisalaEmail:[email protected]
ABSTRACT:
This presentation introduces the Vaisala ASAP Product. Product is based on DigiCORA III MW21based radiosounding equipment. DigiCORA III sets new standards for upper-air sounding operations due toits open software architecture, flexibility, telecommunication and networking capabilities.
Several improvements have been made to GPS-derived upper air wind measurements. Theseimprovements have been implemented in the Vaisala radiosonde design and its associated computationalgorithms. The effect of these improvements has been analyzed for performance and reliability andcompared with collected operational data from the field.
This presentation will also consider "Data as a product" -concept: Discussion about one possibility toaccelerate the increase of the ASAP-observations over the oceans. Vaisala could consider furnishing ASAP-installations and providing data for GTS.

7. DEVELOPMENT OF BEOGEOCHEMICAL AND PHYSICAL DATA ACQUISITION SYSTEMS FORUSE ON MERCHANT VESSELSRick Bailey (CSIRO/BMRC JAFOOS Australia), Roger Francey, Bronte Tilbrook, John Parslow(CSIRO Australia)Email:[email protected]
8. REPORT ON THE DEVELOPMENT OF CO2 MONITORING SYSTEMS TO BE INCLUDED IN ANAUTONOMOUS DATA GATHERING SYSTEMGeoffrey K Morrison, Frank Millero, Flavio Graziottin, Walter Varda, Regis Cook, Richard Wood andRod G. Zika, International SeaKeepers SocietyEmail: [email protected]
ABSTRACT:
The development of two specialized sensors for monitoring air-sea CO2 flux is described: 1) A pCO2continuous-flow system utilizing a miniature shower head equilibrator and 2) a continuous-flow differential pHsystem for monitoring total inorganic carbonate (TCO2). The initial development of these instruments wasfunded by an NSF STTR grant. The second phase of the development is now being funded by an NSFPhase II STTR grant. The two sensors are being designed so that they can be easily installed, together withother ocean and atmospheric sensors, in the SeaKeepers Ocean & Atmospheric Monitoring Systemcurrently being deployed on ships, buoys and piers around the world. After being fully field tested, the twoCO2 instruments will be deployed worldwide by the non-profit International SeaKeepers Society to analyzeCO2 absorption by the oceans as a contribution to the research on the role of CO2 in global warming.
9. IMPROVING THE FREQUENCY AND RELIABILITY OF GLOBAL METEOROLOGICALOBSERVATIONS AT SEARon Fordyce, PMO Manager, Environment Canada, Hamilton, CanadaTom Vandall, Director, AXYS Environmental Systems, Victoria, CanadaEmail: [email protected]
ABSTRACT:
The Voluntary Observing Ships' (VOS) meteorological reports provide essential data tometeorologists and climatologists. Currently these observations are collected, corrected (true wind,magnetic variation, pressure etc.) and transmitted manually using the standard WMO format. Until recently,over 20% of the observed data in Canada’s VOS program was being rejected by failing automated qualitycontrol (QC) tests, or being lost by complications in the data routing pathways to the GTS. Commonly, datawas rejected due to errors in the observed wind speed and direction or errors with the observed position.
The manual nature of VOS data collection introduces an inherent risk for observation bias and/orinput error. In addition, the frequency of data reporting is inconsistent and often not carried out in extremeweather conditions when the data is most important. Other limitations include the wide variety ofuncalibrated instruments that are in use. In an effort to improve Canada’s VOS program, EnvironmentCanada contracted AXYS Environmental systems to develop the Automated Voluntary Observing ShipsAVOS system to transmit fully automated VOS observation reports. This system was based on thesuccessful Watchman based buoy payloads in use in the Canadian Weather Buoy Network. TodayAVOS reports include GPS position, UTC time, vessel identification, 3 hourly ship speed made good,course speed made good, pressure tendency, true wind speed and direction, pressure, air temperature, wetbulb temperature and sea surface temperature. The system uses standardized, calibrated climate qualitysensors, which are in use in the National Weather Buoy Network. Early data return rates for AVOS havebeen excellent with automated region detection algorithms supporting reporting modes for Synoptic (6 hr.),Intermediate Synoptic (3 hr.) and Data Sparse (1hr.) regions. As a result the frequency of measurementshas risen dramatically with automatic region detection and automatic reporting of STORM and SPREPconditions also taking place.
Through the use of image rich touch screen technology and an intuitive software interface, manuallyobserved data such as cloud height and type, present and past weather, wave conditions and ice and icingcan be added to the VOS report. Automated quality control protocols ensure that manual observations arecorrectly entered. Corrections for elevation and magnetic variation are made automatically using regiondetection algorithms. PMO’s have been very enthusiastic about the simple installation and ease of use withAVOS which is helping them to promote the VOS program.

To date Environment Canada has purchased 13 AVOS systems and plans to outfit 75 vessels inthe Canadian AVOS fleet over the next few years. Ships outfitted with AVOS have generated a ten foldincreased in the average number of VOS reports. It is apparent that this system will significantly helpCanada improve the frequency and accuracy of VOS observations.
10. THE NEW OBSJMATadashi Ando, Japan Meteorological AgencyEmail: [email protected](see extended abstract)
11. ARGOS SYSTEM APPLICATIONS AND ENHANCEMENTSChristian Ortega , CLS/Service ArgosEmail: [email protected](see extended abstract)
12. NEW INMARSAT MARINE SAFETY AND COMMERCIAL SERVICES IN 2002Vladimir Maksimov, Inmarsat Ltd.Email: [email protected](see extended abstract)
13. AUTOMATIC VOLUNTARY OBSERVING SHIPS' SYSTEM BRIDGE TOUCHSCREENINTERFACETom Vandall, AXYS Environmental Systems, Victoria, CanadaEmail: [email protected]
ABSTRACT:
AVOS™ automatically samples, processes, displays, logs and transmits weather data from VOSships in the universal FM 13-XI code to VOSCLIM (VOS Climate Project) standards.
Automated parameters include GPS position & UTC time, 3 hourly ship speed made good, coursemade good & pressure tendency, true wind speed & direction, air temperature & wet bulb temperature,barometric pressure, sea surface temperature, and vessel identification. Through the use of touch screentechnology and an intuitive software interface, manually observed data such as cloud height and type,present and past weather, wave conditions and ice and icing can be added to the FM13-XI ship report.Automated quality control protocols ensure that manual observations are correctly entered.
Corrections for elevation and magnetic variation are made automatically using region detectionalgorithms. Region detection also supports automated reporting modes for Synoptic (6 hr.), IntermediateSynoptic (3 hr.) and Data Sparse (1hr.) reporting regions when required. STORM and SPREP conditions arealso automatically detected and transmitted. AVOS Bridge Touchscreen Interface will be demonstrated.
Session 3 Evaluation (Chair: Mr Steve Cook)
14. RESULTS OF FIELD TESTS OF THE NEW XCTD-2Tomowo Watanabe1 and Michio Sekimoto2
1 Tohoku National Fisheries Research Institute2 Tsurumi Seiki Co., LTDEmail: [email protected]
ABSTRACT:
The eXpendable Conductivity, Temperature, and Depth profiler for temperature and salinityobservations to a depth of 1,850 m (XCTD-2) was tested during the MR01-K04 cruise of the research vesselR/V MIRAI in the summer of 2001. The new, deep–water probe was recently developed by the Tsurumi-Seiki Co., LTD. Field tests of the XCTD 2K are indespensible for determining the depth-time equation forpractical use. On the cruise, 12 probes were launched during CTD up-casts at 11 CTD stations. Successfulobservations were collected to a depth of 1800 m by 9 of the 12 tests. By using the 9 pairs of XCTD and

CTD profiles, the depth-time equation was estimated as D = 3.4005t-3.2x10⁻⁴t2 , where D is the depth inmeters and t is the elapsed time after the probe hits the sea surface. The temperature and salinitydifferences from CTD observations in the deep layer of 1000m to 1500m were -0.0010C and -0.008psurespectively. Standard deviations were 0.0180C and 0.013psu. These values indicate improvement of theXCTD system.
15. EVALUATION OF DATA FROM A PILOT FIELD EXPERIMENTT UTILIZING SEAKEEPERSAUTOMOATED DATA COLLECTION AND TELEMETRY SYSTEMS ON A GROUP OF VESSELSGeoffrey K. Morrison, Edward J. Kearns, Christine Caruso-Magee and Rod G. Zika,InternationalSeaKeepers SocietyEmail:[email protected]
16. THE ACCURACY OF VOLUNTARY OBSERVING SHIPS' MARINE METEOROLOGICALOBSERVATIONSElizabeth C. Kent and Peter K. Taylor, Southampton Oceanography Centre, U.K.Email: [email protected]
ABSTRACT:
Typically the merchant ships of the Voluntary Observing Ships scheme are recruited by a PortMeteorological Officer at a port which the ship frequently visits. The observing practises and meteorologicalinstruments provided depend on the recruiting country and are often very basic. Indeed, the VOS systemwas primarily designed to aid weather forecasting, while climate change studies require higher quality data.A better understanding of the error characteristics of the VOS data is now needed for both data assimilationand climate studies.
Using sea and air temperatures as an example, this talk will show how the large random errorspresent in the data can be quantified. Determining the smaller, systematic biases is more difficult becausecorrelations exist between the different variables and their respective errors. For example, the error in SSTdata measured using buckets is likely to depend on the air - sea temperature difference, and hence on bothsea and air temperatures. Surprisingly the scatter in the air temperature data seems to vary with how theSST is measured, probably because the observing practises strongly depend on recruiting country. Bytransforming the data to form new variables which are uncorrelated, the systematic errors can be properlyestimated and then transformed back in terms of the observed quantities. The results suggest that, whileSST data from engine room intake (ERI) thermometers are very scattered, any mean bias is small. Incontrast, while bucket SST data is less scattered, it is biased cold in regions of high heat flux. Previously ithad been assumed that ERI data were biased warm.
Improving the quality of future VOS data requires fuller information on instrumentation and observingtechniques, and the implementation of good observing practises. These are goals of the WMO sponsoredVOS subset for climate (VOS-Clim). Eventually it is hoped to introduce better instrumentation. For example,hull contact SST sensors installed with acoustic data transmission rather than cables. The IMET project atWoods Hole Oceanographic Institute and the AutoFlux system (developed by SOC with European partners)are prototypes for future VOS instrumentation systems.
17. EVALUATION OF XBTs AND XCDTS IN SEA TRIALSRick Bailey, Lisa Cowen, CSIRO/BMRC JAFOOSKen Ridgway (CSIRO)Email: [email protected]
Session 4 Scientific and operational applications (Chair: Mr Jean-Paul Rebert)
18. APPLICATIONS OF UPPER OCEAN THERMAL DATARick Bailey , CSIRO/BMRC JAFOOSEmail: [email protected]

19. EUCOS, AN OCEAN OBSERVATION STRATEGY OVER THE NORTH ATLANTICFrançois Gérard, Météo-FranceEmail: [email protected]
ABSTRACT:
The European meteorological services member of EUMETNET have established a strategy for thedefinition, implementation and operations of the surface based observation systems of interest for weatherforecast over Europe. From 1999 to 2001, the EUMETNET Composite observing system (EUCOS)implementation programme has worked on network evolution scenarios to implement the strategy. Thepresentation will present the oceanic part of the scenario adopted at the end of the EUCOS programme. Itwill be shown that the use of sensitivity tools enable to issue clear requirements for the operation deploymentof marine platforms like ASAP ships, VOS and buoys, in order to target the observation over the mainsensitive areas. The fesibility of such targeting will be shown through the results of an experiment performedin September 2001with the European ASAP ships.
1
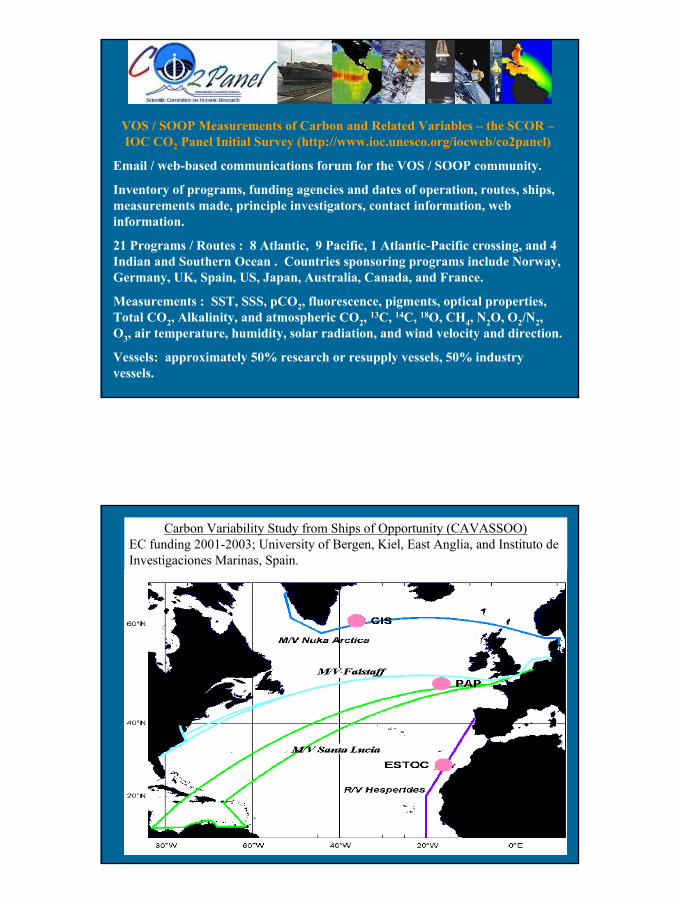
VOS / SOOP Measurements of Carbon and Related Variables – the SCOR –IOC CO2 Panel Initial Survey (http://www.ioc.unesco.org/iocweb/co2panel)
Email / web-based communications forum for the VOS / SOOP community.
Inventory of programs, funding agencies and dates of operation, routes, ships, measurements made, principle investigators, contact information, web information.
21 Programs / Routes : 8 Atlantic, 9 Pacific, 1 Atlantic-Pacific crossing, and 4 Indian and Southern Ocean . Countries sponsoring programs include Norway, Germany, UK, Spain, US, Japan, Australia, Canada, and France.
Measurements : SST, SSS, pCO2, fluorescence, pigments, optical properties, Total CO2, Alkalinity, and atmospheric CO2, 13C, 14C, 18O, CH4, N2O, O2/N2, O3, air temperature, humidity, solar radiation, and wind velocity and direction.
Vessels: approximately 50% research or resupply vessels, 50% industry vessels.
Carbon Variability Study from Ships of Opportunity (CAVASSOO)EC funding 2001-2003; University of Bergen, Kiel, East Anglia, and Instituto de Investigaciones Marinas, Spain.

2
NOAA Underway pCO2 Programs – Atlantic Oceanic and Meteorological Laboratory and the Pacific Marine Environmental Laboratory
Océan Indien Service d'Observation (OISO)Institut National des Sciences de l’Univers, Institut Francais pour la Recherche et Technologie Polaires, Institut Pierre Simion Laplace, et University Pierre et Marie Curie.

3
Geochemistry, Phytoplankton and Color of the Ocean (Gep&Co)
Objectives: To describe the space and time variability of the composition of the phytoplankton over a wide range of oceanic conditions; To understand how oceanic conditions control this variability; and To build a database of field observations for the retrieval of some main phytoplankton groups using sea color detected from satellites.Ship: Merchant ship Contship London Route: Le Havre (France) to Nouméa (New Caledonia) via New York, Panama, Tahiti and Auckland, every three months.
Status: Gep&CO started in November of 1999, and was scheduled for 3 years. At present, 10 cruises have been made, and the last two are scheduled in April and July of 2002.
Panel Projects for VOS / SOOP
To complete the initial inventory of carbon and related measurements from VOS / SOOP;
To bring these groups together into a ‘virtual’ forum to exchange information and data;
To develop intercalibration projects and agreements on the use of certified reference materials where needed;
To encourage the closer coordination of VOS / SOOP measurements with other observation programs such as hydrographic sections and time series stations;
To encourage the further development of automated measurement techniques for a suite of ocean carbon and related variables, including ocean color.

An Automated Ocean and Weather Monitoring System for Use on VolunteerObserving Ships (VOS)
Tom Houston, Geoffrey K. Morrison, Cynthia Moore and Rod G. ZikaThe International SeaKeepers Society
4600 Rickenbacker CausewayMiami FL 33149
www.seakeepers.com
The International SeaKeepers Society has designed an autonomous oceanographic andmeteorological monitoring system which can be deployed on a wide variety of platforms tocollect data for marine weather forecasting and oceanographic research. The compactmodular system has been deployed on yachts, cruise ships, commercial vessels, researchships and piers. Low energy-demand systems are being developed for use in buoys, inpartnership with the National Data Buoy Center of the National Oceanographic andAtmospheric Administration (NOAA). These are expanding the VOS network with reliable,timely and accurate reports every three hours by INMARSAT Standard C telemetry, andcollecting data on oceanographic conditions, stored every minute. The system carries astandard suite of sensors, and can accommodate specialized sensors for focused researchproblems. The society has invited instrument manufacturers, academic faculty , governmentagencies and other organizations to design sensors and experiments utilizing the SeaKeeperscapabilities for low-cost world-wide environmental research..
The monitoring system, shown in Figure 1, is housed two NEMA-4 stainless steel enclosuresto facilitate installation in a variety of configurations. The smaller module contains thecomputer, the INMARSAT transceiver and the power supplies. The second module has thepump, a distribution manifold, and mounting brackets for up to five instrument packages.The modules are each 16 inches wide, 10 inches deep and 18 inches/30 inches high.
Figure 1. The Ocean and Weather Monitoring System. The standard system is shown infigure a, and the instrument module with an expanded suite of sensors in b.
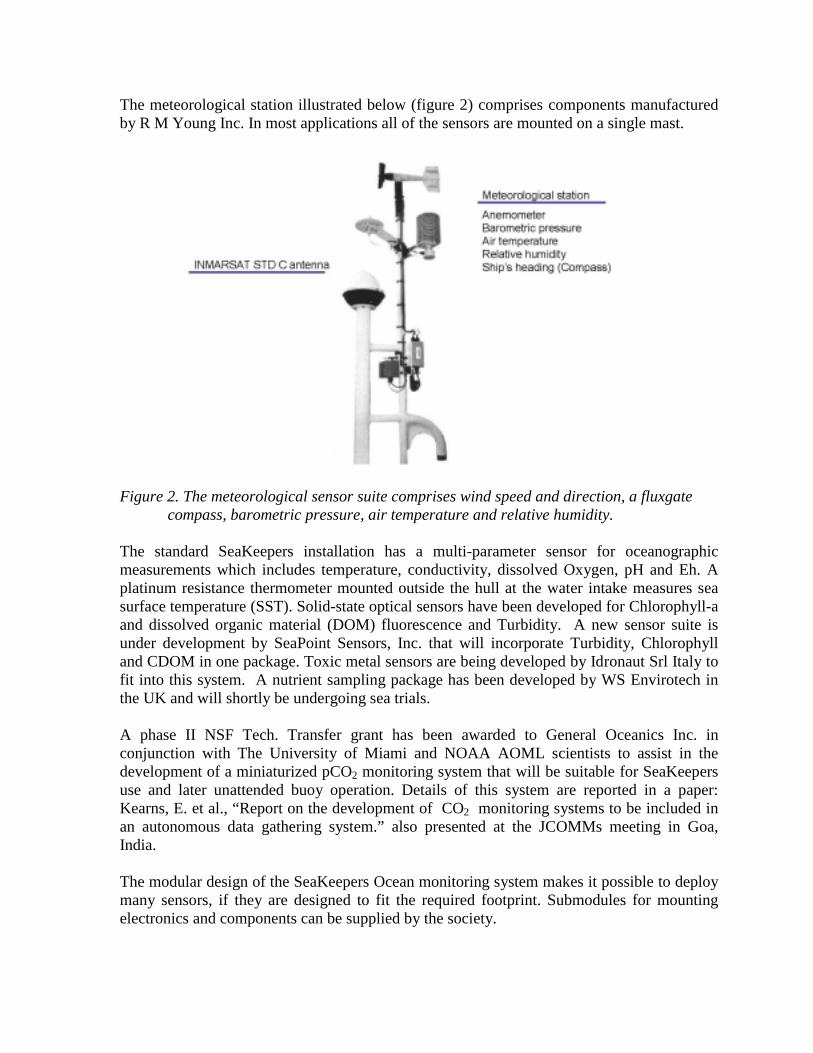
The meteorological station illustrated below (figure 2) comprises components manufacturedby R M Young Inc. In most applications all of the sensors are mounted on a single mast.
Figure 2. The meteorological sensor suite comprises wind speed and direction, a fluxgatecompass, barometric pressure, air temperature and relative humidity.
The standard SeaKeepers installation has a multi-parameter sensor for oceanographicmeasurements which includes temperature, conductivity, dissolved Oxygen, pH and Eh. Aplatinum resistance thermometer mounted outside the hull at the water intake measures seasurface temperature (SST). Solid-state optical sensors have been developed for Chlorophyll-aand dissolved organic material (DOM) fluorescence and Turbidity. A new sensor suite isunder development by SeaPoint Sensors, Inc. that will incorporate Turbidity, Chlorophylland CDOM in one package. Toxic metal sensors are being developed by Idronaut Srl Italy tofit into this system. A nutrient sampling package has been developed by WS Envirotech inthe UK and will shortly be undergoing sea trials.
A phase II NSF Tech. Transfer grant has been awarded to General Oceanics Inc. inconjunction with The University of Miami and NOAA AOML scientists to assist in thedevelopment of a miniaturized pCO2 monitoring system that will be suitable for SeaKeepersuse and later unattended buoy operation. Details of this system are reported in a paper:Kearns, E. et al., “Report on the development of CO2 monitoring systems to be included inan autonomous data gathering system.” also presented at the JCOMMs meeting in Goa,India.
The modular design of the SeaKeepers Ocean monitoring system makes it possible to deploymany sensors, if they are designed to fit the required footprint. Submodules for mountingelectronics and components can be supplied by the society.

One of the advantages of utilizing yachts as one component of the VOS network is theopportunity to sample less frequented ocean regions. Figure 3 illustrate the cruise tracks of30 SeaKeepers member vessels for 2001. The number of vessels equipped with the OceanMonitoring system continues to grow.
Figure 3. Cruise tracks year 2001
Figure 4 illustrates in a cartoon how the data is transferred and handled at the University ofMiami prior to distribution to the US National Weather Service via GTS. As the data volumeincreases we anticipate requiring a full time group of data managers in this area.
Figure 4. Data handling

A spin off from the above system is the creation of an automated weather station that can bereadily installed upon any vessel and will fulfill and exceed the VOS ship requirements whilelogging a high resolution data set for later use. In an effort to develop another source offunding for the Society, the Society is now offering an Automated VOS station which isdescribed in the attached brochure. As well as providing 8 3 hourly observations per day thissystem will telemeter observation times and positions, while providing an elegant display onthe vessels networked computers.
This project represents as unique collaboration between:
The International SeaKeepers Society, a not-for=profit organizationThe National Oceanographic and Atmospheric Administration, US governmentThe University of Miami, Rosenstiel School of Marine and Atmospheric ScienceGeneral Oceanics Inc., a US corporationIdronaut Srl, an Italian manufacturerSeaPoint Sensors Inc, a US corporationWS Envirotech, a UK manufacturer
The International SeaKeepers Society has proved that a small determined group of peoplecan make a significant impact on the volume and frequency of marine observations.

Data transmissions include vessel positioutilized to facilitate better fleet planning. Tis based upon the International SeaKeepeextensively field tested for the last three ye
The package includes the weather stationtransceiver and a sea surface temperatucoaxial cable to the antenna, and 0.25 inchmast and to the sea surface temperature pto connect the system the vessel’s compute
As an option, system can also provide bi-dcrew with true global coverage.
The International SeaKeepers SocietyAutomated Volunteer Observing Ship(VOS) Meteorological Station.
Met sensors and INMARSAT C antenna
Collect data to the quality required by theNational Weather Service WorldMeteorological Organization, and GlobalOcean Observing System
Data Transmissions will always be madeautomatically without involvement by theship’s crew
Avoid time-consuming manual datacollection and transmissionEliminate transcription errorsImprove marine weather forecastingGenerate a permanent record ofweather conditions on all voyages
n and course over the ground, which may behe automated VOS meteorological station whichrs Society’s Ocean monitoring module has beenars; providing data of exceptional quality.
, a NEMA4 enclosed computer, INMARSAT Cre probe. Simple installation requires running a diameter cables to sensor locations both on therobe on the hull. An additional cable is requiredr.
irectional email capability (INMARSAT C) for the

Utilizing the vessels computer network any connected computer can access user-friendly datadisplays.
The system further provides a continuous history of weather conditions during the voyagethat can be displayed on the ship or sent to headquarters
A plot of barometric pressure, air temperature and water temperature from Saturday at 0300 until Sunday at midnight
Sensor specifications
Variable Units Range Accuracy ResolutionSea surface temperature ° Celsius -3 to 50 °C ± 0.01 °C 0.001 °CAir temperature ° Celsius -50 to +50 °C ± 0.3 °C 0.1 °CRelative humidity % 0 to 100 % ± 3 % 0.1 %Wind speed Knots 0 to 120 Knots ± 1 Knot 0.1 KnotsWind direction Degrees 0 to 355 Degrees ± 3 Degrees 0.1 degreeBarometric pressure h Pascals 800 to 1100 hPa ± 2 hPa 0.1 hPaCourse over ground Degrees 0 to 359 Degree ± 3 degrees 1.0 degreeSpeed over ground Knots 0 to 100 knots ±0.5 knot 0.1 KnotLatitude Degrees -90 to +90 <±0.001min 0.0001minLongitude Degrees -180 to +180 <±0.001min 0.0001minUTC time HH:MM:SS 0 to 24 hours ±0.013 sec 0.001 sec

Page Page Page 111
Goa 26/02/02 1
Ship Automatic Weather Stations
Goa 26/02/02 2
Vaisala experience
First Ship applications during 80’sFrom 1986 to 1992, Vaisala supplied thirteen Ship AWS’s to Canada.Some 27 Ship AWS’s have been supplied to DWD in Germany during 90’s.4 full automatic AWS with optical sensor to Norwegian Coast Guard in 2001Total installed base of over 80 systems.
• Research ships, Icebreakers, Cruise Ships, ASAP Ships, Military Ships
• Finland, Germany, Sweden, Russia, USA, Norway, Spain, France, China, Italy, Ireland

Page Page Page 222
Goa 26/02/02 3
Ship AWS features
Interfaces for GPS navigation and ship’s LOG system.True wind calculations.Automatic message coding and transmission via satellite ( Meteosat, GOES, GMS, Inmarsat-C).NMEA compatible input / output.Reliability in a demanding environment.
Goa 26/02/02 4
Technology
Vaisala Milos AWSFlexibility of the system
• third party hardwareFlexibility of the software
• calculations, reports, serial interfacesWorldwide support Quality / Standards
• international standards (CE, IEC, MIL )Proven performance
• > 2000 systems in operation

Page Page Page 333
Goa 26/02/02 5
Overall system
Automatic measurementsPressureTemperature and HumidityTrue wind speed and directionSea temperature (if fitted)
Manual inputCloud and visibilitySea state, Ice etc.Present/past weather
Goa 26/02/02 6
Overall system options
Optional automatic measurementsCloud base Present weather Precipitation Several Solar radiation
- Global, Albedo, UV, IR PrecipitationRain Duration Sunshine durationMultiple wind sensors

Page Page Page 444
Goa 26/02/02 7
Vaisala Ship AWS
Australian Bureau of Meteorology Ship AWS
Vaisala Melbourne
Goa 26/02/02 8
Project Goal
In 1997 Vaisala and Bureau of Met jointly commenced work on Ship AWS.
• Initially developed to collect Weather information across Bass Strait.
To provide a cost effective alternative to existing platformsIdentify a cheaper method of transmitting Met dataTo transmit the data back real time to the regional forecasting centre.To send all Met data via the same communication structure.

Page Page Page 555
Goa 26/02/02 9
System Features
Automatic measurement of Wind, Pressure Temperature and Relative Humidity Calculation of True Wind, Wet Bulb Temperature, 2 minute & 10 minute statisticsLocal display of Real Time dataAutomatic Coding of SYNOP message
Cost effective Transmission of SYNOP message via satellite
Local storage of SYNOP & 10 minute data
Goa 26/02/02 10
System Layout In Met Bureau applications
MILOS 500
STATUS
RESET
RESET
STATUS
STATUS
ER ROR
FULL
CHARGING
AC ON
MILOS 500Data Collectionand ProcessingSystemINSIDEBOX50SEquipmentEnclosure
Wind VaneWAV 151
AnemometerWAA 151
Cross ArmWAT 12
HMP 45AHumidity probe ANDRosemount ST 2401temperature probeINSIDEDTR 13 screenRadiationShield
BRIGHTNESS
BarometricPressuresensor
PTB 220ABarometric pressuretransmitter installedinside 19” rack.
NMEA 0183Compass data
Satcom C terminal
Bridge Console
Bridge

Page Page Page 666
Goa 26/02/02 11
Displays - Real-time View
30s
2s
60s
30s
Goa 26/02/02 12
Displays - Editing Template

Page Page Page 777
Goa 26/02/02 13
Sample messagesBBXX VLST 24174 99383 31448 46/// /0124 10118 20094 30202 40233 52008 22224 85105
BBXX VLST 24184 99381 31449 46/// /0123 10117 20088 30203 40234 52010 22284 85101
BBXX C6CN4 25214 99183 31678 46/// /0514 10238 20220 30076 40099 52017 22243 85225
BBXX C6CN4 26034 99198 31677 46/// /1807 10233 20213 30059 40082 57019 22243 85219
Goa 26/02/02 14
Communications
Satcom C (Data reporting mode)- Cost effective, Global Coverage- Ability to send a full ships Obs.
message.

Page Page Page 888
Goa 26/02/02 15
Communications
The message reported is a binary version of the full ship message.The data is sent via Inmarsat C using the data reporting mode, which reduces the running costs. The data is sent to the Bureau via the Perth Land Earth Station.The data is decoded within the Bureau and is then placed on the GTS as a full Ship message.
Goa 26/02/02 16
Current communications costs In Australia
Data reporting mode costs 6 cents per packetAutomatic observations use 3 packets (18 cents)Manual observations use 5 packets (30 cents)On average, there is usually one manual obs & 23 automatic ones daily (AUD$4.44 per day)Annual cost is about AUD$1620 for 8395
automatic messages and 365 with manual input

Page Page Page 999
Goa 26/02/02 17
Bureau Installations
Bureau currently has six systems in full operation.
- Austral Leader (VNRA)- Iron Yandi (VNVR)- Ormiston (VJIK)- Pacific Sky (GYYP)- Portland (VNAH)- Spirit of Tasmania (VLST)
Goa 26/02/02 18
Bureau Installations - Observations

Page Page Page 101010
Goa 26/02/02 19
Spirit of Tasmania
Goa 26/02/02 20
Spirit of Tasmania

Page Page Page 111111
Goa 26/02/02 21
Pacific Sky
Goa 26/02/02 22
Ormiston

Page Page Page 121212
Goa 26/02/02 23
For Consideration...
Real Time NMEA output to ships Map systemVariable data transmission intervals
- currently 1, 3 or 6 hour- position based
Local storage of data for VOSCLIM requirementsData Delivery methods - e-mail etcOperation in other areas of the world
• Global coverage

Page Page Page 111
2002-02-21 / EEJ
DEVELOPMENT IN VAISALA'S ASAP EQUIPMENT
2002-02-26JCOMM / SOT
Scientific and Technical WorkshopGoa, India
Erkki JärvinenBusiness Unit Manager, Sounding Equipment
Upper Air DivisionVaisala
2002-02-21 / EEJ
Contents
• Vaisala ASAP Equipment• ASAP Launcher• DigiCORA III features
• Windfinding methods• Automatic Loran-C Chain Selection• On the Windfinding Accuracy• GPS Performance Improvement
• RS90• New concept for observations over the oceans
• Data as a product
Page Page Page 222
2002-02-21 / EEJ
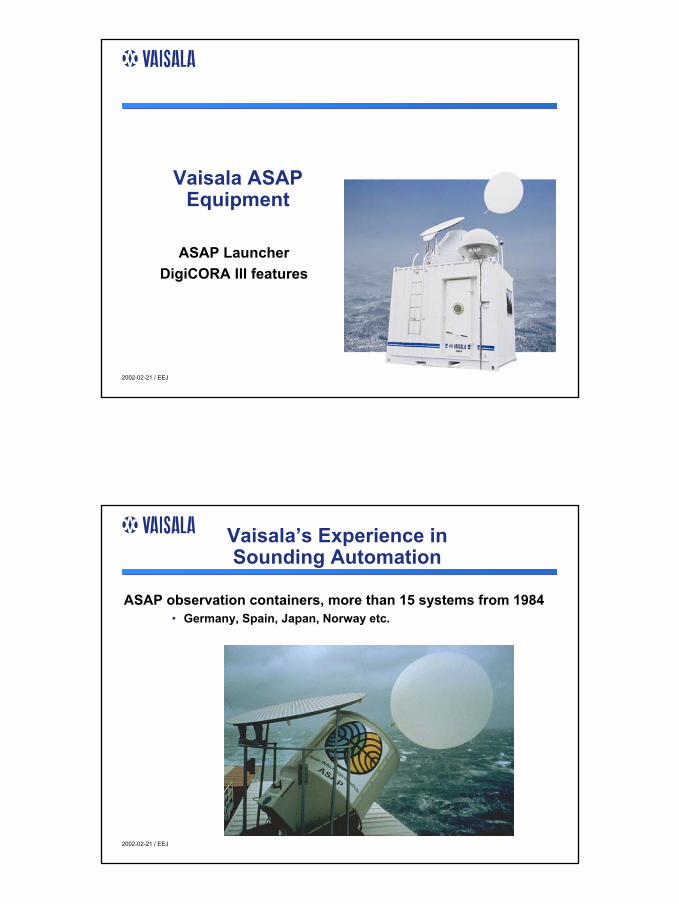
Vaisala ASAP Equipment
ASAP LauncherDigiCORA III features
2002-02-21 / EEJ
Vaisala’s Experience in Sounding Automation
ASAP observation containers, more than 15 systems from 1984• Germany, Spain, Japan, Norway etc.

Page Page Page 333
2002-02-21 / EEJ
ASAP Launcher Construction
2002-02-21 / EEJ
ASAP System Overview (GPS)

Page Page Page 444
2002-02-21 / EEJ
DigiCORA III Standard Software
• PTU and wind data collection,processing and archiving
• Message creation editing anddelivery including:
• TEMP, PILOT, BUFR,• CLIMAT TEMP• Inmarsat-C satellite transmission
• Access to software functionality according to user level• All user prompts can be translated / localized• Remote use: DigiCORA III with Windows operating system can be remotely controlled from another PC• Stable and robust software design
2002-02-21 / EEJ
DigiCORA III in ASAP
Easy to use compared to existing ASAP installation:• Automatic Loran-C chain selection• Possibility to use Inmarsat C
• Inmarsat C coordinates are fed to the system automatically• Compared to DCP, does not loose data in compression• Compared to DCP, the data transmission is 100% vs. 80%
• Various possibilities for messaging: TEMP, BUFR• In next SW-releases:
• Possibility to feed the surface pressure automatically, P-value from radiosonde or from AWS.
• Even more versatile means for remote control and remote maintenance than currently.
• CREX message format

Page Page Page 555
2002-02-21 / EEJ
Windfinding methods
Automatic Loran-C Chain SelectionOn the Windfinding Accuracy
GPS Performance Improvement Project
2002-02-21 / EEJ
Why Loran-C windfinding
Advantages• Low cost radiosonde • Accurate
• Loran-C accuracy meets numerical forecast requirements
• Available in Northern Atlantic (evaluation with Sealand Achiever WPKD)
Limitations• Regional coverage• Sounding geometry must be taken into
account: Automatic chain selection is the answer
• Future of Loran-C is at stake

Page Page Page 666
2002-02-21 / EEJ
Loran-C and Chayka Coverage
---150150150 ---100100100 ---505050 000 505050 100100100 150150150
---808080
---606060
---404040
---202020
000
202020
404040
606060
808080
444333 333 333 444 444 777 777 444 333 333
333 333 333 444 555 555 333 444 555 555 444 444 444 555 666 999 121212111111 666 666 555 333333 333 333 555 555 666 777 888 666 777 666 444 555 555 555 333 444 666 777 141414161616161616131313 777 666 555333 333 333 333 666 777 999 999 111111101010 999 999 999 777 777 444 333 777 777 555 555 666 777 111111151515161616171717141414131313 777 555
777 777 111111101010111111131313121212121212111111101010111111 999 777 555 333 666 666 666 444 888 888 777 444 555 888 121212151515151515141414141414131313 999 777666 444 444 555 888 888 101010 999 121212121212131313101010111111101010101010 999 777 777 555 333 777 444 555 666 888 888 101010 888 777 666 444 333 333 101010111111131313131313131313 888 666 666 555666 777 666 999 999 111111 999 101010111111111111 999 888 777 666 999 666 666 666 555 666 555 777 666 777 777 777 101010151515111111 666 666 666 666 444 444 777 777 777 777 777 777 777 777777 777 666 666 999 999 888 777 777 888 777 555 444 333 555 555 333 333 333 777 777 999 777 888 999 999 121212111111131313121212111111 999 777 666 333 333 333 444 333 555 666 666 888 777 666 777555 555 555 666 666 666 666 777 555 444 555 777 777 888 888 888 121212121212131313111111101010 999 666 444 555 555 444 444 444 333 333 555 444 444 666 555 777555 555 555 444 333 444 333 333 555 555 888 888 888 999 999 999 101010 888 888 777 777 777 555 555 444 444 444 333 333 333 444
333 555 888 101010101010 999 999 888 888 888 888 888 777 777 777 555 555 444 444 444 444 333 333 333 333 333 333666 666 666 666 888 888 888 555 555 555 555 444 444 444 333 333 333 333 333 333 333 333 333 333 333
NOTICE: This is an estimate of the expected coverage
Station Availability, accuracy -1+2 stations
2002-02-21 / EEJ
Automatic Loran-C Chain Selection
• Automatic Loran-C Chain Selection selects the best two chains out of four predefined alternatives to be used in the sounding before the sounding starts.
• The selection is based on station geometry and signal quality
• To get the best possible sounding geometryfor each launch.
• To increase reliability of soundings.• Disturbances in signal quality (distant chains).• Unpredictable maintenance breaks.
• To simplify operator’s work.

Page Page Page 777
2002-02-21 / EEJ
Windfinding Accuracy, Summary
Windfinding accuracy• GPS Vaisala RS80/RS90 GPS is a very
accurate reference with errorless than 0.3 m/s
• Loran-C Loran-C system provides about1 m/s accuracy which degrades atranges exceeding 150 km
• Radar Accuracy depends on the range. At short range (<60 km) more accurate and at long range (>130 km) less accurate than Loran-C.
2002-02-21 / EEJ
Sounding Performance - Synoptical Data
0
1 000
2 000
3 000
4 000
5 000
6 000
7 000
Jan.-00 Jan.-01 Jan.-020.0
1.0
2.0
3.0
4.0
5.0
6.0
7.0
8.0
9.0
Nbr of GPS soundingsMissing GPS winds %

Page Page Page 888
2002-02-21 / EEJ
Vaisala RS90
2002-02-21 / EEJ
RS90 Improved Measurement Performance
• Fast temperature sensor, F- THERMOCAP®
• Accurate temperature sensor with fast response time and minimized solar radiation error
• Shock-resistant pressure sensor BAROCAP®
• Silicon pressure sensor, shock resistant, and offers a fast temperature response
• Fast, defrosting humidity sensor heated HUMICAP®
• Short response time, reduces condensation and icing
• Factory calibration covers a wide measurement range and includes also measurement electronics

Page Page Page 999
2002-02-21 / EEJ
New concept forobservations
over the oceans
Data as a product
2002-02-21 / EEJ
Obstacles for ASAP observations
Common understanding has been for long that more in-situ upper air observations over the oceans are needed.
Common interest and financial resources don’t seem to meet in a timely manner;
• There are difficulties to finance the investments like sounding equipment and automatic launchers.
In addition, running the ASAP-operations - deployment of ships, training of crew, global maintenance etc. - may be slightly out of scope of National Meteorological Services ?

Page Page Page 101010
2002-02-21 / EEJ
Silver Lining
There are promising efforts going on within E-ASAP program to increase the number of ASAP-ships, and to integrate the existing ASAP-systems into the same operation. The finance may still be uncertain.
There are promising efforts going on in order to increase the efficiency by integrating operations within JCOMM/SOT: But whether this leads to increasing number of upper air profiles over the oceans, remains to be seen.
2002-02-21 / EEJ
Data as a Product
For the sake of discussion, there is one more possibility to accelerate the increase of the ASAP-observations over the oceans:Vaisala could be the data provider from a fleet of 25+ ASAP systems, to include
• furnishing ASAP-installations,• taking care of logistics for supporting ASAP-operations,• taking care of maintenance & refurbishment of ASAP
equipment and• providing meteorological messages for GTS for a fee.
Such investment would require that there is a negotiating party or few parties with long-term commitment for such co-operation.Discussion ?

Report on the Development of CO2 Monitoring Systems to be Included in anAutonomous Data Gathering System.
Geoffrey K Morrison1 , Frank Millero1, Flavio Graziottin2, Walter Varda3, Regis Cook3,Richard Wood3 and Rod G. Zika1
The goal of this project was to miniaturize an existing pCO2 monitoring system and it’sattendant water gas equilibrator, for deployment on yachts, buoys and other platforms ofopportunity as a component of the SeaKeepers Ocean and Weather Monitoring System. Therequirements for the system were to develop a small, light weight, energy efficientinstrument package that could be operated automatically for extended periods of time.
The objectives of the first phase, completed six months ago, were:1. to modify a compact, less expensive commercial non-dispersive infrared detector
(NDIR) CO2 sensor to monitor pressure and temperature of CO2.
2. to calibrate and make stability tests for the compact NDIR CO2 sensor
3. to fabricate a miniaturized showerhead equilibrator
4. to perform laboratory bench tests of the new instrument against a reference unit
5. and to perform at sea tests of the new instrument against a reference unit
Figure 1 illustrates schematically the principal components of a pCO2 sensor. A closed loopof air is passed through a equilibrating chamber, where water with the unknown CO2concentration is sprayed from a shower head to maximize surface contact between the waterdroplets and the air. This allows the CO2 concentration in the air to equilibrate with the CO2concentration in the seawater. The air stream is then passed through a (NDIR) to measurethe change in the CO2 concentration in the air. The concentration of dissolved carbon dioxidein seawater is a function of temperature and salinity.
1 The International SeaKeepers Society, 4600 Rickenbacker Causeway, Miami FL 33149 USA2 Idronaut Srl, Milan Italy3 General Oceanics, Miami FL USA

Figure 1. Generalized scheme for measuring pCO2 in seawater.
Stand-alone pCO2 instruments have become common in oceanographic research on the totalcarbon cycle and its implications for global warming.. They typically have been largesystems, requiring large volumes of continuously flowing seawater and high pressurecylinders of calibration gases. Efforts have been underway in our laboratory to reduce thesize and complexity of the instrumentation. Figure 2 shows the equipment used by Millero tomake these measurements on research vessels. The photograph does not show the 40-literwaterfall equilibrator, which is the active part of the system. Although smaller than thoseused by others, it is still considerably larger than the permitted SeaKeepers footprint or thespace available in a monitoring buoy.
Figure 2. Research pCO2 monitoring system for field work.

The SeaKeepers modules were designed to provide a complete monitoring system in acompact modular format, so that sensors could be interchanged as research projects required.The system is contained in two stainless steel NEMA-4 enclosures, which are together 48inches high, 16 inches wide and 10 inches deep. The enclosures can be separated andmounted in a variety of configurations to fit the available space. The instrumentation modulehas a manifold to support five discrete instrument packages in independent submodules of4x8x12 inches (Figure 3). The ultimate goal is to develop a pCO2. sensor that will fit in asubmodule.
Figure 3. Instrument module with pump, manifold and 3 sensor submodules:Turbidity/CDOM, CTD (temperature, conductivity, dissolved oxygen, pH, Eh), and aprototype trace metals analyzer.
An inter-comparison between the “standard” detector (the Li-6262) and the smaller Li-800gas analyzer proposed for this application is shown in figure 4. While it is clear that absolutecalibration shifts are occurring, the similarity in the shapes of the curves and their responsetimes are encouraging.

Figure 4. Intercomparison between the Li-6262 and the Li-800 NDIR detectors
A wide range calibration of the detector yielded a standard deviation of 4.3 micro-atmospheres, which indicates the possibility of achieving the research criterion of +/- 1micro-atmosphere over the more limited ambient observed range. Stability measurementsmade with the smaller detector gave a standard deviation of 1.06, which is again veryencouraging.
Figure 5. Li-800 stability with time. σ = 1.08
The Li-800 NDIR may be adequate for the intended use, and has the advantages of beingsmaller and less expensive than the Li.-6262
There remains an instrumental design problem to be resolved. Water is pumped through thesystem and returned to the source, while air of known concentration is pumped through theequilibrator (Figure 6). It is critical that the water level in the equilibrator remain constant, so

the air circulation is a closed loop. If the liquid level drops in the equilibrator, the system candraw in outside air which can change the concentration of CO2 in the air and the equilibriumvalues of the system, independent of the exchange with the sample water. On the other hand,if the water is allowed to overflow freely with little or no retention time, air will be lost asentrained bubbles. The air loss problem increases in severity and complexity as the volumeof the equilibrator is decreased. It was decided to attempt to design a system which wouldcontinuously control the water level while using bubble traps to minimize bubble air loss.
Figure 6. Schematic of the prototype pCO2 equilibrator.
Figure 7. Equilibrator and control system in SeaKeepers submodule

In a bench top comparison between the research grade instrument and the prototype, responseand tracking appear to be in good agreement (Figure 8). There is a clear calibration offsetand perhaps a systematic drift in the prototype that could be attributable to loss ofequilibrated air and replacement with fresh air. The addition of a water level control in thenext version may resolve these issues.
Figure 8. Bench top comparison of the two systems
During a one week cruise of the R/V F. G. Walton Smith, an informal inter-comparison wasmade between the research grade sensor and the prototype (figure 9).
Figure 9. Field trial of the prototype, compared to a research system.

The results, while encouraging, are far from the desired accuracy of one micro-atmosphere.Additional funding was been obtained to further develop the miniaturized pCO2 analyzer andto deploy it on platforms of opportunity such as SeaKeepers member yachts, piers, buoys andcommercial ships.
Another parameter, besides pCO2, which is routinely measured to characterize the CO2system is total dissolved inorganic CO2 (TCO2). Currently, TCO2 measurements involveacidifying the seawater sample with phosphoric acid and measuring the amount of CO2evolved by either coulometry or infrared detectors. A new and promising technique formeasuring TCO2 has been developed in cooperation between Idronaut Srl, (Milan, Italy) andthe University of Rome (figure 10). The system uses peristaltic pumps to fill a mixingchamber with an unknown sample of seawater. The differential pH sensors are normalized bypassing this sample through both channels. A buffer solution is then added to the sample inone channel, stirred and the change in pH measured relative to the untreated sample. Thevolumes used of seawater and buffer are miniscule,
The differential pH sensors rely upon beautifully constructed capillary electrodes.Differential repeatability to the fourth decimal place has been observed. A unit in the thirddecimal place is equivalent to one micro-atmosphere.
Figure 10. Prototype TCO2 instrument

Figure 11. TCO2 calibration curve

1
Improving The Frequency and Reliability of Global
Meteorological Observations at Sea
byRon Fordyce
andTom Vandall
CanadaEnvironment
Canadian VOS Program…Challenges
Declining number of VOS ships (reports)Smaller crews with higher workloads
Limited PMO resources to manage fleetRequires system standardization to optimize operational
support and increase data quality Requires specialized trainingSignificant time commitment
Human errorQC failure rate of approximately 20%
CanadaEnvironment

2
•
Number of VOS Ships
0
50
100
150
200
250
300
350
1995 1996 1997 1998 1999 2000 2001
Year
CanadaEnvironment
•
Annual Change in Canadian VOS Reports
0
2000
4000
6000
8000
10000
12000
Jan
Feb
Mar
Apr
May
June
July
Aug
Sept
Oct
Nov Dec
VOS
Rep
orts
/Mon
th 1995199619971998199920002001
CanadaEnvironment

3
Canadian VOS Objectives
Increase the frequency and reliability* of VOS reportsDecrease the number of ships
Standardize the fleetImprove data quality
Implement VOSCLIM*Minimize manual requirement*
Reduce QC failure rate*Enhance forecasting capabilities
CanadaEnvironment
Automation… Reliability…WatchmanTM…

4
AVOSTM
• Automatic Voluntary Observing Ship’s System• Automated measurements, reports and telemetry • Reliable Watchman based controller processor• Intuitive image-rich touch-screen Bridge Interface• VOSCLIM sensors• Operates round the clock
CanadaEnvironment
CanadaEnvironment

5
Sensors:
Parameter Sensor Model Range Accuracy Resolution
Wind Direction RMY 05103 360° ±3° 1°
Wind Speed RMY 05103 0 to 60 m/s ±0.3 m/s 0.1 m/s
Water Temperature HATS -10° to +50° C ±0.05°C 0.01°C
Air Temperature Rotronics MP101A-T7 -40° to +60° C ±0.3°C 0.1°C
Relative Humidity Rotronics MP101A-T7 0 to 100 % ±1% 1%
Air Pressure Vaisala PTB210 500 to 1100 hPa ±0.15 hPa 0.01 hPa
Compass Heading KVH C100 360° Compass Swing score dependant
0.1°
CanadaEnvironment

6
AVOSTM Controller ProcessorSetup and configuration from WatchmanTM or Bridge Interface. Includes sensor calibrations (offset and scale factors)
Metadata – sensor type, model #, serial #, calibration due date, location, installer, country, date etc.
SST depth, barometer ht. above SMLL, corrected to SL anemometer(s) ht. above SMLL
Processing - Region detection (auto synoptic modes), pressure correction for elevation, ships speed and course made good (3hr.), true wind from apparent, auto SPREPS and STORM detection and reporting, cont.10 min avgs.
CanadaEnvironment

7
AVOSTM Power & Wiring12VDC from ship mains, 5 day battery backup for AVOS Controller Processor
Bridge Interface ships mains with UPS
All sensors are mounted on AVOS mast (except SST) and powered by controller through communications wiring.
Three serial configuration ports with controller, terminal setup, bridge Interface, and real time winds
INMARSAT C, GPS are mounted on mast.
Installation about 2 days
CanadaEnvironment

8
AVOS™ Bridge Interface SoftwareThe AVOS™ Display Software performs six main
functions:
configuration of the AVOS™ payload, display of AVOS™ payload data, input from users for observed data, data quality control, data archiving, and data transfer to the AVOS™ payload.
CanadaEnvironment
9
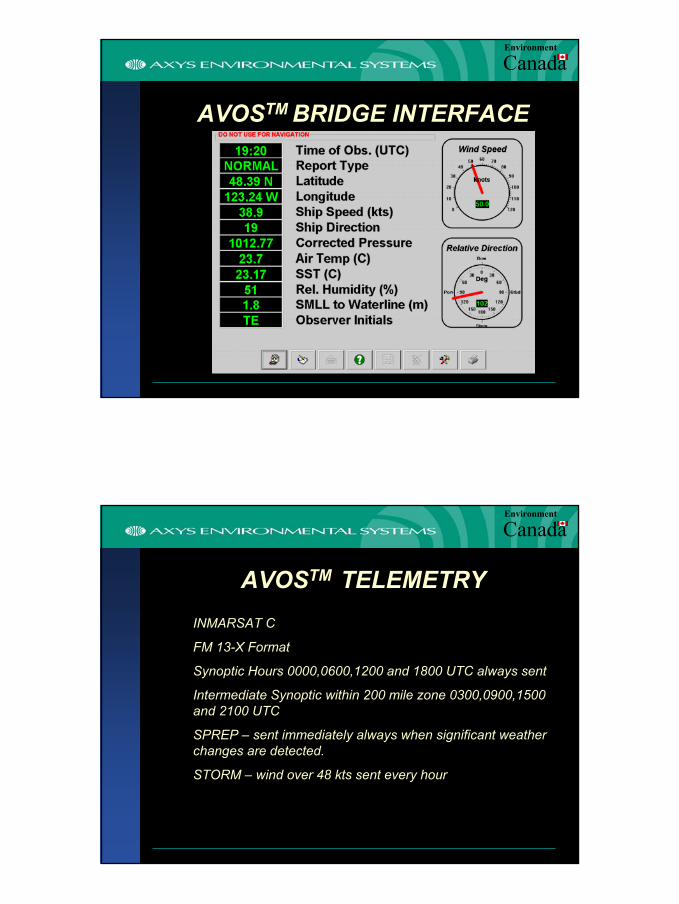
AVOSTM BRIDGE INTERFACE
CanadaEnvironment
AVOSTM TELEMETRYINMARSAT C
FM 13-X Format
Synoptic Hours 0000,0600,1200 and 1800 UTC always sent
Intermediate Synoptic within 200 mile zone 0300,0900,1500 and 2100 UTC
SPREP – sent immediately always when significant weather changes are detected.
STORM – wind over 48 kts sent every hour
CanadaEnvironment

10
IMPACT OF AVOSTM
VOS OBSERVATIONS
0100200300400500600700
Jan
Feb Mar AprMay
Ju
ne July
AugSep
tOct
Nov Dec
# of OBS
Arctic 1995Arctic 2001Sir Wilfred Laurier 2001
CanadaEnvironment
IMPACT OF AVOSTM
The Sir Wilfred Laurier made 1681 VOS reports in the first 3 months of use.
Only 3 Canadian VOS ships have reported over 1600 VOS reports in a 12 month period.
Out of 820 observations on the Arctic in 2001 92% have been made since the recent installation of AVOSTM.
Historically 20% of Canada’s VOS observations have been discarded by QC errors.
No AVOSTM messages have been discarded due to QC
CanadaEnvironment

11
0
200
400
600
800
Arctic 6YR AVG
Arctic AVOS
Laurier 6YR AVG
LaurierAVOS
Aug
Oct
AVOS Results
SIR WILFRED LAURIER 7 Fold IncreaseARCTIC 16
Fold Increase
CanadaEnvironment

12
VOS
In the last few years 92% of the Canadian VOS data was collected by approximately 100 ships.450 reports annually per ship on average.50,000 reports a year.
AVOSTM
75 AVOS ships, 500+ reports a month500,000 reports a yearVOSCLIM
CanadaEnvironment
13 systems in Canada
Canadian VOS Objectivesthr
Increase the frequency of VOS reports50,000 – 500,000
Decrease the number of ships211 - 75
Standardize the fleetAVOSTM
Improve data qualityVOSCLIM
Minimize manual requirement and reduce QC failure rateAVOSTM Reliability
Enhance forecasting capabilities
CanadaEnvironment

Extended abstract for Scientific and Technical Workshop/SOT-1/February 26, 2002
The new OBSJMA
Tadashi ANDO (Japan Meteorological Agency)
1. IntroductionThe Japan Meteorological Agency (JMA) developed a software package on meteorologicalreport compilation for voluntary observing ships (VOSs) named "OBSJMA" in 1997. JMA isnow upgrading the OBSJMA and plans to distribute it among Japanese VOSs. In this report,the present status and future plans on OBSJMA are introduced.
2. Current OBSJMAJMA developed OBSJMA in 1997 for easy and accurate compilation of weather reports andmarine meteorological logbooks recording by using a personal computer. After trial use byseveral ships, JMA has distributed OBSJMA and its operating manuals to about 500 ships. Atevery opportunity, JMA has been making efforts to appeal to VOSs for using OBSJMA: e.g.an article introducing OBSJMA in a JMA's magazine "The Ship and Marine Meteorology".
However, the current OBSJMA has become to be rather old-fashioned because the softwarewas developed on MS-DOS base. For example, keyboard is the only device for data input(i.e. mouse pointer is not available), and it was designed to work on only floppy disk so thatrelevant visual images, such as types of clouds and sea condition, could not sufficiently beincluded.
Under these circumstances, the currentOBSJMA is not popular among JapaneseVOSs. Only 30 or less VOSs haveregularly been using the OBSJMA forsubmitting the meteorological logbooks(Figure 1).
3. The OBSJMA for WINThe JMA is now upgrading the OBSJMAto Windows edition. The new OBSJOM is called "OBSJMA for WIN". One of the majorcharacteristics of the software is that the main screen is designed to be similar to the "Sheetfor Marine Weather Observations" regularly distributed to VOSs by JMA. Observers onboard can easily enter weather data on the screen using the mouse pointer. Figure 2 showsexamples of screens of the OBSJMA for WIN.
The system requirements, functions and the way of distribution of the OMSJMA for WIN areas follows.
Figure 1. Number of ships usingOBSJMA and reports made by OBSJMA
0
2000
4000
6000
8000
10000
1998 1999 2000 2001 year
num ber of
reports
0
10
20
30
40
50
num ber of
ships
num ber of ships
num ber of reports

(1) System requirementsa) Operating System: Windows 95, Windows 98, Windows Me, Windows 2000 and WindowsNT 4.0 for Japanese.b) Memory: 64 MB RAMc) Hard disk: 50 MBd) Distributing media: CD-ROM
(2) FunctionsThe operation of the OBSJMA for WIN is in principle based on that of the current OBSJMAfor MS-DOS. The following functions are added.a) Mouse pointer is available.b) Many color images, such as cloud types, are prepared in the "help" screen.c) All the screens are alternative of Japanese or English and are changeable by clicking.d) Data are archived in IMMT-2 format.e) Meta-data for VOSClim could be input.
(3) Distribution of OBSJMA for WINThe OBSJMA for WIN will be completed in March 2002, and JMA will distribute it toJapanese VOSs. JMA is to write an article to introduce the software package on the magazine"The Ship and Maritime Meteorology" and the JMA's web page for VOSs. In addition, PortMeteorological Officers are to demonstrate the OBSJMA for WIN when they visit VOSs.
4. Future PlanUnfortunately the number of submitted meteorological logbooks are decreasing in Japan. Thedifficulty of weather observation and the decrease of officers/crews are considered to be amajor reason for the decreasing of meteorological reports. JMA expects that the OBSJMA forWIN will contribute to reduce the officers/crews' works of making meteorological reports.JMA will constantly keep on revising the OBSJMA for WIN duly reflecting user's commentsas much as possible.
Recently almost all the shipping companies and many of ships can use internet. JMA plans tomake VOSs available to download the OBSJMA for WIN and relevant documents onmeteorological observation/reports via internet.
In connection with the near future use of the Table Driven Codes CREX/BUFR, JMA isconsidering to add a function to migrate the SHIP messages to CREX/BUFR in the futureOBSJMA without any modification of data entry procedure by officers/crews.

Figure 2. Screens of the OBSJMA for WIN
Data entryscreen
Help screen for cloud type

ARGOS SYSTEM, APPLICATIONS & ENHANCEMENTS
February 2002Christian Ortega
CLSCollecte Localisation Satellites, 8 – 10 rue Hermès,
Parc Technologique du Canal, 31526 Ramonville, Francetel: +33 561 39 47 20 / fax: +33 561 39 47 97 / email: [email protected]
ARGOS SYSTEM OVERVIEW
The Argos data collection and location system wasestablished in 1978 by the National Oceanic andAtmospheric Administration (NOAA, USA), theNational Aeronautics and Space Administration(NASA, USA), and the French space agency (CNES,France). Argos, was developed specifically for scientiststo study the environment.
Argos can locate any platform carrying a suitabletransmitter, anywhere in the world, and collect datafrom sensors connected to the transmitter.
The Argos system is operated and managed by:• CLS, a CNES subsidiary in Toulouse, France• Service Argos, Inc. (SAI), a CLS subsidiary in
Largo, MD, near Washington, DC, USA• worldwide subsidiaries
Over the last 20 years, Argos has evolved continually tokeep pace with the needs of scientific research andapplications dedicated to observing, monitoring andprotecting planet Earth.
Figure 1: Argos is flown onboard the NOAA polarorbiting satellites (5 satellites as of today), and will alsofly on NASDA and EUMETSAT polarorbiting satellites.
ARGOS APPLICATIONS
Half of the Argos system capacity is used for ocean,climate research applications. Many of these data arealso used as input for operational meteorology and, asprogress is made towards an observing system for theoceans, for operational oceanography. Argosapplications also include animal tracking , oil spilltracking, monitoring equipment at sea, hydrology, fishstock management and hazardous cargo monitoring.
OCEAN APPLICATIONS
In the last six years, 5,000 drifting buoys, 1,500 deepfloats, and 300 moored buoys and fixed stations, fittedwith Argos transmitters, have measured the oceancurrents and sent millions of measurements ofatmospheric pressure, wind speed and direction, seatemperature and more. They have been importantcomponents of the operational WWW and WCRPprograms, through TOGA, WOCE and nowGOOS/GCOS, CLIVAR and GODAE programs andexperiments.
ARGOS ON SOOP AND VOS
Argos have been used on ships since 1987 to collectSHIP and XBT observations.Today some 20 ships equipped by French IRD andAustralian BOM-CSIRO are fitted with Argos systems,of which 10 to 12 relay profiles every month.Temperature profiles data are validated by the shipboardsoftware, inflexion points are calculated and coded in anArgos message. Messages are processed, qualitycontrolled by the Argos GTS sub-system and sent toMeteoFrance for GTS insertion. In December 2001, 322XBTs were inserted onto GTS.
Similarly, 4 PAB units from the BOM are sending SHIPobservations. These units combine automaticmeasurements of atmospheric pressure, air and seatemperature, and manually-input observations. Thesedata are validated in Argos centers, coded in SHIP andrelayed to the GTS.

MeteoFrance has developed a basic weather station forVOS called Minos, which collects atmospheric pressureand air temperature. As a major advantage, this low-coststation can be installed in a couple of hours.
Figure 2: Minos : self-contained Argos telemetry stationwith atmospheric pressure, air temperature sensors,GPS, and data display unit for crew members.
ARGOS ENHANCEMENTS
Most fundamental changes are in the satellite segmentand are planned years in advance. Two importantdecisions have been taken regarding the future of theArgos space segment:• CNES has given the go-ahead for development of a
third-generation Argos instrument to enter servicein 2005. This instrument will offer significantenhancements, including better sensitivity, fasterdata transmission, and increased data collectioncapacity.
• CNES and NOAA are consolidating the Argossystem’s global reach by extending theirpartnership agreement to include two new majorpartners: Japan, represented by its national spaceagency NASDA, and Europe, represented byEUMETSAT. Partnership agreement with theBrazilian space agency, INPE, is on its way too.
The current launch schedule for the satellites carryingthe Argos instruments is:
Figure 3: New satellites launches for the Argos systemare already planned until 2012.
TWO-WAY COMMUNICATION
Two-way communication with Argos transmitters, alsoknown as downlink messaging, will start with theADEOS-II satellite, from late 2002.
Typical applications will be switching a transmitter onor off, or modifying a sensor sampling rate.
Users will connect to Argos servers via the web, andprogram the information they want their platforms toreceive. The downlink will also provide uplink messageacknowledgement.
Figure 4: Argos users will send command to theirplatforms through a web interface and the satellite link.
INCREASING DATA BANDWIDTH
The Argos-2 generation, now flying on NOAA-15 & 16,can receive greater than three times more platformmessages simultaneously than previous satellites. Theimprovement is due to a doubling of the number of DataRecovery Units on board the satellite and a tripling ofthe Argos frequency bandwidth. The Argos system in use today includes redundanttransmissions to increase the probability of error-freedata receipt by the satellite. The two-waycommunication capability outlined above will enablethe number of repetitive messages to be reduced by afactor 2 by including an “Acknowledgement” signalwhich will indicate when the data has been successfullyreceived by the satellite. The Argos-3 generation will feature a 4800 bps highdata rate channel, ten times more data transfer than thecurrent channel. This will, for example, match theARGO float data relay requirements in a single satellitepass.

NEW USER INTERFACE, MORE PROCESSINGCAPACITY
New data processing and management systems for theArgos processing centers are being phased in. Thesewill provide:• a more open system that lets users access and
modify platform processing, program characteristicsand access to results, on line
• easier access to results via an improved userinterface.
Figure 9: By mid-2002, Argos users will easily accesstheir results on customized charts through a webbrowser, to see the most recent position or tracks along anumber of days. Users can also download their resultsin spreadsheet.
REALTIME COVERAGE
Argos onboard equipment provides both global coverageof the earth through the store-and-forward mode and realtime regional capability through a “bent-pipe” directreadout mode. CLS and SAI are shortening throughputtime for operational needs, by installing regional stationsworldwide. In January 2002, there were 28 S-bandstations relaying Argos data in real-time.
THE MISSION CONTINUES
Argos has been serving users for more than 20 years, ina spirit of worldwide cooperation. The best example ofthis is the way the system continues to evolve as apartnership between its users and operators. Theenhancements described above will enable the Argosuser community to satisfy increasingly difficult datarelay needs with a proven, reliable and robust datacollection system as Argos continues its Earthobservation and monitoring mission into the nextcentury.
WEB SITES
Argos system description:http://www.cls.fr/http://www.argosinc.com/
30th January 2002
NEW MARITIME SAFETY AND COMMERCIAL SERVICES IN 2002JOINT WMO/IOC TECHNICAL COMMISSION FOR OCEANOGRAPHY AND MARINE
METEOROLOGY (JCOMM) SHIP OBSERVATIONS TEAM.25 February- 2 March 2002, Goa, India
Brief notes on existing services
Inmarsat operates four communication systems Inmarsat A, Inmarsat B, InmarsatC,Inmarsat mini-M and Inmarsat E distress alerting system which are the right choice forsafety at sea and commercial communications.
Inmarsat A is the original analogue Inmarsat satellite communication system thatprovides voice, telex, fax, data (9.6 kbit/sec) and high speed data (56/64 kbit/sec)services. The system is GMDSS compliant and provides telephone and telex distresscalling to a Rescue Coordination Centre.
Inmarsat B is a digital successor to Inmarsat A and offers similar capabilities but withmore efficient use of the resources and low call charges. The system is also GMDSScompliant and provides telephone and telex distress calling to a Rescue CoordinationCentre.
Inmarsat C is a cornerstone of the GMDSS supporting 5 out of 9 communicationfunctions defined in the IMO SOLAS Convention, Chapter IV. It is a packet datacommunication system providing store and forward messaging including e-mailing,distress alerting and distress priority messaging to associated Rescue CoordinationCentres, reception of maritime safety information via the International SafetyNET service,data reporting and polling service. It is also very important that Inmarsat C is used to sendmessages to a short code or two-digit address, e.g. sending meteorological reports,navigational hazards and warnings, request for medical advice and medical assistance,requests for search and rescue assistance and sending ship position reports to shoreauthorities.
EGC SafetyNET provides an efficient and low-cost means of transmitting maritime safetyinformation to vessels at sea and is used by meteorological, hydrographic, search andrescue and coastguard co-ordination authorities. Messages are addressed to ships at seausing IMO defined NAVAREAs/METAREAs, coastal areas or sea areas defined by acircular, e.g. area around vessel in distress or rectangular area.
Inmarsat mini-M is a the smallest, lightweight and cost effective satellite communicationsystem that provides high quality voice, data, fax and e-mail services at the speed of 9.6kbit.sec. It operates via Inmarsat spot beams in four ocean regions like a cellular phonewith maritime coverage. The system is small in size and low weight and can be easilyinstalled on smaller maritime users. Inmarsat Mini-M is not GMDSS compliant and doesnot support safety services.
Inmarsat E is an Emergency Position Indicating Radio Beacon (EPIRB) system whichprovides distress alerting capability via Inmarsat satellites. Distress alerts are handledautomatically and received at associated Rescue Coordination Centres within, typically,two minutes after activation. Inmarsat E EPIRBs have built-in Global Positioning System(GPS) receivers, which provide accurate distress position information and are small andlightweight enough to be installed on smaller vessels. Two Land Earth Stations in eachout of four Inmarsat ocean regions give 100% redundancy in case of failure or outagesassociated with any of the LESs.
The Inmarsat E system supports “Float Free” EPIRBs which incorporate the followingfeatures: integrated GPS receiver which is accurate to within 200 metres; automaticactivation when the EPIRB is hydrostatically released by “floating free”; remote activationand information input from vessels bridge or other manned situation; optional Search andRescue Radar Transponder (SART); optional 121.5MHz locator beacon; high intensity,low duty cycle flashing light.
WHAT IS NEWInmarsat Fleet
Inmarsat Fleet F77, unveiled at Europort exhibition in November 2001, is the first in newfamily of Inmarsat services for the maritime industry in eight years and brings a newdimension to maritime safety. Fleet F77 is the only service that meets the InternationalMaritime Organisation’s latest requirements – IMO Resolution A.888(21) “Criteria for theprovision of mobile satellite communication systems in the Global Maritime Distress andSafety System (GMDSS)”, by providing voice prioritisation and pre-emption.
This essential new prioritisation function comes as standard on Fleet F77 and allows theinterruption and clearing of lower priority communications and routine calls to give way tovoice communication for high priority distress, urgency and safety needs. The ResolutionA.888(21) states that any system being designed for use in the GMDSS after 1 February1999 should be able to recognise the four levels of priority in both ship-to-shore andshore-to-ship directions:- Distress;- Urgency;- Safety; and- Other (general/routine) communications
Rescue authorities calling a vessel equipped with Fleet F77 will always be able to contacta ship, even if the voice or data channel is in continuous use at a lower priority. Not onlywill pre-emption work seamlessly, it will always work in a hierarchical manner:Distress priority P3 call will pre-empt all other communications;Urgency priority P2 call will pre-empt both safety P1 and routine P0 calls; andSafety priority P2 call will pre-empt a routine P0 call.

The introduction of Fleet F77 to the Inmarsat communications portfolio reinforces theircontinued commitment to the provision of international maritime safety. In addition,Inmarsat consistently exceeds the minimum IMO requirement for 99.9% systemavailability for ship-shore distress alerts.
The new IMO criteria were formulated following a maritime rescue incident inNovember 1994. The passenger liner “Achille Lauro” caught fire and sank off thecoast of Somalia. The majority of the passengers (930) were subsequently rescuedby the tanker “Hawaiian King”, and the tanker “Chevron Perth” rescued a further133. Upon being rescued, the survivors were keen to contact family and friends tolet them know they were safe and well. In addition, the world’s press was also keento talk to survivors, to get first-hand accounts of the incident.
The subsequent increase in usage of the Inmarsat A terminal onboard the “HawaiianKing” prevented the Maritime Rescue Co-ordination Centre (MRCC) from contacting theship. The situation was safely resolved by the MRCC using additional Inmarsat safetyequipment, Inmarsat C, to alert the “Hawaiian King” to clear the voice channel on theirInmarsat A for safety communications.
Fleet F77 was at the design stage at the same time that the Resolution A.888(21) wasbeing drafted. Once the new requirements were made clear, Inmarsat incorporated theseinto the design of Fleet F77. Provision of pre-emption in both directions also means thatInmarsat land earth station operators (LESOs), which provide Fleet F77 services, arecapable of offering this valuable safety service.
In addition to an advanced safety service, Fleet F77 will also deliver a wide range ofcommercial communications needs; voice, fax and data services at speeds of up to 64kbit/s, including mobile ISDN and mobile packet data service (MPDS), where users arecharged for the amount of information sent and received rather than the time for whichthey are connected. This will enable mariners to send and receive information on real-time basis, rather than the traditional practice of logging on once or twice a day.
Selection of mobile ISDN or MPDS depends on what a maritime user wants to send orreceive. As a general rule, the mobile ISDN service is best used when transmitting largefiles or if a data speed or of the utmost importance. The MPDS can be more efficient forapplications that are interactive in nature such as e-mail, web or Intranet access.
Fleet F77 supports a range of powerful new applications through its high speed datacapability which include secure access to information online, image transfer, video anddigital image communications. Fleet77 also delivers e-mail, Internet and Intranet accessplus a choice of two fax services. Some of maritime specific applications include graphicalocean charts and weather displays, navigational chart updates, database queries,accessing online safety information, telemedicine, vessel’s telemetry transmission.
Inmarsat mini-CInmarsat mini-C is a low-power and compact communications solution for small vesselmarkets such as fishing vessels, yachting, inland waterways. Mini-C is an evolution of theexisting Inmarsat C technology and supports all standard services combined with asignificantly reduced level of power consumption. Low power consumption also offers thepossibility of using a solar-fed battery power source where required.

Inmarsat mini-C offers two-way messaging and e-mailing, position reporting and polling,ship-to-ship communications. This makes mini-C an ideal portable and inexpensivesolution to fulfill basic messaging, tracking and security communications requirements forsmall maritime users. Mini-C provides ship-to-shore and shore-to-ship telex and e-mail communications,position reporting and tracking applications, short access code address messaging formaritime safety services such as sending meteorological reports to meteorologicalcenters, sending navigational hazards and warnings, request for medical advice andassistance, sending position reports to shore authority.
In future an enhanced Inmarsat mini-C model, to be available in early 2002, will alsoprovide emergency alerting for non-SOLAS ships and reception of maritime safetyinformation via the EGC SafetyNET service. In the merchant marine sector, it can alsodeliver commercial information for shipping and transport companies, fishing andmerchant fleet data applications, anti-piracy and navigation aids. Inmarsat mini-C canalso be installed as supplementary terminals for crew communications, to complementexisting communications services onboard.
Vladimir MaksimovManager, Maritime Safety OperationsInmarsat99 City RoadLondon EC1Y 1AXUnited Kingdom
Tel: +44 20 77281095Fax: +44 20 77281752E-mail: [email protected]

RESULTS OF FIELD TESTS OF THE NEW XCTD-2
Tomowo Watanabe* and Michio Sekimoto**
*Tohoku National Fisheries Research Institute
Shinhama 3-27-5, Shiogama 985-001, Japan
**Tsurumi Seiki Co., LTD
Tsurumi Chuo 2-2-20, Tsurumi-Ku
Yokohama 230-0051, Japan
ABSTRACT
The eXpendable Conductivity, Temperature, and Depth profiler for temperature and salinity
observations to a depth of 1,850 m (XCTD-2) was tested during the MR01-K04 cruise of the
research vessel R/V MIRAI in the summer of 2001. The new, deep–water probe was recently
developed by the Tsurumi-Seiki Co., LTD. Field tests of the XCTD-2 are indispensable for
determining the depth-time equation and evaluating instrument accuracy. On the cruise, 12 probes
were launched during CTD up-casts at 11 CTD stations. By using the pairs of XCTD and CTD
profiles, the depth-time equation was estimated as D = 3.4005t-3.2x10⁻⁴t2 , where D is the depth in
meters and t is the elapsed time after the probe hits the sea surface. The temperature and salinity
differences from CTD observations in the deep layer of 1000m to 1500m were -0.0010C and
-0.008psu respectively. Standard deviations were 0.0180C and 0.013psu. These values indicate
that the XCTD-2 is a useful addition to the XCTD system.
Introduction
The expendable conductivity temperature depth profiler (XCTD) system was developed in the 1990’s and was released for general use for 1000m observation in 1997 by Tsurumi Seiki CO. LTD (TSK). At an early stage, a positive salinity bias and slow adjustment just after launch were recognized as points which should be improved (Mizuno and Watanabe, 1998). TSK has addressed these issues with significant design changes to the original XCTD observation system. TSK also received requests for development of a new model for deeper use and initiated development of an XCTD probe for 2000m observations (XCTD-2).
Field experiments of the XCTD-2 were conducted in the summer of 2001, taking advantage of participation in the MR01-K04 cruise of R/V Mirai conducted by

Japan Marine Science and Technology Center (JAMSTEC). This allowed comparison of profiles observed by XCTD-2 with high precision CTD profiles. The cruise was conducted to revisit the WHP-P17 and high precision CTD observations from the sea surface to the bottom were successfully performed at each station. The purposes of the field tests were to develop a depth-time equation for the new XCTD probe and to evaluate the accuracy of XCTD-2 observations. Design of the XCTD-2 system
The basic structure of the XCTD-2 probe is very similar to the current model for 1000m-observation (XCTD-1) as shown in Mizuno and Watanabe (1998). The major differences are wire length and the wire diameter. The diameter of the wire is 0.07mm, which is 0.02mm thinner than that of the XCTD-1. The length of the wire stored in the canister and the probe are 1200m and 1900m, respectively. TSK estimated that the available observation depth was 1830m at 3.5 kt of ship speed. A highly efficient digital filter was installed in the MK-100 XCTD digital converter, in order to cope with the increased noise introduced by longer data transmission distances. In-situ comparison tests
The MK-100 converter with revised ROM and a PC were placed in a room behind the ship wheelhouse. A hand launcher was installed at the stern, about 50m from the CTD. In order to make XCTD-CTD concurrent observations, the XCTD probes were launched when the CTD-sonde reached a depth range of from 500m to 300m during up-casts. The tests were performed at CTD stations including two training points and nine WHP-P17 revisit stations along the 135°W meridian as shown in Figure 1. The information and results of the observations are summarized in Table 1.
Nine of the 12 tests were successful. One failure was due to operator error, one to hand launcher malfunction, and one to a wire break caused by the ship propeller. Data processing The software for the XCTD observation was a version of the current program revised to allow deeper profiles. Initially, the depth-time equation for the XCTD-1 was used. Later, using the XCTD and CTD profiles obtained at the first training station at 39N, 179W, a temporary depth-time equation was determined according to the method adopted by Hanawa et al. (1995).
Finally, all of the profiles were converted with the temporary depth-time

equation and were then compared with CTD profiles. Again using the method adopted by Hanawa et al. (1995), the final depth-time equation was developed utilizing a comparison to the CTD standard gradient profiles to eliminate temperature errors. The method is based on minimizing the differences between the CTD and XCTD temperature gradient profiles at the center of fixed depth-window intervals. The least squares method was then used to determine the quadratic equation coefficients for each window and the mean of all the values was calculated to determine the general coefficients. Depth-time equation The depth-time equation is in the form, D = at + bt2, where D is the depth in meters and t is the elapsed time in seconds after the probe hits the sea surface. The depth-time equation obtained for each test is shown in table 2. Averaged values of coefficients a and b were adopted for the general equation as described in the section above. The depth-time equation for XCTD-2 was then determined to be:
D = 3.4005t – 3.2x10⁻⁴t2
Figure 2 shows the depth difference of each equation from the averaged equation. The standard deviation of the depth difference at 560 sec (about 1800m by averaged equation) is 14m and difference at 305 sec (about 1000m) is 4.2m. Temperature/salinity comparison
Temperature and salinity profiles for all XCTD-2 data were calculated by using the depth-time equation. Each profile is shown in Figure 3 with the corresponding CTD profile and T-S diagrams are shown in Figure 4. As seen in figure 3, the XCTD-2 profiles follow the CTD profiles well. The temperature and salinity differences averaged for the deep layer from 1000m to 1500m were calculated and summarized in table 2. The mean value of differences was –0.001°C for temperature and –0.008psu for salinity. The standard deviations were 0.018°C and 0.013psu, respectively. These values are better than the initial evaluation of model XCTD-1 by Mizuno and Watanabe (1998). These statistical values meet the specification presented by the manufacturer.
The temperature and salinity sections observed by XCTD-2 along WHP-P17 line from 30°N to 41°N were constructed and are shown in figure 5 and 6. The CTD sections and the difference between the XCTD and CTD observations are attached for comparison. The detailed structure of subsurface temperature fields are captured quite

well by the XCTD-2. As to the salinity field, the structure of the water mass distribution can be evaluated by XCTD salinity section. However, the influence of the variation in accuracy of each probe within the range +/-0.02 appears as an unnatural undulation of the 34.5 psu contour line in the deep layer. The salinity field in the deeper layer where the vertical gradient is small should be interpreted with careful consideration of the accuracy of the salinity measurement of the XCTD. Acknowledgements This study was financially supported by the Ministry of Education, Culture, Sports, Science and Technology under the “SubArctic Gyre Experiment in North Pacific” project. We express our appreciation to Dr. Masao Fukasawa who was the chief scientist of the MR01-K04 cruise of the R/V Mirai. We also wish to thank Captain Akamine and the crew of R/V Mirai for their cooperation with the fieldwork. References Hanawa, K., P. Rual, R. Bailey, A. Sy and M. Szabados (1995): New depth-time equation for Sippican or TSK T-7, T-6, and T-4 expendable bathythermographs (XBT). Deep Sea Res., 42,1423-1451. Mizuno, K. and T. Watanabe (1998): Preliminary Results of in-situ XCTD/CTD comparison test. J. Oceanogr. 54,373-380.

Table 1 XCTD-2 test stations
Station Date (UT) Time Latitude Longitude S/N Depth
TR01S02 2001/07/31 04:43 39- 03.19 N 179- 49.52 W #01075609 1823
TR02S02 2001/08/04 16:03 31- 01.88 N 150- 01.40 W #01075619 -
P17C26 2001/08/06 21:55 30- 00.06 N 134- 59.81 W #01075620 1047
P17C23 2001/08/07 13:12 31- 31.94 N 135- 00.12 W #01075618 1824
P17C21 2001/08/08 00:01 32- 36.53 N 135- 00.71 W #01075615 405
P17C21 2001/08/08 00:11 32- 36.59 N 135- 00.74 W #01075616 1819
P17C18 2001/08/08 15:48 34- 04.47 N 134- 59.78 W #01075612 1810
P17N29 2001/08/09 02:49 34- 59.36 N 135- 01.01 W #01075617 1824
P17N32 2001/08/10 01:26 36- 30.01 N 135- 00.68 W #01075613 1842
P17N35 2001/08/10 18:18 38- 00.34 N 135- 00.99 W #01075614 1803
P17N39 2001/08/11 15:03 39- 37.17 N 135- 01.20 W #01075610 1833
P17N46 2001/08/13 00:29 40- 58.83 N 134- 58.60 W #01075611 1824

Table 2. Depth-time equation for XCTD-2 and temperature and salinity differences between XCTD-2 and CTD observations averaged for the depth range 1000-1500m.
Station Time-Depth Equation Temp. dif. Sal. Dif. S/N
TR01S02 D = 3.40316t-0.00029t^2 -0.010 0.001 #01075609
TR02S02 ---------------------- ------- -------- #01075619
P17C26 ---------------------- ------- -------- #01075620
P17C23 D = 3.43509t-0.00044t^2 0.002 -0.001 #01075618
P17C21 ---------------------- ------- -------- #01075615
P17C21 D = 3.44297t-0.00043t^2 0.004 -0.027 #01075616
P17C18 D = 3.40269t-0.00039t^2 0.021 -0.030 #01075612
P17N29 D = 3.37367t-0.00032t^2 0.018 -0.005 #01075617
P17N32 D = 3.40348t-0.00025t^2 -0.039 -0.010 #01075613
P17N35 D = 3.38351t-0.00027t^2 -0.012 0.013 #01075614
P17N39 D = 3.36603t-0.00023t^2 0.001 -0.017 #01075610
P17N46 D = 3.39365t-0.00030t^2 0.004 -0.017 #01075611
Mean D = 3.40047t-0.00032t^2 -0.001 -0.008
S.D. (0.02565)(0.00008) (0.018) (0.013)

Figure caption Figure 1 Location of CTD/XCTD stations for XCTD-2 tests (●) and MR01-K04 stations (.). Figure 2 Difference from averaged depth-time equation. Figure 3 Vertical temperature and salinity profiles of XCTD-2/CTD. Figure 4 T-S diagrams for XCTD-2/CTD. Figure 5
a) Vertical temperature section along 135W observed by XCTD-2. b) Vertical temperature section along 135W observed by CTD. c) Temperature difference section along 135W, XCTD-2 – CTD.
Figure 6
a) Vertical salinity section along 135W observed by XCTD-2. b) Vertical salinity section along 135W observed by CTD. c) Salinity difference section along 135W, XCTD-2 – CTD.

Figure 1

Difference from averageddepth-time equation
-30
-20
-10
0
10
20
30
0 100 200 300 400 500 600
Elapsed Time(Sec.)
Dep
th(m
)
TRAN1
P17C19
P17C21
P17C23
P17N29
P17N32
P17N35
P17N39
P17N46
Figure 2

Figure 3

Figure 3

Figure 4

Figure 4

Figure 5
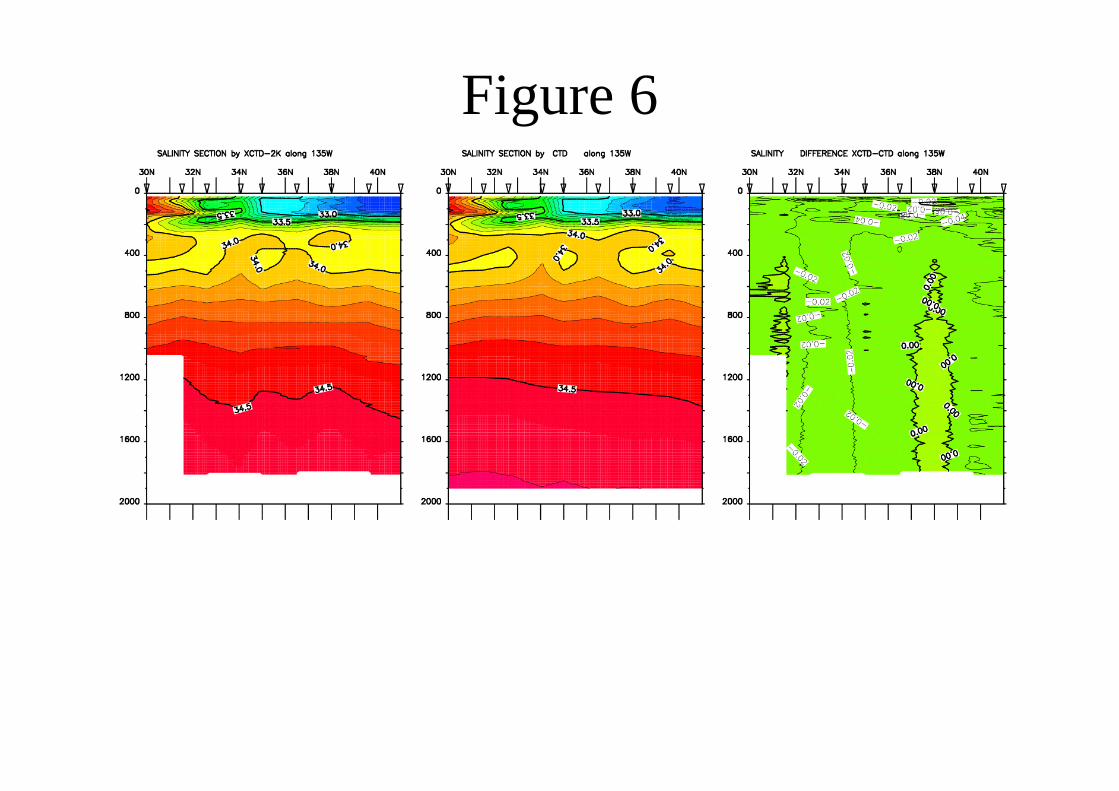
Figure 6

Collection and evaluation of marine observations from the International SeaKeepersSociety Autonomous VOS Fleet
Edward J. Kearns1, Steven Browdy, Rupert Minnett, Christine Caruso-Magee, Geoffrey K.Morrison and Rod G. Zika
The non-profit International SeaKeepers Society was founded by environmentally mindedowners of large yachts. They had a strong interest in the health of the oceans and waterways,and were willing to equip their personal vessels with instruments to contribute to scientificresearch. The autonomous Ocean and Weather Monitoring system collects and transmitsweather information and sea surface temperature (SST) every three hours to NWSTG for useby the National Weather Service for forecasting. More extensive data: temperature,conductivity, dissolved oxygen, pH, and Eh, together with relative wind speed and direction,air temperature, relative humidity, barometric pressure, ships position, speed and heading arerecorded to the computer hard drive every minute for later downloading to the SeaKeepersdatabase. Today, with the continued support of our founding members, we are becominginvolved in equipping commercial vessels, cruise ships, piers and buoys with autonomousocean and weather monitoring systems.. The data described in this paper are heavilyweighted toward cruise ships which operate 24 hours per day and 7 days per week.
The instrumentation installed upon all of these vessels and observing platforms is essentiallyIdentical. Figure 1 shows the components of the system. The computer and instrumentmodules are stainless steel NEMA-4 enclosures, which can be mounted in a variety ofconfigurations. An INMARSAT std-C transceiver is housed in the computer module. Thesoftware collects the data and automatically sends a data message which encodes the 10minute average immediately before the transmission time for each reporting sensor and sendsit to the SeaKeepers data center at the University of Miami.
Thru hull water intake scoop
~~~~~~Seawater discharge
5/8” Teflon-lined SS hose
Meteorological sensors
INMARSAT-C Antenna
Computer Module
Instrument Module
Coaxial antenna cable
Vessel LocalArea Network
SEAKEEPERS SYSTEM COMPONENT SCHEMATIC
Figure 1. Schematic of the SeaKeepers Ocean and Weather Monitoring System. 1 University of Miami, 4600 Rickenbacker Causeway, Miami FL 33149

FFrroomm sseelleecctteedd vveesssseellss ((1133 oouutt ooff 4400++ aatt tthhee ttiimmee ooff tthhiiss rreeppoorrtt)),, aa ssuubbsseett ooff tthheessee ddaattaa aarreeffoorrmmaatttteedd iinn ssttaannddaarrdd WWMMOO FFMM--1133 aanndd FFMM--6622 mmeessssaaggeess aatt RRSSMMAASS aanndd sseenntt ttoo NNWWSSTTGG,,aanndd tthheenn rroouutteedd ttoo GGTTSS aanndd ootthheerr llooccaattiioonnss.. FFiigguurree 22 sshhoowwss tthhee ppoossiittiioonn ffoorr observationsdelivered to NWS during 2001.. OOtthheerr ssyysstteemmss aarree bbeeiinngg aaddddeedd ttoo tthhee rreeppoorrttiinngg ggrroouupp aass tthheeiirrssooffttwwaarree iiss uuppggrraaddeedd aanndd ffiieelldd tteesstteedd.. TThhee vveesssseellss,, aanndd ootthheerr SSeeaaKKeeeeppeerrss ssyysstteemmss oonn ffiixxeeddppllaattffoorrmmss,, aarree aassssiiggnneedd ccaallll ssiiggnnss iinn tthhee ffoorrmmaatt KKSSnnnnnn,, ttoo pprreesseerrvvee aannoonnyymmiittyy ffoorr tthhee oowwnneerrssooff ssuuppeerryyaacchhttss.. TThhee ffuullll ddaattaa sseett ((aavveerraaggeedd aanndd hhiigghh--rreessoolluuttiioonn)) wwiillll bbee aavvaaiillaabbllee aattSSeeaaKKeeeeppeerrss WWeebb--bbaasseedd ddaattaa sseerrvveerr ffoorr uussee bbyy sscciieennttiissttss aanndd eedduuccaattoorrss..
Figure 2. Map of SeaKeepers observations delivered to NWS during 2001.
Membership in the International SeaKeepers Society has continued to grow. Systems areoperating on three cruise ships, two research vessels, 30 yachts, a pier, and are being installedin new yachts, commercial tankers. A low-energy version is being developed for fixed buoys,in cooperation with the National Data Buoy Center (NDBC).
Figure 3. Number of weather observations reported from SeaKeepers vessels by month.

Data Analysis
Each point in the following series of graphs represents one vessel, the error bars representthe repeatability of the data from that vessel. The “Y” axis on each graph represents theaverage difference from the NCEP model, while the “X” axis indicates the number ofobservations reported from that ship.
Figure 4. Comparison of SeaKeepers and VOS fleet data to the NCEP model predictions
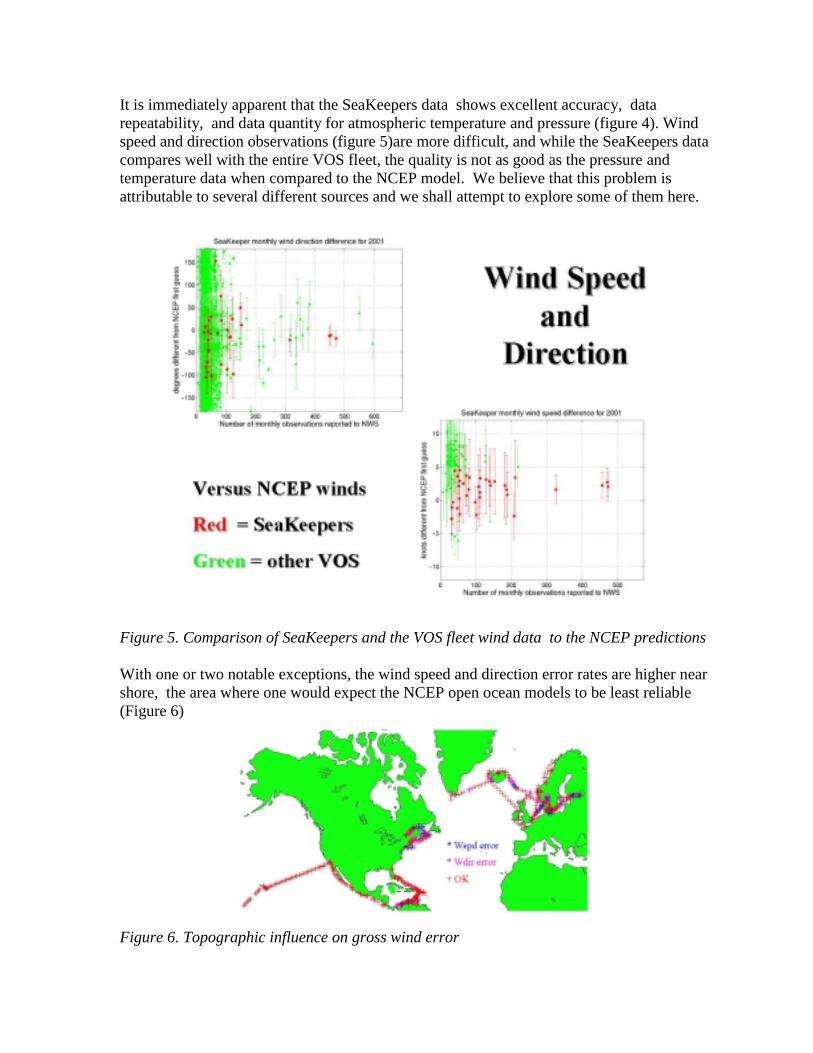
It is immediately apparent that the SeaKeepers data shows excellent accuracy, datarepeatability, and data quantity for atmospheric temperature and pressure (figure 4). Windspeed and direction observations (figure 5)are more difficult, and while the SeaKeepers datacompares well with the entire VOS fleet, the quality is not as good as the pressure andtemperature data when compared to the NCEP model. We believe that this problem isattributable to several different sources and we shall attempt to explore some of them here.
Figure 5. Comparison of SeaKeepers and the VOS fleet wind data to the NCEP predictions
With one or two notable exceptions, the wind speed and direction error rates are higher nearshore, the area where one would expect the NCEP open ocean models to be least reliable(Figure 6)
Figure 6. Topographic influence on gross wind error

There is a better correlation between the SeaKeepers data and QuikSCAT satellite winds anda strong inverse correlation between difference between the observed values and thosepredicted by the models with distance from the coast (Figure 7).
Figure 7. Wind Speed difference from QuikSCAT model predictions, for all SeaKeepersvessels
We have singled out one vessel, Carnival Triumph, whose repetitive course and apparentlarge measured differences have made us suspicious. The lowest quality is indicated winddirection , wind speed differences being localized to near the Cuban coast where presumablyother sources of wind observation are limited. The high incidence of large directiondifferences on the southeasterly outbound leg of the Eastern Caribbean route led us to moreclosely examine the placement of the anemometer. There appears, from examination of windspeed and wind direction differences vs relative wind direction, to be a total absence ofreported wind from 150 to 350 degrees relative to the bow of the vessel. A vessel steaming at20 knots, as this one routinely does, would not be expected to report much in the way ofrelative wind from 90 to 270 degrees. The absence of incident winds in the 270 to 359quadrant was surprising until we more closely examined the location of the wind sensorrelative to a 4 inch diameter tripod mast which sits in exactly this quadrant relative to thewind sensor (Figure 8.). The anemometer will be repositioned and this type of data analysisrepeated to quantify the effect.

Figure 8. Wind bias in observations from Carnival Triumph
Generally the SeaKeepers Sea Surface temperature data is good and in excellent agreementwith the NCEP model Figure 9). The small bias on the more numerous reporting ships couldbe an indication of the nonrepresentative depth of measurements on the cruise ships, typically7 to 10 meters below sea level. For all high data volume vessels, the night time agreement issuperior to the daytime data sets indicating that diurnal surface heating could be playing asignificant role Figure 10)..

Figure 9. Sea Surface Temperature observations compared to the NCEP model
Figure 10. Day/night errors comparison. The numbers on the upper plot identify specificSeaKeepers vessels by call sign.

Future directions:Improve quality control proceduresExpand the number of SeaKeepers systems reporting to the NWS.Deployments in coastal moored buoys and piers.Installations on more freighters and container ships, for routine continuous reporting.
SummaryTThhee iinntteerrnnaattiioonnaall fflleeeett ooff SSeeaaKKeeeeppeerrss vveesssseellss aarree nnooww rroouuttiinneellyy ccoolllleeccttiinngg llaarrggee nnuummbbeerrss ooffggoooodd qquuaalliittyy mmeetteeoorroollooggiiccaall aanndd oocceeaannooggrraapphhiicc mmeeaassuurreemmeennttss.. TThhee ddaattaa aarree bbeeiinngg ddeelliivveerreeddsshhoorreessiiddee iinn rreeaall ttiimmee.. WWhhiillee tthhee oobbsseerrvvaattiioonnss aarree ““ggoooodd”” ccoommppaarreedd ttoo tthhee VVOOSS fflleeeett iinnggeenneerraall,, tthheessee mmeeaassuurreemmeennttss ccaann bbee mmaaddee bbeetttteerr bbyy iimmpprroovveedd QQAA//QQCC pprroocceedduurreess aannddiiddeennttiiffyyiinngg pprroobblleemmss wwiitthh ppaarrttiiccuullaarr vveesssseellss.. CCoonnttiinnuueedd aanndd eexxppaannddeedd ddeeppllooyymmeennttss ooff tthheeSSeeaaKKeeeeppeerrss iinnssttrruummeenntt ssyysstteemm iiss wwaarrrraanntteedd,, aanndd sshhoouulldd pprroovviiddee aa llaarrggee ddaattaabbaassee ooff wwoorrlldd--wwiiddee oocceeaannooggrraapphhiicc aanndd mmeetteeoorroollooggiiccaall oobbsseerrvvaattiioonnss.. AA ppaarrttiiccuullaarr vvaalluuee ooff tthhee uussee ooff pprriivvaatteeyyaacchhttss aass vvoolluunntteeeerr oobbsseerrvviinngg ppllaattffoorrmmss iiss tthhee ooppppoorrttuunniittyy ttoo ccoolllleecctt ddaattaa ffrroomm lleessssffrreeqquueenntteedd aarreeaass ooff tthhee oocceeaannss,, aawwaayy ffrroomm sshhiippppiinngg llaanneess aanndd mmaajjoorr ccoommmmeerrcciiaall ppoorrttss..

The Accuracy of Voluntary Observing Ships' Marine Meteorological Observations
Elizabeth C. Kent and Peter K. Taylor
Southampton Oceanography Centre, Southampton, UK
AbstractTypically the merchant ships of the Voluntary Observing Ships scheme are recruited
by a Port Meteorological Officer at a port which the ship frequently visits. The observingpractises and meteorological instruments provided depend on the recruiting country and areoften very basic. Indeed, the VOS system was primarily designed to aid weather forecasting,while climate change studies require higher quality data. A better understanding of the errorcharacteristics of the VOS data is now needed for both data assimilation and climate studies.
Using sea and air temperatures as an example, this talk will show how the largerandom errors present in the data can be quantified. Determining the smaller, systematicbiases is more difficult because correlations exist between the different variables and theirrespective errors. For example, the error in SST data measured using buckets is likely todepend on the air - sea temperature difference, and hence on both sea and air temperatures.Surprisingly the scatter in the air temperature data seems to vary with how the SST ismeasured, probably because the observing practises strongly depend on recruiting country.By transforming the data to form new variables which are uncorrelated, the systematic errorscan be properly estimated and then transformed back in terms of the observed quantities. Theresults suggest that, while SST data from engine room intake (ERI) thermometers are veryscattered, any mean bias is small. In contrast, while bucket SST data is less scattered, it isbiased cold in regions of high heat flux. Previously it had been assumed that ERI data werebiased warm. A report detailing the preliminary results of these studies can be downloadedfrom: http://www.soc.soton.ac.uk/JRD/MET/PDF/goa.pdf
Improving the quality of future VOS data requires fuller information oninstrumentation and observing techniques, and the implementation of good observingpractises. These are goals of the WMO sponsored VOS subset for climate (VOSClim).Eventually it is hoped to introduce better instrumentation. For example, hull contact SSTsensors installed with acoustic data transmission rather than cables. The IMET project atWoods Hole Oceanographic Institute and the AutoFlux system (developed by SOC withEuropean partners) are prototypes for future VOS instrumentation systems.

1
2003/9/112003/9/11 SOT SOT -- Goa Goa -- 20022002 Diapo Diapo 11
An observation stragegy over the AtlanticAn observation stragegy over the Atlantic
Presentation Presentation to SOT meetingto SOT meetingGoa, Goa, India India 26 26 Feb Feb 20022002
ByByFrançois Gérard, MétéoFrançois Gérard, Météo--FranceFrance
2003/9/112003/9/11 SOT SOT -- Goa Goa -- 20022002 DiapoDiapo 22
European Co-operations in MeteorologyEuropean Co-operations in Meteorology
European Meteorological ServicesEuropean Meteorological Services
OrganisationsOrganisations NetworkingNetworking²²
ECMWFECMWF(Forecast)(Forecast)
EUMETSATEUMETSAT(Space(Space
Observation)Observation)
EUMETNETEUMETNET
EUCOSEUCOS(Ground based(Ground based
observation)observation)
EGOSEGOS(Ocean(Ocean
observation)observation)
ECOMETECOMET(Data and (Data and productsproducts
Exchange)Exchange)
WMO frameworkWMO framework ((ReqsReqs, , guidelinesguidelines, , etcetc))

2
2003/9/112003/9/11 SOT SOT -- Goa Goa -- 20022002 DiapoDiapo 33
What is EUCOS?What is EUCOS?
An observing system An observing system designed designed for for the the support of shortsupport of short--termtermGNWP (24GNWP (24--72h) 72h) overover Europe ;Europe ;An An evolutiveevolutive system ;system ;
Technical evolutionsTechnical evolutions in in ground basedground based observation techniques ;observation techniques ;Expected spaceExpected space segment segment evolutionsevolutions ;;Evolving requirementsEvolving requirements of GNWPof GNWP
A mechanism for coA mechanism for co--operativeoperative definitiondefinition,, implementation implementation and operation of and operation of ththatat observing systemobserving system ;;An An implementationimplementation Programme Programme (1999(1999--2001) 2001) havinghaving led to the led to the above above tthroughhrough
observing system experimentsobserving system experiments and and sensitivity studies,sensitivity studies,cost benefit assessmentcost benefit assessments,s,
2003/9/112003/9/11 SOT SOT -- Goa Goa -- 20022002 DiapoDiapo 44
Present oceanic undersamplingPresent oceanic undersampling
1st Storm
24
26-06
26-122nd Storm
28-1227-12
25-18
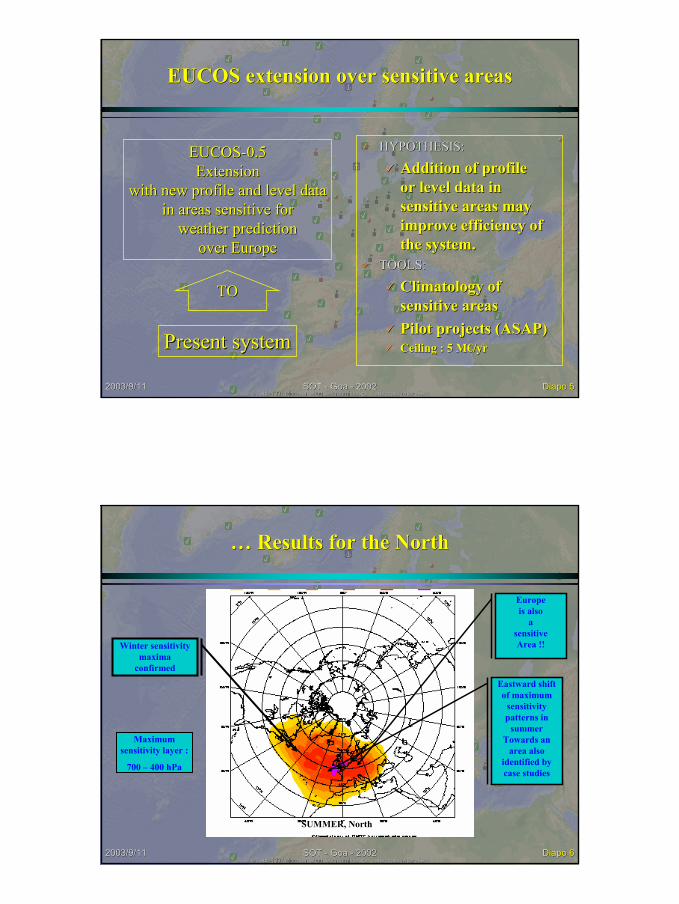
3
2003/9/112003/9/11 SOT SOT -- Goa Goa -- 20022002 DiapoDiapo 55
EUCOS extension over sensitive areasEUCOS extension over sensitive areas
Present Present systemsystem
TOTO
EUCOSEUCOS--0.50.5ExtensionExtension
with new profile and level datawith new profile and level datain areas sensitive forin areas sensitive for
weather predictionweather predictionover Europeover Europe
HYPOTHESIS:HYPOTHESIS:
Addition of profileAddition of profileor level data in or level data in sensitive areas may sensitive areas may improve efficiency of improve efficiency of the system.the system.
TOOLS:TOOLS:
Climatology of Climatology of sensitive areassensitive areasPilot projects (ASAP)Pilot projects (ASAP)Ceiling Ceiling : 5 M€/: 5 M€/yryr
2003/9/112003/9/11 SOT SOT -- Goa Goa -- 20022002 DiapoDiapo 66
WINTER, North
… Results for the North… Results for the North
SUMMER, North
Eastward shift of maximum
sensitivitypatterns in
summerTowards an
area also identified by case studies
Europeis also
asensitiveArea !!Winter sensitivity
maximaconfirmed
Maximum sensitivity layer :
700 – 400 hPa

4
2003/9/112003/9/11 SOT SOT -- Goa Goa -- 20022002 DiapoDiapo 77
Guidelines for EUCOS over the OceanGuidelines for EUCOS over the Ocean
Increase significantly the number of profiles over the Increase significantly the number of profiles over the identified sensitive areas by :identified sensitive areas by :
Activating additional ASAP and AMDAR units :Activating additional ASAP and AMDAR units :From 3000 to 9000 TEMPSHIP messagesFrom 3000 to 9000 TEMPSHIP messages……..Approx 5 000 000 AMDAR messagesApprox 5 000 000 AMDAR messages……
Developing of new observation strategies for these systems ;Developing of new observation strategies for these systems ;Surface data (buoys, ships) to be maintained ;Surface data (buoys, ships) to be maintained ;Assess the operational feasibility of targeted observation :Assess the operational feasibility of targeted observation :
Robotic aircraft demonstration (Robotic aircraft demonstration (AerosondeAerosonde),),Stratospheric balloons;Stratospheric balloons;
2003/9/112003/9/11 EUCOS ProgrammeEUCOS Programme DiapoDiapo 88
Variable operation modeVariable operation mode
MODE 2
MODE 1
MODE 2
MODE 3
MODE 3
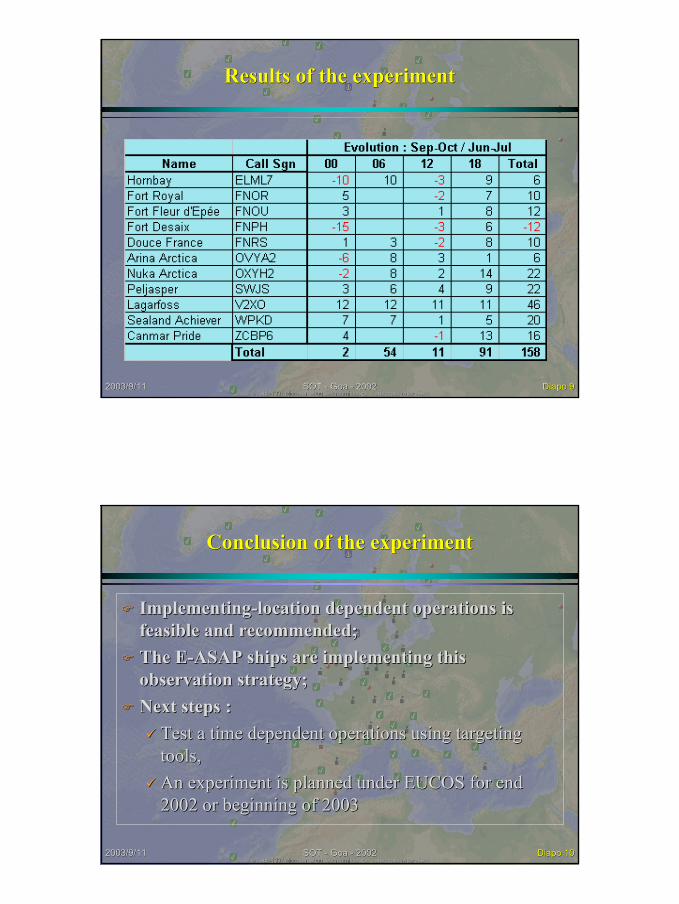
5
2003/9/112003/9/11 SOT SOT -- Goa Goa -- 20022002 DiapoDiapo 99
Results of the experimentResults of the experiment
2003/9/112003/9/11 SOT SOT -- Goa Goa -- 20022002 DiapoDiapo 1010
Conclusion of the experimentConclusion of the experiment
ImplementingImplementing--location location dependent operations is dependent operations is feasible and recommendedfeasible and recommended;;The The EE--ASAP ASAP ships ships are are implementing this implementing this observation observation strategystrategy;;Next steps Next steps ::
Test a time Test a time dependent operations using targeting dependent operations using targeting toolstools,,An An experiment is planned under experiment is planned under EUCOS for end EUCOS for end 2002 or 2002 or beginning beginning of 2003of 2003

6
2003/9/112003/9/11 SOT SOT -- Goa Goa -- 20022002 DiapoDiapo 1111
Surface observation todaySurface observation today
Need to co-ordinate and target surface observation
2003/9/112003/9/11 SOT SOT -- Goa Goa -- 20022002 DiapoDiapo 1212
Surface Pressure sensitivity NorthSurface Pressure sensitivity North
SUMMER WINTER

7
2003/9/112003/9/11 SOT SOT -- Goa Goa -- 20022002 DiapoDiapo 1313
EUCOS requirements…EUCOS requirements…
FromFrom NWP NWP requirementsrequirementsTheThe signal of surface pressure signal of surface pressure is smallis small on on the averagethe average, but , but is is likelylikely to to increase accordingincrease according to to developmentsdevelopments in data in data assimilation assimilation and physics modellingand physics modelling
Impact of data Impact of data from buoysfrom buoys ((and shipsand ships) on ) on synoptic forecast is synoptic forecast is obviousobvious on on somesome casescasesResultsResults call for call for developing targeteddeveloping targeted observation observation from buoysfrom buoys ::
WinterWinter / / Summer deploymentSummer deployment ;;On On requestrequest Activation / Activation / DesactivationDesactivation ;;
TargetedTargeted observation observation strategiesstrategies to to be developed be developed
2003/9/112003/9/11 SOT SOT -- Goa Goa -- 20022002 DiapoDiapo 1414
CONCLUSIONSCONCLUSIONS
Sensitivity andSensitivity and impact impact studies enable studies enable to to identify identify where where to to increase the increase the observation effort observation effort over the over the AtlanticAtlantic;;Implementing Implementing locationlocation--dependent dependent observation observation from from ships ships is feasibleis feasible;;TimeTime--sependent targetingsependent targeting has has still still to to be be demonstrated demonstrated ::
EUCOS EUCOS studies studies programme;programme;THORPEX THORPEX offers offers a a frameworkframework;;
CoCo--operation increases costoperation increases cost--efficiency efficiency of of obs systemsobs systems

- 1 -
SCIENTIFIC AND TECHNICAL WORKSHOP OFTHE JCOMM SHIP OBSERVATIONS TEAM
Goa, India, 26 February 2002
List of Participants
ARGENTINA
Ms Miriam AndrioliChief, Maritime DivisionForecasting DepartmentServicio Meteorológico Nacional25 de Mayo 6581002 BUENOS AIRESArgentinaTelephone: +54-11 5167 6711Telefax: +54-11 5167 6711E-mail: [email protected] [email protected]
AUSTRALIA
Mr Rick BaileyChairman, JCOMM Ship Observations TeamCSIRO/BMRCJoint Australia Facility for Ocean Observing SystemsG.P.O. Box 1289KMELBOURNE, Vic. 3001AustraliaTelephone: +61-3 9669 4170Telefax: +61-32 9669 4660E-mail: [email protected]
Mr Graeme BallManager, Marine Observations UnitBureau of MeteorologyGPO Box 1289KMELBOURNE, Vic. 3001AustraliaTelephone: +61-3 9669 4203Telefax: +61-3 9669 4168E-mail: [email protected]
Mr David K. EvansNational ManagerObservations OperationsBureau of MeteorologyGPO Box 1289KMELBOURNE, Vic. 3001AustraliaTelephone: +61-3 9669 4205Telefax: +61-3 9669 4168E-mail: [email protected]
BULGARIA
Dr Georgi Iliev KortchevDepartment of Forecasts; Senior ResearcherNational Institute of Meteorology andHydrology66 Tzaringradsko chausseeMladost 1SOFIA 1784BulgariaTelephone: +359-2 975 39 86Telefax: +359-2 988 44 94; 988 03 80E-mail: [email protected]
CANADA
Mr Ronald FordyceSupt. Marine Data UnitEnvironment CanadaPort Meteorological Office100 East Port BlvdHAMILTON, Ontario L8H 7S4CanadaTelephone: +1-905 312 0900/0933Cell Phone: +1-905 719 0820Telefax: +1-905 312 0730E-mail: [email protected]
Mr J.R. KeeleyMEDS, Department of Fisheries and OceansW082, 12th floor, 200 Kent StreetOTTAWA, OntarioCanada K1A 0E6Telephone: +1-613 990 0246Telefax: +1-613 993 4658E-mail: [email protected]
Dr Savithri (Savi) NarayananCo-president, JCOMMMarine Environmental Data ServiceDept. of Fisheries and OceansWO82, 12th floor200 Kent StreetOTTAWA, OntarioCanada K1A 0E6Telephone: +1-613 990 0265Telefax: +1-613 993 4658E-mail: [email protected]

- 2 -
FRANCE
Mr Jean-Louis GaumetVice-chairman, ASAP PanelMétéo FranceDSO/DOA/D7, rue Teisserenc de BortB.P. 20278195 TRAPPESFranceTelephone: +33-1 30 13 64 70Telefax: +33-1 30 13 60 68E-mail: [email protected]
Mr François GérardChef du Département océanDirection générale Météo-France1, quai Branly75340 PARIS Cédex 07FranceTelephone: +33-1 45 56 70 24Telefax: +33-1 45 56 74 47E-mail: [email protected]
Mr Jean-Paul RebertInstitut de recherche pour le développement(IRD)Département Milieu et Environment213, rue La Fayette75480 Paris Cédex 10FranceTelephone: +33-1 48 03 76 83E-mail: [email protected]
Mr David VarillonInstitut de recherche pour le développement(IRD)Centre de NouméaUS025 - Moyens à la Mer et ObservatoireOcéaniqueBP A5NOUMEANew CaledoniaFranceTelephone: +687 26 07 11Telefax: +687 26 43 26E-mail: [email protected] http://noumea.ird.nc/ECOP
GERMANY
Mr Ekkehard MittelstaedtBundesamt fuer Seeschiffahrt undHydrographieBernhard-Nocht-Str. 7820359 HAMBURGGermany
Telephone: +49-40 3190 3220Telefax: +49-40 3190 5000E-mail: [email protected]
Dr Volker WagnerChairman, EGOSDeutscher WetterdienstKlima und Umwelt, FE 26P.O. 700421D-22004 HAMBURGGermanyTelephone: +49-40 66901430Telefax: +49-40 6690 1499E-mail: [email protected]
INDIA
Mr V.V. GopalkrishnaIndian XBT ProgramPhysical Oceanography DivisionNational Institute of OceanographyDona-PaulaGOA-403 004IndiaTelephone: +91-832 221322, 226253, Ext.302Telefax: +91-832 223340, 221360, 229102E-mail: [email protected]
Dr M. Dileep KumarNational Institute of OceanographyDona Paula 403004GOAIndiaTelephone: +91-832 226253 ext. 4398Telefax: + 91-832 223340E-mail: [email protected]
Dr G. Narayana SwamyNational Institute of OceanographyDona Paula 403004GOAIndiaTelephone: +91-832 226253 ext. 4271Telefax: + 91-832 223340E-mail: [email protected]
Dr M.R. Ramesh KumarNational Institute of OceanographyDona Paula 403004GOAIndiaTelephone: +91-832 226253Telefax: + 91-832 223340E-mail: [email protected]

- 3 -
Dr N.H. HashimiNational Institute of OceanographyDona Paula 403004GOAIndiaTelephone: +91-832 226253Telefax: + 91-832 223340E-mail: [email protected]
Dr M.R. NayakNational Institute of OceanographyDona Paula 403004GOAIndiaTelephone: +91-832 226253 ext.4347Telefax: + 91-832 223340E-mail: [email protected]
Mr S.K. PrasadDirectorIndia Meterological DepartmentShivaji NagarPUNE - 411 005IndiaTelephone: +91-20 5535211Telefax: +91-20 5533201E-mail: [email protected]
ISRAEL
Dr Matti WeissRapporteur on Regional MarineMeteorological ServicesDepartment of Marine MeteorologyIsrael Meteorological ServiceP.O. Box 25BET DAGAN50250 IsraelTelephone: +972-3 968 2106Telefax: +972-3 968 2126E-mail: [email protected]
JAPAN
Mr Tadashi AndoMarine DivisionClimate and Marine DepartmentJapan Meteorological Agency1-3-4 Otemachi, Chiyoda-kuTOKYO 100-8122JapanTelephone: +81-3 3211 4966Telefax: +81-3 3211 6908E-mail: [email protected]
Dr Yukihiro NojiriHead, Carbon Cycle Research LaboratoryClimate Change Research ProjectNational Institute for Environmental StudiesTsukubaIBARAKI 305-8509JapanTelephone: +81-298 50 2499Telefax: +81-298 51 4732E-mail: [email protected]
KENYA
Mr Ali Juma MafimboPort Meteorological OfficerMeteorological DepartmentBox 98512MOMBASAKenyaTelephone: +254-11 225685E-mail: [email protected]
MALAYSIA
Mr Alui bin BahariMalaysian Meteorological ServiceJalan Sultan46667 PETALING JAYA SELANGORDarul EhsanMalaysiaTelephone: +60-3 7958 7422Telefax: +60-3 7955 0964E-mail: [email protected]
POLAND
Dr Miroslaw MietusChairman, JCOMM Expert Team on MarineClimatologyInstitute of Meteorology and Water Management - Maritime BranchWaszyngtona 42PL-81-342 GDYNIAPolandTelephone: +48-58 6203532Telefax: +48-58 6207101E-mail: [email protected] http://www.imgw.gdynia.pl
RUSSIAN FEDERATION
Dr Alexander A. PostnovState Oceanographic Institute6 Kropotkinskii Lane119992 MOSCOWRussian FederationTelephone: +7-095 246 2889

- 4 -
Telefax: +7-095 246 7288E-mail: [email protected]
SAUDI ARABIA
Mr Ahmaed Yahya HusseinDirector of Observations and Basic SystemsPresidency of Meteorology andEnvironmental ProtectionP.O. Box 1358JEDDAHSaudi ArabiaTelephone: +966-2 6512312 ext.2566E-mail: [email protected]
SINGAPORE
Mr Lim Tian KuayRapporteur on Regional MarineMeteorological ServicesMeteorological Service SingaporeP.O. Box 8 Singapore Changi AirportSingapore 918141SingaporeTelephone: +65 545 7195Telefax: +65 545 7192E-mail: [email protected]
UNITED KINGDOM
Ms Sarah NorthProject Leader, VOS Climate ProjectMet OfficeObservations Supply - Marine NetworksBeaufort ParkEasthampsteadWOKINGHAM, Berkshire RG40 3DNUnited KingdomTelephone: +44-1344 85 5617Telefax: +44-1344 85 5873E-mail: [email protected]
Dr Peter K. TaylorJames Rennell Division (254/27)Southampton Oceanography CentreEuropean WaySOUTHAMPTON, SO14 3ZHUnited KingdomTelephone: +44-23 8059 6408Telefax: +44-23 8059 6400E-mail: [email protected]
USA
Mr Steven K. CookAtlantic Oceanographic and Meteorological Laboratories (R/AOML)Office of Oceanic and Atmospheric Research(NOAA)8604 La Jolla Shores DriveLA JOLLA, CA 92038USATelephone: +1-858 546 7103Telefax: +1-858 546 7185E-mail: [email protected]
Mr Warren H. KeenanNOAA Office of Global Programmes1100 Wayne Avenue, Suite 1210SILVER SPRING, MD 20910USATelephone: +1-301 427 2089 ext. 155Telefax: +1-301 427 2073E-mail: [email protected]
Dr W. Stanley WilsonJCOMM Observations PA CoordinatorChairman, JCOMM ObservationsCoordination GroupNOAA, HCHB 522414th and Constitution Avenue, NWWASHINGTON, DC 20230USA
MANUFACTURERS
AXYS
Dr Thomas VandallDirector of Sales and MarketingAXYS Enfironmental Systems2045 Mills RoadP.O. Box 2219SIDNEY, BCCanadaTelephone: +1-250 655 5868Telefax: +1-250 655 5856E-mail: [email protected]
TSKA
Mr Greg FergusonTSKA, Inc.46208 SE 139th PlaceNORTH BEND, WA 98045USATelephone: +1-425 888 3404E-mail: [email protected]

- 5 -
TSURUMI-SEIKI
Mr Hiroshi IwamiyaPresidentTsurumi-Seiki Co. Ltd.2-20, 2-Chome, Tsurumi-ChuoTsurumi-KuYOKOHAMA 230-0051JapanTelephone: +81-45 521 5252Telefax: +81-45 521 1717E-mail: [email protected]
VAISALA
Mr Simon HarrodVaisalaP.O. Box 6193 Guest StHAWTHORN, Vic. 3122AustraliaE-mail: [email protected]
Mr Erkki JärvinenVaisala OyP.O. Box 26FIN-00421 HELSINKIFinlandTelephone: +3589 8949 1Telefax: +3589 8949 2564E-mail: [email protected]
ORGANIZATIONS
EUMETSAT
Mr Sean BurnsSystem Operations ManagerEUMETSATPostfach 10 05 55D-64205 DARMSTADTGermanyTelephone: +49-6151 807 571Telefax: +49-6151 807 304E-mail: [email protected]
IMSO
Mr Andrew C. FullerInternational Mobile Satellite Organization (IMSO)99 City RoadLONDON EC1Y 1AXUnited KingdomTelephone: +44-20 7728 1378Telefax: +44-20 7728 1172E-mail: [email protected]
PROGRAMMES/PROJECTS
SEAKEEPERS
Mr Geoffrey MorrisonThe International SeaKeepers SocietyRSMAS/MAC4600 Rickenbacker CausewayMIAMI, FL 33149-1098USATelephone: +1-786 325 3733Telefax: +1-305 361 4689E-mail: [email protected]
WRAP
Captain G.V. MackieProject Leader, WRAP30 Keephatch RoadWOKINGHAM, Berkshire RG40 1QJUnited KingdomTelephone: +44-1189 783 687Mobile: +44-7770 933 046Telefax: +44-1189 890 379E-mail: [email protected]
SECRETARIAT
Dr Peter DexterChief, Ocean Affairs DivisionWorld Meteorological Organization7 bis, Avenue de la PaixCase postale No 2300CH-1211 GENEVE 2SwitzerlandTelephone: +41-22 730 82 37Telefax: +41-22 730 80 21E-mail: [email protected]
Mr Etienne CharpentierTechnical Coordinator, DBCP and SOOPJCOMMOPSParc Technologique du Canal8-10 rue HermesF-31526 RAMONVILLE SAINT-AGNEFranceTelephone: +33-5 61 39 47 82Telefax: +33-5 61 75 10 14E-mail: [email protected]
Ms Teruko ManabeOcean Affairs DivisionWorld Weather Watch-ApplicationsDepartmentWorld Meteorological Organization7 bis, Avenue de la Paix

- 6 -
Case postale No 2300CH-1211 GENEVE 2SwitzerlandTelephone: +41-22 730 84 49Telefax: +41-22 730 80 21E-mail: [email protected]
Mr Yves TréglosGOOS Project OfficeUNESCO/Intergovernmental Oceanographic Commission1, rue Miollis75732 PARIS Cédex 15FranceTelephone: +33-1 45 68 39 76Telefax: +33-1 45 68 58 12/3E-mail: [email protected]

*Out-of-print
New JCOMM series replaces discontinued MMROA series
JOINT WMO/IOC TECHNICAL COMMISSIONFOR OCEANOGRAPHY AND MARINE METEOROLOGY
TECHNICAL REPORT SERIES
No. Title WMO/TD-No. Issued16 Scientific and Technical Workshop of the
JCOMM Ship Observations Team -Presentations at the first session of the ShipObservations Team (Goa, India, 26 February2002) - CD ROM only
WMO/TD-No. 1118 2002
15 Automated Shipboard Aerological Programme(ASAP) - Annual Report for 2001
WMO/TD-No. 1112 2002
14 Operational Oceanography - ScientificLectures at JCOMM-I (Akureyri, Iceland, June2001)
WMO/TD-No. 1086 2001
13 Advances in the Applications of MarineClimatology - The Dynamic Part of the WMOGuide to the Applications of MarineClimatology
WMO/TD-No. 1081 2001
12 Automated Shipboard Aerological Programme(ASAP) – Annual Report for 2000
WMO/TD-No. 1069 2001
11 JCOMM Capacity Building Strategy WMO/TD-No. 1063 2001
10 Proceedings of CLIMAR 99 WMO/TD-No. 1062 2001
9 Estimation of Extreme Wind Wave Heights WMO/TD-No. 1041 2000
8 Oceanographic and Marine MeteorologicalObservations in the Polar Regions - A Reportto the Joint WMO/IOC Technical Commissionon Oceanography and Marine Meteorology
WMO/TD-No. 1032 2000
7 Proceedings of a Workshop on Mapping andArchiving of Sea Ice Data – The ExpandingRole of Radar, Ottawa, Canada, 2-4 May 2000
WMO/TD-No. 1027 2000
6 Automated Shipboard Aerological Programme(ASAP) – Annual Report for 1999
WMO/TD-No. 1011 2000
5 Voluntary Observing Ships (VOS ClimateSubset Project (VOSCLIM) – ProjectDocument - Revision 1
WMO/TD-No. 1042 2001
4 The Voluntary Observing Ships Scheme – AFramework Document
WMO/TD-No. 1009 2000
3* JCOMM Ship-of-opportunity ProgrammeImplementation Panel, Third Session, La Jolla,
WMO/TD-No. 1005 2000

*Out-of-print
No. Title WMO/TD-No. IssuedCA, USA, 28-31 March 2000 – SOOP StatusReports – SOOP Scientific and TechnicalDevelopments
2 Meeting of Experts on a JCOMM/GOOS PolarRegion Strategy, Geneva, Switzerland, 6-8December 1999 - Status Reports fromExisting Polar Region Observing Systems
- 2000
1* First Transition Planning Meeting - StPetersburg, Russian Federation, 19-23 July1999 – Status Reports from JCOMMComponent Bodies and Activities
- 1999
MARINE METEOROLOGY AND RELATED OCEANOGRAPHIC ACTIVITIESREPORT SERIES
No. Title WMO/TD-No. Issued44 Marpolser 98 - Metocean Services for Marine
Pollution emergency Response Operations,Townsville, Australia, 13-17 July 1998 –Proceedings - Volume 2 - Review andInformation Papers
WMO/TD-No. 960 1999
Marpolser 98 - Metocean Services for MarinePollution emergency Response Operations,Townsville, Australia, 13-17 July 1998 –Proceedings - Volume 1 - Research Papers
WMO/TD-No. 959 1999
43 Proceedings of the International Workshop onDigitization and Preparation of HistoricalMarine Data and Metadata, Toledo, Spain,15-17 September 1997
WMO/TD-No. 957 1999
- Automated Shipboard Aerological Programme(ASAP) - Annual Report for 1998
WMO/TD-No. 951 1999
42 Provision and EngineeringOperational Application of Ocean Wave Data -in French only
WMO/TD-No. 938 1998
41* The Climate of the Baltic Sea Basin WMO/TD-No. 933 1998
40 Automatisation de l'observation en merAutomation of Observations at Sea
WMO/TD-No. 928 1998
- Automated Shipboard Aerological Programme(ASAP) - Annual Report for 1997
WMO/TD-No. 900 1998
39 Proceedings of the Commission for MarineMeteorology Technical Conference on MarinePollution
WMO/TD-No. 890 1998

*Out-of-print
No. Title WMO/TD-No. Issued38 Evaluation of the Highest Wave in a Storm
(A.V. Boukhanovsky, L.J. Lopatoukhin,V.E. Ryabinin)
WMO/TD-No. 858 1998
37 Tropical Coastal Winds (W.L. Chang) WMO/TD-No. 840 1997
36 Handbook of Offshore Forecasting Services(Offshore Weather Panel)
WMO/TD-No. 850 1997
- Automated Shipboard Aerological Programme(ASAP) - Annual Report for 1996
WMO/TD-No. 819 1997
35 Ice Navigation Conditions in the SouthernOcean (A.A. Romanov)
WMO/TD-No. 783 1996
- Automated Shipboard Aerological Programme(ASAP) - Annual Report for 1995
WMO/TD-No. 767 1996
34 Polar Orbiting Satellites and Applications toMarine Meteorology and Oceanography –Report of the CMM-IGOSS-IODE Sub-groupon Ocean Satellites and Remote Sensing
WMO/TD-No. 763 1996
33 Storm Surges (Vladimir E. Ryabinin,Oleg I. Zilberstein and W. Seifert)
WMO/TD-No. 779 1996
32* Proceedings of the WMO/IOC Workshop onOperational Ocean Monitoring Using SurfaceBased Radars, Geneva, 6-9 March, 1995
WMO/TD-No. 694 1995
- Proceedings of the WMO/IOC TechnicalConference on Space-based OceanObservations, September 1993, Bergen,Norway (US $15.00)
WMO/TD-No. 649 1994
31* Proceedings of the International Workshop onMarine Meteorology
WMO/TD-No. 621 1994
30 Proceedings of the International Seminar forPort Meteorological Officers
WMO/TD-No. 584 1993
29 Meteorological Requirements for WaveModelling (Luigi Cavaleri)
WMO/TD-No. 583 1993
28* Proceedings of the Commission for MarineMeteorology Technical Conference on OceanRemote Sensing
WMO/TD-No. 604 1993
27 A Survey on Multidisciplinary Ocean Modellingand Forecasting (Johannes Guddal)
WMO/TD-No. 516 1992
26* The Accuracy of Ship’s MeteorologicalObservations - Results of the VSOP-NA
1991
25 Ships Observing Marine Climate - ACatalogue of the Voluntary Observing ShipsParticipating in the VSOP-NA
WMO/TD-No. 456 1991
24 Proceedings of the Commission for Marine WMO/TD-No. 350 1990

*Out-of-print
No. Title WMO/TD-No. IssuedMeteorology Technical Conference on OceanWaves
23 Summary Report on National Sea-iceForecasting Techniques
WMO/TD-No. 329 1989
22 Wind Measurements Reduction to a StandardLevel (R.J. Shearman and A.A. Zelenko)
WMO/TD-No. 311 1989
21 Coastal Winds (E.P. Veselov) WMO/TD-No. 275 1988
20* La Prévision du Brouillard en Mer(M. Trémant)Forecasting of Fog at Sea - in French only
WMO/TD-No. 211 1987
19 A Global Survey on the Need for andApplication of Directional Wave Information(S. Barstow and J. Guddal)
WMO/TD-No. 209 1987
18 Baltic Multilingual List of Sea-ice Terms(Jan Malicki, Alex N. Turchin, Hans H. Valeur)
WMO/TD-No. 160 1987
17 Processing of Marine Data (G.D. Hamilton) WMO/TD-No. 150 1986
16* Field Workshop on Intercalibration ofConventional and Remote-sensed SeaSurface Temperature Data (A.E. Strong andE.P. McClain)
1985
15* Forecast Techniques for Ice Accretion onDifferent Types of Marine Structures, IncludingShips, Platforms and Coastal Facilities
WMO/TD-No. 70 1985
14 Scientific Lectures at CMM-IX WMO/TD-No. 41 1985
13 User's Guide to the Data and Summaries ofthe Historical Sea Surface Temperature DataProject
WMO/TD-No. 36 1985
12 WMO Wave Programme: National Reports for1984 on Wave Measuring Techniques,Numerical Wave Models andIntercomparisons
WMO/TD-No. 35 1985
* Supplement No. 4 - Reports for 1991 to 1994on Wave Measuring Techniques, NumericalWave Models and Intercomparisons
WMO/TD-No. 35 1994
Supplement No. 3 - Reports for 1989 to 1990on Wave Measuring Techniques, NumericalWave Models and Intercomparisons
WMO/TD-No. 35 1990
Supplement No. 2 - Reports for 1986 to 1988on Wave Measuring Techniques, NumericalWave Models and Intercomparisons
WMO/TD-No. 35 1989
Supplement No. 1 - Reports for 1985 onWave Measuring Techniques, Numerical
WMO/TD-No. 35 1986

*Out-of-print
No. Title WMO/TD-No. IssuedWave Models and Intercomparisons
11 Drifting Buoys in Support of MarineMeteorological Services (Glenn D. Hamilton)
- 1983
10* Guide to Data Collection and Services UsingService Argos (revised version)
- 1989
9 Intercalibrations of Directly-measured andRemotely Sensed Marine Observations(Alan E. Strong)
- 1983
8 Summary WMO Technical Conference onAutomation of Marine Observations and DataCollection
- 1981
7* Proceedings of the WMO TechnicalConference on the Automation of MarineObservations and Data Collection
- 1981
6 Report on the Results of An Enquiry on MarineMeteorological Services Products
- 1981
5 The Automation of Observational Methods onBoard Ship (M. Yasui)
- 1981
4 Intercalibration of Surface-based andRemotely Sensed Data (except Sea SurfaceTemperature Data) to Be Used in MarineApplications (E.P. McClain)
- 1981
3 Review of Reference Height for and AveragingTime of Surface Wind Measurements at Sea(F.W. Dobson)
- 1981
2 Investigation of Contemporary Methods ofMeasuring Sea Surface and Surface-layerTemperatures (F.S. Terziev)
- 1981
1* Precipitation Measurement at Sea (G.Olbrück)
- 1981