Computation for Physics 計算物理概論 Introduction to NumPy and SciPy.
Science with Python:NumPy, SciPy and
MatplotlibAndrew Walker
for Earth Scientists:27 & 29 Sept. 2011
for Earth Scientists:27 & 29 Sept. 2011
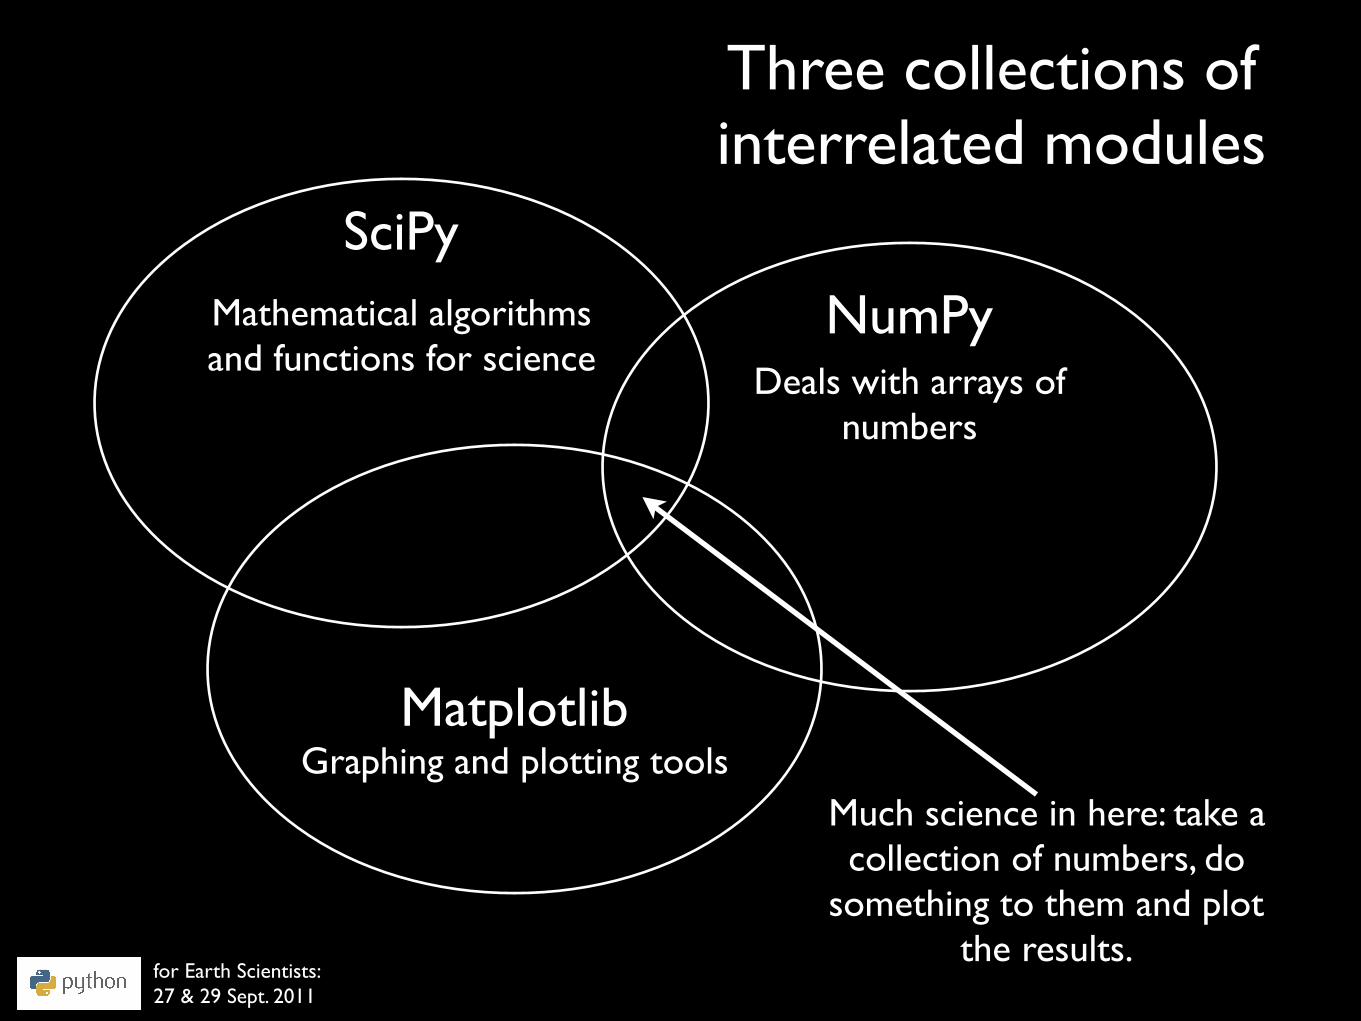
NumPy
SciPy
Matplotlib
Deals with arrays of numbers
Graphing and plotting tools
Mathematical algorithms and functions for science
Much science in here: take a collection of numbers, do
something to them and plot the results.
Three collections of interrelated modules

for Earth Scientists:27 & 29 Sept. 2011
NumPy

for Earth Scientists:27 & 29 Sept. 2011
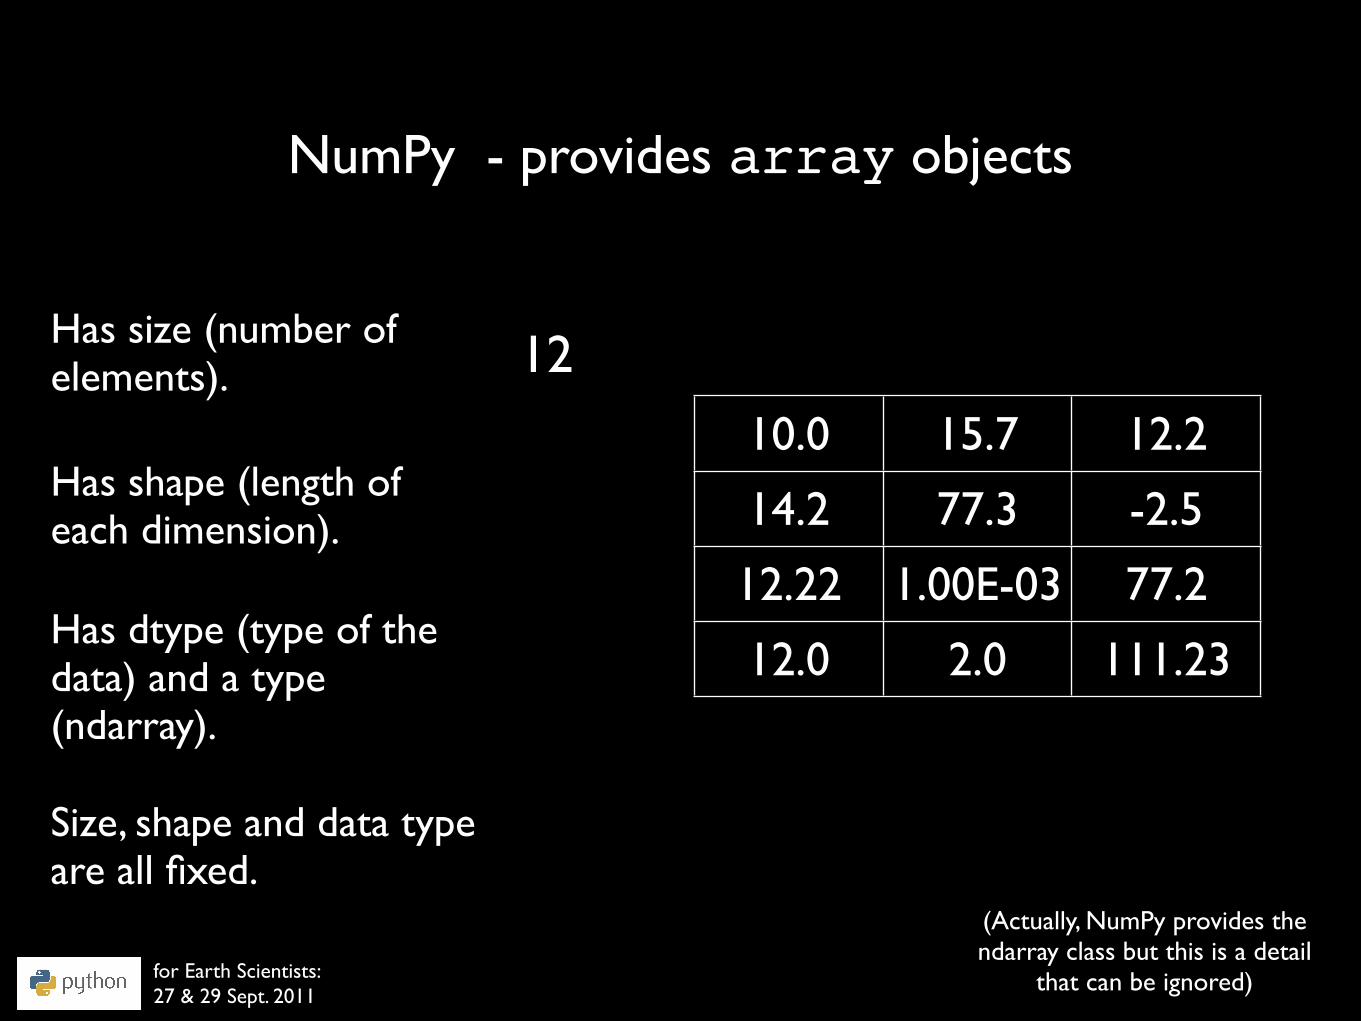
NumPy - provides array objects
(Actually, NumPy provides the ndarray class but this is a detail
that can be ignored)
10.0 15.7 12.2
14.2 77.3 -2.5
12.22 1.00E-03 77.2
12.0 2.0 111.23Has dtype (type of the data) and a type (ndarray).
Size, shape and data type are all fixed.
Has size (number of elements).
Has shape (length of each dimension). a =
for Earth Scientists:27 & 29 Sept. 2011
NumPy - provides array objects
(Actually, NumPy provides the ndarray class but this is a detail
that can be ignored)
10.0 15.7 12.2
14.2 77.3 -2.5
12.22 1.00E-03 77.2
12.0 2.0 111.23Has dtype (type of the data) and a type (ndarray).
Size, shape and data type are all fixed.
Has size (number of elements).
Has shape (length of each dimension).
12
(4,3)
float64
Think of them like Fortran arrays.

for Earth Scientists:27 & 29 Sept. 2011
arrayCreate an empty array, fill it with zeros (or ones) or start from a list or a list of lists.
import numpy as npa = np.array([10.0, 13.2, 4.3])a.size # 3 a.shape # (3,)a.dtype # ‘float64’b = np.zeros((3,3))c = np.ones((3,3))
Create arrays

for Earth Scientists:27 & 29 Sept. 2011
array arithmeticMost operators are overloaded, work element wise on arrays and return arrays.
import numpy as npa = np.array([10.0, 10.0, 10.0])b = np.array([1.0, 2.0, 3.0]) a + b # 11.0, 12.0, 13.0a * b # 10.0, 20.0, 30.0
Add arrays
for Earth Scientists:27 & 29 Sept. 2011
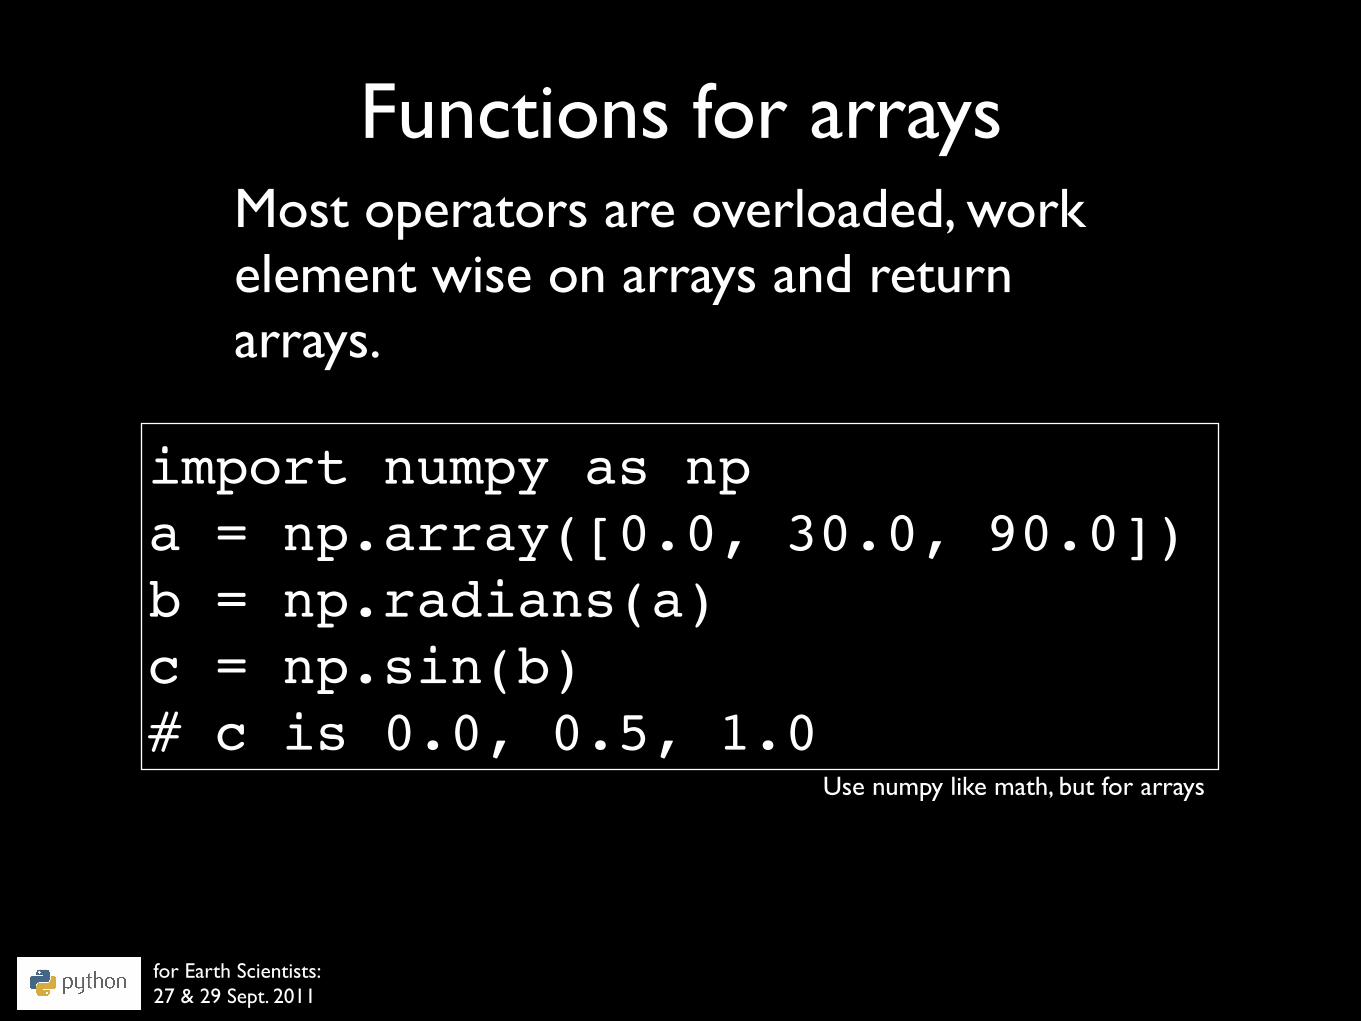
Functions for arraysMost operators are overloaded, work element wise on arrays and return arrays.
import numpy as npa = np.array([0.0, 30.0, 90.0])b = np.radians(a) c = np.sin(b)# c is 0.0, 0.5, 1.0
Use numpy like math, but for arrays

for Earth Scientists:27 & 29 Sept. 2011
Array indices
Work like list indices but you can have several of them separated by commas.
import numpy as npa = np.array([[1.0, 2.0, 3.0], [4.0, 5.0, 6.0]])a[0,0] # 1.0a[0,2] # 3.0a[1,0] # 4.0a[1,2] # 6.0
Like lists

for Earth Scientists:27 & 29 Sept. 2011
Array indices
Work like list indices but you can have several of them separated by commas.
import numpy as npa = np.array([[1.0, 2.0, 3.0], [4.0, 5.0, 6.0]])a[0,0:3] # 1.0, 2.0, 3.0a[0:2,0] # 1.0, 4.0a[1,:] # 4.0, 5.0, 6.0a[0,0:3:2] # 1.0, 3.0
Colons - start:length:stride

for Earth Scientists:27 & 29 Sept. 2011
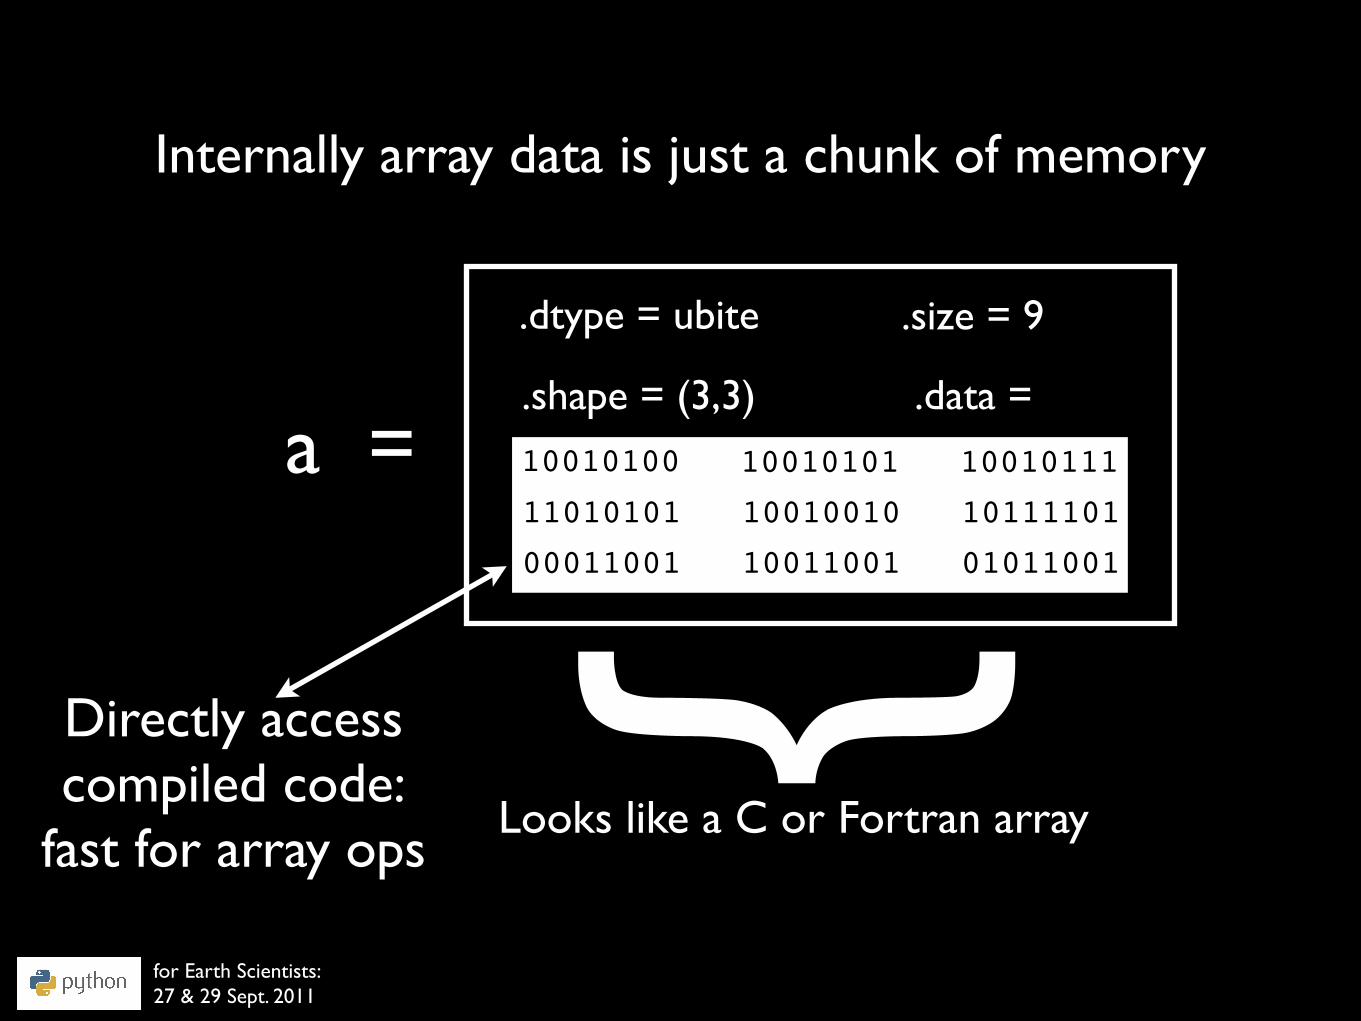
Internally array data is just a chunk of memory
10010100
11010101
00011001
10010101
10010010
10011001
10010111
10111101
01011001
a =
.dtype = ubite .size = 9
.shape = (3,3) .data =
for Earth Scientists:27 & 29 Sept. 2011
Internally array data is just a chunk of memory
10010100
11010101
00011001
10010101
10010010
10011001
10010111
10111101
01011001
a =
.dtype = ubite .size = 9
.shape = (3,3) .data =
{Looks like a C or Fortran array
Directly accesscompiled code:
fast for array ops
for Earth Scientists:27 & 29 Sept. 2011
SciPy: a collection of useful modules

for Earth Scientists:27 & 29 Sept. 2011
Stats
The SciPy stats module provides simple and advanced statistics functions
import numpy as npimport scipy.stats as spsa = np.array([23,33,25,34,20,21,22,21,20,23])np.mean(a) # ~24.2sps.gmean(a) # ~23.8sps.hmean(a) # ~23.4sps.mode(a) # 20
Lots more

for Earth Scientists:27 & 29 Sept. 2011
InterpolateThe SciPy interpolate module has a large number of interpolation schemes
import numpy as npimport scipy.interpolate as spi
x = np.linspace(0, 10, 10)y = np.exp(-x/3.0)f = spi.interp1d(x, y)f2 = spi.interp1d(x, y, kind='cubic')

for Earth Scientists:27 & 29 Sept. 2011
Matplotlib

for Earth Scientists:27 & 29 Sept. 2011
Interpolate and plot
Matplotlib allows plotting of functions
import numpy as npimport scipy.interpolate as spiimport matplotlib.pyplot as plt
x = np.linspace(0, 10, 10)y = np.exp(-x/3.0)f = spi.interp1d(x, y)f2 = spi.interp1d(x, y, kind='cubic')
xnew = np.linspace(0, 10, 40)
plt.plot(x,y,'o',xnew,f(xnew), '-', xnew, f2(xnew),'--')plt.legend(['data', 'linear', 'cubic'], loc='best')plt.show()

for Earth Scientists:27 & 29 Sept. 2011
MatplotlibMany plot types: the gallery has lots of examples. written in python very similar to Matlab and free.

Pyplot: a matplotlib state-machine
import numpy as npimport scipy.interpolate as spiimport matplotlib.pyplot as plt
x = np.linspace(0, 10, 10)y = np.exp(-x/3.0)f = spi.interp1d(x, y)f2 = spi.interp1d(x, y, kind='cubic')
xnew = np.linspace(0, 10, 40)
plt.plot(x,y,'o',xnew,f(xnew), '-', xnew, f2(xnew),'--')plt.legend(['data', 'linear', 'cubic'], loc='best')plt.show()
for Earth Scientists:27 & 29 Sept. 2011
(1) Create a figure(2) Modify figure(3) More modifications(4) Show figure

OO Matplotlib
for Earth Scientists:27 & 29 Sept. 2011
Figure
axes axes
axis
textarrow
contour

OO Matplotlibimport numpy as npimport scipy.interpolate as spiimport matplotlib.pyplot as plt
x = np.linspace(0, 10, 10)y = np.exp(-x/3.0)f = spi.interp1d(x, y)f2 = spi.interp1d(x, y, kind='cubic')
xnew = np.linspace(0, 10, 40)
fig = plt.figure()ax = fig.add_subplot(111)ax.plot(x,y,'o',xnew,f(xnew), '-', xnew, f2(xnew),'--')ax.legend(['data', 'linear', 'cubic'], loc='best')plt.show()
for Earth Scientists:27 & 29 Sept. 2011
OO interface allows finer control over plot, permits embedding in graphical programs and makes it easer to reuse code.
for Earth Scientists:27 & 29 Sept. 2011
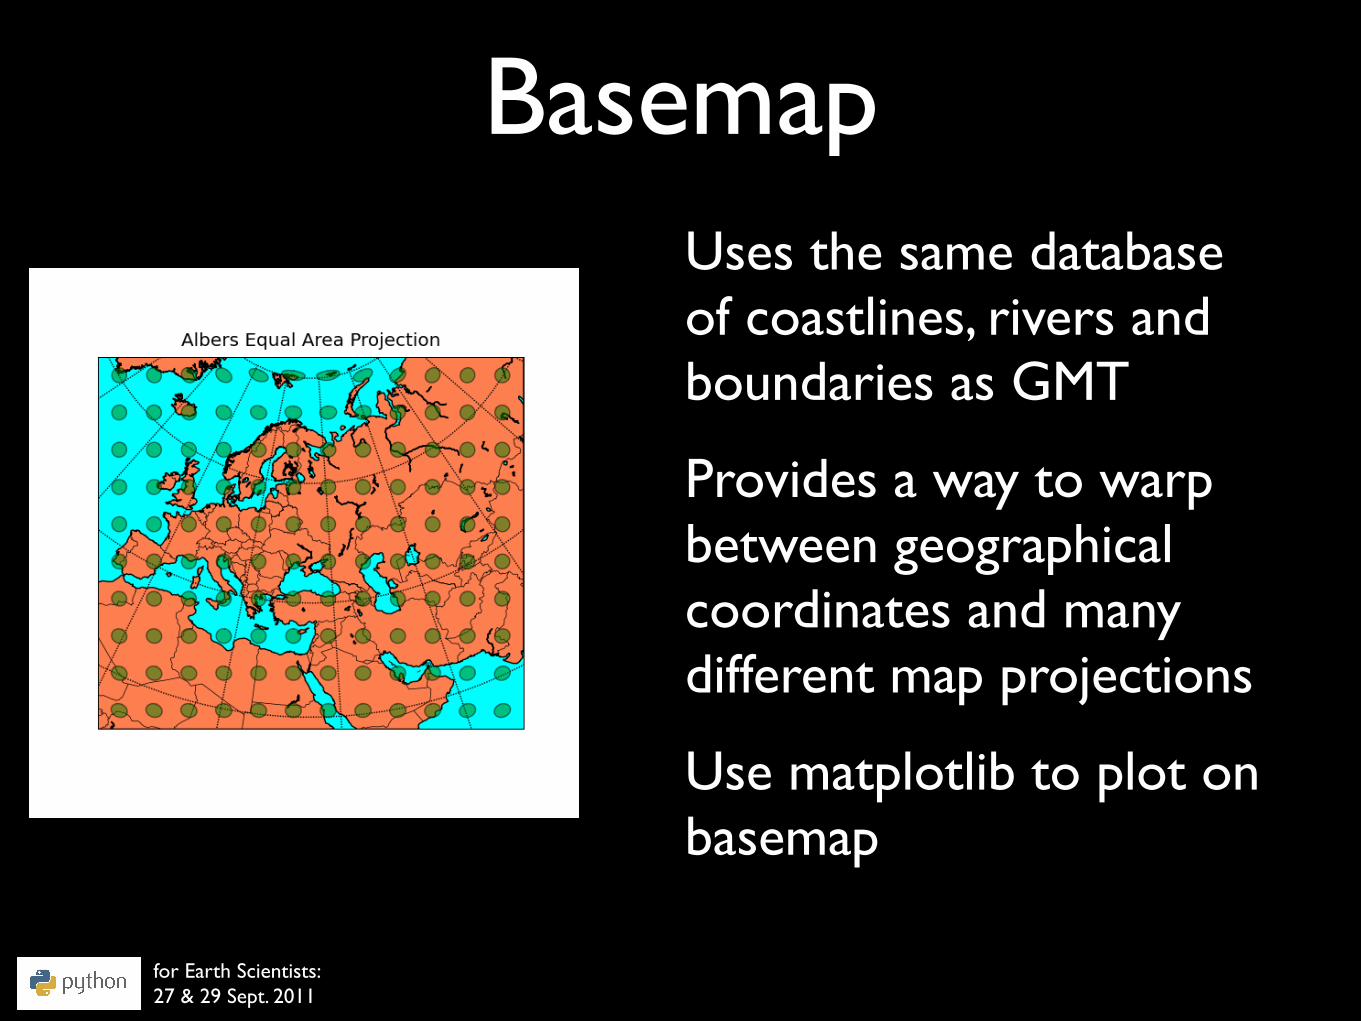
BasemapUses the same database of coastlines, rivers and boundaries as GMT
Provides a way to warp between geographical coordinates and many different map projections
Use matplotlib to plot on basemap

from mpl_toolkits.basemap import Basemapimport numpy as npimport matplotlib.pyplot as pltm = Basemap(width=8000000,height=7000000, resolution='l',projection='aea', lat_1=40.,lat_2=60,lon_0=35,lat_0=50)m.drawcoastlines()m.drawcountries()m.fillcontinents(color='coral', lake_color='aqua')# draw parallels and meridians.m.drawparallels(np.arange(-80.,81.,20.))m.drawmeridians(np.arange(-180.,181.,20.))m.drawmapboundary(fill_color='aqua')
...
plt.title("Albers Equal Area Projection")plt.savefig('aea.png')
for Earth Scientists:27 & 29 Sept. 2011
Basemap
m is a basemap instance

from mpl_toolkits.basemap import Basemapimport numpy as npimport matplotlib.pyplot as pltm = Basemap(width=8000000,height=7000000, resolution='l',projection='aea', lat_1=40.,lat_2=60,lon_0=35,lat_0=50)m.drawcoastlines()m.drawcountries()m.fillcontinents(color='coral', lake_color='aqua')# draw parallels and meridians.m.drawparallels(np.arange(-80.,81.,20.))m.drawmeridians(np.arange(-180.,181.,20.))m.drawmapboundary(fill_color='aqua')
x, y = m(-2.58, 51.54)m.plot(x,y,'wo')
plt.title("Albers Equal Area Projection")plt.savefig('aea.png')
for Earth Scientists:27 & 29 Sept. 2011
Basemap
Use m to convert from geographical to map
coordinates

for Earth Scientists:27 & 29 Sept. 2011
What I’ve not covered

• NumPy array broadcasting
• Special NumPy arrays (masked, sparse, etc.)
• Many SciPy modules (linear algebra...)
• Huge numbers of Matplotlib plot types
http://matplotlib.sourceforge.net/gallery.html
for Earth Scientists:27 & 29 Sept. 2011

• Exceptions
• Functional programming
• Decorators and aspect oriented programming
• Making Python modules with Fortran, C or Java
• Lots more of the standard library
http://docs.python.org/tutorial/
for Earth Scientists:27 & 29 Sept. 2011

• Version control
• Unit tests
• Documentation
• Profiling
• Debugging
for Earth Scientists:27 & 29 Sept. 2011
Whatever language you happen to use