Science, Technology, Engineering & Mathematics (STEM ... · Science, Technology, Engineering &...
19
Science, Technology, Engineering & Mathematics (STEM) Landscape: Trends and Models Executive Summary DRAFT February 15, 2013
Transcript of Science, Technology, Engineering & Mathematics (STEM ... · Science, Technology, Engineering &...

Science, Technology, Engineering & Mathematics (STEM) Landscape: Trends and Models
Executive Summary
DRAFT February 15, 2013

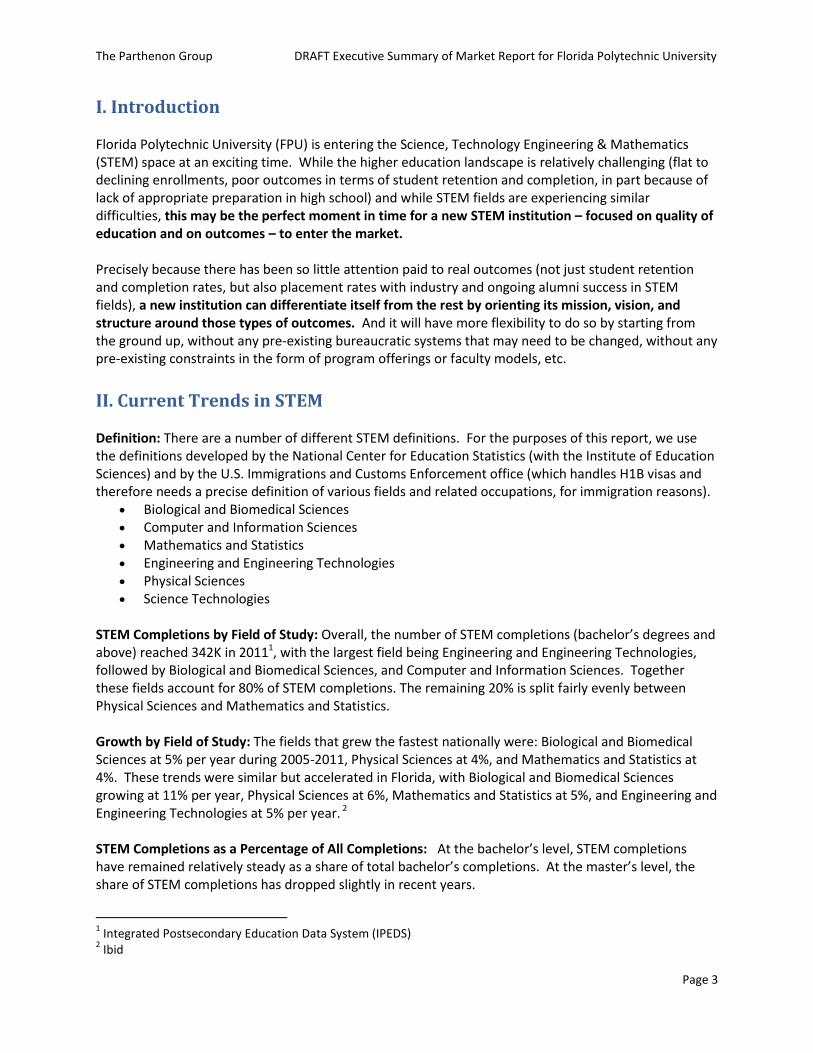
The Parthenon Group DRAFT Executive Summary of Market Report for Florida Polytechnic University
Page 2
Table of Contents
I. Introduction ............................................................................................................................................... 3
II. Current Trends in STEM ............................................................................................................................ 3
III. Potential Implications of Labor Context for Programmatic Focus ........................................................... 5
IV. Program and Curriculum Design Considerations ..................................................................................... 6
V. STEM Institutional Models ........................................................................................................................ 9
VI. Proposed Peer Set of Institutions .......................................................................................................... 12
VII. Institutional Relationships with Industry .............................................................................................. 13
VIII. Next Steps for Florida Polytechnic University ..................................................................................... 16
Accompanying Materials ............................................................................................................................ 19
The Parthenon Group DRAFT Executive Summary of Market Report for Florida Polytechnic University
Page 3
I. Introduction Florida Polytechnic University (FPU) is entering the Science, Technology Engineering & Mathematics (STEM) space at an exciting time. While the higher education landscape is relatively challenging (flat to declining enrollments, poor outcomes in terms of student retention and completion, in part because of lack of appropriate preparation in high school) and while STEM fields are experiencing similar difficulties, this may be the perfect moment in time for a new STEM institution – focused on quality of education and on outcomes – to enter the market. Precisely because there has been so little attention paid to real outcomes (not just student retention and completion rates, but also placement rates with industry and ongoing alumni success in STEM fields), a new institution can differentiate itself from the rest by orienting its mission, vision, and structure around those types of outcomes. And it will have more flexibility to do so by starting from the ground up, without any pre-existing bureaucratic systems that may need to be changed, without any pre-existing constraints in the form of program offerings or faculty models, etc.
II. Current Trends in STEM Definition: There are a number of different STEM definitions. For the purposes of this report, we use the definitions developed by the National Center for Education Statistics (with the Institute of Education Sciences) and by the U.S. Immigrations and Customs Enforcement office (which handles H1B visas and therefore needs a precise definition of various fields and related occupations, for immigration reasons).
Biological and Biomedical Sciences Computer and Information Sciences Mathematics and Statistics Engineering and Engineering Technologies Physical Sciences Science Technologies
STEM Completions by Field of Study: Overall, the number of STEM completions (bachelor’s degrees and above) reached 342K in 20111, with the largest field being Engineering and Engineering Technologies, followed by Biological and Biomedical Sciences, and Computer and Information Sciences. Together these fields account for 80% of STEM completions. The remaining 20% is split fairly evenly between Physical Sciences and Mathematics and Statistics. Growth by Field of Study: The fields that grew the fastest nationally were: Biological and Biomedical Sciences at 5% per year during 2005-2011, Physical Sciences at 4%, and Mathematics and Statistics at 4%. These trends were similar but accelerated in Florida, with Biological and Biomedical Sciences growing at 11% per year, Physical Sciences at 6%, Mathematics and Statistics at 5%, and Engineering and Engineering Technologies at 5% per year. 2 STEM Completions as a Percentage of All Completions: At the bachelor’s level, STEM completions have remained relatively steady as a share of total bachelor’s completions. At the master’s level, the share of STEM completions has dropped slightly in recent years.
1 Integrated Postsecondary Education Data System (IPEDS)
2 Ibid

The Parthenon Group DRAFT Executive Summary of Market Report for Florida Polytechnic University
Page 4
Relative to other countries, the U.S. has one of the lowest shares of STEM completions (STEM degrees as a percent of total bachelor’s degrees awarded). At 15%, the U.S. is significantly behind China (41%), South Korea (33%), India (30%), Germany (29%), France (27%), Japan (24%), the UK (23%), and Canada (22%).3
U.S. trends at the bachelor’s level: Nationally, in 2005-2011, STEM bachelor’s degrees grew at 2.5% per year vs. non-STEM bachelor’s degrees which grew at 2.4% per year. As a result, the share of STEM bachelor’s degrees held steady at 15% of total bachelor’s degrees during this time period. In Florida, STEM bachelor’s degrees grew at 5.1% per year vs. non-STEM bachelor’s degrees which grew at 4.2% per year. As a result, the share of STEM bachelor’s degrees held relatively steady at 13% of total bachelor’s degrees during this time period.4
U.S. trends at the master’s level: Nationally, in 2005-2011, STEM master’s degrees and non-STEM master’s degrees both grew at 3% per year. As a result, the share of STEM master’s degrees held relatively steady at 12% of total master’s degrees during this time period. In Florida, STEM master’s degrees and non-STEM master’s degrees both grew at about 4% per year. As a result, the share of STEM master’s degrees held relatively steady at 11% of total master’s degrees during this time period.
International Students in STEM: International students account for different shares of STEM-trained students in the U.S. depending on degree level:
At the bachelor’s level, students on temporary visas in the U.S. have consistently earned a small share of all STEM degrees awarded in the U.S. (3% to 4% since 2000). The percentage varies somewhat by field of study, with international student completions in electrical and industrial engineering accounting for about 9% in 2009.5
At the master’s level, international students make up a much larger higher proportion of STEM master’s degree recipients. In 2009, 27% of STEM master’s degrees were earned by international students. These degrees were heavily concentrated in computer sciences and engineering where they earned 46% and 43% respectively of all master’s degrees awarded in these fields in 2009. Furthermore, within engineering, more than half of the master’s degrees in electrical and chemical engineering were awarded to students on temporary visas.6
At the doctorate level, international students make up an even higher proportion of STEM doctorates awarded. Temporary residents’ overall share of STEM doctorates rose from 30% in 2000 to 33% in 2009. In fields that are central to U.S. industrial competitiveness (e.g., industrial, chemical, electrical, or materials engineering), international students earned 50% or more of doctoral degrees. Conversely, fields that are potentially less central to competitiveness (e.g., earth science, agricultural science) have higher shares of U.S. citizens getting doctorates. Between 1989-2009, the top 10 countries of origin accounted for 67% of all international doctorate degree recipients. Six out of these top 10 locations are in Asia (China, India, South Korea, Taiwan, Turkey, and Thailand).7
Other International Trends: Increasingly, governments around the world have come to regard movement toward a knowledge-based economy as key to economic progress. Realizing that this
3 U.S. Congress Joint Economic Committee, Understanding the Economy: Unemployment among Young Workers,
2010; Data for China, India, and Brazil is from the Accenture Report on STEM “No Shortage of Talent” 4 IPEDS
5 National Science Board, Science and Engineering Indicators, 2012 edition
6 National Science Board, Science and Engineering Indicators, 2012 edition
7 National Science Board, Science and Engineering Indicators, 2012 edition

The Parthenon Group DRAFT Executive Summary of Market Report for Florida Polytechnic University
Page 5
requires a well-trained workforce, they have invested in upgrading and expanding their higher education systems and broadening participation, especially in STEM fields. One consequence of this is that countries are increasingly competing for international students as a means to attract highly skilled workers to their economy, but also to increase revenue for colleges and universities. While generally students migrate from developing countries to the more developed countries and from Europe and Asia to the United States, a few countries have emerged as regional hubs in their geographic regions (e.g., China and South Korea). Their increased efforts by other countries (e.g., India, China, South Korea) to establish their own world-class research institutions is causing the attractiveness of the U.S. to decline as a STEM destination.8
Minority Students in STEM: Minorities are vastly under-represented in STEM completions, a situation that has seen little improvement between 2000 and 2009.
Bachelor’s level: In 2000, African American and Hispanic STEM degree recipients represented about16% of all STEM degrees at the bachelor’s level and in 2009, this number increased slightly to 17% (but actually decreased in the field of engineering, from 13% to 11%).
Master’s level: The share of African American and Hispanic STEM degree recipients was somewhat lower, but did increase slightly between 2000 and 2009, from 11% to 14% of all STEM degrees awarded.
Doctorate level: The share of African American and Hispanic STEM degree recipients was the lowest, but did increase slightly between 2000 and 2009, from 7% to 8% of all STEM degrees awarded.
III. Potential Implications of Labor Context for Programmatic Focus There is an ongoing debate among universities, elected officials, and corporate leaders about whether there truly is a STEM labor shortage in the U.S., and if so, in which fields. Several approaches have been used to assess the degree of STEM shortages in the U.S:
Percentage of STEM-related jobs occupied by non-U.S. citizens: Another school of thought holds that the degree to which U.S. STEM-related jobs are occupied by non-U.S. citizens is also an indicator of potential shortages of STEM talent. The share of foreign-born workers in STEM occupations has increased slightly between 2000 and 2009, from 22% to 25%. This percentage varies by degree level: in 2009, it was 18% at the bachelor’s level, 33% at the master’s level, and 42% at the doctorate level. 9
Growth rate of the STEM workforce compared to the growth rate of STEM degrees, the theory being that a workforce growth rate greater than degree growth rate is indicative of potential shortages. However, this is somewhat misleading. Not all STEM degree holders end up working in STEM-related fields (about 25% go on to jobs that are not STEM-related), and vice versa, not all workers in occupations with STEM-related tasks have degrees in STEM fields.10
8 National Science Board, Science and Engineering Indicators, 2012 edition
9 SESTAT (2003–08), http://sestat.nsf.gov; Census Bureau, 2000 Decennial Census Public Use Microdata Sample
(PUMS) and ACS (2003, 2006, 2008, 2009) 10
Atkinson, Robert D. and Mayo, Merrilea, “Refueling the U.S. Innovation Economy: Fresh Approaches to Science, Technology, Engineering and Mathematics Education,” The Information Technology and Innovation Foundation, 2010

The Parthenon Group DRAFT Executive Summary of Market Report for Florida Polytechnic University
Page 6
Comparison of STEM job openings to the number of STEM graduates, by level: Bureau of Labor Statistics (BLS) 2020 projections can be used to determine how many job openings there will be by 2020 by STEM-related occupation, and then this “demand” can be matched to “supply” (number of STEM degrees being currently produced that would be a good match for a given job opening in a given occupation). When applied specifically to Florida, 2020 BLS projections suggest that there will be approximately 11K additional job openings by 2020, 11 which is somewhat below the 15K STEM degrees (at the bachelor’s level and above) that will be awarded in Florida.12 However, current BLS methodology likely underestimates the number of job openings because of how they factor in replacements, so additional analysis would need to be conducted to really understand demand, by field, in Florida and nationally. Also, BLS projections are useful to point to broad trends, but it important to remember that they can be highly inaccurate and fail to take into account large market shifts (such as industry consolidation in a particular sector, unexpected cuts in federal R&D budgets).
When determining the programmatic focus of the school, Florida Polytechnic should take the following factors into account:
BLS job openings projections by STEM field
National priorities relevant to STEM: National security and energy efficiency will remain high on the political agenda, and as universities look to the future, there are already some niche program offerings that are taking off and growing (e.g., cybersecurity, alternative/ clean energy, sustainability / green building).
Florida’s Industry Cluster Strategy: The 2010-15 strategic plan published by Enterprise Florida identifies the following:
‒ Foundational industry clusters that Florida seeks to transform: Advanced manufacturing, agriculture, construction, marine, space, and tourism.
‒ Newer industry clusters that Florida seeks to expand and that are critical to the diversification of Florida’s economy: Aviation/ aerospace, clean energy, financial and professional services, homeland security and defense, infotech, and life sciences.
‒ Potential new clusters that could emerge: Creative industries, global logistics, and breakthrough technologies.
IV. Program and Curriculum Design Considerations Given current persistence and retention statistics in STEM (even though outcomes are generally better in STEM than in non-STEM fields, there is a widespread consensus among universities and colleges on the need to improve STEM education. STEM Retention and Persistence Statistics: There is some evidence to suggest that STEM students persist and complete undergraduate programs at a higher rate than non-STEM students. Six years after enrollment in a 4-year college or university in the 2003-04 academic year, 63% of STEM students completed a bachelor’s degree by spring 2009, compared to 55% on non-STEM students.13 Part of this
11
Bureau of Labor Statistics projections of occupational employment, 2008-18 12
IPEDS 13 U.S. Department of Education, National Center for Education Statistics, 2003–04 Beginning Postsecondary
Students Longitudinal Study, Second Follow-Up (BPS:04/09), http://nces.ed.gov/datalab/index.aspx.

The Parthenon Group DRAFT Executive Summary of Market Report for Florida Polytechnic University
Page 7
is due to undergraduate attrition or field switching (from a STEM field to a non-STEM field). The rate of “field switching” is higher in STEM fields the in non-STEM fields. Approximately 40% of students in STEM majors switch out of their fields compared to 30% of students in non-STEM fields. 14 Retention and Persistence Drivers: Most of the reasons provided by students for changing their major had to do with the pedagogical experience / poor teaching. 90 percent of all students who switch out of STEM majors and 98 percent of students who switch out of engineering cited “poor teaching by faculty” as a key concern. Of the 23 most commonly cited reasons for switching out of STEM, all but 7 had something to do with the pedagogical experience. 15 In the course of our research, we have compiled a set of best practices across institutions that are aimed at improving retention of STEM students from freshman to sophomore year, better preparing students for upper-level courses, helping them master not only STEM “facts” but also STEM “skills” that are valued by employers (such as problem-solving, collaboration, communication, teamwork, innovation), with the ultimate goal of increasing graduation rates in STEM-related fields. These best practices include:
(1) Expanding undergraduate research opportunities: Institutions making strides in this area encourage faculty members to include funding for undergraduate researchers in grant proposals; working together with industry partners and other universities, they expand opportunities for student research internships; they facilitate opportunities for students to write and present research findings; and finally, they maintain a supportive environment in which a student can experiment (and possibly fail) without negative consequences. In a nutshell, these institutions share the belief that the earlier in their academic journey students are exposed to and really engaged in their disciplines, the more likely they are to stay in a STEM field and to be successful. The major trend underway today in undergraduate education is to move undergraduate research programs into earlier years (freshman and sophomore), rather than just targeting juniors and seniors. Doing this also has the benefit of preparing freshmen and sophomore for summer jobs and making them more desirable to prospective employers. Examples of these reform efforts include:
Caltech: Established a Summer Undergraduate Research Fellowship (SURF) program that is open to all undergraduates who have completed a third term at Caltech. About 20-25% of each year’s SURFers are freshmen.16
University of Missouri: Designed the EXPRESS Program (Exposure to Research for Science Students) especially for freshmen and sophomores at MU who are from ethnic groups that are underrepresented in the sciences. This program received funding form NIH; students typically work 8-12 hours a week during the semester. The program has led to freshman-sophomore retention rate of 90%.17
Howard Hughes Medical Institute (HHMI): In 2007, HHMI created the Science Education Alliance which grew to 24 large universities and small colleges by 2009. The first Alliance program is the National Genomics Research Initiative, which is a year-long course that enables students to make real discoveries by doing research on bacterial viruses. The program is intended to inspire students before they have a chance to
14
National Science Board, Science and Engineering Indicators, 2012 edition 15
Elaine Seymour and Nancy M. Hewitt, Talking About Leaving: Whey Undergraduates Leave the Sciences (2000) 16
http://www.surf.caltech.edu/applicants/index.html 17
http://undergradresearch.missouri.edu/programs-jobs/programs/express.php

The Parthenon Group DRAFT Executive Summary of Market Report for Florida Polytechnic University
Page 8
become bored or overwhelmed by the typical large introductory science course, and indeed, students participating in the program say they have been “inspired by the chance to do hands-on science.” Faculty in turn recognize that this project “has changed the way they look at teaching. The 24 institutions include among others: Purdue University, Johns Hopkins University, and the University of Florida18
(2) Expanding problem-based learning: Some best practice approaches in this area include
incorporation of more problem-based learning assignments into STEM curricula to facilitate the application of scientific concepts; development of collaborative assignments; interactive teaching and learning rather than mass lecture classes; and the use of experiment-based laboratory exercises instead of the traditional “cookbook” assignments, so that students can develop strong critical thinking and analytical skills. Examples of these reforms include:
University of Cincinnati: To counter freshman-year dropout, the University moved more interesting coursework, notably engineering design, into the freshman year, and offered a freshman design course that introduced creative problem-solving, and effectively eliminated a larger freshman class section.19
Rensselaer Polytechnic Institute: Developed The Rensselaer Plan20 which seeks to enhance interactive teaching and learning in STEM.
Arizona State University-Polytechnic Campus: ASU-Polytechnic Campus made an explicit decision to differentiate itself vis-à-vis the traditional engineering programs at ASU by focusing on real-world applications of knowledge – students learn by “doing” and “making.” They are required to participate in an applied project every semester (part of the program requirement). Projects are real-world in the sense that they are sponsored by industry and students work on actual / live problems that industry is grappling with.21
(3) Building interdisciplinary connections: Interdisciplinary work is becoming recognized as critical
to successful innovation. One example of the power of interdisciplinary approaches is Lee Fleming’s study of 17,000 patents described in Harvard Business Review.22 The study demonstrated that multidisciplinary teams generate patents with a wider spread of success rates than homogeneous teams: the number of failures is greater for multidisciplinary teams, but the most spectacular successes come from such teams as well. Universities and colleges are beginning to recognize that interdisciplinary connections are important to advancing scientific knowledge, but many external factors (such as flows of funds, federal funding criteria, published rankings, etc.) reinforce existing silos because they reward established disciplines / departments within universities. Some leading institutional examples in this area are:
Franklin W. Olin School of Engineering: Has taken this to the extreme. The school has no departments or majors, and every student is responsible for creating their own path in the course of study. The curriculum relies on multidisciplinary integration of subjects,
18
http://www.hhmi.org/news/SEA20091217.html 19
Atkinson, Robert D. and Mayo, Merrilea, “Refueling the U.S. Innovation Economy: Fresh Approaches to Science, Technology, Engineering and Mathematics Education,” The Information Tech. and Innovation Foundation, 2010 20
https://www.rpi.edu/president/plan/resident.html 21
https://technology.asu.edu/iprojects 22
Fleming, Lee, “Perfecting Cross-Pollination: How you craft cross-functional teams depends on your appetite for risk – and your hunger for a breakthrough,” Harvard Business Review, September 2004

The Parthenon Group DRAFT Executive Summary of Market Report for Florida Polytechnic University
Page 9
hands-on learning, team-oriented projects, competency-based assessment, and feedback-driven improvement. Professors co-teach courses in the same way that they expect students to collaborate on projects.
University of Delaware: Will be completing its Interdisciplinary Science and Engineering Laboratory (ISE Lab) in 2013. The 194,000-square-foot facility brings together students and faculty from various disciplines to teach, learn and conduct research in a collaborative environment. Research will provide content for the curriculum and students will learn through exploration of real-world problems. The ISE Lab will have no large lecture halls, but will instead have smaller classrooms that hold no more than 48 students. 8 problem-based learning instructional laboratories feature lab spaces adjoining classrooms so students can discuss a problem and then immediately test a solution. Advanced laboratory spaces include: an imaging and microscopy suite, a nanofabrication facility, a synthesis lab and an advanced materials characterization lab. Lab space will be available for use by UD researchers, students and industry partners.23
(4) Increasing focus on entrepreneurship to develop entrepreneurial STEM students: Some
institutions are introducing elements into overall program design such as courses on entrepreneurship, business plan competitions, and opportunities for students to create real products.
At MIT, program design includes mixed-team project classes such as “Entrepreneurship Laboratory,” “Global Entrepreneurship Laboratory,” and “Innovation Teams.”
Olin offers a course titled “Fundamentals of Business and Entrepreneurship,” typically taken in the freshman year, which is meant to instill knowledge of business principles as student teams form and run businesses with counsel from faculty representing the company’s board of directors. Business profits are contributed to charities chosen by students, in line with Olin’s emphasis on philanthropy and ethics.
Rochester Institute of Technology houses the Simone Center for Student Innovation and Entrepreneurship (established in 2007) which promotes entrepreneurial education through a three-pronged approach: interdisciplinary entrepreneurial curriculum (entrepreneurships minors and concentrations, etc.); applied entrepreneurial experiences (for credit and co-op opportunities to advance a business concept through the RIT Student Business Lab program); and various entrepreneurship programs (such as business plan competitions, speakers series, and conferences).24
UC Berkeley houses the Lester Center for Entrepreneurship and Innovation which partners with universities and corporations worldwide to help students develop and bring new ideas to market.25
V. STEM Institutional Models STEM degrees are awarded by a wide range of institutions in the U.S., ranging from small STEM-only schools to large STEM-focused schools to large universities that offer a wide range of degrees and may house a school of engineering. In total, of the 2,900 4-year degree-granting institutions in the U.S.
23
http://www.udel.edu/iselab/index.html 24
http://www.rit.edu/research/simonecenter/?q=about 25
http://entrepreneurship.berkeley.edu/main/about_site.html

The Parthenon Group DRAFT Executive Summary of Market Report for Florida Polytechnic University
Page 10
(includes public, private non-for-profit, private for-profit), about 1,400 award some type of STEM degree at the bachelor’s level and above. Among these schools, “specialized” schools produce a larger proportion of degrees. When analyzing STEM institutional models in the U.S., we focused our attention on two groups of schools. Together, these 52 schools account for over 20% of all STEM degrees awarded in the U.S.:
35 STEM-Focused Schools: Schools where 50% or more of graduates complete degrees in STEM. ‒ Schools that fall into this category include: Georgia Institute of Technology with over
3,800 STEM completions per year; MIT and Carnegie Mellon University with over 2,000 STEM completions per year; and Rensselaer Polytechnic Institute with over 1,000 STEM completions. Also on this list is Caltech with about 500 STEM completions (much smaller school).
17 Stem Production Schools: Schools where STEM completions are under 50% of total completions, but where more than 2,500 students are awarded STEM degrees each year (at the bachelor’s level or above:
‒ Schools that fall into this category include: Pennsylvania State University with over 3,500 STEM completions per year; University of Illinois at Urbana-Champaign with 3,300 STEM completions; Virginia Tech with over 2,600 STEM completions; and Arizona State University with over 2,500 STEM completions.
We should note that the models we describe below are not based on pre-existing higher education definitions; we have derived the models by conducting an extensive overview of the STEM institutional landscape and looking at common themes and patterns across groups of schools.
(1) Global research institution: Institutions that fit this profile have the following characteristics:
They are typically doctorate-granting universities. The have high research funding in absolute terms. More than 30% of all core expenditures are research-related. They receive high rankings (US News & World report, Lombardi) on research dimensions,
faculty citations dimensions, etc. They recruit world-class research faculty (to support the research enterprise) A higher proportion of their faculty come from academia vs. industry, and even though they
teach, it is their research activities that are perceived as critical to the reputation of the institution. It is not unusual to see institutions in this category spend tens of millions of dollars on recruitment of a handful of faculty; a university’s “status” is often conveyed by the number of faculty who are Nobel Prize recipients.
Finally, these institutions also tend to be quite selective with respect to students (e.g., as measured by SAT scores).
Criteria used to identify institutions in this group: In the top 25 of Lombardi research rankings (developed by the Center for Measuring University Performance at ASU) and relatively high levels of student selectivity as measured by mean SAT scores (in the top 100 SAT rank reported by Lombardi). In the case of international institutions, Times Higher Education rankings were considered (e.g., top 100 universities overall, and top 100 under 50 years).
Examples of these institutions in the U.S. include Caltech, MIT, Georgia Institute of Technology, and the University of Michigan. International examples include Postech in South Korea, ETH Zurich in Switzerland, Korea Advanced Institute of Science and Technology in Korea, and Cranfield University in the United Kingdom. Profiles of these institutions are provided in the document titled February 5 Parthenon Presentation to the Board of Trustees.

The Parthenon Group DRAFT Executive Summary of Market Report for Florida Polytechnic University
Page 11
(2) Elite undergraduate institution: Institutions that fit this profile have the following characteristics: They are typically focused on bachelor’s degrees though they also offer master’s degrees and
sometimes doctoral degrees. They are very selective (have high admission requirements). They still conduct research, but are much less research intensive than the “global research
institutions.” Faculty are typically not perceived as “world-class research faculty,” but they are strong
teachers / instructors, and work closely with undergraduates to engage them in project-based learning and to research early on.
These institutions believe strongly in creating and delivering a high quality undergraduate education in STEM and in retaining students in STEM fields. Some have explicitly revamped their programs to make teaching and learning more interactive, more interdisciplinary, and more inclusive of coursework in fields like business, management, and entrepreneurship.
Criteria used to identify institutions in this group: In the top 25 on US News & World Report rankings (Rensselaer is one exception; ranks 41st); and in the top 50 on Lombardi’s SAT national rankings.
Examples of these institutions in the U.S. include Franklin Olin College of Engineering, Harvey Mudd College, Carnegie Mellon University, and Rensselaer Polytechnic Institute. International examples include Indian Institute of Technology (IIT) in India and Bandung Institute of Technology in Indonesia. This model is typically not found in Western Europe. Profiles of these institutions are provided in the document titled February 5 Parthenon Presentation to the Board of Trustees.
(3) Industry-engaged institution: Institutions that fit this profile have the following characteristics:
They typically are more aligned to labor markets, local or regional. They tend to have multiple strong links to industry (including research and project-based work
for undergraduates, research collaborations with faculty, student internships, student co-ops, co-investment in research ventures; development of targeted / customized degree programs for local/regional employers – for their workforce).
Criteria used to identify institutions in this group: Since there is no “hard” data available to rank institutions on a “depth of industry relationships” scale, we relied on a more qualitative assessment of institutions’ ties to industry. We looked at institutions’ mission statements and anecdotal information on background of faculty members (industry vs. academia), and degree to which students’ academic experience was linked to industry (e.g., making/doing/applying vs. theoretical knowledge).
Examples of these institutions in the U.S. include the ASU’s Polytechnic Campus, Virginia Tech, Colorado School of Mines, and the United States Naval Academy. International examples include Toyota Technological Institute in Japan, Polytechnics Canada, Duale Hochschule Baden-Wuerttemberg – Mannheim in Germany, and Aston University in the United Kingdom. Profiles of these institutions are provided in the document titled February 5 Parthenon Presentation to the Board of Trustees.

The Parthenon Group DRAFT Executive Summary of Market Report for Florida Polytechnic University
Page 12
VI. Proposed Peer Set of Institutions The peer set of institutions will need to be refined / amended once Florida Polytechnic’s vision is finalized, but based on preliminary discussions with the Board, we see the following as key elements of the Polytechnic’s potential future vision:
It will be STEM-focused, but most likely not a STEM-only school. It will conduct some research, but research will lean more toward applied than theoretical. It will focus primarily on undergraduates, but will also award master’s degrees. It will have a substantially applied STEM curriculum that will enable students to graduate “work-
ready” and pursue careers in industry sectors that benefit the growth of Florida’s economy. It will teach STEM “skills,” not just STEM “facts” by helping students develop problem-solving,
teamwork, communication, and listening skills (through program design). In keeping with these points, we recommend the group of institutions below as a starting point. The institutions meet the following criteria:
They either have a high percentage of completions in STEM or graduate 1,000 or more students in STEM fields every year.
They have relatively high admissions criteria (median SAT typically above 1,200) They have strong reputations (typically ranked in the top 100 by the U.S. News & World Report). Income from research (grants and contracts) is typically under 20% of total revenues. They strongly believe in the quality of undergraduate education and actively pursue initiatives to
make this education as relevant and real-world as possible. They establish strong links with industry. They are committed to innovation and entrepreneurship.
Institution Name and
Location Ownership Categorization
Degree Levels
Total Enrollment
% STEM Completions
Grants % of Revenue
Mean SAT (2009)
Rankings
Small Institutions
1. Harvey Mudd (CA) Private Elite Students Bachelors 784 90% 5% 1520 USN: 12
2. Olin College, (MA)* Private Elite Students Bachelors 344 100% 1% 1360-1520
Unranked
Medium-Sized Institutions
3. ASU-Poly Campus (AZ)**
Public Industry-Engaged B, M, D,
Certificates 9,752 19% 32% 1080 USN: 70
4. Carnegie Mellon (PA) Private Elite Students B, M, D 11,531 55% 21% 1395 USN: 23
5. Colorado School of Mines (CO)
Public Industry-Engaged B, M, D 5,524 87% 31% 1260 USN: 77
6. Rensselaer Polytechnic Inst. (NY)
Private Elite Students B, M, D 6,538 74% 22% 1360 USN: 41
7. US Naval Academy (MD)
Private Industry-Engaged Bachelors 4,576 54% 2% 1285 USN: 14
8. Rochester Institute of Technology (NY) *
Private Industry-Engaged B, M, D,
Certificates 15,445 43% 8%
1100-1330
USN: 88 (Engin.)
Large Institutions
9. Purdue Univ. (IN) Public Industry-Engaged B, M, D 40,849 36% 17% 1160 USN: 65
10. Stevens Institute of Technology (NJ) *
Private Industry-Engaged B, M, D 44,616 82% 23% 1190-1390
US: 75
11. Virginia Tech (VA) Public Industry-Engaged B, M, D 30,936 34% 25% 1210 USN: 72
12. Worcester Polytechnic (MA)
Private Industry-Engaged B, M, D 21,489 77% 9% 1325 USN: 65
13. Univ. of Illinois at Urbana-Champaign (IL)
Public Research /
Industry-Engaged B, M, D 44,407 29% 24% 1280 USN: 46
* SAT scores are 25th-75th percentile from USN&WR (median was not available) ** ASU figures are for the entire school, not just for ASU-Polytechnic Campus

The Parthenon Group DRAFT Executive Summary of Market Report for Florida Polytechnic University
Page 13
VII. Institutional Relationships with Industry There are many different existing relationships between institutes of higher education and US industry, ranging from student-based learning experiences to industry-based research projects. These partnerships include but are not limited to: research projects, internships, co-op programs, industry sponsorship of labs, and customized academic programs for industry.
(1) Research Projects: As the broadest category, this relationship encompasses multiple different potential collaborations between industries and higher education depending on the nature of the desired outcomes and the composition of the research team. The teams can be led by faculty members who play key roles in determining the direction of the project and can often result in long-standing relationships with industry partners. The teams can also be composed of students whose work is monitored by a faculty advisor but who collaborate primarily with other students to determine the progression of the project. Applied Research Projects: Industries develop contracts with universities to undertake specific, real problems the industry is experiencing or anticipates in the near term. These could range from improving the efficiency of cost and time in a manufacturing process to improving system emissions to meet new governmental regulations. These projects often look similar to the work of consultants. Theoretical (Basic) Research: In contrast to the applied research projects that aim to directly address a problem, theoretical research projects seek to better understand the basic principles of a field that may improve outcomes for an industry in the long-term. These projects seek to build the fundamental understanding within a field of science, such as unlocking the human genome curing cancer. Although industries may not know at the start how the research will positively influence their work, this research is desirable for overall field development.
Olin College SCOPE (Senior Consulting Program for Engineering) Projects: These year-long engineering projects for corporate clients develop through a corporate partner providing a challenging engineering problem that has significance to the sponsor. The student engineering team works under the guidance of a faculty advisor, and has access to dedicated, professionally-equipped work space at Olin. Partners sign letters of understanding with the university, and many of these have overall timelines of 3-5 years.26
Harvey Mudd Clinic Program: Teams of four or five students with a project manager, faculty advisor, and sponsoring organization liaison collaborate to solve “real-world, technical problems for industrial clients.” Since 1963, when the Clinics first began for engineering students, student teams have completed over 1,400 projects for 375 sponsoring organizations including corporations, national laboratories, and agencies. The company holds the rights to all intellectual property and students are often named on patents that result from their work.
ASU-Polytechnic iProjects: Based in the College of Technology and Innovation, industry partners propose problems that student teams directed by faculty advisors work over the course of a semester. In contrast to the other examples profiled, the ASU industry
26
http://scope.olin.edu/join/forms/

The Parthenon Group DRAFT Executive Summary of Market Report for Florida Polytechnic University
Page 14
partners sign formal contracts that stipulate the scope of work and the price, which usually stands at $25,000 per semester.27
Others: California Institute of Technology Corporate Partners Program including a Bioengineering Research Program with healthcare company Sanofi; National Science Foundation’s Grant Opportunities for Academia Liaison with Industry (GOALI) focusing on theoretical research; industry sponsored clinical trials at University of Michigan’s Medical School; Pfizer grant to the George Washington University’s Cancer Institute, etc.
(2) Internships: These short-term, paid or un-paid student positions within an existing corporation place students in the workplace in their potential STEM field of choice and allow them to gain real-world experience. Although internships exist across all fields, the flexibility and short nature of internships give students exposure to an industry without a large commitment on the part of the industry partner. Internships can be facilitated by a formal relationship between an industry and a university, but often result from informal connections between opportunities and university departments or career services. These positions can run during the semester and earn students course credit (which require formalized agreements), but often take place during the summer between the academic semesters.
Commonwealth of Virginia’s Commonwealth STEM Industry Internship Program (CSIIP): This centralized database of paid summer STEM internships connects students from Virginia with companies from Virginia. Students complete one comprehensive application that goes to all employers and encourages students to prepare to fill the “high-demand, high-paying jobs of the future.”28
(3) Co-op Programs: Similar to internships, co-op programs are partnerships between industry partners and universities to place students in actual jobs. In contrast to internships, co-op programs are always paid positions and can often last an entire semester or year. In multiple examples, students spend 100% of their time in these full-time positions and can either extend the length of their degree program or receive credit for the co-op semester(s). Co-ops typically result in a loner (5-year) degree program.
Virginia Polytechnic Institute and State University (Virginia Tech): Virginia Tech’s Cooperative Education / Internship Program (CEIP) places students in long-term, paid co-op positions with industry partners. Students work full-time, rotating between a semester at their job and a semester in academic programs. During semesters of CEIP work, students pay low fees to the university, get paid, but do not receive academic credit. The co-op program is done in addition to regular credit work. Example industry placements include GE Aviation, Dow Chemical Company, DuPont, ExxonMobil, and General Motors.
Duale Hochschule Baden-Wuerttemberg – Mannheim (Germany): The dual curriculum at DHBW is based in 3-month rotations between industry placements and coursework. With over 2,000 industry partners, students rotate through individualized studying programs on campus and training companies, who are formal partners with the university after being approved for their manufacturing and business processes.
Others: Drexel University Co-op, Rochester Institute of Technology, Wentworth Institute of Technology Co-op, Elberly College of Science at Penn State University Co-op program, Noyce Scholar Program-STEM Education Co-op at Marquette University, etc.
27
https://technology.asu.edu/iprojects 28
http://www.governor.virginia.gov/news/viewRelease.cfm?id=1440

The Parthenon Group DRAFT Executive Summary of Market Report for Florida Polytechnic University
Page 15
(4) Industry Sponsorship of Labs/Equipment: Instead of building independent research centers at
an organization’s headquarters, many industries select to partner with a university and build or donate high-tech labs, equipment, or facilities to a university to enable the development of research on behalf of the industry. These relationships are typically based in formal contracts between the sponsor and the university center or lab.
Rensselaer Polytechnic Institute’s Computational Center for Nanotechnology Innovations: A partnership between Rensselaer, IBM, and New York State, the CCNI contains one of the most powerful supercomputers in the world. Focused on reducing the size of electronic devices, the center will seek to apply lessons to other industries outside of electronics while reducing the time and cost of production.29
Indian Institute of Technology-Gandhinagar’s Ricoh Design Innovation Center: Japanese imagining and electronics company Ricoh partnered with the IIT-Gn campus to set up a center in which both designers from the company and students at the university engage in technology-based problem-solving. Aimed at developing products designed for the Indian marketplace, Ricoh will fund both the center and many of the joint research projects in the three-year agreement.30
NSF’s Industry University Cooperative Research Centers (I/UCRCs): With over 60 active centers, this government program requires 4.3 to 1 industry: government funding to incentivize the relationships between industries and academic centers. By incorporating the center’s industry members into both the voting process to select new projects and the mentorship of projects alongside university faculty, these collaborations lead to “Real Design, by Real Teams, for Real Customers” for both undergraduate and graduate students. Examples include the Center for Electric Vehicles - Transportation and Electricity Convergence (EV-TEC) at the University of Texas at Austin and Texas A&M University and the Center for Agricultural, Biomedical, and Pharmaceutical Nanotechnology (CABPN) at University of Illinois at Urbana-Champagne.31
Other Examples: University of Maryland-Baltimore County’s bwtech@UMBC, Colorado School of Mines’ MineARC, Inc. Refuge Chamber, Microsoft Research Asia Joint Lab Program (JLP) at multiple universities in China, MIT Computer Science and Artificial Intelligent Laboratory Intel Science and Technology Center, Toyota Technological Institute at University of Chicago
(5) Customized programs for industries or employers: When employers identify a specific need of
gap in their workforce, they can seek out a partnership with a university to build a program that will specifically meet these needs. Although many of these partnerships utilize the community college or associates level degrees, when employers seek higher level degrees, colleges and universities fill this gap, such as advancing associates-level candidates to bachelor’s degrees.
Toyota Technical Institute (Nagoya, Japan): This university began with an endowment from the Toyota Motor Corporation and stays close to its source. The university teaches modules on Toyota’s production lines and facilitates research in state-of-the-art
29
https://ccni.rpi.edu/w/ 30
Times of India, http://articles.timesofindia.indiatimes.com/2013-01-28/ahmedabad/36595385_1_japan-s-ricoh-iit-gn-technology-gandhinagar 31
http://www.nsf.gov/eng/iip/iucrc/program.jsp

The Parthenon Group DRAFT Executive Summary of Market Report for Florida Polytechnic University
Page 16
facilities for funded research projects. The 98% employment rate represents positions not only at Toyota, but also at other corporations such as Sony and Mitsubishi.
ASU-Polytechnic’s College of Technology and Innovation Custom Engineering Program for Intel: Resulting in a Bachelor of Science degree, this custom program was designed over a two-year collaboration between Intel and ASU to train Intel’s Arizona-based chip makers. The schedule also meets the needs of students, as the 24-month program involves one day per week of classwork so employees/students can spent the other four days at work.
Other: Software Engineering at Seattle University for Boeing; Jomo Kenyatta University of Agriculture and Technology (JKUAT), Riara University and Strathmore University in Kenya partner with IBM to create Information and Communications Technologies (ICT) focused programs.
VIII. Next Steps for Florida Polytechnic University Armed with this preliminary information, Florida Polytechnic will need to develop the following elements of its overall “go to market” plan:
(1) Mission and Vision:
Why do we exist? What is the problem or issue we are trying to address? What is our purpose as an organization?
What population or market will we serve? Who is our target audience and what are their needs? How do we propose to address these needs? What are our geographic boundaries?
What will success look like? How will our target audience benefit from our efforts? What is the ultimate result we hope to achieve?
What is Florida Polytechnic’s broader Theory of Action & Change? How broad a reach does the school seek to establish (i.e., beyond Florida, beyond the U.S.), and how will it do so?
(2) Programmatic Focus:
Demand: Where is the greatest labor market need, nationally, regionally, and locally? What programs / degrees are required to meet this need? What are funders and employers looking for?
Supply: What is already being offered by other universities in Florida, and with what level of success? Where are the biggest gaps and opportunities?
Differentiation: What is the best way to differentiate ourselves in the STEM landscape? How focused / broad should we be at the beginning? How and where are institutions incorporating a deliberate emphasis on “innovation” within their offerings?
(3) Operational Model:
What strategies will we use to attract our desired student segment? Will Florida Polytechnic recruit highly qualified students through full or partial scholarships? Target international students?

The Parthenon Group DRAFT Executive Summary of Market Report for Florida Polytechnic University
Page 17
What type of research might we focus on? Will we pursue government contracts? Which funding agencies / streams might be a good fit, given FPU’s overall mission and programmatic focus?
How will we engage with employers? Will we pursue private gifts / grants, including potential employee partnerships and contributions? Which industry associations might be good partners for FPU?
What type of faculty do we need to recruit, given stated mission? What will it cost to recruit this type of faculty (salaries, research budgets, etc.)?
How will we deliver instruction to students? All onsite, hybrid, or also online? What are the costs to develop and deliver online / hybrid courses? Can we leverage the Florida Virtual Campus?
How will we support our students and faculty? What kind of supports do students need to persist and succeed in STEM? What do faculty need to teach effectively?
(4) Infrastructure and Implementation:
Facilities and Equipment: Some fields are more capital intensive than others – What infrastructure (classroom space, lab space, equipment) is needed, given programmatic choices?
Systems: What kind of systems need to be in place to ensure a high-quality teaching and learning experience (e.g., seamless recruitment/admission systems, advising systems, academic intervention systems, employer partnership systems, etc.)? What technological solutions should be put in place to optimize the experience?
Government: How will the university be governed? How will academic and management decisions be made?
Management: What functional areas (academic and non-academic) need be created to support the work of the university, and how will they be managed and staffed?
Implementation: What implementation activities, sequencing, resources, and milestones/accountability are required to ensure success in planning, start-up and ongoing operations?
(5) Outcomes: How will we define success in the short, medium, and long term?
What student-related metrics are most important to us?
What research-related metrics are most important to us?
What industry-related metrics are most important to us? Parthenon could assist Florida Polytechnic in developing a clear, data-driven and actionable strategic plan that includes all of the above components and is aligned with the values and mission of the leadership team, the state university system of Florida, and the State of Florida.:
Parthenon would support overall project management, facilitation and stakeholder engagement; analytical and research activities; access to a global network of education contacts; and collaborative thought leadership.
Parthenon activities would align with and support parallel accreditation efforts and requirements.
A sample timeline for this type of support is provided on the next page.

The Parthenon Group DRAFT Executive Summary of Market Report for Florida Polytechnic University
Page 18
The above would of course need to be conducted within the context of the overall Florida Polytechnic implementation roadmap, shown below.
The Parthenon Group DRAFT Executive Summary of Market Report for Florida Polytechnic University
Page 19
Accompanying Materials
1) February 5, 2013 Presentation to the Board of Trustees 2) Mission and Vision_Selected STEM Institutions 3) Database of Selected STEM institutions: US and International 4) Florida 2020 STEM Job Openings by Degree (BLS) 5) Potential STEM job openings (BLS 2020) vs. current number of STEM degrees 6) The Rensselaer Plan: Excerpts