Science Safety and Skills Booklet - Ms. Johnston's...
30
1 Name:_______________________ Period: _____ Science Safety and Skills Booklet Grade 8
Transcript of Science Safety and Skills Booklet - Ms. Johnston's...
1
Name:_______________________ Period: _____
Science Safety and
Skills Booklet
G r a d e 8

2

3
Getting to Know Your Textbook
Science 8
1. How many units are there in this textbook? _______ Name the units.
___________________________________________________________________
___________________________________________________________________
___________________________________________________________________
___________________________________________________________________
___________________________________________________________________
2. What are the three Key Ideas for Unit 1?
___________________________________________________________________
___________________________________________________________________
___________________________________________________________________
3. At the beginning of each section, there is a light brown shaded box containing text. What is
the purpose of this shaded text?
___________________________________________________________________
___________________________________________________________________
___________________________________________________________________
4. What are the Key Terms for Section 7.2? Use the glossary starting on page 507 to define
each of them.
___________________________________________________________________
___________________________________________________________________
___________________________________________________________________
4
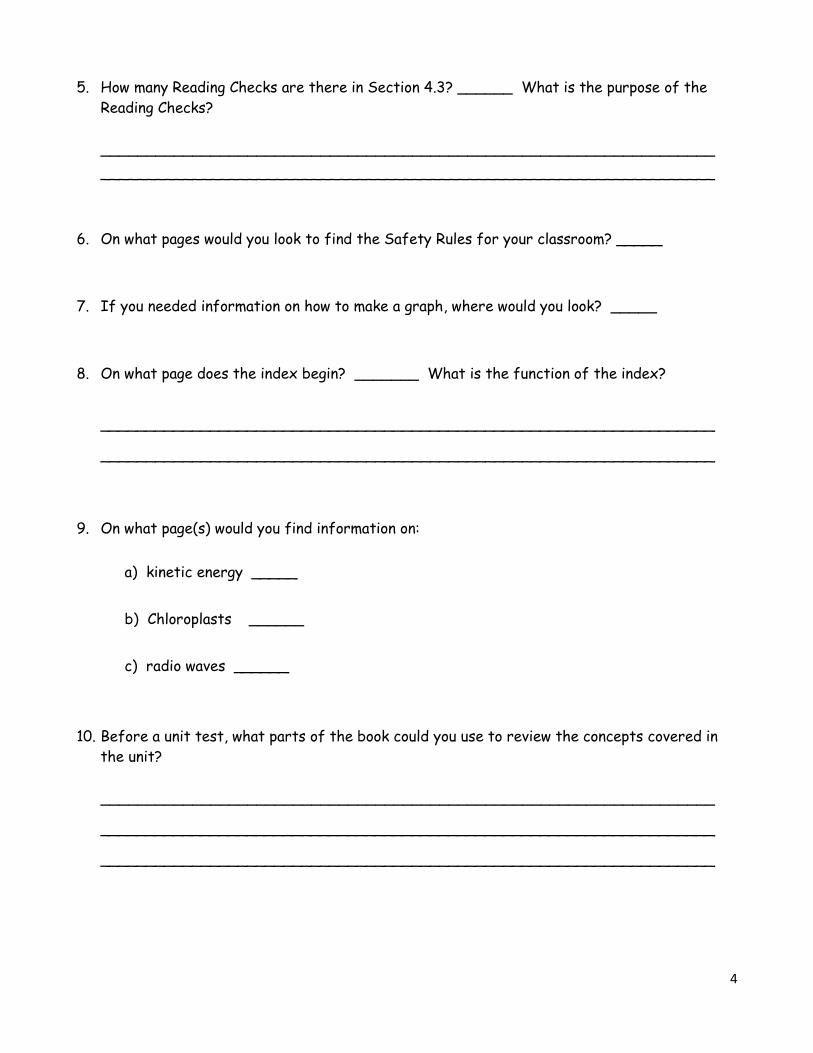
5. How many Reading Checks are there in Section 4.3? ______ What is the purpose of the
Reading Checks?
___________________________________________________________________
___________________________________________________________________
6. On what pages would you look to find the Safety Rules for your classroom? _____
7. If you needed information on how to make a graph, where would you look? _____
8. On what page does the index begin? _______ What is the function of the index?
___________________________________________________________________
___________________________________________________________________
9. On what page(s) would you find information on:
a) kinetic energy _____
b) Chloroplasts ______
c) radio waves ______
10. Before a unit test, what parts of the book could you use to review the concepts covered in
the unit?
___________________________________________________________________
___________________________________________________________________
___________________________________________________________________
5
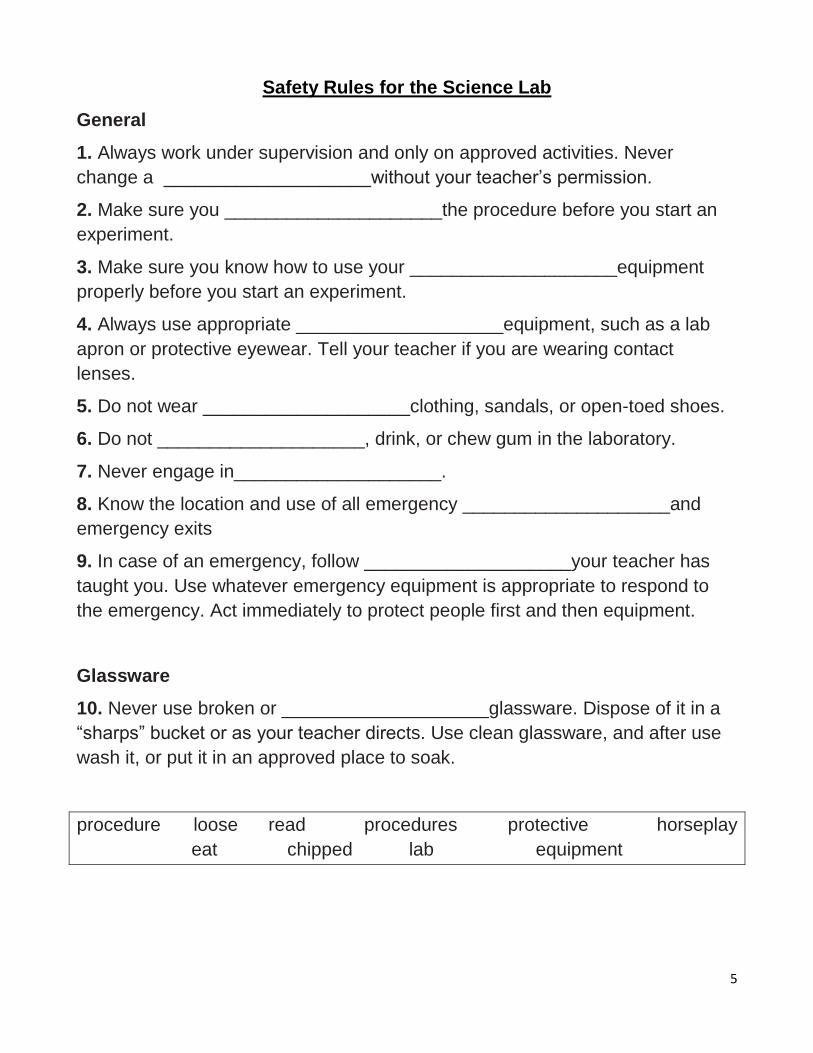
Safety Rules for the Science Lab
General
1. Always work under supervision and only on approved activities. Never
change a ____________________without your teacher’s permission.
2. Make sure you _____________________the procedure before you start an
experiment.
3. Make sure you know how to use your ____________________equipment
properly before you start an experiment.
4. Always use appropriate ____________________equipment, such as a lab
apron or protective eyewear. Tell your teacher if you are wearing contact
lenses.
5. Do not wear ____________________clothing, sandals, or open-toed shoes.
6. Do not ____________________, drink, or chew gum in the laboratory.
7. Never engage in____________________.
8. Know the location and use of all emergency ____________________and
emergency exits
9. In case of an emergency, follow ____________________your teacher has
taught you. Use whatever emergency equipment is appropriate to respond to
the emergency. Act immediately to protect people first and then equipment.
Glassware
10. Never use broken or ____________________glassware. Dispose of it in a
“sharps” bucket or as your teacher directs. Use clean glassware, and after use
wash it, or put it in an approved place to soak.
procedure loose read procedures protective horseplay
eat chipped lab equipment
6
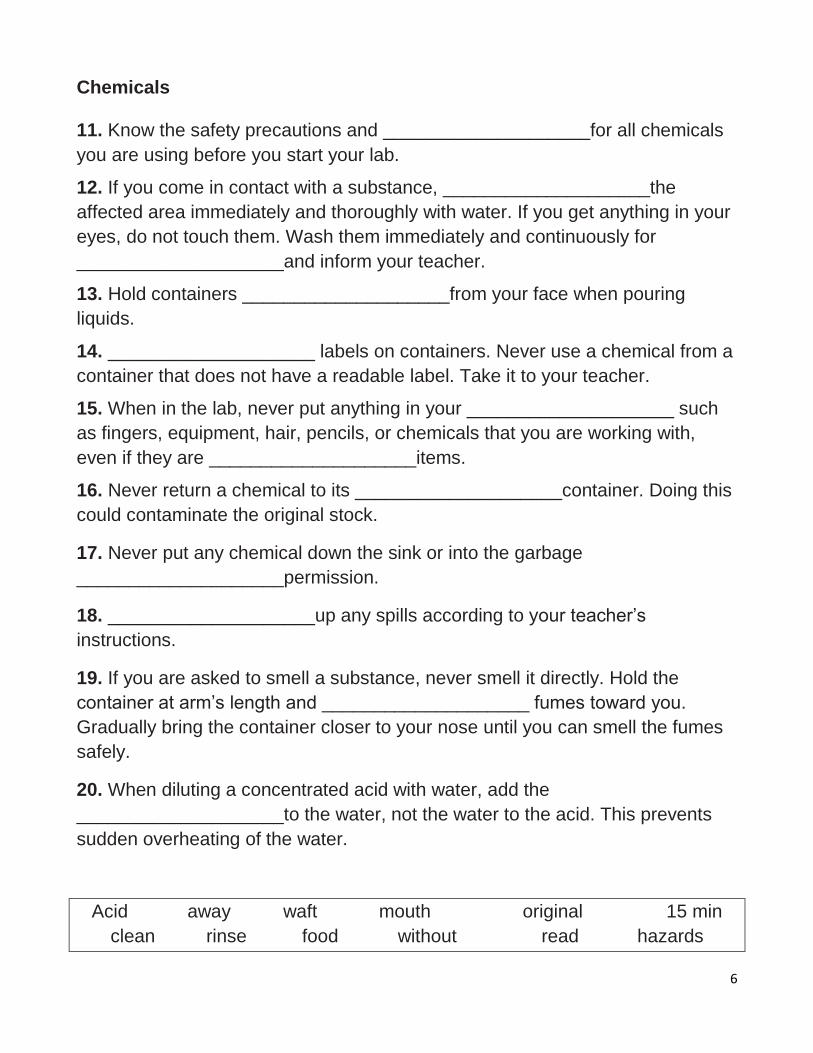
Chemicals 11. Know the safety precautions and ____________________for all chemicals
you are using before you start your lab.
12. If you come in contact with a substance, ____________________the
affected area immediately and thoroughly with water. If you get anything in your
eyes, do not touch them. Wash them immediately and continuously for
____________________and inform your teacher.
13. Hold containers ____________________from your face when pouring
liquids.
14. ____________________ labels on containers. Never use a chemical from a
container that does not have a readable label. Take it to your teacher.
15. When in the lab, never put anything in your ____________________ such
as fingers, equipment, hair, pencils, or chemicals that you are working with,
even if they are ____________________items.
16. Never return a chemical to its ____________________container. Doing this
could contaminate the original stock.
17. Never put any chemical down the sink or into the garbage
____________________permission.
18. ____________________up any spills according to your teacher’s
instructions.
19. If you are asked to smell a substance, never smell it directly. Hold the
container at arm’s length and ____________________ fumes toward you.
Gradually bring the container closer to your nose until you can smell the fumes
safely.
20. When diluting a concentrated acid with water, add the
____________________to the water, not the water to the acid. This prevents
sudden overheating of the water.
Acid away waft mouth original 15 min
clean rinse food without read hazards

7
Hot Plates and Open Flames
21. Handle hot objects carefully. Be especially ____________________with a
hot plate even if it looks as though it has cooled down.
22. Know how to ____________________and operate a Bunsen burner.
23. ____________________back long hair and avoid fuzzy clothing and long
sleeves when you are in an area with open flames.
24. Never leave an ____________________flame unattended, even for a
moment. Assign someone else to watch it, or turn the flame off.
25. Clear area of _____________________________materials before lighting
the Bunsen burner.
Electrical Equipment
26. Make sure your hands are ____________________ when touching
electrical cords, plugs, or sockets.
27. Pull the ____________________, not the cord, when unplugging electrical
equipment.
28. ____________________ frayed cords and any other damaged equipment to
your teacher.
29. If any electrical component becomes ____________________during an
activity, disconnect the circuit immediately.
dry hot careful report light plug tie
careful open flammable
8
9
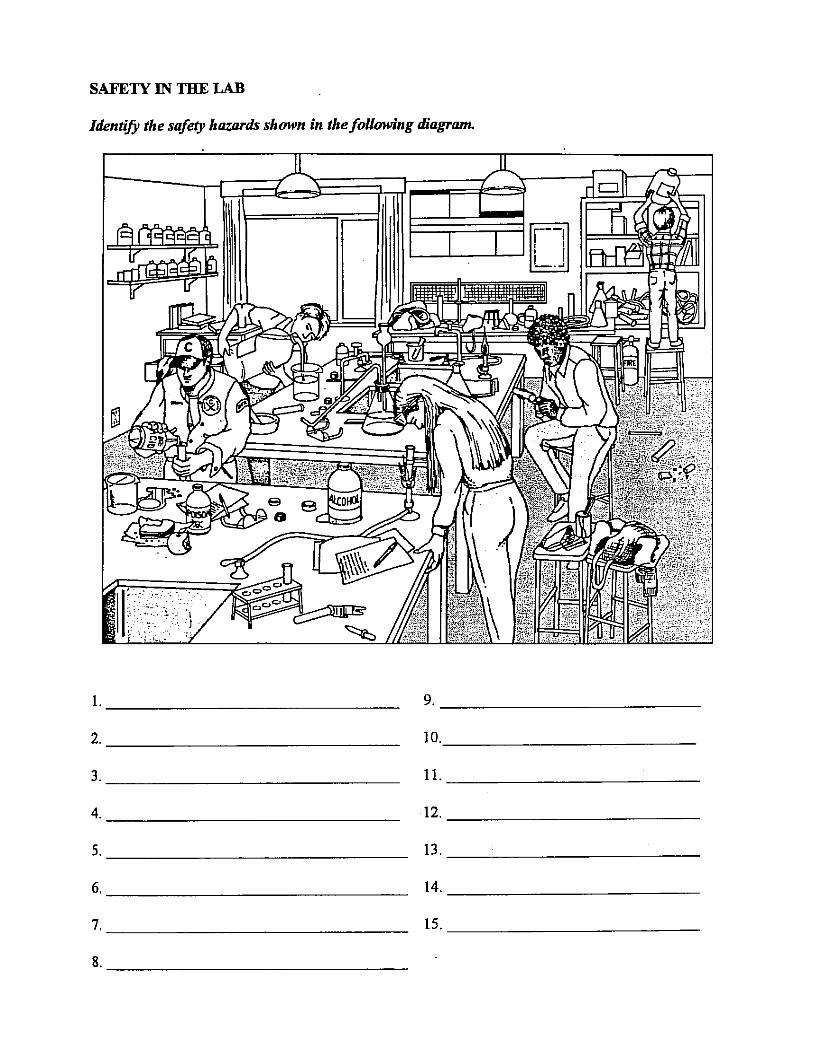
Safety in the Science Classroom
For each of the following safety rules, give one GOOD reason why we have that safety rule.
1. Never begin an experiment or lab without your teacher’s permission.
2. Keep your safety goggles on as long as there are any chemicals being used in the lab,
even if you yourself are finished.
3. Never eat, drink, or chew gum during a lab.
4. Put test tubes in a test tube rack before pouring liquids into them.
5. Make sure your hands are dry when using electrical equipment.
6. Report any injuries, no matter how minor, to your teacher.
7. Clear the area of flammables around a Bunsen burner
8. Never rough house in the class.
9. If your clothing catches on fire, never run.
10. If a chemical gets in your eye, flush it with running water for at least 15 minutes.
10
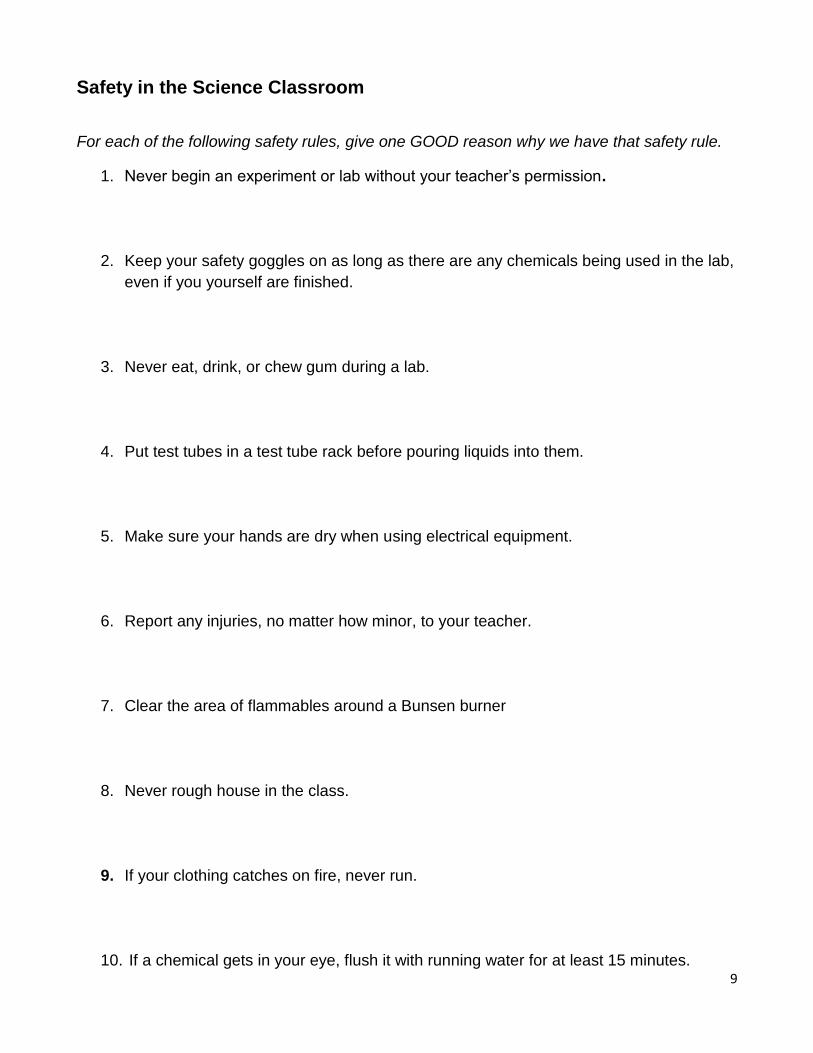
LABELS ON HAZARDOUS PRODUCTS
Household Hazardous Product Symbols (HHPS)
Many of the chemicals you use in class are hazardous, but so are many products you use at
home. It is important for you to be able to recognize and interpret hazard symbols on
products so you can use these products safely in the lab or at home.
Each symbol has two components: its shape and the symbol inside the border. The shape
tells you how hazardous a product is. Going from least dangerous to most dangerous:
A triangle means “caution”
A diamond means “warning”
An octagon means “danger”
Within these shapes are symbols that tell you what kind of hazard the product is. For
example, the skull and crossbones means the substance is toxic. The most toxic substances
show a symbol inside an octagon. The skeletal hand shows you a substance is corrosive, the
flame represents a flammable substance, and the exploding object represents an explosive
substance.
WHMIS SYMBOLS
Throughout Canada, standard symbols are used to identify dangerous materials. The Workplace Hazardous Materials Information System (WHMIS) has produced symbols for such workplaces as science laboratories. These are known as WHMIS symbols. WHMIS symbols are similar to the hazardous product symbols described above, but they are always in a circle. They identify a wider range of hazards than the household symbols do.
11
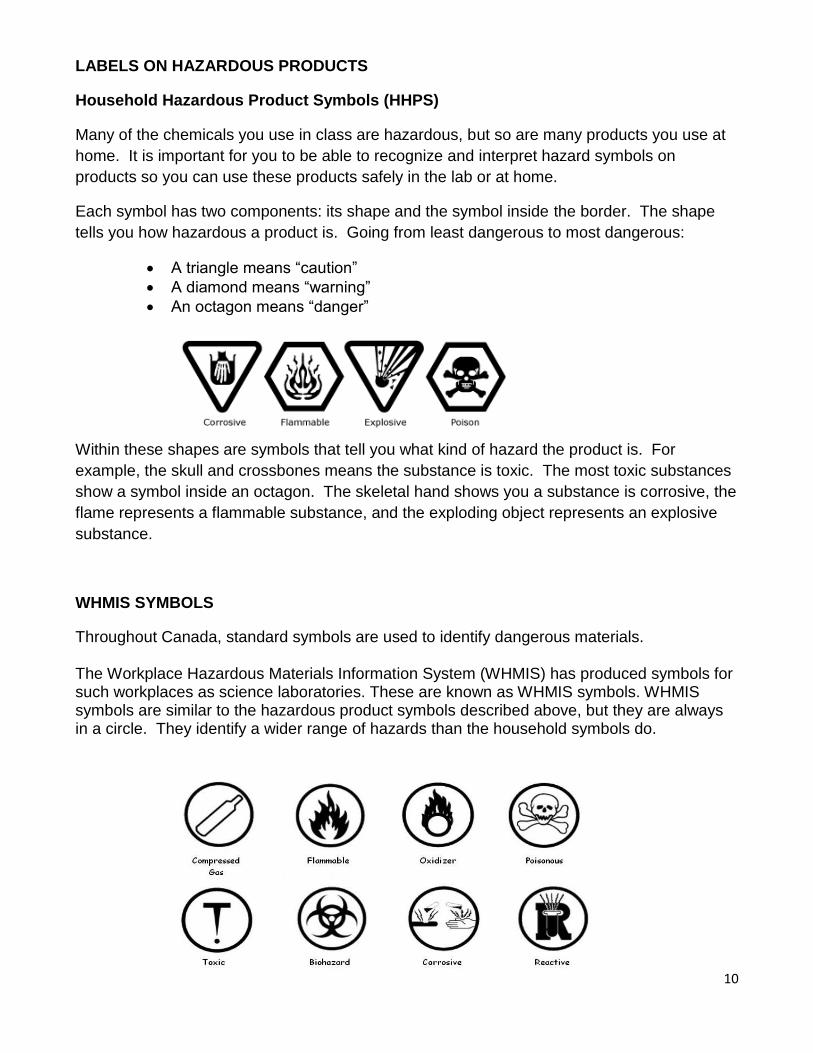
WHMIS Labels WHMIS labels are affixed or attached to the containers of controlled products, and provide information that:
Alerts the user to the hazards of the product
States what precautions to take when handling the product.
Refers the user to a material safety data sheet (MSDS) for more detailed information about the product.
The labels can be marks, signs, stamps, stickers, seals, tickets, tags or wrappers. They can be attached to,
imprinted, stenciled or embossed on the controlled product or its container.

12
Using the information on the other side of the paper and the handouts the teacher gives you, answer the following questions.
1. What does WHMIS stand for?
2. What is the purpose of WHMIS?
3. What information would you find on a WHMIS label?
4. Do all products and chemicals have WHMIS labels? Explain.
5. Identify the following symbols, write down at least one hazard this symbol
represents and give one example of a material or chemical that may have this
symbol.
Identify Symbol One Hazard Example
A
B
C
D
E
F
G
H
13
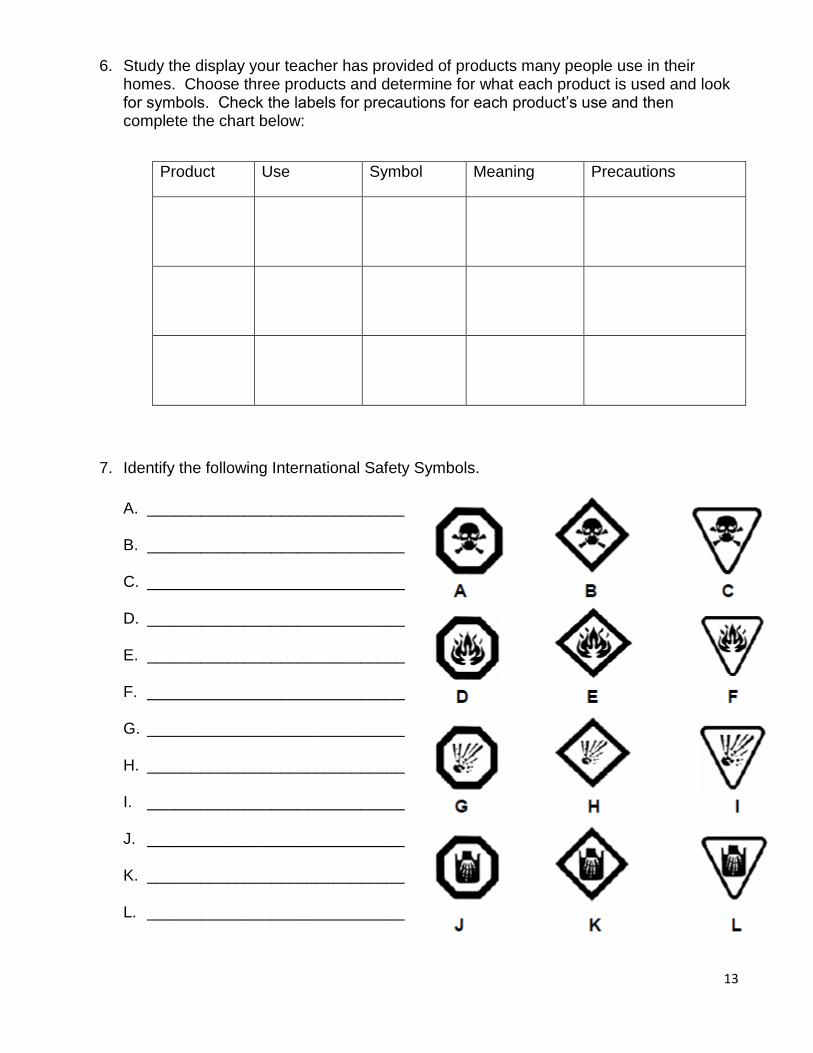
6. Study the display your teacher has provided of products many people use in their homes. Choose three products and determine for what each product is used and look for symbols. Check the labels for precautions for each product’s use and then complete the chart below:
Product Use Symbol Meaning Precautions
7. Identify the following International Safety Symbols.
A. _____________________________
B. _____________________________
C. _____________________________
D. _____________________________
E. _____________________________
F. _____________________________
G. _____________________________
H. _____________________________
I. _____________________________
J. _____________________________
K. _____________________________
L. _____________________________

14
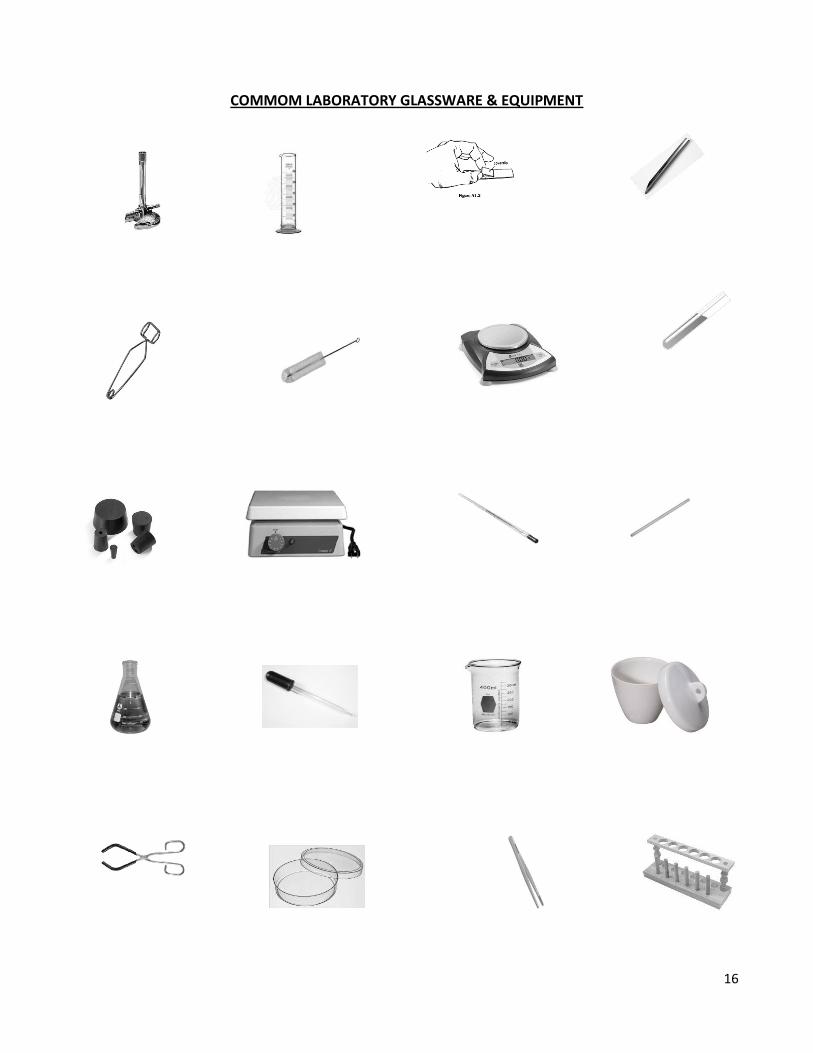
Common Laboratory Equipment
beaker bottle brush Bunsen burner crucible electronic balance eye dropper flask forceps glass slide and cover plate graduated cylinder hot plate petri dish scoopula stoppers stirring rod test tube test tube clamps test tube rack thermometer eye dropper tongs
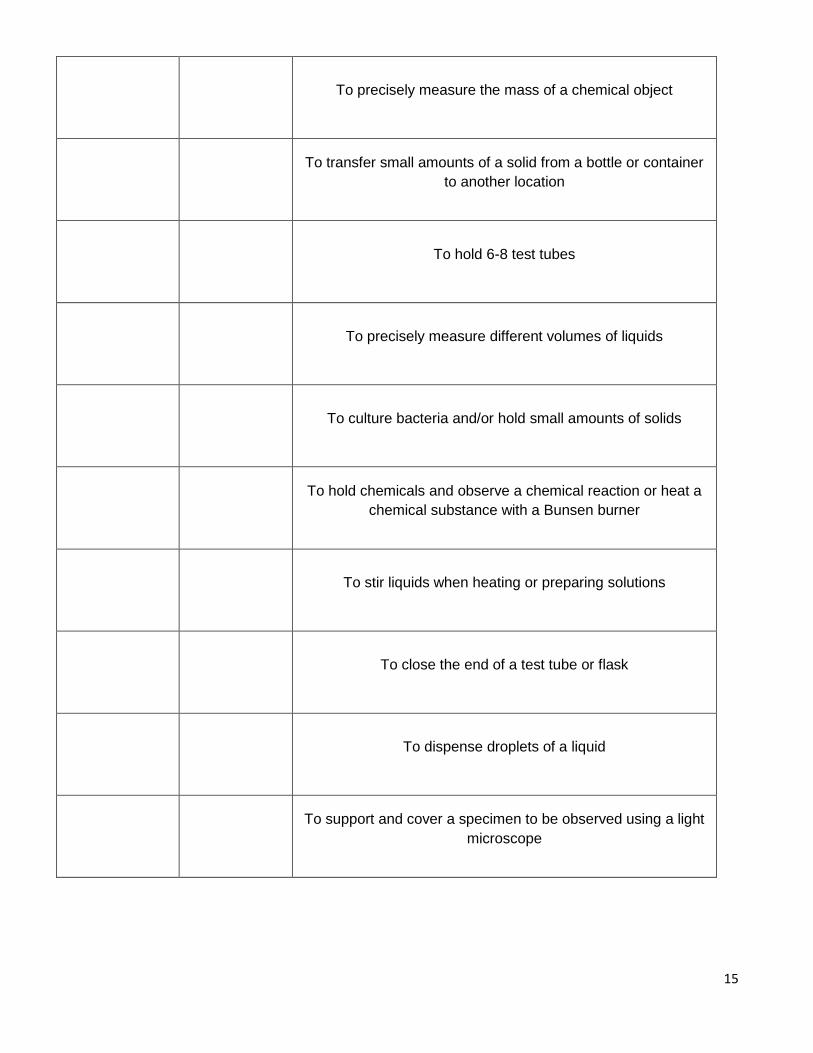
Picture Name Function
To pick up a hot test tube or hold a test tube when heating
To provide a source of heat energy (without an open flame) for
an experiment
To mix and store solutions
To measure the temperature (i.e., average kinetic energy of
matter)
To temporarily hold or heat liquids
To thoroughly clean a test tube, beaker, or flask
To safely pick up and/or pour the contents of a hot beaker
To provide a source of heat energy (open flame) for an
experiment
TO pick up and examine small solids without using hands
15
To precisely measure the mass of a chemical object
To transfer small amounts of a solid from a bottle or container
to another location
To hold 6-8 test tubes
To precisely measure different volumes of liquids
To culture bacteria and/or hold small amounts of solids
To hold chemicals and observe a chemical reaction or heat a
chemical substance with a Bunsen burner
To stir liquids when heating or preparing solutions
To close the end of a test tube or flask
To dispense droplets of a liquid
To support and cover a specimen to be observed using a light
microscope
16
COMMOM LABORATORY GLASSWARE & EQUIPMENT
17
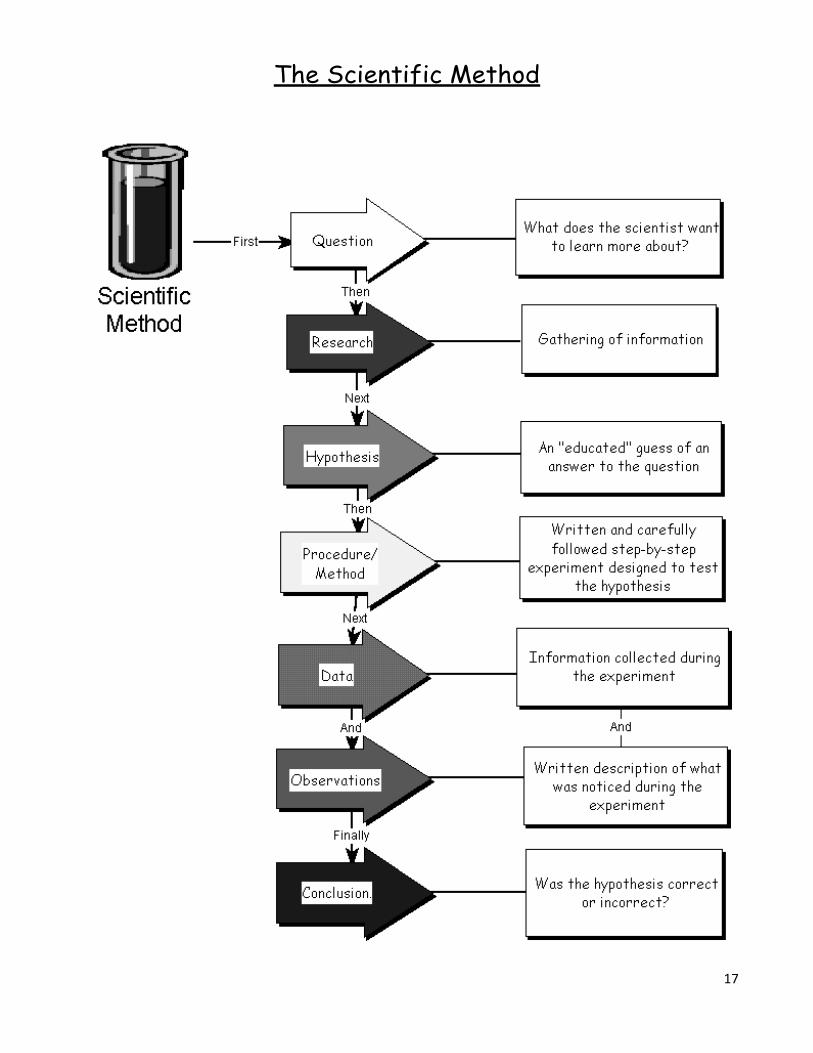
The Scientific Method
18
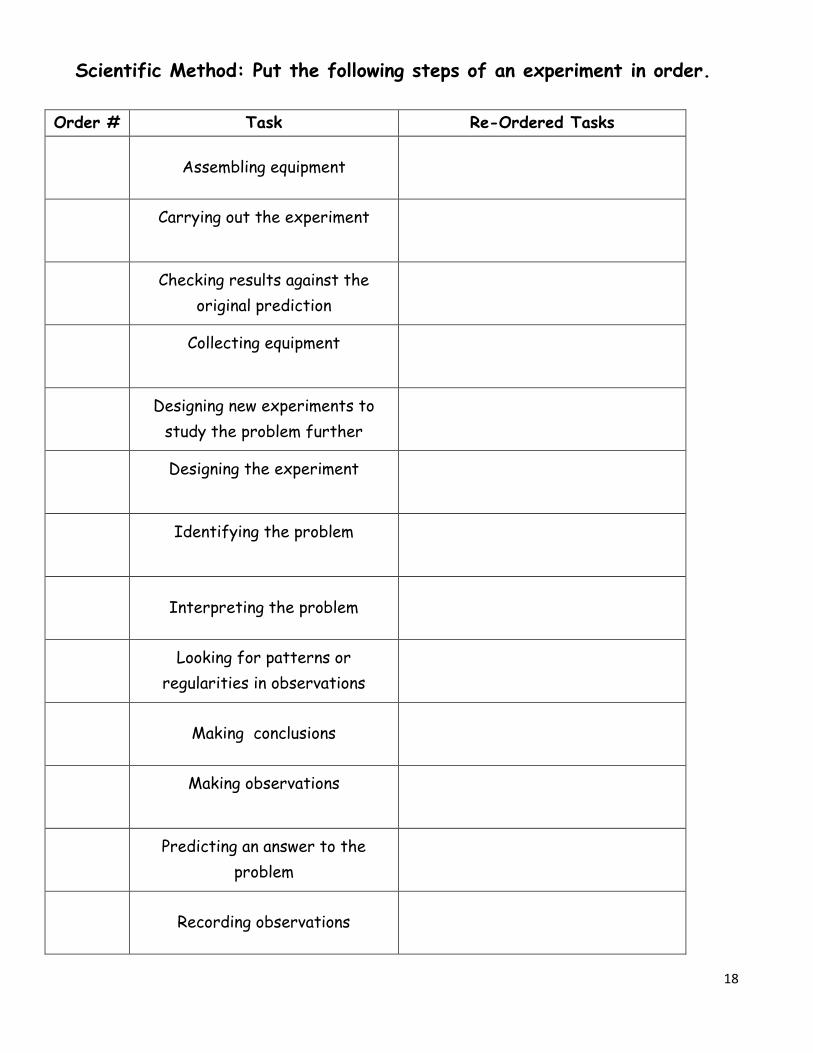
Scientific Method: Put the following steps of an experiment in order.
Order # Task Re-Ordered Tasks
Assembling equipment
Carrying out the experiment
Checking results against the
original prediction
Collecting equipment
Designing new experiments to
study the problem further
Designing the experiment
Identifying the problem
Interpreting the problem
Looking for patterns or
regularities in observations
Making conclusions
Making observations
Predicting an answer to the
problem
Recording observations
19
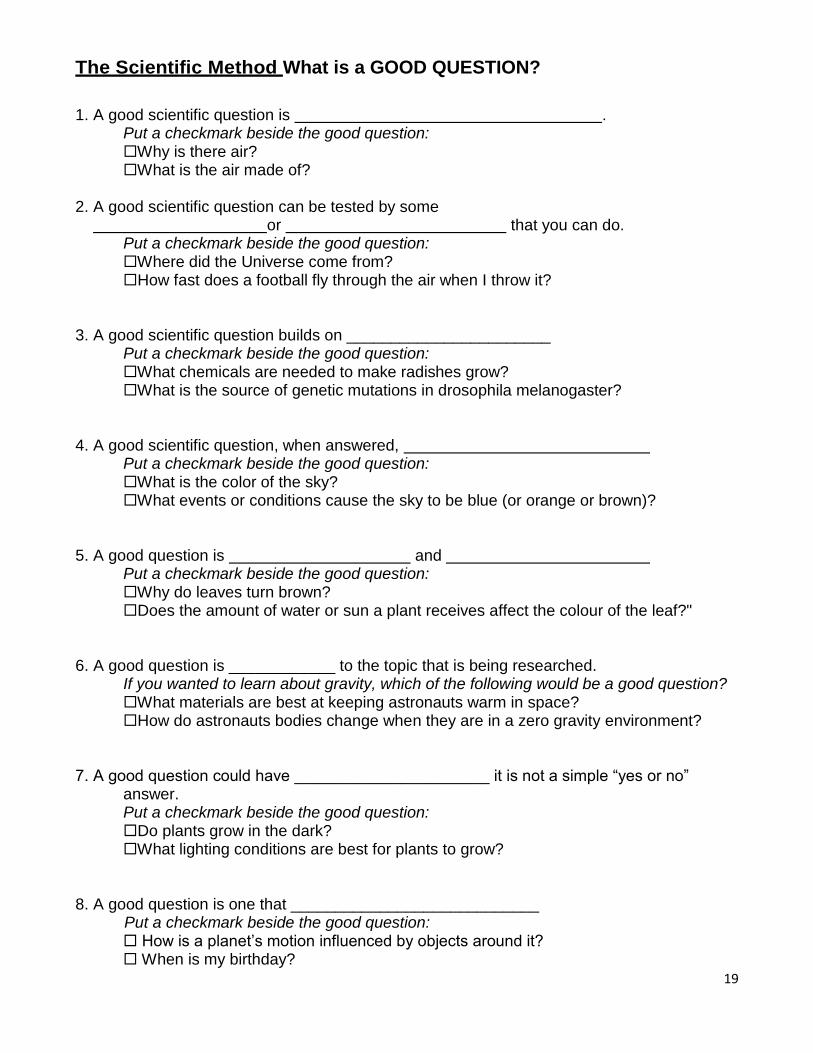
The Scientific Method What is a GOOD QUESTION?
1. A good scientific question is . Put a checkmark beside the good question:
Why is there air? What is the air made of?
2. A good scientific question can be tested by some or that you can do. Put a checkmark beside the good question:
Where did the Universe come from? How fast does a football fly through the air when I throw it?
3. A good scientific question builds on _______________________ Put a checkmark beside the good question:
What chemicals are needed to make radishes grow? What is the source of genetic mutations in drosophila melanogaster?
4. A good scientific question, when answered, Put a checkmark beside the good question:
What is the color of the sky? What events or conditions cause the sky to be blue (or orange or brown)?
5. A good question is and Put a checkmark beside the good question:
Why do leaves turn brown? Does the amount of water or sun a plant receives affect the colour of the leaf?"
6. A good question is ____________ to the topic that is being researched.
If you wanted to learn about gravity, which of the following would be a good question? What materials are best at keeping astronauts warm in space? How do astronauts bodies change when they are in a zero gravity environment?
7. A good question could have ______________________ it is not a simple “yes or no”
answer. Put a checkmark beside the good question: Do plants grow in the dark? What lighting conditions are best for plants to grow? 8. A good question is one that ____________________________ Put a checkmark beside the good question: How is a planet’s motion influenced by objects around it? When is my birthday?
20
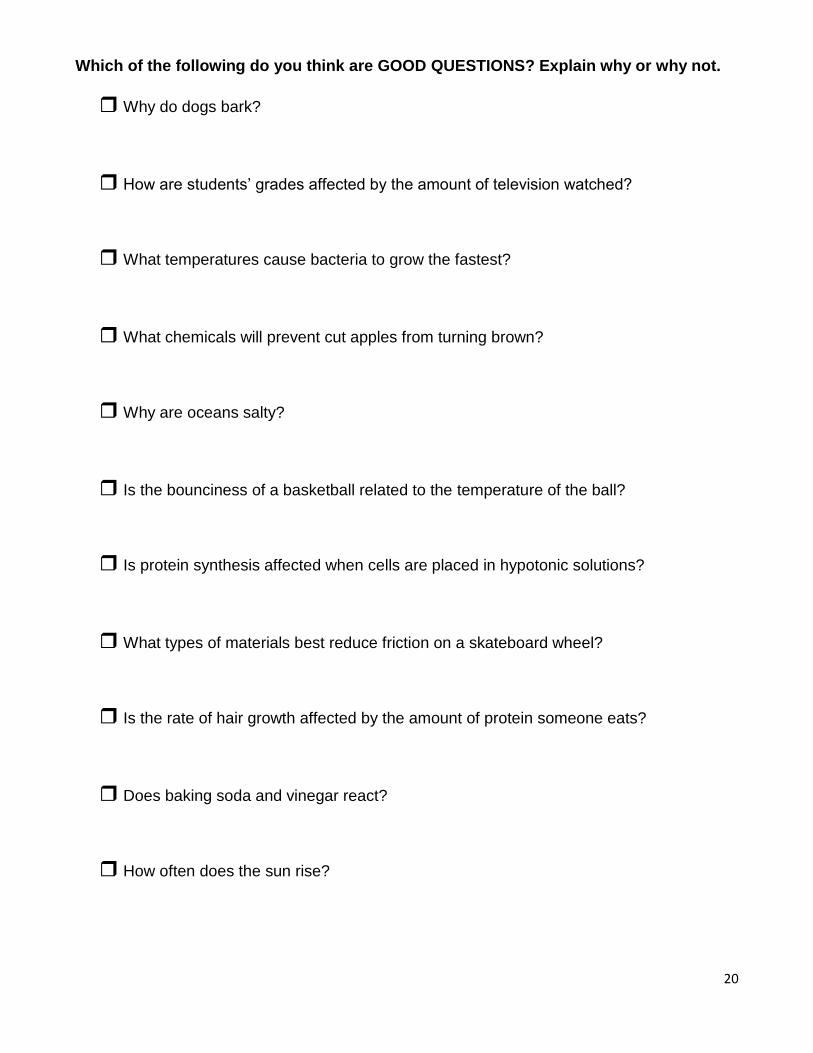
Which of the following do you think are GOOD QUESTIONS? Explain why or why not.
Why do dogs bark?
How are students’ grades affected by the amount of television watched?
What temperatures cause bacteria to grow the fastest?
What chemicals will prevent cut apples from turning brown?
Why are oceans salty?
Is the bounciness of a basketball related to the temperature of the ball?
Is protein synthesis affected when cells are placed in hypotonic solutions?
What types of materials best reduce friction on a skateboard wheel?
Is the rate of hair growth affected by the amount of protein someone eats?
Does baking soda and vinegar react?
How often does the sun rise?
21
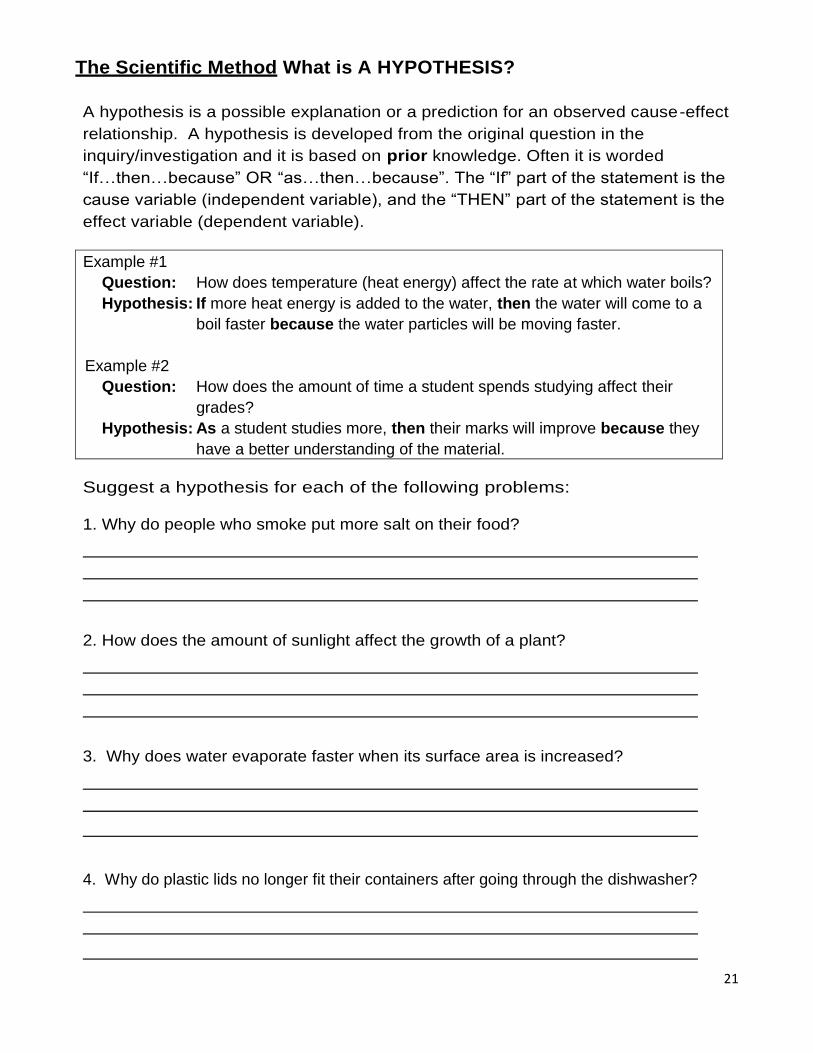
The Scientific Method What is A HYPOTHESIS?
A hypothesis is a possible explanation or a prediction for an observed cause-effect
relationship. A hypothesis is developed from the original question in the
inquiry/investigation and it is based on prior knowledge. Often it is worded
“If…then…because” OR “as…then…because”. The “If” part of the statement is the
cause variable (independent variable), and the “THEN” part of the statement is the
effect variable (dependent variable).
Example #1
Question: How does temperature (heat energy) affect the rate at which water boils?
Hypothesis: If more heat energy is added to the water, then the water will come to a
boil faster because the water particles will be moving faster.
Example #2
Question: How does the amount of time a student spends studying affect their
grades?
Hypothesis: As a student studies more, then their marks will improve because they
have a better understanding of the material.
Suggest a hypothesis for each of the following problems: 1. Why do people who smoke put more salt on their food?
2. How does the amount of sunlight affect the growth of a plant?
3. Why does water evaporate faster when its surface area is increased?
4. Why do plastic lids no longer fit their containers after going through the dishwasher?
22
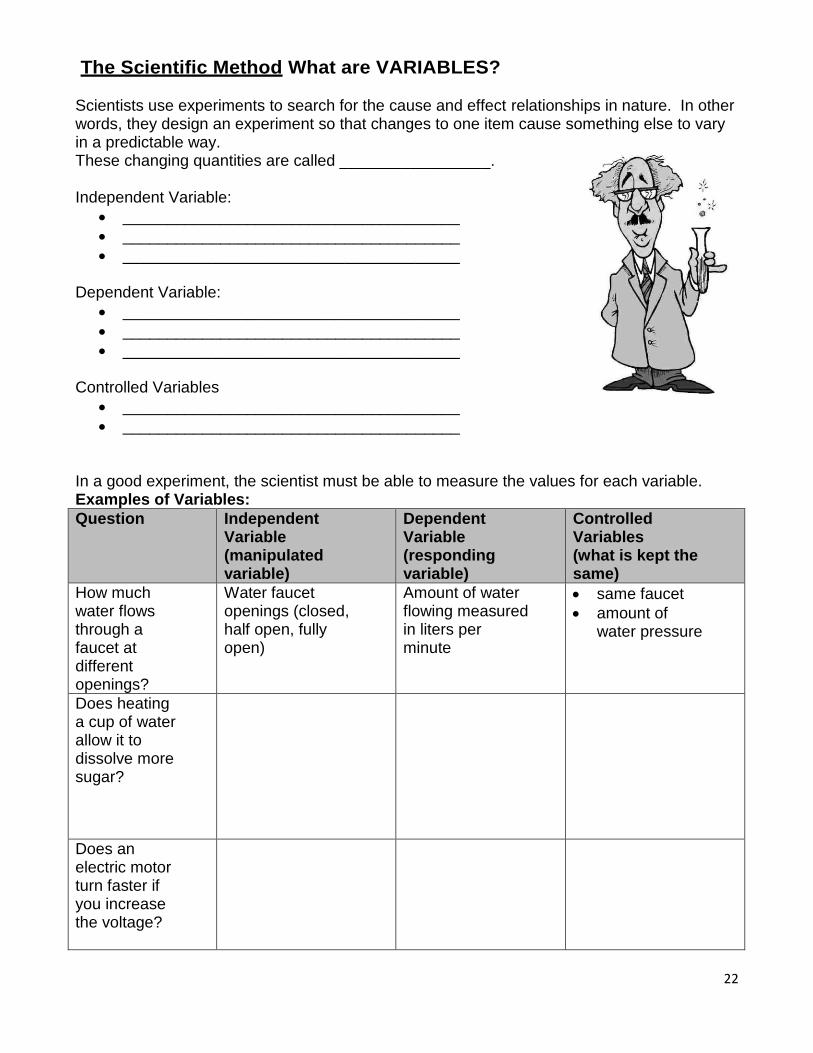
The Scientific Method What are VARIABLES? Scientists use experiments to search for the cause and effect relationships in nature. In other words, they design an experiment so that changes to one item cause something else to vary in a predictable way. These changing quantities are called _________________. Independent Variable:
______________________________________
______________________________________
______________________________________ Dependent Variable:
______________________________________
______________________________________
______________________________________ Controlled Variables
______________________________________
______________________________________
In a good experiment, the scientist must be able to measure the values for each variable. Examples of Variables:
Question Independent Variable (manipulated variable)
Dependent Variable (responding variable)
Controlled Variables (what is kept the same)
How much water flows through a faucet at different openings?
Water faucet openings (closed, half open, fully open)
Amount of water flowing measured in liters per minute
same faucet
amount of water pressure
Does heating a cup of water allow it to dissolve more sugar?
Does an electric motor turn faster if you increase the voltage?

23
Identifying Controls and Variables - Practice Target: I will be able to: Identify manipulated (independent), responding (dependent), and controlled variables in a scientific investigation.
Smithers thinks that a special juice will increase the productivity of workers. He creates two groups of 50 workers each and assigns each group the same task (in this case, they're supposed to staple a set of papers). Group A is given the special juice to drink while they work. Group B is not given the special juice. After an hour, Smithers counts how many stacks of papers each group has made. Group A made 1,587 stacks, Group B made 2,113 stacks.
Topic or problem you wish to investigate: Smithers thinks that a special juice will increase the productivity of workers. Specific Question: Will the special juice that Smithers has increase the productivity of workers? What is the manipulated (independent) variable for this problem? What is the responding (dependent) variable for this problem? List at least three (3) variables that should be controlled.
Homer notices that his shower is covered in a strange green slime. His friend Barney tells him that coconut juice will get rid of the green slime. Homer decides to check this out by spraying half of the shower with coconut juice. He sprays the other half of the shower with water. After 3 days of "treatment" there is no change in the appearance of the green slime on either side of the shower@*
Topic or problem you wish to investigate: Homers shower is covered in a strange green slime. Specific Question: Will coconut juice remove the strange green slime that is covering Homer’s shower? What is the manipulated (independent) variable for this problem? What is the responding (dependent) variable for this problem? List at least three (3) variables that should be controlled.
24
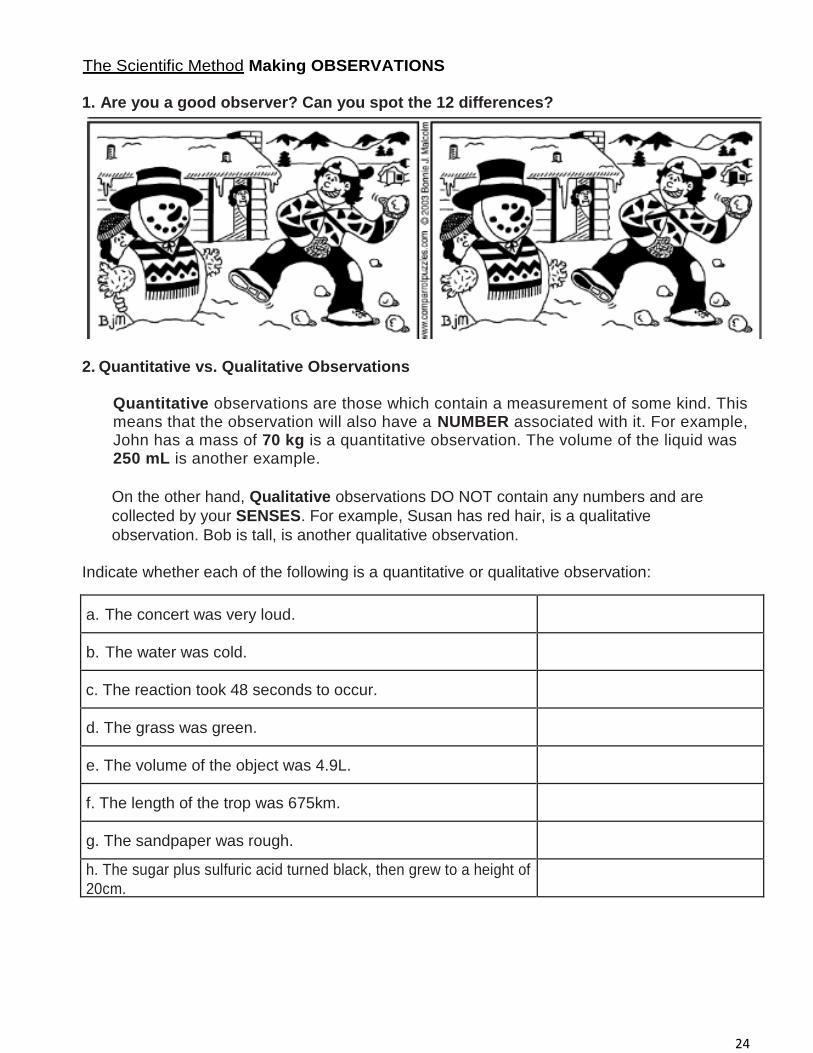
The Scientific Method Making OBSERVATIONS 1. Are you a good observer? Can you spot the 12 differences?
2. Quantitative vs. Qualitative Observations
Quantitative observations are those which contain a measurement of some kind. This means that the observation will also have a NUMBER associated with it. For example, John has a mass of 70 kg is a quantitative observation. The volume of the liquid was 250 mL is another example.
On the other hand, Qualitative observations DO NOT contain any numbers and are
collected by your SENSES. For example, Susan has red hair, is a qualitative
observation. Bob is tall, is another qualitative observation.
Indicate whether each of the following is a quantitative or qualitative observation:
a. The concert was very loud.
b. The water was cold.
c. The reaction took 48 seconds to occur.
d. The grass was green.
e. The volume of the object was 4.9L.
f. The length of the trop was 675km.
g. The sandpaper was rough.
h. The sugar plus sulfuric acid turned black, then grew to a height of
20cm.
25
The Scientific Method Recording RESULTS & OBSERVATIONS Observations (both quantitative and qualitative) are best recorded in table. Examine the observation table below. Question: How does adding a mass to the end of an elastic affect its length?
Table 1: How the mass of an object affects the length of an elastic band
Mass of object (g) Length of elastic (cm)
0 20
200 22
400 25
750 27
1000 30
What makes this a good observation table? How else could you show these results in a meaningful way? Read the question below and design your own observation (data) table. Question: How does the amount of time stirring affect the amount of salt that dissolves in a glass
of water?
26
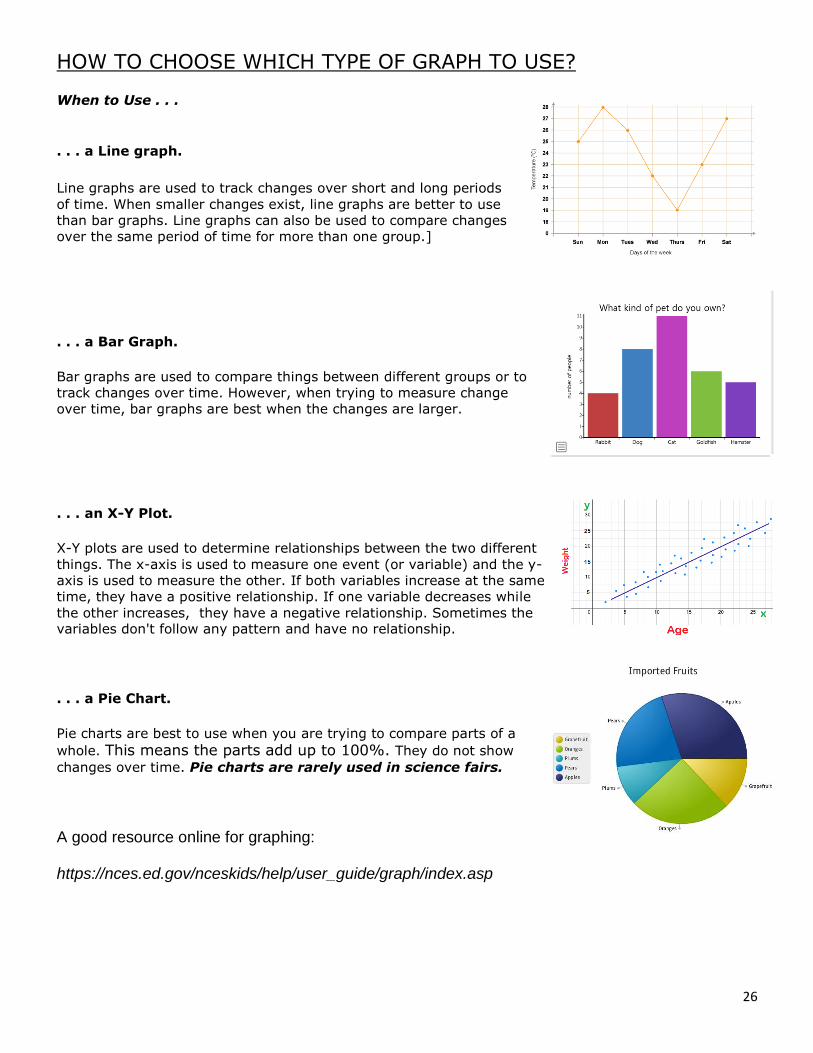
HOW TO CHOOSE WHICH TYPE OF GRAPH TO USE?
When to Use . . .
. . . a Line graph.
Line graphs are used to track changes over short and long periods
of time. When smaller changes exist, line graphs are better to use
than bar graphs. Line graphs can also be used to compare changes
over the same period of time for more than one group.]
. . . a Bar Graph.
Bar graphs are used to compare things between different groups or to
track changes over time. However, when trying to measure change
over time, bar graphs are best when the changes are larger.
. . . an X-Y Plot.
X-Y plots are used to determine relationships between the two different
things. The x-axis is used to measure one event (or variable) and the y-
axis is used to measure the other. If both variables increase at the same
time, they have a positive relationship. If one variable decreases while
the other increases, they have a negative relationship. Sometimes the variables don't follow any pattern and have no relationship.
. . . a Pie Chart.
Pie charts are best to use when you are trying to compare parts of a
whole. This means the parts add up to 100%. They do not show
changes over time. Pie charts are rarely used in science fairs.
A good resource online for graphing: https://nces.ed.gov/nceskids/help/user_guide/graph/index.asp
27
CONSTRUCTING LINE GRAPHS
When you draw a graph:
Always include a title. Use the independent and dependent variables in the title,
e.g., Effect of Amount of Light on Plant Growth.
Always label the independent variable on the x-axis and the responding variable on the y-axis.
If there are units, place them with the heading at the top of the column.
Use marks on the axes to show which lines the scale numbers relate to.
Line Graphs
Use the following steps to construct line graphs from the data below.
1. Identify the independent and dependent variable.
2. Draw and label the x- and y-axis on grid paper (remember to place the independent variable on the x-axis and the dependent variable on the y-axis).
3. Give your graph a title.
4. Study the data in the chart and decide on a scale for the x- and y-axis. The scale will probably not be the same for each axis. When choosing your scale, remember that the graph should fit on one piece of graph paper and that it should be large enough to fill most of the page. Your scale must increase by regular amounts for the entire axis (i.e., increase by twos, by fives, by tens, etc.). Your scale need not start at zero if it is not suitable for your data.
5. Mark the scale on the axes. Make sure you have placed marks so that it is easy to see which line the scale number goes with.
6. Plot the points on the graph. Draw a small circle around each point. If you are plotting more than one set of data on the graph, use different shapes or colours to surround the points.
7. Do not draw a straight line from one point to the next. Doing this makes a broken line graph, which is rarely used in “real” science. Draw a smooth line through the points, as close to each point as you can. This is called a “line of best fit.” This type of line shows the trend of the data. Graphs in science are used for showing relationships and for making predictions. The “line of best fit” serves both purposes.
28
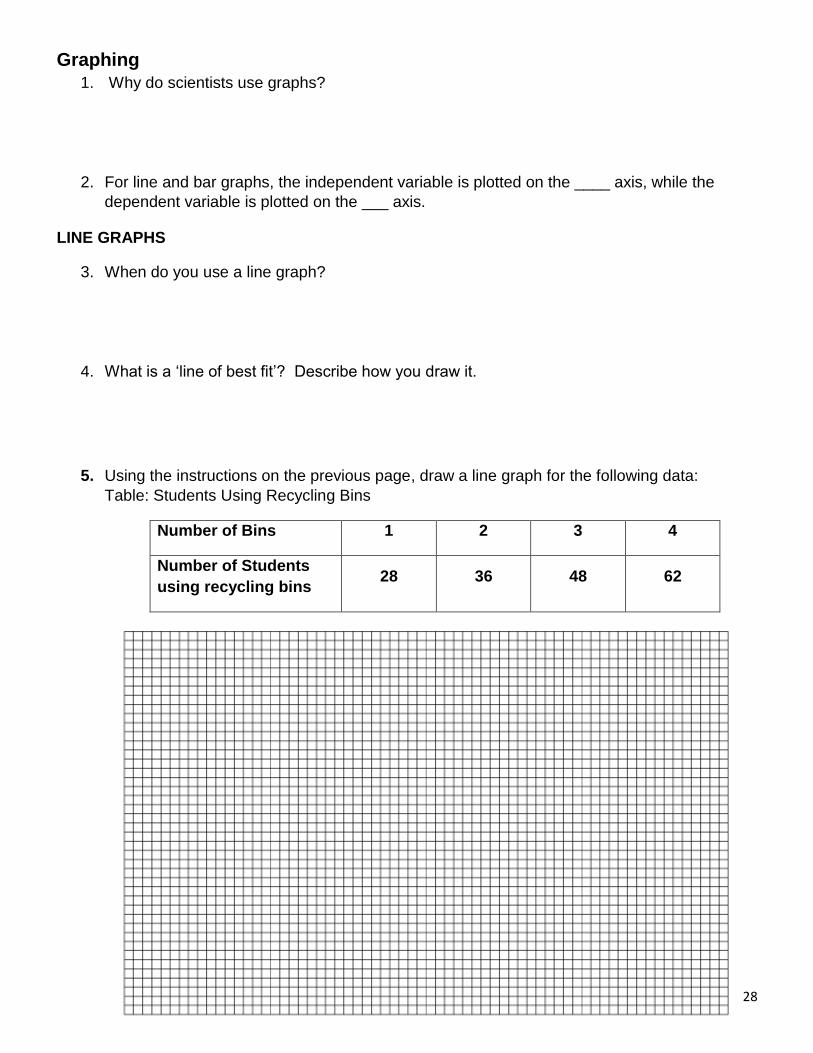
Graphing
1. Why do scientists use graphs?
2. For line and bar graphs, the independent variable is plotted on the ____ axis, while the
dependent variable is plotted on the ___ axis.
LINE GRAPHS
3. When do you use a line graph?
4. What is a ‘line of best fit’? Describe how you draw it.
5. Using the instructions on the previous page, draw a line graph for the following data:
Table: Students Using Recycling Bins
Number of Bins 1 2 3 4
Number of Students
using recycling bins 28 36 48 62
29
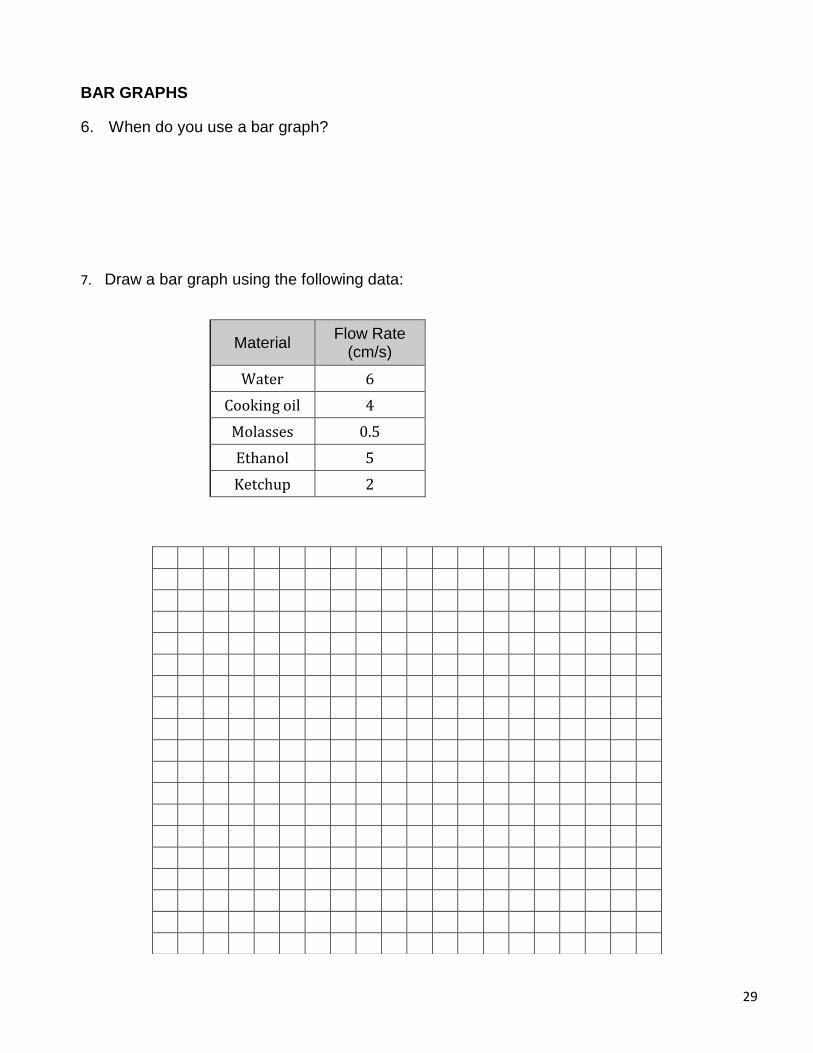
BAR GRAPHS
6. When do you use a bar graph?
7. Draw a bar graph using the following data:
Material
Flow Rate (cm/s)
Water 6
Cooking oil 4
Molasses 0.5
Ethanol 5
Ketchup 2

30
The Scientific Method Conclusion A good conclusion should include:
A statement of the purpose
Whether the hypothesis was supported or rejected
A sentence or two summarizing your results, with data
Any problems you may have had
A future experiment that can build on your results *Remember, in a formal conclusion, never use I, we, you, they, she, he…etc. Example: The purpose of this experiment was to test the new fertilizer, Brand A, on plant growth. The hypothesis that Brand A would cause plants to grow taller than plants treated with store bought fertilizers was rejected. Plants treated with Brand A grew 1.5 cm in one week, whereas plants treated with store-bought fertilizer grew 1.9 cm in one week. One problem that occurred was that Brand A appeared to oxidize when exposed to sunlight, reducing its efficacy. In the future, it would be interesting to apply Brand A at night time to see if application without sunlight results in more effective plant growth. Now your turn… Purpose: to determine if moisture affects the growth of bacteria Hypothesis: If bacteria plates are exposed to higher levels of moisture, then more bacteria will grow. Results:
Plate Number Amount of Water Added (mL)
Number of Bacteria Colonies
1 0 5
2 10 7
3 20 20
Conclusion:

![Appendix A EPBC Act Protected Matters Reports Report 1 ... · Freshwater Crocodile, Johnston's Crocodile, Johnston's River Crocodile [1773] Species or species habitat may occur within](https://static.fdocuments.in/doc/165x107/5e3522f3644d0334f1135f72/appendix-a-epbc-act-protected-matters-reports-report-1-freshwater-crocodile.jpg)