Science or Compliance: Will Section 404(b) Compliance ... · of internal controls over financial...
56
1 Science or Compliance: Will Section 404(b) Compliance Impede Innovation by Emerging Growth Companies in the Biotech Industry? Craig Lewis Senior Advisor, Patomak Partners and Madison S. Wigginton Professor of Finance Owen Graduate School of Management Vanderbilt University Professor of Law Vanderbilt Law School Joshua T. White Assistant Professor of Finance Owen Graduate School of Management Vanderbilt University February 11, 2019
Transcript of Science or Compliance: Will Section 404(b) Compliance ... · of internal controls over financial...

1
Science or Compliance: Will Section 404(b) Compliance Impede Innovation
by Emerging Growth Companies in the Biotech Industry?
Craig Lewis
Senior Advisor, Patomak Partners and
Madison S. Wigginton Professor of Finance
Owen Graduate School of Management
Vanderbilt University
Professor of Law
Vanderbilt Law School
Joshua T. White
Assistant Professor of Finance
Owen Graduate School of Management
Vanderbilt University
February 11, 2019

2
Executive Summary
In 2012, Congress passed the Jumpstart Our Business Startups (“JOBS”) Act to encourage
capital formation in small companies.1 As the media noted at the time, the JOBS Act was aimed
at helping small biotech and technology companies with low revenue gain access to capital needed
for growth by easing regulatory compliance burdens.2 Title I of the JOBS Act created a class of
issuers known as Emerging Growth Companies (“EGCs”), based on certain financial requirements
such as annual gross revenues of less than $1 billion.3 To encourage small companies to conduct
an initial public offering (“IPO”), the “IPO On-Ramp” provisions of the JOBS Act instructed the
U.S. Securities and Exchange Commission (“SEC”) to ease disclosure and financial-statement
obligations for EGCs.4 The IPO On-Ramp provides a five-year exemption from auditor attestation
of internal controls over financial reporting (“ICFR”) mandated by Section 404(b) of the Sarbanes-
Oxley Act (“SOX”).5 This relief is especially important for EGCs because Section 404(b)
compliance costs have long been recognized by market participants, academic studies, the SEC,
and lawmakers as disproportionately large for small companies.
In the years following the passage of the JOBS Act, EGCs represent almost 90% of all
companies going public in the U.S.6 Almost 40% of these EGCs are biotech companies that operate
in the health care industry (hereafter “Bio-EGC”). Bio-EGCs are substantially different from other
EGCs in that they frequently have zero or extremely low revenues, which is largely attributable to
being at relatively early stages of their company lifecycles – a time when product development
requires significant research and development (“R&D”) expenditures. On average, successful
biotech companies spend 10 to 15 years building and staffing laboratories to conduct research and
clinical trials before receiving their first U.S. Food and Drug Administration (“FDA”) therapy
approval.7 These R&D periods are longer than any other sector, including “tech” start-ups.
1 See JOBS Act at https://www.gpo.gov/fdsys/pkg/BILLS-112hr3606enr/pdf/BILLS-112hr3606enr.pdf. 2 See Jose Pagliery, “JOBS Act opens fundraising doors for small firms.” CNN Money, Apr 6, 2012, available at
https://money.cnn.com/2012/04/05/smallbusiness/jobs-act/index.htm. 3 The SEC raised the EGC annual gross revenue cap to $1.07 billion in April 2017 to adjust for inflation. See
https://www.sec.gov/rules/final/2017/33-10332.pdf. 4 The notion of an “IPO On-Ramp” was introduced by the IPO Task Force in a presentation to the U.S. Department
of Treasury in Oct. 2011. See https://www.sec.gov/info/smallbus/acsec/rebuilding_the_ ipo_on-ramp.pdf. 5 See SEC, Emerging Growth Companies, available at https://www.sec.gov/smallbusiness/goingpublic/EGC. 6 Based on the percentage of effective registration statements for IPO companies. See Ernst & Young, Trends in US
IPO Registration Statements, Nov 2018, https://www.ey.com/publication/vwluassetsdld/iporegistrationstatements_
04688-181us_30october2018/$file/iporegistrationstatements_04688-181us_30october2018.pdf. 7 See Biotechnology Innovation Organization, “The Biotechnology Ecosystem: By the Numbers,” available at
https://www.bio.org/toolkit/infographics/biotechnology-ecosystem-numbers.

3
Given that Bio-EGCs tend to have long R&D periods in which they operate with no product
revenue, the planned five-year phase-in of Section 404(b) compliance will require Bio-EGCs to
incur substantial compliance costs at a time when the benefits from auditor attestation are small
due to the relatively straightforward accounting issues that typify Bio-EGCs. Thus, an updated
analysis of the potential costs and benefits of extending Section 404(b) compliance exemptions for
Bio-EGCs is an important consideration for the SEC when balancing investor protection and
capital formation.
We review academic literature on Section 404(b) compliance and the JOBS Act.8 Studies
link Section 404(b) compliance to reduced market capitalization, higher audit fees, exiting of
public markets, and a direct reduction in innovation such as R&D that results in fewer patents.
Academic studies also find limited benefits as the market does not significantly value disclosures
of internal control weaknesses, and disclosing non-effective ICFR by managers and auditors do
not predict future material weaknesses. Put simply, academic evidence implies that the costs of
Section 404(b) compliance will be high and the benefits will be low for Bio-EGCs that lose their
exemption. Academic studies of the JOBS Act find that exemption from Section 404(b)
compliance significantly boosted IPO volume that was largely concentrated in Bio-EGCs. Thus,
extending the exemption from Section 404(b) for low revenue Bio-EGCs could further boost IPO
activity and encourage existing Bio-EGCs to remain public, thereby facilitating capital formation.
We next analyze financial characteristics of 300 Bio-EGCs that raised $25 billion in IPOs
since the JOBS Act. Almost 85% of these Bio-EGCs remain public while most of the remaining
balance are either acquired or merged into another company. Bio-EGCs are geographically
distributed throughout the U.S. and create both economic and societal benefits by developing
therapeutic products targeting a variety of healthcare diseases.
Even though almost 90% of Bio-EGCs go public as early-stage start-ups, they often
achieve large market capitalizations as investors value their potential to create innovative medical
breakthroughs. Despite generating little to no revenue, the current SEC’s current reporting rules
will categorize many of these companies as “accelerated” or “large accelerated” filers once they
lose EGC status.
Our analysis demonstrates that the financial characteristics of Bio-EGCs are similar to non-
accelerated filers – a classification that permanently exempts companies from Section 404(b)
under the Dodd-Frank Act. As a result, we argue that regulators and lawmakers should recognize
8 Section 2 reviews academic literature and provides specific citations.

4
the unique aspects of the biotech industry and consider extending the exemption from Section
404(b) compliance for Bio-EGCs with low revenue. The need for Section 404(b) is largely
mitigated by the straightforward accounting issues a Bio-EGC must address when preparing its
financial statements. This simplicity is one of the key factors that allow us to conclude that the
planned phase-in of Section 404(b) compliance for Bio-EGCs will impede innovation and capital
formation with little benefit to investors. Consistent with the conjecture that accounting issues are
straightforward, Bio-EGCs using relief from Section 404(b) compliance are significantly less
likely to restate financials or have non-effective ICFR designations than other listed companies
that are complying with Section 404(b).
We also present survey evidence that annual Section 404(b) compliance would cost
approximately $412,143 in auditor fees, $192,000 in external consultant fees, and $203,750 in
internal labor costs for each biotech company that loses EGC status. Thus, total Section 404(b)
compliance is estimated to be $807,893 per year. Extending the exemption from Section 404(b)
for an additional five years would save each Bio-EGC approximately $4,000,000 in compliance
costs that could instead be used to fund innovative therapeutics. Bio-EGCs overwhelmingly report
that they would use incremental compliance savings from extending Section 404(b) exemption to
increase annual investments in R&D and hire additional employees. These findings are important
because we show that Bio-EGC employment grows by approximately 200% during the five fiscal
years after going public – more than double the growth rate of Non-Bio EGCs. Thus, diverting
Bio-EGC resources to compliance could attenuate strong employment growth trends, thereby
undermining the intent of the JOBS Act to facilitate capital formation and increase employment at
innovative companies.
Taken together, our report shows that phased-in Section 404(b) compliance for Bio-EGCs
would result in disproportionately high costs with almost no investor protection benefits.
Moreover, this planned phase-in will impede both capital formation and biotech innovation. We
argue that the SEC should exempt low-revenue biotech companies losing EGC status from Section
404(b) so that innovative companies can more efficiently deploy scarce capital for additional
product development, clinical trials, hiring, and other therapeutic development processes intended
to ensure product safety and efficacy for patients. In effect, resources for low-revenue biotech
companies would be better used for science than compliance with Section 404(b).

5
Table of Contents
Executive Summary ........................................................................................................................ 2 Table of Contents ............................................................................................................................ 5 Introduction ..................................................................................................................................... 6 1. Financial Reporting Environment for Small Public Companies............................................... 10
1.1. Tiers of Periodic SEC Reporting Requirements Based on Public Float ............................ 10 1.2. Section 404(b) under the Sarbanes-Oxley Act of 2002 ..................................................... 13 1.3. The JOBS Act and Emerging Growth Companies ............................................................ 17
2. Academic Studies on SOX, Section 404, and the JOBS Act .................................................... 18 2.1. Studies on the Costs of Section 404 ................................................................................... 18 2.2. Studies on the Consequences and Effectiveness of Section 404 ....................................... 20 2.3. Studies on the JOBS Act and IPOs .................................................................................... 21 2.4. Summary of Academic Evidence and Implications for Extending Section 404(b) Relief 22
3. Empirical Analysis of Bio-EGCs .............................................................................................. 23 3.1. Descriptive Statistics for Biotech EGCs ............................................................................ 23 3.2. Financial Characteristics of EGCs ..................................................................................... 25 3.3. Financial Restatements Analysis ....................................................................................... 28 3.4. Manager and Auditor Reports of ICFR ............................................................................. 30 3.5. Summary of Empirical Analysis ........................................................................................ 31
4. Survey Evidence on Compliance Costs of Section 404(b) ....................................................... 31 4.1. Existing evidence on compliance costs ............................................................................. 31
Exhibit 1. A.R.C. Morgan’s Section 404 Compliance Cost Data ......................................... 32 Exhibit 2. Anecdotal Estimates of Section 404(b) Compliance Costs for EGCs ................. 35
4.2. BIO Survey Results ........................................................................................................... 35 Exhibit 3. Survey Estimate of Section 404(b) Compliance Costs for Bio-EGCs ................. 37
5. Implications of Section 404(b) for the Biotech Industry .......................................................... 38 5.1. Unique Aspects of Bio-EGCs ............................................................................................ 38 5.2. Bio-EGC Value Drivers ..................................................................................................... 39 5.3. Disproportionate Costs and Limited Benefits of Complying with Section 404(b) ............ 39 5.4. Benefits of Extending Section 404(b) Relief ..................................................................... 40 5.5. An Alternative Regulatory Approach ................................................................................ 41
6. Conclusion ................................................................................................................................ 42 Academic Citations ....................................................................................................................... 44 Appendix. Variable Definitions .................................................................................................... 45 Figure 1. Biotech IPOs over 2006 to 2018 ................................................................................... 46 Figure 2. Employment Growth at Bio-EGCs ................................................................................ 46 Table 1. Industry Distribution of 300 Bio-EGCs .......................................................................... 47 Table 2. Therapeutic Target of 300 Bio-EGCs ............................................................................. 48 Table 3. Descriptive Statistics of 300 Bio-EGCs.......................................................................... 49 Table 4. Sample of Bio-EGC and Non-Bio EGC Firm Years ...................................................... 49 Table 5. Financial Characteristics of Bio-EGCs and Non-Bio EGCs .......................................... 50 Table 6. Financial Characteristics of Bio-EGCs and Other Listed Issuers ................................... 51 Table 7. Financial Restatements of Bio-EGCs and Non-Bio EGCs ............................................. 52 Table 8. Financial Restatement Firm Years by Filer Category .................................................... 52 Table 9. Financial Restatements of Bio-EGCs and Other Listed Issuers ..................................... 53 Table 10. Identification of Internal Controls Deficiencies ........................................................... 54 Table 11. Non-Effective ICFRs of Bio-EGCs and Other Listed Issuers ...................................... 54 Table 12. Survey Responses on the Impact of Section 404(b) Compliance ................................. 55

6
“Expensive regulatory requirements siphon innovation capital from the lab, diverting funds from science
to compliance on a quarterly and annual basis.”
–John Blake, then-Senior Vice President of Finance, aTyr Pharma, Inc., in testimony
before the U.S. House of Representatives Committee on Financial Services
Subcommittee on Capital Markets, Securities, and Investment (July 18, 2017).9
Introduction
The purpose of this study is to determine if phased-in Section 404(b) compliance for EGCs
would have a disproportionate effect on companies in the biotech industry that went public or are
considering going public as EGCs under the JOBS Act. Approximately 90% of effective IPO
registration statements since the JOBS Act were filed by EGCs with the largest concentration
operating in the health care industry (38%).10 We examine all Bio-EGCs conducting a post-JOBS
Act IPO and find that most have zero product revenue. Since these companies went public early
in their product lifecycle, and typically spend 10-15 years conducting R&D before generating
product revenue, they are particularly vulnerable to disproportionate compliance costs when
compared to the intended benefits of auditor attestation of ICFR. Given the early-stage nature of
Bio-EGCs, the compliance phase-in period of only five-years could have a detrimental effect on
the long-term prospects of existing Bio-EGCs and deter future Bio-EGCs from pursuing an IPO.
To reach our conclusions, we first review the academic literature on the effects of Section
404(b) compliance on small companies. The preponderance of academic evidence concludes that
Section 404(b) compliance is disproportionately costly for small companies, leading to significant
reductions in market capitalization (e.g., Iliev, 2010). Recent work also demonstrates that Section
404(b) compliance causes small companies to reduce innovation such as R&D that results in
patents (Gao and Zhang, 2018). Thus, complying with Section 404(b) has demonstrative real costs
on small innovative companies, such as Bio-EGCs, beyond costly audit fees.
9 See https://financialservices.house.gov/uploadedfiles/hhrg-115-ba16-wstate-jblake-20170718.pdf 10 An IPO registration statement is deemed to be effective if one of the following conditions is met: 1) the SEC order
declaring the registration statement effective; 2) the registration statement is filed and becomes automatically effective
under Rule 462(e) under the Securities Act; 3) 20 days after the registration statement is filed, when it becomes
automatically effective under Section 8(a) of the Securities Act; or 4) 60 days after the initial filing of a registration
statement under Section 12(g) of the Exchange Act. See Ernst & Young, “Update on Emerging Growth Companies
and the JOBS Act,” Nov 2016, https://www.ey.com/Publication/vwLUAssets/ey-update-on-emerging-growth-
companies-and-the-jobs-act-november-2016/%24FILE/ey-update-on-emerging-growth-companies-and-the-jobs-act-
november-2016.pdf; and “Trends in US IPO Registration Statements.” Nov 2018, https://www.ey.com/publication/
vwluassetsdld/iporegistrationstatements_04688-181us_30october2018/$file/iporegistrationstatements_04688-
181us_30october2018.pdf?OpenElement.

7
Academic studies also find limited benefits of Section 404(b) compliance. Evidence shows
that the majority of Section 404(b) auditor attestations of ICFR fail to identify future material
weaknesses (Rice and Weber, 2012). Evidence in Hammersley et al. (2008) shows that when
companies disclose material weaknesses in internal controls, the market response is not statistically
different from zero in a two-tailed test, suggesting that investors do not significantly change their
long-term value assessment of these companies. Put simply, academic studies surmise that the
costs of Section 404(b) are high and the benefits are low for small companies like Bio-EGCs.
Academic literature also links the JOBS Act, and especially relief from Section 404(b), to
a significant boost in IPO volume that is concentrated in biotech companies. Given the increase in
IPO volume, we argue that extending Section 404(b) relief beyond the current five-year phase-in
period would: (1) help existing Bio-EGCs maintain or expand existing R&D investment plans; and
(2) enhance capital formation by encouraging new biotech start-ups to conduct an IPO. These
outcomes would address recent concerns expressed by SEC Chairman Jay Clayton in testimony to
the U.S. House of Representatives that fewer promising emerging companies are going public, and
give so-called “main street investors” additional investment opportunities in start-up companies.11
Lower compliance costs for Bio-EGCs could also have societal benefits by encouraging additional
innovation and product development of drug treatments that take longer to develop and could
accelerate the time it takes to complete clinical trials.
We next analyze the characteristics of existing Bio-EGCs. As of this report date,
approximately 300 Bio-EGCs have gone public since the JOBS Act. This represents a 270%
increase in activity compared to the same period prior to JOBS Act. Bio-EGC IPOs have raised
approximately $25 billion after the JOBS Act. Almost 85% of Bio-EGCs remain listed, while most
of the remaining Bio-EGCs were acquired or merged with another company. Only 3% of Bio-
EGCs have gone bankrupt or delisted. Thus, despite the intrinsic risk of investing in a start-up
company, Bio-EGCs have endured as viable entities during the IPO On-Ramp period.
We find that Bio-EGCs are geographically dispersed in 20 states throughout the U.S. and
generate significant economic benefits to local, state and national economies. Importantly, Bio-
EGCs also create societal benefits by developing innovative therapeutic products targeting a
variety of healthcare diseases including neurology, cardiovascular, and infectious diseases. These
companies operate at the leading edge of scientific innovation and are important conduits for
11 See SEC Chairman Jay Clayton, Testimony on “Oversight of the U.S. Securities and Exchange Commission,”
Before the House Committee on Financial Services, Jun 21, 2018, available at https://www.sec.gov/news/testimony/
testimony-oversight-us-securities-and-exchange-commission.

8
transferring scientific research into therapeutic applications. For example, the lead drug candidate
at more than 25% of Bio-EGCs target oncology-based therapeutics (i.e., cancer).
In considering whether to extend Section 404(b) exemptions, we note that the current SEC
regime primarily classifies company size based on their common stock value rather than some
other metric such as revenue. However, an analysis of financial characteristics show that Bio-
EGCs are profoundly different than companies with similar market capitalizations. Due to unique
industry aspects, Bio-EGCs operate, on average, for 10 to 15 years before generating product
revenue and remain unprofitable with negative free cash flow during this period as resources are
largely poured into R&D. Thus, the planned phase-in of Section 404(b) for existing Bio-EGCs
would significantly and disproportionately impact cash available for product development.
We also compare Bio-EGCs to other listed issuers. On average, Bio-EGCs have larger
market capitalizations than accelerated filers because investors value the science and technology
underpinning their potential to create significant medical breakthroughs. However, across many
other dimensions, Bio-EGCs are more similar to non-accelerated filers, which are permanently
exempt from Section 404(b) compliance under the Dodd-Frank Act. For example, only a few Bio-
EGC companies going public under the JOBS Act have generated product revenue, making an
SEC classification based on market capitalization problematic because, although these firms may
have outsized valuations, they are economically closer to non-accelerated filers on nearly every
other dimension. As a result, we argue that regulators and lawmakers should recognize the unique
aspects of the biotech industry, such as high cash to asset ratios and low or zero product revenue
generation, when considering an extended exemption from Section 404(b) compliance.
One concern that regulators might have in extending Section 404(b) compliance beyond
the five-year IPO On-Ramp is that a lack of auditor attestation of ICFR might result in lower
quality financial reporting and greater instances of financial restatements. Our evidence does not
support this notion. As noted above, studies find limited benefits of auditor attestation. Notably,
auditor attestation does not predict future material weaknesses in internal controls (Rice and
Weber, 2012). To assess this further, we compare the financial restatement frequency of Bio-EGCs
to both Non-Bio EGCs and other listed issuers. Our regression tests show that the frequency of
restatements for Bio-EGCs are not statistically different from Non-Bio EGCs, both of which were
exempt from Section 404(b). When compared to other listed issuers that comply with Section
404(b), Bio-EGCs are approximately 3.2% to 4.4% less likely to restate financials. Further analysis
reveals that Bio-EGCs are also less likely to have an ICFR that is declared non-effective, likely
due to their simple accounting structure and lack of product revenue.

9
We next introduce survey evidence on estimated Section 404(b) compliance costs for Bio-
EGCs nearing the end of their IPO On-Ramp period. Existing Bio-EGCs estimate that annual
auditor attestation of ICFR would cost approximately $412,143—in audit fees alone—for each
biotech company that loses EGC status. Moreover, surveyed biotech companies that went public
as EGCs but are no longer exempt from Section 404(b) estimate spending $192,000 on external
consultants and $203,750 on internal labor to comply specifically with Section 404(b). Thus, total
Section 404(b) compliance costs are estimated to average approximately $807,893 per year.
Extending the exemption from Section 404(b) for an additional five years would save each Bio-
EGC approximately $4,000,000 in compliance costs that could instead be used to fund innovative
therapeutics.
Bio-EGCs overwhelmingly report that they would use incremental Section 404(b)
compliance savings to increase annual investments in R&D and hire additional employees. We
find that during the sample period, Bio-EGC employment grows by an average of 178% during
the five fiscal years after going public. Thus, diverting Bio-EGC resources to compliance could
attenuate these strong employment growth trends, thereby undermining the intent of the JOBS Act
to facilitate capital formation and increase employment at innovative companies. Moreover, when
this result is combined with academic evidence showing Section 404(b) compliance significantly
harms innovation output (Gao and Zhang, 2018), it follows that a failure to extend Section 404(b)
exemption for Bio-EGCs would result in reduced development of important therapeutic products
targeting a variety of diseases.
In summary, this report reviews academic studies and introduces new empirical and survey
evidence showing that the costs of Section 404(b) compliance outweigh the benefits for Bio-EGCs.
Due to the unique aspects of the biotech industry, the SEC should consider extending the Section
404(b) exemption for existing EGCs with low product revenue. Our report shows that an extended
exemption would achieve the SEC’s mission of balancing investor protection and capital
formation. We find that exempting Bio-EGC companies from Section 404(b) would have the
benefit of freeing up innovative capital that survey evidence shows will be used for additional
R&D and hiring. We argue that an extended exemption also would have spillover benefits in the
form of greater capital formation as more companies would be encouraged to go public and stay
public. Such relief would also have societal benefits as innovative Bio-EGCs develop therapeutic
products aimed at healing important diseases. Moreover, the exemption would come at a low cost.
Our empirical evidence shows that the Section 404(b) exemption for Bio-EGCs did not harm
investor protection during the IPO On-Ramp. Yet, the planned phase-in will generate significant

10
compliance costs and will temper the innovative output of Bio-EGCs. Put simply, the evidence
shows that the limited resources of Bio-EGCs are better used for science than compliance.
This report is organized as follows. Section 1 briefly describes the current financial
reporting environment for smaller companies. Section 2 reviews the academic literature on the
costs and benefits of Section 404 compliance and the effect of the JOBS Act on IPO volume.
Section 3 presents an empirical analysis of Bio-EGCs. Section 4 reports survey evidence on the
costs of Section 404(b) compliance. Section 5 discusses the unique industry aspects of Bio-EGCs
and potential benefits, including spillover effects, of extending Section 404(b) relief beyond five
years for Bio-EGCs with low product revenue. Section 6 concludes the report with a summary of
our findings on the net costs and benefits of extending Section 404(b) relief for Bio-EGCs.
1. Financial Reporting Environment for Small Public Companies
This section summarizes the landscape of existing Exchange Act reporting requirements
for small public companies. These descriptions are purposefully brief, focused on companies listed
on a national exchange, and are not intended to provide an exhaustive description of all registration
or reporting requirements and exemptions under the Securities Act or Exchange Act.12
Reporting companies listed on an exchange must provide periodic disclosures to the SEC
that include, for example, quarterly financial statements and annual reports. Reporting companies
must also provide current reports to the SEC on an ongoing basis following certain triggering
events or other material developments that are important to shareholders. We describe how these
requirements vary based on company size in Subsection 1.1. We then describe Section 404
compliance requirements under SOX in Subsection 1.2, and summarize regulatory relief via scaled
disclosure and compliance requirements for EGCs under the JOBS Act in Subsection 1.3.
1.1. Tiers of Periodic SEC Reporting Requirements Based on Public Float
SEC reporting companies provide certain periodic disclosures, such as unaudited quarterly
financial statements filed on Form 10-Q and audited annual reports filed on Form 10-K. SEC
reporting companies must also file ongoing disclosures, known as current reports, on Form 8-K
after specific triggering events.13 The SEC has long been aware that the costs of complying with
reporting obligations are disproportionately large for smaller companies.14 To ease the burden of
12 For additional information on small company reporting obligations, see SEC, “Exchange Act Reporting and
Registration,” Oct 24, 2018, available at https://www.sec.gov/smallbusiness/goingpublic/exchangeactreporting. 13 See SEC, “Fast Answers: Form 8-K,” Aug 10, 2012, https://www.sec.gov/fast-answers/answersform8khtm.html. 14 The SEC Government-Business Forum on Small Business Capital Formation prepared a report in 1998 noting the
disproportionate costs of prior legislation on small companies. See https://www.sec.gov/info/smallbus/finrep16.htm.

11
these requirements and to encourage small company capital formation, the SEC has over time
adjusted and simplified reporting requirements and deadlines for issuers based on a company’s
size. For some rules, the SEC relies on a company’s public float—derived from market
capitalization—rather than its annual revenues to determine size and relief from certain reporting
obligations. An issuer’s public float is the aggregate market value of voting and non-voting
common equity held by non-affiliates of the company. Companies can achieve a large public float
even when they have zero revenue and negative net income since stock prices reflect investor
estimates of the company’s future cash flows.
Under the current SEC reporting rules, a company is designated under Exchange Act Rule
12b-2 as a large accelerated filer if it has a public float of $700 million or more as of the last
business day of the issuer’s most recently completed second fiscal quarter. Accelerated filers have
a public float of at least $75 million but less than $700 million. Non-accelerated filers have a
public float of less than $75 million, or annual revenues less than $50 million if issuers are unable
to calculate public float.15 These definitions determine the timing of the filing of periodic reports
and whether issuers must comply with or are exempt from including the auditor’s attestation of
management’s assessment of ICFR required by Section 404(b). For example, the deadlines for
filing audited annual reports are 60, 75, and 90 days after the fiscal year end for large accelerated
filers, accelerated filers, and non-accelerated filers, respectively. Unaudited quarterly reports on
Form 10-Q are due within 40 days after the fiscal period end for accelerated and large accelerated
filers, and 45 days for non-accelerated filers.
The SEC provides additional relief from reporting obligations for issuers that meet the
definition of a smaller reporting company (“SRC”). Companies meeting the SRC definition are
permitted to include less extensive narrative disclosures, especially those pertaining to executive
compensation. SRCs are also permitted to provide audited financial statements for two rather than
three years. On June 28, 2018, the SEC raised the threshold for companies to meet the definition
of an SRC. Under the amended definition, issuers qualify as an SRC if they have less than $250
million in public float. Issuers with less than $100 million in annual revenue and a public float that
is less than $700 million also qualify as an SRC. The prior criteria for SRC eligibility was a public
float less than $75 million or less than $50 million of annual revenues and no public float.16
15 See SEC, Revisions to Accelerated Filer Definition and Accelerated Deadlines for Filing Periodic Reports. Release
No. 33-8644. Dec 21, 2005, available at https://www.sec.gov/rules/final/33-8644.pdf. 16 See SEC, Division of Corporation Finance, Amendments to the Smaller Reporting Company Definition: A Small
Entity Compliance Guidance for Issuers. Aug 10, 2018, available at https://www.sec.gov/corpfin/amendments-

12
Importantly, the SRC definition amendments did not alter the current thresholds for
definitions of an accelerated filer and large accelerated filer. Thus, an issuer with a public float of
$75 to $250 million could qualify as an SRC, but will remain subject to the filing requirements of
accelerated filers, including the reporting deadlines of periodic reports and the requirement to
comply with Section 404(b). These inconsistent definitions of a “small” company have led to
market confusion as the terms non-accelerated filer and small reporting company are often used
interchangeably, despite having drastically different Section 404(b) compliance obligations.17
In their comment letters to the SEC regarding the proposed definition of an SRC, numerous
market participants noted that the non-uniform treatment of SRCs and non-accelerated filers would
divert resources away from R&D towards compliance costs that are disproportionately high for
smaller companies. 18,19 The concerns of costly Section 404(b) auditor attestation were not limited
to issuers in the biotech industry. Two of the 14 comment letters supporting Section 404(b)
exemption for SRCs were furnished by issuers in the food and furniture industries.20 Overall, 14
of the 18 comment letters (78%) addressing Section 404(b) compliance under the proposed SRC
definition advocated for exempting issuers meeting the new definition of an SRC from auditor
attestation of ICFR under Section 404(b). Only four comment letters (22%) encouraged the
Commission to forego the Section 404(b) exemption for SRCs. Half of these comments were
provided by large accounting firms with an economic interest in generating auditor attestation fees.
smaller-reporting-company-definition. The SRC final rule is available at https://www.sec.gov/rules/final/2018/33-
10513.pdf. 17 See Comment Letter by Biotechnology Innovation Organization on August 30, 2016, noting that market participants
often use the terms non-accelerated and smaller reporting company interchangeably despite the fact that compliance
costs can be dramatically different for these categories. https://www.sec.gov/comments/s7-12-16/s71216-14.pdf. 18 The SEC received 23 comment letters and reported four meetings with market participants. See SEC, Comments on
Proposed Rule: Amendments to Smaller Reporting Company Definition, [Release No. 33-10107; File No. S7-12-16],
available at https://www.sec.gov/comments/s7-12-16/s71216.htm. 19 See, e.g., Joan Conley, Senior Vice President and Corporate Secretary, Nasdaq, in a comment letter dated August
30, 2016, noting that, “[F]or smaller companies, the compliance costs that divert capital from research and
development remain—as the Commission recognized—disproportionately high, and we urge the Commission to
continue its focus on appropriate accommodations. One area that warrants further Commission consideration is
increasing the public float threshold in the definition of accelerated filer in parallel with the proposed increase to this
threshold in the definition of a SRC. By amending the accelerated filer definition, more companies would benefit from
the regulatory cost savings that result from the exemption in the Dodd-Frank Wall Street Reform and Consumer
Protection Act from the requirement that a company’s registered public accounting firm provide an attestation report
on internal control over financial reporting, as required by Section 404(b) of the Sarbanes-Oxley Act. It would also
ensure uniform treatment of SRCs and non-accelerated filers in this regard.” Available at https://www.sec.gov/
comments/s7-12-16/s71216-19.pdf. 20 See the comment letters by Seneca Foods on August 2, 2016, noting that Section 404(b) compliance represents 35%
of total compliance costs, available at https://www.sec.gov/comments/s7-12-16/s71216-5.pdf; and by The Dixie
Group, noting that auditors will claim no cost savings will be achieved under the proposed SRC definition and that
exempting smaller companies [from Section 404(b)] would lower the costs of being public, available at
https://www.sec.gov/ comments/s7-12-16/s71216-2.htm.

13
Despite the overwhelming support of commentators and market participants, the SEC
failed to exempt SRCs from costly Section 404(b). In response to the SEC’s failure to exempt
SRCs from Section 404(b), SEC Commissioner Hester Peirce noted that the change in the SRC
definition did not fully achieve a balance of investor protection and capital formation for small
companies. She states that, “[The SEC] have not yet grappled with the most glaring burden on
smaller issuers–Section 404(b) of Sarbanes-Oxley. As both our adopting release today and the
Chairman’s statements signal, fresh efforts are underway to rethink the value of Section 404(b) for
smaller issuers. Informed by the input we received during the comment process on this rule, I
would have preferred to provide Section 404(b) relief today.”21 Similarly, then-SEC Commissioner
Michael Piwowar expressed disappointment and pointed to the economic analysis by the SEC’s
Division of Economic and Risk Analysis (“DERA”)—which classified the SRC definition benefits
as modest—as evidence that failing to exempt SRCs from Section 404(b) will have no significant
impact on capital formation.22
1.2. Section 404(b) under the Sarbanes-Oxley Act of 2002
SOX was introduced in the House on February 14, 2002 as the Corporate and Auditing
Accountability, Responsibility, and Transparency Act of 2002.23 It was known in the Senate as the
Public Company Accounting Reform and Investor Protection Act of 2002.24 It was signed by then
President George W. Bush and became law on July 30, 2002.25
SOX had eleven sections (titles) that address topics such as auditor independence,
corporate responsibility, white-collar crime, and enhanced financial disclosures. Under Section
404(a) of SOX, companies filing annual reports with the SEC must: (1) state the responsibility of
management for establishing and maintaining adequate internal control structure and procedures
for financial reporting; and (2) include an assessment of the effectiveness of the internal control
structure and procedures of the issuer for financial reporting in its annual report. Collectively these
are referred to as internal controls on financial reporting or “ICFR.”
21 See Commissioner Hester M. Peirce, Statement at Open Meeting on Amendments to Smaller Reporting Company
Definition. Jun 28, 2018, available at https://www.sec.gov/news/public-statement/peirce-statement-smaller-reporting-
companies-062818. 22 See former Commissioner Michael S. Piwowar, Statement of Commissioner Piwowar at Open Meeting Regarding
Amendments to Smaller Reporting Company Definition, Jun 28, 2018, available at https://www.sec.gov/news/public-
statement/statement-piwowar-src-062818. 23 See https://www.congress.gov/congressional-report/107th-congress/house-report/414. 24 See https://www.congress.gov/congressional-record/2002/07/15/senate-section/article/S6734-2. 25 A copy of signed law is available here: https://www.congress.gov/bill/107th-congress/house-bill/3763/text/pl. For
a timeline of SOX legislative actions, see https://www.congress.gov/bill/107th-congress/house-bill/3763/actions.

14
Under Section 404(b) of SOX, each registered public accounting firm that prepares or
issues an audit report must separately attest to and report on the assessment of ICFR made by
management of the company under Section 404(a). Thus, Section 404(b) requires auditors to test
and include a separate opinion on internal controls in addition to its opinion on the accuracy and
completeness of the audited financial statements. The purpose of an independent assessment of the
effectiveness of ICFR is to detect problems that the management’s assessment under Section
404(a) could miss. Material undetected weaknesses in ICFR could ostensibly lead to costly
restatements of financial reports.
The legislative intent of Section 404(b) was to protect investors against corporate fraud by
increasing the quality of a company’s financial reporting via enhanced transparency and auditor
oversight of internal control systems. This intent is embodied in the official House name of SOX–
The Public Company Accounting Reform and Investor Protection Act of 2002. In conjunction with
other provisions of SOX, Section 404(b) was also intended to produce benefits in the form of an
enhanced focus on corporate governance and internal controls, and to increase monitoring by
external gatekeepers of financial information such as auditors.
In April 2002, the House Financial Services Committee noted in its report after the
introduction of SOX that federal securities laws are designed to ensure that public companies
provide investors with full and accurate disclosure of the true financial condition of the company.
The report includes this passage in discussing the need for legislation: “Following the bankruptcies
of Enron Corporation and Global Crossing LLC, and restatements of earnings by several
prominent market participants, regulators, investors and others expressed concern about the
adequacy of the current disclosure regime for public companies.”26
Thus, SOX was a response to a perceived deficiency in internal controls for large, complex
multinational companies. For example, prior to its collapse, Enron Corporation reported total
assets of $65.5 billion and revenue of $100.8 billion in its 2001 annual report.27 Companies such
as Enron are exponentially larger and more complex than Bio-EGCs, which underscores the
differences between the specific issues that SOX 404(b) aimed to address—such as the lack of
26 See Report by Committee on Financial Services. H. Rept-107-414, Apr 22, 2002, available at https://www.
congress.gov/congressional-report/107th-congress/house-report/414. 27 See Enron Corporation. (2001). Annual report for fiscal year ended December 31, 2000. Retrieved from
https://www.sec.gov/Archives/edgar/data/1024401/000102440101500010/ene10-k.txt.
15
controls in large, complex multinational companies, financial reporting errors and fraud, and
revenue recognition—compared to the simple structures of small, pre-revenue Bio-EGCs.28
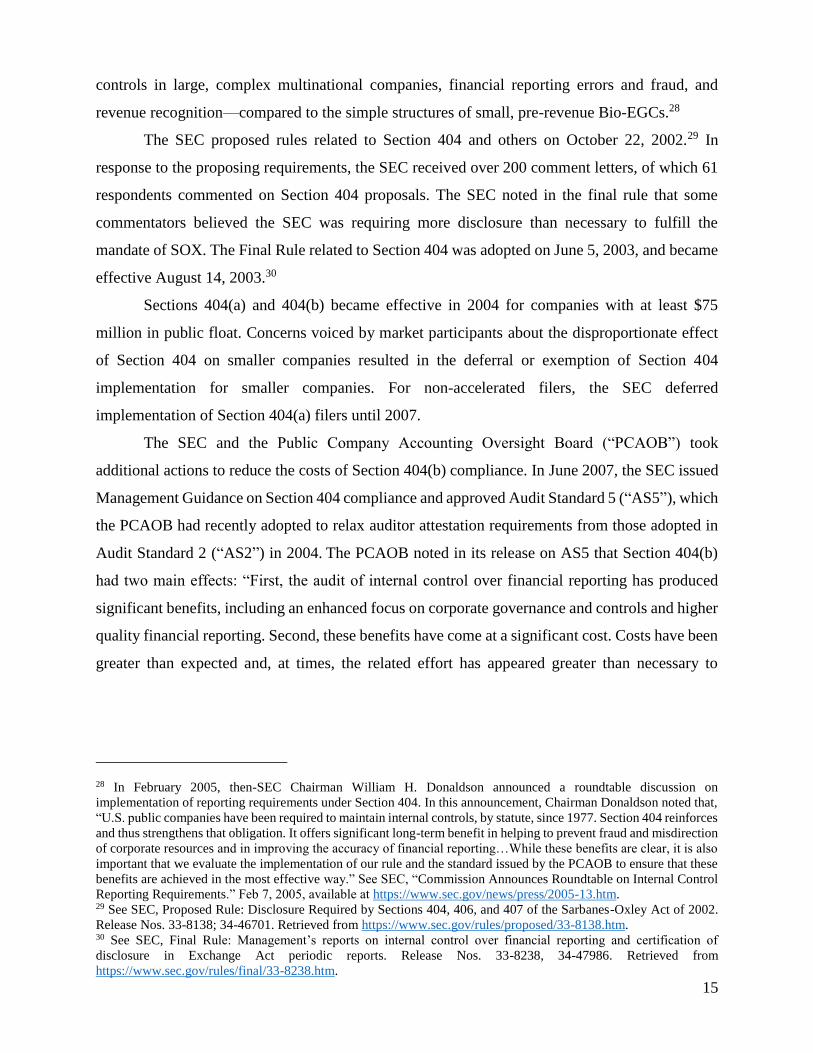
The SEC proposed rules related to Section 404 and others on October 22, 2002.29 In
response to the proposing requirements, the SEC received over 200 comment letters, of which 61
respondents commented on Section 404 proposals. The SEC noted in the final rule that some
commentators believed the SEC was requiring more disclosure than necessary to fulfill the
mandate of SOX. The Final Rule related to Section 404 was adopted on June 5, 2003, and became
effective August 14, 2003.30
Sections 404(a) and 404(b) became effective in 2004 for companies with at least $75
million in public float. Concerns voiced by market participants about the disproportionate effect
of Section 404 on smaller companies resulted in the deferral or exemption of Section 404
implementation for smaller companies. For non-accelerated filers, the SEC deferred
implementation of Section 404(a) filers until 2007.
The SEC and the Public Company Accounting Oversight Board (“PCAOB”) took
additional actions to reduce the costs of Section 404(b) compliance. In June 2007, the SEC issued
Management Guidance on Section 404 compliance and approved Audit Standard 5 (“AS5”), which
the PCAOB had recently adopted to relax auditor attestation requirements from those adopted in
Audit Standard 2 (“AS2”) in 2004. The PCAOB noted in its release on AS5 that Section 404(b)
had two main effects: “First, the audit of internal control over financial reporting has produced
significant benefits, including an enhanced focus on corporate governance and controls and higher
quality financial reporting. Second, these benefits have come at a significant cost. Costs have been
greater than expected and, at times, the related effort has appeared greater than necessary to
28 In February 2005, then-SEC Chairman William H. Donaldson announced a roundtable discussion on
implementation of reporting requirements under Section 404. In this announcement, Chairman Donaldson noted that,
“U.S. public companies have been required to maintain internal controls, by statute, since 1977. Section 404 reinforces
and thus strengthens that obligation. It offers significant long-term benefit in helping to prevent fraud and misdirection
of corporate resources and in improving the accuracy of financial reporting…While these benefits are clear, it is also
important that we evaluate the implementation of our rule and the standard issued by the PCAOB to ensure that these
benefits are achieved in the most effective way.” See SEC, “Commission Announces Roundtable on Internal Control
Reporting Requirements.” Feb 7, 2005, available at https://www.sec.gov/news/press/2005-13.htm. 29 See SEC, Proposed Rule: Disclosure Required by Sections 404, 406, and 407 of the Sarbanes-Oxley Act of 2002.
Release Nos. 33-8138; 34-46701. Retrieved from https://www.sec.gov/rules/proposed/33-8138.htm. 30 See SEC, Final Rule: Management’s reports on internal control over financial reporting and certification of
disclosure in Exchange Act periodic reports. Release Nos. 33-8238, 34-47986. Retrieved from
https://www.sec.gov/rules/final/33-8238.htm.

16
conduct an effective audit of internal control over financial reporting.” 31 For issuers not exempt
from Section 404(b), the goal of AS5 was to streamline and reduce costs of the auditor attestation
of internal controls. Despite efforts to attenuate the compliance burdens of Section 404(b) on small
companies, government agencies, such as the U.S. Department of Treasury and U.S. Government
Accountability Office (“GAO”), readily admit that Section 404(b) continues to generate
disproportionate costs on smaller, low revenue companies.32
Currently, there are two exemptions from Section 404(b) compliance for smaller issuers.
First, under the Dodd-Frank Act of 2010, lawmakers extended a permanent exemption from
Section 404(b) for non-accelerated filers (i.e., issuers with public float-adjusted market
capitalization under $75 million).33 Second, under the JOBS Act, issuers meeting the definition of
an EGC are exempt from Section 404(b) up to five years after their IPO, and would then be phased
in for EGCs that do not meet the definition of a non-accelerated issuer. This period is defined in
the JOBS Act as the “IPO On-Ramp.”
31 See PCAOB, “Auditing Standard No. 5, An Audit of Internal Control Over Financial Reporting That Is Integrated
with An Audit of Financial Statements,” Jun 12, 2007, PCAOB Release No. 2007-005A. Retrieved from
https://pcaobus.org/Standards/Auditing/pages/auditing_standard_5.aspx. 32 See U.S. Department of the Treasury, “A Financial System That Creates Economic Opportunities: Capital Markets.”
October 2017. Noting that, “Increased regulatory burdens under federal securities laws since the enactment of the
Sarbanes-Oxley Act appear to have had a disproportionate impact on smaller companies when compared to their larger
counterparts, despite measures to limit such effects. For instance, the annual attestation by outside auditors of
management’s report on the effectiveness of internal controls under Section 404(b) of the Sarbanes-Oxley Act imposes
significant costs for smaller public companies.” Retrieved from https://www.treasury.gov/press-center/press-
releases/Documents/A-Financial-System-Capital-Markets-FINAL-FINAL.pdf; and U.S. Government Accountability
Office, “Internal Controls: SEC Should Consider Requiring Companies to Disclose Whether They Obtained an
Auditor Attestation.” July 2013. Noting that studies and surveys show the auditor attestation costs, as a percentage of
revenues, affect smaller companies disproportionately compared to their larger counterparts. GAO also noted in a
report that, “Smaller public companies noted that they incur higher audit fees and other costs, such as hiring more
staff or paying outside consultants to comply with the internal control provisions of the Sarbanes-Oxley Act. One
study noted that historically, these higher audit fees and other costs increased regulatory costs for smaller public
companies because regulatory compliance, in general, involves a significant number of fixed costs regardless of the
size of a company. Thus, smaller companies with lower revenues are forced to bear these fixed costs over a smaller
revenue base compared to larger companies.” Retrieved from https://www.gao.gov/assets/660/655710.pdf. 33 See Dodd-Frank Act of 2010. Section 989G. Exemption for Nonaccelerated Filers. Dodd-Frank also tasked the SEC
with determining how it could reduce compliance burdens of Section 404(b) for companies with a market
capitalization between $75 and $250 million while maintaining investor protections. The study was also to include
information on whether reduced compliance burden or a complete exemption would encourage companies to list on a
U.S. exchange for their initial public offering. The study was published in April 2011 and is available at
https://www.sec.gov/news/studies/2011/404bfloat-study.pdf.

17
1.3. The JOBS Act and Emerging Growth Companies
The JOBS Act was enacted on April 5, 2012. Title I of the JOBS Act provided scaled
disclosures for newly public companies meeting the definition of an EGC.34 Current rules stipulate
that an issuer qualifies as an EGC if it had less than $1.07 billion in annual gross revenues during
its most recently completed fiscal year; had not issued more than $1 billion in non-convertible debt
securities over the past three years; and is not a large accelerated filer.35 The intent of the JOBS
Act was to encourage new public companies. By design, companies that made their first sale of
common equity securities in a registered offering prior to December 8, 2011, do not qualify as
EGCs even if they meet all of the other requirements, including smaller revenue.36
If a company qualifies as an EGC, it retains this status for the first five fiscal years after
the completion of an IPO unless one of the following three conditions applies: (1) total annual
gross revenue exceeds $1.07 billion; (2) the EGC issues more than $1 billion in non-convertible
debt; or (3) the issuer becomes a large accelerated filer, typically by achieving a public float of at
least $700 million.
Some benefits of EGC designation are similar to SRCs, including less extensive narrative
disclosures, particularly with respect to executive compensation; and providing two rather than
three fiscal years of audited financial statements. EGCs also are permitted to confidentially file
registration statements and to “test-the-waters” by engaging with qualified institutional buyers and
accredited institutional investors to determine potential interest in an IPO.37 Importantly, once
EGCs go public, they are exempt from the costly auditor attestation of ICFR under Section 404(b)
during the IPO On-Ramp period. This period of Section 404(b) compliance exemption currently
expires after five fiscal years following the IPO or when the issuer loses EGC status due to
revenues, public float, or debt issuance that exceeds the EGC limits.
34 The SEC’s Division of Corporation Finance maintains a list of frequently asked questions concerning the
implementation and application of the JOBS Act for EGCs on its website: https://www.sec.gov/divisions/
corpfin/guidance/cfjjobsactfaq-title-i-general.htm. 35 See SEC, Emerging Growth Companies, Nov 30, 2017, at https://www.sec.gov/smallbusiness/goingpublic/EGC. 36 See Bonnie J. Roe, “IPO On-Ramp: The Emerging Growth Company.” Business Law Today. May 25, 2012,
available at http://apps.americanbar.org/buslaw/blt/content/2012/05/article-04-roe.shtml. 37 Prior to the JOBS Act, private companies were not allowed to engage in written and oral communications regarding
a potential IPO unless a registrations statement was declared effective by the SEC. During the IPO process, written
communications outside the prospectus was prohibited. After the JOBS Act, EGCs are permitted to engage in oral or
written communications with qualified institutional buyers and individual accredited investors, even if no registration
statement has been filed. This process is intended to determine the level of interest in a potential IPO and is known as
“testing-the-waters.” See Appendix A of Dambra et al. (2015) for a summary of scaled disclosure provisions for EGCs.

18
2. Academic Studies on SOX, Section 404, and the JOBS Act
Studies on the consequences of SOX for small companies generally examine compliance
costs estimated by surveys or stock price reactions to legislative events, and the decision of many
small companies to go private and exit public markets. We review these studies, those examining
the effectiveness of Section 404 reports, and recent evidence linking Section 404(b) compliance
to reduced innovation. We also review the literature on the effects of the JOBS Act on IPOs.
2.1. Studies on the Costs of Section 404
Numerous academic and government studies find that small public companies incur higher
proportional fixed costs in the form of audit fees and other costs, such as hiring additional
employees or engaging with outside consultants, to comply with Section 404. For example, the
GAO noted that “for smaller public companies, the cost of compliance has been disproportionately
higher (as a percentage of revenues) than for large public companies, particularly with respect to
the internal control reporting provisions in section 404 and related audit fees.”38 Such concerns
indicate that companies with lower revenues, such as Bio-EGCs, will be forced to bear
proportionally larger fixed costs of Section 404(b) compliance as compared to larger companies.
Zhang (2007) studies the economic consequences of SOX using an event study
methodology. 39 She finds statistically significant negative cumulative abnormal returns for the
sample of U.S. issuers around key SOX-related legislative events. Zhang further tests the market
response to compliance costs associated with Section 404, and shows that deferring Section 404
compliance by an additional year generated significant cost savings of approximately 1.26% of
market capitalization.40 Zhang concludes that: “The compliance costs of Section 404 are
38 See GAO, “Consideration of Key Principles Needed in Addressing Implementation for Smaller Public Companies,”
Apr 2006, available at https://www.gao.gov/assets/250/249736.pdf. 39 An event study uses stock price data to measure how any particular event (e.g., SOX legislation) affects issuers. To
the extent that investors efficiently process new information, the issuer’s stock price should quickly adjust to reflect
the incremental information. The impact of any news event is measured by estimating an “abnormal” stock return.
Abnormal returns are calculated using the actual stock returns on the event days and then subtracting the expected
stock return based on a risk model. The cumulative abnormal return is the sum of abnormal returns over the event
window and represents the total wealth effect of the news. For example, if the cumulative abnormal return over
legislative events is negative (positive) and statistically different from zero for a particular issuer, then investors
anticipate that that legislative event will have a negative (positive) wealth effect on the company. If the cumulative
abnormal return is not statistically different from zero, then the news event is considered value neutral by investors. 40 Zhang (2007) exploits the staggered compliance dates in the final SEC rule where accelerated filers were required
to comply for fiscal years ending on or after June 15, 2004, and non-accelerated filers are required to comply from the
fiscal years ending on or after April 15, 2005. Issuers with different fiscal year-end dates obtained varying extension
periods, which allows the author to examine the benefits of delaying 404 compliance for smaller companies. Zhang
defines a non-accelerated filer as a firm with a market capitalization of less than $75 million.

19
particularly significant for small firms and delaying compliance appears beneficial for them.”41
Iliev (2010) examines stock price reactions to announcing the delay of Section 404 compliance
and reports that, “On net, SOX compliance reduced the market value of small firms.”
Hammersley et al. (2008) examine the benefits of Section 404 by measuring the market
reaction to management’s disclosure of internal control weaknesses. They consider whether
disclosing internal control weaknesses causes investors to re-evaluate their perceived quality of
accounting control systems. Using a sample of issuers disclosing internal control weaknesses, the
authors report evidence showing that neither the disclosure of ‘internal control weaknesses’ nor
‘significant internal control deficiencies’ results in significant stock market responses, suggesting
that these findings do not change investors’ long-term assessments of these companies.42
Dharmapala (2016) examines how issuers responded to the opportunity to qualify as a non-
accelerated issuer under SOX. Under SOX, a company is eligible for non-accelerated issuer status
if it has public float under $75 million. He finds that issuers tend to cluster just below the $75
million threshold following the passage of SOX, while a similar pattern did not exist prior to its
passage. He estimates that issuers reduce their public float by about $1.7 million on average to
stay below the accelerated issuer threshold, which corresponds to an estimated Section 404(b)
compliance cost savings that has a present value of $4 to $6 million. The author also provides
evidence that “bunching” behavior results in higher use of debt versus equity financing and
increases financial constraints for those companies avoiding costly Section 404(b) compliance.
In a study co-authored by SEC economists, Alexander et al. (2013) examine the effects of
Section 404 compliance based on an SEC administered survey to just under 3,000 executives over
December 2008 to January 2009. Most respondents in their survey noted that the benefits of
compliance did not outweigh the costs, especially among smaller companies where the initial
compliance start-up fees are proportionally larger. Only 10.2% of executives surveyed in this
report perceived the net benefits of complying with Section 404 to outweigh the net costs in the
41 Li et al. (2008) also examine the market reaction to events surrounding SOX. These authors report a positive
abnormal stock market reaction to SOX-related events, especially for issuers that had more extensively managed their
earnings in the past. The authors interpret this result as evidence that investors expected SOX to constrain earnings
management and improve financial statement quality overall. Similarly, Jain and Rezaee (2005) report positive returns
overall to the S&P 500 and Value Line equally weighted indexes around SOX-related events that increased the
likelihood of passage. These studies, however, are critiqued by Zhang (2007), who argues that Jain and Rezaee (2005)
utilized faulty econometric techniques and that Li et al. (2008) exclude key event dates around SOX legislation. Zhang
(2007) argues that when taking these into account, SOX does not add value overall. 42 The authors report a 3-day size-adjusted market response of −0.95% to the announcement of internal control
weaknesses. However, this response is not statistically different from zero at conventional levels in a two-tailed test
(two-tailed p = 0.14). The market response to significant internal control deficiencies is −0.75%, which also is
insignificantly different from zero at conventional levels in a two-tailed test (two-tailed p = 0.17).
20
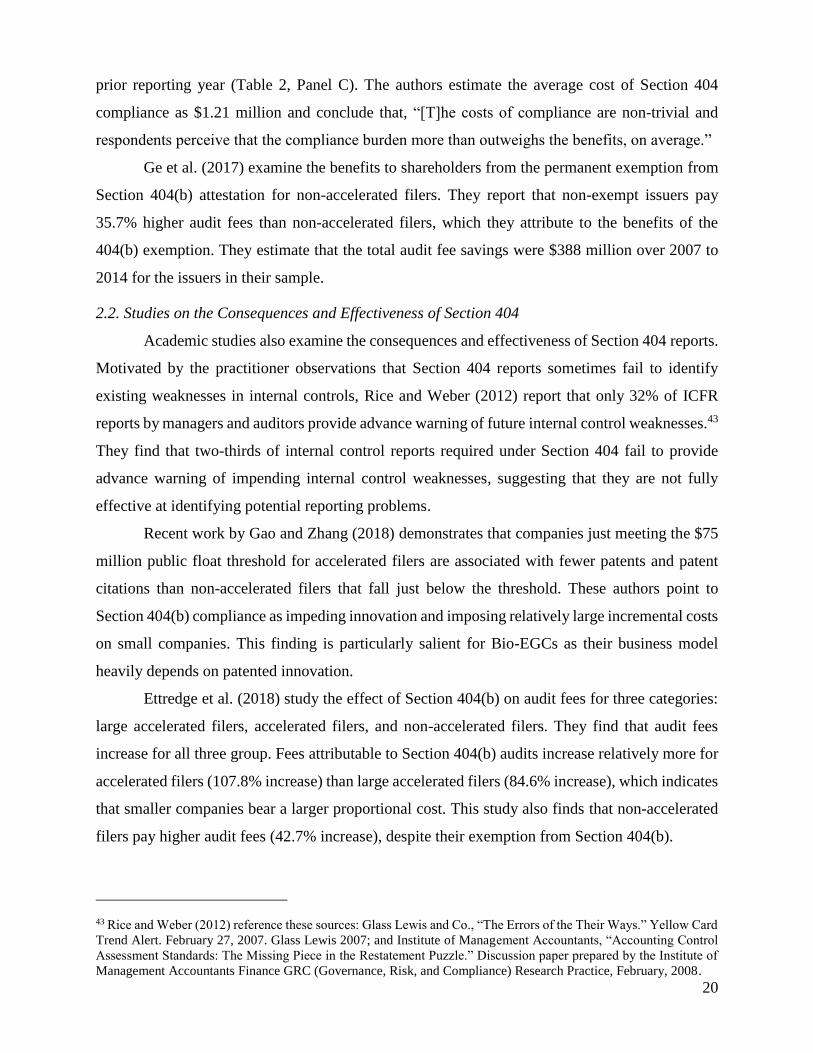
prior reporting year (Table 2, Panel C). The authors estimate the average cost of Section 404
compliance as $1.21 million and conclude that, “[T]he costs of compliance are non-trivial and
respondents perceive that the compliance burden more than outweighs the benefits, on average.”
Ge et al. (2017) examine the benefits to shareholders from the permanent exemption from
Section 404(b) attestation for non-accelerated filers. They report that non-exempt issuers pay
35.7% higher audit fees than non-accelerated filers, which they attribute to the benefits of the
404(b) exemption. They estimate that the total audit fee savings were $388 million over 2007 to
2014 for the issuers in their sample.
2.2. Studies on the Consequences and Effectiveness of Section 404
Academic studies also examine the consequences and effectiveness of Section 404 reports.
Motivated by the practitioner observations that Section 404 reports sometimes fail to identify
existing weaknesses in internal controls, Rice and Weber (2012) report that only 32% of ICFR
reports by managers and auditors provide advance warning of future internal control weaknesses.43
They find that two-thirds of internal control reports required under Section 404 fail to provide
advance warning of impending internal control weaknesses, suggesting that they are not fully
effective at identifying potential reporting problems.
Recent work by Gao and Zhang (2018) demonstrates that companies just meeting the $75
million public float threshold for accelerated filers are associated with fewer patents and patent
citations than non-accelerated filers that fall just below the threshold. These authors point to
Section 404(b) compliance as impeding innovation and imposing relatively large incremental costs
on small companies. This finding is particularly salient for Bio-EGCs as their business model
heavily depends on patented innovation.
Ettredge et al. (2018) study the effect of Section 404(b) on audit fees for three categories:
large accelerated filers, accelerated filers, and non-accelerated filers. They find that audit fees
increase for all three group. Fees attributable to Section 404(b) audits increase relatively more for
accelerated filers (107.8% increase) than large accelerated filers (84.6% increase), which indicates
that smaller companies bear a larger proportional cost. This study also finds that non-accelerated
filers pay higher audit fees (42.7% increase), despite their exemption from Section 404(b).
43 Rice and Weber (2012) reference these sources: Glass Lewis and Co., “The Errors of the Their Ways.” Yellow Card
Trend Alert. February 27, 2007. Glass Lewis 2007; and Institute of Management Accountants, “Accounting Control
Assessment Standards: The Missing Piece in the Restatement Puzzle.” Discussion paper prepared by the Institute of
Management Accountants Finance GRC (Governance, Risk, and Compliance) Research Practice, February, 2008.

21
Ettredge et al. (2018) also examine changes in audit quality and find no evidence that
“massive fee increases” associated with Section 404(b) compliance are linked to better audit
quality as proxied by reductions in discretionary accruals or a lower likelihood of subsequent
restatements. This study concludes that Section 404(b) generated higher fees for auditing firms
with no corresponding increases in investor protection, and that increased audit fees were
disproportionately absorbed by smaller companies.
Other academic studies point to Section 404 costs as a catalyst for company decisions to
exit public markets. Leuz et al. (2008) study issuers that deregister from the SEC between January
1998 and December 2004 and find that issuers that deregister by ceasing to report are smaller than
issuers that deregister because they went private. They link the higher instance of “going dark” for
smaller issuers to the enactment of SOX and Section 404. In a related paper, Kamar et al. (2008)
find SOX increased the tendency for small companies in the U.S. to exit public markets through
private target acquisitions at a greater rate than a sample of similar foreign companies. Thus, these
studies imply that failing to extend the Section 404(b) compliance exemption beyond the IPO On-
Ramp period could lead to an exiting of public markets by existing Bio-EGCs.
2.3. Studies on the JOBS Act and IPOs
Dambra et al. (2015) demonstrate that the JOBS Act is associated with increased IPO
volume. They argue that reduced disclosure costs for EGCs, including the Section 404(b)
exemption, is an important determinant of the increase in post-JOBS Act IPOs. They note that,
“Firms with high proprietary disclosure costs, such as biotechnology and pharmaceutical firms,
increase IPO activity the most.” Dambra et al. (2015) also find that although the increase in IPO
volume was driven by biotech issuers, it was not simply attributable to favorable market conditions
after the JOBS Act was passed. They argue that scaled disclosure and compliance exemptions for
EGCs helps explain the increase in biotech IPOs. These findings are consistent with the conjecture
that extending Section 404(b) relief beyond the IPO On-Ramp period would enable small Bio-
EGCs to go public and stay public.
Other papers examining the JOBS Act find that EGCs utilize scaled disclosure provisions
to enable them to invest more in R&D, rather than paying for costly disclosures. For example,
Chaplinsky et al. (2017) examine EGCs choosing among the JOBS Act disclosure and compliance
exemptions. They find evidence that issuers utilize scaled disclosure when they are smaller,
younger, unprofitable, and have higher R&D expenses. They note that, “The results for high R&D
expenses are primarily driven by the IPOs of biotech and pharmaceutical firms, which make up a

22
significant portion of the EGC sample.” Since the disclosure obligations of public companies are
substantially higher than those of private companies, the opportunity to scale disclosure has
resulted in more innovative and research-intensive companies going public under the JOBS Act.
Taken together, these results are consistent with comments furnished by biotech issuers to
the SEC. For example, commenters indicated that, even though Bio-EGCs do not voluntarily pay
for an auditor attestation of ICFR, almost all Bio-EGCs voluntarily waive their right to delay
compliance with future GAAP standards. These biotech issuers point to similar trends as evidence
that Bio-EGCs are willing to disclose more than is strictly required by the JOBS Act when the
market demands and values such disclosures. In the case of Section 404(b) compliance, the low
rate of voluntary compliance by Bio-EGCs suggests that investors do not demand or value costly
Section 404(b) auditor attestations.44
2.4. Summary of Academic Evidence and Implications for Extending Section 404(b) Relief
In summary, academic evidence finds that SOX-related compliance costs, especially those
related to Section 404(b), are disproportionately large for smaller companies. Studies directly link
Section 404(b) compliance to reduced innovation such as R&D that results in biotech patents.
Academic studies also find that the benefits of ICFR reports by management and auditors are
frequently ineffective at identifying material weaknesses in internal controls. Put simply, academic
studies find the costs of Section 404(b) are high and the benefits are low for small companies.
Academic evidence on the JOBS Act finds that relief from Section 404(b) provided a
significant boost to IPO volume, which was concentrated in early-stage biotech companies.
Empirical evidence shows that scaled disclosure opportunities and Section 404(b) exemptions
under the JOBS Act resulted in a significant increase IPO volume that was concentrated in Bio-
EGCs. Given this increase in companies going public, it follows logically that extending the relief
from Section 404(b) beyond five years for low-revenue Bio-EGCs should have two benefits:
1. Existing Bio-EGCs that are early in their product lifecycle could spend compliance
cost savings on continuing clinical trials and product development. In turn, this
investment could encourage existing Bio-EGC companies to remain public.
2. Extending the exemption for low-revenue Bio-EGCs could encourage even more
capital formation in the biotech industry, and encourage new companies to go public.
44 See August 2016 Comment Letter by 47 biotech issuers (Acorda Therapeutics et al.), available at
https://www.sec.gov/comments/s7-12-16/s71216-11.pdf. This letter points to studies including Dambra et al. (2015);
Ernst & Young, “The JOBS Act: 2015 mid-year update,” Sep 2015, available at https://www.eyjapan.jp/library/issue/
us/gaap-weekly-update/pdf/GAAP-2015-09-17-05.pdf; and Latham & Watkins, “The JOBS Act, Two Years Later:
An Updated Look at the IPO Landscape,” Apr 5 2014, available at https://www.lw.com/thoughtleadership/lw-jobs-
act-ipos-second-year.

23
As the SEC continues to explore ways to revive the U.S. IPO market, we note that the
academic evidence discussed above points to a simple solution that has an established track record
of success: exempting low-revenue Bio-EGCs from Section 404(b) beyond five years.45 Lower
compliance costs will encourage additional innovation and product development by companies
with therapeutics aimed at rare diseases and those that are high risk or need additional clinical
trials and, thus, take longer to generate revenue than products from other sectors. We discuss
potential economic and societal benefits of extending this relief in Section 5.
3. Empirical Analysis of Bio-EGCs
This section provides an empirical analysis of Bio-EGCs. We first describe the sample of
Bio-EGCs going public after the JOBS Act. We then compare the financial characteristics,
restatement frequency, and effectiveness of ICFR for Bio-EGCs to various comparison groups.
3.1. Descriptive Statistics for Biotech EGCs
Figure 1 reports the number of Bio-EGC IPOs before and after the JOBS Act. 46 It shows
that Bio-EGC IPOs experience a 270% increase compared to the same period prior to the passage
of the JOBS Act (300 versus 81).
[See Figure 1, p. 46]
Table 1 reports the four-digit Standard Industrial Classification (“SIC”) code distribution
of Bio-EGCs. Nearly 60% of Bio-EGCs operate in the pharmaceutical preparations industry
(SIC=2834); 31% operate in the biological products industry (SIC=2836); while the remaining 9%
primarily operate in medical-related industries.
[See Table 1, p. 47]
Table 2 reports Bio-EGC product and company specific information. Panel A characterizes
their therapeutic targets at the time of the IPO. Although product targets are quite varied, 26.3%
of Bio-EGCs indicated that they were developing cancer-related products (oncology), 10.3% were
addressing neurological disorders, and 9.7% were focused on infectious diseases.
45 For example, the SEC’s Division of Economic and Risk Analysis cohosted a dialogue on “Reviving the U.S. IPO
Market” in May 2017. One commentator noted the increase in the number of listed firms with negative net income
(i.e., pre-revenue companies) and greater R&D investment, which are hallmarks of Bio-EGCs. The commentator also
notes the “growing importance of R&D means that it is more difficult to finance firms via public offerings.” See
https://www.sec.gov/files/Highlights%20from%20the%20SEC-NYU%20Dialogue%20on%20Reviving%
20the%20US%20IPO%20Market_1.pdf. 46 This graph updates the version presented by William J. Newell titled, “Sarbanes-Oxley Section 404(b): Costs of
compliance and proposed reforms.” SEC Advisory Committee on Small and Emerging Companies. Sep 13, 2017.
Retrieved from https://www.sec.gov/info/smallbus/acsec/william-newell-acsec-091317.pdf.

24
Panel B of Table 2 shows that 18% of these products target rare diseases, and Panel C
reports that just under 75% of Bio-EGCs were in Phase I, II, or III of their clinical trials. Only
11.7% of Bio-EGCs are at the marketing stage and can generate revenue from their lead product.
Panel D reports that most (90%) Bio-EGCs are classified as drug companies, with 83% focusing
on emerging therapeutics (Panel E).
[See Table 2, p. 48]
Table 3 provides descriptive statistics for 300 Post-JOBS Act Bio-EGCs. Panel A reports
that the average (median) Bio-EGCs raises $82 ($70) million at the IPO, and the total amount of
equity capital raised by Bio-EGCs was $25 billion. Almost 94% of Bio-EGCs list on the Nasdaq
exchange (Panel B). Approximately 85% of Bio-EGCs going public under the JOBS Act remain
listed as of December 2018 (Panel C). Panel C also shows that 12.3% of Bio-EGCs were acquired
by or merged with another company, while only 3% of Bio-EGCs delisted or went bankrupt. While
just over half of Bio-EGCs (52%) are headquartered in California or Massachusetts, which are
well-known “innovation hubs,” numerous Bio-EGCs are spread over 20 states including
Pennsylvania, New Jersey, New York, North Carolina, Texas, Maryland, Washington, and
Connecticut (Panel D).47
[Insert Table 3, p. 49]
Figure 2 graphs employment growth for Bio-EGCs and Non-Bio EGCs. The average
(median) number of Bio-EGC employees in our sample is 107 (63). Panel A plots employment for
Bio-EGCs going public in 2012 or 2013 after the JOBS Act.48 The average (median) Bio-EGC has
82 (67) employees reported in the 10-K the first year after going public. This figure grows as a
mostly linear function through the end of fiscal year 2017 for Bio-EGCs that remain listed. The
average (median) number of employees at the end of five fiscal years after going public is 228
(135), which represents growth of 178% (102%). Panel B shows that employment growth trends
are stronger for the full sample of Bio-EGCs (growth mean = 238%, median = 202%) relative to
Non-Bio EGCs (growth mean = 84%, median = 63%).
[See Figure 2, pp. 46-47]
47 For additional data on the biotech industry’s geographic dispersion, see George Goodno, “Interactive Map Displays
Strength of Industry’s National Footprint,” Biotechnology Innovation Organization, December 12, 2018, available at
http://www.biotech-now.org/business-and-investments/business-of-biotech/2018/12/interactive-map-displays-
strength-of-industrys-national-footprint. 48 The growth trends are similar for the full population of Bio-EGCs.

25
3.2. Financial Characteristics of EGCs
In this subsection, we compare and contrast financial characteristics of Bio-EGCs to both
non-Bio EGCs and other listed companies. We augment our sample of Bio-EGCs with a list of
other EGCs from Morrison Foerster.49 For this analysis, we focus on fiscal year data over 2013 to
2017 for EGCs going public prior to January 1, 2018 (fiscal year 2018 results are not reported for
the full population of EGCs as of this report date). Table 4 displays the sample firm years for 241
Bio-EGCs and 605 Non-BIO EGCs with post-IPO data in Compustat over fiscal years 2013-
2017.50 All variables are defined in the Appendix.
[See Table 4, p. 49]
Table 5 compares financial characteristics for the Bio-EGCs to Non-Bio EGCs using firm-
year data from Compustat. Panel A presents mean values and Panel B presents median values. For
each of the financial characteristics, Bio-EGCs have values that are statistically different from
Non-Bio EGCs at the 1% level. On average, Bio-EGCs tend to be almost 50% smaller in market
capitalization and have only a fraction of the total assets of Non-Bio EGCs. Yet, Bio-EGCs have
much higher market-to-book ratios. Thus, many young biotech companies have sizeable market
capitalization values due to investor optimism about their innovative products and the prospects
for FDA approval.
The median total revenue value for Bio-EGCs is only $1.6 million per year. To put this
amount into perspective, consider that it is only 1% of the median total revenue for Non-Bio EGCs
($156.2 million). Approximately 89% of Bio-EGC firm years have total revenue less than $50
million, and 36% have zero revenue reported in Compustat. By contrast, only 28% of Non-Bio
EGC firm years have total revenue less than $50 million and only 8.5% of Non-Bio EGCs have
zero revenue. When removing 81 “blank check” Non-Bio EGCs from the sample (SIC = 6770),
this fraction drops to 22.2% of Non-Bio EGC sample firm years with revenue less than $50 million
and 3.4% with zero revenue. Thus, the revenue generating properties of Bio-EGC differ
fundamentally from Non-Bio EGCs, which is consistent with the long R&D periods for Bio-EGCs.
It is important to note that, despite the large and significant differences in revenue
generation between Bio-EGCs and Non-Bio EGCs, the fraction of Bio-EGCs with zero product
revenue is grossly understated using Compustat data. Like most financial databases, Compustat
49 See Morrison Foerster, EGC Corporate Governance Practices, May 2018. Retrieved from https://www.mofo.com/
resources/publications/180531-egc-corporate-governance.html. 50 The term “firm year” represents the number of fiscal years for each firm. For example, a sample of 10 firms with 5
fiscal years of data would generate 50 firm years. For this analysis, we assign EGC designation for all firm years even
if the issuer exceeds the public float threshold for EGC status. The results are similar when relaxing this assumption.

26
does not discern between “product” revenue and “partnering” or “collaboration” revenue. Bio-
EGCs are unique from Non-Bio EGCs in that they often do not generate any product revenue
during their lab and clinic stages, which can last 10-15 years. During this period, emerging biotech
companies may generate revenue through partnerships or collaborations with other issuers.
Excluding collaborative revenue, almost 90% of Bio-EGCs have zero revenue at the IPO.51
Table 5 also indicates that Bio-EGCs are often unprofitable. For example, return on assets
(“ROA”) tends to be significantly negative during the R&D period. By contrast, the median Non-
Bio EGC has slightly positive ROA. Further analysis reveals that these differences are driven
largely by zero revenue Bio-EGC issuers. Given the lack of revenues, it is not surprising that Bio-
EGCs also generate less free cash flow and have less debt than Non-Bio EGCs.52
Bio-EGCs also have significantly more liquid assets and more cash on their balance sheet
than Non-Bio EGCs. Moreover, the assets of Bio-EGCs tend to be almost exclusively in the form
of cash (cash intensity average = 80%, median = 89%), whereas Non-Bio EGCs have only 18% to
30% of assets in cash. Cash balances are important to Bio-EGC issuers because many investors
value early stage biotech companies based on burn rates rather than a multiple of sales or
earnings.53 Thus, Bio-EGCs are likely more sensitive to diverting cash towards compliance costs
and away from R&D since the loss of cash likely reduces the stock price more for Bio-EGCs than
Non-Bio EGCs that are less cash intensive.
Bio-EGCs spend significantly more on R&D than non-Bio EGCs. The average Bio-EGC
spends 35.6% of total assets on R&D versus 8.4% for Non-Bio EGCs. This is consistent with other
studies that show biotech start-ups have higher average R&D intensity rates than other sectors.54
Bio-EGCs tend to have lower physical asset intensity than non-Bio EGCs as reflected in the gross
51 See Table 3, Panel C. Only 11.7% of Bio-EGCs had marketed products at the IPO stage. 52 The lack of product revenue makes it difficult for Bio-EGCs to borrow at attractive rates. 53 Start-up companies and IPOs are often valued using comparable financial performance metrics such as price-to-
sales, price-to-earnings, or enterprise value-to-EBITDA. Since start-up biotech companies often do not generate sales
or earnings, investors use alternative valuation metrics, such as burn rate, to determine the market capitalization. The
burn rate, which is the level and rate of expenditures needed for R&D, is one of the most important valuation metrics
for biotech companies. For additional discussions, see Cumby, J., & Conrad, J. (2011). Non-financial performance
measures in the Canadian biotechnology industries. Journal of Intellectual Capital, 2(3), 261-272; and Bratic et al.,
Navigating through a Biotech Valuation, http://www.canbiotech.com/userresourcescb/businessdev/navbiotech.pdf. 54 Other studies show that the R&D intensity of biotech start-ups is three times higher than the R&D intensity of all
firms. See Joe Kennedy, Information Technology and Innovation Foundation, “How to Ensure That America’s Life-
Sciences Sector Remains Globally Competitive,” Mar 2018, http://www2.itif.org/2018-life-sciences-globally-
competitive.pdf ; and John Wu and Robert D. Atkinson, Information Technology and Innovation Foundation, “How
Technology-Based Start-Ups Promote U.S. Economic Growth,” Nov 28 2017, https://itif.org/publications/
2017/11/28/how-technology-based-start-ups-support-us-economic-growth.

27
property ratio as a percent of assets. Consistent with fewer physical assets, Bio-EGCs also have
lower capital expenditures as a percent of assets.
[See Table 5, p. 50]
Table 6 compares Bio-EGCs to the universe of listed companies in the Compustat database.
For ease of comparison, we partition the Compustat database into non-accelerated, accelerated,
and large-accelerated filers based on market capitalization.55 We then compare Bio-EGC financial
characteristics to companies in each of these categories.
Overall, Table 6 indicates that the financial characteristics of Bio-EGC are more similar to
non-accelerated filers than accelerated filers. Although the median market capitalization for Bio-
EGCs ($278 million) would lead to classification as accelerated filers ($233 million), other
financial metrics are inconsistent with this designation. For example, total assets are much smaller
for Bio-EGC issuers than accelerated filers. The median total assets for Bio-EGCs ($108 million)
is 68% smaller than the median value for accelerated filers ($339 million).
By contrast, many of their characteristics are similar to those of non-accelerated filers. For
example, the percentage of firm years with sales less than $50 million is quite similar between
Bio-EGCs and non-accelerated filers (88.8% versus 86.6%, respectively). These percentages drop
significantly for accelerated filers and large accelerated filers to 32.5% and 2.1%, respectively.
The median Bio-EGC and non-accelerated filer tends to have negative return on assets and free
cash flows, while the median accelerated and large accelerated filer tends to have positive values
for each measure. One notable difference between Bio-EGCs and all three filing tiers is the
relatively high median R&D intensity rate (27.7% for Bio-EGCs), while the median R&D intensity
is zero for all three filer categories.
Our analysis shows that, aside from larger market capitalizations, Bio-EGCs are most
comparable to non-accelerated filers. Since non-accelerated filers are permanently exempt from
Section 404(b) attestation under Dodd-Frank, it stands to reason that any company that continues
to operate with the financial characteristics of a start-up—regardless of how highly investors value
its future prospects—should be treated as a non-accelerated filer for regulatory purposes. This is
particularly true for low-revenue Bio-EGCs that have yet to develop a commercially viable product
and continue to spend available cash on R&D. Thus, we believe that the SEC should consider
55 We use market capitalization rather than public float (i.e., market capitalization based on shares held by non-
affiliates of the company) for this part of the analysis. Compustat does not provide data on float, so follow prior
academic literature (e.g., Zhang, 2007) by using market capitalization as a proxy for public float. While this approach
introduces measurement error, there is no reason to believe that this measurement error is systematically biased
towards Bio-EGCs.

28
exempting companies from Section 404(b) that have similar operating characteristics to start-ups
(i.e., low revenues and high spending on R&D).
[See Table 6, p. 51]
3.3. Financial Restatements Analysis
Next, we analyze the frequency of financial restatements for Bio-EGCs. Some market
participants point to studies, such as those conducted by the GAO, which show that restatement
rates are higher for issuers that are exempt from Section 404(b), as benefits of auditor attestation
of ICFR.56 The differences in financial characteristics, most notably revenues, between exempt
non-accelerated filers and non-exempt accelerated filers in Table 6, would suggest that such
inferences are not based on an apples-to-apples comparison. Given that revenue recognition is one
of the most frequent drivers of financial restatements, the absence of product revenue at most Bio-
EGCs would predict relatively low rates of financial restatement relative to other issuers. We
investigate financial restatement probabilities for Bio-EGCs relative to both Non-Bio EGCs and
the population of non-accelerated, accelerated, and large accelerated filers in Tables 7 to 9.57
For these tests, we estimate ordinary least squares (“OLS”) regressions to determine if
relief from 404(b) for Bio-EGCs is associated with more financial restatements.58 Table 7 presents
the regression results comparing restatement frequencies for Bio-EGC and Non-Bio EGCs. In this
table, the dependent variable is financial restatement, which equals one if the fiscal year financial
statements are reported as being restated in the Audit Analytics database. Column (1) presents a
simple regression that only controls for year fixed effects. The Bio-EGC dummy is not
significantly different from zero, which implies that Bio-EGCs are no more likely than Non-Bio
EGCs to restate their financials. Column (2) controls for a number of firm-specific factors, such
as size, market-to-book, profitability, and fees paid to the auditor, and yields similar results.
Since Table 5 indicates that cash intensity and asset liquidity are much larger for Bio-
EGCs, Columns (3) and (4) repeat the analysis in Column (2) by respectively replacing the Bio-
EGC dummy with cash intensity and asset liquidity.59 Column (3) indicates that issuers with higher
cash as a percentage of total assets experience fewer financial restatements. Thus, cash-intensive
56 See GAO, “Internal Controls: SEC Should Consider Requiring Companies to Disclose Whether They Obtained an
Auditor Attestation,” Jul 2013, available at https://www.gao.gov/assets/660/655710.pdf. Nagy (2010) also finds a
negative relation between Section 404 compliance and issuing materially misstated financial statements. 57 For these tests, we consider a firm to be a Bio-EGC for all firm years during 2013-2017 even if the firm outgrows
its EGC status. However, the results are similar to those reported when dropping Bio-EGCs that lose their EGC status
due to growth in public float. 58 The presented results are estimated using OLS, but are similar if estimated using a Probit or Tobit model. 59 We do not include these variables as controls with the Bio-EGC dummy due to concerns of multicollinearity.

29
start-up companies have fewer financial restatements. Column (4) shows that issuers with higher
asset liquidity are no more likely to have a financial restatement than those with lower levels of
asset liquidity. Overall, Table 7 shows that Bio-EGCs are no more likely to experience a financial
restatement than Non-Bio EGCs. We do find evidence that firms with high cash burn rates—a
property that is associated with Bio-EGCs—are less likely to restate their financials.
[See Table 7, p. 52]
We next compare the financial restatement frequency of Bio-EGCs to companies classified
according to the three SEC reporting categories (non-accelerated, accelerated, and large
accelerated filers). Companies are included in the sample if they appear in both the Compustat and
Audit Analytics databases.60 Table 8 shows that the restatement rates for non-accelerated,
accelerated, and large accelerated filers are 7.95%, 9.25%, and 6.68%, respectively. Despite their
exemption from Section 404(b), Bio-EGCs have a lower restatement rate (6.20%) than any of the
three SEC reporting categories. We next examine these restatement percentages in a multiple
regression setting to see if differences in financial restatement frequency are significant after
controlling for other factors that may be associated with financial reporting quality.
[See Table 8, p. 52]
Table 9 presents OLS regressions of financial restatements for Bio-EGCs and each SEC
filer category. Depending on the specifications on Columns (1) through (8), Bio-EGCs are 3.2%
to 4.4% less likely to restate financials when compared to issuers that comply with Section 404(b)
(i.e., accelerated and large-accelerated filers). For these alternative specifications, we sequentially
remove non-accelerated filers (Column 2) and large accelerated filers (Column 3). We find that
Bio-EGCs become less likely to restate as one compares them to companies that have
progressively similar market capitalizations. Column (4) reports similar results for the subset of
firms where Audit Analytics indicates that management reports an ICFR – an indicator that the
company complies with Section 404(a) of SOX.
[See Table 9, p. 53]
Bio-EGCs remain less likely to restate financials even after including controls for auditor
attestation of the ICFR (Column 5) and the tone of either the management or auditor ICFR
60 We note that the intersection between companies in the Compustat and Audit Analytics databases is not perfect.
Even though there should be a nearly complete overlap, just under half of the non-accelerated filing observations in
Compustat have restatement data in Audit Analytics and less than one fourth of the accelerated and large accelerated
issuers are missing in the Audit Analytics database. Since there is no logical basis for assuming that firms with missing
data did not restate financials, we exclude missing observations from our analysis.

30
(Column 6). Interestingly, auditor attestation is not significantly correlated with restatements in
any of our regressions.
While a self-declaration of a non-effective ICFR is associated with higher restatement
rates, Table 10 shows that managers and auditors rarely disagree on these reports. One
interpretation is that auditor attestation provides limited incremental information about
restatements above that already being provided by managers. Alternatively, it is possible that
management only makes such a declaration after the auditor has noticed a problem and indicated
that it plans to report a negative finding. It is not possible to discern which effect explains this
result using this dataset.
[See Table 10, p. 54]
Column (7) removes large-accelerated filers and Column (8) includes controls for industry
fixed effects using Fama-French 30 industries. In both cases, the coefficient on the Bio-EGC
dummy remains negative and statistically different from zero. Overall, the results in Table 9 imply
that Bio-EGCs are less likely to experience financial restatements than listed issuers complying
with Section 404(b), despite their exemption from compliance under the JOBS Act.
3.4. Manager and Auditor Reports of ICFR
Panel B of Table 10 examines firms that provide reports on ICFR effectiveness, but have
no accompanying auditor attestation of ICFR [i.e., are exempt or did not voluntarily comply with
Section 404(b)]. The results show that just over 30% of these firm years are associated with the
identification of a non-effective ICFR by management. That is, even in the absence of mandatory
auditor attestation, managers are frequently willing to self-identify non-effective ICFR.
Table 11 reports results from OLS regressions that include all firms that report a non-
effective ICFR by either managers or auditors. In these tests, the dependent variable, non-effective
ICFR, equals one if the internal controls over financial reporting are declared not effective by
managers or auditors and zero otherwise. In each test, we find that Bio-EGCs are less likely to
have a manager or auditor report of a non-effective ICFR.
This finding is robust to a number of different specifications that focus on specific
subsamples and/or include additional control variables. Column (1) includes all issuers that appear
in both the Compustat and Audit Analytics databases. Column (2) removes non-accelerated issuers
and includes a control for whether the firm has an auditor attestation of the ICFR. In this column,
the coefficients on both Bio-EGC and auditor attestation of ICFR are negative and significant
indicating that both are associated with fewer non-effective ICFR. Column (3) repeats the analysis

31
reported in Column (2) after removing large accelerated filers. Column (4) replicates the analysis
in Column (3) but includes industry fixed effects.
[See Table 11, p. 54]
3.5. Summary of Empirical Analysis
Overall, the results of our empirical analysis indicate that Bio-EGCs have unique financial
characteristics, such as a high proportion of companies with low or zero revenue and large
investments in R&D. Our tests indicate that financial characteristics of Bio-EGCs are more
comparable to non-accelerated filers versus other SEC reporting categories. These similarities are
important because non-accelerated filers are permanently exempt from Section 404(b) compliance.
Regression results reveal that Bio-EGCs are no more likely to restate financials than Non-
Bio EGCs, and are less likely to restate financials than listed issuers complying with Section
404(b). All things equal, Bio-EGCs also are less likely to have an ICFR declared non-effective by
either managers or auditors. These findings support the notion that the costs of complying with
Section 404(b) are not offset by benefits of investor protection via costly auditor attestation of
ICFR. Put simply, the empirical evidence overwhelmingly indicates that investors would be better
served if the scarce resources of Bio-EGCs were utilized for product development than compliance
with Section 404(b).
4. Survey Evidence on Compliance Costs of Section 404(b)
This section presents survey evidence of the costs associated with Section 404(b)
compliance. We first examine prior surveys of Section 404(b) compliance, and then discuss the
results of a member survey conducted by the Biotechnology Innovation Organization on our behalf
regarding the estimated costs of complying with Section 404(b) for biotech companies.
4.1. Existing evidence on compliance costs
The most controversial and costly aspect of SOX is compliance with Section 404(b).
Market participants and academics have long raised concerns over the disproportionate cost of
Section 404(b) compliance for smaller companies. For example, the GAO reported in 2006 that
audit fees were higher as a percentage of revenues for smaller issuers prior to SOX, and that this

32
difference increased following after SOX.61 As described in Subsection 1.2, these concerns
resulted in delayed effective dates and exemptions for certain smaller companies over the years.62
The estimated costs of complying with Section 404(b) vary widely depending on company
size and the period in which the costs were estimated. Shortly after the passage of SOX, the SEC
estimated the economy-wide annual costs of implementing Section 404 in June 2003 to be around
$1.24 billion (or $91,000 per company), not including the cost of the auditor’s attestation report.
This statistic was quickly and widely criticized as being egregiously understated, especially for
smaller companies. For example, A.R.C. Morgan (2005) examined a sample of 280 companies
that disclosed the actual cost of initial compliance with Section 404.63 They report that smaller
companies incurred higher compliance costs than larger companies as a percentage of sales. In
Exhibit 1, we reproduce the data published by A.R.C. Morgan in their report summarizing fees by
company size based on sales:
Exhibit 1. A.R.C. Morgan’s Section 404 Compliance Cost Data
Average Company
Annual Sales in US$
Average Cost of Section 404
Compliance for External
Resources only
Compliance Cost as a Percent
of Sales
(Using Midpoint)
0 – 250 Million $1.56 million 1.25%
250 – 500 Million $1.71 million 0.46%
500 – 750 Million $1.78 million 0.28%
750 Million – 1 Billion $2.03 million 0.23%
1 – 2 Billion $2.40 million 0.16%
2 – 7 Billion Insufficient data n/a
7 – 10 Billion $10 million 0.12%
Based on these estimates, an issuer with annual sales of $125 million would spend 1.25%
of sales on Section 404 compliance, where an issuer with annual sales of $375 million would only
spend 0.46% of sales on compliance. Similarly, an issuer with annual sales of $1.5 billion would
only spend 0.16% of sales on compliance. Thus, issuers with revenues of only $125 million
annually would spend 174% more as a percent of sales than an issuer with revenue of $375 million,
and 680% more as a percent of sales than an issuer with $1.5 billion in revenue.
61 See GAO, “Sarbanes-Oxley Act: Consideration of Key Principles Needed in Addressing Implementation for Smaller
Public Companies,” Apr 2006, available at https://www.gao.gov/assets/250/249736.pdf. 62 Former SEC Chairman William Donaldson testified to the House Committee on Financial Services in 2005. He
admitted that, “[I]mplementing Section 404 has not been easy for public companies and has required significant
outlays of time and expense…This is a complex undertaking for a small company…” See Chairman William H.
Donaldson, “Testimony Concerning the Impact of the Sarbanes-Oxley Act, Before the House Committee on Financial
Services,” Apr 21, 2005, available at https://www.sec.gov/news/testimony/ts042105whd.htm. 63 A.R.C. Morgan, “Sarbanes-Oxley Implementation Costs: What companies are reporting in their SEC Filings,” Feb
2005. Retrieved from https://www.auditnet.org/system/resources.

33
Other estimates of Section 404 compliance costs came in much higher than the SEC’s
original estimate of $91,000 per issuer.64 For example, Charles River Associates surveyed Fortune
1000 issuers in 2005 and found issuers spent a total of $7.8 million on average to comply with all
of the Section 404 requirements.65
The SEC produced a study of Section 404 compliance costs in September 2009 based on
survey responses from corporate executives. It notes that the cost of complying with Section 404
is “generally viewed as being unexpectedly high,” especially for smaller companies where some
fixed start-up costs of compliance are not scalable. Despite the PCAOB’s implementation of AS5
in 2007, the SEC notes that smaller companies still report higher proportional costs of Section
404(b) compliance.
The 2007 study by the SEC estimates that the average total cost of Section 404 compliance
is $690,219 for non-accelerated filers and $1,011,404 for accelerated filers. These estimates
include $259,004 and $280,969 in Section 404(b) audit fees for non-accelerated and accelerated
filers, respectively. This study shows that although total compliance costs have declined after the
AS5 reform, the Section 404(b) compliance values remain quite substantial.66
The SEC produced another Section 404(b) compliance cost study in 2011. They reported
that issuers with a public float between $75 and $250 million had total Section 404 compliance
costs of $840,276 on average, including $229,127 in Section 404(b) audit fees. Issuers with a
public float between $250 and $700 million reported total Section 404 compliance costs of
$1,215,808, on average, including $343,305 in Section 404(b) audit fees.67
64 See SEC, Final rule: Management’s reports on internal control over financial reporting and certification of disclosure
in Exchange Act periodic reports. Release Nos. 33-8238, 34-47986. Aug 14, 2003, available at https://www.sec.gov/
rules/final/33-8238.htm. 65 Charles River Associates (“CRA”) (2005) examined a sample of 90 clients that were Fortune 1000 issuers to
determine the cost of Section 404 compliance in the first year of compliance. CRA reports that these clients spent an
average of $5.9 million to comply with Section 404 excluding audit fees. Including audit fees, these companies spent
a total of $7.8 million on average to implement Section 404 overall. These fees break down as follows: average audit
fees ($1.9 million); average issuer costs excluding audit fees ($5.9 million); total average compliance costs ($7.8
million); average company revenue ($8.1 billion); Section 404 compliance as a percent of revenue (0.10%); 404 audit
fees as a percent of revenue (0.02%). CRA projected Section 404 compliance costs for the future years as $4.2 million
on average. The reduced compliance costs reflect survey data and a reduction in annual compliance due to learning.
See Charles River Associates, “Sarbanes-Oxley Section 404 Costs and Remediation of Deficiencies: Estimates from
a Sample of Fortune 1000 Companies,” Apr 2005, https://www.sec.gov/spotlight/soxcomp/soxcomp-all-attach.pdf. 66 See SEC, Office of Economic Analysis, “SEC Study of the Sarbanes-Oxley Act of 2002 Section 404 Internal Control
over Financial Reporting Requirements,” Sep 2009, http://www.sec.gov/news/studies/2009/sox-404_study.pdf. 67 See SEC, “Division of Economic and Risk Analysis, Study and Recommendations on Section 404(b) of the
Sarbanes-Oxley Act of 2002 for Issuers with Public Float Between $75 and $250 Million.” Apr 2011, available at
https://www.sec.gov/news/studies/2011/404bfloat-study.pdf.
34
More recently, Dharmapala (2016) reports compliance costs that are much larger than those
provided in either of the 2007 and 2011 studies by the SEC. He estimates a net present value of
compliance costs of $4 to $6 million for issuers around the $75 million public float threshold.
Protiviti published a SOX compliance cost survey in 2018 that excludes external audit-
related fees. They find average annual internal compliance costs are $1,338,900 for large
accelerated filers, $997,000 for accelerated filers, $560,700 for non-accelerated filers, and
$1,391,500 for EGCs. In fact, their survey shows average annual SOX compliance costs for EGCs
increase each year for 2016, 2017, and 2018, even when compared to issuers in the large
accelerated filer category. In 2018, healthcare providers bear the largest annual SOX compliance
costs compared to issuers operating in the financial services, manufacturing, technology, energy,
insurance, and consumer products sectors.68
While these surveys attempt to adjust compliance estimates based on company size, none
of the studies are specific to Bio-EGCs. This distinction is important for two interrelated reasons:
(i) Prior to receiving FDA approval, Bio-EGCs effectively operate as start-up companies; and (ii)
due to the corresponding lack of revenues, many Bio-EGCs disclose in annual reports that potential
future compliance with Section 404(b) is a significant risk factor to the viability of their business.69
Some anecdotal evidence on Section 404(b) compliance costs for Bio-EGCs comes from a
September 2017 presentation to the SEC Advisory Committee on Small and Emerging Companies
by William J. Newell, CEO of Sutro Biopharma. In Exhibit 2, we reproduce Mr. Newell’s
estimates of Section 404(b) compliance costs for four actual (but anonymized) Bio-EGCs:70
68 See Protiviti, “Benchmarking SOX Costs, Hours and Controls,” 2018, p.4, available at https://www.protiviti.com/
sites/default/files/united_states/insights/sarbanes-oxley_survey_2018_protiviti.pdf. 69 See, e.g., Supernus Pharmaceuticals 2013 Annual Report, noting on p.64 that “As a public company, we are subject
to Section 404(a) of the Sarbanes-Oxley Act relating to internal controls over financial reporting and we expect to
incur significant expense and devote substantial management effort toward ensuring compliance with Section 404(a).
We currently do not have an internal audit group, and we will need to hire additional accounting and financial staff
with appropriate public company experience and technical accounting knowledge. Implementing any appropriate
changes to our internal controls may require specific compliance training for our directors, officers and employees,
entail substantial costs to modify our existing accounting systems, and take a significant period of time to complete.”
Available at https://www.sec.gov/Archives/edgar/data/1356576/000104746914002791/a2219052z10-k.htm; and
Tesaro, Inc. 2013 Annual Report. “Our compliance with Section 404 will require that we incur substantial accounting
expense and expend significant management efforts,” p.61, available at https://www.sec.gov/Archives/edgar/data/
1491576/000110465914019488/ a13-25458_110k.htm. 70 See William J. Newell, “Sarbanes-Oxley Section 404(b): Costs of compliance and proposed reforms. SEC Advisory
Committee on Small and Emerging Companies,” Sep 13, 2017, available at https://www.sec.gov/info/smallbus/acsec/
william-newell-acsec-091317.pdf.

35
Exhibit 2. Anecdotal Estimates of Section 404(b) Compliance Costs for EGCs
Period Company
Public
Float
($ M) Employees
Audit
Fee
External
Consultant
Internal
Labor Total
Pre-JOBS Act A 200 600 $250,000 $40,000 $150,000 $440,000
Pre-JOBS Act B 560 80 $240,000 $30,000 $105,000 $375,000
EGC Projection C 85 60 $250,000 $60,000 $50,000 $360,000
EGC Projection D 240 45 $325,000 $125,000 $15,000 $465,000
Other Bio-EGC compliance cost evidence is provided to the SEC in comments on the
proposed definition of a smaller reporting company. One Bio-EGC noted that following the
expiration of EGC status, they estimate spending more than $400,000 annually on Section 404(b)
compliance.71 Based on these anecdotal estimates, Bio-EGCs could be expected to incur Section
404(b) compliance costs of $360,000 to $465,000 once they lose EGC status.
4.2. BIO Survey Results
Given that many Section 404(b) compliance cost estimates are dated and may not apply
specifically to Bio-EGCs, we introduce new survey evidence. Biotechnology Innovation
Organization conducted a web-based survey of the costs and benefits of Section 404(b) compliance
for its members and shared their survey data with us.72 On October 24, 2018, the survey
questionnaire was sent to 212 members. Between this date and November 16, 2018, there were 36
full or partial respondents, for a response rate of 17%. Of those members responding, 16 firms
reported that they went public as an EGC and 11 retained their EGC status as of the survey date.
Thus, all inferences below are provided with the caveat that our sample size is small and the survey
response rate is moderate given the short time period to respond.
Table 12 summarizes survey responses to the impact of Section 404(b) compliance. Panel
A provides results for 14 respondents that currently comply with Section 404(b) attestation (i.e.,
does not include current Bio-EGCs). We find that biotech issuers complying with Section 404(b)
believe that auditor attestation of ICFR has a positive impact on the quality of internal controls.
The influence on the audit committee’s confidence in ICFR and the accuracy of financial
statements also are highly positive. Auditor attestation has a smaller but positive perceived impact
71 In a comment letter by Calithera Biosciences to the SEC regarding proposed amendments to the SRC definition, the
CFO notes that, “Compliance with Sarbanes-Oxley (SOX) Section 404(b), which is governed by the non-accelerated
filer definition, is extremely costly for emerging biotechnology companies like Calithera. When we are forced to
become compliant with Section 404(b) following the expiration of our emerging growth company (EGC) status, we
estimate that we will spend more than $400,000 annually on SOX compliance. Those funds would be better spent
conducting research to support our effort to bring medicines to patients.” The comment letter is dated August 8, 2016,
and is available at https://www.sec.gov/comments/s7-12-16/s71216-7.pdf. 72 We supervised the design of the survey questions.

36
on the quality of financial reporting and the ability to detect fraud. Auditor attestation also has a
small, positive perceived influence on the company’s ability to raise capital and investor
confidence in the company. Respondents view the impact of Section 404(b) compliance as having
a slight positive effect on firm value, but almost no influence on the efficiency of financial
reporting progress and the liquidity of common stock. Auditor attestation has a small negative
influence on the efficiency of company operations.
Panel B summarizes survey responses to the potential benefits of extending Section 404(b)
relief beyond five years for current Bio-EGCs. Respondents indicate that extending such relief
would have a strong, positive impact on annual investment in R&D, and would also allow these
firms to hire additional employees and provide better opportunities to raise capital and invest in
product safety. A few respondents believe investor confidence and the probability of success of
clinical trials might also experience small, positive benefits.
Panel C presents current Bio-EGC respondents’ estimates of the annual auditing costs of
complying with Section 404(b). These audit estimates do not include internal labor costs, external
consulting fees, and services such as technology fees and hiring outside vendors. The average and
median estimates of Section 404(b) audits are $412,143 and $400,000, respectively. The lowest
estimate was $125,000 and the highest was $1,000,000. To put these estimates into perspective,
they are almost three times the average annual revenue of a Bio-EGC firm ($140,000 as reported
in Table 5).
Panel D reports estimated costs paid to outside vendors and consultants specifically to
comply with Section 404(b) during fiscal years 2013 to 2017. For this panel, we summarize
reported costs for both former Bio-EGCs (i.e., biotech companies that went public and are no
longer categorized as EGCs) and current Bio-EGCs. Thus, these costs reflect Section 404(b)
compliance after losing EGC status for former Bio-EGCs, and costs paid in anticipation of future
compliance for current Bio-EGCs.
Panel D shows that former Bio-EGCs spent an average (median) of $192,200 ($175,000)
on external consultants to comply with Section 404(b) during fiscal year 2017. We focus on fiscal
year 2017 because it represents the most recent fiscal year and because our survey data does not
allow us to identify which year the former Bio-EGC lost its EGC status. As expected, the average
cost of hiring external consultants increases in each fiscal year as more Bio-EGCs lose their
exemption from Section 404(b).
Survey responses in Panel D show that current Bio-EGCs also spend resources hiring
external consultants in anticipation of future Section 404(b) compliance. The average current Bio-
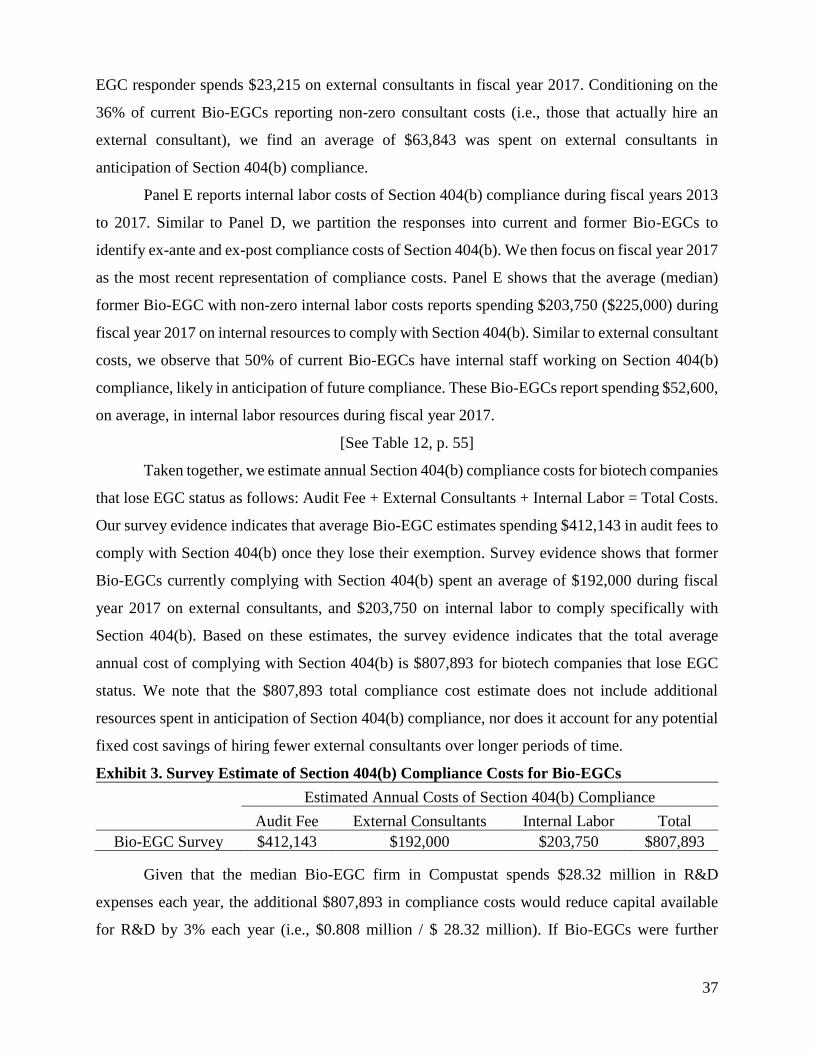
37
EGC responder spends $23,215 on external consultants in fiscal year 2017. Conditioning on the
36% of current Bio-EGCs reporting non-zero consultant costs (i.e., those that actually hire an
external consultant), we find an average of $63,843 was spent on external consultants in
anticipation of Section 404(b) compliance.
Panel E reports internal labor costs of Section 404(b) compliance during fiscal years 2013
to 2017. Similar to Panel D, we partition the responses into current and former Bio-EGCs to
identify ex-ante and ex-post compliance costs of Section 404(b). We then focus on fiscal year 2017
as the most recent representation of compliance costs. Panel E shows that the average (median)
former Bio-EGC with non-zero internal labor costs reports spending $203,750 ($225,000) during
fiscal year 2017 on internal resources to comply with Section 404(b). Similar to external consultant
costs, we observe that 50% of current Bio-EGCs have internal staff working on Section 404(b)
compliance, likely in anticipation of future compliance. These Bio-EGCs report spending $52,600,
on average, in internal labor resources during fiscal year 2017.
[See Table 12, p. 55]
Taken together, we estimate annual Section 404(b) compliance costs for biotech companies
that lose EGC status as follows: Audit Fee + External Consultants + Internal Labor = Total Costs.
Our survey evidence indicates that average Bio-EGC estimates spending $412,143 in audit fees to
comply with Section 404(b) once they lose their exemption. Survey evidence shows that former
Bio-EGCs currently complying with Section 404(b) spent an average of $192,000 during fiscal
year 2017 on external consultants, and $203,750 on internal labor to comply specifically with
Section 404(b). Based on these estimates, the survey evidence indicates that the total average
annual cost of complying with Section 404(b) is $807,893 for biotech companies that lose EGC
status. We note that the $807,893 total compliance cost estimate does not include additional
resources spent in anticipation of Section 404(b) compliance, nor does it account for any potential
fixed cost savings of hiring fewer external consultants over longer periods of time.
Exhibit 3. Survey Estimate of Section 404(b) Compliance Costs for Bio-EGCs
Estimated Annual Costs of Section 404(b) Compliance
Audit Fee External Consultants Internal Labor Total
Bio-EGC Survey $412,143 $192,000 $203,750 $807,893
Given that the median Bio-EGC firm in Compustat spends $28.32 million in R&D
expenses each year, the additional $807,893 in compliance costs would reduce capital available
for R&D by 3% each year (i.e., $0.808 million / $ 28.32 million). If Bio-EGCs were further
38
exempted from Section 404(b) compliance by an additional five years, then these estimates
indicate that Bio-EGCs would save approximately $4 million in total compliance costs.
5. Implications of Section 404(b) for the Biotech Industry
5.1. Unique Aspects of Bio-EGCs
Following the passage of the JOBS Act, over one-third of all firms going public in the U.S.
are Bio-EGCs.73 We have argued that Bio-EGCs are substantially different from other EGCs in
that they frequently have zero or extremely low revenues and spend heavily on R&D before
receiving their first FDA therapy approval.74 In effect, Bio-EGCs are early-stage companies that
are expected to continuing operating like a start-up company for extended time periods (10-15
years) due to the time required for product development and lengthy FDA approval process.
The FDA approval process is complex and can be broken down into stages and phases
(Van Norman, 2016):
• Stage 1 is characterized by the discovery of new compounds or the development of new
technologies that have therapeutic benefits. Following these discoveries is a period of basic
research wherein studies are conducted to determine appropriate dosage, side effects, delivery
mechanisms, and how differs from exiting medications.
• Stage 2 constitutes preclinical research that evaluates a new drug’s toxicity. If it is deemed safe
for humans, it can move onto the clinical trials.
• Stage 3 involves clinical research to determine how a drug interacts with the human body. This
is a formal process with four separate phases:75
o Phase I involves between 20 and 100 volunteers. This phase lasts several months and is
used to determine safety and dosage.
o Phase II involves 100 to 300 volunteers that have the disease or condition that the drug is
supposed to treat and can last up to two years. It is often tested against a placebo group.
The studies conducted in this phase monitor drug efficacy and track side effects.
o Phase III involves 300 to 3000 volunteers and can last up to four years. It encompasses
additional clinical trials and considers longer-term adverse reactions. If the results of these
73 This statistic is based on EGCs representing 87% of effective registration statements for companies conducting an
IPO since the JOBS Act and 39% of EGCs operating in the healthcare industry. See Ernst & Young, “Trends in US
IPO Registration Statements,” Nov 2018, https://www.ey.com/publication/vwluassetsdld/iporegistrationstatements
_04688-181us_30october2018/$file/iporegistrationstatements_04688-181us_30october2018.pdf. 74 See Pharmaceutical Research and Manufacturers of America, “Biopharmaceutical Research & Development: The
Process Behind New Medicines,” 2015, noting on p.1 that, “On average, it takes at least ten years for a new medicine
to complete the journey from initial discovery to the marketplace, with clinical trials alone taking six to seven years
on average,” available at http://phrma-docs.phrma.org/sites/default/files/pdf/rd_brochure_022307.pdf; and U.S.
Department of Veterans Affairs, “How long does the FDA take to approve a drug?” Retrieved from
https://www.hiv.va.gov/patient/clinical-trials/drug-approval-process.asp. 75 See FDA, “Learn About Drug and Device Approvals,” https://www.fda.gov/ForPatients/Approvals/default.htm; and
Diabetes Patient Advocacy Coalition, “The FDA Drug Approval Process,” available at http://diabetespac.org/fda-
drug-approval-process/.

39
trials are positive, the drug becomes subject to FDA final review.
o Phase IV includes any clinical trials conducted after the FDA approves the drug. During
this Phase IV, the drug is released by the FDA for marketing.
5.2. Bio-EGC Value Drivers
Investors in biotech firms evaluate the company’s science and its prospects for developing
a commercially viable drug that can pass the FDA approval process. During the approval period,
low to non-existent product revenues require investors to utilize non-traditional metrics of value
drivers, such as the stage of the FDA approval process, drug efficacy, and the severity of identified
side effects. Investors also track the amount of available cash (which we show is a significant
fraction of assets for most Bio-EGCs) and the associated cash burn rate. Panel A of Table 5 reports
that Bio-EGCs spend 35.64% of total assets on R&D each year compared to 8.85% for non-Bio-
EGCs. It stands to reason that investors consider the burn rate to be an important valuation metric
for a company that spends over one-third of its total assets each year on R&D.76
5.3. Disproportionate Costs and Limited Benefits of Complying with Section 404(b)
As noted above, Table 2 indicates that 65.7% of Bio-EGCs choose to go public before they
have advanced to the pivotal Phase III of the FDA approval process. Since these firms have zero
product revenue at this stage, Bio-EGCs are at a point in their life cycle where they are spending
significant amounts of their available capital to fund clinical trials and to perform fundamental
research related to drug efficacy and safety. Table 5 shows that the average firm keeps 80.48% of
total assets in highly liquid investments (e.g., cash) and spends 35.64% of total assets on R&D
each year. This indicates that Bio-EGCs have enough just enough cash to get to the next phase
before they have to fund again. Based on our estimates, the average Bio-EGC can fund
approximately 2.26 (80.48 / 35.64) years of R&D using its available cash reserves. Given that Bio-
EGCs “burn” cash as they develop commercially viable drugs, anything that impedes the
development process will reduce the likelihood that these firms will be able to eventually obtain
FDA approval.
Consistent with these conjectures, Gao and Zhang (2018) find that firms just exceed the
threshold that requires Section 404(b) compliance have a significant decrease in the number of
patents and patent citations compared to firms that are exempt. The authors conclude that Section
76 Such a signal conveys positive information to investors only if R&D efforts are accompanied by advancement
through the various stages of the FDA approval process, even if the products have yet to generate revenues. Some
Bio-EGCs are able to generate revenues prior to receiving FDA approval by “partnering” with other more established
companies who help fund their research efforts.

40
404(b) compliance impedes innovation. Thus, the phased-in compliance with Section 404(b) for
Bio-EGCs should reduce Bio-EGC innovation and impede their ability to bring products to market.
Another concern with forcing Bio-EGCs to comply with Section 404(b) is that auditor
attestation is largely unnecessary due to the simple nature of their accounting systems. At this
juncture in their lifecycles, Bio-EGCs have non-complex business models and primarily spend
cash on items that are easy to verify, such as payroll and R&D expenditures. As such, Bio-EGCs
do not have the potential internal control issues faced by more mature companies such as improper
revenue recognition and the manipulation of complex accrued liabilities that require significant
judgement.77 Since the financial reporting and internal control issues are relatively simple, we
believe that Section 404(b) auditor attestation does not provide significant incremental benefit for
investors. Rather than protecting investors, unnecessary compliance diverts capital from R&D
which, on net, reduces firm value and diminishes an issuers ability to advance their science and
technology.
At its core, this is a simple dollar-for-dollar trade-off between science and compliance.
Although Section 404(b) compliance may improve investor confidence in financial reporting in
certain settings, it is difficult to understand how these benefits apply to early stage companies in
the biotech industry given the straightforward nature of financial reporting.
5.4. Benefits of Extending Section 404(b) Relief
This subsection estimates benefits of extending Section 404(b) relief. The BIO survey
evidence shows that respondents believe there is a tangible tradeoff between resources that could
be used to invest in clinical trials and Section 404(b) related costs. Panel B of Table 12 reports that
Bio-EGCs believe that the main benefits from extending the compliance period are to maintain
current R&D spending and the ability to hire additional employees. If one considers that the
average estimated Section 404(b) compliance cost for a Bio-EGC is approximately $800,000 per
year, then we estimate that extending Section 404(b) relief would allow Bio-EGCs to hire eight
additional researchers (at approximately $100,000 per year) or add an additional 8 to 16 patients
in clinical trials (estimates range from $50,000 to $100,000 per patient enrolled in clinical trials,
77 Much of the underlying rational for requiring Section 404(b) auditor attestation was based on fraudulent accounting
due to revenue exploitation. For example, Dechow and Skinner (2000) distinguish between accounting choices within
GAAP and those that violate GAAP. They note that fraudulent accounting typically includes recording sales before
they are “realizable”; recording fictitious sales; backdating sales invoices; and overstating inventory. Yet, Bio-EGCs
often have no revenue and their assets tend to consist primarily of cash since the value of R&D does not accrue to the
balance sheet unless the company is acquired. Thus, the potential benefits of a Section 404(b) auditor attestation are
likely limited to accounting for core expenses, which effectively being reported on a cash basis.

41
depending on its type and structure) per year. Given the small scale of these firms, eight researchers
would constitute a 12.70% increase in intellectual capital from the median of 63 employees.78
Moreover, based on the expensive nature of R&D investment and product testing, allowing biotech
companies to devote scarce resources toward product development rather than compliance would
have a better opportunity to advance to the next stage of the clinical trial process.
Extending Section 404(b) relief for Bio-EGCs could also have potentially large benefits
for society, even if they do not lend themselves to ready quantification. For example, 18% of Bio-
EGC IPOs have lead drug candidates that target a rare disease. Other Bio-EGCs conduct research
and perform clinical trials that aim to treat cancer, Alzheimer’s and other neurological diseases,
infectious disease, and heart disease (See Table 2). The survey evidence shows compliance savings
will be invested in additional research, which should improve the speed and probability of
developing innovative drugs that successfully move through the FDA approval process. Freeing
up scarce innovative capital for biotech companies to spend more on basic research may also lead
to discovery of wider applications and ultimately the development of treatments for significant
health challenges, thereby improving the quality of life for society as a whole.
Extending compliance exemptions from Section 404(b) would also have potential spillover
benefits for the U.S. economy in the form of greater employment. The number and success of start-
up companies are crucial to innovation in the life sciences. In a recent study of high-technology
start-up companies, including those in the life sciences, the Information Technology & Innovation
Foundation shows that these companies account for a significant share of new-employment
growth, and a higher portion of job growth than start-ups in other industries, largely because firms
in technology-based industries are better able to translate their R&D investments into jobs.79
5.5. An Alternative Regulatory Approach
The SEC could remedy the disproportionate costs and benefits of Section 404(b)
compliance by altering how issuer size is determined. As we demonstrate in this report, the current
SEC reporting regime would classify many Bio-EGCs with low or zero product revenue as
accelerated filers due to high market capitalization that translates to a large public float. Once the
IPO On-Ramp period ends, these former Bio-EGCs will be forced into costly Section 404(b)
78 There are 241 firms that report employment data in Compustat. The average number of employees at Bio-EGC
firms is 107.2, the minimum is 2, the median is 63, and the maximum is 1,006. Because a few large employers distort
the average, we calculate the fraction of new employees using the median value. 79 See Joe Kennedy, Information Technology & Innovation Foundation, “How to Ensure That America’s Life-
Sciences Sector Remains Globally Competitive,” Mar 2018, available at http://www2.itif.org/2018-life-sciences-
globally-competitive.pdf?_ga=2.202114905.930546292.1544119055-15769970.1543611078.

42
compliance, even though their financial characteristics and financial reporting issues are most
similar to non-accelerated filers, which are permanently exempt from Section 404(b). In a sense,
Bio-EGCs are victims of their own success because they are able to generate high market
capitalizations before generating significant product revenues. We show that by mis-categorizing
these former Bio-EGCs as accelerated filers, millions of dollars that could further innovation are
diverted from science to compliance. Therefore, the current rules requiring low and pre-revenue
companies to be classified as accelerated filers based on public float serves as a roadblock to
developing new technologies that benefit investors and the end users of biotech products.
We believe that the SEC should expand its definition of non-accelerated filers to include
alternative revenue tests. One example could be to exempt firms with less than $100 million in
annual revenue. Another simple approach would be to extend section 404(b) relief to issuers
meeting the SRC definition. Such relief would benefit Bio-EGCs that have decades long R&D
periods and operate pre-revenue.
The planned five-year phase-in of Section 404(b) compliance will force Bio-EGCs at the
end of the IPO On-Ramp to incur substantial compliance costs at time when the benefits from
auditor attestation are relatively small due to the straightforward and simplistic accounting issues
that characterize Bio-EGCs. We encourage the SEC to recognize these nuances in determining the
costs and benefits of extending Section 404(b) compliance as an important consideration for its
mission of balancing investor protection with facilitating capital formation.
6. Conclusion
This report demonstrates that the cost of Section 404(b) compliance significantly
outweighs the benefits for Bio-EGCs at the end of their IPO On-Ramp. Due to the unique aspects
of the biotech industry, the findings in our report infer that the SEC should consider extending
Section 404(b) exemption for prior EGCs with low revenue.
To reach this conclusion, we first review academic literature on Section 404(b) compliance
and the JOBS Act. Studies link Section 404(b) compliance to reduced market capitalization, higher
audit fees, exiting public markets, and reduced innovation for smaller companies. Academic
studies also find only limited benefits as the market does not significantly value disclosures of
internal control weaknesses, and disclosing non-effective ICFR by managers and auditors do not
predict future material weaknesses. Put simply, academic studies show that the costs of Section
404(b) are high and the benefits are low for small companies like low revenue Bio-EGCs at the
end of their IPO On-Ramp.

43
Importantly, academic studies of the JOBS Act find that exemption from Section 404(b)
compliance significantly boosted IPO volume and that the increase is largely attributable to biotech
issuers. Extending the exemption from Section 404(b) for low revenue Bio-EGCs could further
boost IPO activity and encourage existing Bio-EGCs to remain public. Such positive steps towards
enhancing capital formation would address concerns expressed by SEC Chairman Jay Clayton
who testified to the Senate Banking Committee in December 2018 that market participants noted
the costs associated with Section 404(b) “divert significant capital from the core business needs of
companies without a corresponding investor benefit.” Our report introduces supporting evidence.80
We provide empirical evidence that Bio-EGCs are similar to non-accelerated filers on a
number of dimensions except for market capitalization. These similarities are important because
the disproportionate costs of auditor attestation were recognized by lawmakers in exempting non-
accelerated filers from Section 404(b). Further, we introduce a statistical analysis that shows Bio-
EGCs are significantly less likely to have a financial restatement than other listed issuers
complying with Section 404(b). Moreover, Bio-EGCs are less likely to have ICFR that is declared
not effective. Taken together, our empirical evidence demonstrates that exempting Bio-EGCs from
Section 404(b) has not diminished investor protection.
We also introduce novel survey data that estimates Section 404(b) compliance costs for
Bio-EGCs to be $807,893 per year. We argue that extending the exemption from Section 404(b)
compliance for Bio-EGCs would free up capital that survey evidence shows will be used for
additional R&D and hiring. We then show that the passage of the JOBS Act has resulted in Bio-
EGC employment growth that exceeds 200%, which is more than twice the growth rate of Non-
Bio EGCs. Failing to extend the Section 404(b) exemption to Bio-EGCs would harm employees,
investors, end-users, society, and have detrimental effects on the overall economy by dampening
the most vital sector of the IPO market, impeding capital formation, and reducing innovation.
Collectively, our report demonstrates that an extended exemption from Section 404(b) for
Bio-EGCs would achieve the SEC’s mission of balancing investor protection and capital
formation. Such relief would provide both economic and societal benefits as innovative Bio-EGCs
develop therapeutic products aimed at healing important diseases such as cancer.
In sum, this report illuminates a clear conclusion: the scarce innovative resources of Bio-
EGCs at the end of the IPO On-Ramp are better used for science than Section 404(b) compliance.
80 See SEC Chairman Jay Clayton, Testimony on “Oversight of the U.S. Securities and Exchange Commission,”
Before the U.S. Senate Committee on Banking, Housing, and Urban Affairs, Dec 11, 2018, available at
https://www.sec.gov/news/testimony/testimony-oversight-us-securities-and-exchange-commission-0.

44
Academic Citations
Alexander, C., Bauguess, S., Bernile, G., Lee, Y., Marietta-Westberg, J. (2013). Economic effects of SOX
Section 404 compliance: A corporate insider perspective. Journal of Accounting and Economics, 56, 267-290.
Chaplinsky, S., Hanley, K., Moon, S. (2017). The JOBS Act and the costs of going public. Journal of Accounting
Research, 55, 795-836.
Dambra, M., Field, L., Gustafson, M.T. (2015). The JOBS Act and IPO volume: Evidence that disclosure costs
affect the IPO decision. Journal of Financial Economics, 116, 121-143.
Dechow, P.M., Skinner, D.J. (2000). Earnings management: Reconciling the views of accounting academics,
practitioners, and regulators. Accounting horizons, 14, 235-250.
Dharmapala, D. (2016). Estimating the Compliance Costs of Securities Regulation: A Bunching Analysis of
Sarbanes-Oxley Section 404 (b). Working paper, University of Chicago Law School. Retrieved from
https://ssrn.com/abstract=2885849.
Ettredge, M., Sherwood, M., Sun, L. (2018). Effects of SOX 404(b) implementation on audit fees by SEC filer
size category. Journal of Accounting and Public Policy, 37, 21-38.
Gao, H., Zhang, J. (2018). SOX Section 404 and corporate innovation. Journal of Financial and Quantitative
Analysis, forthcoming.
Ge, W., Koester, A., McVay, S. (2017). Benefits and costs of Sarbanes-Oxley Section 404(b) exemption:
Evidence from small firms’ internal control disclosures. Journal of Accounting and Economics, 63, 358-384.
Hammersley, J., Myers, L. A., Shakespeare, C. (2008). Market reactions to the disclosure of internal control
weaknesses and to the characteristics of those weaknesses under section 302 of the Sarbanes Oxley Act of 2002.
Review of Accounting Studies, 13, 141-165.
Iliev, P. (2010). The effect of SOX Section 404: Costs, earnings quality, and stock prices. The Journal of Finance,
65, 1163-1196.
Jain, P. K., Rezaee, Z. (2006). The Sarbanes‐Oxley Act of 2002 and capital‐market behavior: Early evidence.
Contemporary Accounting Research, 23, 629-654.
Kamar, E., Karaca-Mandic, P., Talley, E. (2008). Going-private decisions and the Sarbanes-Oxley Act of 2002:
A cross-country analysis. Journal of Law, Economics, & Organization, 25, 107-133.
Leuz, C., Triantis, A., Wang, T. Y. (2008). Why do firms go dark? Causes and economic consequences of
voluntary SEC deregistrations. Journal of Accounting and Economics, 45, 181-208.
Li, H., Pincus, M., Rego, S. O. (2008). Market reaction to events surrounding the Sarbanes-Oxley Act of 2002
and earnings management. Journal of Law and Economics, 51, 111-134.
Nagy, A. L. (2010). Section 404 compliance and financial reporting quality. Accounting Horizons, 24, 441-454.
Rice, S. C., Weber, D. P. (2012). How effective is internal control reporting under SOX 404? Determinants of
the (non‐) disclosure of existing material weaknesses. Journal of Accounting Research, 50, 811-843.
Van Norman, G. A. (2016). Drugs, devices, and the FDA: Part 1: An overview of approval processes for drugs.
JACC: Basic to Translational Science, 1, 170-179.
Zhang, I. X. (2007). Economic consequences of the Sarbanes–Oxley Act of 2002. Journal of Accounting and
Economics, 44, 74-115.

45
Appendix. Variable Definitions
Variable Definition
Market capitalization Net number of common shares outstanding multiplied by the closing price
of the firm’s common stock at the fiscal year end, from Compustat.
Total assets The book value of total assets from the company’s fiscal year-end balance
sheet, from Compustat.
Market-to-book The market capitalization of common stock plus total long-term debt from
the balance sheet divided by the book value of total assets, from
Compustat.
Total revenue Total annual gross revenue, from Compustat.
Low revenue An indicator variable equal to 1 if total annual gross revenue is less than
$50 million; otherwise 0.
Zero revenue An indicator variable equal to 1 if the company has zero reported revenue
for the fiscal year; otherwise 0.
Return on assets Operating income after depreciation divided by total assets, from
Compustat.
Free cash flow Net change in cash from all items classified in the operating activities
section on the statement of cash flows less capital expenditures, divided
by total assets, from Compustat.
Leverage Total long-term debt divided by total assets, from Compustat.
Cash intensity Cash and short-term investments divided by total assets, from Compustat.
Current asset intensity Total current assets divided by total assets, from Compustat.
Asset liquidity Total current assets less total current liabilities, divided by total assets,
from Compustat.
R&D intensity Total research and development (R&D) expenses divided by total assets,
from Compustat. If missing, we set this value to zero.
CapEx intensity Total capital expenditures (CapEx) divided by total assets, from
Compustat. If missing, we set this value to zero.
Gross property ratio The gross property, plant and equipment value divided by total assets,
from Compustat. If missing, we use the net property ratio.
Financial restatement Equals one if the company restates financials, from Audit Analytics.
Audit fees Total audit fees in millions, from Audit Analytics.
Non-audit fees Total non-audit fees in millions, from Audit Analytics.
Auditor attestation of ICFR Equals one if the auditor provides an attestation of the manager’s report
on internal controls over financial reporting, from Audit Analytics.
Non-effective ICFR Equals one if the internal controls over financial reporting are declared
not effective by managers or auditors, from Audit Analytics.

46
Figure 1. Biotech IPOs over 2006 to 2018
This figure plots the number of biotech IPOs over 2006-2018. There were 5 IPOs in 2012 prior to
April 5, 2012 enactment of the JOBS Act, and 8 IPOs in 2012 after this date. In total there
respectively were 81 biotech IPOs prior to the JOBS Act and 300 Bio-EGC IPOs in the post-JOBS
Act periods. The total number of Bio-EGC IPOs in 2018 is as of December 15, 2018.
Figure 2. Employment Growth at Bio-EGCs
Panel A. This figure presents the mean and median number of employees for Bio-EGCs going
public in calendar year 2012 or 2013 that remain listed through the end of fiscal year 2017.
0
10
20
30
40
50
60
70
80
90
2006 2007 2008 2009 2010 2011 2012
(pre)
2012
(post)
2013 2014 2015 2016 2017 2018
Biotech IPOs Per Year, 2006 to 2018
0
50
100
150
200
250
1 2 3 4 5
Num
ber
of
Em
plo
yee
s
Fiscal Year after IPO
Bio-EGC Employees after IPO
Mean Median

47
Figure 2 (continued)
Panel B. This figure presents the mean and median employment growth for Bio-EGC and Non-
Bio EGCs over the first five fiscal years.
Table 1. Industry Distribution of 300 Bio-EGCs
SIC Code - Industry N Percent Cumulative
2833 Medicinal Chemicals & Botanical Products 2 0.7 0.7
2834 Pharmaceutical Preparations 181 60.3 61.0
2835 In Vitro & In Vivo Diagnostic Substances 3 1.0 62.0
2836 Biological Products, (No Diagnostic Substances) 93 31.0 93.0
2870 Agricultural Chemicals 3 1.0 94.0
3826 Laboratory Analytical Instruments 3 1.0 95.0
3841 Surgical & Medical Instruments & Apparatus 2 0.7 95.7
3842 Orthopedic, Prosthetic & Surgical Appliances & Supplies 1 0.3 96.0
8071 Services-Medical Laboratories 11 3.7 99.7
8731 Services-Commercial Physical & Biological Research 1 0.3 100.0
Total 300 100.0
0%
50%
100%
150%
200%
250%
Mean Median
5-Year Employment Growth for Bio vs. Non-Bio EGCs
Bio-EGC Non-Bio EGC

48
Table 2. Therapeutic Target of 300 Bio-EGCs
Panel A. Therapeutic Target N Percent Cumulative
Oncology 79 26.3 26.3
Neurology 31 10.3 36.7
Infectious Disease 29 9.7 46.3
Other 29 9.7 56.0
Metabolic 26 8.7 64.7
Cardiovascular 18 6.0 70.7
Endocrine 16 5.3 76.0
Inflammation 16 5.3 81.3
Ophthalmology 16 5.3 86.7
Platform 15 5.0 91.7
Hematology 10 3.3 95.0
Psychiatry 6 2.0 97.0
Respiratory 5 1.7 98.7
Gastrointestinal 4 1.3 100.0 Panel B. Rare Disease N Percent Cumulative
Yes 55 18.3 18.3
No 244 81.3 99.7
N/A 1 0.3 100.0
Panel C. Stage N Percent Cumulative
Research (non-drug company) 5 1.7 1.7
Preclinical 31 10.3 12.0
Phase I 44 14.7 26.7
Phase II 117 39.0 65.7
Phase III 60 20.0 85.7
NDA/BLA filing 8 2.7 88.4
Market (drug company) 12 4.0 92.4
Market (non-drug company) 23 7.7 100.1
Panel D. Company Type N Percent Cumulative
Drug 271 90.3 90.3
Diagnostics 26 8.7 99.0
Industrial 3 1.0 100.0 Panel E. Category N Percent Cumulative
Emerging Therapeutics 248 82.7 82.7
Diagnostics / Tools 26 8.7 91.3
Spec Pharma 19 6.3 97.7
Biosimilars 3 1.0 98.7
Industrial Biotech 3 1.0 99.7
Drug Delivery 1 0.3 100.0

49
Table 3. Descriptive Statistics of 300 Bio-EGCs
Panel A. Capital Formation Mean Median Total
Amount sought ($ millions) 81.8 80 Amount raised ($ millions) 82.3 70 Total amount raised ($ millions) 24,694.87
Panel B. Exchange Listing at IPO N Percent
Nasdaq 283 94.3 NYSE 16 5.3 NYSE American 1 0.3
Panel C. Status as of December 15, 2018 N Percent Continued listing 254 84.7 Acquired or merged 37 12.3 Delisted or bankrupt 9 3.0
Panel D. Top 10 Headquarter States N Percent Cumulative
California 85 28.3 28.3
Massachusetts 71 23.7 52.0
Pennsylvania 15 5.0 57.0
New York 14 4.7 61.7
New Jersey 13 4.3 66.0
North Carolina 10 3.3 69.3
Texas 9 3.0 72.3
Maryland 7 2.3 74.7
Washington 7 2.3 77.0
Connecticut 5 1.7 78.7
Table 4. Sample of Bio-EGC and Non-Bio EGC Firm Years
Bio-EGCs Non-Bio EGCs Total EGCs
Firm year Firm years Percent Firm years Percent Firm years
2013 51 26.2 144 73.8 195
2014 125 30.3 288 69.7 413
2015 168 31.5 366 68.5 534
2016 183 30.9 410 69.1 593
2017 205 29.5 489 70.5 694
Total 732 30.1 1,697 69.9 2,429

50
Table 5. Financial Characteristics of Bio-EGCs and Non-Bio EGCs
Panel A. Tests of means Bio-EGC Non-Bio EGC Difference t-stat
Market capitalization ($ millions) 570.70 1099.07 –528.37*** –6.65
Total assets ($ millions) 163.31 1086.89 –923.58*** –11.05
Market-to-book 3.16 2.45 0.72*** 3.76
Total revenue ($ millions) 22.67 323.27 –300.60*** –14.19
Low revenue (% < $50 million) 88.80 27.70 61.10*** 33.51
Zero revenue (%) 35.93 8.54 27.38*** 17.58
Return on assets (%) –47.82 –10.05 –37.76*** –15.99
Free cash flow (%) –42.04 –9.13 –32.91*** –16.09
Leverage (%) 9.06 16.01 –6.95*** –7.36
Cash intensity (%) 80.48 29.84 50.64*** 42.64
Current asset intensity (%) 86.09 40.67 45.43*** 32.36
Asset liquidity (%) 68.43 21.74 46.69*** 24.92
R&D intensity (%) 35.64 8.35 27.29*** 24.29
CapEx intensity (%) 1.82 4.47 –2.65*** 8.62
Gross property ratio (%) 10.60 22.30 –11.70*** –9.25
Panel B. Test of medians Bio-EGC Non-Bio EGC Difference z-stat
Market capitalization ($ millions) 278.19 488.41 –210.22*** –7.97
Total assets ($ millions) 107.91 356.09 –248.17*** –20.12
Market-to-book 2.74 1.46 1.27*** 14.79
Total revenue ($ millions) 1.62 156.16 –154.54*** –26.96
Low revenue (% < $50 million) 100.00 0.00 100.00*** 27.71
Zero revenue (%) 0.00 0.00 0.00*** 16.56
Return on assets (%) –37.94 0.02 –37.96*** –27.62
Free cash flow (%) –33.13 –0.24 –32.89*** –25.70
Leverage (%) 0.00 2.88 –2.88*** –9.10
Cash intensity (%) 89.40 18.12 71.28*** 31.80
Current asset intensity (%) 94.49 34.89 59.60*** 28.53
Asset liquidity (%) 78.23 9.40 68.84*** 29.77
R&D intensity (%) 27.74 0.00 27.74*** 31.52
CapEx intensity (%) 0.66 1.57 –0.91*** 6.88
Gross property ratio (%) 4.27 8.79 –4.52*** –6.57
This table presents descriptive statistics that compare Bio-EGC and Non-Bio EGC firms. The sample comprises 241
Bio-EGCs and 605 Non-Bio EGCs with 2,429 firm years. Panel A presents tests of differences in mean values using
two-tailed t-tests. Panel B presents tests of differences in median values using two-tailed z-tests. ***, **, and * indicate
the differences are statistically different from zero at the 1%, 5%, and 10% significance level, respectively. All
variables are defined in the Appendix.

51
Table 6. Financial Characteristics of Bio-EGCs and Other Listed Issuers
Panel A. Mean Bio-EGC Non-Accelerated Accelerated Large Accelerated
Market cap ($ millions) 570.70 23.15*** 282.57*** 13,394.82***
Total assets ($ millions) 163.31 94.52*** 754.03*** 36,865.84***
Market-to-book 3.16 65.45 84.45 33.59
Total revenue ($ millions) 22.67 35.64** 324.36*** 9,083.57***
Low revenue (% < $50 million) 88.80 86.59* 32.46*** 2.12***
Zero revenue (%) 35.93 31.00*** 7.41*** 0.70***
Return on assets (%) –47.82 –535.67* –17.78** 7.94***
Free cash flow (%) –42.04 –190.09** –10.89*** 3.53***
Leverage (%) 9.06 80.58 17.80*** 24.48***
Cash intensity (%) 80.48 27.09*** 21.37*** 14.15***
Current asset intensity (%) 86.09 46.52*** 36.50*** 29.59***
Asset liquidity (%) 68.43 –1149.79* –3.77*** 12.93***
R&D intensity (%) 35.64 61.87 6.62*** 2.38***
CapEx intensity (%) 1.82 7.91 4.37*** 4.44***
Gross property ratio (%) 10.60 72.84*** 42.10*** 45.29***
Panel B. Median Bio-EGC Non-Accelerated Accelerated Large Accelerated
Market cap ($ millions) 278.19 16.92*** 233.22*** 3,311.61***
Total assets ($ millions) 107.91 16.31*** 339.15*** 4,125.40***
Market-to-book 2.74 0.99*** 0.97*** 1.24***
Total revenue ($ millions) 1.62 2.14** 106.07*** 1,890.65***
Low revenue (% < $50 million) 100.00 100.00* 0.00*** 0.00***
Zero revenue (%) 0.00 0.00*** 0.00*** 0.00***
Return on assets (%) –37.94 –15.27*** 1.89*** 6.29***
Free cash flow (%) –33.13 –11.76*** 0.66*** 4.09***
Leverage (%) 0.00 0.00 5.32*** 21.97***
Cash intensity (%) 89.40 13.00*** 9.77*** 7.61***
Current asset intensity (%) 94.49 44.19*** 31.76*** 26.12***
Asset liquidity (%) 78.23 0.72*** 10.23*** 6.41***
R&D intensity (%) 27.74 0.00*** 0.00*** 0.00***
CapEx intensity (%) 0.66 0.81 1.43*** 2.63***
Gross property ratio (%) 4.27 28.13*** 19.86*** 28.99***
This table presents descriptive statistics that compare Bio-EGC firms to the universe of firms in Compustat with non-
missing, non-zero assets and market capitalization. The sample comprises 732 firm years for 241 Bio-EGCs to a
sample of 13,256 firm years for non-accelerated filers, 10,213 firm years for accelerated filers, and 14,354 firm years
for large accelerated filers over 2013 to 2017. Non-accelerated filers are proxied using market capitalization less than
$75 million. Accelerated filers are proxied using market capitalization greater than or equal to $75 million and less
than $700 million. Large accelerated filers are proxied using market capitalization greater than or equal to $700
million. Panel A denotes tests of differences in mean values using two-tailed t-tests. Panel B denotes tests of
differences in median values using two-tailed z-tests. ***, **, and * indicate the differences are statistically different
from zero at the 1%, 5%, and 10% significance level, respectively. All variables are defined in the Appendix.

52
Table 7. Financial Restatements of Bio-EGCs and Non-Bio EGCs
(1) (2) (3) (4)
Bio-EGC –0.002 –0.004
(–0.15) (–0.30)
Cash intensity –0.039**
(–2.31)
Asset liquidity –0.015
(–1.18)
Ln(market capitalization) –0.007 –0.007 –0.007*
(–1.63) (–1.54) (–1.66)
Leverage 0.032 0.014 0.025
(1.05) (0.47) (0.82)
Market-to-book –0.001 –0.000 –0.001
(–1.26) (–0.84) (–1.10)
Return on assets –0.009 –0.018 –0.006
(–0.93) (–1.58) (–0.48)
Gross property ratio –0.007 –0.016 –0.009
(–0.36) (–0.83) (–0.49)
Audit fees 0.012* 0.013* 0.012*
(1.80) (1.93) (1.81)
Non-audit fees –0.002 –0.004
(–0.15) (–0.30)
Adjusted R2 0.000 0.023 0.025 0.024
Number of Firm Years 2,429 2,402 2,402 2,402 This table reports the estimates from OLS regressions of financial restatements. The dependent variable, financial
restatement, equals one if the fiscal year financial statements are reported as restated in the Audit Analytics database.
All regressions include year fixed effects. Standard errors are clustered at the firm level. ***, **, and * indicate
significance at the 1%, 5%, and 10% level, respectively. All variables are defined in the Appendix.
Table 8. Financial Restatement Firm Years by Filer Category
In Compustat In Compustat and Audit Analytics
Filer Category Total Total
Non-
Restatement Restatement
Restatement
(%)
Non-accelerated 13,256 7,130 6,561 569 7.98
Accelerated 10,213 7,978 7,240 738 9.25
Large accelerated 14,354 12,465 11,632 833 6.68
Total 37,283 27,573 25,433 2,140 7.76
This table is based on companies with coverage in Compustat and Audit Analytics for fiscal years 2013 to 2017. We
retain companies from Compustat if they have non-missing, non-zero information on market capitalization and total
assets. Bio-EGCs are not included in this table and have an unconditional average restatement of 6.20% of sample
firm years when data are available in both Compustat and Audit Analytics (43 restatement firm years, 651 non-
restatement firm years).

53
Table 9. Financial Restatements of Bio-EGCs and Other Listed Issuers
(1) (2) (3) (4) (5) (6) (7) (8)
Bio-EGC –0.017* –0.032*** –0.036*** –0.033*** –0.035*** –0.033*** –0.044*** –0.042**
(–1.79) (–3.22) (–2.95) (–2.96) (–2.97) (–2.76) (–2.96) (–2.48)
Ln(market capitalization) –0.002 –0.007*** –0.013** –0.007*** –0.007*** –0.007*** –0.011* –0.011*
(–1.26) (–3.18) (–2.20) (–3.21) (–3.11) (–2.88) (–1.80) (–1.76)
Leverage –0.000 –0.000 –0.001 –0.001 –0.001 –0.001 –0.002 –0.003
(–1.05) (–0.03) (–0.21) (–0.21) (–0.21) (–0.28) (–0.44) (–0.55)
Market-to-book –0.000** –0.000** –0.000** –0.000** –0.000** –0.000** –0.000*** –0.000**
(–2.30) (–2.35) (–2.35) (–2.36) (–2.37) (–2.27) (–2.73) (–2.51)
Return on assets –0.000 –0.001 –0.001 –0.001 –0.001 –0.001 –0.001 –0.001
(–0.18) (–0.94) (–0.81) (–0.95) (–0.93) (–0.86) (–0.69) (–0.74)
Gross property ratio –0.001** –0.013*** –0.016** –0.014*** –0.014*** –0.014*** –0.017** –0.008
(–2.12) (–2.91) (–2.46) (–3.15) (–3.12) (–3.10) (–2.55) (–0.91)
Audit fees –0.000 0.000 0.010*** 0.000 0.000 0.000 0.009** 0.009***
(–0.46) (0.91) (2.81) (0.78) (0.76) (0.52) (2.56) (2.58)
Non-audit fees –0.001*** –0.001*** –0.020 –0.001*** –0.001*** –0.001*** –0.017 –0.017
(–2.88) (–2.88) (–1.55) (–2.84) (–2.85) (–2.80) (–1.17) (–1.17)
Accelerated filer 0.015** 0.002 0.002 0.002 0.002
(2.48) (0.25) (0.29) (0.23) (0.25)
Non-accelerated filer –0.002
(–0.25)
Auditor attestation of ICFR –0.003 –0.001 –0.006 –0.007
(–0.46) (–0.16) (–0.70) (–0.73)
Non-effective manager ICFR 0.022** 0.019 0.019
(2.48) (1.62) (1.62)
Includes Non-Accelerated Filers Yes No No No No No No No
Includes Accelerated Filers Yes Yes Yes Yes Yes Yes Yes Yes
Includes Large Accelerated Filers Yes Yes No Yes Yes Yes No No
Requires Manager ICFR No No No Yes Yes Yes Yes Yes
Industry Fixed Effects No No No No No No No Yes
Adjusted R2 0.016 0.019 0.018 0.019 0.019 0.020 0.019 0.022
Number of Firm Years 28,267 21,012 8,377 19,913 19,913 19,913 7,800 7,800
This table reports the estimates from OLS regressions of financial restatements. Financial restatement equals one if the fiscal year financial statements are reported as restated
in the Audit Analytics database. All regressions include year fixed effects. Standard errors are clustered at the firm level. ***, **, and * indicate significance at the 1%, 5%, and
10% level, respectively. All variables are defined in the Appendix.

54
Table 10. Identification of Internal Controls Deficiencies
Panel A. Manager and Auditor Identification of Non–Effective ICFR
Manager
Auditor No Yes Total
No 16,687 0 16,687
Yes 2 1,031 1,033
Total 16,689 1,031 17,720
Panel B. Manager Identification of Non–Effective ICFR with No Auditor Attestation
Manager Frequency Percent
No 6,457 69.36
Yes 2,853 30.64
Total 9,310 100.00
Table 11. Non-Effective ICFRs of Bio-EGCs and Other Listed Issuers
(1) (2) (3) (4)
Bio–EGC –0.084*** –0.101*** –0.131*** –0.172***
(–7.22) (–5.67) (–5.91) (–6.64)
Auditor attestation of ICFR –0.102*** –0.115*** –0.111***
(–8.92) (–9.01) (–8.81)
Ln(market capitalization) –0.049*** –0.024*** –0.031*** –0.030***
(–15.17) (–10.73) (–4.44) (–4.40)
Leverage 0.000** 0.013 –0.001 –0.001
(2.33) (0.95) (–0.07) (–0.14)
Market-to-book 0.000 0.000 0.000 0.000
(1.51) (1.06) (1.28) (1.34)
Return on assets –0.000** –0.003 –0.005*** –0.005***
(–2.53) (–1.40) (–3.56) (–3.57)
Gross property ratio 0.001 –0.005 –0.011* –0.028***
(1.26) (–1.10) (–1.70) (–2.93)
Audit fees 0.007*** 0.004*** 0.050*** 0.046***
(7.96) (5.74) (8.35) (9.13)
Non-audit fees –0.003** –0.003*** –0.050*** –0.043**
(–2.11) (–2.69) (–2.88) (–2.54)
Accelerated filer –0.048*** –0.008
(–5.08) (–1.09)
Non-accelerated filer 0.033*
(1.94)
Includes Non-Accelerated Filers Yes No No No
Includes Accelerated Filers Yes Yes Yes Yes
Includes Large Accelerated Filers Yes Yes No No
Requires Manager ICFR No Yes Yes Yes
Industry Fixed Effects No No No Yes
Adjusted R2 0.146 0.049 0.058 0.074
Number of Firm Years 28,267 19,913 7,800 7,800
This table reports the estimates from OLS regressions of the effectiveness of internal control over financial reporting
(“ICFR”). The dependent variable, Non-effective ICFR, equals one if the manager or auditor reports that the ICFR is
not effective as reported in the Audit Analytics database. All regressions include year fixed effects. Standard errors
are clustered at the firm level. ***, **, and * indicate significance at the 1%, 5%, and 10% level, respectively. All
variables are defined in the Appendix.

55
Table 12. Survey Responses on the Impact of Section 404(b) Compliance
Panel A. Impact of Section 404(b) for biotech companies complying with 404(b)
“To the best of your knowledge, what impact has complying with Section 404(b) had on each of
the following?” (5-point scale: –2 = very negative impact; –1= somewhat negative impact; 0 = no
impact; +1 = somewhat positive impact; +2 = very positive impact) N Mean Positive
(%)
Negative
(%)
1. The quality of your company’s internal controls structure 14 1.57 92.9 (13/14) 0.0 (0/14)
2. The audit committee’s confidence in the company’s ICFR 14 1.21 85.7 (12/14) 0.0 (0/14)
3. The quality of your company’s financial reporting 14 0.93 78.6 (11/14) 0.0 (0/14)
4. The accuracy of your company’s financial statements 14 1.07 85.7 (12/14) 0.0 (0/14)
5. Your company’s ability to prevent and detect fraud 14 0.79 64.3 (9/14) 0.0 (0/14)
6. Your company’s ability to raise capital 13 0.54 46.2 (6/13) 0.0 (0/13)
7. Investor confidence in your company 14 0.71 64.3 (9/14) 0.0 (0/14)
8. Efficiency of your company’s operation 14 –0.21 28.6 (4/14) 50.0 (7/14)
9. Efficiency of your company’s financial reporting progress 14 0.07 42.9 (6/14) 42.9 (6/14)
10. Liquidity of your company’s common stock 13 0.08 7.1 (1/14) 0.0 (0/13)
11. Your company’s overall firm value 13 0.23 21.4 (3/14) 0.0 (0/13)
Panel B. Benefits of extending Section 404(b) relief for Bio–EGCs
“In consideration of the costs of 404(b) (either actual or estimated), how would an expanded
exemption from 404(b) impact your company in the following areas?” (5-point scale: –2 = very
negative impact; –1= somewhat negative impact; 0 = no impact; +1 = somewhat positive impact;
+2 = very positive impact) N Mean Positive
(%)
Negative
(%)
1. Annual investments in R&D 11 1.27 72.7 (8/11) 0.00 (0/11)
2. Hiring additional employees 11 0.73 54.5 (6/11) 18.2 (2/11)
3. Investor confidence or appetite in our company 11 0.09 18.2 (2/11) 9.09 (1/11)
4. Probability of success of (pre)–clinical trials 11 0.18 18.2 (2/11) 0.00 (0/11)
5. Investment in product safety 10 0.30 20.0 (2/10) 0.00 (0/10)
6. Ability to raise capital 11 0.36 27.3 (3/11) 0.00 (0/11)
Panel C. Estimated costs of Section 404(b) compliance
“Have you received an estimate for future Section 404(b) compliance?” Those Bio-EGCs
responding “Yes” were asked to provide the amount of the estimate.
N Mean Median Minimum Maximum
Standard
Deviation
Estimated annual cost ($) 7 412,143 400,000 125,000 1,000,000 301,439

56
Table 12 (continued)
Panel D. Reported costs of external consultants for Section 404(b) compliance
“Approximately how much money did your company spend on fees paid to outside vendors and/or
consultants specifically to help you comply with Section 404(b)?” We partition the responses into
former and current Bio-EGCs as of the survey date. All responders Responders with non-zero costs
Annual cost ($) N Mean Median N Mean Median
Former Bio-EGCs
Fiscal Year 2013 3 0 0 0 -- --
Fiscal Year 2014 4 75,875 87,500 3 101,167 100,000
Fiscal Year 2015 4 119,375 113,750 4 119,375 113,750
Fiscal Year 2016 4 184,250 193,500 4 184,250 193,500
Fiscal Year 2017 5 192,200 175,000 5 192,200 175,000
Current Bio-EGCs
Fiscal Year 2013 9 0 0 0 -- --
Fiscal Year 2014 8 5,298 0 1 42,381 42,381
Fiscal Year 2015 9 8,769 0 2 39,459 39,459
Fiscal Year 2016 10 19,218 0 4 48,045 41,091
Fiscal Year 2017 11 23,215 0 4 63,843 55,000
Panel E. Reported costs of internal labor for Section 404(b) compliance
“What was the approximate cost for the work done by your company’s internal staff on 404(b)
compliance?” We partition the responses into former and current Bio-EGCs as of the survey date. All responders Responders with non-zero costs
Annual cost ($) N Mean Median N Mean Median
Former Bio-EGCs
Fiscal Year 2013 3 16,667 0 1 50,000 50,000
Fiscal Year 2014 4 45,000 40,000 3 60,000 40,000
Fiscal Year 2015 4 91,250 57,500 3 121,667 70,000
Fiscal Year 2016 5 171,000 100,000 4 213,750 175,000
Fiscal Year 2017 5 163,000 200,000 4 203,750 225,000
Current Bio-EGCs
Fiscal Year 2013 9 0 0 0 -- --
Fiscal Year 2014 8 5,125 0 2 20,500 20,500
Fiscal Year 2015 9 5,889 0 3 17,667 16,000
Fiscal Year 2016 10 12,900 2,500 5 25,800 16,000
Fiscal Year 2017 10 26,300 5,000 5 52,600 33,000