Science of the Total Environment - ayhoekstra.nlayhoekstra.nl/pubs/Nouri-et-al-2019.pdf · the...
12
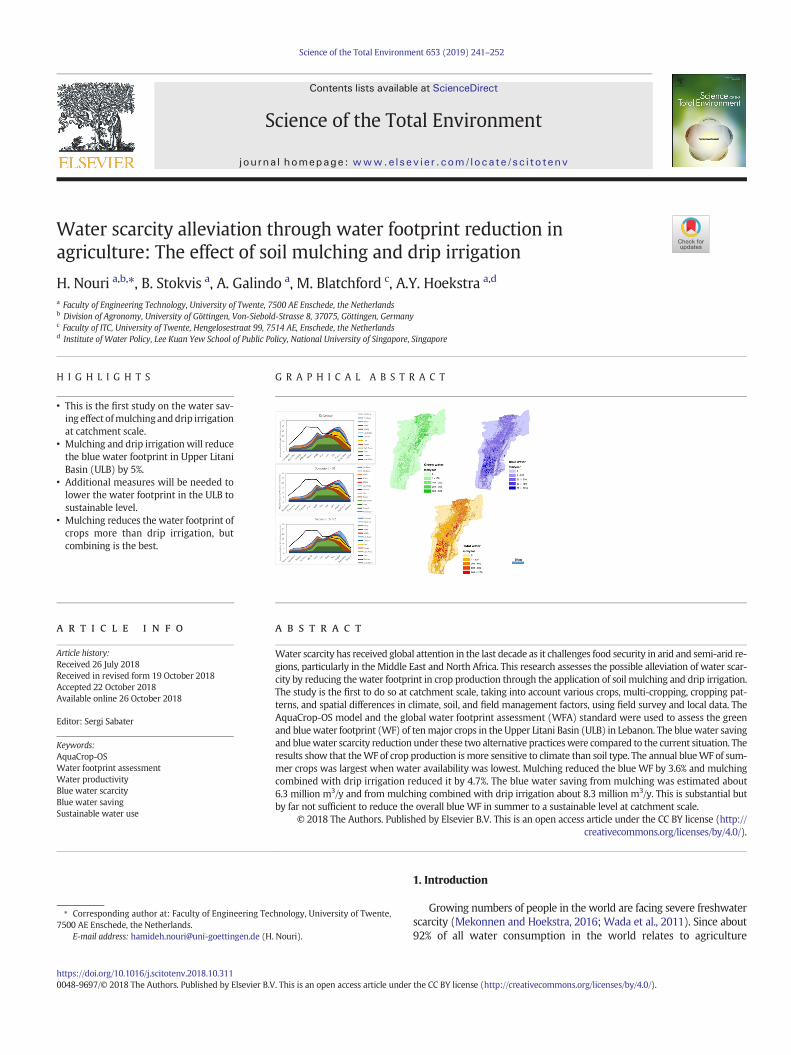
Water scarcity alleviation through water footprint reduction in agriculture: The effect of soil mulching and drip irrigation H. Nouri a,b, ⁎, B. Stokvis a , A. Galindo a , M. Blatchford c , A.Y. Hoekstra a,d a Faculty of Engineering Technology, University of Twente, 7500 AE Enschede, the Netherlands b Division of Agronomy, University of Göttingen, Von-Siebold-Strasse 8, 37075, Göttingen, Germany c Faculty of ITC, University of Twente, Hengelosestraat 99, 7514 AE, Enschede, the Netherlands d Institute of Water Policy, Lee Kuan Yew School of Public Policy, National University of Singapore, Singapore HIGHLIGHTS • This is the first study on the water sav- ing effect of mulching and drip irrigation at catchment scale. • Mulching and drip irrigation will reduce the blue water footprint in Upper Litani Basin (ULB) by 5%. • Additional measures will be needed to lower the water footprint in the ULB to sustainable level. • Mulching reduces the water footprint of crops more than drip irrigation, but combining is the best. GRAPHICAL ABSTRACT abstract article info Article history: Received 26 July 2018 Received in revised form 19 October 2018 Accepted 22 October 2018 Available online 26 October 2018 Editor: Sergi Sabater Water scarcity has received global attention in the last decade as it challenges food security in arid and semi-arid re- gions, particularly in the Middle East and North Africa. This research assesses the possible alleviation of water scar- city by reducing the water footprint in crop production through the application of soil mulching and drip irrigation. The study is the first to do so at catchment scale, taking into account various crops, multi-cropping, cropping pat- terns, and spatial differences in climate, soil, and field management factors, using field survey and local data. The AquaCrop-OS model and the global water footprint assessment (WFA) standard were used to assess the green and blue water footprint (WF) of ten major crops in the Upper Litani Basin (ULB) in Lebanon. The blue water saving and blue water scarcity reduction under these two alternative practices were compared to the current situation. The results show that the WF of crop production is more sensitive to climate than soil type. The annual blue WF of sum- mer crops was largest when water availability was lowest. Mulching reduced the blue WF by 3.6% and mulching combined with drip irrigation reduced it by 4.7%. The blue water saving from mulching was estimated about 6.3 million m 3 /y and from mulching combined with drip irrigation about 8.3 million m 3 /y. This is substantial but by far not sufficient to reduce the overall blue WF in summer to a sustainable level at catchment scale. © 2018 The Authors. Published by Elsevier B.V. This is an open access article under the CC BY license (http:// creativecommons.org/licenses/by/4.0/). Keywords: AquaCrop-OS Water footprint assessment Water productivity Blue water scarcity Blue water saving Sustainable water use 1. Introduction Growing numbers of people in the world are facing severe freshwater scarcity (Mekonnen and Hoekstra, 2016; Wada et al., 2011). Since about 92% of all water consumption in the world relates to agriculture Science of the Total Environment 653 (2019) 241–252 ⁎ Corresponding author at: Faculty of Engineering Technology, University of Twente, 7500 AE Enschede, the Netherlands. E-mail address: [email protected] (H. Nouri). https://doi.org/10.1016/j.scitotenv.2018.10.311 0048-9697/© 2018 The Authors. Published by Elsevier B.V. This is an open access article under the CC BY license (http://creativecommons.org/licenses/by/4.0/). Contents lists available at ScienceDirect Science of the Total Environment journal homepage: www.elsevier.com/locate/scitotenv
Transcript of Science of the Total Environment - ayhoekstra.nlayhoekstra.nl/pubs/Nouri-et-al-2019.pdf · the...
Science of the Total Environment 653 (2019) 241–252
Contents lists available at ScienceDirect
Science of the Total Environment
j ourna l homepage: www.e lsev ie r .com/ locate /sc i totenv
Water scarcity alleviation through water footprint reduction inagriculture: The effect of soil mulching and drip irrigation
H. Nouri a,b,⁎, B. Stokvis a, A. Galindo a, M. Blatchford c, A.Y. Hoekstra a,d
a Faculty of Engineering Technology, University of Twente, 7500 AE Enschede, the Netherlandsb Division of Agronomy, University of Göttingen, Von-Siebold-Strasse 8, 37075, Göttingen, Germanyc Faculty of ITC, University of Twente, Hengelosestraat 99, 7514 AE, Enschede, the Netherlandsd Institute of Water Policy, Lee Kuan Yew School of Public Policy, National University of Singapore, Singapore
H I G H L I G H T S G R A P H I C A L A B S T R A C T
• This is the first study on the water sav-ing effect ofmulching anddrip irrigationat catchment scale.
• Mulching and drip irrigation will reducethe blue water footprint in Upper LitaniBasin (ULB) by 5%.
• Additional measures will be needed tolower the water footprint in the ULB tosustainable level.
• Mulching reduces the water footprint ofcrops more than drip irrigation, butcombining is the best.
⁎ Corresponding author at: Faculty of Engineering Tec7500 AE Enschede, the Netherlands.
E-mail address: [email protected] (H
https://doi.org/10.1016/j.scitotenv.2018.10.3110048-9697/© 2018 The Authors. Published by Elsevier B.V
a b s t r a c t
a r t i c l e i n f oArticle history:Received 26 July 2018Received in revised form 19 October 2018Accepted 22 October 2018Available online 26 October 2018
Editor: Sergi Sabater
Water scarcity has received global attention in the last decade as it challenges food security in arid and semi-arid re-gions, particularly in the Middle East and North Africa. This research assesses the possible alleviation of water scar-city by reducing the water footprint in crop production through the application of soil mulching and drip irrigation.The study is the first to do so at catchment scale, taking into account various crops, multi-cropping, cropping pat-terns, and spatial differences in climate, soil, and field management factors, using field survey and local data. TheAquaCrop-OS model and the global water footprint assessment (WFA) standard were used to assess the greenand bluewater footprint (WF) of tenmajor crops in the Upper Litani Basin (ULB) in Lebanon. The bluewater savingand bluewater scarcity reduction under these two alternative practiceswere compared to the current situation. Theresults show that theWF of crop production is more sensitive to climate than soil type. The annual blueWF of sum-mer crops was largest when water availability was lowest. Mulching reduced the blue WF by 3.6% and mulchingcombined with drip irrigation reduced it by 4.7%. The blue water saving from mulching was estimated about6.3 million m3/y and from mulching combined with drip irrigation about 8.3 million m3/y. This is substantial butby far not sufficient to reduce the overall blue WF in summer to a sustainable level at catchment scale.
© 2018 The Authors. Published by Elsevier B.V. This is an open access article under the CC BY license (http://creativecommons.org/licenses/by/4.0/).
Keywords:AquaCrop-OSWater footprint assessmentWater productivityBlue water scarcityBlue water savingSustainable water use
hnology, University of Twente,
. Nouri).
. This is an open access article under
1. Introduction
Growing numbers of people in the world are facing severe freshwaterscarcity (Mekonnen and Hoekstra, 2016; Wada et al., 2011). Since about92% of all water consumption in the world relates to agriculture
the CC BY license (http://creativecommons.org/licenses/by/4.0/).
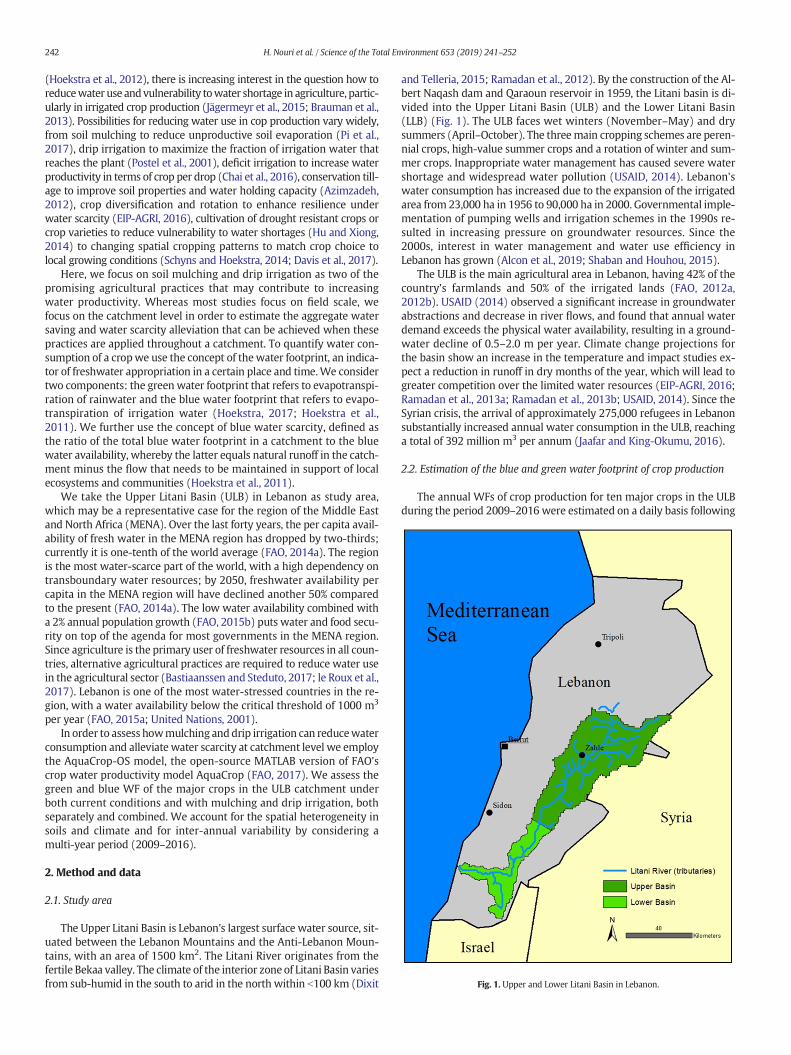
Fig. 1. Upper and Lower Litani Basin in Lebanon.
242 H. Nouri et al. / Science of the Total Environment 653 (2019) 241–252
(Hoekstra et al., 2012), there is increasing interest in the question how toreducewater use andvulnerability towater shortage in agriculture, partic-ularly in irrigated crop production (Jägermeyr et al., 2015; Brauman et al.,2013). Possibilities for reducing water use in cop production vary widely,from soil mulching to reduce unproductive soil evaporation (Pi et al.,2017), drip irrigation to maximize the fraction of irrigation water thatreaches the plant (Postel et al., 2001), deficit irrigation to increase waterproductivity in terms of crop per drop (Chai et al., 2016), conservation till-age to improve soil properties and water holding capacity (Azimzadeh,2012), crop diversification and rotation to enhance resilience underwater scarcity (EIP-AGRI, 2016), cultivation of drought resistant crops orcrop varieties to reduce vulnerability to water shortages (Hu and Xiong,2014) to changing spatial cropping patterns to match crop choice tolocal growing conditions (Schyns and Hoekstra, 2014; Davis et al., 2017).
Here, we focus on soil mulching and drip irrigation as two of thepromising agricultural practices that may contribute to increasingwater productivity. Whereas most studies focus on field scale, wefocus on the catchment level in order to estimate the aggregate watersaving and water scarcity alleviation that can be achieved when thesepractices are applied throughout a catchment. To quantify water con-sumption of a cropwe use the concept of thewater footprint, an indica-tor of freshwater appropriation in a certain place and time.We considertwo components: the green water footprint that refers to evapotranspi-ration of rainwater and the blue water footprint that refers to evapo-transpiration of irrigation water (Hoekstra, 2017; Hoekstra et al.,2011). We further use the concept of blue water scarcity, defined asthe ratio of the total blue water footprint in a catchment to the bluewater availability, whereby the latter equals natural runoff in the catch-ment minus the flow that needs to be maintained in support of localecosystems and communities (Hoekstra et al., 2011).
We take the Upper Litani Basin (ULB) in Lebanon as study area,which may be a representative case for the region of the Middle Eastand North Africa (MENA). Over the last forty years, the per capita avail-ability of fresh water in the MENA region has dropped by two-thirds;currently it is one-tenth of the world average (FAO, 2014a). The regionis the most water-scarce part of the world, with a high dependency ontransboundary water resources; by 2050, freshwater availability percapita in the MENA region will have declined another 50% comparedto the present (FAO, 2014a). The low water availability combined witha 2% annual population growth (FAO, 2015b) puts water and food secu-rity on top of the agenda for most governments in the MENA region.Since agriculture is the primary user of freshwater resources in all coun-tries, alternative agricultural practices are required to reduce water usein the agricultural sector (Bastiaanssen and Steduto, 2017; le Roux et al.,2017). Lebanon is one of the most water-stressed countries in the re-gion, with a water availability below the critical threshold of 1000 m3
per year (FAO, 2015a; United Nations, 2001).In order to assess howmulching anddrip irrigation can reducewater
consumption and alleviate water scarcity at catchment level we employthe AquaCrop-OS model, the open-source MATLAB version of FAO'scrop water productivity model AquaCrop (FAO, 2017). We assess thegreen and blue WF of the major crops in the ULB catchment underboth current conditions and with mulching and drip irrigation, bothseparately and combined. We account for the spatial heterogeneity insoils and climate and for inter-annual variability by considering amulti-year period (2009–2016).
2. Method and data
2.1. Study area
The Upper Litani Basin is Lebanon's largest surface water source, sit-uated between the Lebanon Mountains and the Anti-Lebanon Moun-tains, with an area of 1500 km2. The Litani River originates from thefertile Bekaa valley. The climate of the interior zone of Litani Basin variesfrom sub-humid in the south to arid in the north within b100 km (Dixit
and Telleria, 2015; Ramadan et al., 2012). By the construction of the Al-bert Naqash dam and Qaraoun reservoir in 1959, the Litani basin is di-vided into the Upper Litani Basin (ULB) and the Lower Litani Basin(LLB) (Fig. 1). The ULB faces wet winters (November–May) and drysummers (April–October). The threemain cropping schemes are peren-nial crops, high-value summer crops and a rotation of winter and sum-mer crops. Inappropriate water management has caused severe watershortage and widespread water pollution (USAID, 2014). Lebanon'swater consumption has increased due to the expansion of the irrigatedarea from 23,000 ha in 1956 to 90,000 ha in 2000. Governmental imple-mentation of pumping wells and irrigation schemes in the 1990s re-sulted in increasing pressure on groundwater resources. Since the2000s, interest in water management and water use efficiency inLebanon has grown (Alcon et al., 2019; Shaban and Houhou, 2015).
The ULB is the main agricultural area in Lebanon, having 42% of thecountry's farmlands and 50% of the irrigated lands (FAO, 2012a,2012b). USAID (2014) observed a significant increase in groundwaterabstractions and decrease in river flows, and found that annual waterdemand exceeds the physical water availability, resulting in a ground-water decline of 0.5–2.0 m per year. Climate change projections forthe basin show an increase in the temperature and impact studies ex-pect a reduction in runoff in dry months of the year, which will lead togreater competition over the limited water resources (EIP-AGRI, 2016;Ramadan et al., 2013a; Ramadan et al., 2013b; USAID, 2014). Since theSyrian crisis, the arrival of approximately 275,000 refugees in Lebanonsubstantially increased annual water consumption in the ULB, reachinga total of 392 million m3 per annum (Jaafar and King-Okumu, 2016).
2.2. Estimation of the blue and green water footprint of crop production
The annual WFs of crop production for ten major crops in the ULBduring the period 2009–2016 were estimated on a daily basis following
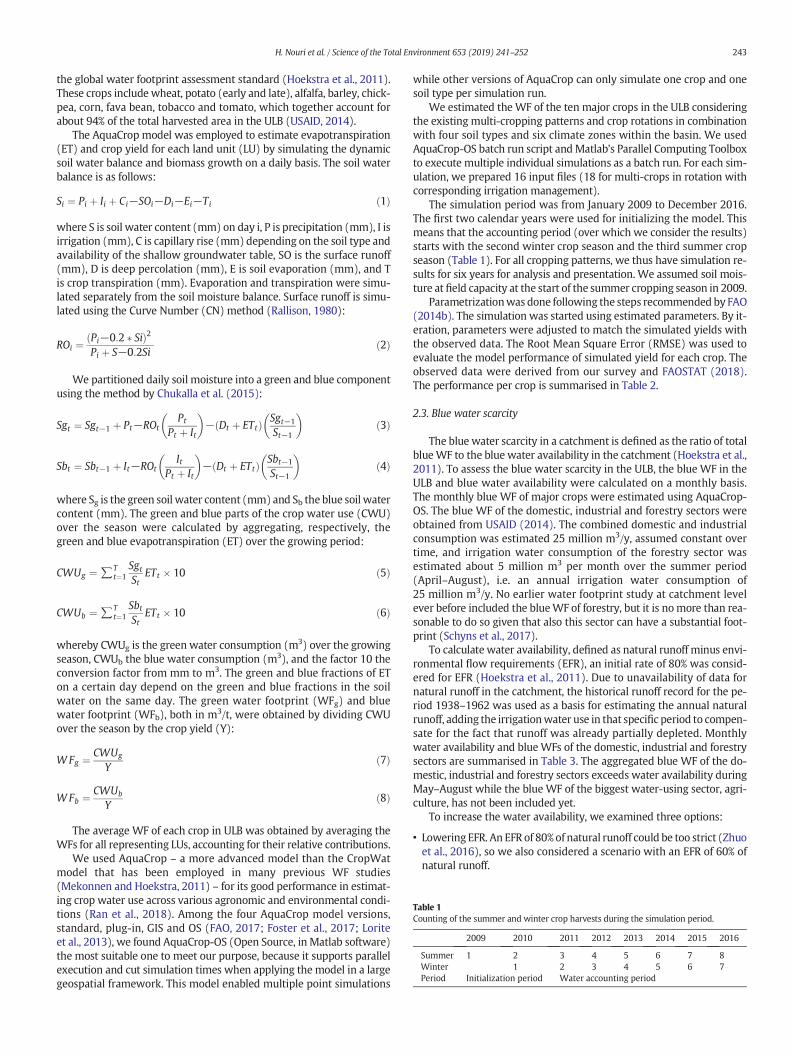
Table 1Counting of the summer and winter crop harvests during the simulation period.
2009 2010 2011 2012 2013 2014 2015 2016
Summer 1 2 3 4 5 6 7 8Winter 1 2 3 4 5 6 7Period Initialization period Water accounting period
243H. Nouri et al. / Science of the Total Environment 653 (2019) 241–252
the global water footprint assessment standard (Hoekstra et al., 2011).These crops include wheat, potato (early and late), alfalfa, barley, chick-pea, corn, fava bean, tobacco and tomato, which together account forabout 94% of the total harvested area in the ULB (USAID, 2014).
The AquaCrop model was employed to estimate evapotranspiration(ET) and crop yield for each land unit (LU) by simulating the dynamicsoil water balance and biomass growth on a daily basis. The soil waterbalance is as follows:
Si ¼ Pi þ Ii þ Ci−SOi−Di−Ei−Ti ð1Þ
where S is soil water content (mm) on day i, P is precipitation (mm), I isirrigation (mm), C is capillary rise (mm) depending on the soil type andavailability of the shallow groundwater table, SO is the surface runoff(mm), D is deep percolation (mm), E is soil evaporation (mm), and Tis crop transpiration (mm). Evaporation and transpiration were simu-lated separately from the soil moisture balance. Surface runoff is simu-lated using the Curve Number (CN) method (Rallison, 1980):
ROi ¼Pi−0:2 � Sið Þ2Pi þ S−0:2Si
ð2Þ
We partitioned daily soil moisture into a green and blue componentusing the method by Chukalla et al. (2015):
Sgt ¼ Sgt−1 þ Pt−ROtPt
Pt þ It
� �− Dt þ ETtð Þ Sgt−1
St−1
� �ð3Þ
Sbt ¼ Sbt−1 þ It−ROtIt
Pt þ It
� �− Dt þ ETtð Þ Sbt−1
St−1
� �ð4Þ
where Sg is the green soil water content (mm) and Sb the blue soil watercontent (mm). The green and blue parts of the crop water use (CWU)over the season were calculated by aggregating, respectively, thegreen and blue evapotranspiration (ET) over the growing period:
CWUg ¼ ∑Tt¼1
SgtSt
ETt � 10 ð5Þ
CWUb ¼ ∑Tt¼1
SbtSt
ETt � 10 ð6Þ
whereby CWUg is the green water consumption (m3) over the growingseason, CWUb the blue water consumption (m3), and the factor 10 theconversion factor from mm to m3. The green and blue fractions of ETon a certain day depend on the green and blue fractions in the soilwater on the same day. The green water footprint (WFg) and bluewater footprint (WFb), both in m3/t, were obtained by dividing CWUover the season by the crop yield (Y):
WFg ¼ CWUg
Yð7Þ
WFb ¼ CWUb
Yð8Þ
The average WF of each crop in ULB was obtained by averaging theWFs for all representing LUs, accounting for their relative contributions.
We used AquaCrop – a more advanced model than the CropWatmodel that has been employed in many previous WF studies(Mekonnen and Hoekstra, 2011) – for its good performance in estimat-ing crop water use across various agronomic and environmental condi-tions (Ran et al., 2018). Among the four AquaCrop model versions,standard, plug-in, GIS and OS (FAO, 2017; Foster et al., 2017; Loriteet al., 2013), we found AquaCrop-OS (Open Source, in Matlab software)the most suitable one to meet our purpose, because it supports parallelexecution and cut simulation times when applying the model in a largegeospatial framework. This model enabled multiple point simulations
while other versions of AquaCrop can only simulate one crop and onesoil type per simulation run.
We estimated the WF of the ten major crops in the ULB consideringthe existing multi-cropping patterns and crop rotations in combinationwith four soil types and six climate zones within the basin. We usedAquaCrop-OS batch run script andMatlab's Parallel Computing Toolboxto execute multiple individual simulations as a batch run. For each sim-ulation, we prepared 16 input files (18 for multi-crops in rotation withcorresponding irrigation management).
The simulation period was from January 2009 to December 2016.The first two calendar years were used for initializing the model. Thismeans that the accounting period (over which we consider the results)starts with the second winter crop season and the third summer cropseason (Table 1). For all cropping patterns, we thus have simulation re-sults for six years for analysis and presentation. We assumed soil mois-ture at field capacity at the start of the summer cropping season in 2009.
Parametrizationwas done following the steps recommended by FAO(2014b). The simulation was started using estimated parameters. By it-eration, parameters were adjusted to match the simulated yields withthe observed data. The Root Mean Square Error (RMSE) was used toevaluate the model performance of simulated yield for each crop. Theobserved data were derived from our survey and FAOSTAT (2018).The performance per crop is summarised in Table 2.
2.3. Blue water scarcity
The blue water scarcity in a catchment is defined as the ratio of totalblueWF to the blue water availability in the catchment (Hoekstra et al.,2011). To assess the blue water scarcity in the ULB, the blue WF in theULB and blue water availability were calculated on a monthly basis.The monthly blue WF of major crops were estimated using AquaCrop-OS. The blue WF of the domestic, industrial and forestry sectors wereobtained from USAID (2014). The combined domestic and industrialconsumption was estimated 25 million m3/y, assumed constant overtime, and irrigation water consumption of the forestry sector wasestimated about 5 million m3 per month over the summer period(April–August), i.e. an annual irrigation water consumption of25 million m3/y. No earlier water footprint study at catchment levelever before included the blueWF of forestry, but it is nomore than rea-sonable to do so given that also this sector can have a substantial foot-print (Schyns et al., 2017).
To calculate water availability, defined as natural runoff minus envi-ronmental flow requirements (EFR), an initial rate of 80% was consid-ered for EFR (Hoekstra et al., 2011). Due to unavailability of data fornatural runoff in the catchment, the historical runoff record for the pe-riod 1938–1962 was used as a basis for estimating the annual naturalrunoff, adding the irrigationwater use in that specific period to compen-sate for the fact that runoff was already partially depleted. Monthlywater availability and blueWFs of the domestic, industrial and forestrysectors are summarised in Table 3. The aggregated blue WF of the do-mestic, industrial and forestry sectors exceeds water availability duringMay–August while the blue WF of the biggest water-using sector, agri-culture, has not been included yet.
To increase the water availability, we examined three options:
• Lowering EFR. An EFR of 80%of natural runoff could be too strict (Zhuoet al., 2016), so we also considered a scenario with an EFR of 60% ofnatural runoff.
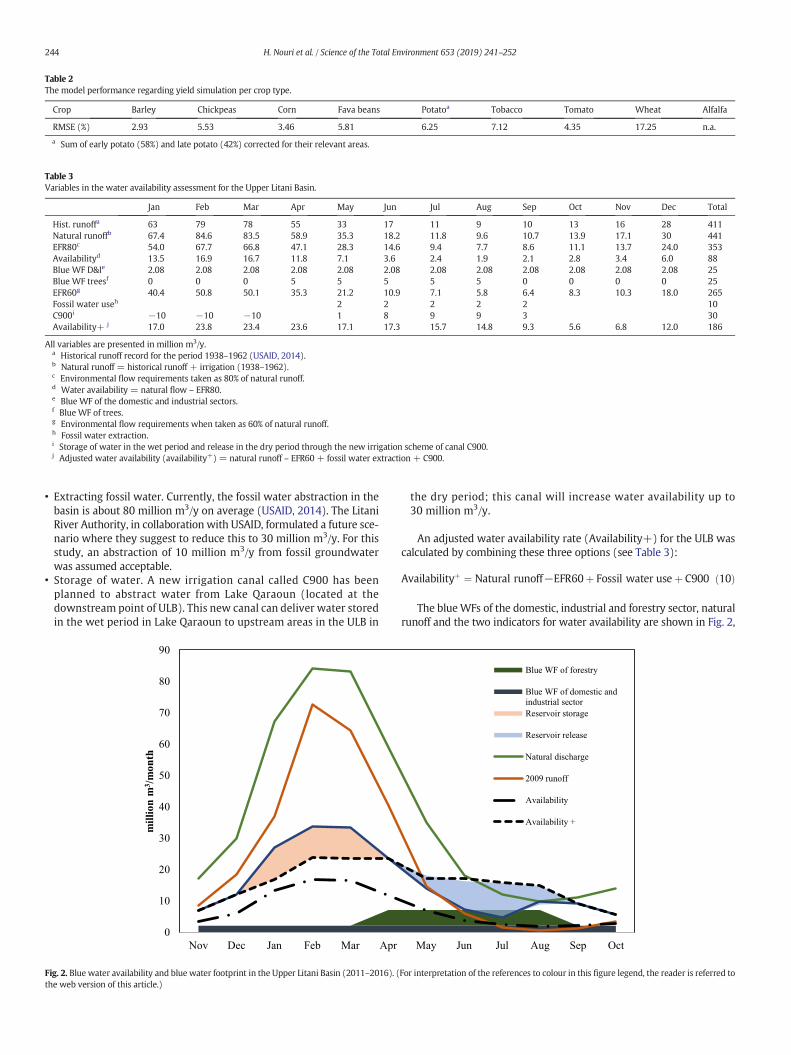
Table 2The model performance regarding yield simulation per crop type.
Crop Barley Chickpeas Corn Fava beans Potatoa Tobacco Tomato Wheat Alfalfa
RMSE (%) 2.93 5.53 3.46 5.81 6.25 7.12 4.35 17.25 n.a.
a Sum of early potato (58%) and late potato (42%) corrected for their relevant areas.
Table 3Variables in the water availability assessment for the Upper Litani Basin.
Jan Feb Mar Apr May Jun Jul Aug Sep Oct Nov Dec Total
Hist. runoffa 63 79 78 55 33 17 11 9 10 13 16 28 411Natural runoffb 67.4 84.6 83.5 58.9 35.3 18.2 11.8 9.6 10.7 13.9 17.1 30 441EFR80c 54.0 67.7 66.8 47.1 28.3 14.6 9.4 7.7 8.6 11.1 13.7 24.0 353Availabilityd 13.5 16.9 16.7 11.8 7.1 3.6 2.4 1.9 2.1 2.8 3.4 6.0 88Blue WF D&Ie 2.08 2.08 2.08 2.08 2.08 2.08 2.08 2.08 2.08 2.08 2.08 2.08 25Blue WF treesf 0 0 0 5 5 5 5 5 0 0 0 0 25EFR60g 40.4 50.8 50.1 35.3 21.2 10.9 7.1 5.8 6.4 8.3 10.3 18.0 265Fossil water useh 2 2 2 2 2 10C900i −10 −10 −10 1 8 9 9 3 30Availability+ j 17.0 23.8 23.4 23.6 17.1 17.3 15.7 14.8 9.3 5.6 6.8 12.0 186
All variables are presented in million m3/y.a Historical runoff record for the period 1938–1962 (USAID, 2014).b Natural runoff = historical runoff + irrigation (1938–1962).c Environmental flow requirements taken as 80% of natural runoff.d Water availability = natural flow – EFR80.e Blue WF of the domestic and industrial sectors.f Blue WF of trees.g Environmental flow requirements when taken as 60% of natural runoff.h Fossil water extraction.i Storage of water in the wet period and release in the dry period through the new irrigation scheme of canal C900.j Adjusted water availability (availability+) = natural runoff – EFR60 + fossil water extraction + C900.
244 H. Nouri et al. / Science of the Total Environment 653 (2019) 241–252
• Extracting fossil water. Currently, the fossil water abstraction in thebasin is about 80 million m3/y on average (USAID, 2014). The LitaniRiver Authority, in collaboration with USAID, formulated a future sce-nario where they suggest to reduce this to 30 million m3/y. For thisstudy, an abstraction of 10 million m3/y from fossil groundwaterwas assumed acceptable.
• Storage of water. A new irrigation canal called C900 has beenplanned to abstract water from Lake Qaraoun (located at thedownstream point of ULB). This new canal can deliver water storedin the wet period in Lake Qaraoun to upstream areas in the ULB in
Fig. 2. Blue water availability and blue water footprint in the Upper Litani Basin (2011–2016). (the web version of this article.)
the dry period; this canal will increase water availability up to30 million m3/y.
An adjusted water availability rate (Availability+) for the ULB wascalculated by combining these three options (see Table 3):
Availabilityþ ¼ Natural runoff−EFR60þ Fossil water useþ C900 ð10Þ
The blueWFs of the domestic, industrial and forestry sector, naturalrunoff and the two indicators for water availability are shown in Fig. 2,
For interpretation of the references to colour in this figure legend, the reader is referred to

Fig.
3.Clim
atezo
nes(a),soiltype
s(b),an
dland
useinclud
ingtenmajor
crop
s(c)in
theUpp
erLitani
Basin.
245H. Nouri et al. / Science of the Total Environment 653 (2019) 241–252
246 H. Nouri et al. / Science of the Total Environment 653 (2019) 241–252
which also shows the actual runoff measured in 2009. Annual naturaland actual runoff were used to estimate the abstraction from fossilgroundwater. Current runoff is around 300 million m3 (USAID, 2014),while natural runoff was estimated to be around 440 million m3 (seeTable 3). The part of the blue WF that was higher than this differencemust have been extracted from fossil groundwater reserves. The annualfossil groundwater extraction is calculated as the blueWFminus the dif-ference between the natural and current runoff (assuming that the dif-ference between natural and current runoff refers to the waterconsumption from renewable water resources).
Following (Hoekstra et al., 2012), monthly rates of water scarcitywere categorized into four levels ofwater scarcity: low (b1.0),moderate(1.0–1.5), significant (1.5–2.0) and severe (N2.0).
2.4. Alternative agricultural practices
We developed two alternative management scenarios compared tocurrent field and irrigationmanagement practices in the ULB. To reducesoil evaporation and soil compaction, controlweeds and their transpira-tion, and nutrient management, the first scenario differs from the refer-ence scenario by applying mulching for all crops. The second scenarioalso appliesmulching for all crops and, in addition, replaces available ir-rigation by drip irrigation for summer crops.
2.5. Data
To account for different combinations of crop, soil and climate inwateruse calculations, we divided the study area into different land units (LUs).Each LU represents a homogeneous area with one specific crop in a spe-cific soil type under particular climate conditions. With ten crop types,four soil types and six climate zones in theULB, a total of 225 LUswere de-fined. Datawere gathered from local government offices and available lit-erature. Also, we collected some data through our field survey that tookplace in the Litani River Basin in Bekaa Valley from 31 June to 19 July2017. The surveys provided geo-referenced technical information ofcrop, soil, water sources (quantity and quality), irrigation, fertilisation,groundwater and yield; these data were partly used in the simulationprocess and partly in the validation process. The two most cultivatedcrops, potato and wheat, were selected to be surveyed in more detail.
Table 4Overview of cropping practices in different land-use types in the Upper Li
Land-
use type
Area
(ha)
Nov Dec Jan Feb Mar
1 700 Fallow
2 4300 Fallow
3 4400 Fallow Early-Potat
4 5500 Wheat
5 500 Fava beans
6 2300 Wheat
7 3200 Barley
8 2800 Chickpeas
9 700 Fava beans
10 800 Fava beans
11 6500 Fallow
Geo-referenced crop-soil-water information was collected at 50 farmsinterviewing 25 potato producers and 25 wheat producers.
Climate data for the period 2009–2016 were derived from sixweather stations within the ULB provided by the Lebanese AgriculturalResearch Institute (LARI). After cleaning the data and using ThiessenPolygons, the ULB was divided into six climate zones; the largest dis-tance from a station was about 25 km. Fig. 3a displays six climatezones in the ULB.
Soil data were obtained from the ISRIC database with soil data at aresolution of 250 × 250m2 (Hengl et al., 2017). The TAXOUSDA classifi-cation system was used to derive different soil types in the ULB. Fig. 3brepresents the spatial distribution of four main soil types of Orthents,Xeralfs, Xerepts and Xerolls in the ULB.
We used the 5 × 5 m2 spatial resolution land-use maps by USAID(2014) for three growing seasons as basemaps to plot the spatial distri-bution of different land uses in the ULB (Fig. 3c). The land uses distin-guished include major crops, bare lands, urban, water bodies,woodlands and fallow lands. A crop calendar was established based onthese maps in combination with field surveys (Table 4).
Some LUs have single cropping; others have multi-cropping (a sum-mer/winter rotationof twodifferent crops). Since the annual crop calendarsubstantially influences the soil water balance, the different combinationsand order of crops and fallow period were simulated separately.
Our field survey and available literature on farming practices in theULB were employed for management data. All farmers in the surveysgrowing potato and wheat used sprinkler irrigation. On average, the ir-rigation depth of 75mmwas recorded forwheat, and 63mm for potato.The irrigation depths, irrigation efficiency and surfacewetted per irriga-tion technique for the remaining crops were derived from Raes et al.(2017). The interval between irrigation events was documented60 days for wheat (in the form of supplementary irrigation) and sevendays for potato (full irrigation). These intervals were used for all winterand summer crops respectively.
The wet period in the ULB is from November to April and the dryperiod from May to October. The planting dates for the winter crops(barley, chickpeas, fava beans, and wheat) and early potato weregenerated from rainfall events. As planting criterion, we applied asuccessive period of 4 days with at least 10 mm of rainfall. Thesummer crops were planted on fixed dates since they were highlydependent on irrigation schedules.
tani Basin.
Apr May Jun Jul Aug Sep Oct
Corn Fallow
Tomato Fallow
o Fallow
Fallow
Fallow
Corn Fallow
Late Potato
Tobacco Fallow
Alfalfa Fallow
Fallow Corn Fallow
247H. Nouri et al. / Science of the Total Environment 653 (2019) 241–252
3. Results
3.1. WF of crops in the ULB basin
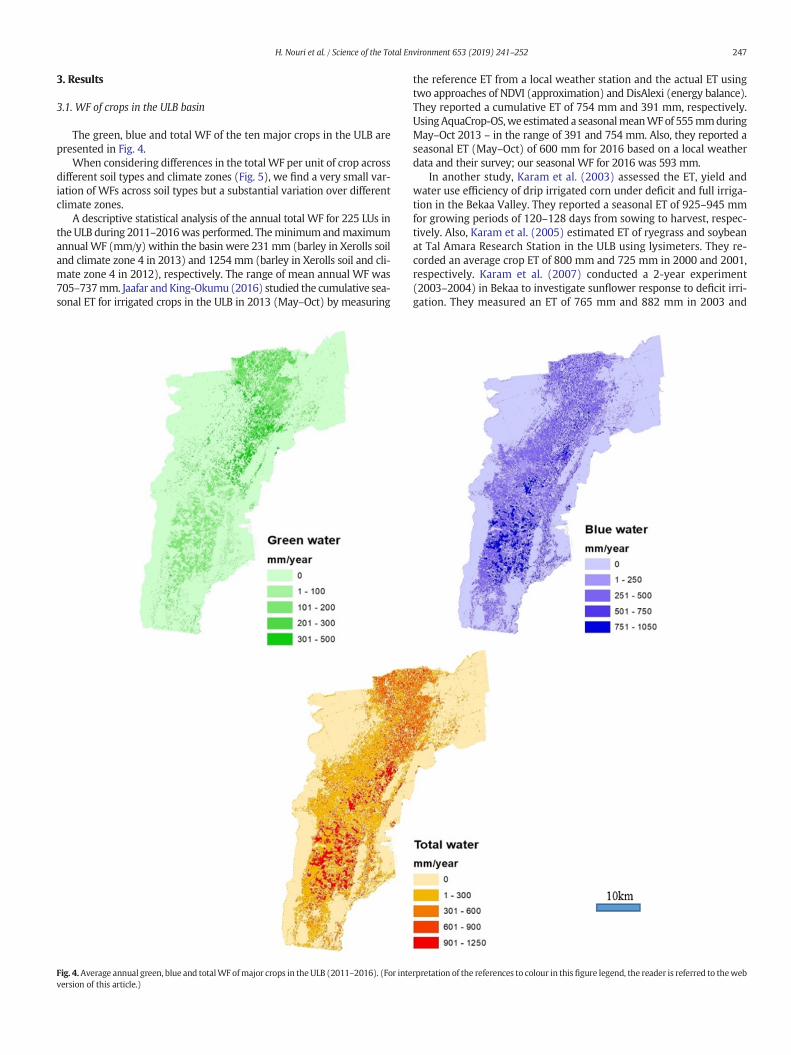
The green, blue and total WF of the ten major crops in the ULB arepresented in Fig. 4.
When considering differences in the total WF per unit of crop acrossdifferent soil types and climate zones (Fig. 5), we find a very small var-iation of WFs across soil types but a substantial variation over differentclimate zones.
A descriptive statistical analysis of the annual total WF for 225 LUs inthe ULB during 2011–2016was performed. Theminimumandmaximumannual WF (mm/y) within the basin were 231 mm (barley in Xerolls soiland climate zone 4 in 2013) and 1254 mm (barley in Xerolls soil and cli-mate zone 4 in 2012), respectively. The range of mean annual WF was705–737mm. Jaafar andKing-Okumu (2016) studied the cumulative sea-sonal ET for irrigated crops in the ULB in 2013 (May–Oct) by measuring
Fig. 4.Average annual green, blue and totalWF ofmajor crops in theULB (2011–2016). (For inteversion of this article.)
the reference ET from a local weather station and the actual ET usingtwo approaches of NDVI (approximation) and DisAlexi (energy balance).They reported a cumulative ET of 754 mm and 391 mm, respectively.UsingAquaCrop-OS,we estimated a seasonalmeanWFof 555mmduringMay–Oct 2013 – in the range of 391 and 754 mm. Also, they reported aseasonal ET (May–Oct) of 600 mm for 2016 based on a local weatherdata and their survey; our seasonal WF for 2016 was 593 mm.
In another study, Karam et al. (2003) assessed the ET, yield andwater use efficiency of drip irrigated corn under deficit and full irriga-tion in the Bekaa Valley. They reported a seasonal ET of 925–945 mmfor growing periods of 120–128 days from sowing to harvest, respec-tively. Also, Karam et al. (2005) estimated ET of ryegrass and soybeanat Tal Amara Research Station in the ULB using lysimeters. They re-corded an average crop ET of 800 mm and 725 mm in 2000 and 2001,respectively. Karam et al. (2007) conducted a 2-year experiment(2003–2004) in Bekaa to investigate sunflower response to deficit irri-gation. They measured an ET of 765 mm and 882 mm in 2003 and
rpretation of the references to colour in this figure legend, the reader is referred to theweb
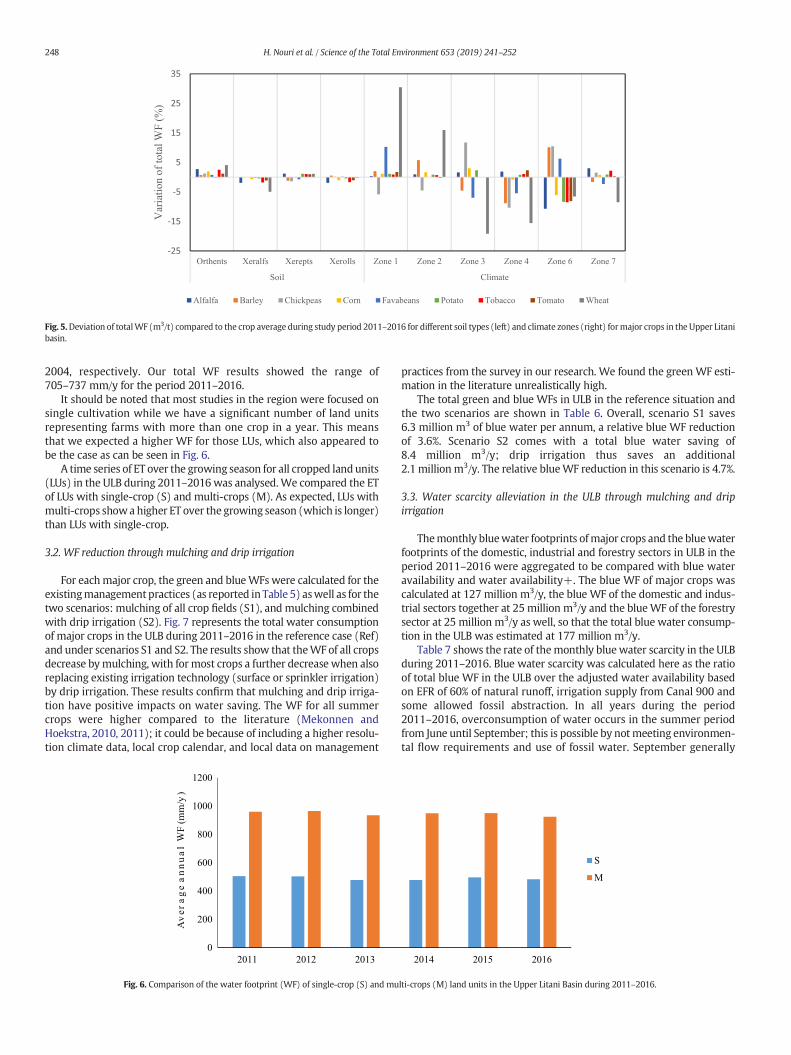
Fig. 5.Deviation of totalWF (m3/t) compared to the crop average during study period 2011–2016 for different soil types (left) and climate zones (right) formajor crops in the Upper Litanibasin.
248 H. Nouri et al. / Science of the Total Environment 653 (2019) 241–252
2004, respectively. Our total WF results showed the range of705–737 mm/y for the period 2011–2016.
It should be noted that most studies in the region were focused onsingle cultivation while we have a significant number of land unitsrepresenting farms with more than one crop in a year. This meansthat we expected a higher WF for those LUs, which also appeared tobe the case as can be seen in Fig. 6.
A time series of ET over the growing season for all cropped land units(LUs) in the ULB during 2011–2016 was analysed.We compared the ETof LUs with single-crop (S) and multi-crops (M). As expected, LUs withmulti-crops showa higher ET over the growing season (which is longer)than LUs with single-crop.
3.2. WF reduction through mulching and drip irrigation
For eachmajor crop, the green and blueWFswere calculated for theexistingmanagement practices (as reported in Table 5) aswell as for thetwo scenarios: mulching of all crop fields (S1), and mulching combinedwith drip irrigation (S2). Fig. 7 represents the total water consumptionof major crops in the ULB during 2011–2016 in the reference case (Ref)and under scenarios S1 and S2. The results show that theWF of all cropsdecrease bymulching, with for most crops a further decrease when alsoreplacing existing irrigation technology (surface or sprinkler irrigation)by drip irrigation. These results confirm that mulching and drip irriga-tion have positive impacts on water saving. The WF for all summercrops were higher compared to the literature (Mekonnen andHoekstra, 2010, 2011); it could be because of including a higher resolu-tion climate data, local crop calendar, and local data on management
Fig. 6. Comparison of the water footprint (WF) of single-crop (S) and mu
practices from the survey in our research. We found the green WF esti-mation in the literature unrealistically high.
The total green and blue WFs in ULB in the reference situation andthe two scenarios are shown in Table 6. Overall, scenario S1 saves6.3 million m3 of blue water per annum, a relative blue WF reductionof 3.6%. Scenario S2 comes with a total blue water saving of8.4 million m3/y; drip irrigation thus saves an additional2.1 million m3/y. The relative blueWF reduction in this scenario is 4.7%.
3.3. Water scarcity alleviation in the ULB through mulching and dripirrigation
Themonthly bluewater footprints ofmajor crops and the bluewaterfootprints of the domestic, industrial and forestry sectors in ULB in theperiod 2011–2016 were aggregated to be compared with blue wateravailability and water availability+. The blue WF of major crops wascalculated at 127 million m3/y, the blue WF of the domestic and indus-trial sectors together at 25 million m3/y and the blueWF of the forestrysector at 25 million m3/y as well, so that the total blue water consump-tion in the ULB was estimated at 177 million m3/y.
Table 7 shows the rate of themonthly bluewater scarcity in the ULBduring 2011–2016. Blue water scarcity was calculated here as the ratioof total blue WF in the ULB over the adjusted water availability basedon EFR of 60% of natural runoff, irrigation supply from Canal 900 andsome allowed fossil abstraction. In all years during the period2011–2016, overconsumption of water occurs in the summer periodfrom June until September; this is possible by notmeeting environmen-tal flow requirements and use of fossil water. September generally
lti-crops (M) land units in the Upper Litani Basin during 2011–2016.
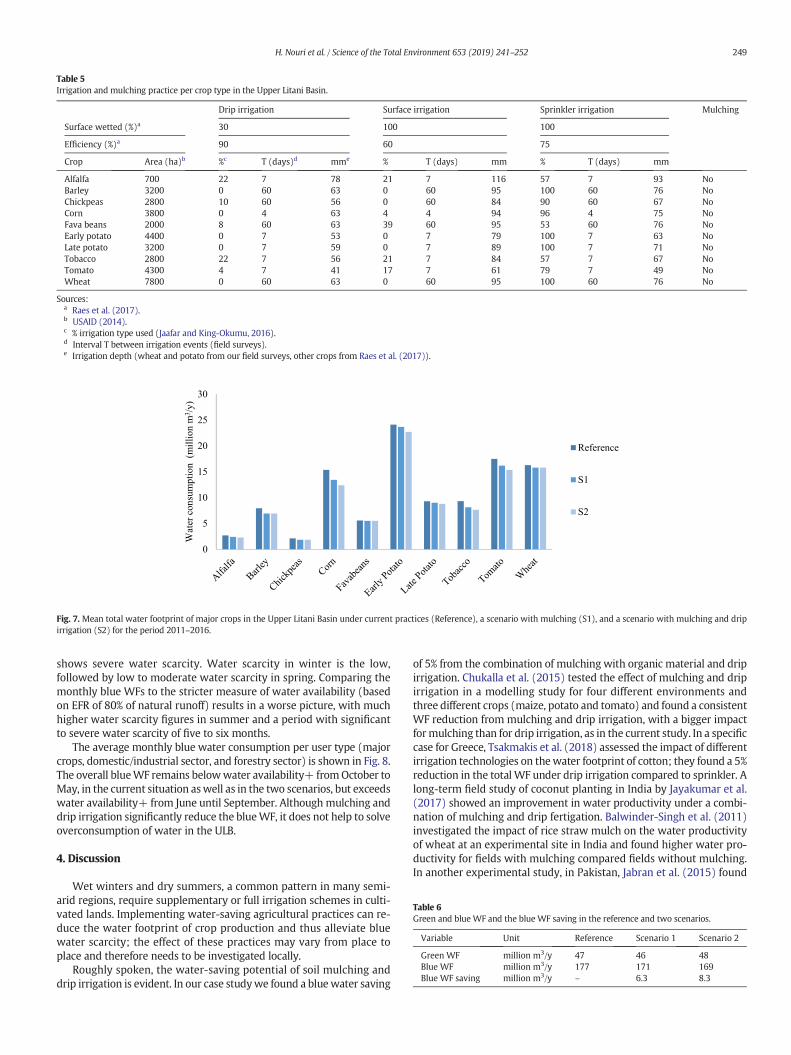
Table 5Irrigation and mulching practice per crop type in the Upper Litani Basin.
Drip irrigation Surface irrigation Sprinkler irrigation Mulching
Surface wetted (%)a 30 100 100
Efficiency (%)a 90 60 75
Crop Area (ha)b %c T (days)d mme % T (days) mm % T (days) mm
Alfalfa 700 22 7 78 21 7 116 57 7 93 NoBarley 3200 0 60 63 0 60 95 100 60 76 NoChickpeas 2800 10 60 56 0 60 84 90 60 67 NoCorn 3800 0 4 63 4 4 94 96 4 75 NoFava beans 2000 8 60 63 39 60 95 53 60 76 NoEarly potato 4400 0 7 53 0 7 79 100 7 63 NoLate potato 3200 0 7 59 0 7 89 100 7 71 NoTobacco 2800 22 7 56 21 7 84 57 7 67 NoTomato 4300 4 7 41 17 7 61 79 7 49 NoWheat 7800 0 60 63 0 60 95 100 60 76 No
Sources:a Raes et al. (2017).b USAID (2014).c % irrigation type used (Jaafar and King-Okumu, 2016).d Interval T between irrigation events (field surveys).e Irrigation depth (wheat and potato from our field surveys, other crops from Raes et al. (2017)).
Fig. 7. Mean total water footprint of major crops in the Upper Litani Basin under current practices (Reference), a scenario with mulching (S1), and a scenario with mulching and dripirrigation (S2) for the period 2011–2016.
Table 6Green and blue WF and the blue WF saving in the reference and two scenarios.
Variable Unit Reference Scenario 1 Scenario 2
Green WF million m3/y 47 46 48Blue WF million m3/y 177 171 169Blue WF saving million m3/y – 6.3 8.3
249H. Nouri et al. / Science of the Total Environment 653 (2019) 241–252
shows severe water scarcity. Water scarcity in winter is the low,followed by low to moderate water scarcity in spring. Comparing themonthly blue WFs to the stricter measure of water availability (basedon EFR of 80% of natural runoff) results in a worse picture, with muchhigher water scarcity figures in summer and a period with significantto severe water scarcity of five to six months.
The average monthly blue water consumption per user type (majorcrops, domestic/industrial sector, and forestry sector) is shown in Fig. 8.The overall blueWF remains belowwater availability+ fromOctober toMay, in the current situation aswell as in the two scenarios, but exceedswater availability+ from June until September. Although mulching anddrip irrigation significantly reduce the blueWF, it does not help to solveoverconsumption of water in the ULB.
4. Discussion
Wet winters and dry summers, a common pattern in many semi-arid regions, require supplementary or full irrigation schemes in culti-vated lands. Implementing water-saving agricultural practices can re-duce the water footprint of crop production and thus alleviate bluewater scarcity; the effect of these practices may vary from place toplace and therefore needs to be investigated locally.
Roughly spoken, the water-saving potential of soil mulching anddrip irrigation is evident. In our case studywe found a bluewater saving
of 5% from the combination of mulching with organic material and dripirrigation. Chukalla et al. (2015) tested the effect of mulching and dripirrigation in a modelling study for four different environments andthree different crops (maize, potato and tomato) and found a consistentWF reduction from mulching and drip irrigation, with a bigger impactformulching than for drip irrigation, as in the current study. In a specificcase for Greece, Tsakmakis et al. (2018) assessed the impact of differentirrigation technologies on thewater footprint of cotton; they found a 5%reduction in the total WF under drip irrigation compared to sprinkler. Along-term field study of coconut planting in India by Jayakumar et al.(2017) showed an improvement in water productivity under a combi-nation of mulching and drip fertigation. Balwinder-Singh et al. (2011)investigated the impact of rice straw mulch on the water productivityof wheat at an experimental site in India and found higher water pro-ductivity for fields with mulching compared fields without mulching.In another experimental study, in Pakistan, Jabran et al. (2015) found
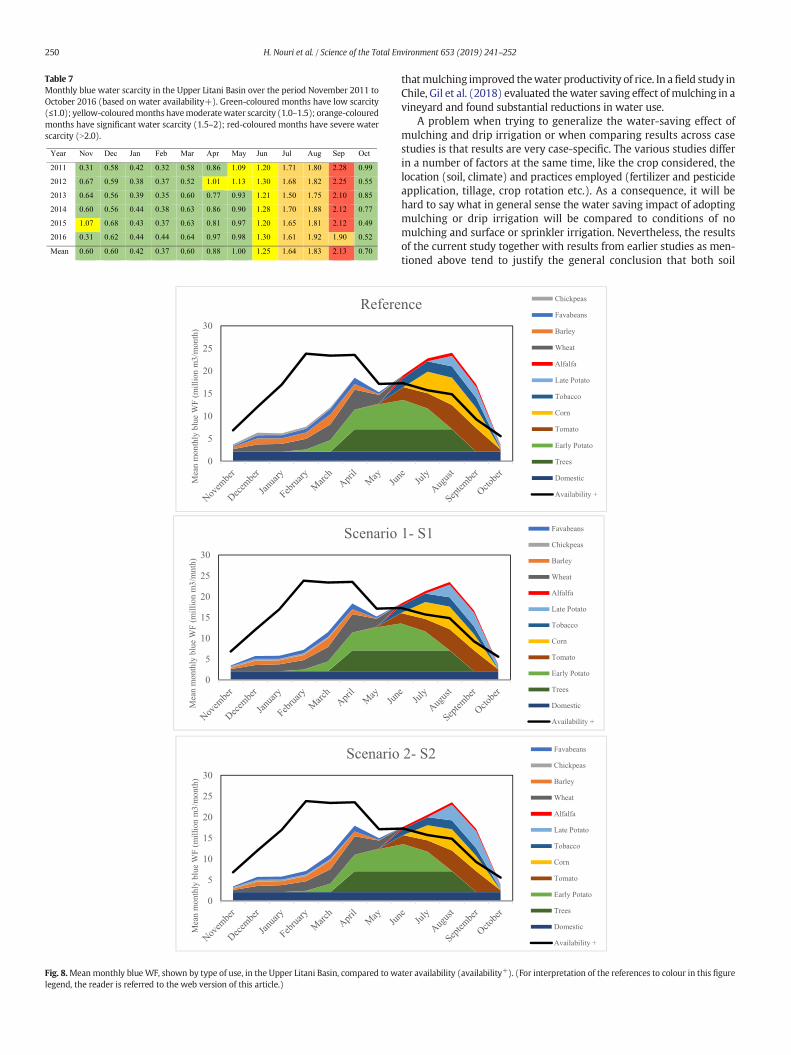
Table 7Monthly blue water scarcity in the Upper Litani Basin over the period November 2011 toOctober 2016 (based on water availability+). Green-coloured months have low scarcity(≤1.0); yellow-colouredmonths havemoderatewater scarcity (1.0–1.5); orange-colouredmonths have significant water scarcity (1.5–2); red-coloured months have severe waterscarcity (N2.0).
Year Nov Dec Jan Feb Mar Apr May Jun Jul Aug Sep Oct
2011 0.31 0.58 0.42 0.32 0.58 0.86 1.09 1.20 1.71 1.80 2.28 0.99
2012 0.67 0.59 0.38 0.37 0.52 1.01 1.13 1.30 1.68 1.82 2.25 0.55
2013 0.64 0.56 0.39 0.35 0.60 0.77 0.93 1.21 1.50 1.75 2.10 0.85
2014 0.60 0.56 0.44 0.38 0.63 0.86 0.90 1.28 1.70 1.88 2.12 0.77
2015 1.07 0.68 0.43 0.37 0.63 0.81 0.97 1.20 1.65 1.81 2.12 0.49
2016 0.31 0.62 0.44 0.44 0.64 0.97 0.98 1.30 1.61 1.92 1.90 0.52
Mean 0.60 0.60 0.42 0.37 0.60 0.88 1.00 1.25 1.64 1.83 2.13 0.70
Fig. 8.Meanmonthly blue WF, shown by type of use, in the Upper Litani Basin, compared to walegend, the reader is referred to the web version of this article.)
250 H. Nouri et al. / Science of the Total Environment 653 (2019) 241–252
thatmulching improved thewater productivity of rice. In afield study inChile, Gil et al. (2018) evaluated thewater saving effect of mulching in avineyard and found substantial reductions in water use.
A problem when trying to generalize the water-saving effect ofmulching and drip irrigation or when comparing results across casestudies is that results are very case-specific. The various studies differin a number of factors at the same time, like the crop considered, thelocation (soil, climate) and practices employed (fertilizer and pesticideapplication, tillage, crop rotation etc.). As a consequence, it will behard to say what in general sense the water saving impact of adoptingmulching or drip irrigation will be compared to conditions of nomulching and surface or sprinkler irrigation. Nevertheless, the resultsof the current study together with results from earlier studies as men-tioned above tend to justify the general conclusion that both soil
ter availability (availability+). (For interpretation of the references to colour in this figure
251H. Nouri et al. / Science of the Total Environment 653 (2019) 241–252
mulching and drip irrigation reduce water use, with the largest effectwhen combined.
A confusing factor when comparing results across studies is that dif-ferent indicators are used when measuring ‘water saving’. While somestudies focus on reduced irrigation water applied (e.g. Lovarelli et al.,2018; Jayakumar et al., 2017), others focus on reduced evapotranspira-tion of irrigation water (e.g. the current study; Chukalla et al., 2015;Zhuo and Hoekstra, 2017). Considering the impact on evapotranspira-tion is particularly relevant when the interest is on the impact of mea-sures on water saving and water scarcity reduction at catchment scale,because it is the evaporated irrigation water that causes water scar-city.Another confusion is that the metrics of green, blue or total con-sumptive water footprint, water productivity, and irrigation efficiencyall differ, so it really matters what is being measured (Zhuo andHoekstra, 2017).
We find a relatively small variation of WFs across soil types but asubstantial variation over different climate zones. This finding is inline with Zhuo et al. (2014), who, in a study for China, also found WFsof crops to be sensitive to climatic factors rather than soil types. This isa relevant finding once we start formulating WF benchmarks based onbest-available technology as proposed by Hoekstra (2014), because itimplies that WF benchmarks will need to be differentiated for differentclimate zones in particular.
The current study considered the benefits of mulching and drip irri-gation (in terms of water saving and water scarcity alleviation) but notthe costs. A marginal cost assessment like carried out by Chukalla et al.(2017) is needed to evaluate the costs of measures to reduce the WF.Particularly drip irrigation is expensive, so that the beneficial effectshould outweigh the costs, which will vary from crop to crop andplace to place.
The value of the current study lies in the scaling up of results tocatchment level. Most studies on technical and managerial measuresto improve yields while reducing water consumption focus on thefield level and show that substantial improvements are possible. Ourstudy shows, however, that when adding up to catchment level, the im-provements are not sufficient to lower the overall blue WF within thecatchment of the ULB to a sustainable level. Particularly in the dry pe-riod, precisely when water availability is extremely low, irrigation de-mands are highest. Artificial reservoirs – as illustrated for the YellowRiver basin in China by Zhuo et al. (2019) and as we show here for theQaraoun reservoir in Litani basin – can store water in the wet periodfor release in the dry period and thus increase water availability in thedry period, but dams are generally associatedwith various environmen-tal and social impacts and need to be evaluated carefully.
5. Conclusion
To assess the possibility of blue water saving in the Upper LitaniBasin through alternative agricultural practices, we formulated two sce-narios:mulching for all crops (S1), andmulching plus drip irrigation forall summer crops (S2). The results, when compared to the current sta-tus, show that both scenarios have a positive but minor impact onblue water saving in the catchment as a whole. Introducing mulchingand drip irrigation for all major crops in the catchment will reduceWFs and alleviate blue water scarcity to some extent, but by far insuffi-cient to solve the problem of current overconsumption of water. Othermeasures need to be explored in addition to the two measures studiedhere, including deficit irrigation, conservation tillage, use of bettercrop varieties, changing crop patterns and possibly, if all measures donot add up to achieve what is needed, reducing the irrigated area.
This research mainly focused on the technical aspects of alternativeagricultural practices; further research is needed to study the feasibilityand practicality of these strategies. For instance, implementing pressur-ized irrigation is costly, so further research on the cost and benefits ofthese alternatives are needed. In addition, the impact of climate changeon water availability was not included in this research and will need to
be included in further study to evaluate the future robustness of mea-sures proposed today.
Acknowledgements
The researchers acknowledge the support of the Food and Agricul-ture Organization of the United Nations (FAO) for providing the finan-cial support for the field survey in Lebanon. Alejandro Galindoacknowledges the postdoctoral financial support received from the Ro-man Areces Foundation.
References
Alcon, F., Tapsuwan, S., Brouwer, R., Yunes, M., Mounzer, O., de-Miguel, M.D., 2019.Modelling farmer choices for water security measures in the Litani river basin inLebanon. Sci. Total Environ. 647, 37–46.
Azimzadeh, S.M., 2012. Conservation tillage in Mediterranean climate (a review). Adv.Environ. Biol. 6, 1880–1890.
Balwinder-Singh, E., Eberbach, P.L., Katupitiya, A., Yadvinder, S., Kukal, S.S., 2011. Growth,yield and water productivity of zero till wheat as affected by rice straw mulch and ir-rigation schedule. Field Crop Res. 121, 209–225.
Bastiaanssen,W.G.M., Steduto, P., 2017. The water productivity score (WPS) at global andregional level: methodology and first results from remote sensing measurements ofwheat, rice and maize. Sci. Total Environ. 575, 595–611.
Brauman, K.A., Siebert, S., Foley, J.A., 2013. Improvements in crop water productivity in-crease water sustainability and food security—a global analysis. Environ. Res. Lett. 8,024030.
Chai, Q., Gan, Y., Zhao, C., Xu, H.-L., Waskom, R.M., Niu, Y., Siddique, K.H.M., 2016. Regu-lated deficit irrigation for crop production under drought stress. A review. Agron. Sus-tain. Dev. 36, 3.
Chukalla, A.D., Krol, M.S., Hoekstra, A.Y., 2015. Green and blue water footprint reductionin irrigated agriculture: effect of irrigation techniques, irrigation strategies andmulching. Hydrol. Earth Syst. Sci. 19, 4877–4891.
Chukalla, A.D., Krol, M.S., Hoekstra, A.Y., 2017. Marginal cost curves for water footprint re-duction in irrigated agriculture: guiding a cost-effective reduction of crop water con-sumption to a permit or benchmark level. Hydrol. Earth Syst. Sci. 21, 3507–3524.
Davis, K.F., Rulli, M.C., Seveso, A., D'Odorico, P., 2017. Increased food production and re-duced water use through optimized crop distribution. Nat. Geosci. 10, 919–924.
Dixit, P.N., Telleria, R., 2015. Advancing the climate data driven crop-modeling studies inthe dry areas of northern Syria and Lebanon: an important first step for assessing im-pact of future climate. Sci. Total Environ. 511, 562–575.
EIP-AGRI, 2016. Water & Agriculture: Adaptive Strategies at Farm Level. The agriculturalEuropean Innovation Partnership (EIP-AGRI). European Commission, Brussels,Belgium.
FAO, 2012a. Coping With Water Scarcity: An Action Framework for Agriculture and FoodSecurity. Food and Agriculture Organization of the United Nations (FAO), Rome, Italy.
FAO, 2012b. Country Study on Status of Land Tenure, Planning andManagement in Orien-tal Near East Countries. Food and Agriculture Organization of the United Nations(FAO), Rome, Italy.
FAO, 2014a. CopingWithWater Scarcity in the Near East and North Africa Fact Sheet - Re-gional Conference for the Near East (NERC-32). Food and Agriculture Organization ofthe United Nations, Rome, Italy.
FAO, 2014b. Global Land Cover - SHARE (GLC-SHARE); Global Land cover Database withSpatial Resolution of 30 Arc-Seconds. Land and Water Division, Food and AgricultureOrganization (FAO), Rome, Italy.
FAO, 2015a. Regional Initiative onWater Scarcity: Towards a Regional Collaborative Strat-egy on Sustainable Agricultural Water Management and Food Security in the NearEast and North Africa Region. Food and Agriculture Organization of the United Na-tions (FAO), Rome, Italy.
FAO, 2015b. Regional Overview of Food Insecurity Near East and North Africa - Strength-ening Regional Collaboration to Build Resilience for Food Security and Nutrition. TheFood and Agriculture Organization of the United Nations, Cairo, Egypt.
FAO, 2017. AquaCrop - Reference Manual. Food and Agriculture Organization of theUnited Nations, Rome, Italy.
FAOSTAT, 2018. FAO - Statistics Division. Food and Agriculture Organization of the UnitedNations, Rome, Italy.
Foster, T., Brozovic, N., Butler, A.P., Neale, C.M.U., Raes, D., Steduto, P., Fereres, E., 2017.AquaCrop-OS: an open source version of FAO's crop water productivity model.Agric. Water Manag. 181, 18–22.
Gil, P.M., Lobos, P., Duran, K., Olguin, J., Cea, D., Schaffer, B., 2018. Partial root-zone dryingirrigation, shading, or mulching effects on water savings, productivity and quality of'Syrah' grapevines. Sci. Hortic. 240, 478–483.
Hengl, T., Mendes de Jesus, J., Heuvelink, G.B.M., Ruiperez Gonzalez, M., Kilibarda, M.,Blagotić, A., Shangguan, W., Wright, M.N., Geng, X., Bauer-Marschallinger, B.,Guevara, M.A., Vargas, R., MacMillan, R.A., Batjes, N.H., Leenaars, J.G.B., Ribeiro, E.,Wheeler, I., Mantel, S., Kempen, B., 2017. SoilGrids250m: global gridded soil informa-tion based on machine learning. PLoS One 12, e0169748.
Hoekstra, A.Y., 2014. Sustainable, efficient and equitablewater use: the three pillars underwise freshwater allocation. WIREs Water 1 (1), 31–40.
Hoekstra, A.Y., 2017. Water footprint assessment: evolvement of a new research field.Water Resour. Manag. 31 (10), 3061–3081.
252 H. Nouri et al. / Science of the Total Environment 653 (2019) 241–252
Hoekstra, A.Y., Chapagain, A.K., Aldaya, M.M., Mekonnen,M.M., 2011. TheWater FootprintAssessment Manual: Setting the Global Standard. Earthscan, London, UK.
Hoekstra, A.Y., Mekonnen, M.M., Chapagain, A.K., Mathews, R.E., Richter, B.D., 2012.Global monthly water scarcity: blue water footprints versus blue water availability.PLoS One 7, e32688.
Hu, H., Xiong, L., 2014. Genetic engineering and breeding of drought-resistant crops.Annu. Rev. Plant Biol. 65, 715–741.
Jaafar, H., King-Okumu, C., 2016. Water Resources Within the Upper Orontes and LitaniBasins: A Balance, Demand and Supply Analysis Amidst Syrian Refugees Crisis Work-ing Paper. International Institute for Environment and Development, Lebanon.
Jabran, K., Ullah, E., Hussain, M., Farooq, M., Zaman, U., Yaseen, M., Chauhan, B.S., 2015.Mulching improves water productivity, yield and quality of fine rice under water-saving rice production systems. J. Agron. Crop Sci. 201, 389–400.
Jägermeyr, J., Gerten, D., Heinke, J., Schaphoff, S., Kummu, M., Lucht, W., 2015. Water sav-ings potentials of irrigation systems: global simulation of processes and linkages.Hydrol. Earth Syst. Sci. 19, 3073–3091.
Jayakumar, M., Janapriya, S., Surendran, U., 2017. Effect of drip fertigation and polythenemulching on growth and productivity of coconut (Cocos nucifera L.), water, nutrientuse efficiency and economic benefits. Agric. Water Manag. 182, 87–93.
Karam, F., Breidy, J., Stephan, C., Rouphael, J., 2003. Evapotranspiration, yield and wateruse efficiency of drip irrigated corn in the Bekaa Valley of Lebanon. Agric. WaterManag. 63, 125–137.
Karam, F., Masaad, R., Sfeir, T., Mounzer, O., Rouphael, Y., 2005. Evapotranspiration andseed yield of field grown soybean under deficit irrigation conditions. Agric. WaterManag. 75, 226–244.
Karam, F., Lahoud, R., Masaad, R., Kabalan, R., Breidi, J., Chalita, C., Rouphael, Y., 2007.Evapotranspiration, seed yield and water use efficiency of drip irrigated sunflowerunder full and deficit irrigation conditions. Agric. Water Manag. 90, 213–223.
le Roux, B., van der Laan, M., Vahrmeijer, T., Bristow, K.L., Annandale, J.G., 2017. Establish-ing and testing a catchment water footprint framework to inform sustainable irriga-tion water use for an aquifer under stress. Sci. Total Environ. 599–600, 1119–1129.
Lorite, I.J., Garcia-Vila, M., Santos, C., Ruiz-Ramos, M., Fereres, E., 2013. AquaData andAquaGIS: two computer utilities for temporal and spatial simulations of water-limited yield with AquaCrop. Comput. Electron. Agric. 96, 227–237.
Lovarelli, D., Ingrao, C., Fiala, M., Bacenetti, J., 2018. Beyond the water footprint: a newframework proposal to assess freshwater environmental impact and consumption.J. Clean. Prod. 172, 4189–4199.
Mekonnen, M.M., Hoekstra, A.Y., 2010. The Green, Blue and GreyWater Footprint of Cropsand Derived Crop Products. Value of Water Research Report Series No.47. UNESCO-IHE, Delft.
Mekonnen, M.M., Hoekstra, A.Y., 2011. The green, blue and grey water footprint of cropsand derived crop products. Hydrol. Earth Syst. Sci. 15, 1577–1600.
Mekonnen, M.M., Hoekstra, A.Y., 2016. Four billion people facing severe water scarcity.Sci. Adv. 2 (2), e1500323.
Pi, X., Zhang, T., Sun, B., Cui, Q., Guo, Y., Gao, M., Feng, H., Hopkins, D.W., 2017. Effects ofmulching for water conservation on soil carbon, nitrogen and biological properties.Front. Agr. Sci. Eng. 4, 146–154.
Postel, S., Polak, P., Gonzales, F., Keller, J., 2001. Drip irrigation for small farmers.Water Int.26, 3–13.
Raes, D., Steduto, P., Hsiao, T., Fereres, E., 2017. AquaCrop Version 6. - Reference Manual.Food and Agriculture Organization of the United Nations, Rome, Italy.
Rallison, R.E., 1980. Origin and evolution of the SCS runoff equation. Symposium on Wa-tershed Management, pp. 912–924.
Ramadan, H.H., Ramamurthy, A.S., Beighley, R.E., 2012. Inter-annual temperature and pre-cipitation variations over the Litani Basin in response to atmospheric circulation pat-terns. Theor. Appl. Climatol. 108, 563–577.
Ramadan, H.H., Beighley, R.E., Ramamurthy, A.S., 2013a. Sensitivity analysis of climatechange impact on the hydrology of the Litani Basin in Lebanon. Int. J. Environ. Pollut.52, 65–81.
Ramadan, H.H., Beighley, R.E., Ramamurthy, A.S., 2013b. Temperature and precipitationtrends in Lebanon's Largest River: the Litani Basin. J. Water Resour. Plan. Manag.138, 16–39.
Ran, H., Kang, S., Li, F., Du, T., Tong, L., Li, S., Ding, R., Zhang, X., 2018. Parameterization ofthe AquaCrop model for full and deficit irrigated maize for seed production in aridNorthwest China. Agric. Water Manag. 203, 438–450.
Schyns, J.F., Hoekstra, A.Y., 2014. The added value of water footprint assessment for na-tional water policy: acase study for Morocco. PLoS One 9, e99705.
Schyns, J.F., Booij, M.J., Hoekstra, A.Y., 2017. The water footprint of wood for lumber, pulp,paper, fuel and firewood. Adv. Water Resour. 107, 490–501.
Shaban, A., Houhou, R., 2015. Drought or humidity oscillations? The case of coastal zone ofLebanon. J. Hydrol. 529, 1768–1775.
Tsakmakis, I.D., Zoidou, M., Gikas, G.D., Sylaios, G.K., 2018. Impact of irrigation technolo-gies and strategies on cotton water footprint using AquaCrop and CROPWATmodels.Environ. Prog. 1–19.
United Nations, 2001. The State of World Population 2001. United Nations PopulationFund, New York, USA.
USAID, 2014. Litani River Basin Management Support (LRBMS) - Project Reports. Leba-nese Republic, The Litani River Authority: United States Agency for InternationalDevelopment.
Wada, Y., van Beek, L.P.H., Viviroli, D., Dürr, H.H., Weingartner, R., Bierkens, M.F.P., 2011.Global monthly water stress: 2. Water demand and severity of water stress. WaterResour. Res. 47.
Zhuo, L., Hoekstra, A.Y., 2017. The effect of different agricultural management practices onirrigation efficiency, water use efficiency and green and blue water footprint. Front.Agric. Sci. Eng. 4, 185–194.
Zhuo, L., Mekonnen, M.M., Hoekstra, A.Y., 2014. Sensitivity and uncertainty in crop waterfootprint accounting: a case study for the Yellow River basin. Hydrol. Earth Syst. Sci.18, 2219–2234.
Zhuo, L., Mekonnen, M.M., Hoekstra, A.Y., Wada, Y., 2016. Inter- and intra-annual varia-tion of water footprint of crops and blue water scarcity in the Yellow River Basin(1961–2009). Adv. Water Resour. 87, 29–41.
Zhuo, L., Hoekstra, A.Y., Wu, P., Zhao, X., 2019. Monthly bluewater footprint caps in a riverbasin to achieve sustainable water consumption: the role of reservoirs. Sci. Total En-viron. 650, 891–899.


![Hoekstra Delft 24Oct2011[1]](https://static.fdocuments.in/doc/165x107/577d23641a28ab4e1e99ab8c/hoekstra-delft-24oct20111.jpg)