
Science Approach Document Threshold of Toxicological ... · Science Approach Document Threshold of...
54
Science Approach Document Threshold of Toxicological Concern (TTC)-based Approach for Certain Substances Health Canada September 2016
Transcript of Science Approach Document Threshold of Toxicological ... · Science Approach Document Threshold of...

Science Approach Document
Threshold of Toxicological Concern (TTC)-based Approach for Certain Substances
Health Canada
September 2016

2
Table of Contents
1.0 Synopsis .............................................................................................................. 3
2.0 Introduction ......................................................................................................... 4
3.0 Application of the TTC-based Approach ........................................................... 5
3.1 Background ........................................................................................................ 5
3.2 Assigning TTC Values ........................................................................................ 8
3.3 Using Oral TTC Values across Different routes of Exposure ........................... 14
4.0 Development of Estimated Exposure Values .................................................. 16
4.1 Exposure from Environmental Media (Indirect Exposure) ................................ 16
4.2 Exposure from Use of Products ....................................................................... 19
5.0 Uncertainties in the TTC-based Approach ...................................................... 22
6.0 Results ............................................................................................................... 25
References ................................................................................................................... 26
Appendix A -TTC Decision Tree proposed by Kroes et al. (2004). .......................... 34
Appendix B – Results of the Approach ..................................................................... 35

3
1.0 Synopsis
Pursuant to section 68 of the Canadian Environmental Protection Act, 1999 (CEPA) (Canada 1999), Health Canada has evaluated a subset of 89 substances of the approximately 1500 remaining priority substances to be addressed in the third phase of the Chemicals Management Plan (CMP). The 1500 substances were identified as priorities for assessment as they met categorization criteria under subsection 73(1) of CEPA and/or were considered a priority based on human health concerns. A group of 237 candidates amongst the 1500 priority substances was identified via qualitative characterization of uses and exposure potential. The aim was to identify those substances which were not evaluated using previous rapid screening approaches but for which exposure to the general population was expected to be limited. The candidates were then assessed via a Threshold of Toxicological Concern (TTC)-based approach. This TTC-based approach identified 89 substances that are unlikely to pose a risk to human health based on current levels of exposure. The Chemical Abstracts Service Registry Numbers (CAS RNs1) of these 89 substances are provided in this Science Approach Document (SciAD). For each candidate, exposure estimates were compared to assigned TTC values. Based on information presented in this Science Approach Document, 89 substances identified in this approach had exposure estimates below assigned TTC values and thus were considered to be of low concern for human health based on current levels of exposure. The remaining 148 substances of the 237 candidates were either excluded or had exposure estimates that exceeded the TTC values; these substances will undergo further assessment under separate initiatives. An assessment of the 89 substances, conducted under sections 68 and/or 74 of CEPA, will be published at a later date.
1 The Chemical Abstracts Service Registry Number (CAS RN) is the property of the American Chemical Society and
any use or redistribution, except as required in supporting regulatory requirements and/or for reports to the Government of Canada when the information and the reports are required by law or administrative policy, is not permitted without the prior, written permission of the American Chemical Society.

4
2.0 Introduction
Following categorization of the Domestic Substance List (DSL), which was completed in 2006, approximately 4300 of the 23000 substances on the DSL were identified as priorities for assessment as they met categorization criteria under subsection 73(1) of CEPA, or were considered a priority based on other human health or ecological concerns. Under this approach, a group of 237 candidate substances were identified via qualitative characterization of uses and exposure potential. The aim was to identify those substances which were not evaluated using previous rapid screening approaches but for which exposure to the general population was expected to be limited. The candidates were then assessed via a Threshold of Toxicological Concern (TTC)-based approach. For each candidate, exposure estimates were compared to assigned TTC values. Where estimates were below assigned TTC values, the substance was considered of low concern for human health based on current levels of exposure.
This SciAD specifically outlines the approach used to assign TTC values incorporating outcomes of recent scientific deliberations (EFSA 2012; EFSA/WHO 2016) and the development of estimates of exposure for the general population for the remaining priority substances considered candidates for this approach.
This SciAD does not represent an exhaustive or critical review of all available data for each of the substances, but provides a summary of the approach and the results obtained. Conservative assumptions and modelling were used, where appropriate. The 89 substances that are considered to have human health exposures below their respective TTC values are included with a summary of the supporting data or predictions. For the substances identified as being of low concern for human health at current levels of exposure, results of this TTC-based approach are intended to form the basis for the human health portion of the screening assessment to be conducted under section 68 and/or section 74 of CEPA and published at a later date.
This SciAD was prepared by staff in the Existing Substance Risk Assessment Bureau (ESRAB) at Health Canada and incorporates input from other programs within the Department. This SciAD has undergone external written peer review and/or consultation. Comments on the technical approach were received from four expert reviewers with expertise and perspectives on the TTC-based approach. The reviewers were Susan Felter (Proctor & Gamble), Mitch Cheeseman (Steptoe & Johnson), Susan Barlow (Consultant in Toxicology & Risk Assessment) and Krul Lisette (TNO, the Netherlands Organisation for Applied Scientific Research). The expert reviewers are associated with companies, consultant firms and independent research organizations; however, they served as individuals, representing their own personal scientific opinions in the peer review. The external peer review and/or consultation was administered by the Toxicology Excellence for Risk Assessment Center. While external comments were taken into consideration, the final content and outcome of the TTC-based approach remain the responsibility of Health Canada.

5
3.0 Application of the TTC-based Approach
3.1 Background
Threshold of Toxicological Concern
TTC is an approach to establish a human exposure threshold value for a chemical, below which there is a low probability of risk to human health (Kroes et al. 2004). The TTC concept is currently used or proposed in several areas of chemical risk assessment internationally, including substances used in food contact articles (US FDA 1995), food flavouring agents under the Joint FAO/WHO Expert Committee on Food Additives (JECFA) (WHO 1995; WHO 1997) and impurities in pharmaceuticals (US FDA 2015). The European Food Safety Authority (EFSA) Scientific Committee has recommended the TTC approach as a scientifically-valid method for deciding if the exposure to a substance is so low that the probability of adverse health effects is low; and accordingly, no further assessment is necessary (EFSA 2012).
The TTC concept was first applied as the Threshold of Regulation for food contact materials by the Unites States Food and Drug Administration (US FDA). This concept evolved over time with the development of multiple TTCs based on the analysis of additional classes of chemicals and additional health effects, including cancer and non-cancer effects.
Munro et al. (1996) compiled a database of 613 chemicals tested for a variety of non-cancer effects in rodents and rabbits in oral toxicity tests including subchronic, chronic, reproductive and developmental toxicity. In cases of substances associated with only subchronic studies, an uncertainty factor of three was applied to the No Observed Effect Level (NOEL) from the subchronic studies in order to group them with other NOELs from chronic studies. However, if a substance was associated with chronic and subchronic studies, but the lowest NOEL came from a subchronic study, the subchronic NOEL was used without adjustment. Each substance was then assigned a Cramer classification using a decision tree (Cramer et al. 1978). Class I included substances with simple structures indicative of low toxicity, class II included substances less innocuous than class I, but with no clear evidence of toxicity, and class III comprised substances with structures indicative of potential health effects of concern. The fifth percentiles from log normal cumulative distributions of NOELs were 3.0, 0.91 and 0.15 mg/kg bw/day for classes I, II and III, respectively. The human exposure threshold value was derived by taking the 5th percentile of the distribution of NOELs for each Cramer class and then dividing by a safety factor of 100. These values were then adjusted for body weight to express the thresholds for classes I, II and III substances as 1800, 540, and 90 µg/person/day, respectively.
In 1999, Cheeseman et al. (1999) used an updated and expanded database of chemicals and health effects data to which reaffirmed the US FDA Threshold of Regulation Building from the work in Cheesman et al. (1999). Kroes et al. (2004) recommended a TTC for chemicals with structural alerts for genotoxicity. The threshold was developed by examining compounds with both structural alerts for carcinogenicity

6
and genotoxicity [based on alerts by Ashby and Tennant (1991)] and cancer dose–response data available from animal studies. For these chemicals, extrapolation from the experimental range to a level that would be considered negligible was undertaken. Kroes et al. (2004) recommends using a TTC of 0.15 µg/person/day for substances with a structural alert for genotoxicity that are not part of a group of exclusions. Additionally, the EFSA/WHO Working Group on TTC recommended incorporating genotoxicity data (if available) and weight of evidence in addition to using structural alerts as a way to assign genotoxic TTC value for chemicals (EFSA/WHO 2016).
Kroes et al. (2004) also evaluated the incorporation of different health effects including neurotoxicity and immunotoxicity, in potential applications of the TTC concept. A separate threshold was proposed by Munro et al. (1996) and discussed by Kroes et al. (2004) for organophosphate compounds due to anti-acetylcholinesterase activity. The EFSA Scientific Committee recommended that this threshold also be used for carbamates (EFSA 2012).
Combining these thresholds with the non-cancer thresholds derived by Munro et al. (1996), Kroes et al. (2004) proposed a decision tree which could be used as guidance for the application of the TTC concept (Appendix A). Both the EFSA Scientific Committee and the EFSA/WHO Working Group have recommended that the TTC values be expressed as µg/kg bw/day in order to apply the TTC approach to different age groups (EFSA 2012; EFSA/WHO 2016). A summary of the TTC values established for Cramer classes, organophosphates and compounds with structural alerts for genotoxicity is presented in Table 3-1.
Although the TTC values presented below were developed using older health effects datasets, there have been multiple papers published after Kroes et al. (2004) that consider the approach based on more recent datasets of health effect studies and have identified values similar to those established by Munro et al. (1996) and Kroes et al. (2004) (Laufersweller 2012; Kalkhof et al. 2011; Pinalli et al. 2011; Tluczkiewicz et al. 2011; Blackburn et al. 2005; Feigenbaum et al. 2015).
Table 3-1. TTC values for various classes of chemicals Chemical class TTC values
(µg/person/day)a TTC values
(µg/kg bw/day)
Cramer class I 1800 30
Cramer class II 540 9.0
Cramer class III 90 1.5
Organophosphates /
Carbamatesb
18 0.3
US FDA Threshold of
Regulationc
1.5 0.025
Genotoxic compounds 0.15 0.0025 a
Kroes et al. (2004) – based on 60kg individual b
Carbamates were included in this threshold as a recommendation by the EFSA Scientific Committee c
Historical value based on US FDA Threshold of Regulation and incorporated in Kroes et al. (2004). Not considered
under the current approach.

7
Exclusions A number of chemical classes have been identified as part of the “cohort of concern” (Table 3-2), which defines exclusions as well as chemical classes that are not covered by the current TTC approach because 1) some substances could be a concern at levels lower than the lowest TTC value or 2) very few substances of this class were included in the database from which TTC values have been derived (Kroes et al. 2004). Subsequent additional exclusions by EFSA (2012) and the non-food European Commission committees (SCCS/SCHER/SCENIHR, 2012) include benzidines and hydrazines based on their potency as genotoxic carcinogens. These exclusions are included under this TTC-based approach.
Table 3-2. Exclusions to the TTC-based approach
Class/group Basis for exclusion Reference(s)
Aflatoxin-like compounds
Potent genotoxic carcinogens Kroes et al. 2004; EFSA 2012; EFSA/WHO 2016
Benzidines Potent genotoxic carcinogens EFSA 2012; EFSA/WHO 2016
N-nitroso-compounds Potent genotoxic carcinogens Kroes et al. 2004; EFSA 2012; EFSA/WHO 2016
Azoxy-compounds Potent genotoxic carcinogens Kroes et al. 2004; EFSA 2012; EFSA/WHO 2016
Hydrazines Potent genotoxic carcinogens EFSA 2012
Steroids Potent non-genotoxic carcinogens
Kroes et al. 2004; EFSA 2012; EFSA/WHO 2016
Polyhalogenated dibenzo-p-dioxins,dibenzofurans and dioxin-like PCBs
Potent, bioaccumulative, non-genotoxic carcinogens, with very large kinetic differences between animals and humans
Kroes et al. 2004; EFSA 2012; EFSA/WHO 2016
Proteins Risk of allergenicity, not included in database
EFSA 2012; EFSA/WHO 2016
Organometallics Not included in dataset Kroes et al. 2004; EFSA 2012; EFSA/WHO 2016
Organo-silicon
compounds
Not included in dataset EFSA/WHO 2016
Metals Not included in databset; some are bioaccumulative
Kroes et al. 2004; EFSA 2012; EFSA/WHO 2016
High molecular weight substances such as polymers
Not included in databset/not clearly defined structure
Kroes et al. 2004
Kroes et al. (2004) indicated that it may be premature to apply the TTC approach to chemicals with endocrine-related effects. More recently, EFSA (2012) indicated that if there is substance-specific data showing endocrine activity, but its relevance is not clear in humans, the decision to include or exclude from a TTC-based approach should be
8
taken on case-by-case basis. If the data shows endocrine-related adverse effects then risk characterization should be undertaken rather than use of a TTC-based approach. For other substances, other than steroids which are an exclusion category, the EFSA Scientific Committee suggested that the TTC approach can be applied (EFSA 2012); this has also been adopted in this TTC-based approach.
Mixtures with unknown chemical structures were recommended for exclusion from the TTC (EFSA 2012). However, the EFSA/WHO Expert Workshop Report provided some practical suggestions for addressing mixtures that are not fully characterized. The TTC approach could be used if sufficient information is available to confirm that the mixture does not contain excluded compounds and that components could be treated as potentially genotoxic and the TTC of 0.0025 µg/kg bw/day would apply. If it can also be determined that there are no concerns for genotoxicity, the substance may be placed directly in Cramer class III providing it is not an organophosphate or a carbamate (EFSA/WHO 2016). The approach for addressing mixtures under this assessment is described in Section 3.2.
Nanomaterial and radioactive or bioaccumulative substances were recommended to be excluded from the TTC approach (EFSA 2012; EFSA/WHO 2016). These types of substances are not part of the candidate substances for the Health Canada TTC-based approach.
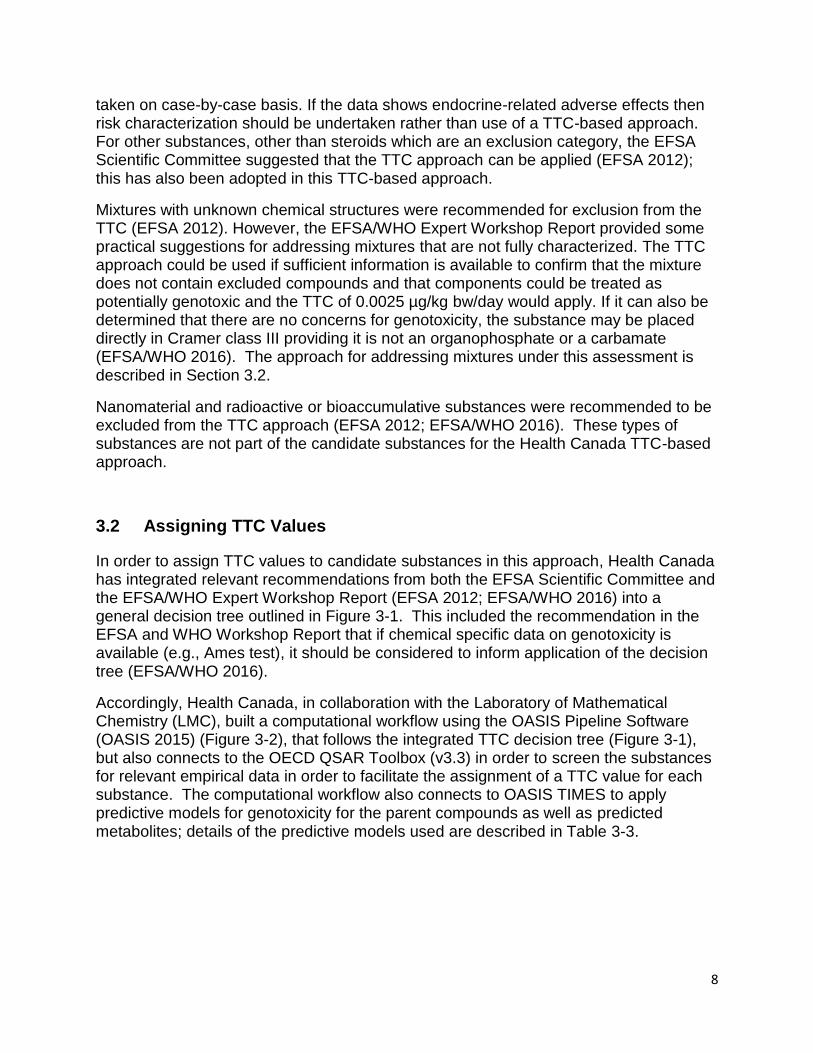
3.2 Assigning TTC Values
In order to assign TTC values to candidate substances in this approach, Health Canada has integrated relevant recommendations from both the EFSA Scientific Committee and the EFSA/WHO Expert Workshop Report (EFSA 2012; EFSA/WHO 2016) into a general decision tree outlined in Figure 3-1. This included the recommendation in the EFSA and WHO Workshop Report that if chemical specific data on genotoxicity is available (e.g., Ames test), it should be considered to inform application of the decision tree (EFSA/WHO 2016).
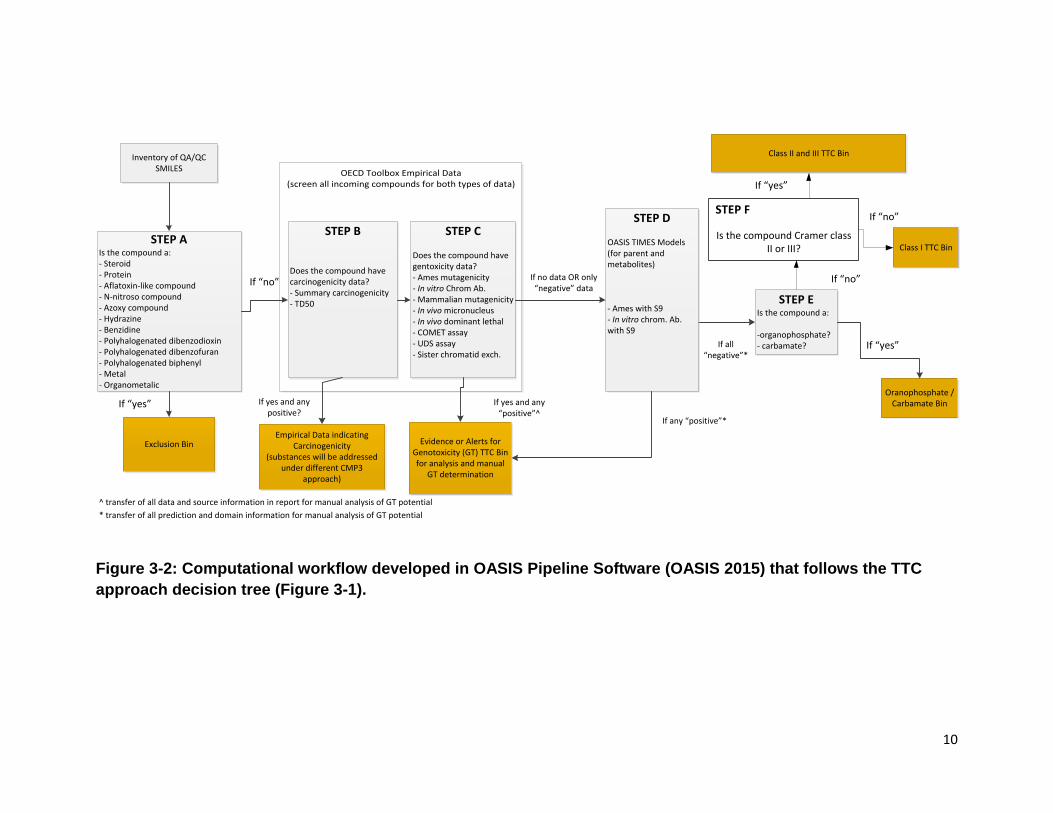
Accordingly, Health Canada, in collaboration with the Laboratory of Mathematical Chemistry (LMC), built a computational workflow using the OASIS Pipeline Software (OASIS 2015) (Figure 3-2), that follows the integrated TTC decision tree (Figure 3-1), but also connects to the OECD QSAR Toolbox (v3.3) in order to screen the substances for relevant empirical data in order to facilitate the assignment of a TTC value for each substance. The computational workflow also connects to OASIS TIMES to apply predictive models for genotoxicity for the parent compounds as well as predicted metabolites; details of the predictive models used are described in Table 3-3.

Yes
Does the substance belong to a member of an exclusion
category?
Is there chemical-specific data indicating the
potential for genotoxicity (e.g in vitro
mutagenicity, in vitro clastogenicity, or in
vivo assay)?
If no or limited data, is there a structural
alert for genotoxicity – including the
predicted metabolites?
Est. Exposure > 0.0025 µg/kg bw/day?
Substance will be addressed by other
approach under the CMPUnlikely to pose a
human health risk
Yes
No
Yes
Is the substance an organophosphate or
carbamate?Est. Exposure > 0.3 µg/kg bw/day?
Unlikely to pose a
human health risk
Is the compound in Cramer Class III or II? Est. Exposure > 1.5 µg/kg bw/day?
Yes
Yes
Is the compound in Cramer Class I? Exposure > 30 µg/kg bw/day?Yes
No
Yes
No
No
Yes
No
No
No
No
Yes
Figure 3-1: Decision tree for the TTC-based approach for select remaining DSL priorities [adapted with considerations from
Kroes et al. (2004), EFSA Scientific Committee (EFSA 2012) and EFSA/WHO Working Group (EFSA/WHO 2016)]. Exclusion
criteria are discussed in Section 3.1.
10
OECD Toolbox Empirical Data (screen all incoming compounds for both types of data)
Is the compound Cramer class II or III?
Empirical Data indicatingCarcinogenicity
(substances will be addressed under different CMP3
approach)
Evidence or Alerts for Genotoxicity (GT) TTC Binfor analysis and manual
GT determination
If “no”
If “yes”
Inventory of QA/QC SMILES
STEP AIs the compound a:- Steroid- Protein- Aflatoxin-like compound- N-nitroso compound- Azoxy compound- Hydrazine- Benzidine- Polyhalogenated dibenzodioxin- Polyhalogenated dibenzofuran- Polyhalogenated biphenyl- Metal- Organometalic
Exclusion Bin
STEP B
Does the compound have carcinogenicity data?- Summary carcinogenicity- TD50
STEP C
Does the compound have gentoxicity data?- Ames mutagenicity- In vitro Chrom Ab.- Mammalian mutagenicity- In vivo micronucleus- In vivo dominant lethal - COMET assay- UDS assay- Sister chromatid exch.
STEP D
OASIS TIMES Models(for parent and metabolites)
- Ames with S9- In vitro chrom. Ab. with S9
STEP EIs the compound a:
-organophosphate?- carbamate?
Class II and III TTC Bin
Class I TTC Bin
Oranophosphate / Carbamate BinIf “yes”
If “no”
If yes and any positive?
If yes and any “positive”^
If no data OR only “negative” data
If any “positive”*
If all “negative”*
If “yes”
If “no”
^ transfer of all data and source information in report for manual analysis of GT potential
* transfer of all prediction and domain information for manual analysis of GT potential
STEP F
Figure 3-2: Computational workflow developed in OASIS Pipeline Software (OASIS 2015) that follows the TTC
approach decision tree (Figure 3-1).

January 28, 2016
Considerations regarding chemical structure of a substance
In order to assign a TTC value, a quality structural representation of the substance is required. The software used in the approach for deriving the TTC values use Simplified Molecular-Input Line-entry System (SMILES) representation. The SMILES for each discrete compound were retrieved from the following databases/tools:
o OECD QSAR Toolbox datasets and inventories (OECD 2015); o ChemIDplus (ChemIDplus 1993); and/or o United States Environmental Protection Agency (US EPA) ACToR (ACToR
2013).
Preference was given to SMILES considered by the Toolbox to be of high quality. ChemIDPlus and US EPA ACToR were also used to verify the SMILES for each discrete substance. Divergent structural representations were resolved manually using expert knowledge.
A similar process for structure verification of discrete substances was conducted for mixture-type substances. A TTC value was assigned to mixtures where representative structures of components could be identified. For these substances, the approach was to examine the representative components of the mixture against the exclusions. If the representative components were not considered to meet exclusions, (a) TTC value(s) for the representative component(s) is assigned. An overall TTC value is assigned for the entire mixture. Where TTC values are different for the individual components, the overall value is based on the component with the lowest threshold.
Verifying exclusions
Substances were examined against previously established exclusions as described in Kroes et al. (2004), EFSA (2012) and EFSA/WHO (2016) (Section 3.1). Moreover, mixtures of substances containing unknown chemical structures or UVCB-type substances (substances of Unknown or Variable composition, Complex reaction products or Biological materials) that do not have (a) representative structure(s) considered suitable for TTC derivation were also not included in the approach. The screening of substances for exclusions was accomplished using structural profilers incorporated into the OASIS Pipeline computational workflow (Figure 3-2; STEP A).
Substances with empirical data for genotoxicity and carcinogenicity
The computational workflow developed for the TTC-based approach integrates steps from the decision tree proposed by Kroes et al. (2004) and in parallel screens the substances for empirical data, related to carcinogenicity and genotoxicity that is available through the OECD QSAR Toolbox.
Substances were queried for empirical data on carcinogenicity (e.g., established TD50 values) (Figure 3-2: STEP B). Substances with positive results were not included in this approach.

12
Substances were also queried for empirical data on genotoxicity (Figure 3-2: STEP C). For many existing substances, the information on genotoxicity is limited. For the purposes of this TTC-based approach, a substance is considered potentially genotoxic if:
a) positive results in in vivo mammalian studies for gene mutation or chromosomal aberrations (including micronuclei); and/or
b) positive results in an in vitro test for gene mutation or chromosomal aberrations (including micronuclei) and absence of conflicting data from in vivo mammalian tests that covers the same genetic endpoint that gave a positive response in the in vitro test.
Where multiple results for a given assay were available within the OECD QSAR Toolbox, the response was assigned based on the most conservative outcome.
The substances considered potentially genotoxic using the above criteria are assigned a TTC value of 0.0025 µg/kg bw/day.
Substances with structural alerts for genotoxicity
Compounds that do not have positive empirical data for genotoxicity were evaluated for structural alerts related to genotoxicity using computational models as outlined in Table 3-3 (Figure 3-2: STEP D). Details for the models are available in the (Q)SAR Model Reporting Format (QMRF) (available upon request).
Table 3-3 Models used to identify substances (including predicted metabolites) with structural alerts for genotoxicity
Model Name (version)
Description Reference
LMC OASIS Tissue Metabolic Simulator (TIMES) (v2.27.17) Sub-model: Ames mutagenicity with S9 metabolic activation (v11.11)
Predicts chemicals that may be able to elicit mutagenicity as a result of interactions with DNA in bacteria. The model couples a mammalian metabolic simulator with an alerting group approach combined with a pattern recognition-type model to predict reactivity of a chemical toward DNA within a given interaction mechanism. The metabolic simulator was trained to reproduce documented maps for mammalian (mainly rat) liver metabolism for 260 chemicals. Chemicals are predicted to be mutagenic as parents only, parents and metabolites, and metabolites only.
TIMES 2015
LMC OASIS Tissue Metabolic
Predicts chemicals that induce structural chromosomal aberrations in Chinese hamster lung cells (CHL) or Chinese hamster ovary cells (CHO).
TIMES 2015

13
Model Name (version)
Description Reference
Simulator (TIMES) (v2.27.17) Sub-model: In vitro chromosomal aberrations with S9 metabolic activation (v11.11)
The model couples a mammalian metabolic simulator with an alerting group approach combined with a pattern recognition-type model to predict reactivity of a chemical toward DNA within a given interaction mechanism. Includes mechanistic interpretation for direct binding to DNA as well as inhibition of topisomerases and interaction of chemicals with nuclear proteins (e.g., histones) also shown to cause chromosomal aberrations. The metabolic simulator was trained to reproduce documented maps for mammalian (mainly rat) liver metabolism. Chemicals are predicted to be mutagenic as parents only, parents and metabolites, and metabolites only.
OASIS TIMES was selected as the predictive tool for the TTC-based approach as it employs a metabolic simulator and screens parents and their predicted metabolites for alerts. Most alerts have a mechanistic interpretation and are transparently documented. Knowledge of alert modulating factors for the substance is also considered by the model. Additionally, the model provides applicability domain analysis for each substance. A chemical is considered in domain if its log Kow and molecular weight are within the specified ranges covered by the training set. Also, the model conducts an atom-centered fragments check to determine if all structural features are represented in the training set chemicals. Alert performance, as defined by the empirical data in the training set, is also considered in the domain analysis. OASIS TIMES is considered to have advantages over other alert screening software (e.g., Toxtree), as it is a hybrid model that combines knowledge-based rules and a statistically-derived model with a metabolic simulator and a domain of applicability analysis.
Predictions in the above models were also generated for compounds with empirical evidence showing the absence of genotoxicity (e.g., predictions were generated for substances with only an Ames test which is negative and no other available empirical data for other genetic endpoints such as chromosomal aberrations). The reason behind this is that no single test is capable of detecting all relevant genotoxic mechanisms. The modelling approach mirrors two endpoints of the standard genotoxicity battery (i.e., mutagenicity vs. clastogenicity). Therefore, a substance can have negative Ames data, which tests for point mutations and frameshifts (mutagenicity) but is predicted to be positive in the in vitro chromosomal aberrations model, which tests for clastogenicity. Predicted positive compounds are considered as having alerts for genotoxicity for the purposes of the TTC-based approach.
A manual process of verifying the model predictions against available empirical data on test-by-test basis was carried out where data permitted. For example, where a model predicted the chemical to be positive in the Ames assay but empirical data are available

14
to indicate that the substance is negative in this test, a preference is given to the empirical result. This was carried out for the in vitro chromosomal aberration assays as well.
Substances are considered potentially genotoxic as described in the above modelling approach and a TTC value of 0.0025 µg/kg bw/day is assigned to these chemicals.
Non-genotoxic substances
Once the chemicals have been screened for genotoxicity potential as outlined above and no positive data or relevant alerts are found, the chemicals proceed through the remainder of the decision tree.
The structure of each substance was examined, using a structural profiler, to determine if the compound is an organophosphate or carbamate (Figure 3-2: STEP E). However, none of the candidates for this approach are organophosphates or carbamates (see Results Section 6.0).
Substances were assigned a Cramer classification based on the Cramer decision tree (Figure 3-2: STEP F). The Cramer classification scheme has been implemented in various software solutions in order to facilitate its use in a consistent manner. Two such programs are the Toxtree software (Toxtree 2015) and the OECD QSAR Toolbox (OECD 2015). Implementation of the Cramer scheme in these two programs required some decisions by the programmers, such as the chemically-based interpretation of the original rules, and the establishment of pre-defined “look-up lists” of normal body constituents and common food components. Therefore, it is possible to have different classifications when using different software. Cramer class under the approach is first based on the software implementation of the 33 questions in the OECD QSAR Toolbox (v3.3). Toxtree was also used to verify Cramer class for each substance outside the computational workflow. Discrepancies were manually examined with considerations from Bhatia et al. (2014) and Roberts et al. (2015) in order to add confidence to the assignment of Cramer class across the CMP remaining substances.
A number of publications have noted the small number of substances that fall into Cramer class II (Munro et al. 1996; Tluczkiewicz et al. 2011; Pinalli et al. 2011; Feigenbaum et al. 2015) and the EFSA Scientific Committee commented that Cramer class II was not sufficiently supported by the existing databases and recommended that consideration should be given to treating substances that would be classified in Cramer class II under the Cramer decision tree as if they were Cramer class III substances (EFSA 2012). Health Canada is adopting this approach for the purpose of its TTC-based approach (Figure 3-2, Step F).
3.3 Using Oral TTC Values across Different Routes of Exposure
The existing TTC values have been derived from experiments in which laboratory animals were administered chemicals in repeated-dose studies via oral route. However, it is common that exposure to chemical substances (being assessed under the CMP)

15
occur through dermal or inhalation routes (e.g., from use of certain consumer products, cosmetics or through environmental media); therefore, appropriate consideration needs to be given when applying oral-based TTC values for non-oral exposure.
EFSA (2012) suggested two possible methods which could be used to derive TTC values for non-oral routes. First, use oral TTC values and conduct route-to-route extrapolation and second, derive separate TTC values by using data from existing studies conducted using other routes of exposure. While there have been attempts to establish databases of inhalation from repeat-dose toxicity studies (Carthew et al. 2009, Escher et al. 2010, Schüürmann et al. 2016) and dermal repeat-dose toxicity studies (William et al. 2016) in order to establish route-specific TTC values, it is generally considered that the number of studies available via other routes is small relative to the oral studies database (Dewhurst and Renwick 2013). Thus, much of the recent focus of adapting the TTC approach for different routes of exposure has been on developing methods for route-to-route extrapolation of the available oral studies that underpin the currently established TTC values.
Under this TTC-based approach, consideration for the application of the oral TTC values to dermal exposures applies to a small subset of substances with direct dermal exposures (i.e., fewer than 15% of the substances that are included in this approach).
A pragmatic approach for applying oral TTC values for dermal exposure involves the quantification of the estimate of external exposure by the dermal route and comparing this value to the orally-derived TTC value. This approach assumes bioavailability equivalence across routes of exposure regardless of differences in toxicokinetics. If the estimate of dermal exposure exceeds the established oral TTC value, then the circumstances of the dermal exposure (e.g., duration of exposure) and characteristics of the substance that may affect dermal absorption potential were examined and refinements to the exposure estimate were incorporated if appropriate.
Knowledge of differences in bioavailability between inhalation and gastrointestinal (GI) routes, differential first-pass metabolism and specific transport processes in the GI tract and lungs is much more limited and substances associated with potential significant exposure via inhalation were not included in this TTC-based approach. This is consistent with the EFSA (2012) opinion noting that it seems inadvisable to base the TTC approach on the Munro dataset and perform route-to-route extrapolation for the inhalation route of exposure. EFSA (2012) also noted that further extensions of the inhalation-specific database would be desirable before establishing TTC values for inhalation. Substances were excluded from this TTC-based approach due to inhalation exposure potential if they met the following criteria:
- had high vapour pressure and found in consumer or cosmetic products; - had an application method potentially resulting in inhalation exposure (e.g., air
freshener); or - were detected in specific Canadian indoor air monitoring data.

16
Canadian indoor air monitoring data was obtained from two recent Canadian indoor air monitoring reports. Zhu et al. (2013), a comprehensive, population-based national indoor air survey conducted in 2009-2011 and Won and Lusztyk (2011), included information from 115 homes in Quebec City between 2008 and 2010. Substances found to have measured levels above the detection limit in indoor air were not included in this TTC-based approach. For environmental media, inhalation exposure (based on 24-hour breathing rates with predicted ambient air concentrations) was aggregated with oral exposure as most substances released to the environment would be expected to partition to air to some extent. Absorption through lung tissue is potentially greater than absorption through the intestinal wall. Knowledge gaps related to route-to-route extrapolation between oral TTC values and inhalation exposures described above are acknowledged as uncertainties to this approach.
4.0 Development of Estimated Exposure Values
For each substance in this TTC-based approach, potential exposure of the Canadian general population was characterized and compared to the TTC value assigned to the substance.
Depending on the uses of a substance, general population exposure can be via direct exposure (e.g., contact with consumer products or cosmetics) or via indirect exposure such as exposure through environmental media (e.g., water, soil, and air).
Conservative estimates of exposure were generated. This section describes how indirect and direct exposures were characterized for the application of the TTC-based approach to assess remaining priorities under the CMP.
4.1 Exposure from Environmental Media (Indirect Exposure)
Exposure of the general population may result from the presence of the substance in various environmental media. A broad-based approach was used to generate environmental concentrations via modelling. The Canadian environmental fugacity model, ChemCAN v6.00 (ChemCAN 2003), was selected to model environmental concentrations in ambient air, surface water and soil; these concentrations were then used to estimate exposure through environmental media of the general population for the candidate substances in the TTC-based approach (see Table B-3 for estimates of exposure to environmental media). Fugacity modelling approach (ChemCAN v6.00)
ChemCAN v6.00, a Level III Canadian environmental fugacity model, was used to estimate ambient environmental concentrations. This model contains 24 pre-parameterized regions in Canada and can be used to estimate steady-state

17
concentrations in environmental compartments, such as ambient air, surface water and soil. As the model estimates concentrations over a regional scale, it is ideally suited for substances that exhibit more disperse releases and for substances that do not degrade quickly in the environment. In addition, by averaging the mass of a substance regionally, the environmental concentrations may be more reasonable for “mixing” compartments (e.g., air and water) than “static” compartments (e.g., soil). ChemCAN v6.00 is best suited for substances that are “Mackay Type 1”. Mackay Type 1 substances are organic substances having vapour pressures greater than 10-7 Pa and water solubility greater than 10-6 g/m3 (Mackay et al. 1996). While ChemCAN v6.00 can be used to simulate some other types of organic substances, unique partitioning coefficients may be required as input that cannot be readily estimated. Approximately 85% of discrete organics and representative structures (in the case of mixtures or UVCBs) evaluated with this TTC-based approach are considered to be Mackay Type 1 substances. For Mackay Type 1 substances, six simulations were conducted: two simulations for each mode-of-entry (i.e., 100% release to air, water, or soil). The first simulation for each medium assumed zero water and air advective inflow concentrations (from other regions) into the region of interest. The second simulation used the output air and water concentrations from the first simulation as advective inflow concentrations, and it was the output concentrations of the second simulation that were used as the exposure point concentrations (EPCs) for deriving human intake estimates. EPI Suite™ was used to obtain or estimate physicochemical properties and environmental degradation half-lives for each substance to run in ChemCAN v6.00 (EPI Suite™ 2012). Preference was given to empirical data when available; otherwise, modelled properties were used. Molecular weight, Henry’s law constant, log Kow, and overall degradation half-lives were used in each model simulation. As an overall degradation half-life for each environmental compartment was required, the half-lives were calculated as the reciprocal sum of each individual degradation process applicable to a given medium (where such information was available): 1/(t1/2 overall) = [1/(t1/2 abiotic) + 1/(t1/2 biotic)] For air, hydroxyl radicals reaction and ozone reaction were considered. For water, hydrolysis and biodegradation were considered. Biodegradation half-lives were estimated by converting BIOWIN3 numerical output to a half-life based on default conversion factors in Aronson et al. (2006). For soil and sediment, only biodegradation half-lives were estimated, based on an assumed 1:1:4 water-to-soil-to-sediment intermedia biodegradation extrapolation factor from Boethling et al. (1995). The emission volumes used for the ChemCAN v6.00 simulations were the total commercial volumes (i.e., manufacture and import) based on section 71 submissions received for each substance as part of Phase 1 and 2 of the Domestic Substances List Inventory Update (DSL IU) (Canada 2014; Environment Canada 2012). In addition, for

18
one substance, information from submissions received for the 2005 reporting year in response to a separate section 71 survey was considered (Canada 2006). In the case of Phase 1 and 2 of the DSL IU, the reporting threshold was either 100 or 1000 kg/year and the reporting year was 2008 and 2011, respectively (Canada 2009; 2012). If a substance was included in the survey in either Phase 1 or 2 of the DSL IU but no volume data were received, the reporting threshold of 100 kg for Phase 1 of the DSL IU and for Part 2 substances of Phase 2 of the DSL IU was used. Environment Canada’s National Pollutant Release Inventory (NPRI) was also verified for any emissions data (Environment Canada 2013). In addition, Canadian hospital and retail pharmacy sales volumes data for 2011-2012 from the IMS MIDAS database were included in emission volumes for substances that are active pharmaceutical ingredients (IMS 2013). For each ChemCAN v6.00 simulation, the “Ontario Mixed-Wood Plain” region was selected as a default region as it represents southern Ontario, the most populated and industrialized area of Canada. Common input parameters for all Mackay Type 1 substances and structures included the following default temperature dependence coefficients (ΔH): -20,000 J/mol (for Kow); +55,000 J/mol (for Kaw); and -75,000 (for Koa) (Beyer et al. 2002). In addition, the “One-Parameter Method” was used to calculate the Kp (air-aerosol) partitioning property based on Koa and a default linear constant of 1.50E-12 for all substances (Finizio et al. 1997). The output environmental concentrations in ambient air, surface water and soil from ChemCAN v6.00 were used to generate human intake estimates for two age groups: formula-fed infants (0 to 6 months) and toddlers (7 months to 4 years). These two age groups were selected as they represent the most exposed age groups on a per body weight basis. Concentrations in ambient air were used to represent exposures to both ambient and indoor air (when recent Canadian measured substance-specific indoor air concentrations above the detection limit were not identified). Concentrations in surface water were used to represent exposures to drinking water. Concentrations in soil were used to represent exposures to both outdoor soil and indoor dust (which contains tracked-in soil). Default exposure factors, namely water consumption rates, inhalation rates, body weights and soil and dust ingestion rates were obtained from Health Canada (1998) and Wilson et al. (2013). For each Mackay Type 1 discrete organic, the highest total environmental intake estimate, from among the three modes-of-entry and two age groups, was used for comparison with the TTC value. For those discrete organics that were not Mackay Type 1, theoretical environmental intake estimates were calculated (see next section for further information). For those substances that are mixtures or UVCBs, intakes for each of the representative structures were compared to each structure’s TTC value. If any discrete organic or UVCB representative structure had an intake exceeding the corresponding TTC value, that discrete organic or UVCB would generally warrant further assessment beyond this TTC-based approach. However, for those substances where intakes were found to exceed the TTC value, and for which direct exposures did

19
not exceed the TTC value (see Section 4.2 for direct exposures), refinements to the conservative modelling assumptions used in ChemCAN v6.00 were considered where possible. Such refinements included use of a sewage treatment plant (STP) removal fraction and use of empirical degradation half-lives from the literature.
Estimation of environmental exposures for non-Mackay Type 1 substances
Theoretical environmental intake estimates were generated for non-Mackay Type 1 substances. First, using ChemCAN v6.00 results, ratios of the highest total human intake estimates to emission volumes were calculated for each Mackay Type 1 substance or representative structure and evaluated using the TTC-based approach. These ratios were used to establish how “sensitive” each intake estimate was to the volumes released. The highest ratio among all of the Mackay Type 1 substances and structures was conservatively selected as a “worst-case” ratio, namely 3.42E-7 (µg/kg bw/day) per (kg substance released/year). This worst-case ratio represents the substance or representative structure from this group with the greatest potential for exposure to the general population per unit emission, namely CAS RN 68603-15-6. The worst-case ratio identified above was used to calculate the theoretical environmental intake of each non-Mackay Type 1 substance or structure by multiplying it with the total volumes in commerce. While the ratio was based on Mackay Type 1 substances, it was deemed reasonably conservative for use with non-Mackay Type 1 substances given that it was a worst-case ratio. However, it is acknowledged that this ratio is based on a subset of all the possible Mackay Type 1 substances in the chemical universe. As such, it cannot be precluded that some Mackay Type 1 organic substances outside those evaluated in this TTC-based approach may have even higher ratios.
4.2 Exposure from Use of Products
Direct exposure to the general population may result from the use of a chemical substance that is sold or made available to Canadians for their use, either directly or as part of a mixture, in product or manufactured item. Substances examined in this approach were associated with a narrow range of uses, including those used primarily in industrial processes and substances found in low concentrations in products (i.e., concentrations less than 5%), considered to result in lower levels of exposure to the general population (e.g., lubricants and food packaging). The main product uses that were examined in this TTC-based approach include use as fragrance ingredients in cosmetics, food (food flavourings and food packaging), and consumer products such as lubricants and adhesives. The primary route of exposure to substances in consumer product and cosmetic scenarios included in this approach was dermal. Dermal factors were applied when refinement of dermal exposure estimates was considered appropriate (see Table B-4 for direct exposure estimates and dermal factors). Substances used as fragrance ingredients in cosmetic products

20
In this TTC-based approach, cosmetic product uses were limited to substances used as fragrance ingredients. Substances used as fragrances are present in cosmetic products at low concentrations and result in exposure estimates that are relevant for comparison to TTC values.
Concentrations of fragrance mixtures (i.e., mixtures of individual fragrance ingredients) in cosmetic products have been reported to range from 0.3 to 2% in various product types. Levels higher than 2% were noted to be in highly fragranced products such as perfume extracts, eau de toilette and fragranced cream. Products such as shower gel and some bath products were noted to have concentrations >1 to 2% whereas antiperspirants/deodorants, hair sprays, shampoos, body lotions and face creams were noted to have concentrations of fragrance mixtures at 1% or less (Cadby et al. 2002). Industry surveys have examined concentrations of individual substances in fragrance mixtures in cosmetic products; however, these values are not publicly available. To estimate the concentration of a fragrance ingredient in a cosmetic product, a default assumption of 10% individual substance in a fragrance mixture was applied when no substance-specific information was available. The 10% default is based on individual ingredients in fragrance mixtures noted in household cleaning products (Basketter et al., 2015); however, in some cases, when a substance-specific recommended maximum value of fragrance ingredient within a fragrance mixture was found to be less than 10%, this recommended value was used instead of the default value. To calculate the amount of substance in a cosmetic product, the concentration of the individual substance in the fragrance mixture (default of 10%) is combined with an assumed value of 1% of fragrance mixture in a given cosmetic product (intended to represent a moderately fragranced product such as body lotion). Based on these assumptions, a substance used as a component of a fragrance mixture was estimated to be present at 0.1% in cosmetic products. Substances used within fragrance mixtures may not be specifically identified in individual cosmetic products. A representative product scenario with high dermal exposure estimates (i.e., body lotion) was used with the fragrance concentration to derive a dermal exposure estimate for substances considered to be used as fragrance ingredients in cosmetic products. The dermal exposure estimate to a fragrance ingredient in a body lotion product (µg/kg bw/day) was based on the following algorithm:
{𝑎𝑚𝑜𝑢𝑛𝑡 𝑜𝑓 𝑝𝑟𝑜𝑑𝑢𝑐𝑡 𝑎𝑝𝑝𝑙𝑖𝑒𝑑 (𝑚𝑔) × 𝑐𝑜𝑛𝑐. 𝑜𝑓 𝑠𝑢𝑏𝑠𝑡𝑎𝑛𝑐𝑒 (%) ×𝑓𝑟𝑒𝑞
𝑑𝑎𝑦×
1000 𝑢𝑔
𝑚𝑔} 𝑏𝑤⁄ (𝑘𝑔)
The following parameters were used: amount of product applied (4 grams/event), frequency of 1.1 events/day, default concentration of 0.1% (substance as fragrance in product) and body weight of 70.9 kg. As noted above, refinements to the exposure estimate were applied using dermal factors as appropriate.
Food
Substances included in this approach were associated with the following food uses:

21
o Food flavouring; and o Food packaging.
Food flavourings are registered in Canada similar to other non-additive food ingredients. In general, flavourings can be used in unstandardized and in standardized foods which have a compositional standard in the Food and Drug Regulations (FDR) that permits the use of the flavouring. In some cases, the FDR identifies the flavouring that is, or is not, permitted in the standardized food. The FDR also contains compositional standards for various flavouring preparations. Canada does not have a list of permitted flavouring agents. However, the FDR does identify certain substances that are prohibited for use in foods, including some substances that could be used for flavouring. And, the use of a food flavouring, like any other substance used in food manufacture, must not result in a violation of section 4 of the Food and Drugs Act (F&DA). Section 4 of the F&DA prohibits the sale of a food that contains a poisonous or harmful substance.
Evaluations from the Joint FAO/WHO Expert Committee on Food Additives (JECFA) are available for several of the substances; many of these evaluations include estimates of intake. When a JECFA evaluation identified an intake value representing the US, this value was used to characterize exposure of the Canadian general population and compared to the TTC value.
Some flavouring compendia may indicate a reported use of a substance that could potentially be used as a flavour in foods but for which no JECFA evaluation is available. Where available, per capita estimates of intake available from the US were used to characterize potential exposure and were compared to the TTC values.
In the case of substances used in food packaging, intake values were derived for uses with potential for direct contact with food. The probable daily intake (PDI) is an estimate of the amount of a substance/chemical that could be consumed in the diet on a daily basis. In deriving PDIs for chemical exposure from food contact materials, Health Canada's Food Directorate considers the analytical migration data in conjunction with distribution of the types of food packaging materials, market share and available food consumption data. In the absence of analytical migration data on a chemical that has been used in food packaging materials, conservative assumptions are used to estimate an upper-bound dietary exposure scenario.
Consumer products
Consumer products considered in this approach included products such as lubricants and adhesives. Dermal exposure was considered to be the primary route of exposure, was assumed to occur during application of the product and was estimated using the following algorithm:
(𝑎𝑚𝑜𝑢𝑛𝑡 𝑜𝑓 𝑝𝑟𝑜𝑑𝑢𝑐𝑡 𝑐𝑜𝑛𝑡𝑎𝑐𝑡𝑖𝑛𝑔 𝑠𝑘𝑖𝑛 (𝑚𝑔) ∗ 𝑐𝑜𝑛𝑐 𝑜𝑓 𝑠𝑢𝑏𝑠𝑡𝑎𝑛𝑐𝑒 (%) ∗1000 𝑢𝑔
𝑚𝑔 ) 𝑏𝑤 (𝑘𝑔)⁄

22
In cases where a concentration of a substance in a product was unknown, an assumption of concentration was made based on available information.
The consumer products included in this approach were considered to have intermittent exposure (e.g., lubricants and adhesives). Current uses of the TTC are primarily for lifetime human exposure assessments (EFSA/WHO 2016). In cases when a substance does not have a genotoxicity alert, EFSA (2012) has noted that the current TTC values for non-cancer endpoints are derived from databases that do not address effects from acute exposure. EFSA (2012) recommends that application to shorter durations of exposure be addressed case-by-case.
In this TTC-based approach, Cramer class TTC values for substances were compared directly with per event exposure estimates for scenarios considered to be intermittent (e.g., lubricants used once to a few times per year). This conservative approach is intended to address potential effects that may occur as a result of exposures during critical periods of development and is based on the EFSA (2012) conclusion that the TTC values for Cramer classes I and III are considered sufficiently protective for adverse effects on reproduction or development.
For substances with structural alerts for genotoxicity and intermittent exposure, lifetime average daily dose (LADD) values were calculated based on the number of days per year the product is expected to be used. Non-cancer endpoints (e.g., addressing potential effects that may occur as a result of exposures during critical periods of development) should also be considered for these substances; therefore, the per event exposure estimate was also compared to the Cramer class TTC value for these substances.
5.0 Uncertainties in the TTC-based Approach
Assigning TTC values
A source of uncertainty for assigning genotoxic TTC values relates to confidence in predictive models for genotoxicity. The confidence in the prediction is influenced by the applicability domain of the models. If the prediction for a given model-substance pair is classified as out of the applicability domain by the model, this does not necessarily mean that the prediction is not valid, or is incorrect. It indicates that the uncertainty about the reliability of the model is increased, as the training and/or validation datasets might not be applicable to the specific substance.
If a predicted positive substance is classified as out of the model domain for both genotoxicity models used in the approach, then there is increased uncertainty associated for the assignment of a genotoxic TTC value for the substance. If the substance is in the applicability domain of at least one model and is predicted positive, there is confidence in the prediction that the substance may be positive in at least one modelled test. In these cases, there is less uncertainty in the assignment of a genotoxic

23
TTC value. For substances that are predicted negative in both models, there is increased uncertainty in the prediction if the substance is not in the domain of both models. The details regarding model applicability domains for each substance for the genotoxicity determination are presented in Appendix B (Table B-1).
A source of uncertainty for applying the TTC value for non-genotoxic substances based on Cramer classification relates to how well represented, with respect to chemical space, a particular candidate chemical is within the Munro data set used to derive the thresholds. The European Commission Joint Research Centre has explored the chemical space issue within the Munro dataset and how representative it is of the broader “world of chemicals” with a particular focus on cosmetic chemicals. They found that the Munro dataset is broadly representative of the chemical space of cosmetics (EC 2012b). The EFSA/WHO Workshop Report also concludes that the current database underpinning the TTC approach has been evaluated and found to sufficiently cover a wide range of chemicals (EFSA/WHO 2016).
In order to examine how well a candidate substance is represented within the chemical space of the Munro dataset, two chemical space elements are examined.
1) The modelled physicochemical properties for the candidate substance are compared with the range of modelled physicochemical properties of the chemicals within the Munro dataset. The Munro dataset was characterised (Table3-3) in terms of a few key physicochemical properties [similar to as described in EC (2012b)] representing size (molecular weight), shape (diameter, number of rotatable bonds), partitioning behaviour [(logKow/logD and topological polar surface area (TPSA)] and reactivity [Highest Occupied Molecular Orbital (HOMO) and Lowest Unoccupied Molecular Orbital (LUMO) energies] using ACD Percepta and OECD QSAR Toolbox (v3.3)(MOPAC 7 Stewart, J.J.P. Stewart Computational Chemistry; OASIS diameter calculator) (ACD c1994-2015; OECD 2015). Table 3-3 Characterization of key physicochemical properties for the chemicals within the Munro dataset
Property Min 5th percentile
Median 95th percentile
Max
Molecular Weight (Da)b
30 85 219 501 1135
Diameter - min (Å)a 2.9 3.2 4.9 6.7 8.1
Diameter - max (Å)a 4.68 6.96 11.9 20 52.5
LogKowb -7.52 -1.5 2.3 6.3 15.3
LogD (at pH 7)b -9.52 -4.3 1.9 6.2 15.3
Number of rotatable bondsb
0 0 3 11 39
TPSAb 0 0 49.3 179.2 554.1
HOMO energy (eV)a -17.8 -11.6 -9.6 -8.1 -2.3
LUMO energy (eV)a -9.4 -1.8 -0.3 1.5 3.8 a
Calculated with OECD Toolbox (v3.3) (MOPAC 7 Module (Stewart, J.J.P. Stewart Computational Chemistry); OASIS diameter calculator) b ACD Percepta (c1994-2015) – PhysChem Profiler

24
If the candidate substance has properties that are outside the maximum and minimum range defined by the chemicals in the Munro dataset it is considered out of domain (Appendix B; Table B-2). Out of the 59 structures that were assigned a TTC value based on Cramer classification, 58 have all described physicochemical properties within the range of the Munro dataset. 2) The chemical substructures and features (i.e., chemotypes) of a candidate substance are compared with those in the Munro dataset. The software ChemoTyper (Yang et al. 2015), which uses the publically available ToxPrint chemotypes, was used to generate a molecular fingerprint for the candidate chemicals and the Munro dataset chemicals to compare chemical features across the two sets of substances. ToxPrint chemotypes contain a set of chemical features and rules derived from various toxicity prediction models and safety assessment guidelines within the US FDA and other agencies and industries (Yang et al. 2015). Where an identified ToxPrint chemotype on a candidate substance was not found within the ToxPrint chemotypes for substances of the Munro dataset it is considered out of domain (Appendix B; Table B-2). Out of the 59 structures that were assigned a TTC value based on Cramer classification, 50 have all identified chemotypes covered by the Munro dataset. When a candidate substance is considered to be out of domain based on either of the two comparisons described above, there is greater uncertainty in applying the TTC approach as these substances may not be well represented within the chemical space of the Munro dataset. A further analysis was conducted for comparative purposes in order to examine the nearest neighbour in the Munro dataset for each relevant candidate substance based on the observed ToxPrint chemotypes. The ToxPrint fingerprints for the candidate and Munro substances were converted to a bit vector to represent the substance (a string of 1s and 0s based on the presence/absence of each of the ToxPrint chemotypes) using the applicable node in the software KNIME (version 2.11.2) (KNIME 2015). The Similarity Search node in KNIME was then used to search for the most similar Munro chemical for each candidate substance based on the Tanimoto distance metric (calculated using the ToxPrint derived bit vector). The nearest neighbour for each candidate substance in the Munro dataset using this approach is presented in Appendix B (Table B-2).
Estimating exposure
The exposure estimates associated with use of products are based on the dermal route of exposure whereas the TTC dataset is based on oral exposures; the application of the dermal factors (outlined in Table B-4) is considered conservative while still reflecting key parameters influencing exposure via the dermal route.

25
The exposure estimates for substances used as fragrances in cosmetics incorporates assumptions of concentration of fragrances in products and a representative product scenario with high dermal exposure (i.e., body lotion). This approach is considered conservative particularly for less common fragrance ingredients.
Exposure estimates for flavourings include JECFA evaluations dated prior to 2009. JECFA has recognised that the maximum survey-derived intake (MSDI) method it used up until 2009 may significantly underestimate dietary exposure to some flavouring agents, such as those consumed by less than 10% of the population, especially where they might be used in a few food categories, and for flavouring agents with an uneven distribution of dietary exposure among consumers. In this approach, the use of an intake value based on the MSDI approach was limited to very few substances (i.e., 5). The estimated intake values were well below the TTC value.
6.0 Results
Based on the method described above, 89 substances of the 237 considered in this approach were found to be associated with direct or indirect exposure lower than their associated TTC value. Therefore, these substances are not considered to be a concern for human health at current levels of exposure.
The remaining 148 substances were either excluded from the TTC approach (based on exclusion criteria outlined in Section 3.1) or exposure estimates were above the assigned TTC value. These substances will undergo further assessment under separate initiatives.
An assessment of the 89 substances, conducted under sections 68 and/or 74 of CEPA, will be published at a later date Appendix B includes a list of these 89 substances, including their associated TTC value, and exposure estimates.

26
References
ACD/Percepta [Prediction Module]. c1997-2015. Toronto (ON): Advanced Chemistry Development. Available from: www.acdlabs.com/products/percepta/ [ACToR] Aggregated Computational Toxicology Resource. 2013- . Washington (DC): US Environmental Protection Agency. Available from: https://actor.epa.gov Aronson D, Boethling R, Howard P, Stiteler W. 2006. Estimating biodegradation half-lives for use in chemical screening. Chemosphere 63: 1953-1960. Ashby J, Tennant R.W. 1991. Definitive relationships among chemicalstructure, carcinogenicity, and mutagenicity for 301 chemicals tested by the US NTP. Mutation Research 257: 229–306. Barlow S. 2005. Threshold of toxicological concern (TTC). ILSI Europe Concise Monograph Series. p.1–31. Available from: http://ilsi.eu/wp-content/uploads/sites/3/2016/06/C2005Thres_Tox.pdf Barlow SM, Kozianowski G, Wurtzen, Schlatter J. 2001. Threshold of toxicological concern for chemical substances present in diet. Report of a workshop held on 5–6 October 1999 in Paris, France organised by the ILSI Europe Threshold of Toxicological Concern Task Force. Food Chem Toxicol 39:893-905. Basketter DA, Lemoine S, McFadden JP. Skin sensitisation to fragrance ingredients: is there a role for household cleaning/maintenance products? 2015. Eur J Dermatol 25(1):7-13. Bernauer U, Heinemeyer G, Heinrich-Hirsch B, Ulbrich B, Gundert-Remy U. 2008. Exposure-triggered reproductive toxicity testing under the REACH legislation: a proposal to define significant/relevant exposure. Toxicology Letters 176:68–76. Beyer A, Wania F, Gouin T, Mackay D, Matthies M. 2002 Selecting internally consistent physicochemical properties of organic compounds. Environ Toxicol Chem 21(5):941–953. Bhatia S, Schultz T, Roberts D, Shen J, Kromidas L, Api AM. 2014. Comparison of cramer classification between Toxtree, the OECD QSAR Toolbox and expert judgment. Reg Tox Pharmacol 71:52-62. Bitsch A, Jacobi S, Melber C, Wahnschaffe U, Simetska N, Mangelsdorf I. 2006. REPDOSE: a database on repeated dose toxicity studies of commercial chemicals—a multifunctional tool. Reg Toxicol Pharmacol 46:202–210. Blackburn K, Stickney JA, Carlson-Lynch HL, McGinnis PM, Chappell L, Felter SP. 2005. Application of the threshold of toxicological concern approach to ingredients in personal and household care products. Reg Toxicol Pharmacol 43:249–259.
Boethling RS, Howard PH, Beauman JA, Larosche ME. 1995. Factors for intermedia extrapolations in biodegradability assessment. Chemosphere 30(4):741–752. Burdock GA. 2009. Fenaroli’s Handbook of Flavor Ingredients. Sixth Edition. CRC Press.
Cadby PA, Troy WR, Vey MGH. 2002. Consumer Exposure to Fragrance Ingredients: Providing Estimates for Safety Evaluation. Reg Toxicol Pharmacol 36:246-252. Canada. 1999. Canadian Envronmental Protection Act, 1999. S.C., 1999, c. 33. Available from: http://laws-lois.justice.gc.ca/PDF/C-15.31.pdf [Canada] Canada, Dept. of the Environment, Dept. of Health. 2006. Canadian Environmental Protection Act, 1999: Notice with respect to selected substances identified as priority for action. Canada Gazette,

27
Part I, vol. 140, no. 9, p. 435–459. Available from: http://publications.gc.ca/gazette/archives/p1/2006/2006-03-04/pdf/g1-14009.pdf Canada. 2009. Canadian Environmental Protection Act, 1999: Notice with respect to certain inanimate substances (chemicals) on the Domestic Substances List, Canada Gazette, Part I 143(40): Oct 3. Available from: http://publications.gc.ca/gazette/archives/p1/2009/2009-10-03/pdf/g1-14340.pdf Canada. 2012. Canadian Environmental Protection Act, 1999: Notice with respect to certain inanimate substances (chemicals) on the Domestic Substances List 146(48):1 December. Available from: http://publications.gc.ca/collections/collection_2012/gazette/SP2-1-146-48.pdf Canada. 2014. Draft results from Phase Two of the Domestic Substances List Inventory Update. Environment Canada: Gatineau (QC).
Carthew P, Clapp C, Gutsell S. 2009. Exposure based waiving: the application of the toxicological threshold of concern (TTC) to inhalation exposure for aerosol ingredients in consumer products. Food Chem Toxicol 47:1287–1295. Cheeseman MA, Machuga EJ, Bailey AB. 1999. A tiered approach to threshold of regulation. Food Chem Toxicol 37:387–412. ChemIDplus. 1993. ChemIDplus Advanced. Bethesda (MD): National Library of Medicine (US). Available from: www.chem.sis.nlm.nih.gov/chemidplus/ [ChemCAN]. 2003. ChemCAN: Level III fugacity model of regional fate of chemicals [Internet]. Version 6.00. Peterborough (ON): The Canadian Centre for Environmental Modelling and Chemistry, Trent University. Available from: http://www.trentu.ca/academic/aminss/envmodel/models/CC600.html Cimino MC. 2006. Comparative overview of current international strategies and guidelines for genetic toxicology testing for regulatory purposes. Environ Mol Mutagen 47(5):362-390. [ConsExpo] Consumer Exposure Model. 2006. Version 4.1. Bilthoven (NL): Rijksinstituut voor
Volksgezondheid en Milieu [National Institute for Public Health and the Environment].
http://www.rivm.nl/en/Topics/C/ConsExpo#tcm:13-42840.
[CPCat] Chemical and Product Categories [database on the inventory]. 2014..U.S. Environmental Protection Agency. Available from: http://actor.epa.gov/cpcat/faces/home.xhtml [CPDB] The Carcinogenic Potency Database [database]. [modified 2007].Berkley Lab, University of
California. http://toxnet.nlm.nih.gov/cpdb/
Cramer GM, Ford RA, Hall RL. 1978. Estimation of toxic hazard – a decision tree approach. Food Cosmet Toxicol 16:255–276. Danish Ministry of Environment – Environmental Protection Agency. 2011. The threshold of toxicological concern (TTC) concept: Development and regulatory applications. Environmental Project No. 1359 2011. Available from: http://www2.mst.dk/udgiv/publications/2011/03/978-87-92708-86-1.pdf Denmark. 2014. Danish surveys on chemicals in consumer products, Ministry of Environment and Food, The Danish Environment Protection Agency. http://eng.mst.dk/topics/chemicals/consumers--consumer-products/danish-surveys-on-consumer-products/ Dewhurst I, Renwick AG. 2013. Evaluation of the Threshold of Toxicological Concern (TTC) – Challenges and approaches, Regulatory Toxicology and Pharmacology 65(1):168-177.

28
Dolan DG, Naumann BD, Sargent EV, Maier A, Dourson M. 2005. Application of the threshold of toxicological concern concept to pharmaceutical manufacturing operations. Reg Toxicol Pharmacol 43:1–9. Eastmond DA, Hartwig A, Anderson D, Anwar WA, Cimino MC, Dobrev I, Douglas GR, Nohmi T, Phillips DH, Vickers C. 2009. Mutagenicity testing for chemical risk assessment: update of the WHO/IPCS harmonized scheme. Mutagenesis 24(4): 341-349. [EAFUS] Everything Added to Food in the United States [Internet]. 2013. U.S. Food and Drug Administration; [cited 2015 November]. Available from: http://www.accessdata.fda.gov/scripts/fcn/fcnNavigation.cfm?rpt=eafusListing [EC] European Commission. 2012. Opinion on use of the threshold of toxicological concern (TTC) approach for human safety assessment of chemical substances with focus on cosmetic and consumer products. Health and Consumer Directorate, Brussels. Available from: http://ec.europa.eu/health/scientific_committees/consumer_safety/docs/sccs_o_092.pdf [EC] European Commission. 2012b. Applicability of the threshold of toxicological concern (TTC) approach to cosmetics – preliminary analysis. Joint Research Council, Ispra, Italy. Available from: http://bookshop.europa.eu/is-bin/INTERSHOP.enfinity/WFS/EU-Bookshop-Site/en_GB/-/EUR/ViewPublication-Start?PublicationKey=LBNA25162 [ECETOC] European Centre for Ecotoxicology and Toxicology of Chemicals. 2010. Guidance an Assessment Factors to Derive a DNEL. Brussels, Belgium. Available from: http://members.ecetoc.org/Documents/Document/20110131112906-ECETOC_Technical_Report_110.pdf [EFSA] European Food Safety Authority. 2012. Scientific opinion on exploring options for providing advice about possible human health risks based on the concept of Threshold of Toxicological Concern (TTC). EFSA Journal 10(7):2750. Available from: http://www.efsa.europa.eu/sites/default/files/scientific_output/files/main_documents/2750.pdf [EFSA] European Food Safety Authority / [WHO] World Health Organisation. 2016. Review Threshold of toxicological concern (TTC) and development of new TTC decision tree. Available from: http://www.efsa.europa.eu/sites/default/files/corporate_publications/files/1006e.pdf [EMA] European Medical Agency. 2006. Guideline on the Limits of Genotoxic Impurities. Committee for Medicinal Products for Human Use (CHMP). European Medicines Agency, EMEA/CHMP/QWP/251344/2006. [EMA] European Medical Agency. 2008. Draft Guideline on the Assessment of Genotoxicity of Herbal Substances/Preparations. Committee on Herbal Medicinal Products (HMPC). European Medicines Agency, London, UK, EMEA/HMPC/107079/2007. Environment Canada. 2012. Final Results from Phase One of the Domestic Substances List Inventory Update Rapid Screening Assessment of Substances of Lower Ecological Concern – Detailed Spreadsheet. Gatineau (QC): Ecological Assessment Division, Environment Canada. Environment Canada. 2013. National pollutant release inventory [database on the Internet]. Gatineau (QC): Environment Canada. Available from: https://www.ec.gc.ca/inrp-npri/ [EPI Suite™] Estimation Programs Interface Suite for Microsoft Windows [Estimation Model]. 2012. Version 4.1. Office of Pollution Prevention and Toxics, U.S. Environmental Protection Agency: Washington D.C.; Syracuse Research Corporation: Syracuse (NY). Available at: http://www2.epa.gov/tsca-screening-tools/epi-suitetm-estimation-program-interface

29
Escher SE, Tluczkiewicz I, Batke M, Bitsch A, Melber C, Kroese, E.D., Buist, H.E, Mangelsdorf I. 2010. Evaluation of inhalation TTC values with the database RepDose. Reg Toxicol Pharmacol 58:259–274. Feigenbaum A, Pinalli R, Giannetto M, Barlow S. Reliability of the TTC approach: Learning from inclusion of pesticide active substances in the supporting database. Food and Chemical Toxicology 75: 24-38. Felter S, Lane RW, Latulippe ME, Llewellyn GC, Olin SS, Scimeca JA, Trautman TD. 2009. Refining the threshold of toxicological concern (TTC) for risk prioritization of trace chemicals in food. Food Chem Toxicol 47:2236-2245. Finizio A, Mackay D, Bidleman T, Harners T. 1997. Octanol air-partition coefficient as a predictor of partitioning of semi-volatile organic chemicals to aerosol. Atmospheric Environment 31(15):2289-2296. Geraets L, Bessems JG, Zeil MJ, Bos PM. (2014). Human risk assessment of dermal and inhalation exposures to chemicals assessed by route-to-route extrapolation: The necessity of kinetic data. Regulatory Toxicology and Pharmacology 70:54-64. Gold LS, Sawyer CB, Magaw R, Backman GM, de Veciana M, Levinson R, Hooper NK, Havender WR, Bernstein L, Peto R, Pike M, Ames BN. 1984. A carcinogenesis potency database of the standardized results of animal bioassays. Environ Health Persp 58:9-319. Gold LS, Slone TH, Bernstein L. 1989. Summary of carcinogenic potency and positivity for 492 rodent carcinogens in the carcinogenic potency database. Environ Health Persp 79:259–272. Grant RL, Kadlubar BJ, Erraguntla NK, Honeycutt M. 2007. Evaluation of acute inhalation toxicity for chemicals with limited toxicity information. Reg Toxicol Pharmacol 47:261–273. Health Canada. 1998. Exposure factors for assessing total daily intake of priority substances by the general population of Canada. Unpublished report. Ottawa (ON): Health Canada, Environmental Health Directorate.
Health Canada. 2016. Guidance on Genotoxicity Testing and Data Interpretation for Pharmaceuticals Intended for Human Use ICH Topic S2(R1). Ottawa (ON): Health Canada. Available from: http://www.hc-sc.gc.ca/dhp-mps/alt_formats/pdf/prodpharma/applic-demande/guide-ld/ich/securit/s2(r1)-step4etape-eng.pdf [ICH] International Conference on Harmonisation. 2012. Guidance for industry: S2(R1) Genotoxicity testing and data interpretation for pharmaceuticals intended for human use. International Conference on Harmonisation of Technical Requirements for Registration of Pharmaceuticals for human use. [IMS] Intercontinental Marketing Services. 2013. Health Canada Sales Database 2011 & 2012 [MIDAS database on CD]. IMS Brogan, Toronto (ON), IMS Brogan. [IPCS] International Program on Chemical Safety. 2007. Mutagenicity testing for chemical risk assessment. Harmonization project draft document for public and peer review. World Health Organization. Available from:
http://www.who.int/ipcs/methods/harmonization/areas/mutagenicity_testing_draft.pdf [JECFA] Joint FAO/WHO Expert Committee on Food Additives. 1993. Evaluation of certain food additives and contaminants. Safety evaluation of flavouring agents. Forty-first report of the Joint FAO/WHO Expert Committee on Food Additives. WHO Technical Report Series 837. World Health Organisation, Geneva, Switzerland. Available from: http://www.who.int/foodsafety/publications/monographs/en/ [JECFA] Joint FAO/WHO Expert Committee on Food Additives. 1995. Evaluation of certain food additives and contaminants. Safety evaluation of flavouring agents. Forty-fourth report of the Joint FAO/WHO

30
Expert Committee on Food Additives. WHO Technical Report Series 859. World Health Organisation, Geneva, Switzerland. Available from: http://www.who.int/foodsafety/publications/monographs/en/ [JECFA] Joint FAO/WHO Expert Committee on Food Additives. 1998. Safety Evaluation of Certain Food Additives and Contaminants. WHO Food Additives Series 40: Annex 5. World Health Organisation, Geneva, Switzerland. p. 497–532. Available from: http://www.who.int/foodsafety/publications/monographs/en/ [JECFA] Joint FAO/WHO Expert Committee on Food Additives. 2000. Evaluation of Certain Food Additives and Contaminants: Fifty-fifth Report of the Joint FAO/WHO Expert Committee, Geneva, Switzerland. Available from: http://apps.who.int/iris/bitstream/10665/42388/1/WHO_TRS_901.pdf [JECFA] Joint FAO/WHO Expert Committee on Food Additives. 2003. Evaluation of Certain Food Additives and Contaminants: Sixty-First Report of the Joint FAO/WHO Expert Committee, Geneva, Switzerland. Available from: http://apps.who.int/iris/bitstream/10665/42849/1/WHO_TRS_922.pdf [JECFA] Prepared by the Sixty-third meeting of the Joint FAO/WHO Expert Committee on Food Additives. 2006. Evaluation of Certain Food Additives. WHO Food Additive Series: 54. Geneva, Switzerland. http://www.inchem.org/documents/jecfa/jecmono/v54je01.pdf) Kalkhof H, Herzler M, Stahlmann R, Gundert-Remy U. 2011. Threshold of toxicological concern values for non-genotoxic effects in industrial chemicals: re-evaluation of the Cramer classification. Archives of Toxicology 86: 17-25.
KNIME [Computational workflow tool]. 2015. Version 2.11.2. Zurich (CH): KNIME.COM AG. Available from: https://www.knime.org/ Kroes R, Galli CL, Munro I, Schilter B, Tran L.-A, Walker R, Wurtzen G. 2000. Threshold of toxicological concern for chemical substances present in the diet: a practical tool for assessing the need for toxicity testing. Food Chem Toxicol 38:255–312. Kroes R, Muller D, Lambe J, Lowik MRH, van Klaveren J, Kleiner J, Massey R, Mayer S, Urieta I, Verger P, Visconti A. 2002. Assessment of intake from the diet. Food Chem Toxicol 40:327–385. Kroes R, Renwick AG, Cheeseman M, Kleiner J, Mangelsdorf I, Piersma A, Schilter B, Schlatter J, van Schothorst F, Vos JG, Wurtzen G. 2004. Structure-based thresholds of toxicological concern (TTC): guidance for application to substances present at low levels in the diet. Food Chem Toxicol 42:65–83. Kroes R, Renwick AG, Feron V, Galli CL, Gibney M, Greim H, Guy RH, L’Huguenot JC, van de Sandt JJM. 2007. Application of the threshold of toxicological concern (TTC) to the safety evaluation of cosmetic ingredients. Food Chem Toxicol 45:2533–2562. Laufersweiler MC, Gadagbui B, Baskerville-Abraham IM, Maier A, Willis A, Scialli AR, Carr GJ, Felter SP, Blackburn K, Daston G, 2012. Correlation of chemical structure with reproductive and developmental toxicity as it relates to the use of the threshold of toxicological concern. Regulatory Toxicology and Pharmacology 62: 160-182. Mackay D, Di Guardo A, Paterson S, Kicsi G, Cowan CE. 1996. Assessing the fate of new and existing chemicals: a five-stage process. Environ Toxicol Chem 15(9):1618-1626. Muller L, Mauthe RJ, Riley CM, Andino MM, Antonis DD, Beels C, DeGeorge J, De Knaep AG, Ellison D, Fagerland JA, Frank R, Fritschel B, Galloway S, Harpur E, Humfrey CD, Jacks AS, Jagota N, Mackinnon J, Mohan G, Ness DK, O'Donovan MR, Smith MD, Vudathala G, Yotti L. 2006. A rationale for determining, testing, and controlling specific impurities in pharmaceuticals that possess potential for genotoxicity. Reg Toxicol Pharmacol 44:198-211.

31
Munro IC, Kennepohl E, Kroes R 1999. A procedure for the safety evaluation of flavouring substances. Food Chem Toxicol 37:207–232. Munro IC, Ford RA, Kennepohl E, Sprenger JG. 1996. Correlation of structural class with no-observed effect levels: A proposal for establishing a threshold of concern. Food Chem Toxicol 34:829–867. Munro IC. 1990. Safety assessment procedures for indirect food additives: An overview: Report of a workshop. Reg Toxicol Pharmacol 12:2–12. [NHPID] Natural Health Products Ingredients Database [database on the internet]. 2016. Health Canada, Government of Canada; [Accessed July 2016]. Available from: http://webprod.hc-sc.gc.ca/nhpid-bdipsn/search-rechercheReq.do
OASIS Pipeline Profiler [Computational workflow tool]. 2015. Version 1.0.52.1. Bourgas (BG): Bourgas Prof. Assen Zlatarov University, Laboratory of Mathematical Chemistry. OECD QSAR Toolbox. [Read across tool]. 2015. Version 3.3. Paris (FR): Organisation for Economic Co-oporation and Development, Environment Directorate.Available from : http://www.oecd.org/chemicalsafety/risk-assessment/theoecdqsartoolbox.htm Pinalli R, Croera C, Thebold A, Feigenbaum A. 2011. Threshold of toxicological concern approach for the risk assessment of substances used for the manufacture of plastic food contact materials. Trends in Food Sci 22:523-534.
Renwick AG.1993. Data‐derived safety factors for the evaluation of food additives and environmental contaminants. Food Additives & Contaminants 10(3):275-305. Roberts DW, Aptula A, Schultz TW, Shen J, Api AM, Bhatia S, Kromidas L. 2015. A practical guidance for cramer class determination. Reg Tox Pharmacol 1-14 (In press). Rulis AM. 1989. Establishing a threshold of regulation. In: Bonin, J.J., Stevenson, D.E. (Eds.), Risk Assessment in Setting National Priorities. Plenum Publishing Corporation. p. 271–278. Rulis AM. 1986. De minimis and the threshold of regulation. In: Felix, C.W. (Ed.), Food Protection Technology. Lewis Publishers. p. 29–37. Safford RJ, Aptula AO, Gilmour N. 2011. Refinement of the dermal sensitisation threshold (DST) approach using a larger dataset and incorporating mechanistic chemistry domains. Reg Toxicol Pharmacol 60:218–224. Safford RJ. 2008. The dermal sensitisation threshold—a TTC approach for allergic contact dermatitis. Reg Toxicol Pharmacol 51:195–200. SCCS, SCHER, SCENIHR. 2012. Joint Opinion on the Use of the Threshold of Toxicological Concern (TTC) Approach for Human Safety Assessment of Chemical Substances with focus on Cosmetics and Consumer Products, 8 June 2012. Schüümann G, Ebert R-U, Tluczkiewicz I, Escher S, Kühne R., 2016. Inhalation threshold of toxicological concern (TTC) – Structural alerts discriminate high from low repeated-dose inhalation toxicity. Environment International 88:123-132. [TIMES] TIssue MEtabolism Simulator [Prediction module]. 2015. Version 2.27.17. Bourgas (BG): Bourgas Prof. Assen Zlatarov University, Laboratory of Mathematical Chemistry. [cited 2015 December 7]. Available from: www.oasis-lmc.org/?section=software&swid=4

32
Tluczkiewicz I, Buist HE, Martin MT, Mangelsdorf I, Escher SE. 2011. Improvement of the Cramer classification for oral exposure using the database TTC RepDose – A strategy description Regulatory Toxicology and Pharmacology 61: 340–350.
Toxtree [Prediction module]. 2015. Version 2.6.13. Bourgas (BG): IDEAconsult Ltd. Available from: http://toxtree.sourceforge.net/download.html#Toxtree_2.6.13 [US FDA] Food and Drug Administration.1995. Federal Register Food Additives; Threshold of Regulation for substances used in food contact articles. Department of Health and Human Services, Food and Drug Administration, 21 CFR Parts 5, 25, 170,171, and 174. Docket Nos 77P-0122, 92N-0181. Available from: http://www.gpo.gov/fdsys/pkg/FR-1995-07-17/pdf/95-17435.pdf [US FDA] Food and Drug Administration. 2001. 21 CFR, Ch.I, Subpart B. Food Additive Safety, 170.20, 170.22, 170.30. Available from: http://www.ecfr.gov/cgi-bin/retrieveECFR?gp=&r=PART&n=21y3.0.1.1.1#sp21.3.170.b [US FDA] Food and Drug Administration. 2015. M7 Assessment and Control of DNA Reactive (Mutagenic) Impurities in Pharmaceuticals to Limit Potential Carcinogenic Risk Guidance for Industry. Available from: http://www.fda.gov/downloads/drugs/guidancecomplianceregulatoryinformation/guidances/ucm347725.pdf Van Ravenzwaay B, Dammann M, Buesen R, Schneider S. 2011. The threshold of toxicological concern for prenatal developmental toxicity. Reg Toxicol Pharmacol 59:81–90. [VKM] Norwegian Scientific Committee for Food Safety. 2006. Present and suggested use of the Threshold of Toxicological Concern (TTC) principle in areas of risk assessment relevant for the Norwegian Scientific Committee for Food Safety (VKM). Opinion of the Ad hoc working group for evaluation of the use of the Threshold of Toxicological Concern (TTC) principle in risk assessments performed by the Norwegian Scientific Committee for Food Safety. [WHO] World Health Organization. 1995. Evaluation of certain food additives and contaminants (Forty-fourth report of the Joint FAO/WHO Expert Committee on Food Additives). WHO Technical Report Series 859. Geneva, Switzerland. [WHO] World Health Organization. 1997. Evaluation of certain food additives and contaminants (Forty-sixth report of the Joint FAO/WHO Expert Committee on Food Additives). WHO Technical Report Series 868. Geneva, Switzerland. [WHO] World Health Organization. 2000. Evaluation of certain food additives. WHO Technical Report Series 891. Geneva, Switzerland. Available from: http://www.who.int/foodsafety/publications/jecfa-reports/en/ Williams FM. 2008. Potential for metabolism locally in the skin of dermally absorbed compounds. Human Experimental Toxicology 27:277-280. Williams FM, Rothe H, Barrett G, Whyte J, Chiodini A, Cronin MT, Monteiro-Riviere N, Plautx J, Roper C, Westerhout J, Yang C, Guy RH. 2016. Assessing the safety of cosmetic chemicals: considerations of a flux decision tree to predict dermally delivered systemic dose for comparison with oral TTC (Threshold of Toxicological Concern). Toxicology and Pharmacology. In press: accepted manuscript [not currently available online]. Wilson R, Jones-Otazo H, Petrovic S, Mitchell I, Bonvalot Y, Williams D, Richardson GM. 2013. Revisiting dust and soil ingestion rates based on hand-to-mouth transfer. Human and Ecological Risk Assessment 19(1):158-188.

33
Won D, Lusztyk E. 2011. Data gathering on chemicals released to indoor air of residences from building materials and furnishings. NRC-Institute for Research in Construction Report no. B3332.2. Prepared for Health Canada, Ottawa, ON. Yang C, Tarkhov A, Marusczyk J. 2015. New publicly available chemical query language, CSRML to support chemotype representations for application to data mining and modeling. J Chem Inf Model 55(3):510-528. Zhu J, Wong S, Cakmak S. 2013. Nationally representative levels of selected volatile organic compounds in Canadian residential indoor air: population-based survey. Environ Sci Technol 47:13276-13283.

34
Appendix A - TTC Decision Tree Proposed by Kroes et al. (2004).

35
Appendix B – Results of the Approach
Table B-1 Assigned TTC values and associated data and predictions for candidate substances associated with direct or indirect exposure lower than their associated TTC value
CAS RN TTC µg/kg bw/d
GT Call (Basis)
GT SB1
GT SB2
GT SB3
TIMES GT
Ames with S9
TIMES GT
CA with S9
CC
50-48-6 0.0025 P(M) N ND ND N(O) P(O) N/A
60-24-2 30 N(E/M) N N N N(I) N(I) 1
64-86-8 0.0025 P(E) N P P N/A N/A N/A
77-47-4 0.0025 P(E) N P Eq N/A N/A N/A
78-67-1 1.5 N(E/M) N N ND N(I) N(I) 3
79-74-3 30 N(M) ND ND ND N(O)N N(O)N 1
85-42-7 1.5 N(M) ND ND ND N(O)N N(O)N 2
87-66-1 0.0025 P(E) P ND P N/A N/A N/A
92-70-6 1.5 N(E) N P N N/A N/A 3
101-37-1 1.5 N(E) N N N P(O)P P(O)P 3
103-24-2 30 N(E/M) N N ND N(I)N N(I)N 1
111-55-7 0.0025 P(M) ND ND ND P(I)P P(I)P N/A
111-96-6 30 N(E/M) N ND ND N(I)N N(I)N 1
112-49-2 0.0025 P(E) P ND ND N/A N/A N/A
118-96-7 0.0025 P(E) P ND N N/A N/A N/A
120-11-6 1.5 N(E) N ND N N(I) P(O) 3
120-24-1 30 N(E) N ND N N(I) P(O) 1
120-54-7 1.5 N(M) ND ND ND N(O)N N(O)N 3
121-91-5 30 N(E/M) N N ND N(O)N N(O)N 1
122-68-9 30 N(M) ND ND ND N(I)N N(O)N 1
122-79-2 0.0025 P(M) ND ND ND P(O) P(O) N/A
126-33-0 0.0025 P(E) N P ND N/A N/A N/A
132-65-0 0.0025 P(M) ND ND ND N(O)N P(O)P N/A
133-14-2 0.0025 P(E) P N ND N/AN/A N/AN/A N/A
288-88-0 1.5 N(M) ND ND ND N(O)N N(O)N 3
614-45-9 0.0025 P(E) P P Eq N/AN/A N/AN/A N/A
632-51-9 1.5 N(M) ND ND ND N(O) N(O) 3
793-24-8 1.5 N(E) N N N P(I)P P(I)P 3
2379-79-5 0.0025 P(M) ND ND ND P(O)P P(O)P N/A
2398-96-1 0.0025 P(M) ND ND ND N(O)N P(O)P N/A
3006-86-8 1.5 N(E/M) N N ND N(I)N N(I)N 3
3081-14-9 1.5 N(E/M) N N ND N(I)N N(I)N 3
3327-22-8 0.0025 P(M) ND ND ND P(O)P P(O)P N/A
3851-87-4 30 N(E/M) N N ND N(O)N N(O)N 1
4979-32-2 0.0025 P(E) N P ND N/AN/A N/AN/A N/A

36
CAS RN TTC µg/kg bw/d
GT Call (Basis)
GT SB1
GT SB2
GT SB3
TIMES GT
Ames with S9
TIMES GT
CA with S9
CC
5285-60-9 1.5 N(M) ND ND ND N(I)N N(I)N 3
6858-49-7 0.0025 P(M) ND ND ND N(O)N P(O)P N/A
8001-04-5a 1.5 N(M) ND ND ND N(I)N N(O)N 2
8016-81-7a 1.5 N(E/M) N N ND N(O)N N(O)N 3
13082-47-8 0.0025 P(M) N ND ND P(O)P P(O)P N/A
13472-08-7 1.5 N(M) ND ND ND N(O)N N(O)N 3
15791-78-3 0.0025 P(E) P ND ND N/AN/A N/AN/A N/A
19720-45-7 1.5 N(M) ND ND ND N(I)N N(O)N 3
21652-27-7 1.5 N(E/M) N N ND N(I)N N(I)N 3
26266-77-3 30 N(M) ND ND ND N(O)N N(O)N 1
26544-38-7 1.5 N(E/M) N ND ND N(O)N N(O)N 3
27193-86-8 0.0025 P(M) ND ND ND N(I)N P(O)P N/A
28173-59-3 0.0025 P(M) ND ND ND P(O)P P(O)P N/A
28777-98-2 1.5 N(M) ND ND ND N(O) N(O) 3
28984-69-2 1.5 N(M) ND ND ND N(O) N(O) 3
29036-02-0 0.0025 P(M) ND ND ND N(O)N P(O)P N/A
29350-73-0 30 N(E/M) N ND ND N(I)N N(O)N 1
32072-96-1 1.5 N(M) ND ND ND N(O) N(O) 3
36437-37-3 0.0025 P(M) ND ND ND N(O) P(O) N/A
38640-62-9 0.0025 P(E) N P ND N/A N/A N/A
53894-23-8 30 N(M) ND ND ND N(I) N(I) 1
61788-72-5 1.5 N(M) ND ND ND N(I) N(O) 3
61789-01-3a 1.5 N(E/M) N ND ND N(I)N N(O)N 3
61790-28-1a 0.0025 P(M) N ND ND N(I)N P(O)P N/A
61790-29-2a 0.0025 P(M) ND ND ND N(I)N P(O)P N/A
61790-59-8 30 N(E/M) N ND ND N(I)N N(I)N 1
61790-60-1a 0.0025 P(M) ND ND ND N(I)N P(I)P N/A
61791-55-7a 1.5 N(E) N N ND N(I)N P(I)P 3
64754-95-6 1.5 N(M) ND ND ND N(O)N N(O)N 3
64800-83-5 0.0025 P(M) ND ND ND P(O)P P(O)P N/A
65277-42-1 0.0025 P(M) ND ND ND P(O)P P(O)P N/A
68082-35-9a 1.5 N(M) ND ND ND N(I)N N(O)N 3
68139-89-9a 1.5 N(M) ND ND ND N(I)N N(I)N 3
68140-48-7 1.5 N(E/M) N ND ND N(O)N N(O)N 3
68398-19-6 1.5 N(E) N N ND P(O)P P(O)P 3
68411-32-5a 1.5 N(E/M) N ND ND N(O)N N(O)N 2
68442-69-3a 1.5 N(M) ND ND ND N(I)N N(O)N 2
68515-60-6a 30 N(M) ND ND ND N(I)N N(I)N 1
68603-15-6a 30 N(E/M) N ND ND N(I)N N(I)N 1
68783-25-5a 0.0025 P(M) ND ND ND N(I)N P(I)P N/A
68783-36-8 1.5 N(E/M) N ND ND N(O)N N(O)N 3

37
CAS RN TTC µg/kg bw/d
GT Call (Basis)
GT SB1
GT SB2
GT SB3
TIMES GT
Ames with S9
TIMES GT
CA with S9
CC
68784-12-3a 1.5 N(E/M) N ND ND N(I)N N(O)N 3
68784-26-9 1.5 N(M) ND ND ND N(O)N N(O)N 3
68909-18-2a 1.5 N(E/M) N N ND N(I)N N(O)N 3
68916-97-2a 0.0025 P(E) P P EQ N/A N/A N/A
68955-53-3a 30 N(E/M) N ND N N(I)N N(I)N 1
70288-86-7a 1.5 N(M) ND ND ND N(O)N N(O)N 3
70955-34-9a 1.5 N(M) ND ND ND N(I)N N(I)N 3
71486-79-8a 1.5 N(M) ND ND ND N(O) N(O) 3
73984-93-7 1.5 N(M) ND ND ND N(O)N N(O)N 3
80584-90-3 1.5 N(M) ND ND ND N(O)N N(O)N 3
94270-86-7 1.5 N(M) ND ND ND N(O)N N(O)N 3
125328-64-5a 0.0025 P(M) ND ND ND N(I)N P(O)P N/A
174333-80-3a 1.5 N(E) N N ND N(O)N P(O)P 3 a
Mixture - Results presented are based on the component resulting in the assignment of the most conservative TTC value or where the mixture could be represented by a single structure. Abbreviations: CAS RN (Chemical Abstract Registry Number); TTC (Threshold of Toxicological Concern Value); GT (Genotoxicity); GT SB1 (Standard Battery Test 1 for Genotoxicity – a test for mutation in bacteria); GT SB2 (Standard Battery Test 2 for Genotoxicity - a cytogenetic test for chromosomal damage (i.e. an in vitro metaphase chromosome aberration test or in vitro micronucleus test), or an in vitro mouse lymphoma thymidine kinase gene mutation assay); GT SB3 (Standard Battery Test 3 for Genotoxicity - an in vivo test for genotoxicity (i.e. a test for chromosomal damage using rodent hematopoietic cells, either for micronuclei or for chromosomal aberrations in metaphase cells)); TIMES GT Ames with S9 (LMC OASIS Tissue Metabolic Simulator (TIMES) (v2.27.17) Ames mutagenicity with S9 metabolic activation model prediction (v11.11); TIMES GT CA with S9 (LMC OASIS Tissue Metabolic Simulator (TIMES) (v2.27.17) In vitro chromosomal aberrations with S9 metabolic activation model prediction (v11.11)); CC (Cramer Class); P (Positive); N (Negative); E (Empirical Data); M (Modelled Data); ND (No Data); N/A (Not Applicable); Y (Yes); Eq (Equivocal); I (In Model Applicability Domain); O (Out of Model Applicability Domain)
Table B-2. Non-genotoxic candidate substances assigned TTC value based of Cramer classification and associated chemical space analysis against substances in the Munro dataset
CAS RN
Representative Structure PC CT Munro Nearest Neighbour based on ToxPrint Chemotypes
60-24-2
I I
78-67-1
I I
79-74-3
I I

38
CAS RN
Representative Structure PC CT Munro Nearest Neighbour based on ToxPrint Chemotypes
85-42-7
I I
92-70-6
I I
101-37-1
I I
103-24-2
I I
111-96-6
I I
120-11-6
I I
120-24-1
I I
120-54-7
I O Chemotype not found in Munro: [(QQ(Q~0_S)_sulfide_di)]

39
CAS RN
Representative Structure PC CT Munro Nearest Neighbour based on ToxPrint Chemotypes
121-91-5
I I
122-68-9
I I
288-88-0
I I
632-51-9
I I
793-24-8
I I
3006-86-8
I O Chemotype not found in Munro: [OZ_oxide_peroxy]
3081-14-9
I I
3851-87-4
I O Chemotypes not found in Munro: [OZ_oxide_peroxy]

40
CAS RN
Representative Structure PC CT Munro Nearest Neighbour based on ToxPrint Chemotypes
; [alkaneBranch_isononyl_pentyl_1_1_1_3-methyl]
5285-60-9
I I
8001-04-5a
I I
8016-81-7a
I I
8016-81-7a
I I
13472-08-7
I I
19720-45-7
I I

41
CAS RN
Representative Structure PC CT Munro Nearest Neighbour based on ToxPrint Chemotypes
21652-27-7
I I
26266-77-3
I I
26544-38-7
I I
28777-98-2
I I
28984-69-2
I I
29350-73-0
I I
53894-23-8
I O Chemotype not found in Munro: [alkaneBranch_isooctyl_hexyl_2-methyl]
61788-72-5
I I
61789-01-3a
I I

42
CAS RN
Representative Structure PC CT Munro Nearest Neighbour based on ToxPrint Chemotypes
61790-59-8a
I I
61791-55-7a
O I
61791-55-7a
I I
64754-95-6
I I
68082-35-9a
I I
68139-89-9a
I I
68140-48-7a
I O Chemotypes not found in Munro: [fused_[5_6]_indane]
68398-19-6
I I

43
CAS RN
Representative Structure PC CT Munro Nearest Neighbour based on ToxPrint Chemotypes
68411-32-5a
I I
68442-69-3a
I O Chemotypes not found in Munro: [chain:aromaticAlkane_Ph-C10]
68515-60-6a
I I
68603-15-6a
I I
68783-36-8
I I
68784-12-3a
I I
68784-26-9
I O Chemotypes not found in Munro: [aromaticAlkane_Ph-C12]

44
CAS RN
Representative Structure PC CT Munro Nearest Neighbour based on ToxPrint Chemotypes
68909-18-2a
I I
68955-53-3a
I I
70288-86-7a
I I
70288-86-7a
I I
70955-34-9a
I I
71486-79-8
I I

45
CAS RN
Representative Structure PC CT Munro Nearest Neighbour based on ToxPrint Chemotypes
73984-93-7
I I
80584-90-3
I O Chemotypes not found in Munro: [ring:hetero_[5]_N_triazole_(1_2_3-)]
94270-86-7
I O Chemotypes not found in Munro: [ring:hetero_[5]_N_triazole_(1_2_3-)]
174333-80-3a
I I
a Mixture – All components shown that were given a Cramer classification or where the mixture could be represented by a
single structure. b Determined based on Tanimoto Similarity calculated using ToxPrint fingerprint (Yang et al. 2015);
Abbreviations: CMP (Chemicals Management Plan); CAS RN (Chemical Abstract Registry Number); PC (Physicochemical property check); CT (ToxPrint Chemotype check); NN (Nearest neighbour similarity check); I (the CMP substance falls within the respective ranges for the given chemical space comparison as discussed in section 5); O (the CMP substance does not fall within the respective ranges for the given chemical space comparison as discussed in section 5);

46
Table B-3. Total volumes in commerce and highest total environmental intake
estimates for select remaining categorized substances under the CMP
CAS RN TTC value (µg/kg bw/day)
Mackay Type 1?
Total volume in commerce (kg/year)A
Highest total environmental intake estimate (µg/kg bw/day)C
50-48-6 0.0025 Yes 1000-10,000D 4.49E-4I
60-24-2 30 Yes 10,000-100,000F 1.04E-4L
64-86-8 0.0025 No 100-1000E 3.42E-4
77-47-4 0.0025 Yes <100G 3.42E-5
78-67-1 1.5 Yes 10,000-100,000F 5.32E-3I
79-74-3 30 Yes <100F 1.32E-6I
85-42-7 1.5 Yes 10,000-100,000F 6.86E-4I
87-66-1 0.0025 Yes 1000-10,000G 6.92E-5I
92-70-6 1.5 Yes 10,000-100,000F 6.92E-4I
101-37-1 1.5 Yes 10,000-100,000F 3.86E-3I
103-24-2 30 Yes 100,000-1,000,000F
5.57E-3I
111-55-7 0.0025 Yes 1000-10,000F 6.31E-5I
111-96-6 30 Yes 1000-10,000H 6.92E-5I
112-49-2 0.0025 Yes 10,000-100,000G 6.92E-4I
118-96-7 0.0025 Yes 100,000-1,000,000G
8.09E-4J
120-11-6 1.5 Yes <100F 1.65E-6I
120-24-1 30 Yes <100F 8.12E-7I
120-54-7 1.5 No 100,000-1,000,000F
3.42E-1
121-91-5 30 Yes 1,000,000-10,000,000F
6.91E-2I
122-68-9 30 Yes <100F 1.57E-6I
122-79-2 0.0025 Yes <100F 8.98E-7J
126-33-0 0.0025 Yes 10,000-100,000F 6.91E-4I
132-65-0 0.0025 Yes 130,000F 8.76E-4I
133-14-2 0.0025 Yes 100-1000F 6.45E-6J
288-88-0 1.5 Yes 1000-10,000G 1.18E-4J
614-45-9 0.0025 Yes 1000-10,000F 8.68E-5J
632-51-9 1.5 Yes <100F 1.18E-6I
793-24-8 1.5 Yes 1,000,000-10,000,000G
1.65E-1I
2379-79-5 0.0025 No <100F 3.42E-5
2398-96-1 0.0025 Yes 100-1000D 1.33E-5I
3006-86-8 1.5 Yes 100,000-1,000,000F
1.95E-2I
3081-14-9 1.5 Yes 1000-10,000G 1.20E-4I

47
CAS RN TTC value (µg/kg bw/day)
Mackay Type 1?
Total volume in commerce (kg/year)A
Highest total environmental intake estimate (µg/kg bw/day)C
3327-22-8 0.0025 Yes 10,000-100,000F 6.93E-4I
3851-87-4 30 Yes 1000-10,000F 3.51E-5J
4979-32-2 0.0025 Yes 100-1000F 1.63E-5I
5285-60-9 1.5 Yes 1000-10,000F 2.54E-4I
6858-49-7 0.0025 No <100F 3.42E-5
8001-04-5 1.5 Yes <100F 1.03E-6I
8016-81-7 1.5 Yes 100,000-1,000,000F
1.18E-2K
13082-47-8 0.0025 No <100F 3.42E-5
13472-08-7 1.5 Yes 10,000-100,000F 5.33E-3I
15791-78-3 0.0025 No 100-1000F 3.42E-4
19720-45-7 1.5 Yes <100F 2.08E-6I
21652-27-7 1.5 No 1000-10,000F 3.42E-3
26266-77-3 30 Yes <100F 1.18E-6I
26544-38-7 1.5 Yes 10,000-100,000G 5.64E-4I
27193-86-8 0.0025 Yes 1000-10,000F 5.68E-5I
28173-59-3 0.0025 No 100-1000F 3.42E-4
28777-98-2 1.5 Yes 1,000,000-10,000,000G
1.11E-1I
28984-69-2 1.5 No 100-1000F 3.42E-4
29036-02-0 0.0025 Yes 10,000-100,000G 1.12E-3I
29350-73-0 30 Yes <100F 9.17E-7I
32072-96-1 1.5 Yes 100,000-1,000,000F
1.11E-2I
36437-37-3 0.0025 Yes 10,000-100,000G 1.21E-3I
38640-62-9 0.0025 Yes 10,000-100,000F 9.99E-4I
53894-23-8 30 No 10,000-100,000G 3.42E-2
61788-72-5 1.5 Yes <100F 5.38E-6I
61789-01-3 1.5 Yes 10,000-100,000F 5.27E-4I
61790-28-1B 0.0025 Yes 100,000-1,000,000F
3.38E-4I
61790-29-2B 0.0025 Yes 2,700,000F 9.09E-4I
61790-59-8 30 Yes 100,000-1,000,000F
5.64E-3I
61790-60-1 0.0025 Yes 10,000-100,000F 5.63E-4I
61791-55-7 1.5 Yes 100,000-1,000,000F
5.68E-3I
64754-95-6 1.5 No 1000-10,000F 3.42E-3I
64800-83-5 0.0025 Yes 1000-10,000F 1.02E-4I
65277-42-1 0.0025 No 1000-10,000D 1.78E-3
68082-35-9 1.5 Yes <100F 6.11E-7I

48
CAS RN TTC value (µg/kg bw/day)
Mackay Type 1?
Total volume in commerce (kg/year)A
Highest total environmental intake estimate (µg/kg bw/day)C
68139-89-9 1.5 Yes 10,000-100,000F 5.66E-4I
68140-48-7 1.5 Yes 1000-10,000F 2.30E-4I
68398-19-6 1.5 Yes 1000-10,000F 1.05E-4I
68411-32-5 1.5 Yes 100,000-1,000,000F
1.67E-2I
68442-69-3 1.5 Yes 1000-10,000F 5.60E-5I
68515-60-6 30 Yes 1000-10,000G 1.05E-4I
68603-15-6 30 Yes <100F 3.42E-5I
68783-25-5 0.0025 Yes 1000-10,000F 2.03E-4I
68783-36-8 1.5 No 10,000-100,000F 3.42E-2
68784-12-3 1.5 Yes 1,000,000-10,000,000F
1.11E-1I
68784-26-9 1.5 No 100,000-1,000,000F
3.42E-1
68909-18-2 1.5 Yes 1,000,000-10,000,000F
1.68E-1I
68916-97-2 0.0025 Yes <100F 1.08E-6I
68955-53-3 30 Yes 1000-10,000F 1.11E-4I
70288-86-7 1.5 No 100-1000F 3.42E-4
70955-34-9 1.5 No 10,000-100,000F 3.42E-2
71486-79-8 1.5 No 10,000-100,000F 3.42E-2
73984-93-7 1.5 No <100F 3.42E-5
80584-90-3 1.5 Yes 1000-10,000F 1.12E-4I
94270-86-7 1.5 Yes 1000-10,000F 1.12E-4I
125328-64-5 0.0025 Yes 180,000F 1.99E-3K
174333-80-3 1.5 Yes 10,000-100,000F 1.34E-3I a A worst-case emission factor of 100% was conservatively used for all substances and representative structures. For those
substances where a volume range is reported in the table, the upper limit of the range was used for deriving the human intake estimates. b A modelled total STP removal rate of 94.01% was used for CAS RNs 61790-28-1 and 61790-29-2 and 47.97% for CAS RN 65277-
42-1 (EPI Suite™ 2012). For all other substances and representative structures, a total STP removal rate of 0% was used. c All physicochemical properties and degradation half-lives were obtained from EPI Suite™ (2012), with preference given to
empirical values where available. d Total volume in commerce was sum of volumes from DSL IU2 and IMS MIDAS database (Canada 2014; IMS 2013).
e Total volume in commerce was sum of volumes from DSL IU1 and IMS MIDAS database (Environment Canada 2012; IMS
2013). f Total volume in commerce was from DSL IU2 (Canada 2014).
g Total volume in commerce was from DSL IU1 (Environment Canada 2012).
h Total volume in commerce was from a survey of persistent, bioaccumulative and inherently toxic (PBiT) substances, polymers
representing greatest potential for exposure to humans, and substances identified as hazardous to human health (Canada 2006). i Worst-case mode-of-entry was to water and highest exposed age group was formula-fed infant (0-0.5 years). j Worst-case mode-of-entry was to air and highest exposed age group was toddler (0.5-4 years).
k Worst-case mode-of-entry was to soil and highest exposed age group was toddler (0.5-4 years).
l Worst-case mode-of-entry was to soil and highest exposed age group was formula-fed infant (0-0.5 years).

January 28, 2016
Table B-4. Direct exposure estimates for select remaining categorized substances under the CMP
CAS RN Name info TTC value (µg/kg bw/day)
Direct exposure scenario (s) Exposure estimate (µg/kg bw/day)a,b
60-24-2 Ethanol, 2-mercapto-
30 Food packaging (identified to be used in the manufacture of different types of food packaging materials in Canada)
0.74 µg/kg bw/day
78-67-1 Propanenitrile, 2,2’-azobis[2-methyl-
1.5 Food packaging (identified to be used in the manufacture of different types of food packaging materials in Canada)
0.0006 µg/kg bw/day
120-11-6 Benzene, 2-methoxy-1-(phenylmethoxy)-4-(1-propenyl)-
1.5 Flavouring agent Note that this substance is listed in the Natural Health Products Ingredients Database (NHPID) with a non-medicinal role for potential use as flavour enhancer in natural health products; however, it is not currently found in licensed natural health products as per the Licensed Natural Health Products Database (LNHPD)
0.014 µg/kg bw/day [based on US intake value of 1 µg/day (from JECFA, 2003)]
120-24-1 Benzeneacetic acid, 2-methoxy-4-(1-propenyl)phenyl ester
30 Flavouring agent Note that this substance is listed in the NHPID with anon-medicinal role for potential use as flavour enhancer in natural health products; however, it is not currently found in licensed natural health products as per the LNHPD
0.0042 µg/kg bw/day [based on US intake value of 0.3 µg/day (from JECFA, 2003)]
121-91-5 1,3-Benzenedicarboxylic acid
30 Food packaging (identified to be used in the manufacture of different types of food packaging materials
0.050 µg/kg bw/day (adults) 8.61 µg/kg bw/day (infant)

50
CAS RN Name info TTC value (µg/kg bw/day)
Direct exposure scenario (s) Exposure estimate (µg/kg bw/day)a,b
in Canada, including some coating used with infant formula)
122-68-9 2-Propenoic acid, 3-phenyl-, 3-phenylpropyl ester
30 1) Fragrance in cosmetic products: assumed up to 4% in the fragrance concentrate (from: http://www.thegoodscentscompany.com/data/rw1002221.html) 2) Flavouring agent in a variety of products Note that this substance is listed in the NHPID with a non-medicinal role for potential use as flavour enhancer in natural health products; however, it is not currently found in licensed natural health products as per the LNHPD
1) Fragrance: 25 µg/kg bw/day (based on dermal exposure to body cream (4.4 g/day), 4% substance in fragrance mixture, 1% fragrance mixture in body cream product; no dermal factor applied) 2) Flavouring agent: 0.52 µg/kg bw/day [based on US intake value of 37 µg/day, (from JECFA, 2000)]
122-79-2 Acetic acid, phenyl ester
0.0025 Flavouring agent Note that this substance is listed in the NHPID with a non-medicinal role for potential use as flavour enhancer in natural health products; however, it is not currently found in licensed natural health products as per the LNHPD
0.00014 µg/kg bw/day [based on US intake value of 0.01 µg/day (from JECFA, 2000)]
288-88-0 1H-1,2,4-Triazole 1.5 Consumer product, i.e., lubricant (0.1% concentration)
1.2 µg/kg bw/day (Based on 1184 µg/kg bw/day * 0.001 * DF where 1184 µg/kg bw/day represents dermal exposure to lubricant, 0.1% concentration of substance in product, no dermal factor applied).

51
CAS RN Name info TTC value (µg/kg bw/day)
Direct exposure scenario (s) Exposure estimate (µg/kg bw/day)a,b
614-45-9 Benzenecarboperoxoic acid, 1,1-dimethylethyl ester
0.0025 Consumer product, i.e., tube adhesive
"Per event" exposure = 28 µg/kg bw/day (compared to TTC Class I value assigned to this substance of 30 µg/kg bw/day) (based on 1128 µg/kg bw/day * 0.05 * DF where: 1184 µg/kg bw/day represents dermal exposure to tube adhesive product, 5% concentration of substance in product and a dermal factor of 50%). Amortized exposure = 0.005 µg/kg bw/day (based on (per event exposure * 12 days/year) ÷ (365 days/year * 80 years))
3006-86-8 Peroxide, cyclohexylidenebis[(1,1-dimethylethyl)
1.5 Food packaging (identified to be used in the manufacture of different types of food packaging materials in Canada)
0.0014 µg/kg bw/day
3327-22-8 1-Propanaminium, 3-chloro-2-hydroxy-N,N,N-trimethyl-, chloride
0.0025 Food packaging (identified to be used in the manufacture of different types of food packaging materials in Canada)
0.0020 µg/kg bw/day
8001-04-5 Musks (Tonquin musk)
1.5 Flavouring agent 0.00423 µg/kg bw/day (based on individual consumption value for Tonquin musk (from: Burdock, 2009 (Fenaroli's Handbook of Flavor Ingredients, Sixth Edition))
13472-08-7 Butanenitrile, 2,2’-azobis[2-methyl-
1.5 Food packaging (identified to be used in the manufacture of different types of food packaging materials
0.51 µg/kg bw/day

52
CAS RN Name info TTC value (µg/kg bw/day)
Direct exposure scenario (s) Exposure estimate (µg/kg bw/day)a,b
in Canada)
28777-98-2
2,5-Furandione, dihydro-3-(octadecenyl)
1.5
Food packaging (identified to be used in the manufacture of different types of food packaging materials in Canada)
0.15 µg/kg bw/day
28984-69-2 4,4(5H)-Oxazoledimethanol, 2-(heptadecenyl)-
1.5 Consumer product, i.e., antifreeze/ de-icing product (used motor oil, fuel additive as scenario)
1.1 µg/kg bw/day (Based on 1214 µg/kg bw/day * 0.00091 * DF where 1184 µg/kg bw/day represents dermal exposure to fuel additive (used to represent antifreeze product), 0.091% concentration of substance in product, no dermal factor applied).
29350-73-0 Naphthalene, decahydro-1,6-dimethyl-4-(1-methylethyl)-, [1S-(1α,4α,4aα,6α,8aβ)]-, didehydro deriv.
30 Flavouring agent 0.00071 µg/kg bw/day [based on US intake value of 0.05 µg/day (from JECFA, 2006)]
32072-96-1 2,5-Furandione, 3-(hexadecenyl)dihydro-
1.5 Food packaging (identified to be used in the manufacture of different types of food packaging materials in Canada)
0.55 µg/kg bw/day

53
CAS RN Name info TTC value (µg/kg bw/day)
Direct exposure scenario (s) Exposure estimate (µg/kg bw/day)a,b
68784-12-3 2,5-Furandione, dihydro-, mono-C15-20-alkenyl derivs.
1.5 Food packaging (identified to be used in the manufacture of different types of food packaging materials in Canada)
0.59 µg/kg bw/day
68784-26-9 Phenol, dodecyl-, sulfurized, carbonates, calcium salts, overbased
1.5 Consumer product, i.e., lubricant
1.2 µg/kg bw/day (Based on 1184 µg/kg bw/day * 0.01 * DF where: 1184 µg/kg bw/day represents dermal exposure to lubricant product, 1% concentration of substance in product, DF (dermal factor) = 10%)
80584-90-3 1H-Benzotriazole-1-methanamine, N,N-bis(2-ethylhexyl)-4-methyl-
1.5 Consumer product, i.e., lubricant
0.9 µg/kg bw/day (Based on 1184 µg/kg bw/day * 0.003 * DF where: 1184 µg/kg bw/day represents dermal exposure to lubricant product, 0.3% concentration of substance in product, DF (dermal factor) = 25%)
94270-86-7 1H-Benzotriazole-1-methanamine, N,N-bis(2-ethylhexyl)-ar-methyl-
1.5 Consumer product, i.e., lubricant 0.9 µg/kg bw/day (Based on 1184 µg/kg bw/day * 0.003 * DF where: 1184 µg/kg bw/day represents dermal exposure to lubricant product, 0.3% concentration of substance in product, DF (dermal factor) = 25%)
a Dermal factors were applied in cases where refinement of dermal exposure estimates was considered appropriate; dermal factors were determined as outlined below:

54
- 10%: substance with molecular weight (MW) > 500 g/mol and log Kow < -1 or > 4 - 25%: duration of exposure is < 1 hour (e.g., use of a lubricant product) and substance with MW > 300 g/mol or log Kow (< -1 or > 4), - 50%: duration of exposure is < 1 hour (but the substance does not have the above noted physical/chemical characteristics), - 75%: substance is an ingredient in a cosmetic product (except in hair dyes).
b adult exposure based on body weight of 70.9 kg.


![Threshold of Toxicological Concern Approach[5] 95 There are generic questions in the risk assessment of chemicals that are under discussion in the scientific 96 community, sometimes](https://static.fdocuments.in/doc/165x107/5e39557ba527233aae2e1b4b/threshold-of-toxicological-concern-approach-5-95-there-are-generic-questions-in.jpg)