Schroder Japan Growth Fund plc - RNS · PDF fileSchroder Japan Growth Fund plc 1 For ... The...
16
Schroder Japan Growth Fund plc Half Year Report and Accounts for the six months ended 31 January 2017
Transcript of Schroder Japan Growth Fund plc - RNS · PDF fileSchroder Japan Growth Fund plc 1 For ... The...

Schroder Japan Growth Fund plcHalf Year Report and Accounts for the six months ended 31 January 2017

Contents
Financial Highlights 1
Interim Management Report 2
Income Statement 8
Statement of Changes in Equity 9
Statement of Financial Position 10
Notes to the Accounts 11
Investment objectiveThe Company’s principal investment objective is to achieve capital growth from an actively managed portfolio
principally comprising securities listed on the Japanese stock markets, with the aim of achieving growth in excess
of the TSE First Section Total Return Index in sterling over the longer term.
Investment policyThe Manager utilises an active stock driven investment approach, drawing on Schroders’ extensive research
resources in Japan. The portfolio is principally invested in a broad range of companies quoted on the Tokyo Stock
Exchange, the regional stock markets of Fukuoka, Hiroshima, Kyoto, Nagoya, Niigata, Osaka and Sapporo and the
Japanese over the counter (OTC) market. Investments may also be made in companies listed elsewhere but
controlled from Japan or with a material exposure to the Japanese economy. There are no constraints on size of
company or sector allocation. This flexibility will allow the Manager to take advantage of changes in market
sentiment and in the domestic economic cycle as it develops.
The portfolio is mainly invested in equities but may also be invested in warrants, convertibles and other derivative
instruments where appropriate. The Company may invest up to 5% of its assets in securities which are not listed on
any stock exchange, but would not normally make such investment except where the Manager expects that the
securities will shortly become listed on a Japanese stock market.
Contents, Investment Objective and Policy
Schroder Japan Growth Fund plc

Schroder�Japan�Growth�Fund�plc 1
For the six months
Total returns (including dividends reinvested)1 ended 31 January 2017
Net�asset�value�(“NAV”)�per�share2 17.6%
Share�price2 20.5%
Benchmark3 11.7%
1 Total�return�calculations�assume�that�any�dividends�paid�out�during�the�period�were�reinvested.2 Source:�Morningstar.3 Source:�Thomson�Reuters.�The�Company’s�benchmark�is�the�TSE�First�Section�Total�Return�Index (in�sterling�terms).
31 January 31 July
Other financial information 2017 2016 % Change
Shareholders’�funds�(£’000) 262,919 226,688 +16.0
Shares�in�issue 125,008,200 125,008,200 –
NAV�per�share 210.32p 181.34p +16.0
Share�price 192.00p 162.00p +18.5
Share�price�discount�to�NAV�per�share 8.7% 10.7%
Gearing1 10.7% 12.1%
1 Gearing�represents�borrowings�used�for�investment�purposes,�less�cash,�expressed�as�a�percentage�of�net�assets.
Financial Highlights

PerformanceThe six-month period to 31 January 2017 has seen improved performance from the Japanese stock market, with
the benchmark producing a total return of 11.7%. In addition, the Company comfortably outperformed the
benchmark during the period, producing a total return of 17.6%. As investor sentiment towards Japan improved,
the discount narrowed from 10.7% at the start of the period to 8.7% at its close and the share price produced a
total return of 20.5%.
Further performance details are set out in the Manager’s Review on page 3.
Gearing policyThe Company has in place a ¥6 billion term loan expiring in 2019 and a ¥1 billion revolving credit facility, the latter
which remained undrawn as at 31 January 2017. The gearing continues to be operated within the limits agreed by
the Board. At the beginning of the period, the gearing (borrowings less cash expressed as a percentage of net
assets) stood at 12.1% and the level had decreased to 10.7% at 31 January 2017.
OutlookThe Company achieved a small but historically important moment last month, when the share price hit £2 for the
first time. That it has taken over two decades for the price to double is hardly a triumph for Japan’s stock market;
the Manager has added value relative to the local index, but otherwise it is a reminder of how long the economy has
been entangled in the after-effects of the 1980-90s boom/bust.
How long will it take for the share price to double again? So much of the appeal of the market now lies in the word
‘potential’ – what could happen to profits if inflation and economic growth return to more ‘normal’ levels, what
could happen to returns on equity if companies continue with their newfound enthusiasm for ‘shareholder value’, or
what could happen if local investors commit material amounts to the market? Not all of these will happen soon, if at
all, and there are obvious challenges internationally, but Japan’s appeal today is that much of its potential is in its
own hands.
Jonathan Taylor
Chairman
5 April 2017
2 Schroder Japan Growth Fund plc
Interim Management Report – Chairman’s Statement

Schroder Japan Growth Fund plc 3
Interim Management Report – Manager’s Review
Market backgroundThe market rose a healthy 16.2% in local currency as it gradually recovered from the macro shocks of the first half
of 2016 (negative interest rates and Brexit) and then received additional impetus from the US presidential election,
which engendered optimism about global growth. Events in the US also served as a trigger to stem the rise in the
yen against sterling and the small depreciation of the currency meant that the market’s sterling return was a lower
11.7%.
The economic backdrop improved internationally and domestically. Economic policy was also largely supportive
with announcements of a fiscal package by the government and a new monetary policy framework by the Bank of
Japan. This framework has at its core “yield curve control” which fixes 10 year bond yields at around 0%. The fact
that negative short term interest rates (an unpopular policy) were not taken deeper into negative territory was
positive for sentiment. At the same time fixing long term interest rates at a time of rising US dollar yields had the
effect of reversing the yen’s appreciation and, as a result, improving prospects for corporate profits.
The turnaround in economic and interest rate expectations had a marked impact on sector and style preferences
within the market over the six months. Specifically, having lagged over the previous 12 months as “risk off”
sentiment dominated, cyclicals and financials rebounded strongly and the previously popular domestic defensive
sectors reversed course. This was also reflected in value outperforming growth and the broader market. For
example energy, financial and shipping sectors were amongst the best performing sectors and pharmaceuticals
and food were amongst the worst.
The Company’s NAV total return was 17.6% in sterling, significantly ahead of the benchmark’s 11.7% rise. Gearing
contributed to outperformance given the strong underlying market. Stock selection was also beneficial, especially
holdings in financials and energy, which more than offset negative contributions in telecoms and pharmaceuticals.
ActivityProfits were taken in some cyclicals and technology holdings such as Nitto Denko, Hitachi Hi-Tec and Sumitomo
Heavy Industries. Within the trading company sector, where the exposure is overweight, we switched the holding in
Sumitomo Corporation into Itochu. Valuations were similarly cheap but Itochu had less risk of impairment losses. A
small position in Topcon was sold off and new positions started in Recruit Holdings (operator of staffing and
marketing websites), Jafco (venture capital specialist) and HIS (travel agent).
OutlookAn upturn in global growth is historically positive for the Japanese stock market. This time round seems no different
with the important caveat that improved sentiment is in part due to President Trump’s policies, implementation of
which carries above average uncertainty. More tantalising for long term investors in Japan is the prospect of a
sustained emergence from deflation which four years of Abenomics has still failed to achieve. There are grounds for
cautious optimism here given developments in the labour market. Economic policy is broadly supportive of the
stock market and its direction is characterised by greater consistency than is apparent in other developed
economies. Meanwhile company profits are benefiting from the manufacturing cycle and weaker yen after a
challenging 2016. The direction of corporate governance is positive notwithstanding a few high profile examples of
the opposite. By and large Japan’s stock market rally has been matched by improved profits with the result that
valuations, whilst not outstandingly cheap in aggregate, cannot be described as especially stretched either. So
whilst risks exist in terms of the evolution of President Trump’s policies, their impact on the exchange rate and
possible policy errors in Japan, on balance prospects appear favourable and, reflecting this, the Company is
moderately geared (10.7% at the end of January 2017).

Interim Management Report – Manager’s Review
4 Schroder�Japan�Growth�Fund�plc
Investment policyIn�last�year’s�interim�review�we�wrote�that�we�were�finding�most�attractive�valuations�in�cyclical�parts�of�the�market,
without�having�a�clear�view�of�what�the�catalyst�might�be�for�these�areas�to�outperform.�It�remains�the�case�that�we
prefer�cyclicals although�they�are�less�cheap�and�more�widely�recognised�as�benefiting�from�current�developments.
However,�whereas�last�year�we�found�it�near�impossible�to�find�attractive�valuations�in�low�volatility,�domestic
defensive�areas,�this�is�less�so�now�and�we�are�making�some�additions�to�holdings�in�pharmaceuticals�and�retail.
Within�cyclicals�we�have�taken�profits�in�some�of�the�internationally�exposed�high�flyers�where�we�are�less�confident
of�the�quality�of�the�businesses�long�term�and�are�favouring�higher�quality�cyclicals�or�more�domestically�facing
names.�Real�Estate�is�an�example�of�the�latter�and�a�sector�which�has�continued�to�lag.�We�are�maintaining�our
overweight�position�in�financials,�favouring�insurance,�in�the�belief�that�evolution�of�the�slope�of�the�yield�curve�will
be�beneficial.
Schroder Investment Management Limited
5�April 2017

Schroder�Japan�Growth�Fund�plc 5
Interim Management Report – Investment Portfolio
As�at�31�January�2017
Transportation Equipment
Toyota Motor 13,633 4.6
Hi-Lex 7,725 2.7
Isuzu Motors 4,635 1.6
Honda�Motor 4,061 1.4
Unipres 2,477 0.9
Musashi�Seimitsu�Industry 1,425 0.5
Total Transportation Equipment 33,956 11.7
Electrical Appliances
TDK 6,465 2.2
Koito Manufacturing 5,159 1.8
Mitsubishi�Electric 4,408 1.5
Fujitsu 3,832 1.3
Hitachi 3,740 1.3
Canon 3,186 1.1
Nidec 2,501 0.9
Screen� 1,944 0.7
Konica�Minolta 1,763 0.6
Total Electrical Appliances 32,998 11.4
Banks
Sumitomo Mitsui Financial 10,754 3.6
Mitsubishi UFJ Financial 5,977 2.1
Seventy�Seven�Bank 2,320 0.8
Fukuoka�Financial 2,062 0.7
Chiba�Bank 1,019 0.3
Musashino�Bank 694 0.2
Total Banks 22,826 7.7
Chemicals
SK Kaken 5,912 2.0
Sekisui�Chemical 4,081 1.4
Sakata�Inx 3,671 1.3
Fujifilm�Holdings 2,637 0.9
T&K�Toka 1,686 0.6
Nippon�Shokubai 1,335 0.5
Nitto�Denko 1,029 0.4
Nippon�Soda 899 0.3
Total Chemicals 21,250 7.4
Land Transportation
East Japan Railway 8,689 3.0
Sankyu 5,432 1.9
Hitachi�Transport�System 3,335 1.1
Central�Japan�Railway 3,199 1.1
Total Land Transportation 20,655 7.1
Retail Trade
Seven and I Holdings 4,867 1.7
AT�Group 4,338 1.5
H2O�Retailing 2,718 0.9
ABC-Mart 2,585 0.9
Nafco 2,106 0.7
Izumi� 2,090 0.7
Don�Quijote 1,336 0.5
Total Retail Trade 20,040 6.9
Wholesale Trade
Mitsui & Co. 7,600 2.5
Yamada�Denki 3,940 1.4
Inabata 3,810 1.3
Itochu 2,005 0.7
Hitachi�High-Technologies 1,309 0.4
Mitsubishi 941 0.3
Total Wholesale Trade 19,605 6.6
Information and Communication
KDDI 9,440 3.2
Nippon Telephone and Telegraph 8,861 3.0
Chubu�Nippon�Broadcasting 732 0.3
Total Information and Communication 19,033 6.5
Insurance
Sompo Japan Nipponkoa 9,375 3.2
T&D Holdings 5,993 2.0
Total Insurance 15,368 5.2
Machinery
Disco 5,043 1.7
Nabtesco 2,332 0.8
Sumitomo�Heavy�Industries 2,118 0.7
JTEKT 1,995 0.7
Nippon�Thompson 1,913 0.7
Sankyo 800 0.3
Total Machinery 14,201 4.9
Pharmaceutical
Santen Pharmaceutical 4,913 1.7
Otsuka�Holdings 4,573 1.6
Astellas�Pharma 2,685 0.9
Kissei�Pharmaceuticals 568 0.2
Total Pharmaceutical 12,739 4.4
Rubber Products
Bridgestone 9,066 3.1
Total Rubber Products 9,066 3.1
Construction
Haseko 4,253 1.5
JGC 2,942 1.0
Sanki�Engineering 1,572 0.5
Total Construction 8,767 3.0
Air Transportation
Japan Airlines 6,361 2.2
Total Air Transportation 6,361 2.2
Non-Ferrous Metals
Dowa�Mining 3,145 1.1
Sumitomo�Electric�Industries 1,762 0.6
Total Non-Ferrous Metals 4,907 1.7
Securities and Commodity
Nomura�Holding 2,872 1.0
Tokai�Tokyo�Securities 1,842 0.6
Total Securities and Commodity 4,714 1.6
£’000 % £’000 %
Stocks�in�bold�are�the�20�largest�investments,�which�by�value�account�for�49.8%�(31�July�2016:�50.8%�and
31 January�2016:�50.2%)�of�total�investments.

Interim Management Report – Investment Portfolio
As�at�31�January�2017
6 Schroder�Japan�Growth�Fund�plc
Foods
Sapporo�Breweries 1,750 0.6
Total Foods 1,750 0.6
Marine Transportation
Mitsui�O.S.K.�Lines 1,179 0.4
Total Marine Transportation 1,179 0.4
Other Products
Nintendo 849 0.3
Total Other Products 849 0.3
Iron and Steel
Mirai�Industry 789 0.3
Total Iron and Steel 789 0.3
Mining
Inpex 784 0.3
Total Mining 784 0.3
Warehousing and Harbour TransportationServices
Kintetsu�World�Express� 772 0.3
Total Warehousing and HarbourTransportation Services
772 0.3
Total investments 291,316 100.0
£’000 %
Precision Instruments
Hoya 2,432 0.8
Shimadzu 1,994 0.7
Total Precision Instruments 4,426 1.5
Oil and Coal products
JX�Holdings 4,292 1.5
Total Oil and Coal products 4,292 1.5
Real Estate
Mitsui�Fudosan 2,641 0.9
Nomura�Real�Estate 1,506 0.5
Total Real Estate 4,147 1.4
Other Financing Business
Hitachi�Capital 2,491 0.9
Jafco 1,112 0.4
Total Other Financing Business 3,603 1.3
Services
Recruit 1,299 0.4
H.I.S. 940 0.3
Total Services 2,239 0.7
£’000 %

Schroder�Japan�Growth�Fund�plc 7
Principal�risks�and�uncertaintiesThe�principal�risks�and�uncertainties�with�the�Company’s�business�fall�into�the�following�risk�categories:�strategic;
investment�management;�financial and�currency;�gearing�and�leverage;�accounting,�legal�and�regulatory; custody;
and�service�provider.�A�detailed�explanation�of�the�risks�and�uncertainties�in�each�of�these�categories�can�be�found
on�pages�14�and�15�of�the�Company’s�published�Annual�Report�and�Accounts�for�the�year�ended�31 July�2016.
These�risks�and�uncertainties�have�not�materially�changed�during�the�six�months�ended�31 January�2017.
Going�concernHaving�assessed�the�principal�risks�and�uncertainties,�and�the�other�matters�discussed�in�connection�with�the
viability�statement�as�set�out�on�page 16�of�the�published�Annual�Report�and�Accounts�for�the�year�ended 31�July
2016,�the�Directors�consider�it�appropriate�to�adopt�the�going�concern�basis�in�preparing�the�accounts.
Related�party�transactionsThere�have�been�no�transactions�with�related�parties�that�have�materially�affected�the�financial�position�or�the
performance�of�the�Company�during�the�six�months�ended�31�January�2017.
Directors’�responsibility�statementThe�Directors�confirm�that,�to�the�best�of�their�knowledge,�this�set�of�condensed�financial�statements�has�been
prepared�in�accordance�with�United�Kingdom�Generally�Accepted�Accounting�Practice�(UK�GAAP)�and�with�the
Statement�of�Recommended�Practice,�“Financial�Statements�of�Investment�Companies�and�Venture�Capital�Trusts”
issued�in�November�2014�and�updated�in�January�2017�and�that�this�Interim�Management�Report�includes�a�fair
review�of�the�information�required�by�4.2.7R�and�4.2.8R�of�the�Financial�Conduct�Authority’s�Disclosure�Guidance
and�Transparency�Rules.
Interim Management Report

8 Schroder�Japan�Growth�Fund�plc
(Unaudited) for the six months (Unaudited)�for�the�six�months (Audited)�for�the�year
ended 31 January 2017 ended�31�January�2016 ended�31�July�2016
Revenue Capital Total Revenue Capital Total Revenue Capital Total
£’000 £’000 £’000 £’000 £’000 £’000 £’000 £’000 £’000
Gains/(losses)�on�investments�held�at�
fair�value�through�profit�or�loss – 37,784 37,784 – (6,912) (6,912) – 25,692� 25,692
Net�foreign�currency�gains/(losses) – 953 953 – (3,698) (3,698) – (11,102) (11,102)
Income�from�investments 2,763 – 2,763 2,138� – 2,138� 5,588� – 5,588
Other�interest�receivable�and�
similar�income – – – – – – 1� – 1
Gross return/(loss) 2,763 38,737 41,500 2,138� (10,610) (8,472) 5,589� 14,590� 20,179
Investment�management�fee (312) (729) (1,041) (254) (593) (847) (514) (1,198) (1,712)
Administrative�expenses (265) – (265) (289) – (289) (531) – (531)
Net return/(loss) before finance
costs and taxation 2,186 38,008 40,194 1,595� (11,203) (9,608) 4,544� 13,392� 17,936
Finance�costs (56) (131) (187) (36) (84) (120) (87) (203) (290)
Net return/(loss) on ordinary
activities before taxation 2,130 37,877 40,007 1,559� (11,287) (9,728) 4,457� 13,189� 17,646
Taxation�on�ordinary�activities�(note�3) (276) – (276) (213) – (213) (559) – (559)
Net return/(loss) on ordinary
activities after taxation 1,854 37,877 39,731 1,346� (11,287) (9,941) 3,898� 13,189� 17,087
Return/(loss) per share (note 4) 1.48p 30.30p 31.78p 1.08p (9.03)p (7.95)p 3.12p 10.55p 13.67p
The�“Total”�column�of�this�statement�is�the�profit�and�loss�account�of�the�Company.�The�“Revenue”�and�“Capital”
columns�represent�supplementary�information�prepared�under�guidance�issued�by�The�Association�of�Investment
Companies.�The�Company�has�no items�of�other�comprehensive�income,�and�therefore�the�net�return�on�ordinary
activities�after�taxation�is�also�the�total�comprehensive�income�for�the�period.
All�revenue�and�capital�items�in�the�above�statement�derive�from�continuing�operations.�No�operations�were
acquired�or�discontinued�in�the�period.
Income Statement
for�the�six�months�ended�31�January�2017�(unaudited)
Schroder�Japan�Growth�Fund�plc 9
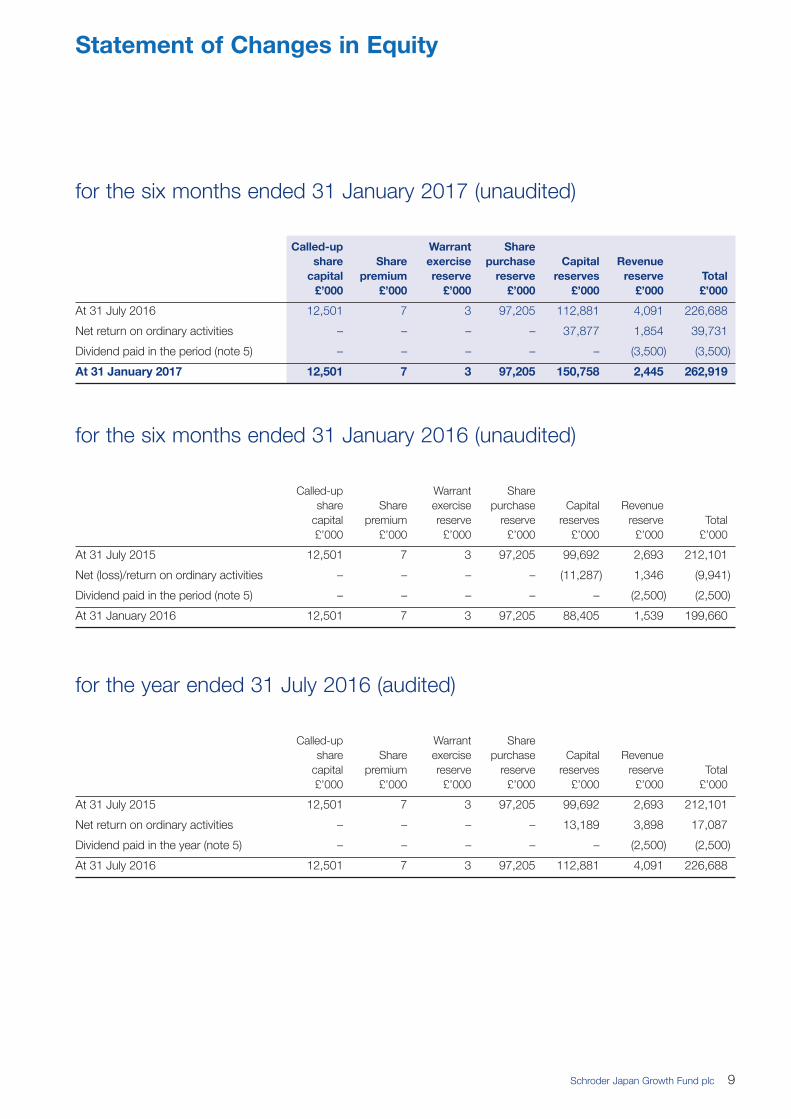
for�the�six�months�ended�31�January�2017�(unaudited)
Called-up Warrant Share
share Share exercise purchase Capital Revenue
capital premium reserve reserve reserves reserve Total
£’000 £’000 £’000 £’000 £’000 £’000 £’000
At�31�July�2016 12,501� 7� 3� 97,205� 112,881� 4,091� 226,688
Net�return�on�ordinary�activities – – – – 37,877� 1,854� 39,731
Dividend�paid�in�the�period�(note�5) – – – – – (3,500) (3,500)
At 31 January 2017 12,501 7 3 97,205 150,758 2,445 262,919
for�the�six�months�ended�31�January�2016�(unaudited)
Called-up Warrant� Share
share Share exercise� purchase Capital Revenue
capital premium reserve reserve reserves reserve Total
£’000 £’000 £’000 £’000 £’000 £’000 £’000
At�31�July�2015 12,501� 7� 3� 97,205� 99,692� 2,693� 212,101
Net�(loss)/return�on�ordinary�activities – – – – (11,287) 1,346� (9,941)
Dividend�paid�in�the�period�(note�5) – – – – – (2,500) (2,500)
At�31�January�2016 12,501� 7� 3� 97,205� 88,405� 1,539� 199,660
for�the�year�ended�31�July�2016�(audited)
Called-up Warrant� Share
share Share exercise� purchase Capital Revenue
capital premium reserve reserve reserves reserve Total
£’000 £’000 £’000 £’000 £’000 £’000 £’000
At�31�July�2015 12,501� 7� 3� 97,205� 99,692� 2,693� 212,101
Net�return�on�ordinary�activities – – – – 13,189� 3,898� 17,087
Dividend�paid�in�the�year�(note�5) – – – – – (2,500) (2,500)
At�31�July�2016 12,501� 7� 3� 97,205� 112,881� 4,091� 226,688
Statement of Changes in Equity

10 Schroder�Japan�Growth�Fund�plc
(Unaudited) (Unaudited) (Audited)
At 31 January At�31�January At�31�July
2017 2016 2016
£’000 £’000 £’000
Fixed assets
Investments�held�at�fair�value�through�profit�or�loss 291,316 229,615� 254,114
Current assets
Debtors 579 1,039� 1,077
Cash�at�bank�and�in�hand 14,235 5,301� 16,565
14,814 6,340� 17,642
Current liabilities
Creditors:�amounts�falling�due�within�one�year (847) (1,357) (973)
Net current assets 13,967 4,983� 16,669�
Total assets less current liabilities 305,283 234,598� 270,783�
Creditors:�amounts�falling�due�after�more�than�one�year�(note�6) (42,364) (34,938) (44,095)
Net assets 262,919 199,660� 226,688�
Capital and reserves
Called-up�share�capital�(note�7) 12,501 12,501 12,501
Share�premium� 7 7 7
Warrant�exercise�reserve 3 3 3
Share�purchase�reserve 97,205 97,205 97,205
Capital�reserves 150,758 88,405 112,881
Revenue�reserve 2,445 1,539 4,091
Total equity shareholders’ funds 262,919 199,660 226,688
Net asset value per share (note 8) 210.32p 159.72p 181.34p
Statement of Financial Position
at�31�January�2017�(unaudited)
Registered�in�England�and�Wales
Company�Registration�number:�2930057

Schroder�Japan�Growth�Fund�plc 11
1. Financial�statementsThe�information�contained�within�the�accounts�in�this�half�year�report�has�not�been�audited�or�reviewed�by�the�Company’s
auditors.
The�figures�and�financial�information�for�the�year�ended�31�July�2016�are�extracted�from�the�latest�published�accounts�of�the
Company�and�do�not�constitute�statutory�accounts�for�that�year.�Those�accounts�have�been�delivered�to�the�Registrar�of
Companies�and�included�the�report�of�the�auditors�which�was�unqualified�and�did�not�contain�a�statement�under�either�section
498(2)�or�498(3)�of�the�Companies�Act�2006.
2. Accounting�policiesBasis of accountingThe�accounts�have�been�prepared�in�accordance�with�United�Kingdom�Generally�Accepted�Accounting�Practice�and�with�the
Statement�of�Recommend�Practice�"Financial�Statements�of�Investment�Trust�Companies�and�Venture�Capital�Trusts"�issued�by
the�Association�of�Investment�Companies�in�November�2014 and�updated�in�January�2017.
All�of�the�Company’s�operations�are�of�a�continuing�nature.
The�accounting�policies�applied�to�these�accounts�are�consistent�with�those�applied�in�the�accounts�for�the�year�ended�31�July
2016.
3. Taxation�on�ordinary�activitiesThe�Company’s�effective�corporation�tax�rate�is�nil,�as�deductible�expenses�exceed�taxable�income.�The�tax�charge�comprises
irrecoverable�overseas�withholding�tax.
4. Return/(loss)�per�share(Unaudited) (Unaudited)
Six months Six�months (Audited)
ended ended Year�ended
31 January 31�January 31�July
2017 2016 2016
£’000 £’000� £’000
Revenue return 1,854 1,346 3,898
Capital return/(loss) 37,877 (11,287) 13,189
Total return/(loss) 39,731 (9,941) 17,087
Weighted average number of shares in issue during the period 125,008,200 125,008,200 125,008,200
Revenue return per share 1.48p 1.08p 3.12p
Capital return/(loss) per share 30.30p (9.03)p 10.55p
Total return/(loss) per share 31.78p (7.95)p 13.67p
5. Dividends�paid(Unaudited) (Unaudited)
Six months Six�months (Audited)
ended ended Year�ended
31 January 31�January 31�July
2017 2016 2016
£’000 £’000 £’000
2016�final�dividend�paid�of�2.80p�(2015:�2.00p) 3,500 2,500 2,500
No�interim�dividend�has�been�declared�in�respect�of�the year�ending�31�July 2017�(2016:�nil).
Notes to the Accounts
12 Schroder�Japan�Growth�Fund�plc
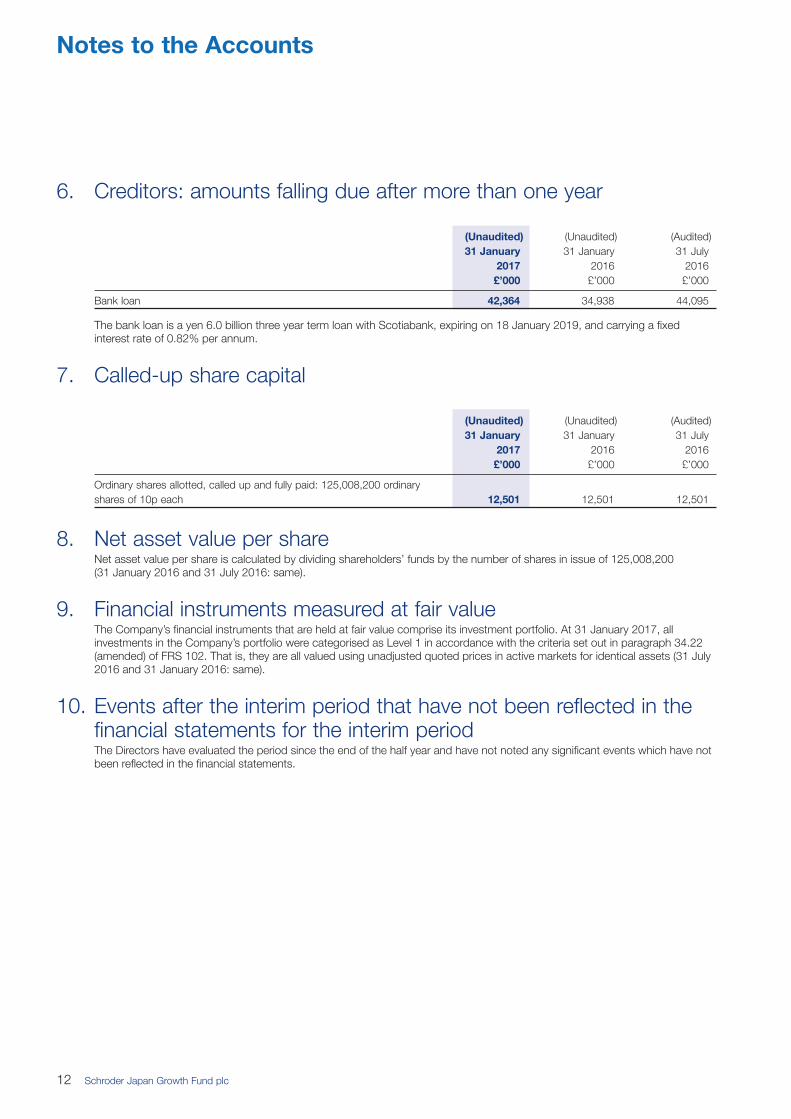
6. Creditors:�amounts�falling�due�after�more�than�one�year
(Unaudited) (Unaudited) (Audited)
31 January 31�January 31�July
2017 2016 2016
£’000 £’000 £’000
Bank�loan 42,364 34,938� 44,095
The�bank�loan�is�a�yen�6.0�billion�three�year�term�loan�with�Scotiabank,�expiring�on�18�January�2019,�and�carrying�a�fixed
interest�rate�of�0.82%�per�annum.
7. Called-up�share�capital
(Unaudited) (Unaudited) (Audited)
31 January 31�January 31�July
2017 2016 2016
£’000 £’000 £’000
Ordinary�shares�allotted,�called�up�and�fully�paid:�125,008,200�ordinary�
shares�of�10p�each 12,501 12,501� 12,501
8. Net�asset�value�per�shareNet�asset�value�per�share�is�calculated�by�dividing�shareholders’�funds�by�the�number�of�shares�in�issue�of�125,008,200
(31 January�2016�and�31�July�2016:�same).
9. Financial�instruments�measured�at�fair�valueThe�Company’s�financial�instruments�that�are�held�at�fair�value�comprise�its�investment�portfolio.�At�31�January�2017,�all
investments�in�the�Company’s�portfolio�were�categorised�as�Level�1�in�accordance�with�the�criteria�set�out�in�paragraph�34.22
(amended)�of�FRS�102.�That�is,�they�are�all�valued�using�unadjusted�quoted�prices�in�active�markets�for�identical�assets�(31 July
2016�and�31�January�2016:�same).
10. Events�after�the�interim�period�that�have�not�been�reflected�in�thefinancial�statements�for�the�interim�periodThe�Directors�have�evaluated�the�period�since�the end�of�the�half�year and�have�not�noted�any�significant�events�which�have�not
been�reflected�in�the�financial�statements.
Notes to the Accounts


www.schroders.co.uk/japangrowth
Dealing CodesISIN Number: GB0008022849
SEDOL Number: 0802284
Ticker: SJG
Global Intermediary Identification Number (GIIN)7T0909.99999.SL.8 26
Legal Entity Identifier (LEI)549300SSPK3AXNJ0C673
Advisers
Alternative Investment Fund Manager(“Manager”)Schroder Unit Trusts Limited
31 Gresham Street
London EC2V 7QA
Investment Manager and Company SecretarySchroder Investment Management Limited
31 Gresham Street
London EC2V 7QA
Telephone: 020 7658 2356
Registered Office31 Gresham Street
London EC2V 7QA
Depositary and CustodianHSBC Bank plc
8 Canada Square
London E14 5HQ
Lending BankScotiabank Europe PLC
201 Bishopsgate
London EC2M 3NS
Corporate BrokerCenkos Securities plc
6-8 Tokenhouse Yard
London EC2R 7AS
RegistrarEquiniti Limited
Aspect House
Spencer Road
Lancing
West Sussex BN99 6DA
Shareholder Helpline 0800 032 0641*
Website: www.shareview.co.uk
*Calls to this number are free of charge from UK
landlines.
Communications with shareholders are mailed to the
address held on the register. Any notifications and
enquiries relating to shareholdings, including a change
of address or other amendment should be directed to
Equiniti Limited at the address above.
Independent Auditors
PricewaterhouseCoopers LLP
Chartered Accountants
and Statutory Auditors
7 More London Riverside
London SE1 2RT
DirectorsJonathan Taylor (Chairman)
Anja Balfour
Alan Gibbs
Richard Greer
Certain pre-sale, regular and periodic disclosures required by the AIFM Directive may be found on the website
www.schroders.co.uk/its.
The Company’s leverage policy and details of limits on leverage required under the AIFM Directive are published on
the website at www.schroders.co.uk/its.