Schools' Racial Mix, Students' Optimism, and the …eaop.ucsd.edu/198/achievement-gap/Schools Racial...
28
Schools' Racial Mix, Students' Optimism, and the Black-White and Latino-White Achievement Gaps Author(s): Pat António Goldsmith Source: Sociology of Education, Vol. 77, No. 2 (Apr., 2004), pp. 121-147 Published by: American Sociological Association Stable URL: http://www.jstor.org/stable/3649382 . Accessed: 10/12/2013 12:47 Your use of the JSTOR archive indicates your acceptance of the Terms & Conditions of Use, available at . http://www.jstor.org/page/info/about/policies/terms.jsp . JSTOR is a not-for-profit service that helps scholars, researchers, and students discover, use, and build upon a wide range of content in a trusted digital archive. We use information technology and tools to increase productivity and facilitate new forms of scholarship. For more information about JSTOR, please contact [email protected]. . American Sociological Association is collaborating with JSTOR to digitize, preserve and extend access to Sociology of Education. http://www.jstor.org This content downloaded from 98.176.112.184 on Tue, 10 Dec 2013 12:47:01 PM All use subject to JSTOR Terms and Conditions
Transcript of Schools' Racial Mix, Students' Optimism, and the …eaop.ucsd.edu/198/achievement-gap/Schools Racial...
Schools' Racial Mix, Students' Optimism, and the Black-White and Latino-White AchievementGapsAuthor(s): Pat António GoldsmithSource: Sociology of Education, Vol. 77, No. 2 (Apr., 2004), pp. 121-147Published by: American Sociological AssociationStable URL: http://www.jstor.org/stable/3649382 .
Accessed: 10/12/2013 12:47
Your use of the JSTOR archive indicates your acceptance of the Terms & Conditions of Use, available at .http://www.jstor.org/page/info/about/policies/terms.jsp
.JSTOR is a not-for-profit service that helps scholars, researchers, and students discover, use, and build upon a wide range ofcontent in a trusted digital archive. We use information technology and tools to increase productivity and facilitate new formsof scholarship. For more information about JSTOR, please contact [email protected].
.
American Sociological Association is collaborating with JSTOR to digitize, preserve and extend access toSociology of Education.
http://www.jstor.org
This content downloaded from 98.176.112.184 on Tue, 10 Dec 2013 12:47:01 PMAll use subject to JSTOR Terms and Conditions

Schools' Racial Mix, Students' Optimism, and the Black-White and Latino-White
Achievement Gaps Pat Ant6nio Goldsmith
University of Wisconsin-Parkside
This article examines how schools' racial and ethnic mix of students and teachers influences black, white, and Latino students' occupational expectations, educational aspirations, and concrete attitudes. Findings from multilevel-model analyses of data from the National Education Longitudinal Study show that Latinos' and blacks' beliefs are more optimistic and more pro-school in segregated-minority schools, especially when these schools also employ many minority teachers. Further analyses indicate that the positive effects of segregated- minority schools on blacks' and Latinos' beliefs reduce the black-white and Latino-white gaps in achievement. These findings suggest that teachers and administrators in segregated-white schools need to address how they lower minority students' beliefs and that segregated-minor- ity schools can be improved by hiring many minority teachers.
lacks and Latinos, on average, achieve less in school than do whites (National Center for Education Statistics, NCES, 1996).
Researchers have offered various explanations for this social phenomenon. Compared with white students, black and Latino students are more likely to come from families of low socioe- conomic status (SES), live with one parent, and live in high-poverty neighborhoods. They are also more likely to attend inferior schools, and they tend to learn less than do whites even when they attend the same schools (Ainsworth 2002; Kao, Tienda, and Schneider 1996; Oakes 1985; Roscigno 2000).
However, in one area related to achieve- ment, beliefs, blacks and perhaps Latinos have an advantage over whites. Certain beliefs, like educational aspirations, occupational expecta- tions, and attitudes toward school, are related to students' achievement (Ainsworth-Darnell and Downey 1998; Dumais 2002; Portes and Wilson 1976). Both blacks and Latinos have
higher educational aspirations than do whites, especially when differences in family SES are taken into account (Cheng and Starks 2002; Kao and Tienda 1998; Qian and Blair 1999). Blacks also have higher occupational expecta- tions and more pro-school attitudes than do whites (Ainsworth-Darnell and Downey 1998; Coleman et al. 1966; Garrison 1982; but see Mickelson 1990).
In this article, I extend the current under- standing of black-white and Latino-white differ- ences in these beliefs by examining whether they are affected by schools' racial and ethnic mix of students and teachers. As I discuss later, there are reasons to believe that minority-seg- regated schools may both positively and nega- tively influence students' beliefs.
In addition to addressing these theoretical issues, studying the effects of schools' racial and ethnic composition on students' beliefs has important policy implications because of the current extent of segregation. Fifty years have
Sociology of Education 2004, Vol. 77 (April): 121-147 121
This content downloaded from 98.176.112.184 on Tue, 10 Dec 2013 12:47:01 PMAll use subject to JSTOR Terms and Conditions

122 Goldsmith
passed since the landmark case of Brown v. Board of Education, but public schooling in the United States remains highly segregated. Sixty- six percent of blacks and 73 percent of Latinos attend schools in which at least half the stu- dents are not white (Orfield and Yun 1999). However, whites are the most segregated group; their segregation from blacks, Latinos, and Asians is rising and accounts for 80 percent of all school segregation (Reardon 2000). Despite the prevalence and persistence of seg- regation in American schools, few studies have compared students' beliefs across schools with different racial-ethnic compositions.
I begin by reviewing the literature on racial- ethnic differences in beliefs. This literature has generally concluded that the beliefs of blacks and Latinos are higher (i.e., more optimistic and more pro-school) than are those of whites, at least as measured in surveys, but there is dis- agreement about why they are higher and whether they improve blacks' and Latinos' achievement. After discussing this literature, I explain how schools' student and teacher racial compositions may influence beliefs.
These two discussions are followed by an analysis of nationally representative data from the National Education Longitudinal Study (NELS) on students' beliefs and schools' racial- ethnic composition. The results suggest that Latinos' and blacks' beliefs are more optimistic and more pro-school in segregated-minority schools, especially when these schools also employ many minority teachers. I then exam- ine the influence of these relatively high beliefs on the achievement gaps between these two groups and whites across different school con- texts. This analysis reveals that blacks' and Latinos' relatively high beliefs consistently shrink the black-white and Latino-white gaps in scores on math and reading tests.
REVIEW OF THE LITERATURE
Racial-ethnic Differences in Beliefs and Achievement The relatively positive beliefs of blacks and Latinos will reduce these groups' gaps in achievement with whites only if these beliefs improve achievement. Support for the notion
that aspirations and expectations improve academic performance comes from two cen- tral theories of educational achievement. First, the status attainment model views edu- cational aspirations and occupational expec- tations as mental states-like goals-that affect students' motivation (Sewell and Hauser 1975). This model predicts that opti- mistic students are more motivated and achieve more.
Second, Bourdieu (2000; see also Dumais 2002) suggested that students' orientation to schooling and education originates in their habitus-their sense of the social structure and their place in it. He argued that students who believe they will reach high levels of edu- cation and obtain high-status jobs invest more in education than do their counterparts, who typically withdraw from schooling.
However persuasive these perspectives, the association between beliefs and achieve- ment could be weaker for blacks and Latinos than for whites. Blacks' and Latinos' beliefs appear to be unrelated to their position in the social structure. Although they are more opti- mistic than whites, blacks and Latinos are less likely to attend school beyond college or to enter high-status occupations, and they receive lower pay at most educational levels. In addition, Latinos' and blacks' pro-school attitudes are puzzling because these students often attend inferior schools and are taught less-demanding material (Kozol 1991; Oakes 1985; Orfield and Eaton 1996).
Few doubt that optimism is important for academic achievement, but the aspirations and expectations of blacks and Latinos may be too high to influence it. For example, Alexander, Entwisle, and Bedinger (1994:284) suggested that "resignation to failure will not bring success, but neither will wishful think- ing. The problem with 'too great expecta- tions' . . . is that they lack conditionality and hence are not likely to serve as a useful guide to action."
Others have considered the optimism of blacks to be irrational because they have regarded it as resulting from a lack of infor- mation about mobility processes (Hoelter 1982). Alexander et al. (1994) maintained that overly optimistic expectations indicate students' or their parents' lack of attention to
This content downloaded from 98.176.112.184 on Tue, 10 Dec 2013 12:47:01 PMAll use subject to JSTOR Terms and Conditions

Schools' Racial Mix and Students' Optimism 123
school feedback or lack of skills in using such feedback. Without such attention and skills, students overestimate how successful they will be, and they fail to modify their behavior in ways that will bring their high expectations to fruition. Thus, the lack of information, attention, and skill may account for blacks' and Latinos' relatively great expectations and make their expectations relatively less effec- tive in raising achievement.
The relation between pro-school attitudes and achievement is also controversial, partly because of the weak link between attitudes and behavior, in general, and partly because this relationship has been specifically questioned among blacks (Mickelson 1990; Ogbu 1995a, 1995b). Ogbu (1995b:282), for example, found that blacks profess pro-school attitudes but reported, "Many [blacks] are not trying to behave that way and . .. they are opposed to doing so."
Mickelson (1990) suggested that attitudes are less effective in improving achievement when they are too abstract. Abstract attitudes are formed from the dominant ideology that anyone can become successful by doing well in school. These beliefs, Mickelson said, are unconnected to students' daily lives, and, as a result, they cannot predict achievement. Concrete attitudes, in contrast, are formed from students' experiences. Because these attitudes are more relevant in students' lives, they have more impact on students' academic achieve- ment. Mickelson also demonstrated that blacks' concrete attitudes are less pro-school than are whites' and that concrete attitudes, but not abstract attitudes, predict students' grades, net of differences in family resources.
Ainsworth-Darnell and Downey (1998) also examined racial differences in concrete attitudes. Like Mickelson (1990), they con- cluded that concrete attitudes are related to grades. However, they did not find that blacks' concrete attitudes are less pro-school than are those of whites; they found the opposite. Furthermore, their conclusion was the opposite of Mickelson's: Racial differences in concrete attitudes did not widen the black- white achievement gap; they reduced it.
Although Mickelson (1990) did not address whether educational aspirations and occupa- tional expectations should be considered
abstract or concrete beliefs, these aspirations and expectations probably contain a mixture of both. Aspirations and expectations are overly optimistic in adolescence and decline in the 12th grade (Kerckhoff 1977). This decline sug- gests that students' expectations and aspira- tions become less abstract-and more con- crete-as children age (Kao and Tienda 1998).
A concrete component of expectations and aspirations may result from comparing one's chances for success to those of others. If blacks and Latinos compare their chances for success to those of whites, a relatively high-achieving group, then they will be pessimistic about their future (Ogbu 1995a). However, Kao and Tienda (1998) found that blacks and Latinos compare their chances of success to those of their in-group peers, who are relatively low achieving. MacLeod (1995), who studied a small sample of blacks in a working-class neigh- borhood, found that they compared their chances of success to what their parents accomplished, and because of affirmative action and civil rights laws, these young blacks thought that they were likely to achieve upward mobility. These explanations suggest a relatively concrete base for minorities' positive beliefs and suggest that such beliefs may lead students to invest in their education.
Thus, the literature on racial and ethnic dif- ferences in beliefs has consistently shown that blacks and Latinos have higher beliefs than do whites, but researchers still debate whether minorities' beliefs improve achievement. Moreover, few recent studies have considered whether schools' racial and ethnic mix of teachers and students affects students' beliefs. Schools' student mix is believed to shape students' values, expectations, atti- tudes, and behaviors independently of each student's particular SES or racial background (Alwin and Otto 1977; Coleman et al. 1966; Gamoran 1992). The school context may also make students' beliefs more efficacious or less efficacious. I examine these possibilities next.
Schools' Composition and Students' Beliefs
Many studies have examined the relationship between school segregation and achieve- ment, and although the results have been
This content downloaded from 98.176.112.184 on Tue, 10 Dec 2013 12:47:01 PMAll use subject to JSTOR Terms and Conditions

124 Goldsmith
mixed, most studies have found lower achievement in predominantly minority schools (Bankston and Caldas 2002; Crain and Mahard 1983; Orfield and Eaton 1996; Pong 1998). Thus, I begin by considering why segregated minority schools lower stu- dents' optimism or pro-school attitudes, or if they do not lower them, why the beliefs of students who attend minority-segregated schools are less effective in improving achievement.
Ogbu (1995a, 1995b) argued that in- group peers disparage fellow involuntary minorities (e.g., blacks)1 who conform to those values, attitudes, and behaviors that raise achievement. Any influence of involun- tary-minority peers is exacerbated in predom- inantly minority schools because in-group peers surround blacks. For this reason, Farkas, Lleras, and Maczuga (2002) suggested that blacks who hold pro-school attitudes and optimistic beliefs are chastised more in pre- dominantly black schools and thus that fewer blacks profess such attitudes and optimism in minority-segregated schools (but see the response by Ainsworth-Darnell and Downey 2002).
In addition, indirect effects of racial segre- gation may worsen schools' normative cli- mate, which is believed to result, in part, from the attitudes and optimism of the individual students who are concentrated in the school. Where optimistic students with pro-school attitudes are concentrated, as is often the case in schools with a high-SES mix of stu- dents, researchers have found that the school climate encourages optimism and pro-school attitudes independently of each student's SES (Coleman et al. 1966; Gamoran 1992). Because of the relatively low-SES background of blacks and Latinos, racial segregation clus- ters poor students and thus fosters climates that lower students' beliefs. Orfield and Eaton (1996:53-54), for example, noted that the concentration of poverty in minority-segre- gated schools results in "low levels of compe- tition and expectation ... [and] peer pressure against academic achievement."
Bankston and Caldas (2002) agreed that minority-segregated schools lack optimistic and pro-school climates, but they argued that the climate is also degraded from the con-
centration of students from single-parent families. Rates of single-parent families are higher in predominantly-minority schools because blacks' and Latinos' families are more likely to be headed by single mothers than are whites', and a concentration of students from single-parent families has been shown to lower achievement (Pong 1998). Because stu- dent-parent contact improves students' beliefs (Qian and Blair 1999), concentrating students from single-parent families may also worsen the schools' climate (Bankston and Caldas 2002).
Predominantly-minority schools also clus- ter students from poor neighborhoods because blacks' and Latinos' neighborhoods are often much poorer than are those of whites (Massey and Denton 1993; Wilson 1987). According to Wilson (1987), norms about the importance of school weaken in poor neighborhoods because social isolation separates these students from the pro-school beliefs in mainstream American culture. Similarly, Massey and Denton (1993) agreed with Ogbu's (1995a, 1995b) view that black peer groups chastise those who adopt atti- tudes and behaviors that are conducive to achievement, but they claimed that this situ- ation arises from the concentration of pover- ty in ghettos, rather than from blacks' status as an involuntary minority group. The con- centration of blacks and Latinos from poor neighborhoods in segregated-minority schools may create a normative climate of low expec- tations and antischool attitudes.
Despite these reasons for predicting lower beliefs in minority-segregated schools, studies that have compared blacks' aspirations and expectations in desegregated and segregated schools have shown either no differences or more optimism among blacks in black-segre- gated schools (Falk 1978; Hoelter 1982; White and Knight 1973). These researchers have argued that segregated-black schools improve students' beliefs by reducing their knowledge about their low chances of being successful. Segregated-minority schools may also raise students' beliefs by concentrating students and/or parents who are relatively less skilled in responding to school feedback. Thus, highly optimistic and pro-school atti- tudes among students in segregated-minority
This content downloaded from 98.176.112.184 on Tue, 10 Dec 2013 12:47:01 PMAll use subject to JSTOR Terms and Conditions

Schools' Racial Mix and Students' Optimism 125
schools may result from a lack of information and skill; attitudes formed in this way may be particularly ineffective in raising achievement.
However, there are also reasons to believe that segregated-minority schools improve beliefs without lowering their effectiveness. Kao and Tienda (1998) suggested that in- group peers raise minorities' optimism because blacks and Latinos compare their chances for success to those of in-group peers. The prevalence of in-group peers in minority-segregated schools may facilitate this comparison. In addition, one study of aspirations and peer relationships reported that racially mixed and all-black friendship dyads have higher aspirations than do white- white dyads (Hallinan and Williams 1990). This finding implies that peer effects in segre- gated-minority schools raise students' opti- mism and perhaps their pro-school attitudes.
Moreover, the concentration of blacks and Latinos in segregated schools may improve the school climate because these students, all else being equal, are relatively optimistic and have pro-school attitudes. If school climates result from individual students' beliefs, then predominantly black and Latino schools will create a normative climate that promotes pro-school attitudes, high aspirations, and high expectations.
In addition to the effects of peers, teachers may also influence students' beliefs. Ferguson's (1998) review of the literature on teacher effects suggested that teachers often have racially biased perceptions of their stu- dents and that minority students are especial- ly sensitive to teachers' perceptions. This bias may be reduced by having a teacher of the same race. Ehrenberg, Goldhaber, and Brewer (1995), who examined this issue with NELS data, found that students receive mod- estly higher-than-average evaluations from teachers who share their racial, ethnic, and gender identities. Ladson-Billings (1994) argued similarly. She maintained that black teachers' frequent use of cultural referents from black culture and history to impart knowledge and develop skills improves the motivation and performance of black stu- dents.
In contrast, Alexander, Entwisle, and Thompson (1987) found a stronger interac-
tion between teacher's social-class back- ground and students' race. Although all teachers, by definition, have middle-class occupations, their class backgrounds vary. Net of students' competence, teachers from middle-class backgrounds, regardless of race, negatively evaluate low-SES and especially black students, whereas teachers from work- ing-class backgrounds, regardless of race, evaluate students more equally.
Studies of black teachers have suggested that teachers' race interacts with that of their students. Foster (1990, 1997) argued that black teachers are particularly effective teach- ers of black students because of the political messages they convey to their students. Whereas blame-the-victim explanations of racial inequality are common in integrated schools, Foster found that black teachers are committed to undoing the status quo by focusing on the causes and consequences of racial inequality and the unequal power rela- tions in society. This difference, the teachers believe, helps black students do better in school because they learn the political impor- tance of education. Although Foster inter- viewed only black teachers, it is likely that teachers from other racial-ethnic minority groups share similar political perspectives.
In addition to interactions between indi- vidual teachers and students, a school's pro- portion of minority teachers may exert inde- pendent influences on its climate. Ladson- Billings (1994) argued that "culturally rele- vant schools"-that is, schools that are infused with a culturally relevant curricu- lum-have many black students and many black teachers. Perhaps for this reason or for the political messages mentioned earlier, some studies have found positive associations between a school's proportion of minority teachers and the achievement of the school's minority students (Meier, Wrinkle, and Polinard 1999; Weiher 2000).
Foster's (1997) interviews with black teachers also suggested why minority stu- dents' optimism and pro-school attitudes may be lower in integrated schools. According to the teachers, it is difficult to convey relevant, political messages to black students in these schools. While the teachers noted that integrated schools had better facil-
This content downloaded from 98.176.112.184 on Tue, 10 Dec 2013 12:47:01 PMAll use subject to JSTOR Terms and Conditions

126 Goldsmith
ities and equipment, they were critical of tracking systems, lowered expectations, and other mechanisms that subordinate black stu- dents. As one teacher put it, "In the white school we get more materials, we have more to work with, but we-blacks-aren't appre- ciated as much" (p. xxxix). Moreover, inte- grated schools often develop hierarchical tracking systems, and the best teachers and best resources are directed toward the higher, predominantly white, tracks (Ladson-Billings 1994).
Segregated-minority schools with many minority teachers may be infused with a polit- ically and culturally relevant curriculum. Integrated schools and predominantly white schools, in contrast, may have more-unequal reward and tracking systems. These school differences may lead to more pro-school atti- tudes and greater optimism among blacks and Latinos in predominantly minority schools that employ many minority teachers.
DATA AND MEASUREMENT
My analysis addressed three questions. First, are blacks and Latinos more likely than whites to have high occupational expectations, edu- cational aspirations, and pro-school attitudes, all else being equal? Second, does schools' racial and ethnic mix of students and teachers influence the beliefs of blacks, whites, and Latinos? Third, do black-white and Latino- white differences in beliefs reduce the gaps in achievement between these groups?
I selected the base-year sample of the NELS to answer these questions. This study, conducted in 1988, used a stratified-random sample of 24,599 eighth graders in 1,052 public and private schools and contains sur- vey data collected from students, parents, teachers, and school principals. The base year is more applicable than are other waves of the NELS for this analysis because it contains rela- tively more students per school, about 24 (NCES 1992), thereby improving the estima- tion of school effects and student effects.
The base-year sample is also better than other waves for studying the controversial link between beliefs and achievement among blacks and Latinos. The beliefs of blacks and
Latinos are thought to be less efficacious when they are too unrealistic or too abstract (Alexander et al. 1994; Mickelson 1990). Eighth-graders' beliefs are more likely to have these characteristics than are those of older students because beliefs become more realis- tic and concrete as students age (Kao and Tienda 1998; Kerckhoff 1977).
This focus on beliefs that are potentially ineffective is also mirrored in the measure- ment of the belief variables. To focus on beliefs that are the most likely to be unrealis- tic and/or abstract, I measured students' beliefs with dichotomous variables signaling whether the student had a very high belief or not (1 = very high, 0 = not very high). By measuring the beliefs this way, more can be learned about the causes and consequences of very high beliefs.
Five different beliefs were measured. The first, high occupational expectations, codes students who expect to be professionals or managers by age 30. The second, high edu- cational aspirations, codes students who aspire to go to a higher school after college (i.e., to a professional or graduate school). The other three are measures of students' concrete attitudes and were created from multiple, underlying questions.2 They flag students with high attitudes toward (1) the teachers or the teaching in their school, (2) their math and science classes, and (3) their English and history classes. These attitudinal measures are considered concrete (derived from experiences), rather than abstract (derived from ideologies), because the ques- tions are about students' actual teachers and classes. The underlying questions are also identical or similar to those used by Ainsworth-Darnell and Downey (1998).
Racial-ethnic background was coded from the RACE composite variable with dummy variables for non-Hispanic blacks and Latinos (1 = yes for both). Non-Hispanic whites are the reference category. Observed differences among Latinos by nationality are discussed in the Results section.
Measures of schools' racial and ethnic mix of students and teachers were taken from the principals' reports of the percentage of stu- dents in each of five racial-ethnic categories, the number of full-time teachers, and the
This content downloaded from 98.176.112.184 on Tue, 10 Dec 2013 12:47:01 PMAll use subject to JSTOR Terms and Conditions

Schools' Racial Mix and Students' Optimism 127
number of full-time teachers in each of five racial-ethnic categories. The key issues in measuring these effects are, first, whether the measure or measures should sum the black and Latino proportions together, as is usually done (see, e.g., Pong 1998; Roscigno 2000) or model them separately, which is rarer (e.g., see Goldsmith 2002). The second issue is whether to use continuous or discrete mea- sures.
The theories discussed earlier disagree on whether to combine the peer effects of blacks and Latinos into a single measure. Farkas et al.'s (2002) extension of Ogbu (1995a, 1995b) suggests that the effects of black and Latino peers will differ because blacks are con- sidered an involuntary minority while Latinos are considered a mixture of voluntary and involuntary minorities (see note 1). Because only involuntary minorities are believed to oppose pro-school beliefs, black peers' influ- ence should be more negative than Latino peers', although both effects may be negative.
The other explanations suggest combining the effects of black and Latino peers. Schools with many black and/or many Latino students will improve beliefs because (1) they facilitate comparisons with low-achieving students; (2) they concentrate students with optimistic and pro-school attitudes, improving the climate; (3) they isolate students from information about what is required for academic and occupational success; and (4) they have many students who lack skills in using school feed- back to establish realistic expectations.
Preliminary analyses showed that blacks' beliefs are positively, not negatively, influ- enced by the presence of many blacks. Given that the only explanation for separate effects of black and Latino peers predicts negative effects of proportion black, this explanation was ruled out, and the effects of black and Latino peers were consequently combined. Moreover, in models not shown, I found that blacks and Latinos respond similarly to having both many blacks and many Latinos in their school, which is further support for combin- ing these peer effects into a single measure.
The explanations reviewed earlier also dis- agree about whether or not to combine black and Latino teacher effects. One possibility is that students' beliefs will improve by simply
having a same-race teacher (Ehrenberg et al. 1995; Ladson-Billings 1994). In contrast, the other explanations suggest combining black and Latino teacher effects. Alexander et al. (1987) suggested that it is a working-class background-which blacks and Latinos are likely to share in greater proportion than are whites-that benefits black and, by exten- sion, Latino, students. Moreover, Foster's (1997) contention that it is the political mes- sages of black teachers that improves black students' attitudes toward school can also be extended to Latinos, who share blacks' posi- tion as a subordinate group. Finally, a con- centration of either black or Latino teachers is likely to reduce the use of racially unequal practices in a school (e.g., tracking systems).
Unfortunately, although the NELS data contain information on many students in many schools, they lack sufficient information for testing whether these teacher effects should be combined. The sample includes only 10 blacks in schools in which Latinos are 30 percent or more of the teachers and just 210 Latinos in schools in which blacks are 30 percent or more of the teachers. The infor- mation gleaned from these few Latinos was examined in models not shown and indicated that Latinos respond similarly to the presence of many black teachers and many Latino teachers (but this finding should be interpret- ed cautiously because of the small sample). On the basis of this finding, the effects of black and Latino teachers were combined as well.
The second issue is whether to use contin- uous or discrete measures. A preliminary analysis revealed that schools' combined pro- portion of black and Latino students has con- sistently positive effects on students' beliefs. The same variable for teachers also has posi- tive effects, but not quite as consistently. However, in models that include both student and teacher proportions, along with interac- tions to estimate different slopes for different groups, serious multicolinearity problems arise.3 A closer examination of the data revealed that almost all the schools with a majority of white students also had a majori- ty of white teachers, but some schools with a majority of minority students had many white teachers, while others did not.
This content downloaded from 98.176.112.184 on Tue, 10 Dec 2013 12:47:01 PMAll use subject to JSTOR Terms and Conditions
128 Goldsmith
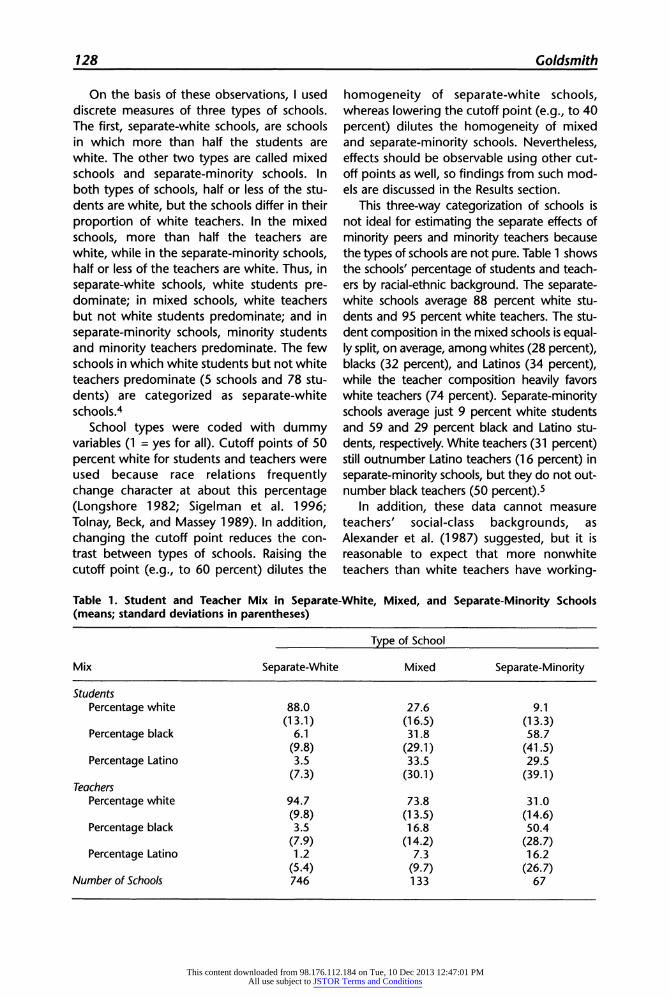
On the basis of these observations, I used discrete measures of three types of schools. The first, separate-white schools, are schools in which more than half the students are white. The other two types are called mixed schools and separate-minority schools. In both types of schools, half or less of the stu- dents are white, but the schools differ in their proportion of white teachers. In the mixed schools, more than half the teachers are white, while in the separate-minority schools, half or less of the teachers are white. Thus, in separate-white schools, white students pre- dominate; in mixed schools, white teachers but not white students predominate; and in separate-minority schools, minority students and minority teachers predominate. The few schools in which white students but not white teachers predominate (5 schools and 78 stu- dents) are categorized as separate-white schools.4
School types were coded with dummy variables (1 = yes for all). Cutoff points of 50 percent white for students and teachers were used because race relations frequently change character at about this percentage (Longshore 1982; Sigelman et al. 1996; Tolnay, Beck, and Massey 1989). In addition, changing the cutoff point reduces the con- trast between types of schools. Raising the cutoff point (e.g., to 60 percent) dilutes the
homogeneity of separate-white schools, whereas lowering the cutoff point (e.g., to 40 percent) dilutes the homogeneity of mixed and separate-minority schools. Nevertheless, effects should be observable using other cut- off points as well, so findings from such mod- els are discussed in the Results section.
This three-way categorization of schools is not ideal for estimating the separate effects of minority peers and minority teachers because the types of schools are not pure. Table 1 shows the schools' percentage of students and teach- ers by racial-ethnic background. The separate- white schools average 88 percent white stu- dents and 95 percent white teachers. The stu- dent composition in the mixed schools is equal- ly split, on average, among whites (28 percent), blacks (32 percent), and Latinos (34 percent), while the teacher composition heavily favors white teachers (74 percent). Separate-minority schools average just 9 percent white students and 59 and 29 percent black and Latino stu- dents, respectively. White teachers (31 percent) still outnumber Latino teachers (16 percent) in separate-minority schools, but they do not out- number black teachers (50 percent).5
In addition, these data cannot measure teachers' social-class backgrounds, as Alexander et al. (1987) suggested, but it is reasonable to expect that more nonwhite teachers than white teachers have working-
Table 1. Student and Teacher Mix in Separate-White, Mixed, and Separate-Minority Schools (means; standard deviations in parentheses)
Type of School
Mix Separate-White Mixed Separate-Minority
Students Percentage white 88.0 27.6 9.1
(13.1) (16.5) (13.3) Percentage black 6.1 31.8 58.7
(9.8) (29.1) (41.5) Percentage Latino 3.5 33.5 29.5
(7.3) (30.1) (39.1) Teachers
Percentage white 94.7 73.8 31.0 (9.8) (1 3.5) (14.6)
Percentage black 3.5 16.8 50.4 (7.9) (14.2) (28.7)
Percentage Latino 1.2 7.3 16.2 (5.4) (9.7) (26.7)
Number of Schools 746 133 67
This content downloaded from 98.176.112.184 on Tue, 10 Dec 2013 12:47:01 PMAll use subject to JSTOR Terms and Conditions

Schools' Racial Mix and Students' Optimism 129
class backgrounds. Moreover, students' beliefs may be affected by having a minority teacher and by attending a school that employs many minority teachers. In this analysis, both these effects are captured by the dummy variable for separate-minority schools because there is no control for the race or ethnicity of each student's teachers. Despite these shortcomings, this categoriza- tion allowed me to compare students' beliefs in predominantly minority and predominant- ly white schools and whether the effects of predominantly minority schools differ by their proportions of minority teachers.
The models presented here also include a number of control variables. I included four contextual-level control variables: residential- neighborhood poverty rate, mean student SES, proportion of students in single-parent families, and whether the school is private.
Students' residential-neighborhood pover- ty rate was taken from the 1990 census. Similar to other national-level data on resi- dential areas, the census does not contain information on actual neighborhood bound- aries, which creates measurement error. Researchers minimize this problem by using the smallest ecological units available. Although the census contains information at the levels of blocks and tracts, the smallest ecological area that can be merged with the NELS is the five-digit zip-code area. The rela- tively large area is likely to make estimated neighborhood effects imprecise. To be consis- tent with theories of neighborhood effects (Massey and Denton 1993; Wilson 1987), I measured them with the poverty rate (i.e., the fraction of persons who are poor).
The mean SES of schools' students is the average SES from students who were sampled within each school. SES is a standard, normal variable created by the NCES that summa- rizes information on parental education, income, occupation, and household posses- sions. The schools' proportion of students from single-parent families was measured from the midpoints of a categorical scale on the principals' questionnaire. School sector was measured with a dummy variable for pri- vate schools (1 = yes), taken from the school data file.
Students' individual SES was also included
to account for the positive effects of family SES on beliefs (Ainsworth-Darnell and Downey 1998; Kao and Tienda 1998). I also accounted for family structure because more contact between parents and their children is believed to raise aspirations and possibly other beliefs (Qian and Blair 1999). BYF- COMP, a variable created by the NCES, was used to form a dummy variable flagging fam- ilies with both biological parents (1 = yes), and BYFAMIZ, also created by the NCES, was used to measure the total family size. I also controlled for the effects of prior achievement on beliefs with a dummy variable signaling whether or not the student had repeated a grade (1 = yes), as reported retrospectively by students. In addition, I controlled for nativity effects (Kao and Tienda 1995; Ogbu 1995a, 1995b) by including dummy variables for for- eign-born students and another for students with one or more foreign-born parents (1 = yes for both). Both were taken from the par- ent questionnaire. To measure achievement, I used scores on standardized math (BY2XMSTD) and reading (BY2XRSTD) tests. Both tests are normally distributed with a mean of 50 and a standard deviation of 10 (over the entire base-year sample). Data on regions and places were taken from the stu- dent file.
The sample included all students who self- reported themselves as Hispanic (of any race or ethnicity), black, or white. Other racial-eth- nic groups, though of interest, are beyond the scope of this article. In addition, the sam- ple was limited to students with valid data for all variables except the variables for nativity effects. The large number of missing cases for these variables required me to use mean sub- stitution. Dummy variables were added to flag where mean substitution occurred.
ANALYTIC STRATEGY
Two sets of models are presented, one set using the five beliefs as the dependent vari- ables and the other set using scores on the math and reading tests as the dependent variables. Both sets use multilevel models (Goldstein 1995). These models are advanta- geous in situations in which Level-1 units (i.e.,
This content downloaded from 98.176.112.184 on Tue, 10 Dec 2013 12:47:01 PMAll use subject to JSTOR Terms and Conditions

130 Goldsmith
students) are clustered within Level-2 units (i.e., schools) because both models can be estimated simultaneously. The intercept is allowed to vary by school to control for unmeasured school effects. Also, standard errors are adjusted to account for the cluster- ing of students in schools, and the degrees of freedom for school effects are based on the number of schools, rather than the number of students. The multilevel models can be writ- ten as follows:
Yij =
700oo + cfq Xq + 1FmZm + !oj + rij,
where Y represents the dependent variable (either a belief or a test score), Yoo is the aver- age value of Y across schools when other vari- ables equal zero, X represents the q student- level variables with fixed effects, Z represents the m school-level variables, o0j is the error associated with the jth school, and rij is the error associated with the ith student in the jth school. oj is assumed independent of rij.
When the dependent variable is a dichoto- mous measure of high beliefs, this multilevel model is mixed with logistic regression. Logistic regression restricts the predicted out- comes to values between zero and one and eliminates the heteroscedascity created by using linear models to predict dichotomous outcomes (Agresti 1990). The mixed multi- level models were estimated in the GLIMMIX macro in SAS PROC MIXED (Littell et al. 1996).
Coefficients in logistic regression are log- odds ratios. Exponentiating them changes them to odds ratios and eases their interpre- tation. For example, an effect of the dummy variable black equal to 0.3 indicates that blacks are (exp 0.3 =) 1.35 times more likely than is the reference group (whites) to report a high belief. The probability of reporting a high belief can also be estimated, but it is complicated by the need to account for the level of all independent variables when inter- preting the effect of any single coefficient. To ease the use of probabilities, all independent variables save the dummy variables designat- ing race, ethnicity, gender, and school type are grand-mean centered in the multivariate models. Next, I discuss the characteristics of black, white, and Latino students in these
data across the separate-white, mixed, and separate-minority schools.
RESULTS
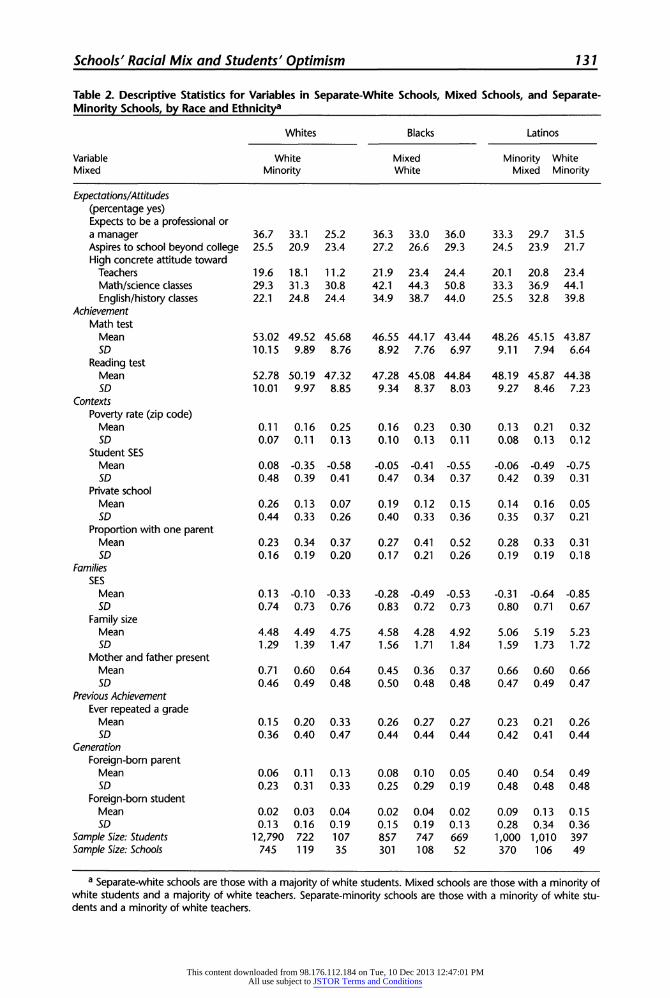
Characteristics of Students, by Race-Ethnicity and Type of School Table 2 presents descriptive statistics for each variable by group and type of school. Looking at the sample size for each school type shows the extent of school segregation. Ninety-four percent (n = 12,790) of whites attend sepa- rate-white schools, and only 5 percent (n = 722) and 1 percent (n = 107) of whites attend mixed and separate-minority schools, respec- tively. Blacks and Latinos are spread more evenly across school types. Thirty-eight per- cent (n = 857), 33 percent (n = 747), and 29 percent (n = 669) of blacks attend separate- white schools, mixed schools, and separate- minority schools, respectively. The respective percentages for Latinos are 42 (n = 1,000), 42 (n = 1,010), and 16 (n = 397).
Table 2 also shows how students' contexts, families, and scores on standardized tests dif- fer by race-ethnicity and school type. Disadvantages are usually greater for blacks and Latinos than for whites, and they usually increase with the schools' minority represen- tation. Neighborhood poverty rates, for example, are 0.11, 0.16, and 0.25 for whites who attend separate-white, mixed, and sepa- rate-minority schools, respectively. These rates are higher for blacks (0.16, 0.23, and 0.30, respectively) and Latinos (0.13, 0.21, and 0.32, respectively), but they also rise with the schools' minority representation. Similar patterns exist for the other variables measur- ing students' contexts and families. A not unexpected finding is that whites' scores on the eighth-grade math test (53, 49, and 46, respectively) decline across school types. They are also higher than those of blacks (47, 44, and 43, respectively), with Latinos (48, 45, and 44, respectively) falling in between. Scores on reading tests are distributed simi- larly.
The substantial differences among stu- dents across the three types of schools indi- cate that multilevel models, which hold these
This content downloaded from 98.176.112.184 on Tue, 10 Dec 2013 12:47:01 PMAll use subject to JSTOR Terms and Conditions
Schools' Racial Mix and Students' Optimism 131
Table 2. Descriptive Statistics for Variables in Separate-White Schools, Mixed Schools, and Separate- Minority Schools, by Race and Ethnicitya
Whites Blacks Latinos
Variable White Mixed Minority White Mixed Minority White Mixed Minority
Expectations/Attitudes (percentage yes) Expects to be a professional or a manager 36.7 33.1 25.2 36.3 33.0 36.0 33.3 29.7 31.5 Aspires to school beyond college 25.5 20.9 23.4 27.2 26.6 29.3 24.5 23.9 21.7 High concrete attitude toward Teachers 19.6 18.1 11.2 21.9 23.4 24.4 20.1 20.8 23.4 Math/science classes 29.3 31.3 30.8 42.1 44.3 50.8 33.3 36.9 44.1 English/history classes 22.1 24.8 24.4 34.9 38.7 44.0 25.5 32.8 39.8
Achievement Math test
Mean 53.02 49.52 45.68 46.55 44.17 43.44 48.26 45.15 43.87 SD 10.15 9.89 8.76 8.92 7.76 6.97 9.11 7.94 6.64
Reading test Mean 52.78 50.19 47.32 47.28 45.08 44.84 48.19 45.87 44.38 SD 10.01 9.97 8.85 9.34 8.37 8.03 9.27 8.46 7.23
Contexts Poverty rate (zip code)
Mean 0.11 0.16 0.25 0.16 0.23 0.30 0.13 0.21 0.32 SD 0.07 0.11 0.13 0.10 0.13 0.11 0.08 0.13 0.12
Student SES Mean 0.08 -0.35 -0.58 -0.05 -0.41 -0.55 -0.06 -0.49 -0.75 SD 0.48 0.39 0.41 0.47 0.34 0.37 0.42 0.39 0.31
Private school Mean 0.26 0.13 0.07 0.19 0.12 0.15 0.14 0.16 0.05 SD 0.44 0.33 0.26 0.40 0.33 0.36 0.35 0.37 0.21
Proportion with one parent Mean 0.23 0.34 0.37 0.27 0.41 0.52 0.28 0.33 0.31 SD 0.16 0.19 0.20 0.17 0.21 0.26 0.19 0.19 0.18
Families SES
Mean 0.13 -0.10 -0.33 -0.28 -0.49 -0.53 -0.31 -0.64 -0.85 SD 0.74 0.73 0.76 0.83 0.72 0.73 0.80 0.71 0.67
Family size Mean 4.48 4.49 4.75 4.58 4.28 4.92 5.06 5.19 5.23 SD 1.29 1.39 1.47 1.56 1.71 1.84 1.59 1.73 1.72
Mother and father present Mean 0.71 0.60 0.64 0.45 0.36 0.37 0.66 0.60 0.66 SD 0.46 0.49 0.48 0.50 0.48 0.48 0.47 0.49 0.47
Previous Achievement Ever repeated a grade
Mean 0.15 0.20 0.33 0.26 0.27 0.27 0.23 0.21 0.26 SD 0.36 0.40 0.47 0.44 0.44 0.44 0.42 0.41 0.44
Generation Foreign-born parent
Mean 0.06 0.11 0.13 0.08 0.10 0.05 0.40 0.54 0.49 SD 0.23 0.31 0.33 0.25 0.29 0.19 0.48 0.48 0.48
Foreign-born student Mean 0.02 0.03 0.04 0.02 0.04 0.02 0.09 0.13 0.15 SD 0.13 0.16 0.19 0.15 0.19 0.13 0.28 0.34 0.36
Sample Size: Students 12,790 722 107 857 747 669 1,000 1,010 397 Sample Size: Schools 745 119 35 301 108 52 370 106 49
a Separate-white schools are those with a majority of white students. Mixed schools are those with a minority of white students and a majority of white teachers. Separate-minority schools are those with a minority of white stu- dents and a minority of white teachers.
This content downloaded from 98.176.112.184 on Tue, 10 Dec 2013 12:47:01 PMAll use subject to JSTOR Terms and Conditions

132 Goldsmith
differences constant, are necessary to deter- mine whether school type influences beliefs, but before I turn to those analyses, I briefly discuss the racial-ethnic differences in the raw data. The top of Table 2 shows the percent- age of students who reported high beliefs, by race-ethnicity and school type. In these data, the percentage of students with high beliefs is higher among blacks than among whites and Latinos, regardless of school type. The only exception is that whites in separate-white schools are more likely than are blacks or Latinos in these schools to expect to be a pro- fessional or manager. Latinos are also more likely than are whites to have high concrete attitudes regardless of school type, but whites are more likely than are Latinos to have high educational aspirations in separate-white schools and in separate-minority schools.
In addition, the percentage of blacks and Latinos with high concrete attitudes increases with the schools' minority representation. This finding is somewhat surprising because of the characteristics of the students in minor- ity schools. Usually, more-privileged students have more pro-school attitudes, so the higher attitudes of blacks and Latinos in these schools imply that a school effect exists. There are no obvious school-type trends for whites' beliefs, but it is worth noting that the percentage of whites in separate-minority schools with high attitudes toward teachers is low (just 11%, or 12 out of 107 students). To determine whether race-ethnicity and school type independently influence beliefs, I exam- ined the mixed, multilevel models.
Effects of Race and Ethnicity Parameter estimates from the mixed multi- level models are shown in Table 3. Two mod- els, labeled Model 1 and Model 2, are shown for each belief. The first model estimates racial and ethnic differences in the entire sam- ple, and the second estimates school-type effects. Both models include all the control variables.
I begin by briefly discussing the effects of the control variables. In general, students who are more privileged have higher beliefs. Those from high-SES families, those who live with both parents and in small families, those
who attend private schools and schools with a high mean SES, and those who have not repeated a grade are more likely to have high beliefs than are their counterparts. Being for- eign born and having foreign-born parents also tends to improve beliefs.
Although a privileged background usually improves beliefs, there are exceptions. Family structure is unlikely to be a statistically signif- icant predictor of concrete attitudes, and the effect of going to school with many students of single-parent families is not significant for any belief. Moreover, attending schools with high-SES peers lowers beliefs about math/sci- ence classes, and living in zip-code areas with high poverty rates6 raises the chances of hav- ing high educational aspirations and attitudes toward English/history classes. These excep- tions aside, students with contextual and familial advantages are usually more likely to have high beliefs.
Now I examine whether race and ethnicity affect beliefs net of other variables. The coeffi- cients for black and Latino in Model 1, which estimates black-white and Latino-white differ- ences among males, are all positive and signifi- cant. The magnitude of the coefficients indi- cates that blacks' odds of having high beliefs are between (exp 0.26 =) 1.3 (for occupational expectations) and 2.1 (for attitudes toward English/history classes) times greater than are those of similar white males. Latinos' odds of having high beliefs are between 1.2 (for occu- pational expectations) and 1.6 (for attitudes toward English/history classes) times greater than are those of similar white males.
It is known that females generally have higher educational aspirations than do males (Dumais 2002; Kao and Tienda 1998), so it is important to examine whether this tendency extends to other beliefs. The coefficients for female, which estimate gender effects among whites, show that white females are more likely than are similar white males to expect to be a professional or manager, to aspire to school beyond college, and to have high atti- tudes toward teachers. However, they are less likely to have high attitudes toward math/sci- ence classes, as seen by the negative coeffi- cient for female in this model. For attitudes toward English/history classes, there are no gender differences.
This content downloaded from 98.176.112.184 on Tue, 10 Dec 2013 12:47:01 PMAll use subject to JSTOR Terms and Conditions

Table 3. Mixed Multilevel Model Regression of Students' Beliefs onto Race-Ethnicity, School Type, and Other Variables
Concrete Attitude Toward
Expects to Be a Aspires to Math/Science Professional or School Beyond
Manager College Teaching Classes English/History Classes
Variable 1 2 1 2 1 2 1 2 1 2
Race-Ethnicity*School Type White*white school (reference) - - White*mixed school - 0.07 - 0.05 - 0.13 - 0.05 - 0.15 White*minority school - -0.09 - 0.51 ** - -0.27 - -0.04 - -0.02 Black*white school (reference) - - Black*mixed school - 0.02 - 0.29** - 0.28** - 0.12 - 0.21* Black*minority school - 0.22* - 0.48*** - 0.32* - 0.33*** - 0.35*** Latino*white schoo (reference) - - - - - - - - Latino*mixed school - 0.01 - 0.29** - 0.10 - 0.12 - 0.34*** Latino*minority school - 0.24* - 0.42*** - 0.36* - 0.34** - 0.63***
Race/Ethnicity/Gender White (reference) - - Black (1 = yes) 0.26*** 0.22** 0.38*** 0.24** 0.36*** 0.26** 0.56*** 0.49*** 0.74*** 0.68*** Latino (1 = yes) 0.19** 0.17* 0.34*** 0.25** 0.31*** 0.27*** 0.17** 0.11 0.41*** 0.26*** Female (1 = yes) 0.50*** 0.50*** 0.26*** 0.26*** 0.09** 0.09** -0.48*** -0.48*** 0.07 0.07 Black*female 0.10 0.10 0.33*** 0.32*** -0.11 -0.11 0.17 0.16 -0.10 -0.10 Latino*female -0.01 -0.01 0.11 0.10 -0.02 -0.02 0.15 0.15 -0.11 -0.12
School and Neighborhood Context Zip-code poverty rate 0.06 -0.06 0.83*** 0.57** 0.49 0.34 0.37 0.21 0.82*** 0.58** Mean school SES 0.03 0.04 0.25*** 0.31*** 0.20*** 0.25*** -0.22*** -0.18*** -0.08 0.00 Private school (1 = yes) 0.18*** 0.18*** 0.23*** 0.22*** 0.77*** 0.76*** 0.00 -0.01 0.13* 0.11 Proportion with a single parent -0.07 -0.10 0.14 0.07 0.22 0.17 0.01 -0.03 0.24 0.19
Family SES and Structure SES (z-score) 0.51 ** 0.51"** 0.86*** 0.86*** 0.08** 0.07** 0.15*** 0.114*** 0.1 8** 0.1 7*** Family size -0.04*** -0.05*** -0.04*** -0.04*** 0.01 0.01 0.01 0.01 0.03*** 0.03*** Mother and father present 0.11** 0.11** -0.02 -0.02 0.02 0.02 0.05 0.05 0.00 0.00
Previous Achievement Repeated a grade (1 = yes) -0.63*** -0.63*** -0.58*** -0.58*** 0.02 0.02 -0.15*** -0.15*** -0.01 0.00
Continued
0 0 0
0
:0
13
-Al
This content downloaded from 98.176.112.184 on Tue, 10 Dec 2013 12:47:01 PMAll use subject to JSTOR Terms and Conditions

134 Goldsmith
a)
0
a) .0
I-
u
v0
0 a,
o
o
rC
0L o
r-
aV)
-) co
LI
0
0
0 oI
C
0-0 x
LI
800 L10U~2
Nu
Nu
Nu
Nu
a)
,o000 00 S r- C N
do d
66
Or-N ',,00
,N- \0 0
?O oO .
6 O
NN rI,
N \00
C; C; C;
C?
cn L V \ N n
N
CN 0 \0 0 do d
do d
I'N
0_ L )
.o I1
r; o
66 a
4' 4' 4' 4 4' 4' 4' 4 4' 4' 4' 4'
niVt *Cr' Nrf Lf.
66 a- 4' 4' 4 * 4' 4 4' 4' 4'
NyO N\rr
0\0
NO '
>'.II r II
CQ) a - V
CCC a
0 ~) 4- 02
a) C.
0
C
o
(0
4-
eC
E "o
CL
S) o(
oc
-V
a) C
La)
C ~a); v, 0 -
a)u-4-
The black-by-female and Latino-by-female interactions, which test for different race-eth- nicity effects among females, are significant only for one belief (educational aspirations). The nonsignificant interactions mean that black-white and Latino-white differences are the same among males and females and that the sex differences just discussed apply to minority groups as well. The significant and positive interaction between black and female in the model predicting educational aspira- tions shows that black females have a greater advantage over white females than black males have over white males. The model esti- mates that given average levels of other inde- pendent variables, the probability of aspiring to school beyond college is 0.18 for white males, 0.24 for black males, 0.22 for white females, and 0.32 for black females.7
Thus, these data show that all else being equal, blacks and Latinos are more apt to have high beliefs than are whites, regardless of gender. The models also show larger white-black differences in educational aspira- tions between females than between males. Now I consider how school types influence students' beliefs.
School-type Effects, by Race and Ethnicity School-type effects, shown in Table 3 in the columns labeled 2, are modeled with interac- tions between each racial-ethnic group and two of the three types of schools. Separate- white schools are the reference category. The included interactions test whether the type of school affects beliefs within each racial group. For example, the black-by-mixed-school interaction estimates the effect on blacks of attending a mixed school, rather than a sepa- rate-white school.8
First, notice that the main effects of black and Latino, which now estimate racial-ethnic differences among males in separate-white schools instead of the entire sample, are slightly smaller but still significant except in one instance. (The effect of Latino is no longer significant in the model predicting attitudes toward math/science classes.) The black-by-female and Latino-by-female inter- actions are almost completely unchanged
This content downloaded from 98.176.112.184 on Tue, 10 Dec 2013 12:47:01 PMAll use subject to JSTOR Terms and Conditions

Schools' Racial Mix and Students' Optimism 135
from Model 1 to Model 2. Taken together, these findings indicate that gender differ- ences are not affected by type of school and that blacks and Latinos of both genders are more likely than are similar whites to have high beliefs in separate-white schools.
Moreover, school type rarely influences whites' beliefs, as is seen in the lack of signif- icant interactions between school type and white. The only significant interaction for whites indicates that whites' odds of aspiring to school beyond college are 1.7 times greater in separate-minority schools than in separate-white schools, all else being equal. The effect's magnitude is large but of little practical importance because only 1 percent of whites attend these schools.
Blacks' and Latinos' beliefs, in contrast, fre- quently improve in mixed and, especially, in separate-minority schools. Three of the black- by-mixed-school interactions and two of the Latino-by-mixed-school interactions are posi- tive and significant, indicating that blacks and Latinos in mixed schools have higher beliefs than do their counterparts in separate-white schools, all else being equal. The odds ratios for the significant coefficients are between 1.2 and 1.4 for blacks and between 1.3 and 1.4 for Latinos.
Blacks and Latinos attending separate- minority schools are more likely to have high beliefs than are similar blacks and Latinos in separate-white schools for all five beliefs. This finding is indicated by the positive and signif- icant interactions between black or Latino and separate-minority school in all the second models. The magnitudes of the effects are slightly but consistently larger than are the effects associated with attending a mixed school. They indicate that blacks' odds of having a high belief are between 1.2 and 1.6 times greater in predominantly-minority schools than in separate-white schools. For Latinos, the corresponding odds differences are between 1.3 and 1.9 times.9
In sum, the models show that blacks and Latinos are more likely to have high beliefs than are similar whites in separate-white schools and that blacks' and Latinos' odds of having high beliefs are often greater in mixed schools and always greater in separate-minor- ity schools than in separate-white schools.10
For example, the probability of expecting a professional or managerial job in separate- white schools, mixed schools, and separate- minority schools, respectively, is 0.38, 0.40, and 0.36 for white females; 0.46, 0.47, and 0.52 for black females; and 0.42, 0.43, and 0.48 for Latinas when all else equals its grand mean.
In models not shown, I checked for nation- al-origin differences among Latinos. The NELS data allow for comparisons among Mexican, Puerto Rican, Cuban, and Other Latino-origin groups. In the raw data, there are significant differences. For example, 39 percent of Cuban- and 21 percent of Mexican-origin stu- dents aspire to school beyond college. However, only 1 out of 30 tests showed sig- nificant difference among Latinos in models that contained all the control variables.11 These results suggest that the control vari- ables account for differences among Latinos, but this conclusion may be premature. Despite an oversampling of Latinos in the NELS, these data contain only 276 Puerto Rican and 107 Cuban students (as opposed to 1,458 Mexicans), and the category of Other Latino (n = 533) is itself heterogeneous.
In other models, I analyzed school-type effects with more school-type categories. I ranked schools into categories of none, low, medium, and high according to their propor- tion of minority students and their proportion of minority teachers. This ranking created a 4- by-4 table of cells. I then combined cells as needed to ensure that there were at least 80 whites, blacks, and Latinos in each cell. The final categorization included seven types of schools. Models including this categorization of schools, not shown, produced slightly less- consistent effects than did those shown in Table 3, but they showed a similar pattern. Whites' beliefs are rarely influenced by school type, while those of blacks and Latinos are usually most positively affected by attending schools with the highest proportions of minority students and minority teachers. Thus, the NELS data suggest that whites' beliefs are largely independent of school type, while blacks' and Latinos' beliefs tend to be relatively optimistic and pro-school in segre- gated-minority schools that employ many minority teachers.
This content downloaded from 98.176.112.184 on Tue, 10 Dec 2013 12:47:01 PMAll use subject to JSTOR Terms and Conditions

136 Goldsmith
Racial-Ethnic Differences in Beliefs and the Gap in Test Scores To determine whether blacks' and Latinos' relatively high beliefs reduce their gaps in achievement with whites, I estimated multi- level models predicting scores on reading and math tests. Two models are estimated for each test. They are the same, except that the second holds differences in beliefs constant. In the first model, without beliefs held con- stant, any advantage that blacks and Latinos accrue from having relatively high beliefs will be picked up by the black and Latino dummy variables, reducing the estimated size of the gap in test scores. In the second model, in which beliefs are held constant, the gaps are estimated net of differences in beliefs. Comparing the gaps across the two models shows whether differences in beliefs influence the test-score gaps.
In both models, separate black-white and Latino-white gaps are estimated for males and females by including black-by-female and Latino-by-female interactions. Two- and three-way interactions between these interac- tions and school type are also included so that the gaps can be estimated for each type of school because blacks and Latinos may experience the largest gains in separate- minority schools, where their beliefs are usu- ally the highest.
In the second model, in which beliefs are held constant, each belief is entered as a main effect and in a number of interactions. The main effects are the effects on whites in sepa- rate-white schools. The interactions include all those that are necessary to allow slopes to vary by race-ethnicity and school type. These interactions are included because high beliefs may be less effective for blacks and Latinos (Alexander et al. 1994) and for the relatively low-SES students in mixed and separate- minority schools.12
Both models also hold constant the same independent variables as those used to pre- dict beliefs (shown in Table 3). In addition, all other independent variables, including the belief variables and except black, Latino, female, and school types, are grand-mean centered. In this way, the estimated gaps are those for which the beliefs equal their grand
mean. Also, I included the belief about math/science classes only in the model pre- dicting scores on the math test and the belief about English/history classes only in the model predicting scores on the reading test.
Efficacy of Beliefs, by School Type Table 4 shows the estimated effects of hav- ing high beliefs on scores on the math and reading tests. The main effects of the belief variables on whites in separate-white schools are generally strong and robust. In separate-white schools, expecting to be a professional or manager raises whites' scores on the math test by 2.5 points and whites' scores on the reading test by 2.2 points. Test scores are normally distributed in the entire NELS sample with a standard deviation of 10, so these effects can be rewritten as approximately 0.25 and 0.22 standard deviations. The effects of high educational aspirations for these students are slightly larger (3.0 points in math and 3.1 points in reading), but the effects of concrete attitudes are weaker. Having high attitudes toward classes raises their math scores by 1.9 points and their reading scores 1.3 points, and having high attitudes toward teachers has no effect on math scores and a small (0.5 points) but signifi- cant effect on reading scores.
Do blacks and Latinos, or whites in other types of schools, benefit less from having high beliefs than do whites in separate-white schools? The interactions testing these ques- tions are also shown in Table 4. Each interac- tion tests whether the slope for whites in sep- arate-white schools is different than it is for each of the other combinations of race-eth- nicity by school type. Negative interactions mean that whites in separate-white schools benefit more. For example, the black-by- mixed-school-by-attitude-toward-classes interaction (-1.17) in the model predicting scores on the math test indicates that this attitude has less of an effect on blacks in mixed schools than it has on whites in sepa- rate-white schools.
The table shows that in the model predict- ing scores on the math test, 10 of the 32 interactions are significant and negative, and
This content downloaded from 98.176.112.184 on Tue, 10 Dec 2013 12:47:01 PMAll use subject to JSTOR Terms and Conditions

Schools' Racial Mix and Students' Optimism 137
Table 4. Multilevel Model Estimates of the Effects of Beliefs on Test Scores, with Interactions by Race-Ethnicity and School Type
Variablea Math Test Reading Test
Main Effects (effects for whites in separate-white schools)
Expects professional or managerial job 2.53*** 2.23*** Aspires to school beyond college 2.99*** 3.12*** Attitude toward teaching 0.03 0.48*** Attitude toward classesb 1.87*** 1.26***
Interactions Separate- Separate- Separate- Separate- White Mixed Minority White Mixed Minority
Whites by School Type Expects professional or managerial job -0.50 -3.21* -1.25* -2.29 Aspires to school beyond college 0.03 -0.33 0.04 -0.36 Attitude toward teaching 0.68 2.80 0.22 1.53 Attitude toward classes -1.84*** -0.25 -1.07 -1.74
Latinos by School Type Expects professional or.managerial job -0.27 -0.77 -1.50* -0.85 -0.98 -1.90** Aspires to school beyond college -0.48 -0.54 -1.16 -0.29 -0.62 2.68*** Attitude toward teaching 0.59 -0.41 -0.29 0.35 0.27 0.32 Attitude toward classes -1.66*** -0.84 -0.89 -1.03 -2.08*** -1.42
Blacks by School Type Expects professional or managerial job -1.42** -0.63 -1.38** -1.04 -1.15* -0.86 Aspires to school beyond college -0.85 -1.25* -1.99*** -0.01 -1.10 -1.73** Attitude toward teaching -0.23 -0.77 0.95 0.13 -1.19 0.36 Attitude toward classes -1.43*** -1.17* -0.16 -2.09*** -0.94 -0.96
aVariables that are not shown include dummy variables for race-ethnicity, gender, and school type and the interactions between them to estimate different racial-ethnic gaps by school type and gender. In addition, the models include the same variables as those shown in Table 3.
bAttitude toward math/science classes was used to predict scores on the math test, and attitude toward English/history classes was used to predict scores on the reading test.
*p < .05 (one-tailed test), **p < .05 (two-tailed test), ***p < .01 (two-tailed test). A one-tailed test was used if the effect was not significant on a two-tailed test and the effect was negative (the pre- dicted direction).
in the model predicting scores on the reading test, 7 of the 32 interactions are significant and negative. There are no positive, signifi- cant interactions. In addition, out of the 62 interactions, 51 have a negative sign, many more than would be expected on the basis of chance. The negative interactions are slightly concentrated among blacks. The table shows that 9 of the 24 interactions involving blacks, 5 of the 24 involving Latinos, and 3 of the 16 involving whites are negative and significant.
Differences in slopes probably occur because of differences in students' and par- ents' skills and resources in developing behav-
ioral strategies for raising students' achieve- ment to match their high beliefs (Ainsworth- Darnell and Downey 1998, 2002; Alexander et al. 1994). The relatively lower slopes of blacks, Latinos, and whites in mixed and sep- arate-minority schools suggest that these stu- dents or their parents have fewer of these resources than do white students who attend separate-white schools.
However, the results also suggest that whites, blacks, and Latinos all benefit from having high beliefs, regardless of the type of school. Most of the interactions are not sig- nificant, and even among the significant
This content downloaded from 98.176.112.184 on Tue, 10 Dec 2013 12:47:01 PMAll use subject to JSTOR Terms and Conditions

138 Goldsmith
ones, the overall effects usually remain posi- tive. For example, the effect of having high educational aspirations for blacks in separate- minority schools, which is the sum of the cor- responding interaction (-1.99) and the main effect (2.99), is still positive (2.99 - 1.99 = 1.00). This pattern is generally true through- out, although there are exceptions. Thus, it appears that high beliefs are less effective for blacks and Latinos than they are for whites in separate-white schools, but high beliefs usu- ally have positive effects on all the different groups of students.
Differences in High Beliefs and the Gaps in Test Scores I now examine how much the gaps in test scores change from the first model to the sec- ond one. The estimated gaps in test scores are shown in Table 5, while the coefficients used to calculate these gaps are shown in the appendix. The formulas used to estimate the gaps are shown in the notes to Table 5. Each gap compares students in the same type of school and of the same gender. For example, the gap shown for black males in separate- white schools is the gap between black males and white males attending separate-white schools, all else being equal.
The columns labeled Gap 1 are those gaps estimated without beliefs held constant (that is, in Model 1), and the columns labeled Gap 2 are those gaps estimated with beliefs held constant at their grand mean and the slopes for each belief allowed to vary by race, ethnicity, and type of school (that is, in Model 2). The column labeled Change shows the differences in the gaps (change = Gap 2 - Gap 1). If blacks' and Latinos' relatively high beliefs reduce the gaps in test scores, then the gaps should be more negative in Model 2 than in Model 1, and the changes will be negative. The changes will be positive if whites' higher slopes make up for their lower levels on each belief.
The table shows that the changes in the gaps are negative for blacks and Latinos of both genders, across all types of schools, and for both tests without exception. For exam- ple, the black-white gap among males in mixed schools is -2.8 without beliefs held constant and -3.4 with beliefs held constant,
a change of -0.6. The gap would be larger if whites' and blacks' beliefs were equal.
The magnitude of the changes is small, ranging from -0.1 to -0.7, meaning that blacks' and Latinos' relatively high beliefs reduce the gap by less than one point or less than one-tenth of a standard deviation. The percentage that the gap is reduced, all else being equal, is shown in the fourth column (percentage reduced = change / Gap 2 * 100%). These reductions range from 2 per- cent to 29 percent for blacks and from 7 per- cent to 74 percent for Latinos. The smallest changes are in separate-white schools (rang- ing from -0.1 to -0.4 points and from 2 per- cent to 22 percent), and the largest ones are in separate-minority schools (ranging from -0.2 to -0.7 points and from 7 percent to 74 percent). Thus, the gaps usually change more in the schools where Latinos' and blacks' beliefs are the highest.
However, the black-white and Latino-white comparisons within mixed and separate- minority schools may overestimate how much Latinos and blacks benefit from having high beliefs because the few whites in these schools may differ from whites in separate- white schools in ways that are not controlled in the analysis. For this reason, I also compare blacks and Latinos in mixed and separate- minority schools to whites in separate-white schools.
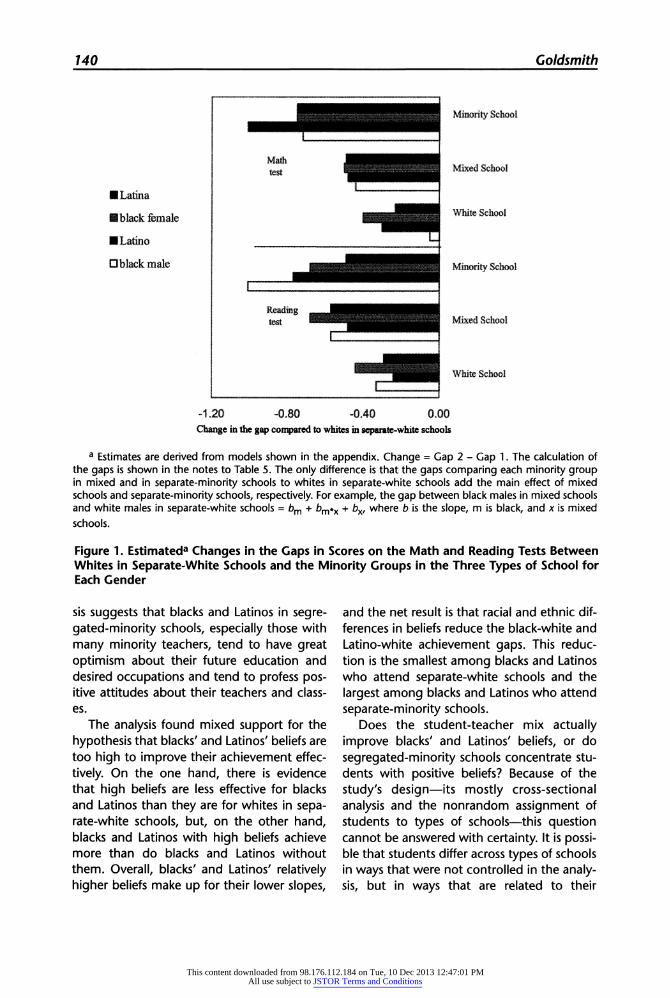
The results of these comparisons are sum- marized in Figure 1. Each bar in the figure is the estimated change in the gap between whites in separate-white schools and each of the minority-by-school-type combinations. For example, the change in math-test scores shown on the bar graph for black males in mixed schools is -0.56. This change is calcu- lated from the gap between black males in mixed schools and white males in separate- white schools. This gap is -4.01 when beliefs are not held constant (Model 1) and larger, -4.57, when beliefs are held constant (Model 2). The difference in the two gaps is the change (-4.57 - 4.01 = -0.56) shown in the figure. As before, separate gaps for males and females are estimated.
As the figure shows, all the changes in the gaps are negative, indicating that blacks and Latinos-regardless of which type of school
This content downloaded from 98.176.112.184 on Tue, 10 Dec 2013 12:47:01 PMAll use subject to JSTOR Terms and Conditions

Schools' Racial Mix and Students' Optimism 139
Table 5. Multilevel Model Estimates of the Gapsa in Test Scores with Whites of the Same Gender in the Same Type of School, with (Gap 2) and without (Gap 1) Beliefs Held Constant
Gaps in Test Scores with Whites of the Same Gender
Math Reading
School Percentage Percentage Student Type Gap 1 Gap 2 Changeb Change Gap 1 Gap 2 Change Change
Black male White -3.6 -4.0 -0.3 8.3 -2.7 -2.7 -0.1 1.9 Mixed -2.8 -3.4 -0.6 16.9 -2.9 -3.2 -0.4 11.9 Minority -1.7 -2.2 -0.5 23.1 -2.5 -2.7 -0.2 7.4
Latino White -1.8 -2.0 -0.2 12.2 -1.1 -1.4 -0.3 22.4 Mixed -0.6 -1.1 -0.5 46.1 -0.6 -1.0 -0.4 40.2 Minority +0.8 +0.6 -0.3 -48.3 -0.5 -1.0 -0.5 47.0
Black female White -3.7 -4.1 -0.4 10.7 -3.7 -4.0 -0.4 9.8 Mixed -3.7 -4.1 -0.4 10.3 -3.9 -4.2 -0.3 6.9 Minority -1.6 -2.3 -0.7 29.0 -2.0 -2.7 -0.6 24.0
Latina White -2.9 -3.2 -0.3 9.3 -2.9 -3.2 -0.2 7.2 Mixed -2.1 -2.4 -0.3 12.7 -2.8 -3.1 -0.3 9.3 Minority -0.2 -0.7 -0.5 73.9 -1.6 -2.2 -0.6 28.9
a Estimates of the gaps are from the models shown in the appendix. With b used o indicate slope and m, f, x, and s used to refer to the minority group, female, mixed schools, and separate-minori- ty schools, respectively, gaps are as follows: males: separate-white schools = bm; mixed schools = bm + bm*x; separate-minority schools = bm + bm*s; females: separate-white schools = bm + bm*f; mixed schools = bm + bm*f + bm,* + bm*f*x; separate-minority schools = bm + bm*f + bm*x + bm*f*s.
b The change in the gap = G2 - GI; the percentage change = change / G2 * 100.
they attend-benefit from having high beliefs relative to whites in separate-white schools. Moreover, the figure shows that the gap between whites in separate-white schools and minorities in separate-minority schools is reduced the most by holding beliefs constant. These comparisons are the third set of bars for each examination in the figure. The first set of bars, which is the smallest, represents the changes in the gaps among students who attend separate-white schools. The middle set of bars represents the changes in the gaps between whites in separate-white schools and minorities in mixed schools. The findings indi- cate that relative to whites in separate-white schools, blacks and Latinos attending sepa- rate-white schools benefit the least from dif- ferences in beliefs and that blacks and Latinos in separate-minority schools benefit the most.
CONCLUSIONS
The study found that eighth-grade black and Latino students are more likely than are simi- lar white students to have high occupational expectations, educational aspirations, and concrete attitudes. It also found that blacks and Latinos are more likely to have high beliefs in mixed schools (schools in which minority students but not minority teachers predominate) and especially in separate- minority schools (schools in which minority teachers and minority students predominate) than in separate-white schools (schools in which white students predominate).
Moreover, the analysis suggests that blacks and Latinos in segregated-minority schools are not opposed to attitudes and beliefs that improve their achievement. In fact, this analy-
This content downloaded from 98.176.112.184 on Tue, 10 Dec 2013 12:47:01 PMAll use subject to JSTOR Terms and Conditions
140 Goldsmith
Minority School
NEblack female White School
nLatino C 3black male Minority School
Reading testadnMixed School
White School
-1.20 -0.80 -0.40 0.00 Change in the gap compared to whites in separate-white schools
a Estimates are derived from models shown in the appendix. Change = Gap 2 - Gap 1. The calculation of the gaps is shown in the notes to Table 5. The only difference is that the gaps comparing each minority group in mixed and in separate-minority schools to whites in separate-white schools add the main effect of mixed schools and separate-minority schools, respectively. For example, the gap between black males in mixed schools and white males in separate-white schools = bm + bm*x + bx, where b is the slope, m is black, and x is mixed schools.
Figure 1. Estimateda Changes in the Gaps in Scores on the Math and Reading Tests Between Whites in Separate-White Schools and the Minority Groups in the Three Types of School for Each Gender
sis suggests that blacks and Latinos in segre- gated-minority schools, especially those with many minority teachers, tend to have great optimism about their future education and desired occupations and tend to profess pos- itive attitudes about their teachers and class- es.
The analysis found mixed support for the hypothesis that blacks' and Latinos' beliefs are too high to improve their achievement effec- tively. On the one hand, there is evidence that high beliefs are less effective for blacks and Latinos than they are for whites in sepa- rate-white schools, but, on the other hand, blacks and Latinos with high beliefs achieve more than do blacks and Latinos without them. Overall, blacks' and Latinos' relatively higher beliefs make up for their lower slopes,
and the net result is that racial and ethnic dif- ferences in beliefs reduce the black-white and Latino-white achievement gaps. This reduc- tion is the smallest among blacks and Latinos who attend separate-white schools and the largest among blacks and Latinos who attend separate-minority schools.
Does the student-teacher mix actually improve blacks' and Latinos' beliefs, or do segregated-minority schools concentrate stu- dents with positive beliefs? Because of the study's design-its mostly cross-sectional analysis and the nonrandom assignment of students to types of schools-this question cannot be answered with certainty. It is possi- ble that students differ across types of schools in ways that were not controlled in the analy- sis, but in ways that are related to their
This content downloaded from 98.176.112.184 on Tue, 10 Dec 2013 12:47:01 PMAll use subject to JSTOR Terms and Conditions

Schools' Racial Mix and Students' Optimism 141
beliefs. Nevertheless, this study showed that net of a large number of contextual and familial differences, blacks and Latinos in mixed and especially in separate-minority schools are more likely than are blacks and Latinos in separate-white schools to have high beliefs.
There are three likely explanations for this finding. First, these schools may contain a rel- atively large number of students and parents who lack the adequate skills and resources for interpreting school feedback, and, conse- quently, the students overestimate their chances of being successful. Although differ- ences in skills and resources across students or parents are likely to be related to students' SES, family structure, family size, and previous achievement, these control variables may not fully account for differences in skills. The best evidence in this study that differences in skills exist net of these variables is the finding that high beliefs raise blacks' and Latinos' achieve- ment less than they raise the achievement of whites who attend separate-white schools.
Support for this interpretation can also be found in studies that have found that black- white and Latino-white differences in achieve- ment result from an unequal distribution of skills, habits, and styles (Farkas 1990). White students tend to possess more skills, habits, and styles that improve achievement than do blacks and Latinos. Moreover, the correlations between students' concrete attitudes and their skills, habits, and styles are lower for blacks and Latinos than they are for whites (Ainsworth-Darnell and Downey 2002). These low correlations suggest a reason why whites in separate-white schools benefit more from high beliefs than blacks and Latinos do. Whites in separate-white schools are better equipped to match high beliefs with behav- iors that will improve their achievement.
However, I doubt that this is the complete story. Having very positive beliefs must result from more than a lack of skills because posi- tive beliefs are associated with higher, not lower, achievement. In addition, this explana- tion cannot account for why mixed and espe- cially separate-minority schools do more to raise the beliefs of blacks and Latinos than they do those of whites.
The second likely explanation is that
blacks' and Latinos' beliefs improve in the presence of minority peers. Peer effects, broadly speaking, probably work by creating a normative climate and by students compar- ing themselves with others (see the review by Gamoran 1992). Normative climates reflect more than the students' typical beliefs because they imply that all students in a school move toward the school norm. Concentrating students with high beliefs gen- erally will raise all students' beliefs. Peers also influence students' beliefs because they serve as a comparison group when students devel- op aspirations and expectations. Students become more optimistic when they compare themselves with low-achieving peers.
Concentrating blacks and Latinos in a school is likely to improve the school's nor- mative climate because blacks and Latinos, all else being equal, tend to have high beliefs. In addition, comparing oneself to blacks and Latinos also improves aspirations and expec- tations because these students are relatively low achieving. Schools with many minorities will thus improve students' beliefs. These effects can be contrasted with those associat- ed with a concentration of high-SES students. High-SES students have positive beliefs but are high achieving; therefore, they raise stu- dents' beliefs by improving the normative cli- mate, but reduce students' beliefs through comparison processes (Gamoran 1992).
Why would the effects of having minority peers raise minorities' beliefs more than those of whites? It is possible that peers are more influential when they are friends and acquain- tances (Hallinan and Williams 1990). Whites in separate-minority schools may have fewer minority friends and acquaintances than do blacks and Latinos in these schools (Quillian and Campbell 2001). Whites also may not compare themselves with blacks and Latinos (Kao and Tienda 1998), and beliefs may be less contagious in racially and ethnically mixed dyads (Hallinan and Williams 1990).
This explanation, however, also cannot fully account for this study's findings. If only minority peers improve beliefs, mixed schools should raise blacks' and Latinos' beliefs as much as do separate-minority schools. However, the effects of mixed schools on blacks' and Latinos' beliefs are inconsistent
This content downloaded from 98.176.112.184 on Tue, 10 Dec 2013 12:47:01 PMAll use subject to JSTOR Terms and Conditions
142 Goldsmith
and weak compared to those of separate- minority schools.
The third likely explanation is that minori- ty teachers are better able to raise minority students' beliefs than are white teachers. This could be an individual effect or a contextual effect. An individual effect occurs when minority teachers or teachers from working- class backgrounds raise their own minority students' beliefs (Alexander et al. 1987; Ehrenberg et al. 1995; Foster 1990, 1997; Ladson-Billings 1994). A contextual effect occurs when a school has many minority teachers who infuse it with a culturally rele- vant curriculum or make other structural changes, like reducing unequal tracking sys- tems, that affect minority peers' beliefs (Ladson-Billings 1994; Meier et al. 1999; Weiher 2000). As was mentioned earlier, this study was unable to determine whether the effects are contextual or individual, but the findings suggest that segregated-minority schools are better able to serve minority stu- dents when they employ many minority teachers.
This analysis suggests that segregated- white schools need to enact measures to reduce their harmful effects on blacks' and Latinos' beliefs. Although concrete sugges- tions are preliminary, changes could include enacting processes that bring minority peers together, as forming black-student unions and Latinos Unidos would do. Moreover, they also may improve blacks' and Latinos' beliefs by employing more minority teachers. Predominantly nonwhite schools can improve blacks' and Latinos' achievement by employ- ing more minority teachers as well.
The effects of minority peers and minority teachers ultimately raise serious questions about the color lines in American society and its importance in debates about integration. Supporters of integration have denied that integration's benefits to blacks or Latinos stem from sitting next to white students or having white teachers. Instead, they point to the benefits of having small class sizes; local community support; and a concentration of students from two-parent, affluent families situated in middle-class neighborhoods (e.g., see Bankston and Caldas 2002; Crain and Mahard 1983; Kozol 1991; Orfield and Eaton
1996; Pong 1998). These benefits are real; they improve achievement, and their com- bined importance is surely greater than those of favorable beliefs. But being situated in a white environment does have an effect. All else being equal, blacks and Latinos report less optimism and less pro-school attitudes in predominantly white schools than in pre- dominantly nonwhite schools, especially non- white schools that employ many nonwhite teachers. Seeing this positive aspect of segre- gated-minority schools will help scholars, advocates, and policy makers understand what an integrated school needs to be to be successful for black and Latino students.
Thus, the racial and ethnic differences in achievement among students mirror the racial and ethnic differences among schools. Black and Latino students achieve less than do whites just as achievement at predomi- nantly black and Latino schools is less than that at predominantly white schools. But blacks and Latinos have an advantage over whites: more optimism and more pro-school attitudes. Similarly, predominantly black and Latino schools have an advantage over pre- dominantly white schools: They promote optimism and pro-school attitudes. Neither advantage is enough to overcome the entire gaps in achievement, but these differences in beliefs help reduce them.
NOTES
1. Ogbu (1995a) distinguished among dif- ferent types of minorities, and only those who are classified as "involuntary minorities" are thought to oppose the attitudes, values, and behaviors that are conducive to educational achievement. He considered blacks to be involuntary minorities. Only some Latinos can be classified as involuntary minorities (Kao and Tienda 1998; Matute-Bianchi 1986).
2. The index for attitudes toward teachers is the average of (1) "students get along well with teachers"; (2) "teachers are interested in students"; (3) "the teaching is good"; (4) "when I work hard on schoolwork, my teach- ers praise my effort"; (5) "in class I often feel 'put down' by my teachers" (reverse coded); and (6) "most of my teachers really listen to
This content downloaded from 98.176.112.184 on Tue, 10 Dec 2013 12:47:01 PMAll use subject to JSTOR Terms and Conditions

Schools' Racial Mix and Students' Optimism 143
what I have to say" (1= strongly disagree, 2 = disagree, 3 = agree, and 4 = strongly agree). Alpha = .79. Students with high attitudes are defined as those averaging at least "agree."
The index for attitudes toward math and sciences classes is the average of (1) math and (2) science "will be useful in my future" and "I look forward to" (3) math and (4) science (1 = strongly disagree, 2 = disagree, 3 = agree, 4 = strongly agree). Alpha = .66. The index for English and history classes is the same (except for the classes) and alpha = .66. Students with high attitudes are defined as those averaging at least "agree."
3. Variance inflation factors estimated in ordinary least-squares regression often exceed 10, which is considered indicative of serious multicolinearity (Neter, Wasserman, and Kutner 1985). Most of the problem is created by the high correlations between the proportions of teachers and students. For example, proportion nonwhite teachers and nonwhite students correlates 0.78, but multi- colinearity is exacerbated when the propor- tions are included as interactions, squared terms, or both.
4. Removing them from the analysis pro- duced substantively identical results.
5. For the black students in the sample, the percentages of black students and black teachers in separate-minority schools are even higher, at 87 and 66 percent, respec- tively. Latinos in these schools are not as con- centrated with their coethnics. Their schools average 70 percent Latino students and 39 percent Latino teachers.
6. A reviewer noted that neighborhood effects measured at the relatively large level of zip-code areas may dampen the effects, espe- cially on blacks, because middle-class blacks live closer to poor blacks than middle-class whites live to poor whites (Pattillo 1998). This possibility was investigated in models not shown by including black poverty-rate and Latino poverty-rate interactions. The results revealed no significant interactions.
7. The probability of having a high belief (Y = 1) is exp BX / (1 + exp BX). For example, for white males, all X except the constant equal 0 when noncentered variables equal their grand mean, so their probability that Y= 1 is exp bO /(1 + exp b0)= (exp-1.51/ (1 + exp
-1.51) = 0.18. For white females, all X equal zero at the grand mean except the constant and the effect of female, so their probability is (exp (-1.51 + 0.26)) / (1 + exp (-1.51 + 0.26)) = 0.22.
8. I did not model school-type effects with main effects and interactions because the small sample of whites in separate-white schools is a poor comparison for showing how much blacks and Latinos benefit from attending separate-minority schools.
9. The effects of separate-minority schools on two of the beliefs, occupational expecta- tions and attitudes toward teachers, are sig- nificant only in a one-tailed test, suggesting that the effects are not robust. In part, the lack of robustness occurs because the models divide the variance more than is necessary by modeling separate effects of school types for Latinos and blacks. The models in Table 3 show nearly identical school-type effects on blacks and Latinos, and the theories reviewed earlier do not suggest that the effects should differ between groups. Coefficients in models combining the school-type effects for blacks and Latinos are more robust, all reaching sig- nificance at .05 in two-tailed tests. In addi- tion, models using this specification show similar results when the cutoff point for the dummy variables is changed to either 40 per- cent or 60 percent. In these models, 9 of the 10 effects of separate-minority schools on blacks and Latinos are positive and signifi- cant. The one that is not is almost significant (p = .06, one-tailed test).
Models replacing the dummy variables for school-types with continuous measures of the teacher-student mix-as long as both propor- tions are not entered simultaneously--show similar results. Schools' proportion of non- white students significantly improves all five of blacks' and Latinos' beliefs and three of whites' beliefs (not occupational expectations and attitudes toward teachers). Schools' pro- portion of nonwhite teachers significantly improves four of Latinos' beliefs (not attitudes toward teachers), three of blacks' beliefs (not occupational expectations and not attitudes toward teachers) and one of whites' beliefs (educational aspirations). When the student and teacher proportions are entered together, few coefficients are significant (see note 3).
This content downloaded from 98.176.112.184 on Tue, 10 Dec 2013 12:47:01 PMAll use subject to JSTOR Terms and Conditions

144 Goldsmith
10. In models not shown, I investigated the effects of types of schools on Asian stu- dents. Asian students' beliefs are consistently higher than are white students' beliefs, but are rarely influenced by the types of schools the students attend, with only 2 of the 10 effects significant (both positive). However, the few Asian students in mixed and separate- minority schools reduces the power to test this effect appropriately.
11. Mexican-origin students have more positive attitudes toward English/history classes than do Puerto Rican students, all else being equal.
12. I investigated models, not shown, without these interactions among the belief variables and found that they overestimate how much blacks and Latinos benefit from having high beliefs.
APPENDIX
Multilevel Model Estimates of Race, Ethnicity, and School Type onto Scores on the Math and Reading Tests
Math Test Reading Test
Variable a 1 2 1 2
Intercept 52.12*** 52.39*** 50.70*** 51.05*** Black -3.64*** -3.97*** -2.66*** -2.90*** Latino -1.75*** -1.99*** -1.05*** -1.43*** Female -0.89*** -1.11*** 1.94*** 1.55*** Black * female -0.01 -0.12 -0.99 -1.09 Latino * female -1.15** -1.20** -1.89*** -1.73*** Mixed school -1.18** -1.17** -0.95* -1.10** Separate-minority school -2.34** -2.84** -0.87 -1.36 Black * mixed school 0.82 0.57 -0.19 -0.44 Latino * mixed school 1.18 0.94 0.45 0.49 Female * mixed school 1.62 1.36 1.31 1.29 Black * female * mixed school -0.87 -0.61 -0.10 0.11 Latino * female * mixed school -0.42 -0.19 -0.29 -0.39 Black * separate-minority school 1.96 1.78 0.20 0.16 Latino * separate-minority school 2.56** 2.53 0.51 0.46 Female * separate-minority school 0.76 1.25 -0.67 -0.34 Black * female * separate-minority school 0.06 -0.30 1.43 1.25 Latino * female * separate-minority school 0.17 -0.25 0.86 0.63
a All models include the same control variables as the models shown in Table 3. Models labeled 2 also include the belief variables (main effects and interactions) shown in Table 4.
*p < .05 (one-tailed test), **p < .05 (two-tailed test), ***p < .01 (two-tailed test). A one-tailed test was used if the effect was not significant on a two-tailed test and the direction of the effect was predicted.
This content downloaded from 98.176.112.184 on Tue, 10 Dec 2013 12:47:01 PMAll use subject to JSTOR Terms and Conditions

Schools' Racial Mix and Students' Optimism 145
REFERENCES
Agresti, Alan. 1990. Categorical Data Analysis. New York: John Wiley & Sons.
Ainsworth, James W. 2002. "Why Does It Take a Village? The Mediation of Neighborhood Effects on Educational Achievement." Social Forces 81:117-52.
Ainsworth-Darnell, James W., and Douglas B. Downey. 1998. "Assessing the Oppositional Culture Explanation for Racial/Ethnic Differences in School Performance." American Sociological Review 63:554-70.
--. 2002. "The Search for Oppositional Culture among Black Students." American Sociological Review 67:156-64.
Alexander, Karl L., Doris R. Entwisle, and Samuel D. Bedinger. 1994. "When Expectations Work: Race and Socioeconomic Differences in School Performance." Social Psychology Quarterly 57:283-99.
Alexander, Karl L., Doris R. Entwisle, and Maxine S. Thompson. 1987. "School Performance, Status Relations, and the Structure of Sentiment: Bringing the Teacher Back in." American Sociological Review 52:665-82.
Alwin, Duane F., and Luther B. Otto. 1977. "High School Context Effects on Aspirations." Sociology of Education 50:259-73.
Bankston, Carl L. III and Stephen J. Caldas. 2002. A Troubled Dream: The Promise and Failure of School Desegregation in Louisiana. Nashville, TN: Vanderbilt University Press.
Bourdieu, Pierre. 2000. "Cultural Reproduction and Social Reproduction." Pp. 56-69 in The Structure of Schooling: Readings in the Sociology of Education, edited by R. Arum and I. R. Beattie. London: Mayfield.
Cheng, Simon, and Brian Starks. 2002. "Racial Differences in the Effects of Significant Others on Students' Educational Expectations." Sociology of Education 75:306-27.
Coleman, James S., Ernest Q. Campbell, Carol J. Hobson, James McPartland, Alexander M. Mood, Frederick D. Weinfeld, and Robert L. York. 1966. Equality of Educational Opportunity. Washington, DC: U.S. Government Printing Office.
Crain, Robert L., and Rita E. Mahard. 1983. "The Effect of Research Methodology on Desegregation-Achievement Studies: A Meta- Analysis." American Journal of Sociology 88:839-54.
Dumais, Susan A. 2002. "Cultural Capital, Gender, and School Success: The Role of Habitus." Sociology of Education 75:44-68.
Ehrenberg, Ronald G., Daniel D. Goldhaber, and
Dominic J. Brewer. 1995. "Do Teachers' Race, Gender, and Ethnicity Matter? Evidence from the National Longitudinal Study of 1988." Industrial and Labor Relations Review 48:548-61.
Falk, William W. 1978. "Mobility Attitudes of Segregated and Desegregated Black Youths." Journal of Negro Education 47:132-42.
Farkas, George. 1990. Human Capital or Cultural Capital? Ethnicity and Poverty Groups in an Urban School District. New York: Aldine de Gruyter.
Farkas, George, Christy Lleras, and Steve Maczuga. 2002. "Does Oppositional Culture Exist in Minority and Poverty Peer Groups?" American Sociological Review 67:148-55.
Ferguson, Ronald F. 1998. "Teachers' Perceptions and Expectations and the Black-White Test Score Gap." Pp. 273-317 in The Black-White Test Score Gap, edited by C. Jencks and M. Phillips. Washington, DC: Brookings Institution.
Foster, Michele. 1990. "The Politics of Race: Through the Eyes of African-American Teachers." Journal of Education 172:123-41.
-. 1997. Black Teachers on Teaching. New York: New Press.
Gamoran, Adam. 1992. "Social Factors in Education." Pp. 1222-29 in Encyclopedia of Educational Research (6th ed.). New York: Macmillan.
Garrison, Howard H. 1982. "Trends in Educational and Occupational Aspirations of High School Males: Black-White Comparisons." Sociology of Education 55:53-62.
Goldsmith, Pat Ant6nio. 2002. "All Segregation Is Not Equal: The Effects of Proportion African American and Proportion Latino." Sociological Perspectives 46:83-105.
Goldstein, Harvey. 1995. Multilevel Statistical Models. New York: Halstead.
Hallinan, Maureen T., and Richard A. Williams. 1990. "Students' Characteristics and the Peer- Influence Process." Sociology of Education 63:122-32.
Hoelter, Jon W. 1982. "Segregation and Rationality in Black Status Aspiration Processes." Sociology of Education 55:31-39.
Kao, Grace, and Marta Tienda. 1995. "Optimism and Achievement: The Educational Performance of Immigrant Youth." Social Science Quarterly 76:1-19.
-. 1998. "Educational Aspirations of Minority Youth." American journal of Education 106:349-84.
Kao, Grace, Marta Tienda, and Barbara Schneider. 1996. "Racial and Ethnic Variation in
This content downloaded from 98.176.112.184 on Tue, 10 Dec 2013 12:47:01 PMAll use subject to JSTOR Terms and Conditions

146 Goldsmith
Academic Performance." Research in Sociology of Education and Socialization 11:263-97.
Kerckhoff, Alan C. 1977. "The Realism of Educational Ambitions in England and the United States." American Sociological Review 42:563-71.
Kozol, jonathan. 1991. Savage Inequalities: Children in America's Schools. New York: Crown.
Ladson-Billings, Gloria. 1994. The Dreamkeepers: Successful Teachers of African American Children. San Francisco: Jossey-Bass.
Littell, Ramon C., George A. Milliken, Walter W. Stroup, and Russell D. Wolfinger. 1996. SAS System for Mixed Models. Cary City, NC: SAS Institute.
Longshore, Douglas. 1982. "Race Composition and White Hostility: A Research Note on the Problem of Control in Desegregated Schools." Social Forces 61:73-78.
MacLeod, jay. 1995. Ain't No Makin' it: Aspirations & Attainment in a Low-Income Neighborhood (2nd ed.). Boulder, CO: Westview Press.
Massey, Douglas S., and Nancy A. Denton. 1993. American Apartheid: Segregation and the Making of the Underclass. Cambridge, MA: Harvard University Press.
Matute-Bianchi, Maria Eugenia. 1986. "Ethnic Identities and Patterns of School Success and Failure among Mexican-Descent and Japanese-American Students in a California High School: An Ethnographic Analysis." American Journal of Education 95:233-55.
Meier, Kenneth J., Robert D. Wrinkle, and J. L. Polinard. 1999. "Representative Bureaucracy and Distributional Equity: Addressing the Hard Question." Journal of Politics 61:1025-39.
Mickelson, Roslyn Arlin. 1990. "The Attitude- Achievement Paradox Among Black Adolescents." Sociology of Education 63:44-61.
National Center for Education Statistics. 1992. National Education Longitudinal Study of 1988 First Follow-Up: Data File User's Manual (NCES 92-030). Washington, DC: U.S. Department of Education.
-. 1996. Youth Indicators. Available on-line: http://nces.ed.gov/pubs/yi/y9627a.html
Neter, John, William Wasserman, and Michael H. Kutner. 1985. Applied Linear Statistical Models: Regression, Analysis of Variance, and Experimental Designs (2nd ed.). Homewood, IL: Richard Irwin.
Oakes, jeannie. 1985. Keeping Track: How Schools Structure Inequality. New Haven, CT: Yale University Press.
Ogbu, John U. 1995a. "Cultural Problems in Minority Education: Their Interpretations and Consequences-Part One: Theoretical Background." Urban Review 27:189-205.
. 1995b. "Cultural Problems in Minority Education: Their Interpretations and Consequences-Part Two: Case Studies." Urban Review 27:271-97.
Orfield, Gary, and Susan E. Eaton. 1996. Dismantling Desegregation: The Quiet Reversal of Brown v. Board of Education. New York: New Press.
Orfield, Gary, and John T. Yun. 1999. "Resegregation in American Schools." Cambridge, MA: The Civil Rights Project, Harvard University. Available on-line: http://www.law.harvard.edu/groups/civil- rights/publications/resegregation99.html
Pattillo, Mary E. 1998. "Sweet Mothers and Gangbangers: Managing Crime in a Black Middle-Class Neighborhood." Social Forces 76:747-74.
Pong, Suet-ling. 1998. "The School Compositional Effect of Single Parenthood on 10th-Grade Achievement." Sociology of Education 73:24-43.
Portes, Alejandro, and Kenneth L. Wilson. 1976. "Black-White Differences in Educational Attainment." American Sociological Review 41:414-31.
Qian, Zhenchao, and Sampson Lee Blair. 1999. "Racial/Ethnic Differences in Educational Aspirations of High School Seniors." Sociological Perspectives 42:605-25.
Quillian, Lincoln, and Mary Campbell. 2001. "Segregation Forever? Racial Composition and Multiracial Friendship Segregation in American Schools" (Discussion Paper 1241- 01). Ann Arbor, MI: Institute for Research on Poverty.
Reardon, Sean. 2000. "The Changing Structure of School Segregation: Measurement and Evidence of Multiracial Metropolitan-Area School Segregation." Demography 37:351-64.
Roscigno, Vincent J. 2000. "Family/School Inequality and African-American/Hispanic Achievement." Social Problems 47:266-90.
Sewell, William H., and Robert M. Hauser. 1975. Education, Occupation and Earnings: Achievement in the Early Career. New York: Academic Press.
Sigelman, Lee, Timothy Bledsoe, Susan Welch, and Michael W. Combs. 1996. "Making Contact? Black-White Social Interaction in an Urban Setting." American Journal of Sociology 101:1306-22.
Tolnay, Stewart E., E. M. Beck, and james L. Massey. 1989. "Black Lynchings: The Power Threat Hypothesis Revisited." Social Forces 67:605-40.
Weiher, Gregory R. 2000. "Minority Student
This content downloaded from 98.176.112.184 on Tue, 10 Dec 2013 12:47:01 PMAll use subject to JSTOR Terms and Conditions

Schools' Racial Mix and Students' Optimism 147
Achievement: Passive Representation and Social Context in Schools." Journal of Politics 62:886-95.
White, Kinnard, and James Knight. 1973. "School Desegregation, Socioeconomic Status, Sex, and the Aspirations of Southern Negro
Adolescents." journal of Negro Education 42:71-78.
Wilson, William Julius. 1987. The Truly Disadvantaged: The Inner City, the Underclass, and Public Policy. Chicago: Chicago University Press.
Pat Ant6nio Goldsmith, Ph.D., is an Assistant Professor in the Sociology-Anthropology Department at the University of Wisconsin-Parkside. He is currently studying how school organizational prac- tices influence interracial conflict and interracial friendship and is beginning a study on the mis- treatment of Mexicans and Mexican Americans by border officials.
I thank Paula England and George Farkas for commenting on an earlier draft of this article. Direct all correspondence to Pat Ant6nio Goldsmith, Sociology-Anthropology Department, 900 Wood Road, PO Box 2000, University of Wisconsin-Parkside, Kenosha, WI 53141-2000; e-mail: [email protected].
This content downloaded from 98.176.112.184 on Tue, 10 Dec 2013 12:47:01 PMAll use subject to JSTOR Terms and Conditions