School Year 2016-2017 Business Rules for School-Wide ... SY16-17 Business Rules for... · 1 1200...
55
1 1200 First Street, NE | Washington, DC 20002 | T 202.442.5885 | www.dcps.dc.gov School Year 2016-2017 Business Rules for School-Wide Accountability Metrics September 2016
Transcript of School Year 2016-2017 Business Rules for School-Wide ... SY16-17 Business Rules for... · 1 1200...

1
1200 First Street, NE | Washington, DC 20002 | T 202.442.5885 | www.dcps.dc.gov
School Year 2016-2017
Business Rules for School-Wide
Accountability Metrics
September 2016

2
1200 First Street, NE | Washington, DC 20002 | T 202.442.5885 | www.dcps.dc.gov
School Year 2016-2017 Business Rules for School-Wide Accountability Metrics
This document was developed in a collaborative effort across the Office of the Chief of Schools (COS),
the Office of Instructional Practice (OIP), the Office of Teaching and Learning (OTL), and the Office of the
Chief of Staff (OCS).
The business rules included in this document provide an outline of how metrics are tracked and
calculated as displayed in SPDI and other accountability related Central Office reports. While designed to
answer most questions, additional inquiries should be directed to the following offices:
For data reporting: [email protected]
For IMPACT goal setting: [email protected]
For general data requests and SPDI access: o Clusters 1-4: Colin Welch ([email protected]) o Clusters 5-6: Kirsten James ([email protected]) o Clusters 7-9: Doug Abbott ([email protected]) o Cluster 10: Kristie Lee Jen ([email protected])

3
1200 First Street, NE | Washington, DC 20002 | T 202.442.5885 | www.dcps.dc.gov
Table of Contents School Year 2016-2017 Business Rules for School-Wide Accountability Metrics ......................................... 2
Reading Inventory (RI) .................................................................................................................................. 4
Text Reading Comprehension (TRC) ........................................................................................................... 10
i-Ready ........................................................................................................................................................ 11
Ninth Grade Academy ................................................................................................................................. 15
Promotion ................................................................................................................................................... 17
Course Passing ............................................................................................................................................ 19
Middle School On-Track .............................................................................................................................. 20
Adjusted Cohort Graduation Rate (ACGR) .................................................................................................. 22
SAT- College Admission Exam ..................................................................................................................... 24
PSAT ............................................................................................................................................................ 26
Advanced Placement (AP) Achievement .................................................................................................... 28
Evaluacion del Desarrollo de la Lectura 2 (EDL2) ........................................................................................ 30
ACCESS Growth ........................................................................................................................................... 32
Attendance .................................................................................................................................................. 33
Truancy........................................................................................................................................................ 35
Behavior Metrics ......................................................................................................................................... 36
Student Satisfaction Metrics ....................................................................................................................... 39
Appendix ..................................................................................................................................................... 40

4
1200 First Street, NE | Washington, DC 20002 | T 202.442.5885 | www.dcps.dc.gov
Reading Inventory (RI) What is the purpose of this assessment?
This assessment, administered by Houghton Mifflin Harcourt, is a research-based, adaptive assessment
that measures students’ reading skills and longitudinal progress. DCPS uses this assessment to measure
students’ reading comprehension in terms of lexile scores, proficiency levels, and growth.
Which students are included in RI calculations?
Students that meet the following criteria will be included in all RI calculations unless otherwise noted
under specific metrics:
Are not English language learner (ELL) Newcomers: ELL Newcomers are students that were born outside of the United States and have been enrolled in U.S. schools for less than 12 full calendar months
Are not students that are eligible for the Multi-State Alternate Assessment (MSAA)
RI Participation Rate
Which students are included in the calculation?
In addition to the inclusion criteria above, students need to meet the following criteria to be included in
the RI participation rate calculation. Students must:
Be in the enrollment snapshot at the school where they tested; the BOY enrollment snapshot is the official audited enrollment file (preliminary rates are calculated using the October enrollment snapshot) and the EOY snapshot is from the first day of the EOY testing window communicated by OTL
Be in grades 5-10, OR be in grades 4-10 if the school has designated RI as the primary
assessment for 4th graders
The RI participation rate (RI Participation Rate) is expressed by the total number of students in the
enrollment snapshot that were tested in a window (RI Participation Tested) as a percentage of the total
number of students registered in the enrollment snapshot in the school’s testing grades (RI Registered):
𝑹𝑰 𝑷𝒂𝒓𝒕𝒊𝒄𝒊𝒑𝒂𝒕𝒊𝒐𝒏 𝑹𝒂𝒕𝒆 =𝑹𝑰 𝑷𝒂𝒓𝒕𝒊𝒄𝒊𝒑𝒂𝒕𝒊𝒐𝒏 𝑻𝒆𝒔𝒕𝒆𝒅
𝑹𝑰 𝑹𝒆𝒈𝒊𝒔𝒕𝒆𝒓𝒆𝒅

5
1200 First Street, NE | Washington, DC 20002 | T 202.442.5885 | www.dcps.dc.gov
RI Proficiency Bands
Which students are included in the calculation?
Students in grades 1-12 who completed an RI assessment in the testing window
How are results reported?
Students can fall into one of four proficiency bands based on their grade of enrollment and lexile score: Below Basic, Basic, Proficient, or Advanced. The table below outlines the cut points for each proficiency band and grade.
Grade Below Basic Basic Proficient Advanced
Grade 1 BR 0L to 189L 190L to 534L 535L & Above
Grade 2 BR to 219L 220L to 419L 420L to 654L 655L& Above
Grade 3 BR to 329L 330L to 519L 520L to 824L 825L& Above
Grade 4 BR to 539L 540L to 739L 740L to 944L 945L& Above
Grade 5 BR to 619L 620L to 829L 830L to 1014L 1015L & Above
Grade 6 BR to 729L 730L to 924L 925L to 1074L 1075L & Above
Grade 7 BR to 769L 770L to 969L 970L to 1124L 1125L & Above
Grade 8 BR to 789L 790L to 1009L 1010L to 1189L 1190L & Above
Grade 9 BR to 849L 850L to 1049L 1050L to 1264L 1265L & Above
Grade 10 BR to 889L 890L to 1079L 1080L to 1339L 1340L & Above
Grade 11/12 BR to 984L 985L to 1184L 1185L to 1389L 1390L & Above
The percentage of students who score as proficient or advanced on RI (RI Proficiency) is expressed as
the number of proficient or advanced students (RI Proficient Students) divided by the number of
students tested, as recorded in the export file (RI Tested).
𝑹𝑰 𝑷𝒓𝒐𝒇𝒊𝒄𝒊𝒆𝒏𝒄𝒚 =𝑹𝑰 𝑷𝒓𝒐𝒇𝒊𝒄𝒊𝒆𝒏𝒕 𝑺𝒕𝒖𝒅𝒆𝒏𝒕𝒔
𝑹𝑰 𝑻𝒆𝒔𝒕𝒆𝒅

6
1200 First Street, NE | Washington, DC 20002 | T 202.442.5885 | www.dcps.dc.gov
RI Proficiency Band Growth
Which students are included in the calculation?
In addition to the inclusion criteria for all RI metrics (page 2), students need to meet the following
criteria to be included in the RI proficiency band growth calculation. Students must:
Be in the enrollment snapshot at the school where they tested; the BOY enrollment snapshot is the official audited enrollment file (preliminary rates are calculated using the October enrollment snapshot) and the EOY snapshot is from the first day of the EOY testing window communicated by OTL
Be in grades 5-10, OR be in grades 4-10 if the school has designated RI as the primary assessment for 4th graders
Test at the same school in the BOY and EOY windows
How are results reported?
For the purposes of the proficiency band growth calculation only, students’ grade levels in the audit file will be used to calculate all proficiency bands during the year. For example, if a student starts the year in 9th grade but promotes to 10th grade during the year, the student’s proficiency bands at BOY and EOY will be based on the 9th grade cut points.
For students that meet the inclusion criteria outlined above, the first recorded proficiency band from the BOY window (or highest proficiency band if the student tested more than once on the same day) is used as the base for calculation.
If the student tested any time after the beginning of the unofficial MOY window and achieved a
higher proficiency band than the official EOY assessment, the higher proficiency band will be
used to determine if the student improved. However, a student must test during the EOY
window in order for the MOY score to count for the growth calculation.
Proficiency Band Growth (RI Band Growth) is the number of students who improve at least one
proficiency band or maintain Advanced status (RI Improved Band) expressed as a percentage of the
number of students eligible to be included in the growth calculation (RI Growth Total).
𝑹𝑰 𝑩𝒂𝒏𝒅 𝑮𝒓𝒐𝒘𝒕𝒉 =𝑹𝑰 𝑰𝒎𝒑𝒓𝒐𝒗𝒆𝒅 𝑩𝒂𝒏𝒅
𝑹𝑰 𝑮𝒓𝒐𝒘𝒕𝒉 𝑻𝒐𝒕𝒂𝒍
Please see the next page for example calculations of RI Proficiency Band Growth.

7
1200 First Street, NE | Washington, DC 20002 | T 202.442.5885 | www.dcps.dc.gov
RI Proficiency Band Growth
Example Calculations
Example 1:
Testing Window (Date) School Performance Band
BOY (9/22/2016) School A Basic
Unofficial MOY (2/16/2017) School A Proficient
EOY (5/16/2017) School A Basic
Result: This student tested at the same school in the BOY and EOY windows, so he is eligible to count for
the growth rate. Because the student is eligible to be included in the calculation, the Data and Strategy
Team will use the student’s highest proficiency band after the beginning of the unofficial MOY window,
which is Proficient. Therefore, because the student scored Basic at BOY, the student will count as having
improved proficiency bands.
Example 2:
Testing Window (Date) School Performance Band
BOY (9/21/2016) School A Proficient
EOY (5/15/2017) School B Proficient
Result: This student will not count towards any school’s growth rate because she did not test at the same
school at BOY and EOY.
Example 3:
Testing Window (Date) School Performance Band
BOY (9/21/2016) School A Advanced
EOY (5/15/2017) School A Advanced
Result: This student will count as having maintained her Advanced proficiency band because she tested
at the same school at BOY and EOY.
Example 4:
Testing Window (Date) School Performance Band
BOY (9/21/2016) School A Advanced
Unofficial MOY (2/16/2017) School A Advanced
Result: This student will not count towards School A’s growth rate because she did not test at School A
during the EOY testing window.

8
1200 First Street, NE | Washington, DC 20002 | T 202.442.5885 | www.dcps.dc.gov
RI Lexile Score Growth
Which students are included in the calculation?
In addition to the inclusion criteria for all RI metrics (page 2), students need to meet the following
criteria to be included in the RI proficiency band growth calculation. Students must:
Be in the enrollment snapshot at the school where they tested; the BOY enrollment snapshot is the official audited enrollment file (preliminary rates are calculated using the October enrollment snapshot) and the EOY snapshot is from the first day of the EOY testing window communicated by OTL
Be in grades 5-10, OR be in grades 4-10 if the school has designated RI as the primary assessment for 4th graders
Test at the same school in the BOY and EOY windows
How are results reported?
For students that meet the inclusion criteria outlined above, the first recorded proficiency band from the BOY window (or highest proficiency band if the student tested more than once on the same day) is used as the base for calculation.
Student growth targets are provided by the vendor, Houghton-Mifflin, and are based on students’ BOY lexile scores and grade levels. The growth targets are displayed in the appendix.
If the student tested any time after the beginning of the unofficial MOY window and earned a higher score than their official EOY assessment, the higher score will be used to calculate growth. However, a student must test during the EOY window in order for the MOY score to count for the growth calculation.
The percentage of students who met their growth targets (RI % Met Growth) are the number of
students who met their growth target on RI lexile scores (RI Student Met Growth) divided by RI Growth
Total.
𝑹𝑰 % 𝑴𝒆𝒕 𝑮𝒓𝒐𝒘𝒕𝒉 =𝑹𝑰 𝑺𝒕𝒖𝒅𝒆𝒏𝒕 𝑴𝒆𝒕 𝑮𝒓𝒐𝒘𝒕𝒉
𝑹𝑰 𝑮𝒓𝒐𝒘𝒕𝒉 𝑻𝒐𝒕𝒂𝒍
Please see the next page for examples of RI Lexile Score Growth calculations.

9
1200 First Street, NE | Washington, DC 20002 | T 202.442.5885 | www.dcps.dc.gov
RI Lexile Score Growth
Example Calculations
Example 1: 6th grade student
Testing Window (Date) School Lexile Score Growth Target
BOY (9/22/2016) School A 650 705
Unofficial MOY (2/16/2017) School A 720
EOY (5/16/2017) School A 700
Result: This student tested at the same school in the BOY and EOY windows, so he is eligible to count for
the growth rate. Because the student is eligible to be included in the calculation, the Data and Strategy
Team will use the student’s highest score after the beginning of the informal MOY window, which is 720.
The student’s lexile point growth for the year is: 720 - 650 = 70. The student exceeded his growth target
of 55 points.
Example 2: 7th grade student
Testing Window (Date) School Lexile Score Growth Target
BOY (9/21/2016) School A 800 835
EOY (5/15/2017) School B 810
Result: This student will not count towards any school’s growth rate because she did not test at the same
school at BOY and EOY.
Example 3: 7th grade student
Testing Window (Date) School Lexile Score Growth Target
BOY (9/21/2016) School A 1010 1035
Unofficial MOY (2/16/2017) School A 1040
Result: This student will not count towards School A’s growth rate because she did not test at School A
during the EOY testing window.
Example 4: 10th grade student
Testing Window (Date) School Lexile Score Growth Target
BOY (9/21/2016) School A 1305 1305
EOY (5/15/2017) School A 1295
Result: Because this student’s expected growth was 0 and he did not maintain or improve upon his BOY
score of 1305 from the beginning of the year, he did not meet his growth target.

10
1200 First Street, NE | Washington, DC 20002 | T 202.442.5885 | www.dcps.dc.gov
Text Reading Comprehension (TRC) What is the purpose of this assessment?
TRC is a reading performance assessment that allows teachers to evaluate a student’s reading comprehension skills and the ability to apply those skills to increasingly complex texts. DCPS uses TRC as a reading proficiency assessment for students in elementary school (grades K-4).
Proficiency Rate
Which students are included in the calculation?
In order to be included in TRC calculations, students must meet all of the following criteria:
Are not English language learner (ELL) Newcomers: ELL Newcomers are students that were born outside of the United States and have been enrolled in U.S. schools for less than 12 full calendar months
Are not eligible for the Multi-State Alternate Assessment (MSAA)
Are in grades K-3 if the school tested 4th graders on RI or K-4 if the school tested 4th graders on TRC
Are on a school’s roster at both the beginning-of-year (BOY) and end-of-year (EOY) windows will be considered for TRC EOY achievement
Are not in grade K and are enrolled in a Dual-Language program. Dual-Language participation is as follows:
o Whole school implementation: Bancroft ES, Bruce-Monroe ES, Oyster-Adams Bilingual School
o Strand implementation: Cleveland ES, Marie Reed ES, Powell ES, Tyler ES
How are results reported?
Each student’s proficiency level is provided by the assessment’s vendor as Far Below Proficient, Below Proficient, Proficient, or Above Proficient for each window.
Students in grades 3-5 who score Proficient or Above Proficient in the BOY window, do not take TRC at EOY, and are at the same school as of the first day of the EOY window are assumed to remain at Proficient or better at EOY and will be included in the school’s EOY aggregate calculation.
The proficiency rate for TRC (TRC % Proficient) is expressed as the percentage of students who scored as
Proficient or Above Proficient (TRC Proficient) compared to the total number of students who are tested
and meet the inclusion criteria above (TRC Tested).
𝑻𝑹𝑪 % 𝑷𝒓𝒐𝒇𝒊𝒄𝒊𝒆𝒏𝒕 =𝑻𝑹𝑪 𝑷𝒓𝒐𝒇𝒊𝒄𝒊𝒆𝒏𝒕
𝑻𝑹𝑪 𝑻𝒆𝒔𝒕𝒆𝒅
11
1200 First Street, NE | Washington, DC 20002 | T 202.442.5885 | www.dcps.dc.gov
i-Ready What is the purpose of this assessment?
The i-Ready mathematics diagnostic assesses a student’s performance across Common Core-aligned
domains. Through an online computer adaptive diagnostic, DCPS measures proficiency and growth in
mathematics for students in grades 2-8. i-Ready leverages advanced technology to provide a deep,
customized evaluation of every student and to track student growth and performance consistently and
continuously.
i-Ready Participation Rate
Which students are included in the calculation?
Students that meet the following criteria will be included in the calculation:
In the enrollment snapshot at the school where they tested; the BOY enrollment snapshot is the official audited enrollment file (preliminary rates are calculated using the October enrollment snapshot) and the MOY and EOY snapshots are from the first day of the respective testing window communicated by OTL
In grades 2-8
Are not eligible for the MSAA
How are results reported?
The participation rate for i-Ready (i-Ready Participation Rate) is the expression of the total number of
students tested in the window (i-Ready Participation Tested) as a percentage of the total number of
students registered in i-Ready testing grades in the enrollment snapshot (i-Ready Registered).
𝒊 − 𝑹𝒆𝒂𝒅𝒚 𝑷𝒂𝒓𝒕𝒊𝒄𝒊𝒑𝒂𝒕𝒊𝒐𝒏 𝑹𝒂𝒕𝒆 =𝒊 − 𝑹𝒆𝒂𝒅𝒚 𝑷𝒂𝒓𝒕𝒊𝒄𝒊𝒑𝒂𝒕𝒊𝒐𝒏 𝑻𝒆𝒔𝒕𝒆𝒅
𝒊 − 𝑹𝒆𝒂𝒅𝒚 𝑹𝒆𝒈𝒊𝒔𝒕𝒆𝒓𝒆𝒅
12
1200 First Street, NE | Washington, DC 20002 | T 202.442.5885 | www.dcps.dc.gov
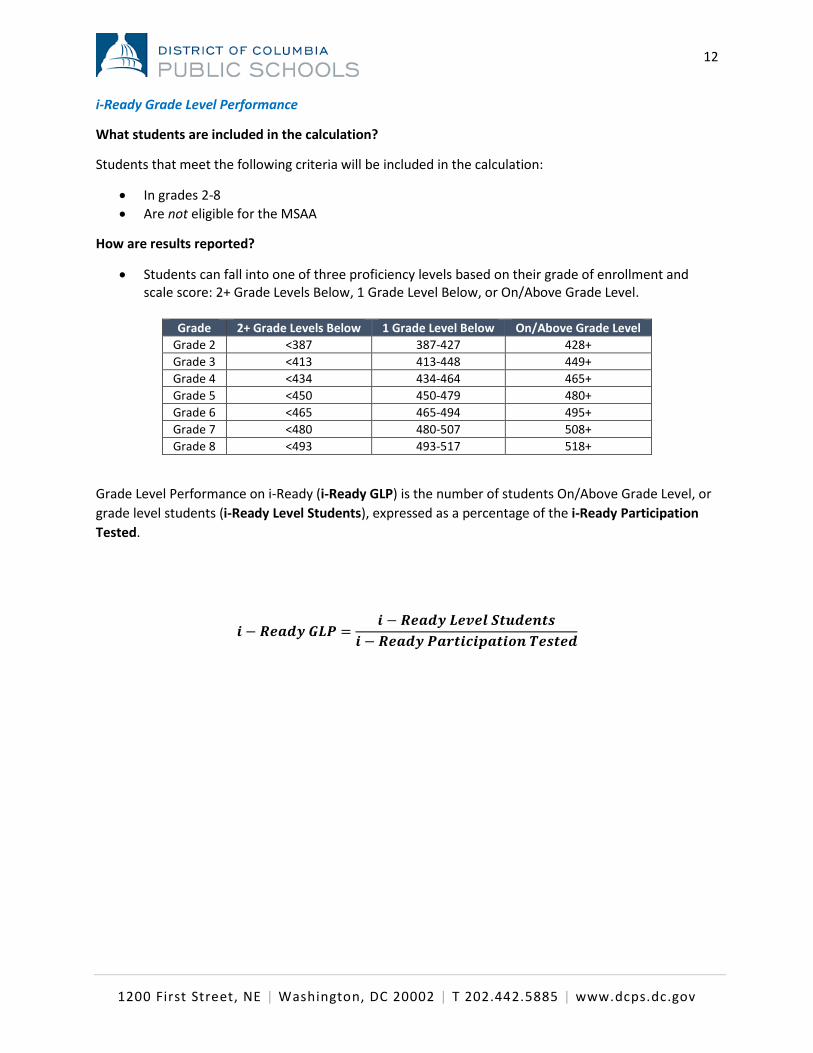
i-Ready Grade Level Performance
What students are included in the calculation?
Students that meet the following criteria will be included in the calculation:
In grades 2-8
Are not eligible for the MSAA
How are results reported?
Students can fall into one of three proficiency levels based on their grade of enrollment and scale score: 2+ Grade Levels Below, 1 Grade Level Below, or On/Above Grade Level.
Grade 2+ Grade Levels Below 1 Grade Level Below On/Above Grade Level
Grade 2 <387 387-427 428+
Grade 3 <413 413-448 449+
Grade 4 <434 434-464 465+
Grade 5 <450 450-479 480+
Grade 6 <465 465-494 495+
Grade 7 <480 480-507 508+
Grade 8 <493 493-517 518+
Grade Level Performance on i-Ready (i-Ready GLP) is the number of students On/Above Grade Level, or
grade level students (i-Ready Level Students), expressed as a percentage of the i-Ready Participation
Tested.
𝒊 − 𝑹𝒆𝒂𝒅𝒚 𝑮𝑳𝑷 =𝒊 − 𝑹𝒆𝒂𝒅𝒚 𝑳𝒆𝒗𝒆𝒍 𝑺𝒕𝒖𝒅𝒆𝒏𝒕𝒔
𝒊 − 𝑹𝒆𝒂𝒅𝒚 𝑷𝒂𝒓𝒕𝒊𝒄𝒊𝒑𝒂𝒕𝒊𝒐𝒏 𝑻𝒆𝒔𝒕𝒆𝒅

13
1200 First Street, NE | Washington, DC 20002 | T 202.442.5885 | www.dcps.dc.gov
i-Ready Scale Score Growth
Which students are included in the calculation?
Students that meet the following criteria will be included in the calculation:
Tested at the same school in the BOY and EOY windows
In the enrollment snapshot at the school where they tested; the BOY enrollment snapshot is the official audited enrollment file (preliminary rates are calculated using the October enrollment snapshot) and the EOY snapshot is from the first day of the EOY testing window communicated by OTL
In grades 2-8
Are not eligible for the MSAA
How are results reported?
During the EOY window, the higher of a student’s first two scores will be used for growth calculations.
A student’s MOY score will be used in place of a lower EOY score if: o It is the first score recorded for that student between the beginning of the MOY window
and the beginning of the EOY window o A student tests at least once during the EOY window
Student growth targets are provided by the vendor, Curriculum Associates, and are based on each student’s grade of enrollment. The table below displays all expected growth targets.
Grade Expected Growth (Points)
Grade 2 27
Grade 3 27
Grade 4 22
Grade 5 20
Grade 6 13
Grade 7 11
Grade 8 11
The percentage of students who met their i-Ready growth targets (i-Ready % Met Growth) will be
expressed as the number of students who met or exceeded their expected growth target (i-Ready
Students Met Growth) expressed as a percentage of the total number of students tested in BOY and
EOY windows (i-Ready Growth Tested).
𝒊 − 𝑹𝒆𝒂𝒅𝒚 % 𝑴𝒆𝒕 𝑮𝒓𝒐𝒘𝒕𝒉 =𝒊 − 𝑹𝒆𝒂𝒅𝒚 𝑺𝒕𝒖𝒅𝒆𝒏𝒕𝒔 𝑴𝒆𝒕 𝑮𝒓𝒐𝒘𝒕𝒉
𝒊 − 𝑹𝒆𝒂𝒅𝒚 𝑮𝒓𝒐𝒘𝒕𝒉 𝑻𝒆𝒔𝒕𝒆𝒅
Please see the next page for examples of i-Ready scale score growth calculations.

14
1200 First Street, NE | Washington, DC 20002 | T 202.442.5885 | www.dcps.dc.gov
i-Ready Scale Score Growth
Example Calculations
Example 1: 2nd grade student
Testing Window (Date) School Scale Score Growth Target
BOY 1 (9/22/2016) School A 300
BOY 2 (9/22/2016) School A 430 460
EOY (5/16/2017) School A 465
Result: This student tested at the same school in the BOY and EOY windows, so he is eligible to count for
the growth rate. The student’s BOY 2 score of 430 will be used for the growth calculation because it was
the highest score in the BOY window from the student’s first day of testing (9/22/2016). The student’s
scale score growth for the year is: 465 - 430 = 35. The student exceeded his growth target of 27 points.
Example 2: 7th grade student
Testing Window (Date) School Scale Score Growth Target
BOY (9/21/2016) School A 505 516
EOY (5/15/2017) School B 520
Result: This student will not count towards any school’s growth rate because she did not test at the same
school at BOY and EOY.
Example 3: 5th grade student
Testing Window (Date) School Scale Score Growth Target
BOY (9/22/2016) School A 465 485
MOY (2/16/2017) School A 490
EOY (5/16/2017) School A 480
Result: This student tested at the same school in the BOY and EOY windows, so he is eligible to count for
the growth rate. Because the student is eligible to be included in the calculation, the Data and Strategy
Team will use the student’s highest score after the beginning of the MOY window, which is 490. The
student’s scale score growth for the year is: 490 - 465 = 25. The student exceeded his growth target of 20
points.

15
1200 First Street, NE | Washington, DC 20002 | T 202.442.5885 | www.dcps.dc.gov
Ninth Grade Academy What is the purpose of this metric?
Ninth Grade Academy is a program meant to track the progress of high school cohorts in passing core
courses needed to graduate. DCPS measures the percentage of these students who are “On-Track to
Promote”, or those students passing said core courses, in order to better gauge progress toward
graduation.
Which students are included in the NGA population?
First-time 9th grade students who are currently registered in English I and/or Algebra I courses in the current school year based on the following rules:
o Enrolled and registered on the last day of school at one of the participating NGA high schools: Anacostia HS (school code= 450); Ballou HS (452); Cardozo EC (454); Coolidge HS (455); Dunbar HS (467); Eastern HS (457); Roosevelt HS @ MacFarland (459); Ron Brown High School (425); Woodson, H.D. HS (464).
o Classified as first-time 9th graders 9th grade entry year, which is a data point entered by schools, is the current
school year Registered as grade 9 on the last day of school
o Enrolled in English I and/or Algebra I or completed the course already in the current year.
o “English I courses” include courses whose course codes contain the following leading characters: E03; E09; E15; E16; E50; E95; EC6; EI3; X01; X02; E07. For schools on a semester schedule, EX1 counts as English I in the first semester.
o “Algebra I courses” include courses whose course codes contain the following leading characters: M21; M22; M24; MMX; M18; M19; M8X; MA1; MA2; MX8; M23.
o Students who took Alg I-A (M23), but not Alg I-B (M24), count as NGA. o Students with credit recovery courses (i.e. suffix of “CR”) only count if they have another
record of that course at any point in the year.
Notes about student participation: o Special education (SPED) students in self-contained classrooms are excluded because
they are not taught by Academy teachers. o ELL Level 1 students are excluded. Even though these ELL Level 1 students may be
taught by an NGA teacher for Algebra I, they are not taught by an NGA teacher for English I.
o Special Exclusions: Students at Cardozo Education Campus and Roosevelt Senior High School who are part of the International Academy do not count as NGA. These students have an “ESL” section type added to their courses.

16
1200 First Street, NE | Washington, DC 20002 | T 202.442.5885 | www.dcps.dc.gov
NGA On-Track to Promote
Which students are included in the calculation?
On-track to promote is measured each term, based on currently enrolled and registered NGA students. The final on-track to promote rate is limited to NGA students registered on the last day of school and includes courses passed and credits earned after summer school.
How are results reported?
Students are considered on-track to promote (On-Track Students) if their most recent term marks (or final marks for completed courses) indicate they are passing English I, Algebra I and 6 total credits (5 DCMR, Chapter 2201.8)
See the appendix for notes on passing course marks for English I, Algebra I and 6 Total Credits.
NGA On-Track % is the number of On-Track Students expressed as a percentage of the total number of
students enrolled in the ninth-grade academy (NGA Enrolled).
𝑵𝑮𝑨 𝑶𝒏 − 𝑻𝒓𝒂𝒄𝒌 % =𝑶𝒏 − 𝑻𝒓𝒂𝒄𝒌 𝑺𝒕𝒖𝒅𝒆𝒏𝒕𝒔
𝑵𝑮𝑨 𝑬𝒏𝒓𝒐𝒍𝒍𝒆𝒅
17
1200 First Street, NE | Washington, DC 20002 | T 202.442.5885 | www.dcps.dc.gov
Promotion What is the purpose of this metric?
DCPS measures the percentage of these students who are “On-Track to Promote”, or those students
passing the courses needed to graduate, in order to better gauge progress toward graduation.
Which students are included in the individual grade populations?
First-time 9th graders
9th grade entry year, which is a data point entered by schools, is the current school year
Enrolled and registered at school as a 9th grader at the last day of the school
First-time 10th graders
9th grade entry year, which is a data point entered by schools, is the prior school year
Enrolled and registered at school as a 10th grader at the last day of the school
First-time 11th graders
9th grade entry year, which is a data point entered by schools, is two years prior
Enrolled and registered at school as an 11th grader at the last day of the school

18
1200 First Street, NE | Washington, DC 20002 | T 202.442.5885 | www.dcps.dc.gov
On-Track to Promote
Which students are included in the calculation?
On-track to promote is measured each term based on currently enrolled and registered students. The
final on-track to promote rate includes students registered on the last day of school, but includes
courses passed and credits earned after summer school.
How are results reported?
For First-time 9th graders:
Students are considered on-track to promote (On-Track Students) if their most recent term marks (or final marks for completed courses) indicate they are passing English I, Algebra I and 6 total credits (5 DCMR, Chapter 2201.8)
See the appendix for notes on passing course marks for English I, Algebra I and 6 Total Credits.
For All 10th graders:
Students are considered on-track to promote (On-Track Students) if their most recent term marks (or final marks for completed courses) indicate they are passing English II and 12 total credits (5 DCMR, Chapter 2201.8)
See the appendix for notes on passing course marks for English II and 12 Total Credits.
For All 11th graders:
Students are considered on-track to promote (On-Track Students) if their most recent term marks (or final marks for completed courses) indicate they are passing English III and 18 total credits (5 DCMR, Chapter 2201.8)
See the appendix for notes on passing course marks for English III and 18 Total Credits.
On-Track % is the number of On-Track Students expressed as a percentage of the total number of
students enrolled at the noted grade level (Enrolled).
𝑶𝒏 − 𝑻𝒓𝒂𝒄𝒌 % =𝑶𝒏 − 𝑻𝒓𝒂𝒄𝒌 𝑺𝒕𝒖𝒅𝒆𝒏𝒕𝒔
𝑬𝒏𝒓𝒐𝒍𝒍𝒆𝒅

19
1200 First Street, NE | Washington, DC 20002 | T 202.442.5885 | www.dcps.dc.gov
Course Passing What is the purpose of this metric?
Course Passing rates are measured in order to observe trends in student population achievement in
different areas of study. These rates can be broken down by sub-groups, in order to better assist school
leaders in identifying instructional areas which may benefit from additional support.
What students are included in the calculations?
Students who were enrolled on the last day of school (Course Enrollment) and students who took the
specified course(s) and earned a passing mark(s) (Passing Students).
How are results reported?
Passing marks are considered non-numeric marks of: P, A, A-, B+, B, B-, C+, C, C-, D+, D; or numeric marks of 64 and above.
For high schools, core courses are defined as courses in English, math, science, or social studies that count toward graduation credit as defined by programs of study in ASPEN.
For middle schools, courses are core English, math, science, and social studies courses. See the appendix for comprehensive list.
Students who have withdrawn from the course, with a course mark of “W”, and students who did not receive a final grade are excluded from the calculation.
If a student takes a course twice or more, the student’s best grade is included in the calculation.
For courses on a semester schedule, the passing rate will be determined as of the last day of the semester.
For the passing all core courses calculation, the student’s best grade from each core subject area is included in the calculation. The core course codes tables on pp. 44 and 45-49 of the appendix display which courses count towards each core subject area.
The passage rate of an individual course (% Passing) is the number of Passing Students expressed as a
percentage of the Course Enrollment.
% 𝑷𝒂𝒔𝒔𝒊𝒏𝒈 =𝑷𝒂𝒔𝒔𝒊𝒏𝒈 𝑺𝒕𝒖𝒅𝒆𝒏𝒕𝒔
𝑪𝒐𝒖𝒓𝒔𝒆 𝑬𝒏𝒓𝒐𝒍𝒍𝒎𝒆𝒏𝒕

20
1200 First Street, NE | Washington, DC 20002 | T 202.442.5885 | www.dcps.dc.gov
Middle School On-Track What is the purpose of this metric?
The Middle School On-Track metric allows schools with middle grades to systematically identify
struggling students and target supports to ensure students are on-track for academic success in high
school.
Which students are included in the calculation?
All students in grades 6, 7, and 8 that were enrolled in the school in the audit file and in the EOY
enrollment snapshot are included in the calculation. The only exception is that students in the Missing
Marks category will not be included in aggregate calculations so that the percentages only reflect
students with marks entered for all core subject areas and at least one non-core course.
How are results reported?
Student-Level Flag: Students will fall into one of six statuses based on their course marks. Note that the
criteria and courses for SPED and ELL0F
1 students differ from the criteria for students in the general
education population.
General Education OR SPED & enrolled in SPED course(s)
If ELL & enrolled in ELL course(s)
grade-level English courses,
grade-level science courses,
grade-level social studies courses,
grade-level or higher math courses,
AND at least one non-core course.
any middle school ELL English courses,
any middle school ELL science courses,
any middle school ELL social studies courses,
any middle school ELL math courses,
AND at least one non-core course.
The criteria for each status are displayed in the following table. The core subject areas noted in the table
are defined as English, science, social studies, and math. Specific courses that count as core for each
subject are outlined in the Core Courses Table in the appendix.
Status Criteria
Green Receiving passing marks in all core subject areas and at least one non-core course.
Yellow Passing at least one course in all core subject areas but receiving non-passing marks in all non-core courses, OR receiving non-passing marks in all courses in one core subject area.
Purple Passing English, science, social studies, and at least one non-core course but receiving a non-passing mark in a higher grade-level math course.
Orange Not enrolled at least one course in each of the core subject areas OR not enrolled in a non-core course.
Red Receiving non-passing marks in all courses in two or more core subject areas OR receiving non-passing marks in all courses in one core subject area and in all non-core courses.
Missing Marks Missing a mark in any core course and/or missing marks for all non-core courses.
1 ELL students include all students with the following ELL statuses: ELL, ELL Level 1, ELL Level 2, ELL Level 3, ELL Level 4, ELLm (Return to ESL), FLEP Monitoring Year 1, FLEP Monitoring Year 2, LES, NES, Outdated (Re-Assess), and Parental Exempt (ELL Level 1-4).

21
1200 First Street, NE | Washington, DC 20002 | T 202.442.5885 | www.dcps.dc.gov
Additional Notes:
The Core Courses Table on page 3 displays the course codes that are included in each core subject area by grade level. Please note that statuses for SPED and ELL students will incorporate the courses under their respective sections as well as the general education courses. However, SPED and ELL courses will not count towards statuses for students that are not identified as SPED or ELL, respectively.
A, A-, B+, B, B-, C+, C, C-, D+, D, and P are considered to be passing marks. Instances in which students withdrew with a course mark of W will be removed and will not be considered in determining students’ statuses. All other marks are considered to be non-passing marks.
If a student is enrolled in more than one grade-level or higher math course as in the example of Student H above, the highest mark will be used to determine the student’s on-track flag. If a student is enrolled in a math course at a higher grade level than his or her own (e.g. a 7th grade student enrolled in 8th grade math) and not in the grade-level course, the student is assumed to have previously passed the course associated with his or her grade of enrollment.
Mark entry rates are calculated by dividing the total number of courses in which students included in the calculation have received a mark by the total number of courses in which students included in the calculation are enrolled.
School-Level Calculation: MS On-Track status aggregations (% i Status) are reported as the number of
students that fall under each status (# i Status) as a percentage of the total number of students with
Green, Yellow, Red, Purple, and Orange statuses (# Eligible). Note that students with a status of Missing
Marks are not included in the percentage calculations.
% 𝒊 𝑺𝒕𝒂𝒕𝒖𝒔 = # 𝒊 𝑺𝒕𝒂𝒕𝒖𝒔
# 𝑬𝒍𝒊𝒈𝒊𝒃𝒍𝒆
NOTE: The “i” represents the respective status.

22
1200 First Street, NE | Washington, DC 20002 | T 202.442.5885 | www.dcps.dc.gov
Adjusted Cohort Graduation Rate (ACGR) What is the purpose of this metric?
ACGR is measure of how many students, who begin 9th grade in DCPS, are able to graduate in four years.
This metric will allow school leaders to better observe how often students are both retained and achieve
promotion in order to graduate “on time”.
Which students are included in the calculation?
The ACGR cohort initially consists of all students who were ever enrolled in DCPS with a first-time 9th
grade year of three school years before their graduating year. For example, the SY2015-2016 graduating
cohort was comprised of students who first enrolled as a first-time 9th grader in SY2012-2013. Students
can enter the cohort at any point in time during the 4-year span, as long as they meet this initial
criterion.
The following students are not included in the cohort: o Students only ever enrolled in a non-diploma-granting institution [Mamie D. Lee and
Sharpe Health (now River Terrace), Incarcerated Youth Program, Youth Services Center, CHOICE Academy, Resolution].
o Students who were last enrolled in DCPS prior to the official October 2012 audit and were withdrawn with the code “Enrolled but never attended.”
o Students who never reached Stage 5 enrollment o Students who were last enrolled in CFSA/PRO schools (948, 958, 7000) o Students for whom schools have provided acceptable withdrawal documentation
indicating a transfer to another diploma-granting institution after the student’s final withdrawal from DCPS or unofficial documentation for deceased students or those who have moved outside the country.
How are results reported?
The ACGR method of calculating graduation rate, which has been in use in DC since SY2010-2011,
accounts for the completion outcomes (e.g., graduation) of a cohort of students who all started 9th
grade at the same time. ACGR accounts not only for the outcome of a student but also the time spent in
reaching that outcome.
Initial ACGR rates are available in August of most years. ACGR calculations are then audited and finalized in the fall, after approval by OSSE. This typically occurs in October or November.
ACGR is the number of certified graduates within the cohort (Cohort Grads) expressed as a percentage
of the total number of students in the cohort, minus the number of those students who transferred out
with valid transfer documentation (Cohort Size).
𝑨𝑪𝑮𝑹 =𝑪𝒐𝒉𝒐𝒓𝒕 𝑮𝒓𝒂𝒅𝒔
𝑪𝒐𝒉𝒐𝒓𝒕 𝑺𝒊𝒛𝒆

23
1200 First Street, NE | Washington, DC 20002 | T 202.442.5885 | www.dcps.dc.gov
Additional Notes:
School of Responsibility: The last diploma-granting school in which a student is enrolled is the school of responsibility. If students subsequently transfer to a non-diploma-granting institution, the last diploma-granting school in which the student was enrolled prior to the end of June is held responsible.
Graduation Status: A student is considered a certified graduate for ACGR calculations if he or she appears on any certified graduates list in 2016 or prior. August graduates are treated the same as June graduates. Earning an IEP certificate does not count as a successful graduation.

24
1200 First Street, NE | Washington, DC 20002 | T 202.442.5885 | www.dcps.dc.gov
SAT- College Admission Exam What is the purpose of these metrics?
SAT participation rates and average SAT scores allow school leaders to see how well high school
students are performing on one of the most used college admission exams. This section references the
Super Score, which is a student’s highest possible combination of Evidence-Based Reading & Writing
and Math sections on the SAT. Both the Super Score and section averages are reported, which can offer
school leaders information as to what additional supports may help high school students be better
prepared for this college admission exam.
SAT Participation Rate
Which students are included in the calculation?
All 11th and 12th graders registered at a school as of the test administration date (SAT Registered).
How are results reported?
These metrics are calculated after each SAT administration and use the count of registered 11th and 12th
graders as of the latest test administration date. A student’s grade level will be determined by their
grade in ASPEN as of the test administration date. Note: This is different from the self-reported grades
used by College Board.
The SAT Participation Rate is expressed by the total number of 11th and 12th grade students that took
the SAT at any point during the year (SAT Tested) as a percentage of the total number of registered 11th
and 12th grade students as of the test administration date (SAT Registered):
𝑺𝑨𝑻 𝑷𝒂𝒓𝒕𝒊𝒄𝒊𝒑𝒂𝒕𝒊𝒐𝒏 𝑹𝒂𝒕𝒆 =𝑺𝑨𝑻 𝑻𝒆𝒔𝒕𝒆𝒅
𝑺𝑨𝑻 𝑹𝒆𝒈𝒊𝒔𝒕𝒆𝒓𝒆𝒅

25
1200 First Street, NE | Washington, DC 20002 | T 202.442.5885 | www.dcps.dc.gov
SAT Section Average
Which students are included in the calculation?
All 11th and 12th graders who took the SAT during the school year. (SAT Total)
How are results reported?
These metrics are calculated after each SAT administration and use the count of registered 11th and 12th
graders as of the latest test administration date. A student’s grade level will be determined by their
grade in ASPEN as of the test administration date. Note: This is different from the self-reported grades
used by College Board.
DCPS breaks out the average score for each section (evidence-based reading & writing and math) by
grade. The average score for each section (SAT Section Average) is the sum each student’s highest score
on that section (Section High Score), expressed as an average of the total number of 11th or 12th grade
test takers (SAT Total).
𝑺𝑨𝑻 𝑺𝒆𝒄𝒕𝒊𝒐𝒏 𝑨𝒗𝒆𝒓𝒂𝒈𝒆 =𝑺𝒆𝒄𝒕𝒊𝒐𝒏 𝑯𝒊𝒈𝒉 𝑺𝒄𝒐𝒓𝒆
𝑺𝑨𝑻 𝑻𝒐𝒕𝒂𝒍
SAT Average Super Score
Which students are included in the calculation?
All 11th and 12th graders who took the SAT during the school year. (SAT Total)
How are results reported?
These metrics are calculated after each SAT administration and use the count of registered 11th and 12th
graders as of the latest test administration date. A student’s grade level will be determined by their
grade in ASPEN as of the test administration date. Note: This is different from the self-reported grades
used by College Board.
DCPS calculates the highest combination of scores for all 11th and 12th graders who took the test during
the 2015-2016 school year. The school’s average composite score on the SAT (SAT Avg Super Score) is
expressed as the sum of super scores for all 11th and 12th grade test takers (Super Score Sum) averaged
against the SAT Total.
𝑺𝑨𝑻 𝑨𝒗𝒈 𝑺𝒖𝒑𝒆𝒓 𝑺𝒄𝒐𝒓𝒆 =𝑺𝒖𝒑𝒆𝒓 𝑺𝒄𝒐𝒓𝒆 𝑺𝒖𝒎
𝑺𝑨𝑻 𝑻𝒐𝒕𝒂𝒍

26
1200 First Street, NE | Washington, DC 20002 | T 202.442.5885 | www.dcps.dc.gov
PSAT What is the purpose of these metrics?
PSAT participation rates and average PSAT scores allow school leaders to see how well high school
students are prepared for the SAT. In addition to being a great practice exam for students, the PSAT
(NMSQT) qualifies students for the National Merit Scholarship. All metrics will be reported by grade
level.
PSAT Participation Rate
Which students are included in the calculation?
All 9th, 10th, and 11th grade students registered at a school as of the test administration date (PSAT
Registered).
How are results reported?
These metrics are calculated after each PSAT administration and use the count of registered 9th, 10th,
and 11th graders as of the test administration date. A student’s grade level will be determined by their
grade in ASPEN as of the test administration date. Note: This is different from the self-reported grades
used by College Board.
The PSAT Participation Rate is expressed by the total number of 9th, 10th, and 11th grade students that
took the PSAT at any point during the year (PSAT Tested) as a percentage of the total number of
registered 9th, 10th, and 11th grade students as of the test administration date (PSAT Registered):
𝑷𝑺𝑨𝑻 𝑷𝒂𝒓𝒕𝒊𝒄𝒊𝒑𝒂𝒕𝒊𝒐𝒏 𝑹𝒂𝒕𝒆 =𝑷𝑺𝑨𝑻 𝑻𝒆𝒔𝒕𝒆𝒅
𝑷𝑺𝑨𝑻 𝑹𝒆𝒈𝒊𝒔𝒕𝒆𝒓𝒆𝒅

27
1200 First Street, NE | Washington, DC 20002 | T 202.442.5885 | www.dcps.dc.gov
PSAT Section Average
Which students are included in the calculation?
All 9th, 10th, and 11th grade students who took the PSAT during the school year. (PSAT Total)
How are results reported?
These metrics are calculated after the PSAT administration and use the count of registered 9th, 10th, and
11th graders as of the test administration date. A student’s grade level will be determined by their grade
in ASPEN as of the test administration date. Note: This is different from the self-reported grades used by
College Board.
DCPS breaks out the average score for each section (evidence-based reading & writing and math) by
grade. The average score for each section (PSAT Section Average) is the sum each student’s score on
that section (PSAT Section High Score), expressed as an average of the total number of 9th, 10th, and 11th
grade test takers (PSAT Total).
𝑷𝑺𝑨𝑻 𝑺𝒆𝒄𝒕𝒊𝒐𝒏 𝑨𝒗𝒆𝒓𝒂𝒈𝒆 =𝑷𝑺𝑨𝑻 𝑺𝒆𝒄𝒕𝒊𝒐𝒏 𝑯𝒊𝒈𝒉 𝑺𝒄𝒐𝒓𝒆
𝑷𝑺𝑨𝑻 𝑻𝒐𝒕𝒂𝒍
PSAT Average Score
Which students are included in the calculation?
All 9th, 10th, and 11th grade students who took the PSAT during the school year. (PSAT Total)
How are results reported?
These metrics are calculated after the PSAT administration and use the count of registered 9th, 10th, and
11th graders as of the test administration date. A student’s grade level will be determined by their grade
in ASPEN as of the test administration date. Note: This is different from the self-reported grades used by
College Board.
The school’s average composite score on the PSAT (PSAT Avg Score) is expressed as the sum of scores
for 9th, 10th, and 11th grade test takers (PSAT Score Sum) averaged against the PSAT Total.
𝑷𝑺𝑨𝑻 𝑨𝒗𝒈 𝑺𝒄𝒐𝒓𝒆 =𝑷𝑺𝑨𝑻 𝑺𝒄𝒐𝒓𝒆 𝑺𝒖𝒎
𝑷𝑺𝑨𝑻 𝑻𝒐𝒕𝒂𝒍

28
1200 First Street, NE | Washington, DC 20002 | T 202.442.5885 | www.dcps.dc.gov
Advanced Placement (AP) Achievement What is the purpose of this metric?
Advanced Placement (AP) exams are administered toward the end of the year and are offered to
students who are enrolled in the respective AP course during that school year. Exams are graded on a
scale from 1-5 (5 being the highest), where scores of 3 and above represent passing. By measuring the
percentage of students who achieve each of the five possible scores, on each exam, school leaders are
able to see how well their AP courses are preparing their students for success on the AP exam.
AP Course Enrollment Rate
Which students are included in the calculation?
All students who were enrolled in an AP course during the school year (AP Enrolled)
How are results reported?
The participation rate for AP (AP Participation Rate) is the number of students enrolled in AP courses at
the school (AP Enrolled) expressed as a percentage of the total number of students enrolled at the
school (AP Enroll Total).
𝑨𝑷 𝑷𝒂𝒓𝒕𝒊𝒄𝒊𝒑𝒂𝒕𝒊𝒐𝒏 𝑹𝒂𝒕𝒆 =𝑨𝑷 𝑬𝒏𝒓𝒐𝒍𝒍𝒆𝒅
𝑨𝑷 𝑬𝒏𝒓𝒐𝒍𝒍 𝑻𝒐𝒕𝒂𝒍

29
1200 First Street, NE | Washington, DC 20002 | T 202.442.5885 | www.dcps.dc.gov
AP Exam Performance
Which students are included in the calculation?
All students who completed an AP exam for the respective school year are included in the calculation.
How are results reported?
Each exam is graded on a 1-5 scale with results of 3 or higher counting as passing. The percentage of
exams in each score level will be calculated.
School AP Performance is number of AP Exams that fall into each of the five score levels, expressed as a
percentage of AP Total Exams. For example, % AP 3 would be the number of exams graded a 3 (AP 3
Exams) expressed as a percentage of AP Total Exams.
% 𝑨𝑷 𝒊 =𝑨𝑷 𝒊 𝑬𝒙𝒂𝒎𝒔
𝑨𝑷 𝑻𝒐𝒕𝒂𝒍 𝑬𝒙𝒂𝒎𝒔
NOTE: The “i” represents the respective score level.

30
1200 First Street, NE | Washington, DC 20002 | T 202.442.5885 | www.dcps.dc.gov
Evaluacion del Desarrollo de la Lectura 2 (EDL2) What is the purpose of this assessment?
EDL2 is the Spanish literacy benchmark assessment administered by the elementary dual-language
programs within DCPS. The assessment, used in conjunction with TRC and DIBELS, is used to inform
growth and proficiency in the Spanish language. The following schools will administer the EDL2 in SY16-
17: Bancroft ES, Bruce-Monroe ES, Cleveland ES, Oyster-Adams Bilingual School, Marie Reed ES, Powell
ES, and Tyler ES.
EDL2 Proficiency Bands
Which students are included in this calculation?
Students that meet the following criteria will be included in the calculation:
Completed an EDL2 assessment in the testing window
Are in grades 1-5
Are in the enrollment snapshot at the school where they tested; the BOY enrollment snapshot is the official audited enrollment file (the October enrollment snapshot is used until the audit file is ready) and the EOY snapshot is from the first day of the EOY testing window communicated by OTL
Are not eligible for the MSAA
Are not ELL Newcomers (except if student’s home language is Spanish, as indicated on their registration form): ELL Newcomers are students that were born outside of the United States and have been enrolled in U.S. schools for less than 12 full calendar months
Are enrolled in a dual-language program at one of the following schools: o Whole school implementation: Bancroft ES, Bruce-Monroe ES, Oyster-Adams Bilingual o Strand implementation: Cleveland ES, Marie Reed ES, Powell ES, Tyler ES
How are results reported?
Students can fall into one of four proficiency levels based on their grade of enrollment and DRA level:
Below Benchmark, Approaching Benchmark, Benchmark, Above Benchmark. The EDL Proficiency Bands
table in the appendix outlines the cut points for each proficiency level and grade at each benchmark
period. The first score in the window is used to determine each student’s proficiency level for BOY and
the highest score in the window is used for EOY. If a student tested more than once on the same day for
either window, the highest score is used.
Additional Notes:
MOY testing is optional if students are showing growth through progress monitoring
TRC and EDL2: o Students scoring at or below the “Reading Behaviors” (RB) level in their home language
should be exempted from the RB portion of the assessment in the partner language o Once students have demonstrated RB proficiency in either language, assessments can
begin at level 3 (EDL2) and level C (TRC) which assess post-RB skills.
Any student that scores a Level 60 at the beginning of the year on a non-fiction text (NF) is exempt from EDL2 testing at the end of the year and will be considered above benchmark.
Teachers must report students’ independent level.

31
1200 First Street, NE | Washington, DC 20002 | T 202.442.5885 | www.dcps.dc.gov
Achievement rates for EDL2 (% EDL Prof Band i) is the number of students scoring in each band (EDL
Band i) expressed as a percentage of the total number of students tested in the window (EDL Tested).
% 𝑬𝑫𝑳 𝑷𝒓𝒐𝒇 𝑩𝒂𝒏𝒅 𝒊 =𝑬𝑫𝑳 𝑩𝒂𝒏𝒅 𝒊
𝑬𝑫𝑳 𝑻𝒆𝒔𝒕𝒆𝒅
NOTE: The “i” represents the respective proficiency band.

32
1200 First Street, NE | Washington, DC 20002 | T 202.442.5885 | www.dcps.dc.gov
ACCESS Growth What is the purpose of this metric?
The ACCESS for ELLs is an annual assessment that helps schools determine how ELL students have
progressed with their English language development. The results inform the need for support to enable
English language learners (ELLs) to continue developing greater English language proficiency in each of
the four language domains. The results also allow teachers to tailor instruction for ELL students.
Students are expected to achieve 0.6 points of growth on the ACCESS over the course of a full academic
year, as measured from one ACCESS for ELLs assessment to another.
Which students are included in the calculation?
Students that took the ACCESS ALT, meaning they received an A1, A2, A3, P1, P2, or P3 for their results,
are not included in the calculation. All other students that took ACCESS in the current school year and
the previous school year are included in the calculation.
What is the difference between state and internal accountability measures?
The ACCESS for ELLs 2.0 administration window is being moved to February, effective SY 16-17. As such,
state accountability for student growth will take effect in SY 17-18. DCPS will continue to measure ELL
language growth internally. LAD is available to support schools in this process.
How are results reported?
The ACCESS growth rate (ACCESS Growth) is the number of students that achieved 0.6 points of growth
from the previous year’s administration (ACCESS Students Met Growth) expressed as a percentage of
the total number of students that took the ACCESS assessment in the current year and the previous year
(ACCESS Tested).
Results count toward the school where the student tested in the current year.
𝑨𝑪𝑪𝑬𝑺𝑺 𝑮𝒓𝒐𝒘𝒕𝒉 =𝑨𝑪𝑪𝑬𝑺𝑺 𝑺𝒕𝒖𝒅𝒆𝒏𝒕𝒔 𝑴𝒆𝒕 𝑮𝒓𝒐𝒘𝒕𝒉
𝑨𝑪𝑪𝑬𝑺𝑺 𝑻𝒆𝒔𝒕𝒆𝒅

33
1200 First Street, NE | Washington, DC 20002 | T 202.442.5885 | www.dcps.dc.gov
Attendance What is the purpose of this metric?
This metric is an indicator of the percent of students who are present for instruction, a vital aspect of
educational success. These measures can be broken down by sub-group, which allow school leaders to
identify where chronic absence is occurring most frequently in the school.
In-Seat Attendance
Which students are included in the calculation?
In-Seat Attendance (ISA) is the percent of school days for which students were present, or in-seat.
Because this is intended to be an indicator of the percent of students who are present for instruction,
almost all absences count against ISA.
The only absences that do not count against ISA are in-school suspension absences and school activity
absences. Absences that count against ISA are called In-Seat Absences.
How are results reported?
The school level ISA calculation includes all in-seat days and membership days that were accrued at the
school that year. Therefore, in-seat days and membership days accrued by students that have since
withdrawn are still included in the school ISA calculation.
ISA is the total number of in-seat days, or the sum of each student’s attended school days (In-Seat
Days), expressed as a percentage of the total number of expected school days for each student minus
the total number of excluded absences, or the total number of days students were expected to attend
school (Membership Days).
𝑰𝑺𝑨 =𝑰𝒏 − 𝑺𝒆𝒂𝒕 𝑫𝒂𝒚𝒔
𝑴𝒆𝒎𝒃𝒆𝒓𝒔𝒉𝒊𝒑 𝑫𝒂𝒚𝒔

34
1200 First Street, NE | Washington, DC 20002 | T 202.442.5885 | www.dcps.dc.gov
ISA Categories for Students
What is the purpose of this metric?
Students are often categorized into ISA categories to allow school leaders to quickly see student
attendance more granularly than an overall ISA rate. The information below provides an overview of the
ranges and how students are placed in them.
Which students are included in the calculation?
Only currently registered students are included, and only the membership days and in-seat days accrued
in each of these students’ most current enrollment period are included. For example, if a student was
enrolled in a school in the fall, withdrew, and came back in the spring and stayed through the end of the
year, only the membership days and in-seat days from her or his most recent enrollment date will be
included in the calculation.
How are results reported?
This metric shows students who have an ISA of less than or equal to 90% - which aligns with the
definition of what is considered a chronically absent student - broken out into the <=80% and 81%-90%
groups.
The preceding formula for ISA is used to find the percentage of days each student attended school out
of the days they were expected to attend. This formula will categorize each student into one of four
categories:
< 80%
80 – 89 %
90- 94 %
>= 95 %
Students who fall into the 80-89% and <80% categories will be considered “chronically absent”. The
percentage of students falling into each category will be reported at the end of the year.

35
1200 First Street, NE | Washington, DC 20002 | T 202.442.5885 | www.dcps.dc.gov
Truancy What is the purpose of this metric?
The truancy metric allows school leaders to identify where and when truancy is occurring most
frequently, and how their school compares to other schools within the district.
Which students are included in the calculation?
A truant student (sometimes referred to as a chronically truant student) is a student who: o Is over the age of 5 and under the age of 18 as of 9/30/16 o Was enrolled in the school at some point during the school year, for at least 10
membership days o Has accrued at least 10 unexcused absences in any enrollment during the school year
All students who are enrolled at a school for at least 10 membership days will be counted toward the Enrolled Students
Students will only count toward a school’s Truant Students at the school at which they became truant.
School numbers will not necessarily add up to the district number, since a student could be enrolled in multiple schools or become truant in multiple schools throughout the year.
How are results reported?
The Truancy Rate is calculated by dividing the number of unique students who ever became truant in
any one enrollment (Truant Students) by the total number of students ever enrolled in the school
during the year (Enrolled Students).
𝑻𝒓𝒖𝒂𝒏𝒄𝒚 𝑹𝒂𝒕𝒆 =𝑻𝒓𝒖𝒂𝒏𝒕 𝑺𝒕𝒖𝒅𝒆𝒏𝒕𝒔
𝑬𝒏𝒓𝒐𝒍𝒍𝒆𝒅 𝑺𝒕𝒖𝒅𝒆𝒏𝒕𝒔

36
1200 First Street, NE | Washington, DC 20002 | T 202.442.5885 | www.dcps.dc.gov
Behavior Metrics Suspensions per Hundred Students
What is the purpose of this metric?
This metric is designed to allow comparison of suspensions across schools of different size or to district,
cluster, or national metrics.
Which students are included in the calculation?
Students registered at any point during the school year are included in the calculation.
How are results reported?
Suspensions per hundred students is calculated by taking the number of approved suspensions issued at
the school and dividing it by the average number of registered students. All suspensions issued at the
school are included regardless of whether the student is still a DCPS student or at the suspending school.
The number of suspensions per hundred students (Susp per Hundred) is the total number of approved
suspensions issued (Issued Susps) divided by the average number of registered students (Avg
Registered) multiplied by 100 to minimize fractional results.
𝑺𝒖𝒔𝒑 𝒑𝒆𝒓 𝑯𝒖𝒏𝒅𝒓𝒆𝒅 =𝑰𝒔𝒔𝒖𝒆𝒅 𝑺𝒖𝒔𝒑𝒔
𝑨𝒗𝒈 𝑹𝒆𝒈𝒊𝒔𝒕𝒆𝒓𝒆𝒅

37
1200 First Street, NE | Washington, DC 20002 | T 202.442.5885 | www.dcps.dc.gov
Percent of Registered Students Suspended
What is the purpose of this metric?
This metric is designed to allow comparison of suspensions across schools of different size or to district
or cluster metrics.
Which students are included in the calculation?
This calculation includes suspended students in the numerator and the average number of registered
students during the school year in the denominator. Average instead of a point in time is used in order
to minimize the impact of changes in student population throughout the year on the metric.
How are results reported?
This metric is designed to look at the number of students, rather than incidents and speaks to what
share of the student population has behavior issues that result in suspension.
The percent of registered students suspended (% Suspended) is the number of students with at least
one suspension (Susp Students) expressed as a percentage of the Avg Registered.
% 𝑺𝒖𝒔𝒑𝒆𝒏𝒅𝒆𝒅 =𝑺𝒖𝒔𝒑 𝑺𝒕𝒖𝒅𝒆𝒏𝒕𝒔
𝑨𝒗𝒈 𝑹𝒆𝒈𝒊𝒔𝒕𝒆𝒓𝒆𝒅

38
1200 First Street, NE | Washington, DC 20002 | T 202.442.5885 | www.dcps.dc.gov
Note: The following two metrics should be looked at together.
What is the purpose of these metrics?
If the percent of suspensions assigned to SPED students far outweighs the overall percent of SPED
students in a building, this could mean that SPED students are being disproportionately suspended.
Special Education Suspension Rates
Which students are included in the calculation?
This calculation includes suspensions assigned to special education students in the numerator and
suspensions assigned to any student in the numerator for a given school, cluster or district.
How are results reported?
Suspension rates for special education students (% SPED Suspensions) are calculated as the total
number of suspensions assigned to SPED students (SPED Susps) as a percentage of the total number of
suspensions (Total Susps).
% 𝑺𝑷𝑬𝑫 𝑺𝒖𝒔𝒑𝒆𝒏𝒔𝒊𝒐𝒏𝒔 =𝑺𝑷𝑬𝑫 𝑺𝒖𝒔𝒑𝒔
𝑻𝒐𝒕𝒂𝒍 𝑺𝒖𝒔𝒑𝒔
Percent of SPED students
Which students are included in the calculation?
This metric includes special education students as of the run date in the numerator and registered
students as of the run date in the denominator.
How are results reported?
The percentage of SPED students in the building is calculated by the number of currently registered
SPED students (SPED Total) divided by the total number of currently registered students (Registered
Total).
% 𝑺𝑷𝑬𝑫 =𝑺𝑷𝑬𝑫 𝑻𝒐𝒕𝒂𝒍
𝑹𝒆𝒈𝒊𝒔𝒕𝒆𝒓𝒆𝒅 𝑻𝒐𝒕𝒂𝒍

39
1200 First Street, NE | Washington, DC 20002 | T 202.442.5885 | www.dcps.dc.gov
Student Satisfaction Metrics What is the purpose of this metric?
In addition to collecting general data on school climate, the student satisfaction survey is also the
primary method for measuring progress against DCPS’ 4th Capital Commitment Goal, which states that
90% of students will say they like their school by 2017.
Student Satisfaction Index
Which students are included in the calculation?
DCPS administers satisfaction surveys to students in grades 3 and higher. Students must answer at least two of the eight questions to be included in the index score
o Student Response Rate: All students enrolled as of March 9, 2016 were eligible to complete the survey in SY2015-2016 and a similar date will be communicated this year.
Students in the following categories are removed from the population (and therefore do NOT count against the response rate):
Students who had returned opt out forms.
Students withdrawn before the start of the survey window (May 2, 2016 in SY2015-2016).
Students flagged to DCPS as having severe cognitive disabilities that prevented them from taking the survey.
Students were counted as respondents as long as they answered at least one question on the survey.
For alternative schools (CHOICE, Youth Services Center, Incarcerated Youth Program), DCPS used rosters as of May 2, 2016 to calculate response rates in SY2015-2016 and a similar date will be communicated this year.
How are results reported?
The Student Satisfaction Index (SSI) score for the district (or each school) is the percentage of students who overall responded favorably to this group of questions.
The SSI uses eight questions instead of the single “I like my school” for a more robust measure.
Scores range from 0-100%.
Response options range from Strongly Disagree to Strongly Agree.
NOTE: Questions in the Student Satisfaction Index are in the appendix.

40
1200 First Street, NE | Washington, DC 20002 | T 202.442.5885 | www.dcps.dc.gov
Appendix RI Expected Growth Cuts; Grades 4-10*
Grade BOY Lexile Score Expected Growth
Grade 4
0L to 199L 245
200L to 299L 200
300L to 399L 160
400L to 499L 130
500L to 599L 100
600L to 699L 80
700L to 799L 65
800L to 899L 50
900L to 999L 35
1000L to 1099L 25
Grade 5
0L to 199L 235
200L to 299L 190
300L to 399L 155
400L to 499L 130
500L to 599L 105
600L to 699L 85
700L to 799L 65
800L to 899L 50
900L to 999L 30
1000L to 1099L 15
1100L to 1199L 5
Grade 6
0L to 199L 205
200L to 299L 155
300L to 399L 115
400L to 499L 90
500L to 599L 70
600L to 699L 55
700L to 799L 45
800L to 899L 35
900L to 999L 30
1000L to 1099L 20
1100L to 1199L 5
1200L to 1299L 0
Grade 7
0L to 199L 220
200L to 299L 165
300L to 399L 125
400L to 499L 90
500L to 599L 70
600L to 699L 55
700L to 799L 45
800L to 899L 35
900L to 999L 30
1000L to 1099L 25
1100L to 1199L 15
1200L to 1299L 0

41
1200 First Street, NE | Washington, DC 20002 | T 202.442.5885 | www.dcps.dc.gov
RI Expected Growth Cuts Continued…
Grade BOY Lexile Score Expected Growth
Grade 8
0L to 199L 240
200L to 299L 185
300L to 399L 140
400L to 499L 105
500L to 599L 80
600L to 699L 65
700L to 799L 55
800L to 899L 45
900L to 999L 35
1000L to 1099L 30
1100L to 1199L 20
1200L to 1299L 10
1300L to 1399L 0
Grade 9
0L to 199L 220
200L to 299L 165
300L to 399L 125
400L to 499L 90
500L to 599L 70
600L to 699L 50
700L to 799L 40
800L to 899L 35
900L to 999L 30
1000L to 1099L 25
1100L to 1199L 15
1200L to 1299L 5
1300L to 1399L 0
Grade 10
0L to 199L 245
200L to 299L 185
300L to 399L 140
400L to 499L 105
500L to 599L 80
600L to 699L 65
700L to 799L 50
800L to 899L 45
900L to 999L 40
1000L to 1099L 35
1100L to 1199L 25
1200L to 1299L 15
1300L to 1399L 0
1400L to 1499L 0
*Students with an expected growth target of 0 must maintain or improve upon their BOY score in order
to meet their growth target.

42
1200 First Street, NE | Washington, DC 20002 | T 202.442.5885 | www.dcps.dc.gov
Ninth Grade Academy: On-Track to Promote & Promotion Course Code Table
Notes on Course Passing for inclusion among On-Track Students:
Passing English I: Student is currently enrolled in an English I course (see NGA business rules for list of English I courses) and has a passing mark for the most recent term OR has completed English I and passed the course.
Passing Algebra I: Student is currently enrolled in an Algebra I course (see NGA business rules for list of Algebra I courses) and has a passing mark for the most recent term OR has completed Algebra I and passed the course, including middle school Algebra I credit.
Passing 6 Total Credits: Student is currently passing or has earned credits equal to at least 6 total credits. Passing credits are calculated by summing up the credit value of all courses a student is passing; credits a student has already earned is based on cumulative credit on the student’s transcript (including applicable credit from middle school or a non-DCPS school).
The following table displays course codes that count for each course required for promotion.
Course Code Course Name Algebra I English I English II English III
M21 Algebra I Yes No No No
M22 Honors Algebra I Yes No No No
M24 Algebra I-B 1.0 Yes No No No
M19 Algebra I PtB Yes No No No
M8X Algebra I MS Yes No No No
MA1 Algebra I-A 0.5 Yes No No No
MA2 Algebra I-B 0.5 Yes No No No
MX8 MS Algebra EOC Yes No No No
MMX Algebra I MS Yes No No No
M18 Algebra I PtA Yes No No No
E03 English I No Yes No No
E09 Hon English I No Yes No No
E15 English I-A No Yes No No
E16 English I-B No Yes No No
E50 English & Humanities I No Yes No No
E95 English I No Yes No No
EC6 9th Grade Ramp-Up ELA Workshop No Yes No No
EI3 Read 180 English I No Yes No No
E04 English II No No Yes No
E07 AP English Lit & Composition No No Yes Yes
E08 AP English Lang & Composition No No Yes Yes
E18 English II-B No No Yes No
E36 Hon English II No No Yes No
E51 English & Humanities II No No Yes No
X01 IB English A1 HL Part I No No Yes Yes
X02 IB English A1 HL Part II No No Yes Yes
E05 English III No No No Yes
E12 AP Language & Composition No No No Yes
E19 English III-A No No No Yes
E20 English III-B No No No Yes
E37 Hon English III No No No Yes
E52 English & Humanities III No No No Yes

43
1200 First Street, NE | Washington, DC 20002 | T 202.442.5885 | www.dcps.dc.gov
Courses required for promotion continued…
Course Code Course Name Algebra I English I English II English III
EP3 AP Eng Lit&Comp A No No No Yes
EP4 AP Eng Lit&Comp B No No No Yes
YGA College English Lit No No No Yes
YGB College Humanities No No No Yes
Reporting Schedule
No. Reporting Period Purpose
1 Term 1 End Reflects term 1 marks
2 Term 2 End Reflects term 2 marks
3 Term 3 End Reflects term 3 marks
4 Term 4 End Reflects final marks
5 Post-Summer (used for EOY metrics)
Reflects credits earned post-summer school

44
1200 First Street, NE | Washington, DC 20002 | T 202.442.5885 | www.dcps.dc.gov
Course Passing Rate Course Lists
Course Codes Included for Specific Course Passing Rates
Course Code
Title Algebra I Algebra II
Geometry English I English II
English III
English IV
M21 Algebra I Yes No No No No No No
M22 Honors Algebra I Yes No No No No No No
M24 Algebra I-B 1.0 Yes No No No No No No
MA1 Algebra I-A 0.5 Yes No No No No No No
MA2 Algebra I-B 0.5 Yes No No No No No No
MMX Algebra I MS Yes No No No No No No
M41 Algebra II & Trigonometry
No Yes No No No No No
M42 Honors Algebra II No Yes No No No No No
M44 Algebra II-B + Trig 1.0 No Yes No No No No No
M45 Algebra II (MS) No Yes No No No No No
MA3 Algebra II-A + Trig 0.5 No Yes No No No No No
MA4 Algebra II-B + Trig 0.5 No Yes No No No No No
M31 Geometry No No Yes No No No No
M32 Honors Geometry No No Yes No No No No
M34 Geometry Part B 1.0 No No Yes No No No No
MG1 Geometry A 0.5 No No Yes No No No No
MG2 Geometry B 0.5 No No Yes No No No No
MMY Geometry MS No No Yes No No No No
E03 English I No No No Yes No No No
E09 Hon English I No No No Yes No No No
E15 English I-A No No No Yes No No No
E16 English I-B No No No Yes No No No
E50 English &Humanities I No No No Yes No No No
E95 English I No No No Yes No No No
E04 English II No No No No Yes No No
E10 English & Humanities II No No No No Yes No No
E17 English II-A No No No No Yes No No
E18 English II-B No No No No Yes No No
E36 Hon English II No No No No Yes No No
E51 English &Humanities II No No No No Yes No No
E05 English III No No No No No Yes No
E07 AP English Lit & Composition
No No No No No Yes No
E08 AP English Lang & Composition
No No No No No Yes No
E12 AP Language & Composition
No No No No No Yes No
E19 English III-A No No No No No Yes No
E20 English III-B No No No No No Yes No
E37 Hon English III No No No No No Yes No
E52 English &Humanities III No No No No No Yes No
EP3 AP Eng Lit&Comp A No No No No No Yes No

45
1200 First Street, NE | Washington, DC 20002 | T 202.442.5885 | www.dcps.dc.gov
Course Code
Title Algebra I Algebra II
Geometry English I English II
English III
English IV
EP4 AP Eng Lit&Comp B No No No No No Yes No
X01 IB English A1 HL Part I No No No No No Yes No
X02 IB English A1 HL Part II No No No No No Yes No
YGA College English Lit No No No No No Yes No
YGB College Humanities No No No No No Yes No
E06 English IV No No No No No No Yes
E21 English IV-A No No No No No No Yes
E22 English IV-B No No No No No No Yes
E40 Hon English IV No No No No No No Yes
E53 English &Humanities IV No No No No No No Yes
ES4 Senior English Seminar No No No No No No Yes
Notes:
For any calculations completed during semester two in a given school year, Algebra course M23 and Geometry course M33 will be considered a core class. M23 and M33 will not be considered core courses for year-end calculations as these courses do not count toward graduation.
If necessary, central office will work with schools to adjust the business rules to fit special circumstances.

46
1200 First Street, NE | Washington, DC 20002 | T 202.442.5885 | www.dcps.dc.gov
Core Course Codes for Middle School Course Passing Rates
Course
Code Course Title
Core
English
Core
Math
Core Social
Studies
Core
Science
E01 English 7 Yes No No No
E02 English 8 Yes No No No
E48 Humanities 7 Yes No No No
E49 Humanities 8 Yes No No No
EE2 Lang Arts 6 Yes No No No
EM6 Humanities 6 Yes No No No
M06 CC 6TH GRADE MATH No Yes No No
M07 CC 7TH GRADE MATH No Yes No No
M08 CC 8TH GRADE MATH No Yes No No
MMX Algebra I MS No Yes No No
MMY Geometry MS No Yes No No
MMU Accelerated 5th Grade No Yes No No
MMV Accelerated 6th Grade No Yes No No
MMW Accelerated 7th Grade No Yes No No
HC2 WORLD GEOGRAPHY AND CULTURES No No Yes No
HC3 WORLD HISTORY AND GEOGRAPHY I: ANCIENT WORLD No No Yes No
HC4 US HISTORY AND GEOGRAPHY: GROWTH & CONFLCT No No Yes No
SS2 Science 6 No No No Yes
SS3 Science 7 No No No Yes
SS4 Science 8 No No No Yes
Notes:
For Cap Hill Montessori @ Logan, course codes E48, E49 and EM6 are used as social studies courses and not English courses.
For Oyster Adams, course codes L6H, L6L and L6S are used for social studies courses, as part of their dual immersion program.
This practice may vary year to year. The Data and Strategy Team will work closely with OTL, in conjunction with analyzing the course enrollment trends, to ensure that appropriate course codes as identified.
If necessary, central office will work with schools to adjust the business rules to fit special circumstances.

47
1200 First Street, NE | Washington, DC 20002 | T 202.442.5885 | www.dcps.dc.gov
Core Course Codes for High School Course Passing Rates
Course Code
Title Core
English Core Math
Core Social Studies
Core Science
EP3 AP Eng Lit&Comp A Yes No No No
EP4 AP Eng Lit&Comp B Yes No No No
E08 AP English Lang & Composition Yes No No No
E07 AP English Lit & Composition Yes No No No
EP5 APEng Lang&Comp A Yes No No No
EP6 APEng Lang&Comp B Yes No No No
YGA College English Lit Yes No No No
YGB College Humanities Yes No No No
E50 English &Humanities I Yes No No No
E51 English &Humanities II Yes No No No
E52 English &Humanities III Yes No No No
E53 English &Humanities IV Yes No No No
NE4 English C1 Yes No No No
NE5 English C2 Yes No No No
NE6 English C3 Yes No No No
NE7 English C4 Yes No No No
E03 English I Yes No No No
E15 English I-A Yes No No No
E16 English I-B Yes No No No
E04 English II Yes No No No
E17 English II-A Yes No No No
E18 English II-B Yes No No No
E05 English III Yes No No No
E19 English III-A Yes No No No
E20 English III-B Yes No No No
E06 English IV Yes No No No
E21 English IV-A Yes No No No
E22 English IV-B Yes No No No
E09 Hon English I Yes No No No
E36 Hon English II Yes No No No
E37 Hon English III Yes No No No
E40 Hon English IV Yes No No No
X01 IB English A1 HL Part I Yes No No No
X02 IB English A1 HL Part II Yes No No No
ES4 Senior English Seminar Yes No No No
M23 Algebra I-A 1.0 No No^ No No
M33 Geometry Part A 1.0 No No^ No No
M21 Algebra I No Yes No No
MMX Algebra I MS No Yes No No
MA1 Algebra I-A 0.5 No Yes No No
NN2 Algebra I-A C2 No Yes No No
MA2 Algebra I-B 0.5 No Yes No No
M24 Algebra I-B 1.0 No Yes No No

48
1200 First Street, NE | Washington, DC 20002 | T 202.442.5885 | www.dcps.dc.gov
Course Code
Title Core
English Core Math
Core Social Studies
Core Science
NN3 Algebra I-B C2 No Yes No No
M41 Algebra II & Trigonometry No Yes No No
M45 Algebra II (MS) No Yes No No
MA3 Algebra II-A + Trig 0.5 No Yes No No
MA4 Algebra II-B + Trig 0.5 No Yes No No
M44 Algebra II-B + Trig 1.0 No Yes No No
M61 AP Calculus AB No Yes No No
M62 AP Calculus BC No Yes No No
M64 AP Statistics No Yes No No
M67 AP ULM Computer Science No Yes No No
YGF College Calculus B No Yes No No
YGT College Mathematics No Yes No No
M54 Conc & Context of Calculus No Yes No No
M52 Elementary Func & Analytical Geo No Yes No No
NN1 Foundational Math C1 No Yes No No
M31 Geometry No Yes No No
MG1 Geometry A 0.5 No Yes No No
MG2 Geometry B 0.5 No Yes No No
MMY Geometry MS No Yes No No
M34 Geometry Part B 1.0 No Yes No No
M22 Honors Algebra I No Yes No No
M42 Honors Algebra II No Yes No No
M32 Honors Geometry No Yes No No
M56 Honors Precalculus No Yes No No
X41 IB Math Methods SL I No Yes No No
X42 IB Math Methods SL II No Yes No No
X43 IB Math Studies SL I No Yes No No
X44 IB Math Studies SL II No Yes No No
X48 Mathematics HL No Yes No No
M49 Plane Trigonometry No Yes No No
M51 Pre-Calculus No Yes No No
M57 Precalculus (MS) No Yes No No
MP1 Pre-Calculus Pt A 0.5 No Yes No No
MP2 Pre-Calculus Pt B 0.5 No Yes No No
M38 Probability & Stats (1.0) No Yes No No
M36 Probability & Stats I No Yes No No
M37 Probability & Stats II No Yes No No
NN4 Real World Math No Yes No No
HP2 AP U.S. Government No No Yes No
HP1 AP U.S. History No No Yes No

49
1200 First Street, NE | Washington, DC 20002 | T 202.442.5885 | www.dcps.dc.gov
Course Code
Title Core
English Core Math
Core Social Studies
Core Science
HQ3 AP US Government No No Yes No
HX7 AP US Hist Part A - 0.5 No No Yes No
HX8 AP US Hist Part B 0.5 No No Yes No
HP4 AP World History No No Yes No
HM1 AP World History (MS) No No Yes No
YGC College DC Hist&Govt No No Yes No
YGE College Political Science No No Yes No
YGD College US Hist&Geog No No Yes No
YGV College World History No No Yes No
NH7 Concepts of US & DC Government C4 No No Yes No
NH6 Concepts of US Hist & Geo C3 No No Yes No
NH4 Concepts of World Hist & Geo I-A C1 No No Yes No
NH5 Concepts of World Hist & Geo I-B C1 No No Yes No
HC9 District of Columbia Hist & Gov No No Yes No
HH1 Honors U.S. History No No Yes No
HH4 Honors World History No No Yes No
X24 IB 20th Century World History HL No No Yes No
X23 IB History of the Americas HL No No Yes No
HC8 Principles of US Government No No Yes No
HX5 U.S. History/Geo Pt A No No Yes No
HX6 U.S. History/Geo Pt B No No Yes No
HC7 US Hist & Geo :Gilded Age to Present No No Yes No
H23 World Geography No No Yes No
HC5 World Hist & Geo I: Middle Ages No No Yes No
HC6 World Hist & Geo II: Modern World No No Yes No
HX1 World Hist & Geog I - Part A No No Yes No
HX3 World History & Geo II - PART A No No Yes No
HX4 World History & Geography II - PART B No No Yes No
HX2 World History/Geo I - PART B No No Yes No
S17 Anatomy & Physiology No No No Yes
S23 AP Biology No No No Yes
S33 AP Chemistry No No No Yes
S05 AP Environmental Science No No No Yes
S72 AP Physics 1: Algebra-Based No No No Yes
S73 AP Physics 2: Algebra Based No No No Yes
S42 AP Physics B No No No Yes
S71 AP Physics C: Electricity & Magnetism No No No Yes
S70 AP Physics C: Mechanics No No No Yes
S32 Biochemistry No No No Yes
S21 Biology No No No Yes

50
1200 First Street, NE | Washington, DC 20002 | T 202.442.5885 | www.dcps.dc.gov
Course Code
Title Core
English Core Math
Core Social Studies
Core Science
SB3 Biology I-A 0.5 No No No Yes
SB4 Biology I-B 0.5 No No No Yes
SB2 Biology I-B 1.0 No No No Yes
SZ1 Biotechnology I No No No Yes
SZ2 Biotechnology II No No No Yes
SZ3 Biotechnology III No No No Yes
S31 Chemistry No No No Yes
SC2 Chemistry IB - 1.0 No No No Yes
S94 Chemistry I-A 0.5 No No No Yes
S95 Chemistry I-B 0.5 No No No Yes
YGG College Biology No No No Yes
YGH College Biology-SciMajors No No No Yes
YGJ College Chemistry No No No Yes
YGW College Engineering No No No Yes
YGR College Lab Science No No No Yes
YGK College Physics No No No Yes
SP2 Conc of Phys Sci B 1.0 No No No Yes
S57 Conc of Physical Science No No No Yes
NS5 Concepts of Biology CE No No No Yes
NS6 Concepts of Earth Science CE No No No Yes
NS4 Concepts of Environmental Science CE No No No Yes
NS7 Concepts of Physical Science CE No No No Yes
S45 Earth Science No No No Yes
SR1 Earth Science Pt A 0.5 No No No Yes
SR2 Earth Science Pt B 0.5 No No No Yes
S20 Ecology No No No Yes
SE2 Environ Sci I-B 1.0 No No No Yes
S03 Environmental Science No No No Yes
S68 Forensic Science No No No Yes
ST4 Hon Aerospace Enginrg No No No Yes
S64 Hon Biology No No No Yes
SB7 Hon Biology I-A 0.5 No No No Yes
SB8 Hon Biology I-B 0.5 No No No Yes
OH6 HON BIOMED SCI CAPSTONE (LEVEL IV) No No No Yes
ST5 Hon Biotech Engineering No No No Yes
ST6 Hon Civ Eng & Architecture No No No Yes
ST7 Hon Cmp Integr Mfg No No No Yes
ST3 Hon Digital Electronics No No No Yes
ST8 HON ENG DESIGN & DEVT No No No Yes
S04 Hon Environmental Science No No No Yes

51
1200 First Street, NE | Washington, DC 20002 | T 202.442.5885 | www.dcps.dc.gov
Course Code
Title Core
English Core Math
Core Social Studies
Core Science
OH4 HON HUMAN BODY SYSTEMS (LEVEL II) No No No Yes
OH5 HON MEDICAL INTERVENTIONS (LEVEL III) No No No Yes
S49 Hon Physics B No No No Yes
S58 Hon Physics C No No No Yes
OH3 HON PRINS OF BIOMED SCIENCES (LEVEL I) No No No Yes
S36 Honors Chemistry No No No Yes
ST1 HONORS INTRO TO ENGINEERING DESIGN (LEVEL I)
No No No Yes
ST2 HONORS PRINCIPLES OF ENGINEERING (LEVEL II)
No No No Yes
X29 IB Biology HL I No No No Yes
X30 IB Biology HL II No No No Yes
X27 IB Biology SL I No No No Yes
X28 IB Biology SL II No No No Yes
X40 IB Sports Science No No No Yes
X75 IB Sports Science Part II No No No Yes
S16 Intro Anatomy & Physiology No No No Yes
S47 Intro to Physical Oceanography No No No Yes
SZ6 Issues in Biotechnology No No No Yes
S56 Lab Techniques No No No Yes
S46 Marine Science No No No Yes
S22 Microbiology No No No Yes
S35 Organic Chemistry No No No Yes
S48 Physical Oceanography No No No Yes
X37 Physics High Level Part I No No No Yes
S41 Physics I No No No Yes
S96 Physics Part A 0.5 No No No Yes
S97 Physics Part B 0.5 No No No Yes
S19 Prins of Botany No No No Yes
S40 Prins of Technology I No No No Yes
S06 Prins of Zoology No No No Yes
TR3 Robotics Technology I No No No Yes
SBA Spanish Language Biology I No No No Yes
Y67 Transfd General Science Course No No No Yes
Notes:
For any calculations completed during semester two in a given school year, Algebra course M23 and Geometry course M33 will be considered a core class. M23 and M33 will not be considered core courses for year-end calculations as these courses do not count toward graduation.
If necessary, central office will work with schools to adjust the business rules to fit special circumstances

52
1200 First Street, NE | Washington, DC 20002 | T 202.442.5885 | www.dcps.dc.gov
Middle School On-Track
Example Scenarios:
Student Grade Math English Social Studies Science Non-Core Courses
Status
Student A 7 Passing Passing Passing Passing Passing Green
Student B 8 Passing Passing Passing Passing Not passing Yellow
Student C 7 Passing Not passing Passing Passing Passing Yellow
Student D 6 Not passing Passing Not passing Passing Passing Red
Student E 7 Passing Passing Passing Passing 6th grade science
Passing Orange
Student F 7 Not passing 8th grade math
Passing Passing Passing Passing Purple
Student G 6 Passing Missing mark Passing Passing Passing Missing Marks
Student H 7 Not passing 7th grade math;
Passing 8th grade math
Passing Passing Passing Passing Green
Student I 6 Missing mark Passing Not enrolled Passing Passing Orange
Core Courses Table: This table displays the courses incorporated under each core subject area based on
students’ grade levels, SPED statuses, and ELL statuses.
Grade Group Core Math Core English Core Social Studies Core Science
6th Gen Ed M06 – CC 6th Grade Math MMV – Accelerated 6th Grade M07 – CC 7th Grade Math MMW – Accelerated 7th Grade M08 – CC 8th Grade Math MMX – Algebra I MS MMY – Geometry MS
EM6 – Humanities 6 EE2 – Lang Arts 6
HC2 – World Geography and Cultures
SS2 – Science 6
SPED NM6 – Math FT 6 NM7 – Math FT 7 NM8 – Math FT 8
NE1 – ELA FT 6 NH1 – Concepts of World History & Geo I-1 FT
NS1 – Science FT 6
ELL F14 – ESL Mathematics I F15 – ESL Mathematics II F16 – ESL Mathematics MS
F08 – Beginning ESL MS F10 – Intermed ESL MS F13 – Adv ESL MS
F20 – ESL Social Studies I F21 – ESL Social Studies II F22 – ESL SOCIAL STUDIES (MS)
F17 – ESL Science I F18 – ESL Science II F19 – ESL Science MS
7th Gen Ed M07 – CC 7th Grade Math MMW – Accelerated 7th Grade M08 – CC 8th Grade Math MMX – Algebra I MS MMY – Geometry MS
E01 – English 7 E48 – Humanities 7
HC3 – World History and Geography I: Ancient World
SS3 – Science 7
SPED NM7 – Math FT 7 NM8 – Math FT 8
NE2 – ELA FT 7 NH2 – Concepts of World History & Geo I-B FT
NS2 – Science FT 7
ELL F14 – ESL Mathematics I F15 – ESL Mathematics II F16 – ESL Mathematics MS
F08 – Beginning ESL MS F10 – Intermed ESL MS F13 – Adv ESL MS
F20 – ESL Social Studies I F21 – ESL Social Studies II F22 – ESL SOCIAL STUDIES (MS)
F17 – ESL Science I F18 – ESL Science II F19 – ESL Science MS

53
1200 First Street, NE | Washington, DC 20002 | T 202.442.5885 | www.dcps.dc.gov
Grade Group Core Math Core English Core Social Studies Core Science
8th Gen Ed M08 – CC 8th Grade Math MMX – Algebra I MS MMY – Geometry MS
E02 – English 8 E49 – Humanities 8
HC4 – US History and Geography: Growth & Conflict
SS4 – Science 8
SPED NM8 – Math FT 8 NE3 – ELA FT 8 NH3 – Concepts of United States His/Geo 8 FT
NS3 – Science FT 8
ELL F14 – ESL Mathematics I F15 – ESL Mathematics II F16 – ESL Mathematics MS
F08 – Beginning ESL MS F10 – Intermed ESL MS F13 – Adv ESL MS
F20 – ESL Social Studies I F21 – ESL Social Studies II F22 – ESL SOCIAL STUDIES (MS)
F17 – ESL Science I F18 – ESL Science II F19 – ESL Science MS
NOTE: Course codes L6L (6th Grade), L6S (7th Grade), and L6H (8th Grade) also count for general
education social studies at Oyster-Adams; Course codes EM6 (6th Grade), E48 (7th Grade), and E49 (8th
Grade) count as general education social studies courses but not general education English courses at
Capitol Hill Montessori.
High school course codes M21, M22, M23, M24, MA1, MA2, M31, M32, M33, M34, MG1, MG2, and
M45 count as higher grade-level math courses for all middle school students. The table above only
contains middle school course codes.
Course codes AA5, AA6, AA7, LUN, AVD, REC, AA4, AA3, Y15, and Summer School courses are excluded
from all calculations.

54
1200 First Street, NE | Washington, DC 20002 | T 202.442.5885 | www.dcps.dc.gov
EDL Proficiency Bands
Grade TOY Below
Benchmark Approaching Benchmark
Benchmark Above
Benchmark
Kindergarten
BOY
MOY <A A 1 2 and above
EOY 1 or below 2 3 4 and above
Grade 1
BOY 1 or below 2 3 4 and above
MOY 6 or below 8 10 12 and above
EOY 10 or below 12-14 16 18 and above
Grade 2
BOY 10 or below 12-14 16 18 and above
MOY 14 or below 16-18 20 24 and above
EOY 18 or below 20-24 28 30 and above
Grade 3
BOY 18 or below 20-24 28 30 and above
MOY 24 or below 28-30 34 38 and above
EOY 28 or below 30-34 38 40 and above
Grade 4
BOY 28 or below 30-34 38 40 and above
MOY 28 or below 30-34 38-40 50 and above
EOY 30 or below 34-38 40 50 and above
Grade 5
BOY 30 or below 34-38 40 50 and above
MOY 34 or below 38 40-50 60 and above
EOY 34 or below 38-40 50 60 and above

55
1200 First Street, NE | Washington, DC 20002 | T 202.442.5885 | www.dcps.dc.gov
Student Satisfaction Survey
Below are the questions asked in the Student Satisfaction Survey with response options ranging from
Strongly Disagree to Strongly Agree:
Student Satisfaction Survey Questions
I would recommend my school to other students.
My family is welcome at my school.
We have enough teaching materials (like books, photocopies, and calculators) for all.
My school is clean and well maintained.
I feel safe at my school.
Adults maintain control of my school.
My school offers good after-school options.
I like my school.