School Teachers’ - assets.publishing.service.gov.uk · OME Office of Manpower Economics ... TLR...
73
School Teachers’ Review Body Twenty-Fourth Report – 2014 Chair: Dame Patricia Hodgson, DBE Cm 8886 School Teachers’ Review Body School Teachers’ Review Body – Twenty-Fourth Report – 2014 40471_00_School Teachers Cover.indd 1 06/06/2014 14:18
Transcript of School Teachers’ - assets.publishing.service.gov.uk · OME Office of Manpower Economics ... TLR...
Twenty-Sixth Report 2012
Chair: Jerry Cope
School Teachers’ Review Body
Twenty-Fourth Report – 2014
Chair: Dame Patricia Hodgson, DBE
Cm 8886
School Teachers’ Review Body
Scho
ol Teachers’ R
eview B
od
y – Twenty-F
ourth R
epo
rt – 2014
40471_00_School Teachers Cover.indd 1 06/06/2014 14:18
School Teachers’ Review Body
Twenty-Fourth Report – 2014
Chair: Dame Patricia Hodgson, DBE
Presented to Parliament by the Prime Minister and the Secretary of State for Education
by Command of Her Majesty
June 2014
Cm 8886
40471_00_all.indb 1 06/06/2014 14:22

© Crown copyright 2014
You may re-use this information (excluding logos) free of charge in any format or medium, under the terms of the Open Government Licence v.2. To view this licence visit www.nationalarchives.gov.uk/doc/open-government-licence/version/2/ or email [email protected]
Where third party material has been identified, permission from the respective copyright holder must be sought.
Any enquiries regarding this publication should be sent to us at Office of Manpower Economics, Victoria House, Southampton Row, London WC1B 4AD www.gov.uk/government/organisations/office-of-manpower-economics
Print ISBN 9781474105132Web ISBN 9781474105149
Printed in the UK by the Williams Lea Group on behalf of the Controller of Her Majesty’s Stationery Office
ID 23051401 40471 06/14
Printed on paper containing 75% recycled fibre content minimum
40471_00_all.indb 2 06/06/2014 14:22
iii
TERMS AND ABBREVIATIONS
Consultees Organisations which made representations and provided evidence to the STRB
ASCL Association of School and College Leaders
ATL Association of Teachers and Lecturers
DfE/the Department Department for Education
NAHT National Association of Head Teachers
NASUWT National Association of Schoolmasters Union of
Women Teachers
NEOST National Employers’ Organisation for School Teachers
NGA National Governors’ Association
NUT National Union of Teachers
Secretary of State Secretary of State for Education
UCAC Undeb Cenedlaethol Athrawon Cymru
Voice formerly the Professional Association of Teachers
Welsh Government
Other
AGR Association of Graduate Recruiters
ASHE Annual Survey of Hours and Earnings
BME Black and Minority Ethnic groups
CPI/CPIH Consumer Price Index
DTR Database of Teacher Records
Estyn Education and training inspectorate for Wales
GCSE General Certificate of Secondary Education
GDP Gross Domestic Product
HE Higher Education
HESA Higher Education Statistics Agency
HMT HM Treasury
IDS Incomes Data Services
IFS Institute for Fiscal Studies
IPSA Independent Parliamentary Standards Authority
ITT Initial Teacher Training
LA Local Authority
MFG Minimum Funding Guarantee
NCTL/National College National College for Teaching and Leadership
NQT Newly Qualified Teacher
OBR Office for Budgetary Responsibility
Ofsted Office for Standards in Education, Children’s Services and Skills
OME Office of Manpower Economics
ONS Office for National Statistics
PGCE Postgraduate Certificate in Education
PTR/PAR Pupil to teacher ratio/Pupil to adult ratio
QTS Qualified Teacher Status
40471_00_all.indb 3 06/06/2014 14:22

iv
RPI/RPIJ Retail Price Index
SCITT School-Centred Initial Teacher Training
SEN Special Educational Needs
STPCD/the Document DfE (2013) School Teachers’ Pay and Conditions Document and Guidance on School Teachers’ Pay and Conditions, TSO
STRB/Review Body School Teachers’ Review Body
SWC School Workforce Census
TLR Teaching and Learning Responsibility
TSM Teacher Supply Model
40471_00_all.indb 4 06/06/2014 14:22
v
Contents
Page
The School Teachers’ Review Body . . . . . . . . . . . . . . . . . . . . . . . . . . vii
Executive Summary . . . . . . . . . . . . . . . . . . . . . . . . . . . . . . . . . . . . . . ix
Chapter 1. Introduction and background to the remit . . . . . . . . . . . . . . . . . 1
2. Overview of the evidence . . . . . . . . . . . . . . . . . . . . . . . . . . . . . . 5
3. The teacher labour market: our analysis and commentary. . . . . . 15
4. Teachers’ pay: our conclusions and recommendations . . . . . . . . 35
Appendix A. Remit and directions from the Secretary of State . . . . . . . . . . . . 45
B. Letter from the Chief Secretary to the Treasury . . . . . . . . . . . . . . 47
C. Structure of the teachers’ pay system . . . . . . . . . . . . . . . . . . . . . 49
D. Conduct of the review . . . . . . . . . . . . . . . . . . . . . . . . . . . . . . . . 51
E. Current and recommended pay levels . . . . . . . . . . . . . . . . . . . . . 55
40471_00_all.indb 5 06/06/2014 14:22

vi
40471_00_all.indb 6 06/06/2014 14:22
vii
THE SCHOOL TEACHERS’ REVIEW BODYOur role
The School Teachers’ Review Body (STRB) was established in 1991 as an independent body to examine and report on such matters relating to the statutory conditions of employment of school teachers in England and Wales as may from time to time be referred to it by the Secretary of State. STRB reports to the Prime Minister and the Secretary of State. The legal foundation for the function and work of STRB is Part Eight of the Education Act 2002. The secretariat for STRB is provided by the Office of Manpower Economics (OME).
The members of STRB are:
Dame Patricia Hodgson, DBE (Chair)
Peter Batley
Jonathan Crossley-Holland
Dan Flint
Debbie Meech
Jill Pullen
Mike Redhouse
Dr Patricia Rice
40471_00_all.indb 7 06/06/2014 14:22

viii
40471_00_all.indb 8 06/06/2014 14:22
ix
Executive Summary
The Secretary of State asked us to consider how to apply to teachers’ pay the Government’s “average 1%” pay uplift policy which applies across the public sector.
The context for our work has changed substantially since we last considered a pay uplift. Following implementation of our 21st Report, schools will, for the first time in September 2014, make individual progression decisions, based on performance against objectives, for all teachers. At the same time, reforms to leadership pay and allowances following our 23rd Report will enhance school autonomy on pay. Taken together, the recent reforms provide for a broad national pay framework, establishing minima and maxima for teacher and leadership pay ranges and the main responsibility allowances. This framework defines the areas within which schools are free to make their own decisions, such as setting recruitment and retention allowances, and making individual pay decisions. Accordingly schools now have considerable autonomy to use pay to attract, reward and promote high calibre teachers and respond to local circumstances.
On the economic and labour market context, the Department told us there was no additional funding for schools to cover the 2014 pay award. It suggested the teacher labour market remained strong, with low vacancy rates and a strong supply of high quality graduates into teaching.
Our own analysis showed that, whilst some indicators suggest recruitment and retention has remained stable in a generally subdued labour market, there are some emerging areas of concern. These include competitive pressures in many areas of the country, where the gap between pay of teachers and other graduates is widening in respect of both starting pay and profession-wide pay. As the wider economy recovers, demand from other sectors is likely to accentuate recruitment and retention pressures, including existing shortages in sciences and maths specialists. Within the sector, the school landscape is also evolving, with growing numbers of academies and other structural changes which impact on the labour market for teachers and leaders.
In the short term, it will be important for schools to make full use of the pay flexibilities now available to respond to recruitment and retention pressures, setting higher starting salaries where justified and increasing reward for the most effective performers to motivate and retain them. However, emerging labour market pressures will coincide with a significant impending increase in demand for teachers, as increased numbers of pupils flow through the school system. Together these will accentuate the importance of ensuring the profession can attract and retain sufficient high calibre graduates. This challenging context points to a need for a fuller review of the teachers’ pay framework as soon as Government priorities permit to ensure the profession remains attractive. We would welcome a remit to undertake such a review.
Uplift to the national pay framework for September 2014
In considering a pay uplift for September 2014, we make a clear distinction between our role in reviewing pay levels in the national framework (as it stands following recent reforms) and decisions on how to apply any uplift to individual salaries in payment, which should in general be taken by schools. However, we recognise this year is a transitional one, as schools take the first decisions on performance-related progression and gain confidence in operating more autonomously. To help schools we therefore set out first our proposals on uplift to the framework, and then consider the implications for salaries and allowances in payment.
40471_00_all.indb 9 06/06/2014 14:22
x
The Secretary of State proposed that the statutory minima and maxima of classroom teachers’ pay should be uprated by 1% in 2014/15. He noted that the discretionary reference points were useful as a transitional measure but said that adding 1% to the reference points would undermine schools’ autonomy. Consultees argued strongly that the pay uplift should be separate from performance, and considered that an increase should be applied across the board to all pay ranges, allowances and salaries in payment.
The majority of the teacher unions sought a pay award higher than 1%, arguing this was necessary to ensure future teacher supply and that the Government should make additional funding available. They noted that recruitment and retention would become more challenging as the economy recovered; and raised concerns about recruitment to initial teacher training and on teachers’ motivation and morale. However, the employers told us that a 1% award would itself be a cost pressure and anything higher would present some schools with very significant affordability challenges.
We set out above our assessment of the recruitment and retention pressures. It is clear that many schools face significant competitive pressures, but in parts of the country teachers’ pay remains attractive for good graduates. Given the considerable variation in labour market challenges, both between regions and frequently between localities; the scope schools now have to respond to local issues using pay flexibility; and affordability pressures on schools, we recommend, on balance, a 1% uplift to the minima and maxima of all the pay ranges in the national pay framework, including the national TLR and SEN ranges.
Application of the national pay framework uplift to salaries and allowances in payment
Most teachers currently on the minima will receive a progression increase this September of more than 1%, based on performance in 2013/14. Since all teachers must be paid between the minimum and the maximum of the relevant pay range the proposed 1% uplift will apply to all teachers remaining on the minima of any pay range, including new recruits.
In principle, we consider any pay award, including for those on the maxima, should take account of performance. However, in this initial year the focus of attention in schools will have been on planning for differentiated progression decisions for those below the maxima. Recognising the need to manage transition, we recommend uplifting salaries of those on the maxima by 1% this September. Consistent with the principle of school autonomy, we recommend that schools’ pay policies for 2014/15 should make clear how any future pay decisions for those on the maximum will take account of performance in applying any uplift to the national framework.
In our 21st Report we recommended that the existing points on the main pay scale become discretionary reference points, as a transitional measure to support schools moving to performance-based progression. We heard from consultees that many schools are using these reference points, whilst others have developed their own arrangements in their pay policies. Although the discretionary reference points are not part of the national pay framework we recognise that it would be logical to uplift them by 1% to maintain their relative positions between the new minima and maxima. We recommend uplifting the reference points in DfE advice by 1% for pay decisions in September 2014.
Where schools have adopted local arrangements for progression, without recourse to these discretionary reference points, we are not in a position to make any recommendation on applying an uplift. We therefore recommend that schools who have not adopted the reference points set out in DfE advice consider how to apply the 1% uplift to the national pay framework to their local pay policy.
40471_00_all.indb 10 06/06/2014 14:22
xi
We further recommend that reference points be removed from the national advice to schools to signal clearly that schools should, from September 2015, make performance-related progression decisions in accordance with local arrangements. We also recommend that the Department should provide advice on the scope for the most able teachers to progress rapidly through the main and upper pay ranges, where justified by consistently excellent performance.
For those teachers and school leaders on individual pay ranges1, it will be for schools to determine how the 1% uplift to the national framework should be applied, ensuring they remain within the framework.
On allowances, we recommend a 1% uplift to the minima and maxima of TLR and SEN allowances, as set out in the national framework. This means any payment set at the minimum should automatically increase by 1% to remain within the revalorised range. We recommend school discretion on individual payments above the minimum but note they may wish to review the levels and relativities of their TLR and SEN payments following our recommended 1% uplift to the national framework. We make no recommendations on changes to other allowances, where the values are set locally without reference to a national framework.
We recognise that implementation of these recommendations, if accepted, will be challenging for some schools, including the need to review pay policies in time for the 2014/15 appraisal year. More generally, schools will be at different stages of gaining confidence in using pay flexibilities. We underline the need for schools to be supported through the provision of benchmarking data and advice from the Department on progression expectations. Against this background, we re-iterate the need for governing bodies to secure good quality, independent HR advice and maintain effective oversight of performance appraisal and pay decisions.
In conclusion, our recommendations this year are intended to support schools in making the transition to greater autonomy on pay. In future, we expect our role to evolve to take account of school autonomy but anticipate a continuing need, guided by individual remits from the Secretary of State, to review the national pay framework to maintain the competitiveness of pay for the profession, to ensure the right incentives for performance improvement and to attract and retain high calibre teachers and talented leaders.
1 Leading practitioner and leadership pay ranges.
40471_00_all.indb 11 06/06/2014 14:22

xii
40471_00_all.indb 12 06/06/2014 14:22

1
CHAPTER 1
Introduction and background to the remit
Introduction
1.1 Our role, set out in the Education Act 2002, is to consider and report to the Prime Minister and the Secretary of State on matters referred to us on teachers’ pay and conditions. In his remit letter of 24th October 2013, the Secretary of State asked us to consider:
• What adjustments should be made to the salary and allowance ranges and scales for classroom teachers, unqualified teachers and school leaders to reflect the 1 per cent pay award for public sector workers; and
• What adjustments should be made to salaries and allowances in payment.
1.2 The Secretary of State’s remit letter, reproduced in Appendix A, asked us to report on these matters by 16th May 2014. It also asked us to take account of the letter of 23rd July 2013, from the Chief Secretary to the Treasury, to all Pay Review Body Chairs (reproduced in Appendix B) which set out the Government’s public sector pay policy. In this chapter, we describe the background to our remit and outline the structure of this report.
Background and context
1.3 We undertook this remit against the backdrop of the Government’s continuing policy on pay restraint and pension reform for workers across the public sector. Following the two-year pay freeze from September 2011 to August 2013, the Government accepted our recommendations for an award of 1% across all pay scales and allowances for teachers from September 2013. This was applied to the pay structure prior to implementation of our 21st and 23rd Reports, which recommended increased pay flexibilities for schools, as set out below.
Recent reforms
1.4 The reforms flowing from our 21st and 23rd Report recommendations significantly alter the context for our deliberations on this remit. Together they enable increased autonomy for schools to: attract, reward and promote the best talent; respond to local circumstances within a broad national framework; and set appropriate reward for teachers and school leaders allied to accountability. The changes will enable maintained schools to compete effectively in a changing labour market in which increasing numbers of academies and free schools have substantial autonomy on pay and conditions. We set out in Chapter 4 the national pay framework resulting from the reforms, and the implications for our role in respect of it.
1.5 The central recommendation of our 21st Report was for greater flexibility on pay at local level, including differentiated pay progression linked to appraisal. This was implemented from September 2013, requiring schools to set new pay policies for the 2013/14 appraisal year as a basis for first decisions in September 2014. Our recommendations also provided greater scope for local flexibility in the use of allowances (including fixed-term responsibility allowances and recruitment and retention incentives) and a new leading practitioner pay range to encourage some of the very best teachers to stay in the classroom. These changes have been in place since September 2013.
40471_00_all.indb 1 06/06/2014 14:22
2
1.6 The main recommendations in our recent 23rd Report, now accepted by the Secretary of State, included:
• providing a clear and usable framework for setting the pay of school leaders, enabling governing bodies to match pay to accountabilities and the local needs of the school. This will help them respond effectively in a rapidly changing sector and offer appropriate reward to high quality leaders who are so crucial to raising standards;
• greater freedom in setting the level of Teaching and Learning Responsibility (TLR) payments; whilst retaining the main allowances used by schools and the existing safeguarding provisions;
• retaining the core statutory protections on teachers’ working hours and time for planning, preparation and assessment whilst removing unnecessary detailed guidance on non-pay conditions.
1.7 These changes will be reflected in an updated School Teachers’ Pay and Conditions Document (STPCD) for September 2014.
Transition
1.8 Schools are now making the transition to using these significant new pay flexibilities, which will take time and careful management. Having set out in September 2013 pay policies stating how pay progression will be determined, based on performance in the 2013/14 academic year, schools will make the first such decisions this autumn. Alongside this, all schools face the challenge of preparing for curriculum and assessment reforms.
1.9 Although the main changes flowing from our 23rd Report take effect from September 2014, they do not immediately require schools to review pay of the leadership team or allowances, unless other changes such as restructuring suggest it. However, leadership pay points will be removed from the STPCD, consistent with the approach taken for classroom teachers in 2013, so schools will need to set out in pay policies in September 2014 how differentiated pay progression for school leaders will apply in the 2014/15 appraisal year.
1.10 We are mindful it will take time for these reforms to become fully embedded and will require significant cultural change in the schools sector. We comment on transitional considerations relevant to our current pay uplift in Chapter 4.
Conduct of our review
1.11 We considered and analysed written and oral evidence from the Secretary of State and from our statutory consultees, in line with our obligations under the Education Act 2002. We also provided consultees with an opportunity to comment on others’ submissions and received written evidence from non-statutory consultees.
1.12 We held oral representation sessions with teacher and head teacher unions to explore their position on various topics and their views on others’ evidence. We also heard oral representations from the Department, including the Secretary of State; the Welsh Government; employer representatives (National Employer Organisation for School Teachers (NEOST)) and governor associations. We have set out in the relevant chapters key points made by consultees in written and oral representations. Where consultees have published full submissions on their websites, we have provided the links to the websites in Appendix D.
40471_00_all.indb 2 06/06/2014 14:22

3
1.13 We were grateful to our consultees for their detailed and timely submissions and for their contributions at oral evidence sessions, which have enabled us to consider the issues thoroughly and examine critically the available evidence before making our recommendations.
1.14 More generally, we considered evidence of trends in the wider labour market for graduates, and comparisons between teacher earnings and those of other graduate professions, to ensure we had a full picture of the climate for recruitment and retention to the profession. This evidence is set out fully in Chapter 3, along with a range of data on earnings and pay settlements across the market as a whole. We also sought evidence on wider pay practice, including in academies, which play an increasingly significant role in the labour market.
1.15 We are also grateful to those schools and local authorities we have visited over the last few years. As we have noted in previous reports, such visits provide practical insights and give a greater depth to our understanding of the issues facing teachers and school leaders in their working lives, as well as the skills and knowledge they bring to their roles.
Structure of this report
1.16 Our report sets out the evidence base and rationale for our decisions. The structure is as follows:
• Chapter 2 sets out the representations and evidence from the Department and statutory consultees.
• Chapter 3 provides our analysis and commentary on the teacher labour market.
• Chapter 4 sets out the changing context for our regular pay reviews following implementation of recommendations of our recent reports, and our recommendations on this remit. We also look ahead briefly to the prospects for a review of the national framework when conditions allow.
40471_00_all.indb 3 06/06/2014 14:22

4
40471_00_all.indb 4 06/06/2014 14:22
5
CHAPTER 2
Overview of the evidence
2.1 In this chapter we summarise the main points made to us by the Department and by consultees in their evidence on a pay award for 2014/15.
The Department’s views and evidence
Economic context
The Government’s economic evidence
2.2 The Department’s submission set out the Government’s belief that its long term economic plan had ensured economic stability and provided the foundations for the current recovery following the most damaging financial crisis in generations and the largest deficit since the Second World War. It attributed the deficit to the financial crisis and unsustainable pre-crisis increases in public spending. It said the Government was restoring the public finances to a sustainable path and the deficit as a percentage of GDP was forecast to have halved by 2014/15.
2.3 It noted the UK economy had gained momentum through 2013 and GDP growth had exceeded forecasts, with early signs that GDP growth was balanced across the main sectors of the economy. The Office for Budgetary Responsibility’s (OBR) Autumn Statement 2013 forecast had revised UK GDP growth in 2013 from 0.6% to 1.4% and from 1.8% to 2.4% in 2014.
2.4 The Department said the factors which weighed on UK growth between 2010 and 2012 were abating. External risks remained, reinforcing the case for stability in the Government’s long term economic plan. It believed clear and credible consolidation plans remained essential for reducing the risk of a loss of market confidence in the UK, arguing strongly in favour of maintaining a credible path of deficit reduction.
Inflation
2.5 The Department noted inflation had fallen significantly since its peak in September 2011 when the Consumer Price Index (CPI) reached 5.2%. Inflation over the third quarter of 2013 was 2.7% but forecast by the Bank of England to remain around the 2.0% target from Q4 2013 onwards. The OBR expected the rate of inflation to slow between 2013 and 2016, returning to the 2.0% target in the second half of 2016.
Labour market
2.6 The Department noted an increase in employment to its highest ever level at 29.95 million. The OBR expected employment to continue to rise over the forecast period, but at a slower pace than in 2012. The unemployment rate had fallen 0.2 percentage points in the third quarter of 2013 and OBR expected it to continue to fall, reaching 7.0% by the second quarter of 2015.
2.7 The Department observed however that wage growth remained weak with pay (excluding bonuses) in the third quarter of 2013 increasing by only 0.8% compared to the same period in 2012. In the third quarter of 2013 the CPI increased by 2.7% on the year, meaning that real pay growth continued to be negative over this period. Although
40471_00_all.indb 5 06/06/2014 14:22

6
average total private sector pay had recovered somewhat from its decline in 2009 it remained relatively weak. Public sector (excluding financial services1) average regular pay growth had weakened since the end of 2012.
2.8 The Department commented that it was important to consider the overall value of the public sector reward package, including pensions. It said public service pensions remained among the best available and would provide guaranteed, index-linked benefits that were protected against inflation. It noted that new public service pension schemes would be introduced in April 2015. It also noted wider changes that have already been implemented, including progressive increases in member contributions starting in April 2012, with protection from the impact of these changes for the lowest paid. Teachers earning less than £26,000 would not see increases of more than 1.5 percentage points by 2014/15. It said the Government was clear that any changes to public service pensions, including increased contributions, did not justify upward pressure on pay.
Affordability in schools
2.9 The Department set out its position on affordability in schools, noting that investment in education was a Government priority for driving long-term economic growth. It said the overall schools budget continued to be protected at flat cash per pupil (before the addition of the Pupil Premium) until the end of the spending review period (2014/15), although individual school budgets would change due to changes in local funding formulae. It had put in a place a Minimum Funding Guarantee (MFG) to ensure that most schools would not see a reduction of more than 1.5% per pupil (before addition of the Pupil Premium) compared with the previous year. It said it had already made significant changes to local school funding arrangements to ensure schools were funded on a simpler and more consistent basis, with more money based on the needs of pupils.
2.10 The Department said a further flat 1% pay uplift to all salaries and relevant allowances would increase the paybill2 by about £260m in 2014/15, a combination of the pay award (£220m) and pay drift (£40m). This cost would need to come from existing school budgets. It said that depending on the circumstances of an individual school, a differential award could disproportionately affect the staffing budget, potentially creating a risk to its financial security.
2.11 The Welsh Government had budgeted for gross expenditure per pupil to increase by 1.3%. The Provisional Local Government Settlement for 2014/15 published in October 2013 set out core revenue funding for individual authorities. This included an element of the additional funding arising from the First Minister’s commitment to protect schools’ spending at 1% more than the uplift to the overall Welsh budget. The Department said that despite an overall reduction in funding it was expected that the amount relating to schools in Wales would increase slightly from 2013/14, allowing for changes in pupil numbers.
Teacher labour market
2.12 The Department emphasised the importance of high quality teachers and school leaders. It said the teacher labour market remained strong, with low vacancies and an increasing proportion of graduates with a 2:1 degree or higher entering the profession. It said the recommendations from the STRB’s 21st Report gave schools the flexibility to establish reward packages that would attract and retain the best teachers.
1 The financial services which are excluded from the figures are the nationalised banks which are now classified as part of the public sector.
2 This figure includes teachers in academies which are not bound by STPCD.
40471_00_all.indb 6 06/06/2014 14:22
7
2.13 The Department commented that schools were now able to recruit and train graduates themselves, through the School Direct programme and School-Centred Initial Teacher Training (SCITT) providers, as well as the Teach First programme. The Department was providing additional support to enable Teach First to expand to 2,000 places annually by 2015/16. It said these changes to the routes into teaching gave schools an even greater degree of influence over the teacher labour market.
2.14 The Department provided information on the make-up of the teacher workforce and on classroom teachers’ salaries. Its analysis showed that in 2012/13, the median pay of classroom teachers was lower than that of private sector graduate professionals3 in five of the nine regions.
2.15 The Department said vacancy rates in England had remained fairly low and stable in the past three years. It noted that overall pupil numbers were projected to continue rising, with pupil numbers in maintained nursery and state-funded primary schools increasing by 8% between 2013 and 2017, which would have implications for future teacher demand. It said that in Wales, the teacher vacancy rate remained low, with an average of 25 applications for each primary school vacancy and 12 for each secondary school vacancy. Primary pupil numbers in Wales were projected to rise by 34,000 between 2013 and 2022, with secondary numbers falling overall between 2013 and 2017/18 but returning to the current level by 2022/23.
Applying the 2014 pay award
2.16 The Department’s proposal was as set out in its response to our 21st Report: “the statutory minima and maxima for classroom teachers’ pay should be uprated by 1% in each year 2013-14 and 2014-15”. It also said: “Schools are free to determine the extent of pay uplifts to teachers within the minima and maxima, and will be able to provide an uplift of 1%, in line with any overall uplift in pay in the public sector, if they so choose”. The Department asked us to consider how the 1% award should apply across the statutory provisions for leadership pay and allowances in the light of the Secretary of State’s response to our 23rd Report. At oral evidence the Secretary of State confirmed his view that a 1% award should apply to the minima and the maxima of all the pay ranges, including those for unqualified teachers and school leaders and that managers, who were accountable for teachers’ performance, should have discretion to make awards within the pay ranges. He noted that reference points were useful as a transitional measure but there would come a point when they should be removed. In his view, adding 1% to the reference points would undermine schools’ autonomy.
Consultees’ views and evidence
Economic context
2.17 Most of our statutory consultees pointed out the broader context for the consideration of this remit, referring to the two-year pay freeze followed by the 1% award in September 2013, which they said were imposed without reference to prevailing market pressures or pay trends elsewhere. They set out the impact of pay restraint on teachers and commented on the decreasing value of the teachers’ reward package, which had been eroded by inflation and pension reform. They also noted the increased pension contributions now paid by teachers, with a further increase to come from April 2014.
3 Defined by DfE as those working in the ‘professional occupations’ or ‘associate professional and technical occupations’ groups of the Standard Occupational Classification. Our analysis in Chapter 3 compares teachers’ earnings with those in the ‘professional occupations’ group alone.
40471_00_all.indb 7 06/06/2014 14:22
8
2.18 Some consultees re-iterated points made in their representations for the 22nd Report about the Government’s public sector pay policy and the constraints placed upon the Review Body. ASCL did not accept that a 1% cap was the most appropriate way to address the impact of the pay freeze and subsequent erosion of teachers’ pay. NASUWT argued that investment in education was a key factor in economic recovery and sustainability and said the current remit was the final opportunity for the Review Body to demonstrate its independence. Some consultees pointed out that the Independent Parliamentary Standards Authority (IPSA) had recommended an 11% pay increase for MPs and called upon STRB to assert its own independence in reaching a decision on teachers’ pay. NUT commented on political pressure on the STRB and suggested the Government’s public sector pay policy was flawed. Voice was concerned that the remit letter ‘reads as if the 1% increase is a “fait accompli”’.
Rationale for a pay award
2.19 ASCL said it was imperative that the principle of a ‘cost of living’ award should be maintained and proposed the distinction between performance-related progression and pay uplift be enshrined in the STPCD. It believed it was STRB’s role to make pay decisions relating to the wider issues facing the profession, separate from local managers who were best placed to make decisions on performance-related progression. ATL said the rationale for a national award was to recognise the increases in the cost of living. UCAC also saw it as a ‘cost of living’ increase.
2.20 NAHT said the Secretary of State’s remit letter did not acknowledge that the 1% pay award was intended only to counter the increase in the cost of living and was not in itself a pay increase, as cost of living awards only prevent or mitigate real terms pay cuts. It opposed any ‘entangling’ of performance-related pay and an annual pay award. It was concerned that there was a consistent approach to teachers’ and school leaders’ pay and maintained there was a strong consensus that the 1% increase was, and should be, a cost of living award to be applied universally to all salaries.
2.21 NUT maintained the function of a pay award was to preserve real pay as well as its competitive position and said there should be a clear distinction between pay progression and the headline pay uplift. NASUWT argued for an above inflation pay award in order to ensure that teaching remained competitive with other graduate occupations and to avert an impending recruitment and retention crisis.
Teacher Labour Market
2.22 Most consultees commented on the potential impact on teacher recruitment, retention and morale of a 1% pay award, saying it would have an adverse effect on the attractiveness of the profession and would hinder the task of attracting more graduates to meet increased demand for teachers arising from the growth in pupil numbers.
Starting pay and progression
2.23 Several unions (ATL, NAHT, NASUWT, NUT) presented analysis that suggested teachers’ starting salaries were much lower than other graduate professions. They commented on the highly competitive market for graduate recruitment, particularly for certain subjects. ASCL said that other industries were more attractive to new entrants and career changers, and said pay needed to be comparable with other graduate professions. NASUWT cited comparative analysis by Incomes Data Services (IDS) which indicated a persistent pay premium for comparable post-graduate professional occupations. NAHT, NUT and Voice noted that the level of starting salaries sent an important signal on the standing of the profession to graduates considering career choices. NAHT said it was a false economy to allow teachers’ pay to fall further behind.
40471_00_all.indb 8 06/06/2014 14:22

9
2.24 NUT said the ending of fixed pay scales and experience-based progression would cause confusion amongst potential applicants to teaching. UCAC expressed similar concerns. Voice said the freedoms given to schools on pay progression decisions would overall have the effect of keeping pay levels down. NEOST commented that it was too early to judge the effects of the 21st Report in providing accelerated progression for high performers.
Earnings and settlements
2.25 Some teacher unions noted pay settlements in other sectors were around 2.5% and questioned whether the profession could continue to attract graduates in a competitive labour market. ATL cited evidence showing that teachers in the independent sector earned higher salaries than teachers in the maintained sector.
2.26 Three classroom teacher unions suggested classroom teachers’ pay had fallen significantly behind where it would have been if salaries had kept pace with inflation: ATL suggested this figure would be 15.1% by 2015. NASUWT calculated a real-terms reduction in pay of 14.5% since 2010 as a result of pay restraint, excluding the increased pension contributions. NUT said that inflation, increased pension contributions and the proposed 1% pay cap from September 2014 would result in teachers’ pay falling by more than 15% in real terms since the 2009 pay award.
2.27 NUT cited an Incomes Data Services (IDS) report4 which pointed out that the RPI inflation rate was higher than the other measures used by Government, the RPIJ and CPIH. ATL and NUT both quoted a report by the Institute for Fiscal Studies (IFS) which suggested that the OBR had forecast squeezes to public sector pay up to 2018/19, which would further reduce the public-private sector pay gap below levels last seen in the early 2000s, when parts of the public sector had difficulties recruiting and retaining staff5. ATL also noted that comparisons between the salaries of private and public sector workers failed to capture accurately the different nature of the roles undertaken and the make up of the workforce. UCAC believed there was a need for a ‘cost of living’ increase and said public sector pay restraint had a serious impact on the economy in Wales.
2.28 Several unions commented on the reduced value of the overall reward package for teachers as a result of public sector pay restraint measures and increases in pension contributions. Voice commented that in order to attract individuals of the right calibre and in the right numbers into teaching, the package on offer had to be attractive.
Teacher supply and demand
2.29 Most consultees highlighted recruitment difficulties in STEM subjects (Science, Technology, Engineering, Maths), which would be accentuated following recently announced changes to GCSE and post-16 maths. NAHT also commented on recruitment challenges for teachers of modern foreign languages, whilst NASUWT highlighted concerns on a range of key subject areas. NUT suggested there were worrying signs of significant teacher supply problems, citing comments made by Professor Sir Tim Brighouse and Professor John Howson. Voice raised concerns highlighted by the Department’s data which, it said, showed continued shortages of teachers in some subject areas. It was also concerned that Ofsted reported 20% of pupils were being taught by non-subject specialists; a point also made by NAHT.
2.30 ASCL noted difficulty recruiting at head of department level for a growing number of subject areas. It was concerned about wastage within the profession, noting the reluctance of deputy and assistant heads to apply for headship posts due to the level of professional risk involved. It said school leaders who left the profession represented an
4 IDS, Inflation statistics: RPI still dominant, while newest measures slow to catch on, 14 November 2013.5 IFS, Hard choices ahead for government cutting public sector employment and pay, December 2013.
40471_00_all.indb 9 06/06/2014 14:22

10
important loss of experience. NEOST and NGA both reported certain types of schools were facing difficulties recruiting head teachers: Catholic, primary, rural, and special schools, and, increasingly, outstanding schools, where the personal risk of taking on such a school was perceived as too high. Voice commented that although the head teacher vacancy rate remained low it could mask the difficulty that some schools experienced in recruiting head teachers.
2.31 ATL said there was a risk of a recruitment and retention crisis developing rapidly as the economy recovered. It did not see recruitment bursaries as an adequate response to recruitment for shortage subjects. It also noted a possible future shortage of school leaders and said the model where school leaders took responsibility for more than one school was unsustainable. It noted the changing age profile of the profession and raised concerns about the loss of experience. NUT also commented on the age profile of teachers and on the numbers retiring before normal pension age.
2.32 Several consultees highlighted the Department’s data that showed the number of primary school places required from 2011/12 to 2016/17 would increase by 9.9% and that this would result in a 5% increase in the number of required secondary school places by 2018/19. They raised concerns about the attractiveness of the teaching profession in recruiting teachers to meet this increased demand. Some said a strategic approach to planning teacher supply across the country was needed, noting that not all areas of the country had teaching schools.
2.33 Consultees also commented on retention. NAHT noted that graduates no longer saw teaching as a career for life and said the pay structure at the five-year point was a concern as it impacted on decisions about whether to stay in teaching. NASUWT cited wastage figures and its own member survey (conducted by ComRes) which showed that nearly half of teachers had seriously considered leaving the profession. It said there were a number of drivers of a potentially serious recruitment and retention crisis: increasing pupil numbers, tuition fees, the pay freeze and the pay cap, deteriorating conditions of service and the denigration and de-professionalisation of teaching.
Initial Teacher Training (ITT)
2.34 As already noted, several consultees expressed concern about the absence of a strategic approach to teacher supply. Several teacher unions noted the reported shortfalls in applications for teacher training in almost all subjects when compared to Government allocations. Most consultees raised concerns about the impact of recent changes to the ITT arrangements. Several commented that School Direct was under-recruiting. NUT feared that an increasing focus on School Direct had built a considerable instability into the teacher training system.
2.35 ASCL and ATL both raised concerns on the quality of applicants to the profession and the training offered. ATL was also concerned that university departments with a history of training high quality teachers were closing and highlighted the limited capacity of universities to step in to fill any gaps created by School Direct.
2.36 At oral evidence, NUT raised concerns that Teach First fostered a sense that graduates might only stay in teaching for a couple of years before moving on to another career. ASCL said that although increasing numbers of Teach First entrants were remaining in the profession they represented a small proportion of overall recruitment. NASUWT suggested Government policy was a disincentive to graduates considering teaching, citing the deterrent effect of tuition fees, the impact of the pay freeze and pay restraint, wider deterioration in conditions of services and denigration of the profession.
40471_00_all.indb 10 06/06/2014 14:22

11
Wales
2.37 The Welsh Government challenged the notion of pay being a key driver for performance and opposed locally determined pay; favouring a national system of pay to ensure the fairest and most cost effective method of administration. It said the onus of determining all teachers’ salaries locally had added significant burdens and pressures to workload at a time when resources were at a premium.
2.38 It reported particular problems in recruiting Welsh medium teachers, physics and maths teachers and to areas of socio-economic deprivation, points endorsed by NEOST and UCAC, who also reported particular difficulties in recruitment for leadership posts. UCAC noted that vacancy rates remained low in Wales at 0.4% (nursery/primary) and 0.3% (secondary). Voice observed that the vacancy rate in Wales remained higher than in England.
2.39 To prevent an over-supply of teachers, the Welsh Government had continued to reduce ITT intake numbers but offered training incentives for shortage subjects. It said there was an average of 25 applications per vacancy for every primary post advertised and 12 applications for secondary posts. UCAC raised concerns over the reduction in applications to ITT in Wales for courses commencing in 2014 and highlighted the use of non-specialist teachers where as many as 45% (chemistry) and 50% (physics) of teachers who were teaching these subjects were not subject specialists. UCAC said that pupil projections suggested the usage of all available ITT entrants and a significant reliance on a large number of re-entrants to the profession to meet the resulting teacher demands in Wales. The Welsh Government said that previous years’ ITT intake levels would be retained for 2014/15 but it would monitor the situation, in particular for primary schools, in light of the 2012-based national pupil projections.
2.40 The Welsh Government reported that retention rates were high, reflecting the lack of alternative graduate jobs available in Wales. UCAC commented on a lack of training opportunities for teachers despite several changes to the education sector.
Motivation and morale
2.41 ASCL noted teaching was becoming less attractive as a career. Pay was not the sole factor: general conditions, workload, accountability and negative media coverage all contributed to the status of the profession. It was also becoming less family-friendly. ATL suggested teachers’ morale was being seriously undermined by comments made by the Secretary of State and the Chief Inspector of Schools, and the introduction of performance-related progression had added to pressure on teachers. It also posited the level of debt that student teachers now owed as a reason for looking for better paid jobs elsewhere.
2.42 NASUWT said the previous 1% pay award had adversely affected morale and cited evidence from a survey of members of a lack of confidence in pay decisions. NUT cited its survey commissioned from YouGov and suggested the introduction of performance-related pay for classroom teachers had had a highly damaging impact on morale. UCAC said that morale had been affected by the erosion of teachers’ pay, suggesting this would impact on recruitment and retention. At oral evidence it said that there had been a decrease in the number of capable and highly motivated applicants to teaching due to excessive workloads and negative media coverage of the profession.
40471_00_all.indb 11 06/06/2014 14:22
12
Affordability in schools
2.43 NEOST highlighted that flat cash Dedicated School Grant settlements meant that school budgets were falling in real terms, creating cost pressures and concern over the affordability of any pay award. NGA accepted that any pay award would have direct cost pressures on flat cash school budgets.
2.44 ATL commented that the affordability issue was much wider than the STRB’s remit and that the Department seemed to have prioritised spending on the academies and free school project, a point also made by NASUWT. NUT said the Department had created affordability issues by failing to increase school spending in real terms and urged STRB to resist constraints for reasons of affordability, saying it was not appropriate to depress pay on budgetary grounds.
2.45 At oral evidence several consultees recognised that there were likely to be staff redundancies as schools tried to manage the cost of any pay award in already stretched school budgets. They acknowledged that the affordability picture varied depending on local authority budgets and schools’ income.
2.46 NASUWT said that prior to 2010, affordability at individual school level was not a relevant factor advanced for consideration as successive governments funded the pay award through increases in the quantum for schools. It went on to say that even in current circumstances schools should be able to fund the pay award and good managers would cope within their school budgets. In this context, it raised concern about a lack of transparency and rigour in pay decisions for head teachers.
2.47 We explored at oral evidence consultees’ views on the potential to manage tight school budgets by employing fewer, better paid teachers. Some consultees said this was not the answer as it would lead to larger class sizes, greater pressures on remaining teachers and compromise on the quality of education. NASUWT set out its vision of highly skilled, qualified teachers leading a team of professionals which could result in fewer teachers but thought that this should be driven by workforce reform to improve outcomes rather than budgetary pressures. UCAC said that some schools were changing structures by combining two year groups or subject areas to manage effectively within tight budgets.
Level of a pay award
2.48 All the teacher unions said teachers’ pay had been eroded in real terms in recent years and had worsened when compared to pay of other graduate professionals. Most considered a 1% pay award to be insufficient and sought a higher award, calling upon the Review Body to exercise its independence by recommending a higher uplift. In oral evidence, however, some acknowledged that affordability constraints meant an award above 1% would present schools with very significant affordability challenges.
2.49 NASUWT sought a significant increase above inflation. ATL and NUT both said there was a justifiable case for a significant increase above 1%, although ATL acknowledged there was a 1% ceiling in practice. UCAC believed that the pay award should be at least in line with inflation, taking into account the two-year pay freeze and subsequent pay restraint. ASCL accepted that a degree of constraint had been necessary but did not accept that a 1% pay cap was appropriate. NAHT and Voice both called for a uniform uplift but did not specify the value of an award.
2.50 NEOST supported a 1% pay award, although it described it as a cost pressure that schools would have to absorb.
40471_00_all.indb 12 06/06/2014 14:22
13
Application of a pay award
2.51 All consultees sought an across the board increase to all pay ranges and salaries in payment for the following reasons:
• To send an important signal to the profession that it was valued.
• To ensure all teachers received a pay uplift to keep up with the market.
• For the stability of the pay structure, career progression, teacher morale and simplicity for the employer.
• To ensure a simple approach to the September 2014 pay award at a time when schools were getting to grips with differential performance-related progression.
• A differential award would be divisive and damaging for morale.
• 1% was too little to be applied differentially.
2.52 At oral evidence we explored consultees’ views on when a pay award should be applied nationally as opposed to having local discretion. All consultees thought that the pay award should be applied at a national level to maintain competitive pay levels and support recruitment and retention. NEOST said some schools would welcome discretion on how to apply the pay award but local authorities would prefer uniformity. Some consultees noted that schools had local discretion to differentiate performance-based awards, as a result of our 21st Report. The Welsh Government saw professional development rather than pay as a vehicle for improving standards. It considered differential pay awards would lead to bigger problems and disputes, which would deflect attention from improving standards across the piece.
2.53 Several consultees said that it was important to maintain a distinction between the annual pay award and performance-related pay. NASUWT said the Review Body should avoid making recommendations for a pay award on an individual school-level basis which could contribute to a race to the bottom on teachers’ pay.
2.54 Most consultees preferred the reference points in DfE advice be retained as schools continued to use them while making the transition to the new system of performance-related progression. The Welsh Government proposed re-introduction of scale points or at least the retention of the reference points.
2.55 Voice thought reference points should be retained for September 2014 as schools would be making the first set of performance decisions then, but could see logic in removing these in future once practices had been embedded within schools. NGA said it might be appropriate to remove reference points as they could stifle innovation on pay; it said that schools could re-create reference points if they wished to in their own pay policies.
2.56 ATL called for the pay arrangements of all teachers to be brought back under the STPCD.
Application of a pay award to teacher allowances
2.57 All consultees, with the exception of NEOST, supported applying the pay award to all allowances. NEOST favoured an uplift for TLRs, SEN allowances and allowances payable to unqualified teachers but did not support an uplift to other allowances that were set entirely at individual school level, saying these should be reviewed annually by schools.
2.58 At oral evidence NGA said it would not object to the NEOST proposal and ASCL commented that although the proposal on allowances was interesting, the symbolism of universal application was important in current circumstances. NASUWT rejected the NEOST proposals saying that the impact of uprating all allowances was miniscule in relation to the overall budget. UCAC also said that allowances would form a minimal
40471_00_all.indb 13 06/06/2014 14:22
14
amount of the schools budget but would be a significant amount for individual teachers. It said it should be recognised that allowances tended to be fixed amounts for specific responsibilities.
2.59 NAHT considered that all permanent allowances were part of pay, so should be uplifted but acknowledged there was a case for short-term allowances, such as TLR3, to be excluded.
Unqualified teachers
2.60 NASUWT noted that the Chancellor’s 2011 Autumn Statement included provisions for the lowest paid public sector workers to receive a £250 non-consolidated payment for each year of the pay freeze and believed there was a need for the Treasury to keep its promise to the lowest paid teachers and restore the pay levels of Unqualified Teachers to parity with those prior to 1 September 2013.
Application of a pay award to the leadership pay ranges
2.61 ATL noted that the differential in pay between school leaders and classroom teachers must not be stretched too far, a point also made by NASUWT. NEOST said employers were concerned not to exacerbate any head teacher recruitment difficulties by awarding a lower uplift to members of the leadership group.
Diversity
2.62 NASUWT suggested there was emerging evidence from its members of widening pay inequalities within schools, affecting disproportionately black and minority ethnic (BME) teachers, women teachers and disabled teachers. It asked that the Review Body’s recommendations should require the DfE to carry out a detailed and robust equality impact assessment of any proposals and a robust monitoring system to inform future deliberations. UCAC made similar points and believed that the result of not applying the pay award across the board would be more pay challenges based on equality issues.
2.63 ATL, NASUWT and Voice reported an increase in the number of older teachers (50+ years) at the top of pay ranges who were being taken through capability procedures. There was some concern that this was driven by cost rather than performance issues.
2.64 Some consultees commented on the need for good role models to attract and retain people from diverse backgrounds. NEOST reported that some local authorities had run good recruitment campaigns designed to attract candidates from diverse backgrounds. NUT said certainty on pay progression, workload and role models would help to attract recruits from a diverse range of backgrounds. NGA said it was not aware of anything being done strategically to ensure people from a wider range of backgrounds were recruited into teaching. It believed BME groups to be greatly under-represented on school governing bodies and suggested it was hard to raise awareness of these issues given the diminishing role of local authorities. ATL highlighted the changing age profile of the profession, the lack of men in the primary sector, and the issue of part-time teachers’ disproportionate workload. NAHT suggested the position was improving with the proportion of BME trainees increasing and more people from less affluent backgrounds now attending university.
40471_00_all.indb 14 06/06/2014 14:22
15
CHAPTER 3
The teacher labour market: our analysis and commentary
3.1 Chapter 2 provided a summary of consultees’ evidence, including their assessment of the labour market following the two-year pay freeze. Consultees have drawn on a range of sources of information and timeframes in their analyses with most highlighting perceived risks to the teacher labour market. These relate to a range of factors, including workload, the morale of the workforce, the impact of recent pay restraint, cost of living pressures and the relative position of teaching as a profession. In this chapter we set out our own analysis of the labour market for teachers.
Economy-wide inflation, average earnings and settlements
Earnings and prices
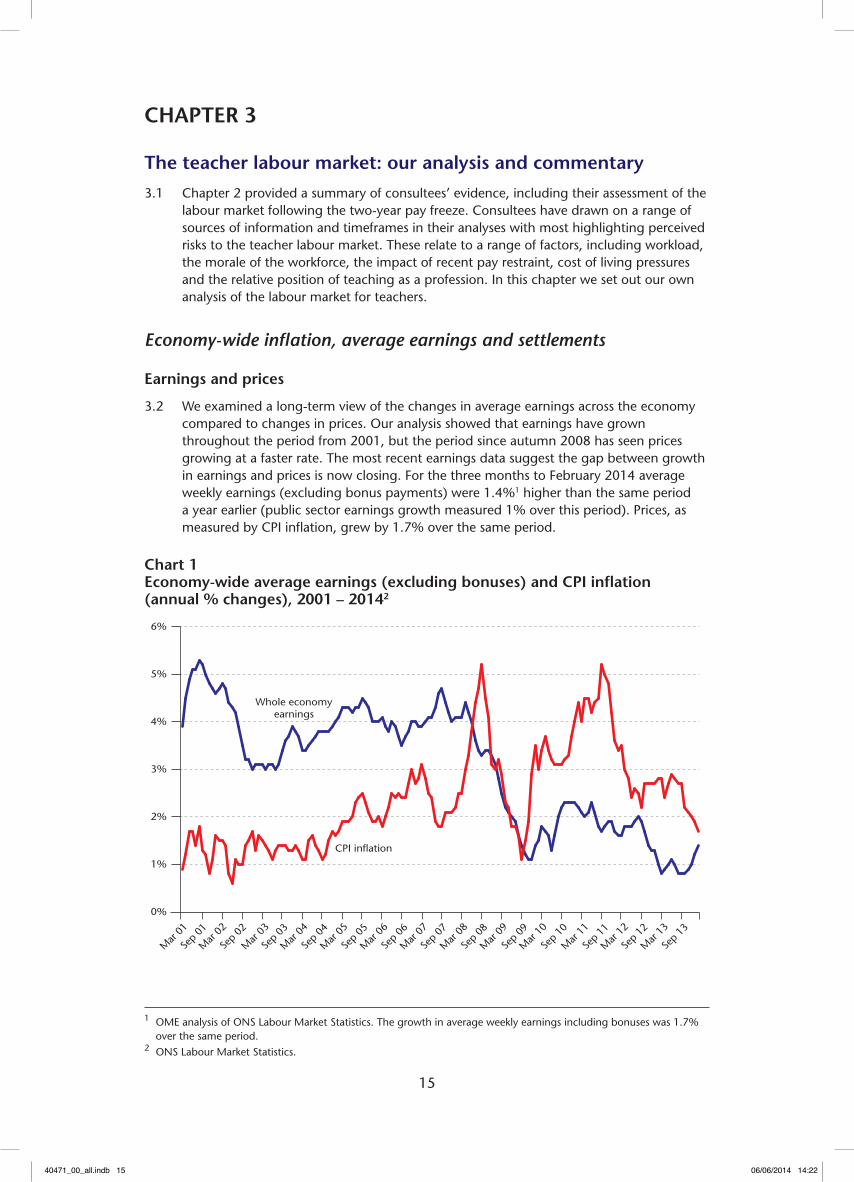
3.2 We examined a long-term view of the changes in average earnings across the economy compared to changes in prices. Our analysis showed that earnings have grown throughout the period from 2001, but the period since autumn 2008 has seen prices growing at a faster rate. The most recent earnings data suggest the gap between growth in earnings and prices is now closing. For the three months to February 2014 average weekly earnings (excluding bonus payments) were 1.4%1 higher than the same period a year earlier (public sector earnings growth measured 1% over this period). Prices, as measured by CPI inflation, grew by 1.7% over the same period.
Chart 1 Economy-wide average earnings (excluding bonuses) and CPI inflation (annual % changes), 2001 – 20142
0%
1%
2%
3%
4%
5%
6%
Sep 13
Mar
13
Sep 12
Mar
12
Sep 11
Mar
11
Sep 10
Mar
10
Sep 09
Mar
09
Sep 08
Mar
08
Sep 07
Mar
07
Sep 06
Mar
06
Sep 05
Mar
05
Sep 04
Mar
04
Sep 03
Mar
03
Sep 02
Mar
02
Sep 01
Mar
01
Whole economyearnings
CPI inflation
1 OME analysis of ONS Labour Market Statistics. The growth in average weekly earnings including bonuses was 1.7% over the same period.
2 ONS Labour Market Statistics.
40471_00_all.indb 15 06/06/2014 14:22
16
3.3 Examining annual changes to prices (as measured by CPI and RPI inflation) over the last four years, we note that throughout 2010 and most of 2011 inflation was well above the Government’s 2% target but then fell steadily from around 5% in November 2011 to 2.2% (CPI) and 2.6% (RPI) in September 2012. Both measures increased sharply in October 2012 and subsequently levelled off before falling in the last three months of 2013, with CPI measuring 1.6% in March 2014 (and RPI 2.5%).
3.4 Commenting in its February 20143 Inflation Report, the Bank of England noted CPI inflation returned to the 2% target in December. It said that inflation was expected to moderate further in the following few months before edging back up to around the target.
Economy-wide settlements
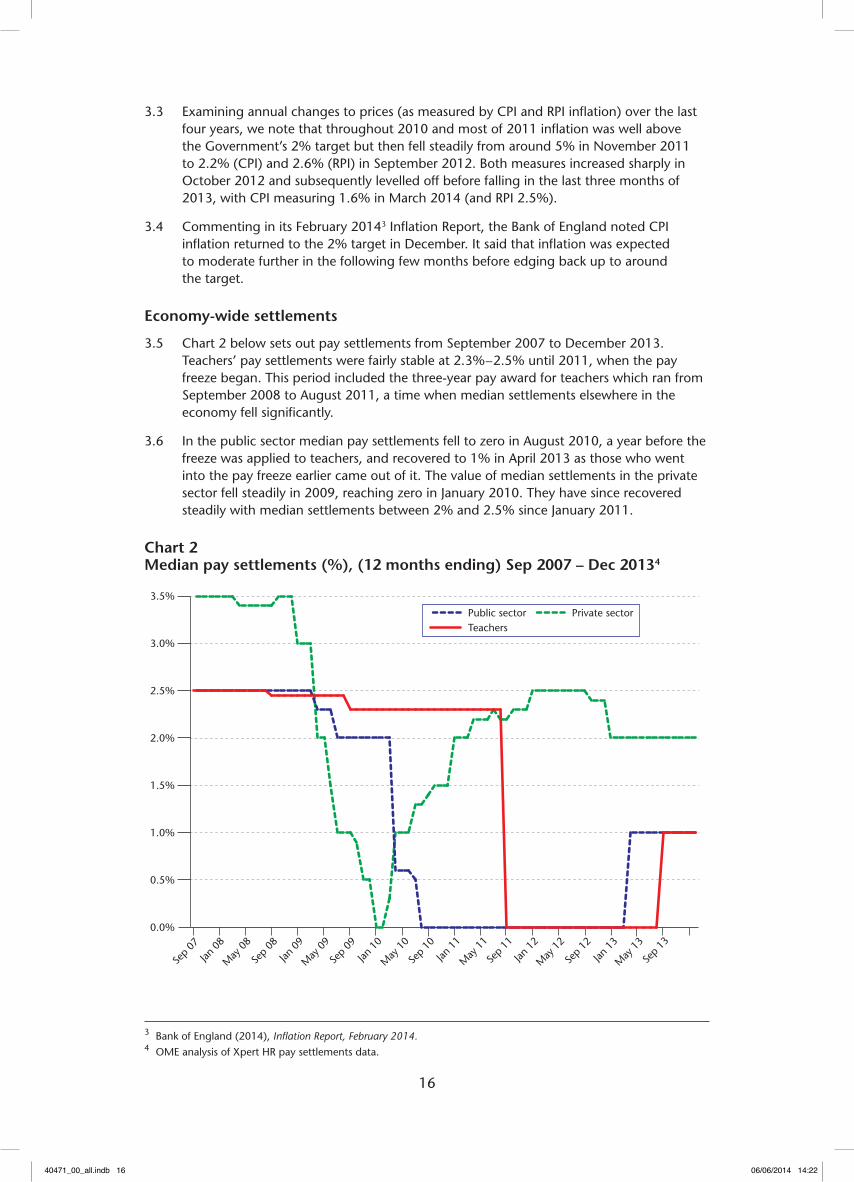
3.5 Chart 2 below sets out pay settlements from September 2007 to December 2013. Teachers’ pay settlements were fairly stable at 2.3%–2.5% until 2011, when the pay freeze began. This period included the three-year pay award for teachers which ran from September 2008 to August 2011, a time when median settlements elsewhere in the economy fell significantly.
3.6 In the public sector median pay settlements fell to zero in August 2010, a year before the freeze was applied to teachers, and recovered to 1% in April 2013 as those who went into the pay freeze earlier came out of it. The value of median settlements in the private sector fell steadily in 2009, reaching zero in January 2010. They have since recovered steadily with median settlements between 2% and 2.5% since January 2011.
Chart 2 Median pay settlements (%), (12 months ending) Sep 2007 – Dec 20134
0.0%
0.5%
1.0%
1.5%
2.0%
2.5%
3.0%
3.5%
Sep
13
May
13
Jan 1
3
Sep
12
May
12
Jan 1
2
Sep
11
May
11
Jan 1
1
Sep
10
May
10
Jan 1
0
Sep
09
May
09
Jan 0
9
Sep
08
May
08
Jan 0
8
Sep
07
Public sector Private sectorTeachers
3 Bank of England (2014), Inflation Report, February 2014.4 OME analysis of Xpert HR pay settlements data.
40471_00_all.indb 16 06/06/2014 14:22
17
Teachers’ Earnings
Teachers’ average earnings growth
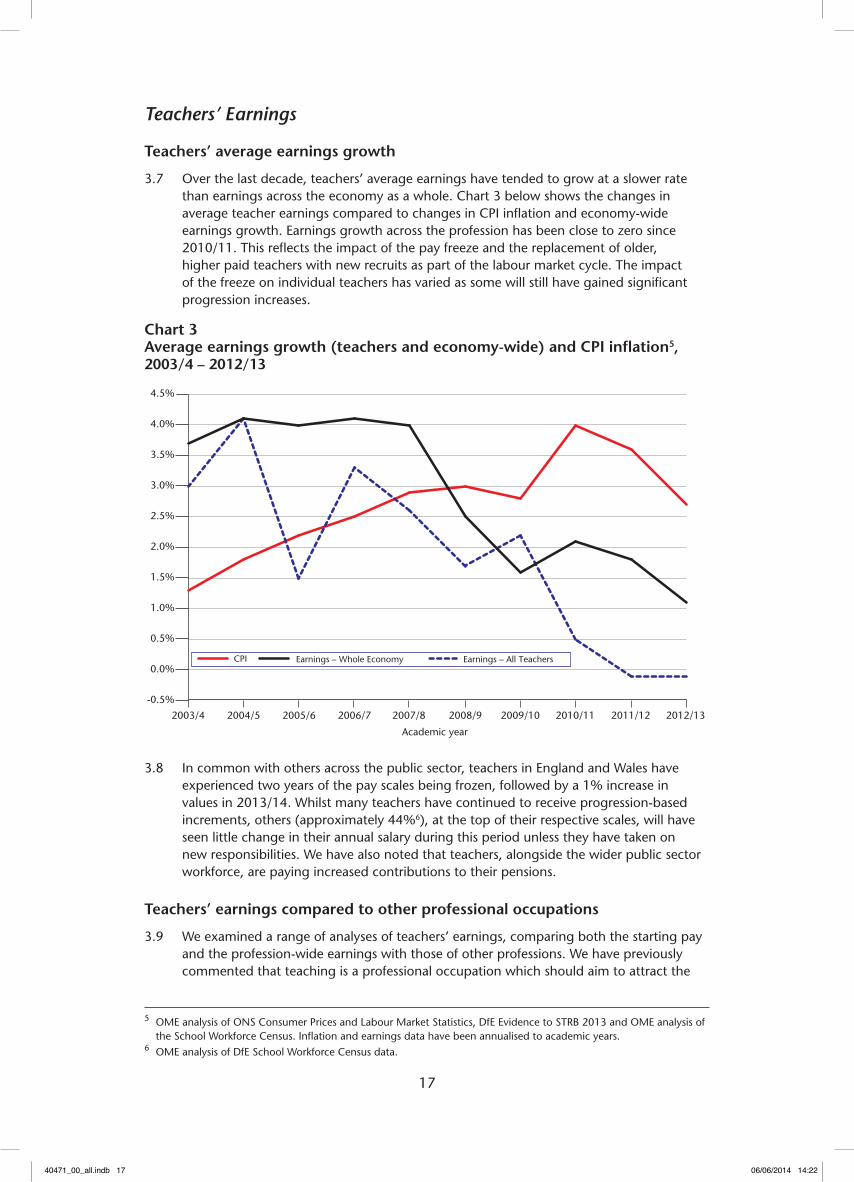
3.7 Over the last decade, teachers’ average earnings have tended to grow at a slower rate than earnings across the economy as a whole. Chart 3 below shows the changes in average teacher earnings compared to changes in CPI inflation and economy-wide earnings growth. Earnings growth across the profession has been close to zero since 2010/11. This reflects the impact of the pay freeze and the replacement of older, higher paid teachers with new recruits as part of the labour market cycle. The impact of the freeze on individual teachers has varied as some will still have gained significant progression increases.
Chart 3 Average earnings growth (teachers and economy-wide) and CPI inflation5, 2003/4 – 2012/13
3.8
-0.5%
0.0%
0.5%
1.0%
1.5%
2.0%
2.5%
3.0%
3.5%
4.0%
4.5%
2012/132011/122010/112009/102008/92007/82006/72005/62004/52003/4
Earnings – Whole Economy Earnings – All TeachersCPI
Academic year
In common with others across the public sector, teachers in England and Wales have experienced two years of the pay scales being frozen, followed by a 1% increase in values in 2013/14. Whilst many teachers have continued to receive progression-based increments, others (approximately 44%6), at the top of their respective scales, will have seen little change in their annual salary during this period unless they have taken on new responsibilities. We have also noted that teachers, alongside the wider public sector workforce, are paying increased contributions to their pensions.
Teachers’ earnings compared to other professional occupations
3.9 We examined a range of analyses of teachers’ earnings, comparing both the starting pay and the profession-wide earnings with those of other professions. We have previously commented that teaching is a professional occupation which should aim to attract the
5 OME analysis of ONS Consumer Prices and Labour Market Statistics, DfE Evidence to STRB 2013 and OME analysis of the School Workforce Census. Inflation and earnings data have been annualised to academic years.
6 OME analysis of DfE School Workforce Census data.
40471_00_all.indb 17 06/06/2014 14:22
18
most able graduates and that as such teachers’ earnings should be compared with those of other professional occupations7 as described by the Standard Occupational Classification (SOC). Other analyses using different definitions for comparator groups are possible.
Starting pay and the wider new graduate market
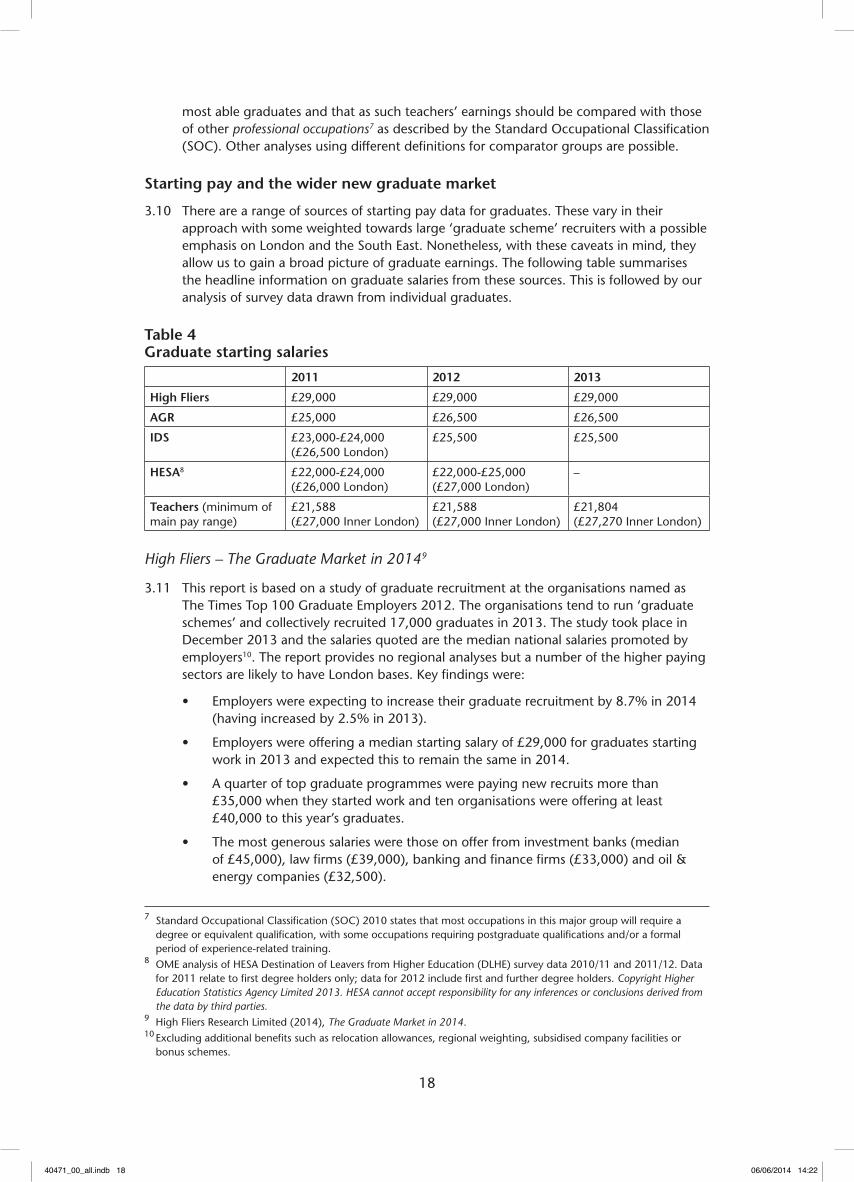
3.10 There are a range of sources of starting pay data for graduates. These vary in their approach with some weighted towards large ‘graduate scheme’ recruiters with a possible emphasis on London and the South East. Nonetheless, with these caveats in mind, they allow us to gain a broad picture of graduate earnings. The following table summarises the headline information on graduate salaries from these sources. This is followed by our analysis of survey data drawn from individual graduates.
Table 4 Graduate starting salaries8
2011 2012 2013
High Fliers £29,000 £29,000 £29,000
AGR £25,000 £26,500 £26,500
IDS £23,000-£24,000 (£26,500 London)
£25,500 £25,500
HESA8 £22,000-£24,000 (£26,000 London)
£22,000-£25,000(£27,000 London)
–
Teachers (minimum of main pay range)
£21,588 (£27,000 Inner London)
£21,588 (£27,000 Inner London)
£21,804(£27,270 Inner London)
High Fliers – The Graduate Market in 20149
3.11 This report is based on a study of graduate recruitment at the organisations named as The Times Top 100 Graduate Employers 2012. The organisations tend to run ‘graduate schemes’ and collectively recruited 17,000 graduates in 2013. The study took place in December 2013 and the salaries quoted are the median national salaries promoted by employers10. The report provides no regional analyses but a number of the higher paying sectors are likely to have London bases. Key findings were:
• Employers were expecting to increase their graduate recruitment by 8.7% in 2014 (having increased by 2.5% in 2013).
• Employers were offering a median starting salary of £29,000 for graduates starting work in 2013 and expected this to remain the same in 2014.
• A quarter of top graduate programmes were paying new recruits more than £35,000 when they started work and ten organisations were offering at least £40,000 to this year’s graduates.
• The most generous salaries were those on offer from investment banks (median of £45,000), law firms (£39,000), banking and finance firms (£33,000) and oil & energy companies (£32,500).
7 Standard Occupational Classification (SOC) 2010 states that most occupations in this major group will require a degree or equivalent qualification, with some occupations requiring postgraduate qualifications and/or a formal period of experience-related training.
8 OME analysis of HESA Destination of Leavers from Higher Education (DLHE) survey data 2010/11 and 2011/12. Data for 2011 relate to first degree holders only; data for 2012 include first and further degree holders. Copyright Higher Education Statistics Agency Limited 2013. HESA cannot accept responsibility for any inferences or conclusions derived from the data by third parties.
9 High Fliers Research Limited (2014), The Graduate Market in 2014.10 Excluding additional benefits such as relocation allowances, regional weighting, subsidised company facilities or
bonus schemes.
40471_00_all.indb 18 06/06/2014 14:22
19
• Public sector employers (median of £22,400) had the lowest reported graduate pay rates.
AGR Graduate Recruitment Survey11
3.12 The AGR is a membership organisation and its surveys are based on returns from some 200 of its members (there is some overlap with High Fliers). Collectively, these are estimated to have offered a total of 21,000 vacancies during the recruitment season ending December 2013. A large variety of business sectors responded to the survey (law firms were the largest sectoral category surveyed (21%), followed by engineering or industrial companies (9%), IT (7%) and investment banking (7%)). Key points were:
• There was renewed confidence and optimism in the graduate recruitment market with a predicted 10.2% increase in vacancy levels in 2013/14. This followed a 4.3% increase in the previous year.
• The median starting salary for recruitment years ending in both December 2012 and December 2013 was £26,500.
• Investment bank or fund managers continued to offer the highest median starting salaries at £38,250 followed by law firms at £37,000. Median starting salaries for other sectors ranged from £23,000 to £29,750.
• London attracted higher starting salary levels (a median salary of £28,500), with most other English regions predicted to have a median salary of £25,000. Median salaries in Wales were £23,000.
IDS Pay and Progression for graduates 201312
3.13 The IDS report is based on responses from 121 graduate employers across the country. Again, many of these are likely to run dedicated ‘graduate schemes’ and there is likely to be some overlap with the previously listed studies. Key points were:
• The highest forecast median salaries in 2013 were in London (£28,000).
• Outside London, median salaries in all other English regions were in the range £23,750 – £25,750.
Higher Education Statistics Agency (HESA) data
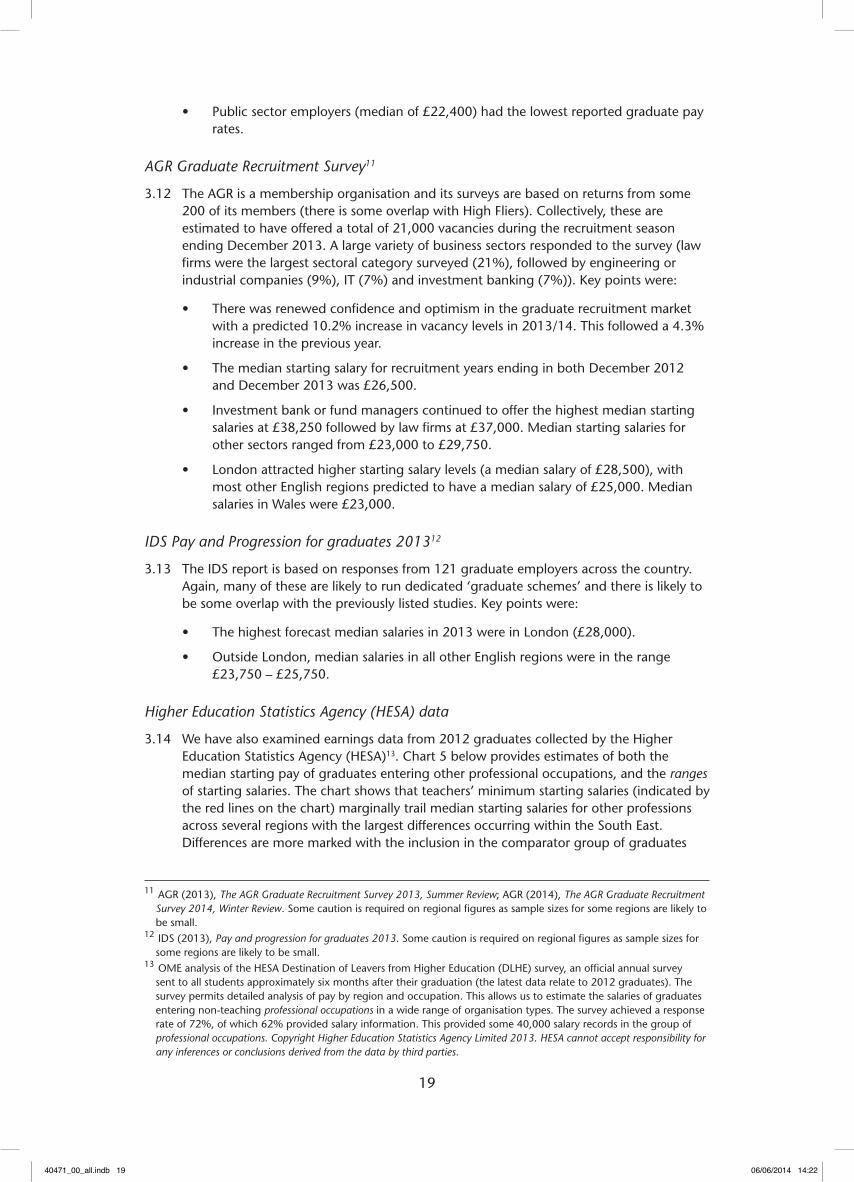
3.14 We have also examined earnings data from 2012 graduates collected by the Higher Education Statistics Agency (HESA)13. Chart 5 below provides estimates of both the median starting pay of graduates entering other professional occupations, and the ranges of starting salaries. The chart shows that teachers’ minimum starting salaries (indicated by the red lines on the chart) marginally trail median starting salaries for other professions across several regions with the largest differences occurring within the South East. Differences are more marked with the inclusion in the comparator group of graduates
11 AGR (2013), The AGR Graduate Recruitment Survey 2013, Summer Review; AGR (2014), The AGR Graduate Recruitment Survey 2014, Winter Review. Some caution is required on regional figures as sample sizes for some regions are likely to be small.
12 IDS (2013), Pay and progression for graduates 2013. Some caution is required on regional figures as sample sizes for some regions are likely to be small.
13 OME analysis of the HESA Destination of Leavers from Higher Education (DLHE) survey, an official annual survey sent to all students approximately six months after their graduation (the latest data relate to 2012 graduates). The survey permits detailed analysis of pay by region and occupation. This allows us to estimate the salaries of graduates entering non-teaching professional occupations in a wide range of organisation types. The survey achieved a response rate of 72%, of which 62% provided salary information. This provided some 40,000 salary records in the group of professional occupations. Copyright Higher Education Statistics Agency Limited 2013. HESA cannot accept responsibility for any inferences or conclusions derived from the data by third parties.
40471_00_all.indb 19 06/06/2014 14:22
20
with further degrees. The higher minimum starting salaries for teachers in London are broadly equal to wider median graduate starting salaries although graduate recruits in some professions earn significantly more.
3.15 As well as the median (the central value when all earnings observations are ordered) the chart also shows the inter-quartile range (the middle 50% of the earnings distribution), the 5th percentile (the value below which 5% of earnings observations are found) and the 95th percentile (the value above which 5% of earnings observations are found). The chart shows there is considerable variation of starting salaries around the median for graduates entering other professional occupations; for example, the middle 50% of starting salaries (the inter-quartile range) typically spanned a range of some £5,000 – £9,000 around the headline median value for graduates with first degrees (and this increases to £8,000 – £10,000 if we include those with higher degrees). The chart also supports the data from earlier cited sources which showed that graduates in some occupations receive significantly higher starting salaries than teachers, and that this is the case in all regions.
Chart 5 Starting salaries of 2012 graduates entering other professional occupations, 2012/13 – Median, Inter-quartile range, 5th and 95th Percentiles
£10,000
£15,000
£20,000
£25,000
£30,000
£35,000
£40,000
£45,000
£50,000
£55,000
Classroom teachers starting salary 2012, with higher rates for inner and outer London
SOC 2010: Other professional occupations – first degree
SOC 2010: Other professional occupations – first or higher degree
North East
North W
est
Yorksh
ire and
The Hum
ber
East M
idlands
West
Mid
lands
East of E
ngland
London
South East
South W
est
Wales
Graduate pay progression
3.16 For many graduates, an important consideration in occupational choice relates to their expectation of salary progression in subsequent years. A study by IDS14 found that graduate employers commonly had two or three year training schemes with pay
14 IDS (2013), Pay and progression for graduates 2013.
40471_00_all.indb 20 06/06/2014 14:22
21
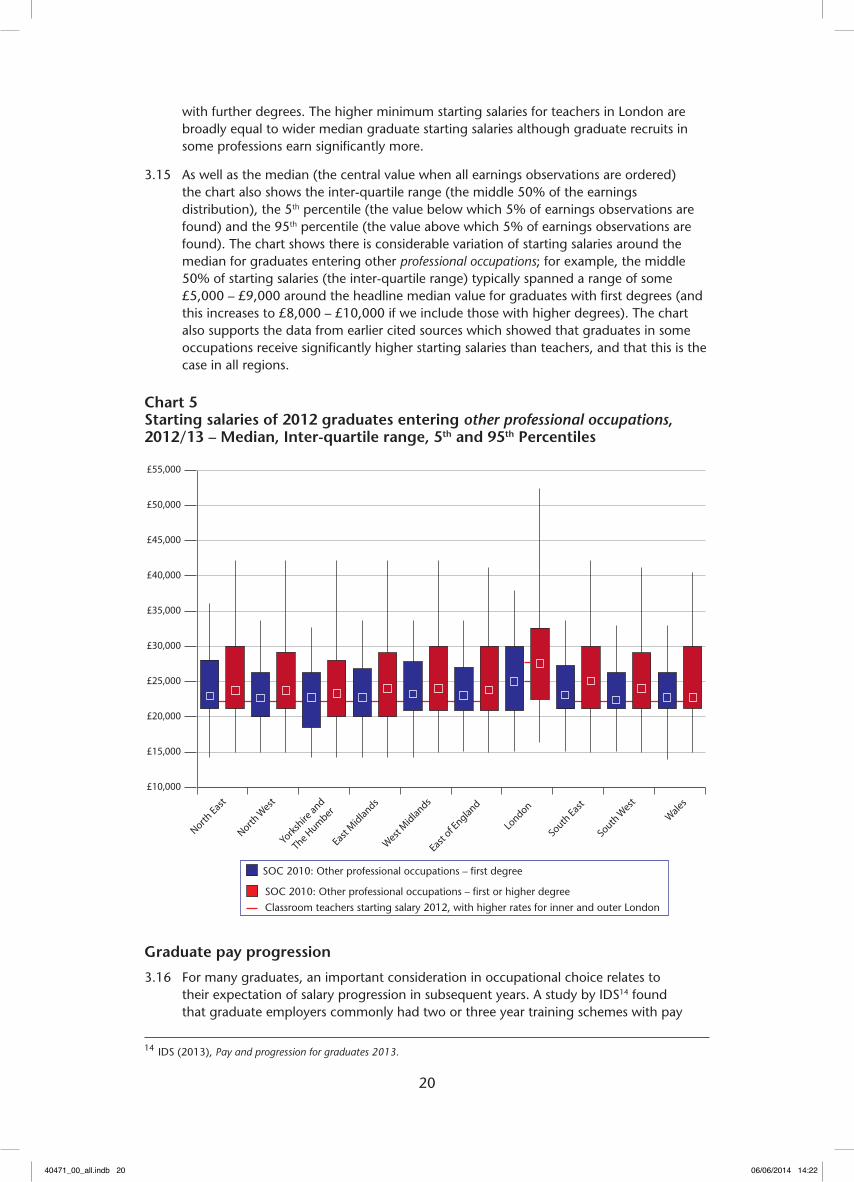
progression often tied to performance. IDS found that in 2012, average salaries of graduates with three-year tenure was 37% higher than the corresponding average starting rate; graduates with five-year tenure had an average salary some 71% higher than the starting rate.
3.17 We noted consultees’ concerns in Chapter 2 about the importance of the pay structure at the five-year point. The framework has meant that teachers in England and Wales have typically seen their salaries increase through annual pay progression by 26% after three years (M1 to M4) and by 46% after five years (M1 to M6). The salary for teachers reaching the top of the Upper Pay Range (typically after 10 years) has been some 70% higher than their starting salary. For a significant proportion of teachers on the main and upper pay scales (40% in secondary and 17% in primary15), this has been enhanced further through additional allowances or responsibility payments.
Chart 6 Pay progression (% change over starting pay after three and five years)
0%
10%
20%
30%
40%
50%
60%
70%
80%
After 5 yearsAfter 3 years
Graduates Teachers (excluding allowances)
3.18 Following implementation of our 21st Report recommendations, schools now have greater flexibility to set the starting pay of teachers, taking account of local pressures, and to determine their rate of progression based on performance, but the impact of this change on average earnings has yet to be seen in the data.
Profession-wide earnings compared to other occupations
3.19 Chart 7 below provides an update of the regional earnings analysis set out in our 21st and 22nd Reports. The chart shows that, in 2012/13, before the pay reforms flowing from our 21st Report, classroom teachers’ median earnings (excluding leaders) trailed those of other professionals in 6 (of 10) regions (Inner/Outer London, South East, East of England, East Midlands and West Midlands), compared with 5 (of 10) regions in 2011/12. Across the majority of regions the relative position of classroom teachers’ earnings had worsened since 2011/12. This reflects largely unchanged teachers’ median earnings in both years. While some caution is needed because of small sample sizes with the comparator data, this points to a continuing deterioration in the earnings position of teachers relative to other graduate professionals.
15 OME analysis of DfE School Workforce Census: Proportion of full-time teachers in 2012 receiving a TLR.
40471_00_all.indb 21 06/06/2014 14:22
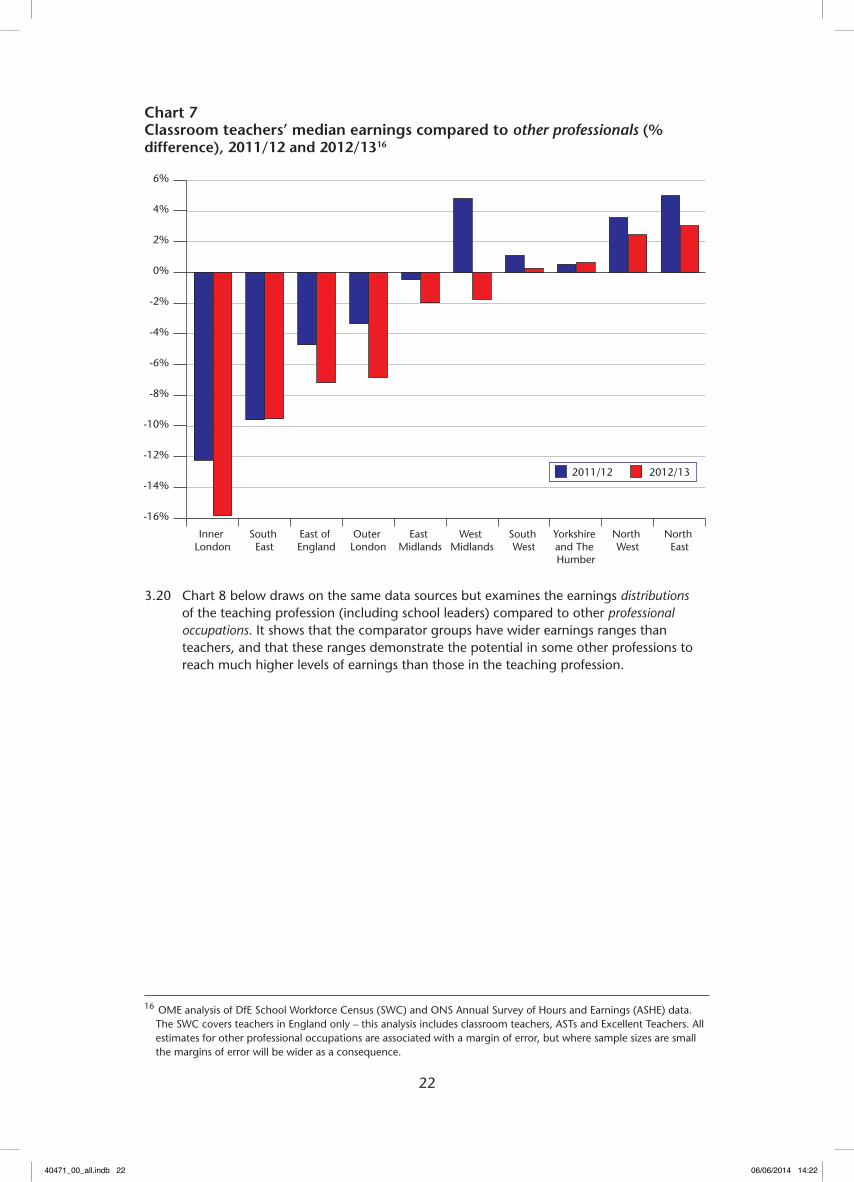
22
Chart 7 Classroom teachers’ median earnings compared to other professionals (% difference), 2011/12 and 2012/1316
-16%
-14%
-12%
-10%
-8%
-6%
-4%
-2%
0%
2%
4%
6%
North East
North West
Yorkshire and The Humber
South West
West Midlands
East Midlands
Outer London
East of England
South East
Inner London
2011/12 2012/13
3.20 Chart 8 below draws on the same data sources but examines the earnings distributions of the teaching profession (including school leaders) compared to other professional occupations. It shows that the comparator groups have wider earnings ranges than teachers, and that these ranges demonstrate the potential in some other professions to reach much higher levels of earnings than those in the teaching profession.
16 OME analysis of DfE School Workforce Census (SWC) and ONS Annual Survey of Hours and Earnings (ASHE) data. The SWC covers teachers in England only – this analysis includes classroom teachers, ASTs and Excellent Teachers. All estimates for other professional occupations are associated with a margin of error, but where sample sizes are small the margins of error will be wider as a consequence.
40471_00_all.indb 22 06/06/2014 14:22
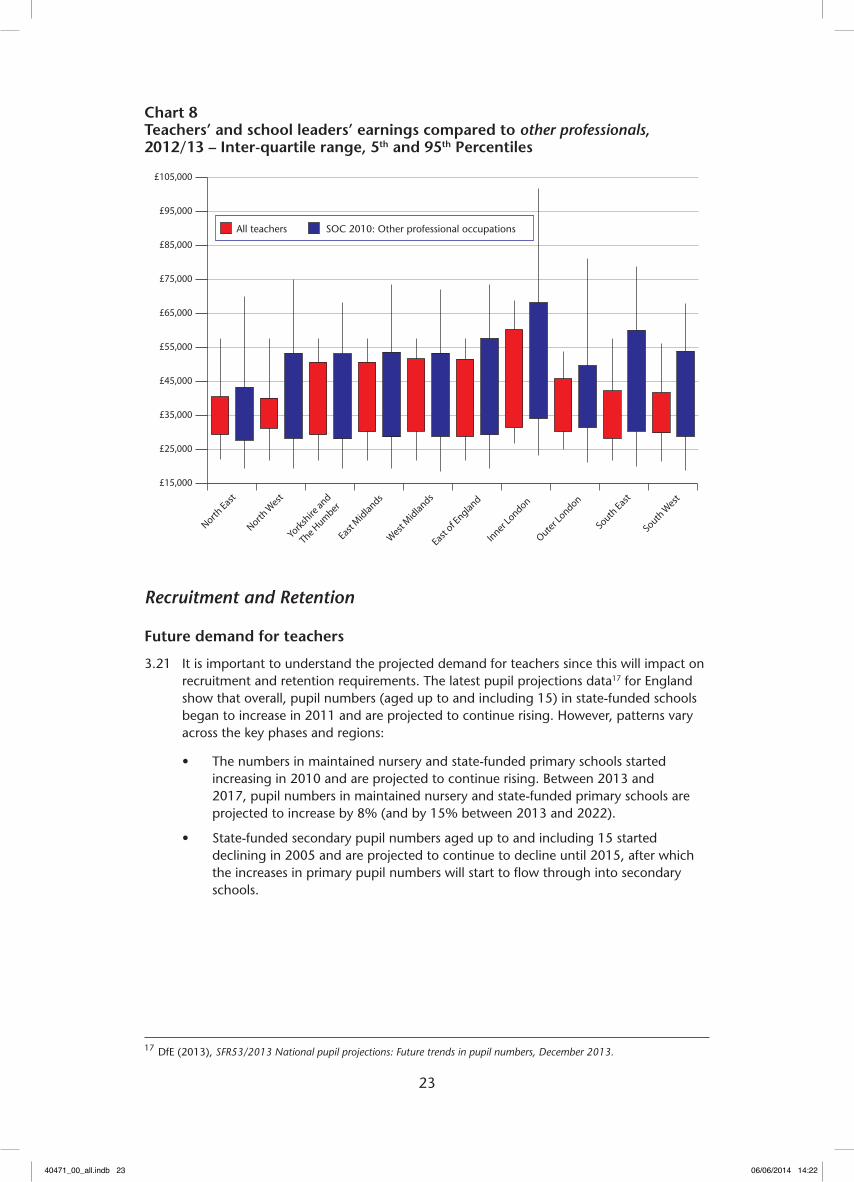
23
Chart 8 Teachers’ and school leaders’ earnings compared to other professionals, 2012/13 – Inter-quartile range, 5th and 95th Percentiles
£15,000
£25,000
£35,000
£45,000
£55,000
£65,000
£75,000
£85,000
£95,000
£105,000
All teachers SOC 2010: Other professional occupations
North East
North W
est
Yorksh
ire and
The Hum
ber
East M
idlands
West
Mid
lands
East of E
ngland
Inner L
ondon
Outer L
ondon
South East
South W
est
Recruitment and Retention
Future demand for teachers
3.21 It is important to understand the projected demand for teachers since this will impact on recruitment and retention requirements. The latest pupil projections data17 for England show that overall, pupil numbers (aged up to and including 15) in state-funded schools began to increase in 2011 and are projected to continue rising. However, patterns vary across the key phases and regions:
• The numbers in maintained nursery and state-funded primary schools started increasing in 2010 and are projected to continue rising. Between 2013 and 2017, pupil numbers in maintained nursery and state-funded primary schools are projected to increase by 8% (and by 15% between 2013 and 2022).
• State-funded secondary pupil numbers aged up to and including 15 started declining in 2005 and are projected to continue to decline until 2015, after which the increases in primary pupil numbers will start to flow through into secondary schools.
17 DfE (2013), SFR53/2013 National pupil projections: Future trends in pupil numbers, December 2013.
40471_00_all.indb 23 06/06/2014 14:22

24
Chart 9 Number of pupils (aged up to age 15) in England (millions), 1970 – 2022
2.0
2.5
3.0
3.5
4.0
4.5
5.0
1970 1975 1980 1985 1990 1995 2000 2005 2010 2015 2020
Maintained nursery and state-funded primary schools
State-funded secondary schools
3.22 Long-term projections of pupil numbers are at a national level. The Office of National
Statistics (ONS) produces shorter-term projections of the numbers of the school-aged population by region:
• By 2016, all regions in England are projected to have an increase in their primary aged population (aged 5 to 10) compared with 2011. There is some variation by region, ranging from around 9% in the North West and West Midlands to 13% in the East of England.
• The population aged 11 to 15 is projected to decline in all regions each year up to and including 2014, with some regional variation in the years following. In 2015, the 11 to 15 population in London is projected to stabilise, but in all other regions this age group will continue to decline until 2016, when numbers in all regions except the North East and the South West will start to recover or stabilize. The North East is projected to experience the greatest decrease in this age group – 9% between 2011 and 201618.
3.23 Our analysis has also demonstrated that there is considerable local variation in pupil projections19 with:
• Primary numbers forecast to change by between -2% (Northumberland) and +50% (Croydon) between 2012/13 and 2017/18.
• Secondary numbers forecast to grow by between -9% (Isle of Wight) and +52% (Reading) over the longer period 2012/13 to 2019/20.
18 DfE (2013), Evidence to the STRB: the 2014 pay award.19 OME analysis of DfE School Capacity Survey and School Census data published December 2013.
40471_00_all.indb 24 06/06/2014 14:22

25
3.24 In Wales, primary pupil numbers are expected to increase by around 13% from 2013 to 2021. Secondary school numbers are expected to decrease over the next few years, followed by a recovery as the increased primary numbers feed through to the secondary sector. The projections suggest a net increase across both phases of some 6% over the period to 202120.
3.25 Projected increases in pupil numbers of the magnitude summarised above were last seen during the late 1960s. We note that the rising birth rate then moved the Government to a major expansion in teacher training numbers to cope with the subsequent increases in primary and secondary pupil numbers in the early to mid 1970s.
Support staff
3.26 There has been a significant change in the balance of teaching and support staff over the past decade21.
• In England, the number of teaching support staff (including teaching assistants, special needs support and minority ethnic needs support staff) has increased from 147,000 in 2005 to 232,000 in 2012 (+58%).
• In Wales, the number of teaching support staff (including teaching assistants, special needs support and minority ethnic needs support staff) increased from approximately 10,000 in 2005/6 to 17,000 in 2011/12 (+70%).
3.27 Pupil to teacher ratios (PTRs) and pupil to adult ratios (PARs – which include teaching support staff, and exclude administrative and clerical staff)22 are affected by changes in numbers to pupils, teachers and support staff. Recent trends show:
• In England, PTRs in both primary and secondary schools decreased by around 8% since 2005 (i.e. there are now fewer pupils per teacher). The corresponding reduction to PARs in both phases was 14% - due to increasing numbers of support staff. Figures for secondary academies are virtually identical to secondary maintained schools.
• In Wales, primary and secondary PTRs have remained broadly flat since 2005. PARs have decreased by 24% in primary schools and 12% in secondaries (i.e. there are now fewer pupils per adult due to increases in support staff numbers).
Initial Teacher Training
3.28 Incentives are available to teacher trainees in both England and Wales. Financial support is focused on priority subjects and the recruitment of high-calibre candidates with the precise amounts available reflecting these variables. Examples in England include bursaries ranging from £4,000 to £20,000 (the latter for trainees with a first class degree in chemistry, physics or maths) and competitive scholarships of up to £25,000 to support recruitment to maths, physics, chemistry and computer science. In Wales, bursaries range from £1,000 to £20,000 (the latter for trainees with a first class degree (or 2:1 in physics) who are entering training to teach maths, physics and chemistry).
Recruitment against target
3.29 The Department uses its Teacher Supply Model (TSM) to calculate the target number of ITT places required to match the future supply of teachers to the estimated demand for qualified teachers within the state funded sector in England. The model simulates flows
20 OME analysis of Welsh Assembly Pupil Projections statistics published in School Statistics Compendium 2013.21 OME analysis of DfE School Workforce statistics and Welsh Government Schools Census statistics. Covers period
to 2012.22 OME analysis of DfE school workforce statistics and Welsh Government Schools Census data for 2012.
40471_00_all.indb 25 06/06/2014 14:22
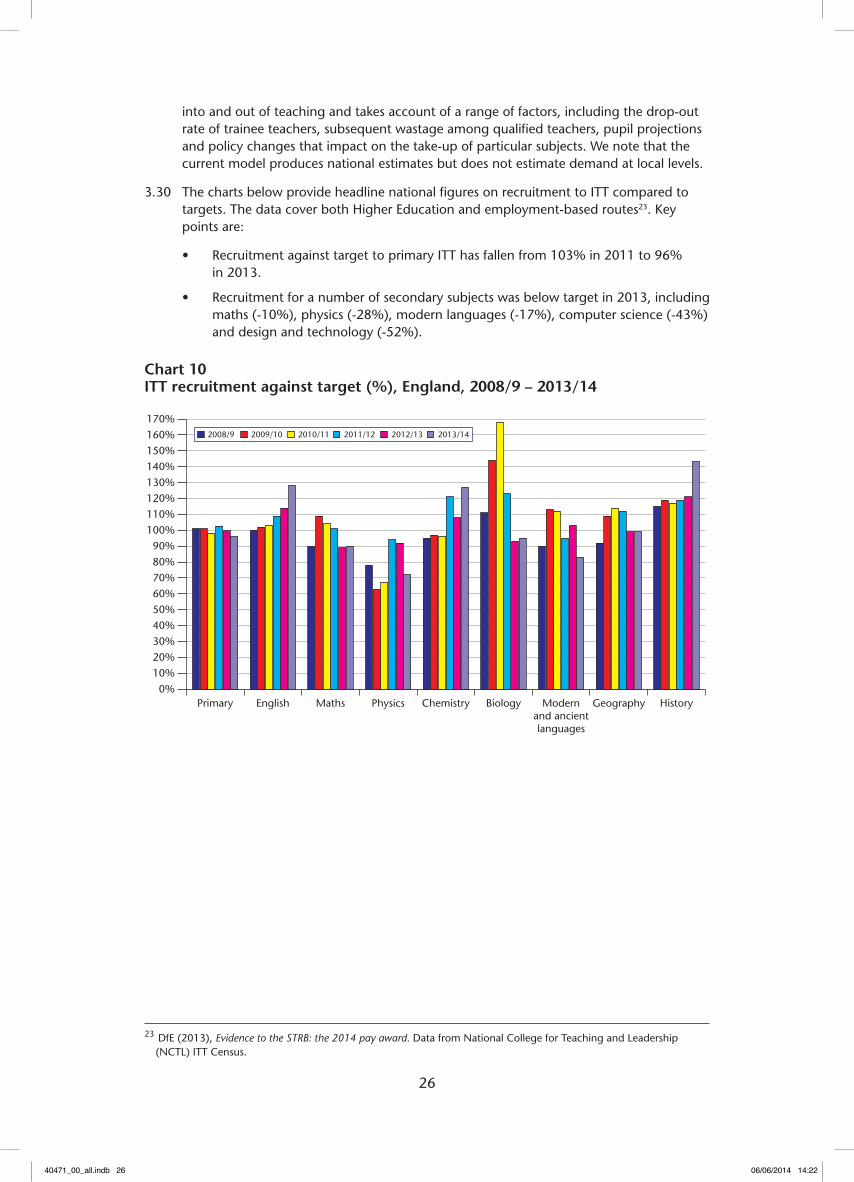
26
into and out of teaching and takes account of a range of factors, including the drop-out rate of trainee teachers, subsequent wastage among qualified teachers, pupil projections and policy changes that impact on the take-up of particular subjects. We note that the current model produces national estimates but does not estimate demand at local levels.
3.30 The charts below provide headline national figures on recruitment to ITT compared to targets. The data cover both Higher Education and employment-based routes23. Key points are:
• Recruitment against target to primary ITT has fallen from 103% in 2011 to 96% in 2013.
• Recruitment for a number of secondary subjects was below target in 2013, including maths (-10%), physics (-28%), modern languages (-17%), computer science (-43%) and design and technology (-52%).
Chart 10 ITT recruitment against target (%), England, 2008/9 – 2013/14
0%10%20%30%40%50%60%70%80%90%
100%110%120%130%140%150%160%170%
HistoryGeographyModernand ancientlanguages
BiologyChemistryPhysicsMathsEnglishPrimary
2008/9 2009/10 2010/11 2011/12 2012/13 2013/14
23 DfE (2013), Evidence to the STRB: the 2014 pay award. Data from National College for Teaching and Leadership (NCTL) ITT Census.
40471_00_all.indb 26 06/06/2014 14:22
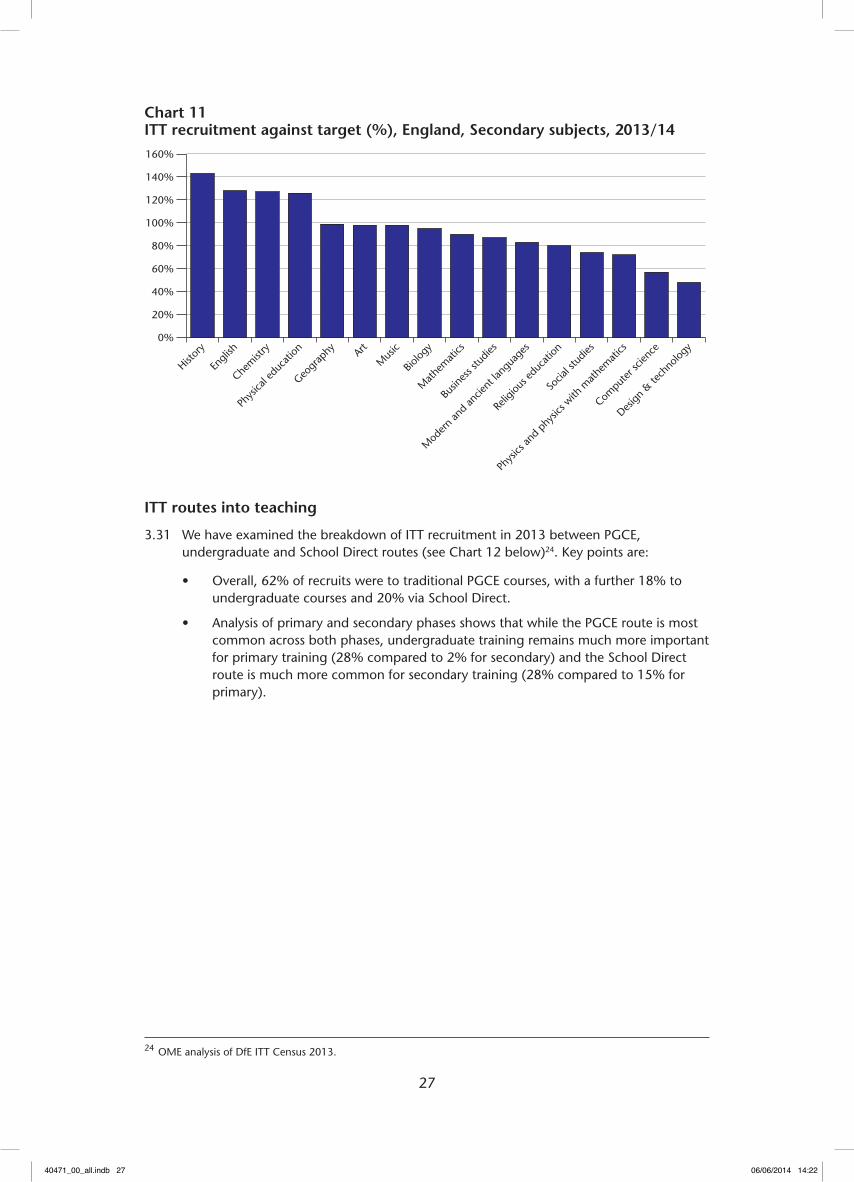
27
Chart 11 ITT recruitment against target (%), England, Secondary subjects, 2013/14
0%
20%
40%
60%
80%
100%
120%
140%
160%
Design
& te
chno
logy
Compu
ter sc
ience
Phys
ics an
d ph
ysics
with
math
emati
cs
Socia
l stu
dies
Relig
ious e
duca
tion
Mod
ern an
d an
cient
lang
uage
s
Busin
ess s
tudie
s
Math
emati
cs
Biolog
yM
usicArt
Geogr
aphy
Phys
ical e
duca
tion
Chem
istry
Engli
sh
Histor
y
ITT routes into teaching
3.31 We have examined the breakdown of ITT recruitment in 2013 between PGCE, undergraduate and School Direct routes (see Chart 12 below)24. Key points are:
• Overall, 62% of recruits were to traditional PGCE courses, with a further 18% to undergraduate courses and 20% via School Direct.
• Analysis of primary and secondary phases shows that while the PGCE route is most common across both phases, undergraduate training remains much more important for primary training (28% compared to 2% for secondary) and the School Direct route is much more common for secondary training (28% compared to 15% for primary).
24 OME analysis of DfE ITT Census 2013.
40471_00_all.indb 27 06/06/2014 14:22

28
Chart 12 Recruits to 2013/14 ITT, England, by training route
0%
10%
20%
30%
40%
50%
60%
70%
80%
TotalSecondaryPrimary
Postgraduate Undergraduate School Direct
Gender, age and ethnicity of recruits to ITT (England 2013/14)
3.32 Looking at gender, 21% of recruits to primary ITT and 38% of recruits to secondary ITT were men. The corresponding percentages for the whole teacher workforce in England are 14% and 38% respectively but we note that the proportion of men teaching in secondary schools has decreased markedly in the last 20 years25. This may reflect a perception that salaries in the profession are not sufficiently attractive.
3.33 Overall, 45% of recruits to ITT were 25 or over (and 12% were 35 or over). Higher proportions of older recruits used the School Direct routes, especially the ‘salaried’ variant.
3.34 While 12% of new recruits were of Black and Ethnic Minority (BME) origin, broadly in line with profile of the wider teaching workforce, this is significantly lower than the school age population where BME groups make up some 24% of the population26.
Initial Teacher Training in Wales
3.35 The Welsh Government has continued to reduce ITT places. As chart 13 demonstrates, overall intake numbers have reduced significantly since 2004/5 following a review of ITT provision in Wales and based on evidence of past oversupply of teachers. The Welsh Government’s assessment is that ITT intake numbers should be retained at current levels for 2014/1527.
25 OME analysis of historic workforce data: 52% of UK secondary teachers in 1990/91 were men. See DfE (2013), Education and training statistics for the UK: 2013 (Table 1.3).
26 OME analysis of ONS population estimates (age 0-19).27 DfE (2013), Evidence to the STRB: the 2014 pay award.
40471_00_all.indb 28 06/06/2014 14:22
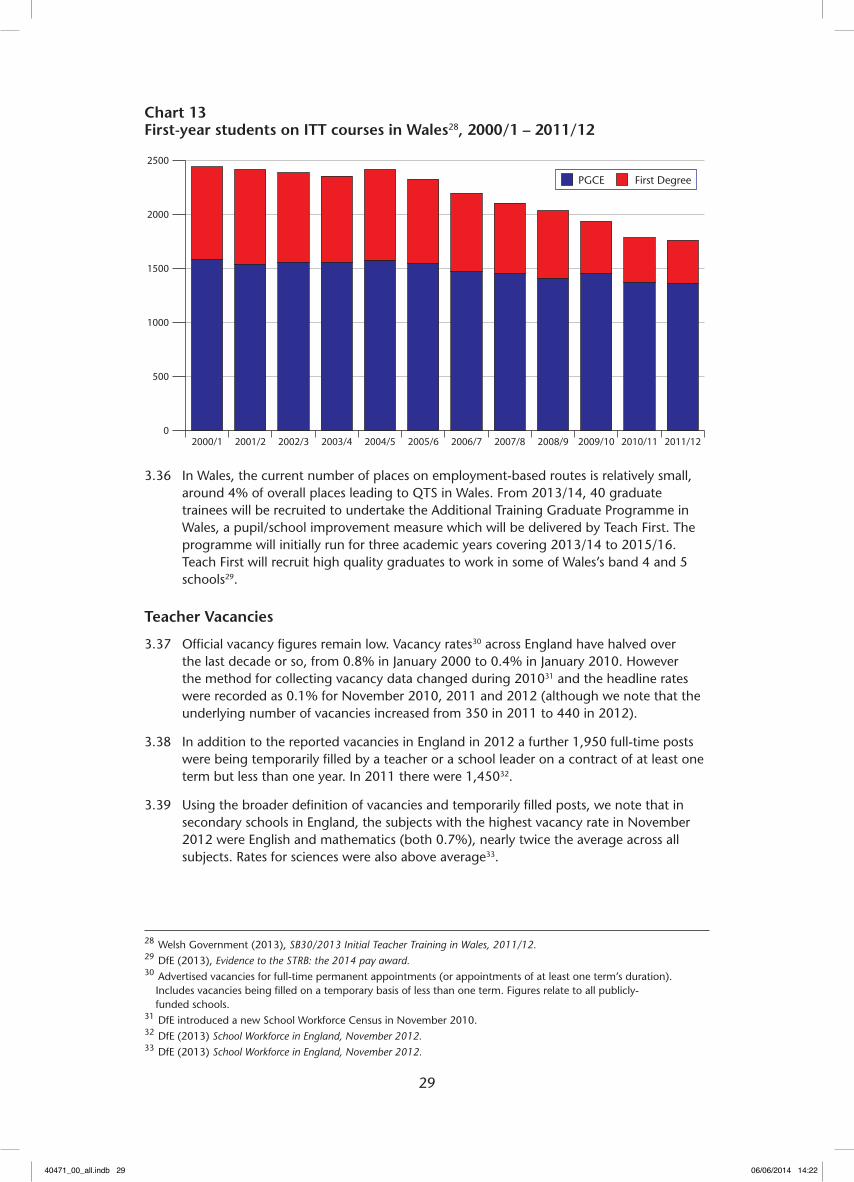
29
Chart 13 First-year students on ITT courses in Wales28, 2000/1 – 2011/12
0
500
1000
1500
2000
2500
2011/122010/112009/102008/92007/82006/72005/62004/52003/42002/32001/22000/1
PGCE First Degree
3.36 In Wales, the current number of places on employment-based routes is relatively small, around 4% of overall places leading to QTS in Wales. From 2013/14, 40 graduate trainees will be recruited to undertake the Additional Training Graduate Programme in Wales, a pupil/school improvement measure which will be delivered by Teach First. The programme will initially run for three academic years covering 2013/14 to 2015/16. Teach First will recruit high quality graduates to work in some of Wales’s band 4 and 5 schools29.
Teacher Vacancies
3.37 Official vacancy figures remain low. Vacancy rates30 across England have halved over the last decade or so, from 0.8% in January 2000 to 0.4% in January 2010. However the method for collecting vacancy data changed during 201031 and the headline rates were recorded as 0.1% for November 2010, 2011 and 2012 (although we note that the underlying number of vacancies increased from 350 in 2011 to 440 in 2012).
3.38 In addition to the reported vacancies in England in 2012 a further 1,950 full-time posts were being temporarily filled by a teacher or a school leader on a contract of at least one term but less than one year. In 2011 there were 1,45032.
3.39 Using the broader definition of vacancies and temporarily filled posts, we note that in secondary schools in England, the subjects with the highest vacancy rate in November 2012 were English and mathematics (both 0.7%), nearly twice the average across all subjects. Rates for sciences were also above average33.
28 Welsh Government (2013), SB30/2013 Initial Teacher Training in Wales, 2011/12.29 DfE (2013), Evidence to the STRB: the 2014 pay award.30 Advertised vacancies for full-time permanent appointments (or appointments of at least one term’s duration).
Includes vacancies being filled on a temporary basis of less than one term. Figures relate to all publicly-funded schools.
31 DfE introduced a new School Workforce Census in November 2010.32 DfE (2013) School Workforce in England, November 2012.33 DfE (2013) School Workforce in England, November 2012.
40471_00_all.indb 29 06/06/2014 14:22
30
3.40 The vacancy rate for school leaders in England in 2012 (0.2%) was slightly higher than the headline rate across the profession. We also note wider analysis showing that, in 2011/12, some 18% of head teacher vacancies in England required a re-advertisement, with the rate higher in London and the South East (22% and 27% respectively)34. More recent data suggest that 26% of primary schools advertising for a new head teacher in January 2013 needed to re-advertise (44% in London) 35.
3.41 The headline vacancy rate in Wales (using a different methodology) has been stable over recent years and was 0.3% in 2013 (very slightly lower than 2012)36. The statistics for advertised vacancies in Wales show that between 1 January and 31 December 2012, 788 teacher vacancies were advertised for primary schools with an average of 25 applications received per vacancy for every post advertised; 882 teacher vacancies were advertised for secondary schools with an average of 12 applications received per vacancy37.
Newly released vacancy data for England
3.42 The DfE released new vacancy data for England, collected in November 2013, just prior to the completion of this report. It shows that the headline vacancy rate has increased since 2012 from 0.1% to 0.2% (from 440 to 750 full-time vacancies). In addition to these vacancies, a further 2,330 full-time posts were being temporarily filled by a teacher or leader on a contract of at least one term but less than one year (the corresponding number in 2012 was 1,950).
3.43 As we have commented previously, we are conscious that aggregate vacancy rates should be treated with some caution as they can mask a number of issues:
• They can conceal localised variation in vacancies.
• They are unable to capture whether a school has recruited the required quality or experience of teacher; for example, our visits have suggested to us that some schools have advertised unsuccessfully for more experienced staff.
• The official rates also mask problems with the availability of sufficient suitably qualified specialist subject teachers. We note with concern that the average percentage of hours taught by teachers holding a relevant post A-level qualification varies considerably and can be low; examples are English (85%), maths (82%), chemistry (80%), physics (74%)38. We comment in paragraph 3.57 on the challenge for schools to consider how to make best use of limited specialist resource.
Teacher wastage and retention
3.44 Teacher wastage (qualified teachers leaving the profession) has been broadly stable at between 8 and 10% between 2004/5 and 2010/11 (the latest year for which data are available). Wastage was highest in the South West in 2010/11 but was otherwise broadly similar across England.
3.45 We have examined recent trends in the retention rates of teachers. We are conscious that headline retention rates depend on the starting point of the calculation, i.e. teacher trainees or teachers newly in post. We have examined these separately.
34 Pearson Think Tank (2012), Are we running out of teachers?35 2013 Times Educational Supplement (17 May 2013) citing Education Data Surveys.36 Welsh Government (2013), Teachers in Service, Vacancies and Sickness Absence, January 2013.37 DfE (2013), Evidence to the STRB: the 2014 pay award, para. C24.38 DfE (2013) School Workforce in England, November 2012.
40471_00_all.indb 30 06/06/2014 14:22
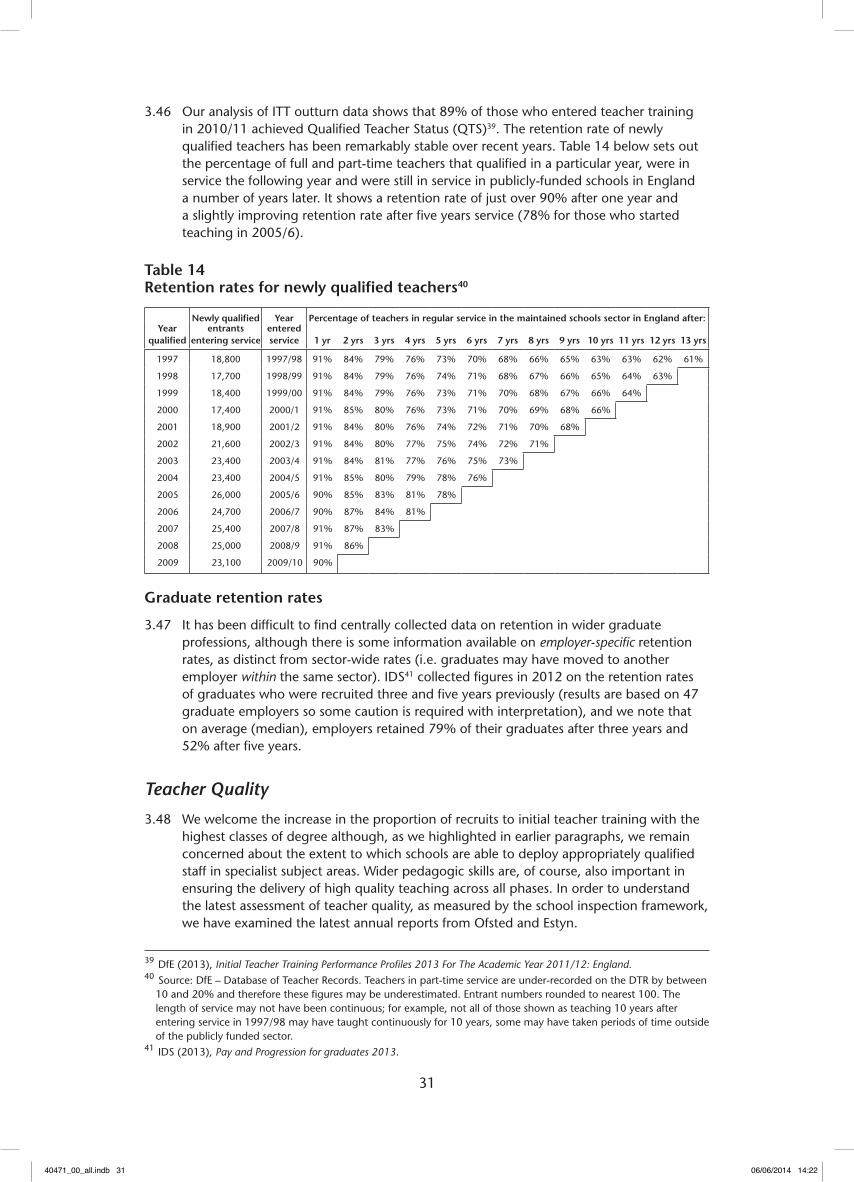
31
3.46 Our analysis of ITT outturn data shows that 89% of those who entered teacher training in 2010/11 achieved Qualified Teacher Status (QTS)39. The retention rate of newly qualified teachers has been remarkably stable over recent years. Table 14 below sets out the percentage of full and part-time teachers that qualified in a particular year, were in service the following year and were still in service in publicly-funded schools in England a number of years later. It shows a retention rate of just over 90% after one year and a slightly improving retention rate after five years service (78% for those who started teaching in 2005/6).
Table 14 Retention rates for newly qualified teachers40
Newly qualified Year Percentage of teachers in regular service in the maintained schools sector in England after:Year
qualifiedentrants
entering serviceentered service
1 yr
2 yrs
3 yrs
4 yrs
5 yrs
6 yrs
7 yrs
8 yrs
9 yrs
10 yrs
11 yrs
12 yrs
13 yrs
1997 18,800 1997/98 91% 84% 79% 76% 73% 70% 68% 66% 65% 63% 63% 62% 61%
1998 17,700 1998/99 91% 84% 79% 76% 74% 71% 68% 67% 66% 65% 64% 63%
1999 18,400 1999/00 91% 84% 79% 76% 73% 71% 70% 68% 67% 66% 64%
2000 17,400 2000/1 91% 85% 80% 76% 73% 71% 70% 69% 68% 66%
2001 18,900 2001/2 91% 84% 80% 76% 74% 72% 71% 70% 68%
2002 21,600 2002/3 91% 84% 80% 77% 75% 74% 72% 71%
2003 23,400 2003/4 91% 84% 81% 77% 76% 75% 73%
2004 23,400 2004/5 91% 85% 80% 79% 78% 76%
2005 26,000 2005/6 90% 85% 83% 81% 78%
2006 24,700 2006/7 90% 87% 84% 81%
2007 25,400 2007/8 91% 87% 83%
2008 25,000 2008/9 91% 86%
2009 23,100 2009/10 90%
Graduate retention rates
3.47 It has been difficult to find centrally collected data on retention in wider graduate professions, although there is some information available on employer-specific retention rates, as distinct from sector-wide rates (i.e. graduates may have moved to another employer within the same sector). IDS41 collected figures in 2012 on the retention rates of graduates who were recruited three and five years previously (results are based on 47 graduate employers so some caution is required with interpretation), and we note that on average (median), employers retained 79% of their graduates after three years and 52% after five years.
Teacher Quality
3.48 We welcome the increase in the proportion of recruits to initial teacher training with the highest classes of degree although, as we highlighted in earlier paragraphs, we remain concerned about the extent to which schools are able to deploy appropriately qualified staff in specialist subject areas. Wider pedagogic skills are, of course, also important in ensuring the delivery of high quality teaching across all phases. In order to understand the latest assessment of teacher quality, as measured by the school inspection framework, we have examined the latest annual reports from Ofsted and Estyn.
39 DfE (2013), Initial Teacher Training Performance Profiles 2013 For The Academic Year 2011/12: England.40 Source: DfE – Database of Teacher Records. Teachers in part-time service are under-recorded on the DTR by between
10 and 20% and therefore these figures may be underestimated. Entrant numbers rounded to nearest 100. The length of service may not have been continuous; for example, not all of those shown as teaching 10 years after entering service in 1997/98 may have taught continuously for 10 years, some may have taken periods of time outside of the publicly funded sector.
41 IDS (2013), Pay and Progression for graduates 2013.
40471_00_all.indb 31 06/06/2014 14:22
32
3.49 Ofsted’s latest annual report42 reported that children in England now have the best chance they have ever had of attending a good school with more schools and academies inspected in 2012/13 judged good or outstanding than in the previous year. It found that the proportion of children attending good or outstanding primary schools had increased in 2012/13, including in some of the previously weakest local authority areas. However, it did report major concerns over secondary school provision in a number of local authority areas, noting in particular that in 13 local authorities, less than half of secondary students attend a good or outstanding school.
3.50 Ofsted reported that the quality of teaching in individual lessons was good or outstanding in 71% of primary lessons and 69% of secondary lessons. It said though, that English and mathematics were not taught well enough, with around a third of lessons observed by inspectors over the previous four years being judged as less than good for the quality of teaching in these two key subjects. This was compounded by disproportionately poorer teaching in the lower sets.
3.51 Estyn’s annual report43 reported that standards in primary schools were similar to the previous year with seven in ten inspected in 2012/13 graded as good and around one in four as adequate. However, over the last three years, the proportion of schools where teaching was adequate or unsatisfactory overall had increased from 18% in 2010/11 to 26% in 2012/13. Standards in secondary schools were more variable with fewer than half graded as good or better, and the proportion judged unsatisfactory increasing from one in seven to one in four. Teaching in the most recently inspected secondary schools was good or better in only just over half of schools. Standards in all special schools were good or excellent.
Concluding comments
3.52 Our analysis of the labour market coincides with a number of important contextual developments. There are continuing changes to the school landscape in the form of growing numbers of academies and other structural changes such as the evolution of school clusters or federations. As we noted in our 23rd Report, academies in particular are impacting on the labour market for teachers and leaders. Increasing demand from schools abroad is another feature of the market.
3.53 Schools are also affected by the fiscal climate: the overall schools’ budget has remained flat in cash terms44 and our analysis of funding figures demonstrated a wide variation in per-pupil funding, both between and within the four geographic pay band areas. The Department has announced additional funding for the 2015/16 financial year to help schools in the least fairly funded local authorities45. We note this is for one year only and as consultees stressed in their evidence there remains the need for a revised national funding formula for the longer term. We also note that forthcoming changes requiring employers to increase their contribution to meet the costs of pensions will accentuate the affordability challenge for schools.
3.54 Our analysis has shown that while some aggregate measures of recruitment and retention have remained stable in a generally subdued labour market, these can mask local labour market challenges. We have identified some worrying signs in the recent data on initial training such as the below-target numbers of recruits to both primary and a number of secondary subject areas and have noted consultees’ concerns about the ability of the School Direct model to meet the demands of primary schools. In this context, we note
42 Ofsted (2013), Annual Report 2012/13.43 Estyn (2013), Estyn Annual Report 2012/13.44 Excludes Pupil Premium payments.45 David Laws (13 March 2014) Oral statement to Parliament on minimum funding levels. <https://www.gov.uk/
government/speeches/david-laws-oral-statement-on-minimum-funding-levels>
40471_00_all.indb 32 06/06/2014 14:22
33
that the DfE has significantly increased the proportion of ITT places to be filled via the School Direct route in 2014/1546. It will be important that the scheme is able to respond to demand both in terms of school phase and geographical location. The increase in reported vacancies and the apparent shortage of suitably qualified subject teachers in secondary schools, evidenced by the proportion of hours taught by teachers with the relevant subject qualification, are a concern. As the wider economy shows signs of recovery, it will be particularly important to keep a close eye on recruitment trends, both in terms of quantity and quality.
3.55 We have also noted the significant impending increase in demand for teachers as increased numbers of pupils flow through the school system. As we have remarked previously, the intensity of these pressures on the labour market varies considerably, both between regions and, frequently, between localities within regions. These developments, coinciding with clear indications of a recovering graduate labour market, mean there is a real challenge for the sector in preserving the attractiveness of teaching as a preferred profession for good graduates.
3.56 As this chapter has identified, there is clear and consistent evidence that both the starting and profession-wide pay of teachers is less competitive relative to other professional occupations in several areas of the country, and that this gap is widening. Our evidence also suggests able graduates in other professions progress more quickly in the first three to five years and have more opportunity to reach higher levels of earnings as their careers progress subsequently. This heightens the risk of those in the profession feeling under-valued and recruitment and retention suffering as a consequence.
3.57 The reforms to the pay framework in our recent reports have aimed to provide individual schools with greater freedoms within the national pay framework. These include the option to pay new teachers above the minimum, to accelerate the pay progression of the highest performers through the main ranges and to move teachers more easily into higher ranges. We hope, and expect, that this additional flexibility will go some way to helping schools address the particular localised labour market challenges they face. School leaders will need to consider how best to use their limited budgets, and available specialist staff, to gain the right balance between quality and numbers of staff, in order to deliver the highest quality provision. This may call for consideration of innovative structures and sharing of expertise across schools. However, these changes may not be sufficient to meet the wider supply and demand challenges in the medium term.
3.58 This remit is the latest of several that have taken place against a backdrop of public sector pay restraint. Our analysis of the teacher labour market has highlighted areas of risk; this is despite the recent relatively benign climate for teacher recruitment and retention given the wider economic landscape. It is our view that these risks will be heightened as the economy strengthens and both graduates and existing teachers see wider employment opportunities. In this context, we would like to receive a future remit enabling a fuller review of the teachers’ pay framework as soon as Government priorities permit. Such a review could examine the overall effectiveness of the framework in providing attractive career paths and pay levels which are competitive with other graduate professions. This would help safeguard the ability of the profession to continue to both recruit good graduates and to retain the excellent teachers who are already developing their careers.
46 DfE Press Release December 2013, Provisional initial teacher training allocations 2014/15. Release shows that the provisional number of School Direct places will increase to 15,400 in 2014 from 9,600 in 2013.
40471_00_all.indb 33 06/06/2014 14:22

34
40471_00_all.indb 34 06/06/2014 14:22
35
CHAPTER 4
Teachers’ pay: our conclusions and recommendations
The context set by recent reforms
4.1 As we noted in Chapter 1, this is the first remit in which our recommendations apply to the reformed pay framework, reflecting the changes set out in our 21st and 23rd Reports. The main changes affecting classroom teachers, which came into effect from September 2013, were:
• the extension of performance-related pay progression to all;
• abolition of mandatory pay points within the pay ranges;
• a new leading practitioner pay range to enable the very best teachers to stay in the classroom; and
• greater discretion for schools in the use of allowances.
Other changes, which apply to leadership pay from September 2014, are:
• a new national framework for local decisions, taking account of the circumstances of the school and challenge of the role;
• removal of complex rules on starting pay and differentials within the leadership group; and
• abolition of fixed pay points within broad pay bands.
4.2 This means that schools now have substantially greater freedoms in setting individuals’ pay and allowances, and in differentiating pay progression for individuals according to performance. In September 2013 schools were required to set out in their pay policies how progression awards would be made in the coming year. The first decisions on such awards will be made in September 2014, based on appraisal of performance in the 2013/14 academic year. This represents a significant change in the context for considering a pay remit. When we recommended a pay uplift last year it was applied to the fixed, nationally set, pay points that had been in place for many years.
4.3 In considering our approach to this remit, we have been guided by the principles set out in our 21st and 23rd Reports. Taken together, their recommendations provide schools with increased autonomy to attract, reward and promote the best talent and to respond to local circumstances, within a broad national framework of pay and conditions, in order to drive school improvement and better outcomes for pupils. This gives school leaders and governing bodies discretion to exercise appropriate professional judgement to respond to local school needs. In particular, the new framework is intended to:
• support efforts to raise the status of the profession, encouraging high calibre graduates and career-changers to come into teaching and retaining able teachers in the profession;
• enable schools to respond to local circumstances and help those facing the greatest challenges to tailor pay so as to attract and retain the most able teachers who can make the greatest impact on pupils’ progress;
• promote performance improvement and encourage teachers to develop and improve their teaching skills;
40471_00_all.indb 35 06/06/2014 14:22
36
• support multiple career pathways, with incentives for some of the very best teachers to stay in the classroom leading pedagogy and for able teachers to seek early promotion into management roles;
• provide a clear and workable approach to help governing bodies set pay for school leaders taking into account the challenges and circumstances of individual schools;
• enable appropriate reward allied to accountability for all teachers and school leaders through differentiated progression to reward excellence; and
• simplify the STPCD and make it more transparent so teachers, school leaders and governing bodies can use it with confidence, operating in an environment of greater autonomy.
The national pay framework
4.4 Following the recent reforms, the national framework sets broad bands for all teaching and leadership posts (see diagrammatic representation in Appendix C) and gives schools discretion in setting pay and performance-related progression for individual teachers within the bands. It informs broad expectations in respect of starting salaries, pay progression early in teachers’ careers, reward for responsibilities and the potential pay at senior leadership levels.
4.5 We see a clear distinction between this national framework, which sets pay structures and broad pay ranges for the profession, and decisions taken by schools as they exercise local autonomy within that framework. We regard the national pay framework as being:
• the minima and maxima for all pay ranges1 (unqualified teacher, main, upper, leading practitioner and leadership, including the eight head teacher bands2);
• the minima and maxima for all allowances that have their values set at a national level (i.e. TLR and SEN allowances);
• the definition of, and broad criteria for, other allowances e.g. recruitment and retention, additional payments, residential duties etc; and
• the definition of areas within which schools have discretion to make their own decisions, such as individual progression awards and local levels of allowances.
4.6 These features provide opportunities for teachers to progress through the framework according to skills, roles and performance, with school leaders given responsibility for setting appropriate individual starting pay and determining individual pay awards based on achievement against school objectives. Similarly, governing bodies set a pay range for leadership posts taking into account the circumstances and challenge of the role and determine progression through that range based on performance.
4.7 In conjunction with this autonomy, governing bodies are responsible for ensuring that individual school pay policies set out how the school will exercise its discretion within the framework, and make decisions taking into account local needs, equality considerations and affordability. This includes flexibility to:
• set pay on appointment, including the criteria for appointing to higher salaries and using recruitment and retention payments;
• make individual decisions on progression, including the value of any pay points (if used); and
1 Each pay range currently has four distinct geographic pay bands; England and Wales (excluding the London Area), Inner London, Outer London and the Fringe Area.
2 The broad pay bands as defined in our 23rd Report.
40471_00_all.indb 36 06/06/2014 14:22
37
• award individual allowances, including the levels of any TLR payments and SEN allowances, along with any other locally determined allowances.
4.8 These flexibilities allow schools to take account of their particular circumstances and enable school leaders to attract, reward and retain teachers who are successful in improving pupil outcomes. The exercise of this local discretion and autonomy needs to be underpinned by effective performance management, a strong focus on professional development and high standards of governance. To inform local decisions, schools will need access to timely and relevant data on recruitment, retention and pay levels both at a national and local level, including comparators with similar schools. As the wider market for graduates becomes more competitive, and more academy schools use their greater freedoms on pay, it will be increasingly important for maintained schools to make full use of the new flexibilities, to attract and retain high calibre graduates and talented leaders.
4.9 As set out above, the reforms arising from our recent reports mean the pay framework now combines broad parameters at a national level with local flexibility. This inevitably impacts on the work of the Review Body which will need to take into consideration schools’ greater autonomy, whilst ensuring that the national pay framework takes account of:
• the competitiveness of the teaching profession in relation to the graduate labour market in order to ensure an adequate supply of suitably qualified teachers and the retention of highly able and experienced teachers and leaders; and
• appropriate incentives for performance improvement and for taking on key roles, including leadership.
4.10 Consistent with our current approach, we would expect future reviews to take into account a wide range of evidence, as they have done in the past. This could include pay levels and structures for other graduate professions; teacher supply (recruitment into ITT and from ITT into teaching, ease of filling vacancies and specific roles, retention and wastage); demand (expected trends in pupil numbers, curriculum changes and specialist subject demand) and affordability (particularly given the differing levels of school funding). Reviews would also need to take account of the considerable flexibility now available to schools to respond to local recruitment and retention pressures and to differentiate progression according to performance.
Pay review for 2014
4.11 In this remit we were asked to consider how to apply a 1% pay award for 2014, and to recommend both adjustments to the salary and allowance ranges and adjustments to salaries and allowances in payment. As we have noted above, this September (2014) schools will be making their first progression decisions, based on performance in the 2013/14 academic year. Accordingly, this is a transitional year and we recognise schools will be at different stages of developing their approaches to pay, with many still using the discretionary reference points set out in DfE advice to schools last year. We have therefore taken a pragmatic approach in setting out how an uplift should be applied this year.
Level of uplift to the national pay framework
4.12 We examined first whether the evidence pointed towards an uplift higher than 1%. Many consultees presented evidence on the impact of inflation and increased costs of pension contributions on teachers’ take-home pay. They made clear they believed there was a justification for a cost of living uplift to the pay ranges and that the Department’s proposed 1% award would be wholly inadequate. As we have noted previously, the cost of living (as measured by inflation) is only one of a number of considerations
40471_00_all.indb 37 06/06/2014 14:22
38
that employers typically take into account when determining pay levels. Our primary consideration is whether salaries are at an appropriate level to recruit high calibre graduates and retain experienced, able teachers.
4.13 As we set out in Chapter 3, while some aggregate measures of recruitment and retention have remained fairly stable we have noted a range of emerging pressures on recruitment and pay. Our analysis of the wider graduate labour market showed that the picture varied between regions and that aggregate measures masked local labour market challenges. In some parts of the country, pay remains at a level which makes teaching attractive and a preferred profession for good graduates, while in others pay for teachers is less competitive. As the wider economy recovers, demand from other sectors is likely to accentuate emerging recruitment and retention pressures. It will be important for schools to use the full flexibility they now have to respond to local market challenges.
4.14 It is also clear that the profession needs to respond to increasing pupil numbers, with some localities showing particularly marked projected increases. Many schools already face particular recruitment challenges in, for example, STEM subjects3. Strategies such as the targeting of training bursaries are now in place, and again, the new pay framework gives schools tools to tackle emerging local pressures. However, the shortage of graduates in these subjects means that pay may not be the whole answer. As we noted in Chapter 3, school leaders will need to consider how best to use limited budgets and available specialist staff to deliver high quality specialist provision, if necessary developing innovative structures and sharing expertise.
4.15 As we noted in Chapter 3, pay progression in other graduate professions can be faster than that previously available in schools when they were constrained by rigid pay increments. This underlines the importance of schools using the full scope of their new discretion to progress the best performing teachers rapidly through the main, upper and, where used, leading practitioner pay ranges to incentivise and retain them, and make clear the potential beyond that to match pay to the challenge of leadership roles.
4.16 On affordability, the Department’s evidence made clear that school budgets are flat per pupil in cash terms in England and schools will need to fund any pay awards from existing budgets. The Welsh Government had budgeted for expenditure per pupil to increase by 1.3%, although in oral evidence it recognised that there were difficult budget issues for individual schools, particularly those with deficit budgets. We noted NEOST’s concern over the affordability of any pay award when school budgets were falling in real terms, creating cost pressures. Several consultees recognised that there were likely to be staff redundancies as schools tried to manage the cost of any pay award in already stretched school budgets.
4.17 We acknowledge the significant affordability pressures on schools and the considerable variation in per pupil budgets between individual schools according to circumstances, including as a result of historic funding patterns. In considering this remit we were also asked to have regard to the Government’s policy that public sector pay awards should average 1%. We note the considerable variation in labour market challenges, both between regions and, frequently, between localities within regions. The evidence shows that in some parts of the country teacher pay remains competitive; where this is not the case schools now have significant scope to respond to emerging pressures at local level with pay flexibility, where budgets permit.
4.18 Taking account of all the evidence, we recommend, on balance, a 1% uplift of the national framework. This uplift should be applied to the minima and maxima of all the pay ranges and allowances in the national pay framework (unqualified
3 STEM: Science, Technology, Engineering and Maths
40471_00_all.indb 38 06/06/2014 14:22

39
teachers’ range, main pay range, upper pay range, leading practitioner pay range and the leadership pay range, including the minima and maxima of the eight head teacher pay bands, the three levels of Teaching and Learning Responsibility (TLR) payments and the Special Educational Needs (SEN) allowance).
Application of an uplift to the national pay framework to salaries and allowances in payment
4.19 The Department proposed that the 1% pay award should be applied to the minima and maxima of the pay ranges only, and that schools should be free to determine the extent of pay uplift to teachers within the minima and the maxima, and should be able to provide an uplift of 1%, if they so choose. We received strong representations from consultees that, in their view, the pay uplift award should be separate from performance, and should apply uniformly, across the board to all teachers.
4.20 In principle we consider any individual pay award should take account of performance, within the parameters of any adjustment to the national framework. We recognise this is a transitional year, and that schools need to gain confidence in using the pay flexibilities now available, in particular managing differentiated performance-based progression and responding to local pressures. It may therefore help schools if we set out for this remit how we expect the national pay uplift to apply to different groups within the teacher workforce this year. However, we also signal our expectations on greater school autonomy in such decisions from 2015.
Those on individual pay ranges
4.21 School leaders and leading practitioners are paid on individual pay ranges set locally within the national framework. Many will be eligible for performance-related progression increases and again these will be decided by schools4. We therefore consider it appropriate for schools to determine locally how to take account of the uplift to the national framework in such decisions. Schools should also consider how the individual pay ranges should be uplifted in the light of changes to the national framework.
Those on the minima of national pay ranges
4.22 All teachers must be paid between the minimum and maximum of the relevant pay range. We recognise that in September 2014 many teachers currently on a range minimum will receive a progression award, determined in accordance with their performance and school pay policy, which will take them above the uprated minimum. Those remaining on a minimum, including new recruits, will automatically receive a 1% uplift as a result of the revalorisation. The same principle applies to head teachers on the minimum of their broad band.
Those on the maxima of pay ranges
4.23 Around 40% of teachers are on the maxima of their pay range and will typically have been in the school the previous performance year. In principle we consider any pay award for those on the maxima should take account of performance. However, in this initial year the focus of attention in schools will have been on planning for differentiated progression decisions for those below the maximum. For September 2014 we therefore consider it appropriate, in the context of managing transition, to uplift salaries of those on the maxima in line with the 1% uplift to the framework.
4 For simplicity we refer throughout to ‘schools’ taking decisions on pay, to cover both head teacher and governing body responsibilities in the pay determination process.
40471_00_all.indb 39 06/06/2014 14:22
40
4.24 Looking ahead to 2014/15, we regard it as inconsistent with the principle of school autonomy that any recommendations on an uplift to the national framework should be applied automatically to teachers on the maximum of their pay range, regardless of performance. We therefore recommend that the Department make clear that schools should review their pay policies for 2014/15 and set out how pay decisions for those on the maximum in September 2015 will take account of performance in applying any uplift to the national framework.
4.25 In light of this, we recommend that:
• The pay5 of teachers on the minima6 and maxima of their range and of head teachers on the minima and maxima of their pay band be uplifted to the new minima and maxima in September 2014; and
• that the Department make clear that, in revising their pay policies for 2014/15, schools should consider, and set out, how any pay decisions for those on the maxima of pay ranges in September 2015 will take account of performance in applying any uplift to the national framework.
Those between the minima and the maxima of the main and upper pay ranges and treatment of reference points, where applicable
4.26 School pay policies set out how performance-related progression awards will be applied locally. In our 21st Report we recommended the option of retaining the points on the main pay scale in the form of discretionary reference points for a transitional period, to offer schools ‘scaffolding’ whilst adjusting to the use of performance-based progression. We heard from consultees that many schools are using these reference points, which are set out in national advice to schools from DfE. That advice makes clear that schools are free to decide their own pay policies, which may include locally determined pay points, or other arrangements with no points. Some have done so, developing tailored, local arrangements to help them use pay as a tool to support performance improvement and school outcomes.
4.27 The DfE discretionary reference points are not part of the national pay framework. However, we recognise that they reflect the values set in September 2013 and that, for pay decisions in September 2014, it would be logical to uprate them by 1% to maintain their relative positions between the new minimum and maximum. We therefore recommend that DfE should uprate by 1% the reference points in its advice to schools, for the purpose of guiding September 2014 pay decisions.
4.28 Where schools have adopted local arrangements for progression in their pay policies without recourse to the discretionary reference points set out in DfE advice, we are not in a position to make a detailed recommendation on application of an uplift. We therefore recommend that schools who have not adopted the reference points set out in DfE advice consider how to apply the 1% uplift to the national framework to their local pay policy. Similarly, for those teachers on the upper pay range (where there are no reference points) schools will have to consider how to apply the 1% to their local pay policy.
4.29 Looking ahead, we consider it is inconsistent with the principles of school autonomy and differentiated performance-related pay progression to retain indefinitely nationally-set, discretionary reference points. They were intended to support transition to the new arrangements but if retained too long risk undermining school autonomy and stifling innovative approaches to pay progression. Accordingly we recommend that reference
5 Base pay excluding any allowances. The treatment of allowances in payment is dealt with later in the chapter.6 As set out in paragraph 4.22, most teachers on a range minimum will be eligible for an appraisal based award of
more than 1%. Those remaining on a minimum will automatically be moved to the revalorised range minimum.
40471_00_all.indb 40 06/06/2014 14:22
41
points should be removed from Departmental advice following the September 2014 pay decisions. We also recommend that DfE makes clear that all schools should revise their pay policies for 2014/15 and set locally determined arrangements for performance-related progression as a basis for decisions on pay in September 2015, and subsequently.
Allowances in payment
4.30 The values of TLR and SEN allowance ranges are part of the national pay framework and, as recommended above, minima and maxima of each allowance should therefore be uplifted by 1%. Within these ranges, schools set out in their pay policies specific levels of allowances determined by the weight of responsibilities. Since specific levels of allowance must be set within the national pay framework, those set at the TLR and SEN minima should automatically be revalorised to include the 1% uplift. Schools may wish to review the levels and relativities of other TLR and SEN allowances set locally, as part of a wider review of their school pay policies following changes to the national framework.
4.31 The levels, and criteria for payment, of other allowances are set locally and schools are best placed to undertake any review. Consequently we make no recommendation on changes to other allowances, leaving such decisions to schools.
Speed of progression
4.32 In our 21st Report we said that a good teacher on the main pay range should expect to progress to the maximum of the range in around five years. There is emerging evidence that high-performing graduates in other professions progress at a faster rate. In Chapter 3 we noted that graduates typically see their starting pay increase by around 70% after 5 years compared with an increase of just 46% after the same time for classroom teachers, under the previous incremental progression arrangements. We therefore recommend that the Department should make clear in advice to schools the scope for the most able teachers to progress rapidly through the main and upper pay ranges, where justified by consistently excellent performance, to either the leading practitioner or the leadership pay ranges.
Summary of recommendations
4.33 In summary, on application of a pay uplift we recommend:
• a 1% uplift should be applied to the minima and maxima of all the pay ranges and allowances in the national pay framework (unqualified teachers’ range, main pay range, upper pay range, leading practitioner pay range and the leadership pay range, including the minima and maxima of the eight head teacher pay bands, the three levels of Teaching and Learning Responsibility (TLR) payments and the Special Educational Needs (SEN) allowance).
• for those on individual pay ranges7, schools determine locally how to take account of the uplift to the national framework in making individual pay progression decisions and consider how individual pay ranges should be uplifted.
• the pay8 of teachers on the minima and maxima of their range and of head teachers on the minima and maxima of their pay band be uplifted to the new minima and maxima in September 2014.
7 Leading practitioners and teachers in leadership posts.8 Base pay excluding any allowances. The treatment of allowances is covered by separate recommendations.
40471_00_all.indb 41 06/06/2014 14:22

42
• DfE make clear that, in revising their pay policies for 2014/15, schools should consider, and set out, how any pay decisions for those on the maxima of pay ranges in September 2015 will take account of performance in applying any uplift to the national framework.
• DfE uprate by 1% the reference points in its advice to schools, for the purpose of guiding September 2014 pay decisions.
• that schools who have not adopted the reference points set out in DfE advice consider how to apply the 1% uplift to the national framework to their local pay policy.
• that reference points should be removed from DfE advice following the September 2014 pay decisions.
• that DfE make clear that all schools should revise their pay policies for 2014/15 and set locally determined arrangements for performance-related progression as a basis for decisions on pay in September 2015.
• that DfE make clear in advice to schools the scope for the most able teachers to progress rapidly through the main and upper pay ranges, where justified by consistently excellent performance, to either the leading practitioner and leadership pay ranges.
Looking ahead
4.34 We have set out above our recommendations for implementation from September 2014, which will provide schools with greater autonomy on pay decisions. The school landscape will continue to evolve, with increasing numbers of academies and free schools in a position to take advantage of their greater freedoms on pay as they move beyond the immediate challenges of establishment or conversion. There may be further structural changes, such as increased use of federations and other organisational structures that are not readily apparent at present, to enable schools to keep pace with increasing demands, to manage workload and to provide appropriate professional development for teachers. There will be continuing expectations of higher levels of performance, along with further changes to the national curricula.
4.35 The recommendations from our 23rd Report on school leaders’ pay will be implemented from September 2014 along with our recommendations from this report, if accepted. The national pay framework for teachers will then consist of:
• four pay ranges for classroom teachers (unqualified, main, upper and leading practitioner), with minima and maxima;
• the pay range and eight pay bands for school leaders, with minima and maxima;
• the framework for allowances, with minima and maxima for TLRs and SEN allowances, and the definition and broad criteria for other allowances; and
• the definition of areas within which schools have discretion to make their own decisions.
There will no longer be any national pay points within pay ranges9 nor, subject to acceptance of our recommendations, any discretionary reference points. Pay progression should be based on performance and schools will have autonomy to decide their own pay policies within the parameters of the national framework.
9 There are currently four geographic pay bands in each pay range; England and Wales (excluding the London Area), Inner London, Outer London and the Fringe Area.
40471_00_all.indb 42 06/06/2014 14:22
43
4.36 These developments will be challenging for some schools and will involve significant cultural change in the sector. We re-iterate points we have made previously on the need for schools to be supported in using the flexibilities available to them. We note the need for:
• benchmarking data for schools. In line with our comments on the importance of good data to support governance in our 23rd Report, we invite the Department to take steps to address this issue.
• DfE advice on progression expectations. As set out earlier, this should make clear the scope for consistently excellent performers to progress more rapidly.
• schools to ensure they have good quality independent HR advice.
4.37 In many areas there has been a reduction in local authority support for schools on pay matters, including the capacity for monitoring on diversity. We have noted that, even in schools remaining within local authority control, there is a trend to look outside for HR advice. Increasing school autonomy puts a premium on governing bodies securing good advice to provide a sound foundation for fulfilling their responsibilities on the effective oversight of performance management and pay decisions. This includes ensuring individual decisions are properly documented and objectively justified.
4.38 Recent years’ pay constraints have made significant inroads into the competitive position of teaching compared to other graduate professions. As our analysis in Chapter 3 has shown, the competitiveness of both starting pay rates and pay at more senior levels have weakened in many areas of the country. This coincides with an imminent increase in demand for teachers, as growing pupil numbers flow into and through the school system.
4.39 The greater freedoms schools now enjoy on pay will enable them, subject to affordability, to offer competitive starting pay and progress the best teachers more rapidly. This should help them respond effectively to short term pressures. However, recent economic indicators are encouraging, and the wider graduate labour market is recovering. This good news has implications for the teacher labour market, sharpening our concern about the widening gap between teachers’ pay compared to other professional occupations in many parts of the country. We see an emerging risk that teachers’ relative position will deteriorate, accentuating the challenge of responding effectively to the demographic bulge in the school population.
4.40 Against this challenging backdrop we would welcome a future remit to undertake a fuller review of the national pay framework for the profession. The improving graduate labour market combined with potential increases in demand for teachers due to demographic factors, suggest it should not be too long deferred.
4.41 We have commented previously on the need for improved labour market data to allow us to consider trends in teacher supply and demand. In conducting this review, we have drawn on data available from the School Workforce Census which provides detailed earnings data for teachers in England. However, there are a number of areas where better data are required:
• Initial Teacher Training. This requirement assumes greater significance as multiple teacher training routes are established and the balance between the different routes changes. More detailed data on the numbers of applicants, places, acceptances and outcomes relating to the different training routes.
• More up-to-date and granular data on teacher wastage, including information on the reasons for leaving the profession.
• Improved measures of teacher vacancies.
• Pay data for teachers in Wales.
40471_00_all.indb 43 06/06/2014 14:22

44
4.42 It will be important for any future review to have access to improved data in these areas and we urge the Department to give these issues appropriate priority.
Dame Patricia Hodgson, DBE (Chair)
Peter Batley
Jonathan Crossley-Holland
Dan Flint
Debbie Meech
Jill Pullen
Mike Redhouse
Dr Patricia Rice
May 2014
40471_00_all.indb 44 06/06/2014 14:22
APPENDIX A
Remit and directions from the Secretary of State
45
Rt Hon Michael Gove MP Secretary of State
Sanctuary Buildings Great Smith Street Westminster London SWlP 3BT
tel: 0370 000 2288 www.education.gov.uk/help/contactus
Dame Patricia Hodgson OBE Chair School Teachers Review Body Office of Manpower Economics Victoria House Southampton Row London WC1B 4AD 24 October 2013
Dear Patricia,
STRB REMIT: MATTERS FOR REPORT
I would first of all like to repeat my thanks to you and all of the members of the STAB for your continued hard work. From 1 September this year schools across England and Wales have been implementing their new pay policies based on the recommendations of your 21st Report. Schools are now leading the development of new approaches to pay for classroom teachers which will allow them to make the best use of their resources and to raise standards.
Your recommendations have enabled schools to adjust reward packages in response to any recruitment and retention difficulties that they may face. They are able to ensure that their overall pay bill is affordable within their budget, rather than being tied in to year-on-year salary increases over which they have no influence. As well as implementing your recommendations, we are putting Initial Teacher Training into the hands of schools, so that they are directly involved in selecting and recruiting high quality graduates to become teachers.
At the 2011 Autumn Statement, the Government announced its policy that public sector pay awards will average 1 per cent for the two years following the pay freeze. I understand that the Chief Secretary of the Treasury (CST) wrote to you and all other Pay Review Body Chairs on 23 July 2013 to set out the Government's approach to public sector pay.
I would now like to ask for your recommendations on how to apply the pay award in 2014. In accordance with the CST's letter, you will want to consider what awards are justified and in doing so may wish to consider the CSTs comments on recruitment and retention issues; affordability; and the continued need for pay restraint. I intend to submit for your consideration written evidence that the case for continued pay restraint in the public sector remains strong. My evidence will
40471_00_all.indb 45 06/06/2014 14:22
46
provide a detailed account of the teacher labour market based on the latest recruitment and retention data. I will also provide evidence of affordability at national and school level.
Considerations to which the STRB should have regard
In considering your recommendations you should have regard to the following:
a) The need to ensure that the proposals reflect the Government's policy that public sector pay awards average 1 per cent for the two years following the pay freeze;
b) The affordability of any recommendations within the existing budgets of individual schools;
c) The need to ensure that any proposals are not difficult or onerous for schools to implement;
d) Evidence of the national state of teacher and school leader supply, including rates of recruitment and retention, vacancy rates and the quality of candidates applying for Qualified Teacher Status (QTS);
e) Evidence of the wider state of the labour market in England and Wales;
f) Forecast changes in the pupil population and consequent changes in the level of demand for teachers;
g) The Government's commitment to increasing autonomy for all head teachers and governing bodies to establish pay arrangements that are suited to the individual circumstances of their schools.
Matters for recommendation
I refer to the STAB the following matters for recommendation:
a) What adjustments should be made to the salary and allowance ranges and scales for classroom teachers, unqualified teachers and school leaders to reflect the 1 per cent pay award for public sector workers;
b) What adjustments should be made to salaries and allowances in payment.
In order to allow adequate time for consultation before any changes are introduced in September 2014 your report should be with me on or before th 16
2014.
I look forward to your recommendations.
�d\
MICHAEL GOVE
40471_00_all.indb 46 06/06/2014 14:22
APPENDIX B
Letter from the Chief Secretary to the Treasury
47
40471_00_all.indb 47 06/06/2014 14:22
48
40471_00_all.indb 48 06/06/2014 14:22
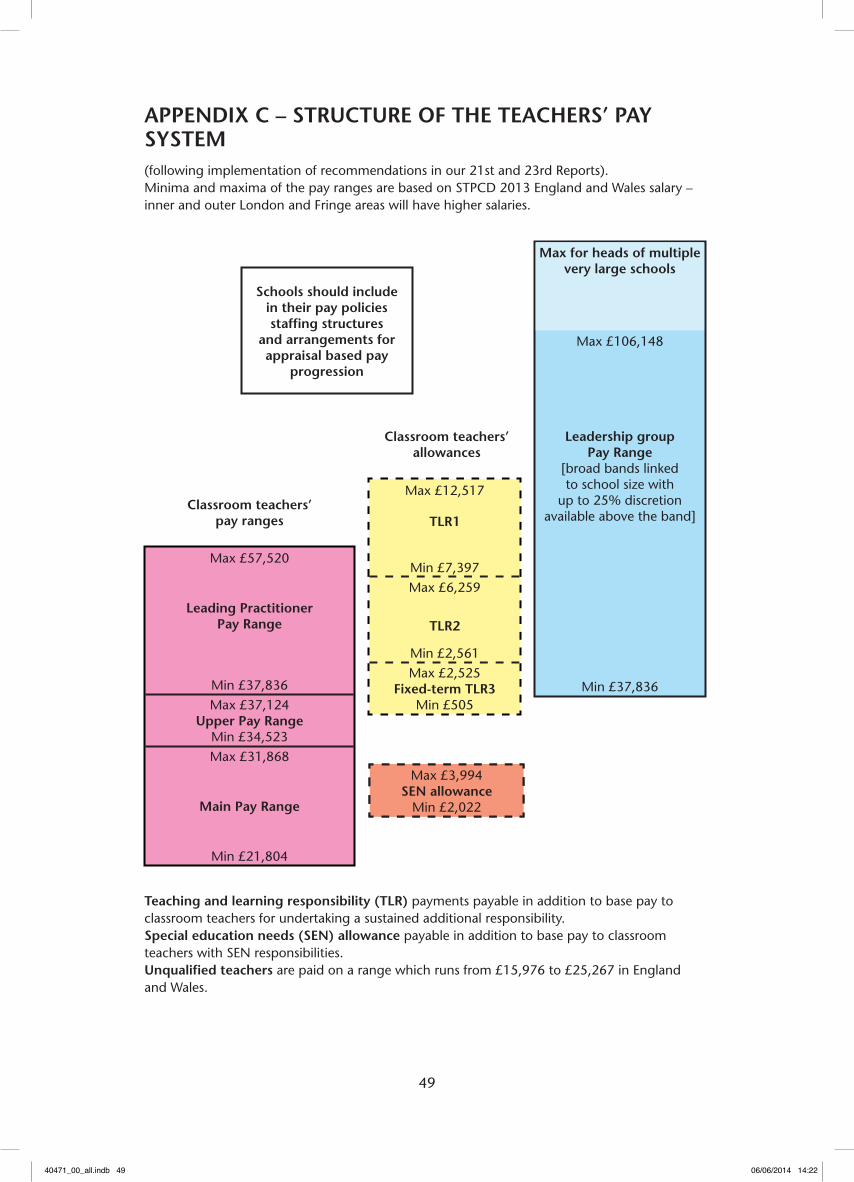
49
APPENDIX C – STRUCTURE OF THE TEACHERS’ PAY SYSTEM(following implementation of recommendations in our 21st and 23rd Reports). Minima and maxima of the pay ranges are based on STPCD 2013 England and Wales salary –inner and outer London and Fringe areas will have higher salaries.
Teaching and learning responsibility (TLR) payments payable in addition to base pay to classroom teachers for undertaking a sustained additional responsibility.Special education needs (SEN) allowance payable in addition to base pay to classroom teachers with SEN responsibilities.Unqualified teachers are paid on a range which runs from £15,976 to £25,267 in England and Wales.
Schools should include in their pay policies staffing structures
and arrangements for appraisal based pay
progression
Max for heads of multiple very large schools
Max £106,148
Leadership group Pay Range
[broad bands linked to school size with
up to 25% discretion available above the band]
Min £37,836
Classroom teachers’ pay ranges
Classroom teachers’ allowances
Classroom teachers’ allowances
Max £3,994SEN allowance
Min £2,022
Max £57,520
Leading Practitioner Pay Range
Min £37,836Max £37,124
Upper Pay Range Min £34,523Max £31,868
Main Pay Range
Min £21,804
Max £12,517
TLR1
Min £7,397Max £6,259
TLR2
Min £2,561Max £2,525
Fixed-term TLR3Min £505
40471_00_all.indb 49 06/06/2014 14:22

50
40471_00_all.indb 50 06/06/2014 14:22
51
APPENDIX D
Conduct of the review
D1. The Secretary of State for Education, the Rt Hon Michael Gove MP, in his remit letter of 24 October 2013 asked us to consider:
• What adjustments should be made to the salary and allowance ranges and scales for classroom teachers, unqualified teachers and school leaders to reflect the 1 per cent pay award for public sector workers; and
• What adjustments should be made to the salaries and allowances in payment.
D2. The Secretary of State’s remit letter, reproduced in Appendix A, asked us to report on these matters by 16 May 2014. The remit letter also asked us to take account of the letter of 23 July 2013, from the Chief Secretary to the Treasury, to all Pay Review Body Chairs (reproduced in Appendix B) which set out the Government’s public sector pay policy. Our work to respond on these matters took place between January and May 2014.
D3. We set out in the body of this report the wide range of evidence we considered. We set out below the statutory consultation we undertook and a range of visits and meetings which informed our broad understanding of the issues.
Consultation
D4. On 25 October 2013 we gave the following organisations the opportunity to make written representations and provide evidence on the matter on which we were due to report:
Government
Department for Education (DfE)Welsh Government
Organisations representing teachersAssociation of School and College Leaders (ASCL)Association of Teachers and Lecturers (ATL)British Association of Teachers of the Deaf (BATOD)National Association of Head Teachers (NAHT)National Association of Schoolmasters Union of Women Teachers(NASUWT)National Union of Teachers (NUT)Undeb Cenedlaethol Athrawon Cymru (UCAC) Voice
Association of local authorities
National Employers’ Organisation for School Teachers (NEOST)
Organisations representing governors
Governors Wales (GW)National Governors’ Association (NGA)
40471_00_all.indb 51 06/06/2014 14:22
52
D5. We also notified the following organisations of our remit:
Agency for Jewish Education
Association of Directors of Children’s Services (ADCS)
Association of Directors of Education in Wales (ADEW)
Association of Professionals in Education and Children’s Trusts (Aspect)
Board of Education, General Synod of the Church of England
Catholic Education Services for England and Wales
Her Majesty’s Inspectorate for Education and Training in Wales (Estyn)
Freedom and Autonomy for Schools – National Association (FASNA)
Free Churches Education Committee
General Teaching Council for Wales (GTCW)
Independent Academies Association
Information for School and College Governors (ISCG)
Methodist Independent Schools Trust
Office for Standards in Education, Children’s Services and Skills (Ofsted)
SSAT (The Schools Network) Ltd
D6. We invited the above consultees to respond in writing by 20 December 2013 and asked them to copy their submissions to other consultees. We gave consultees an opportunity to comment in writing on other consultees’ submissions.
D7. The following consultees made written submissions: ASCL1, ATL2, DfE3, NAHT4, NASUWT5, NEOST6, NGA7, NUT8, UCAC9, Voice10 and the Welsh Government11. In addition we received a submission from the Independent Academies Association.
D8. ASCL, ATL, NAHT, NASUWT, NUT, UCAC, Voice and the Welsh Government each provided a supplementary submission in response to other consultees’ submissions.
D9. We invited the following consultees to make oral representations: ASCL, ATL, DfE, NAHT, NASUWT, NEOST, NGA, NUT, UCAC, Voice and the Welsh Government. All these organisations made individual representations at meetings in February/ March 2014.
1 ASCL (2013) <http://www.ascl.org.uk/news-and-views/consultation-responses_news-detail.school-teachers-review-body-strb-24th-remit-2014-pay-award.html>
2 ATL (2013) <http://www.atl.org.uk/Images/atl-submission-to-STRB-24th-report.pdf>3 DfE (2013) <https://www.gov.uk/government/publications/evidence-to-the-strb-the-2014-pay-award>4 NAHT (2013) <http://www.naht.org.uk/welcome/news-and-media/key-topics/pay-and-conditions/naht-response-to-
the-strb-24th-remit-into-the-1-per-cent-pay-increase/>5 NASUWT (2013) <http://www.nasuwt.org.uk/groups/public/@journalist/documents/nas_download/nasuwt_011880.
pdf>6 NEOST is the representative body for employers of teachers in maintained schools in England and Wales. It draws
members from the Local Government Association, the Welsh Local Government Association, FASNA, the Church of England Board of Education and the Catholic Education Service. NEOST (2013) <http://www.local.gov.uk/workforce-education-and-young-people/-/journal_content/56/10180/3510609/ARTICLE>
7 NGA (2013) <http://www.nga.org.uk/About-Us/NGA-s-Views/Consultation/Evidence-submitted-to-the-STRB-December-2013.aspx>
8 NUT (2013) <http://www.teachers.org.uk/node/20173>9 UCAC (2013) <http://www.athrawon.com/uploads/STRB24.pdf>10 Voice (2013) <http://www.voicetheunion.org.uk/index.cfm?cid=1155>11 Welsh Government (2013) <http://wales.gov.uk/docs/dcells/consultation/131210-written-submission-to-strb-
december-5-2013-en.pdf>
40471_00_all.indb 52 06/06/2014 14:22
53
Visits and Meetings
D10. In total, the Review Body had 10 working meetings between 24 January 2014 and 16 May 2014. We held three additional meetings at which we heard oral representations from consultees.
D11. In considering this remit, the Review Body took account of conversations held with teachers, school leaders, Chairs of Governing Bodies and local authority officials in eighteen local authorities visited over the last three years12.
D12. The Review Body also received a range of briefing relevant to the remit including from Charlie Taylor, Chief Executive of the National College for Teaching and Learning, and Professor John Howson, University of Oxford.
12 Birmingham, Bromley, Caerphilly, Camden, Cardiff, Croydon, Doncaster, Hammersmith and Fulham, Haringey, Hertfordshire, Hull, Leicester, Merton, Monmouthshire, Portsmouth, Sefton, Shropshire, Waltham Forest.
40471_00_all.indb 53 06/06/2014 14:22

54
40471_00_all.indb 54 06/06/2014 14:22
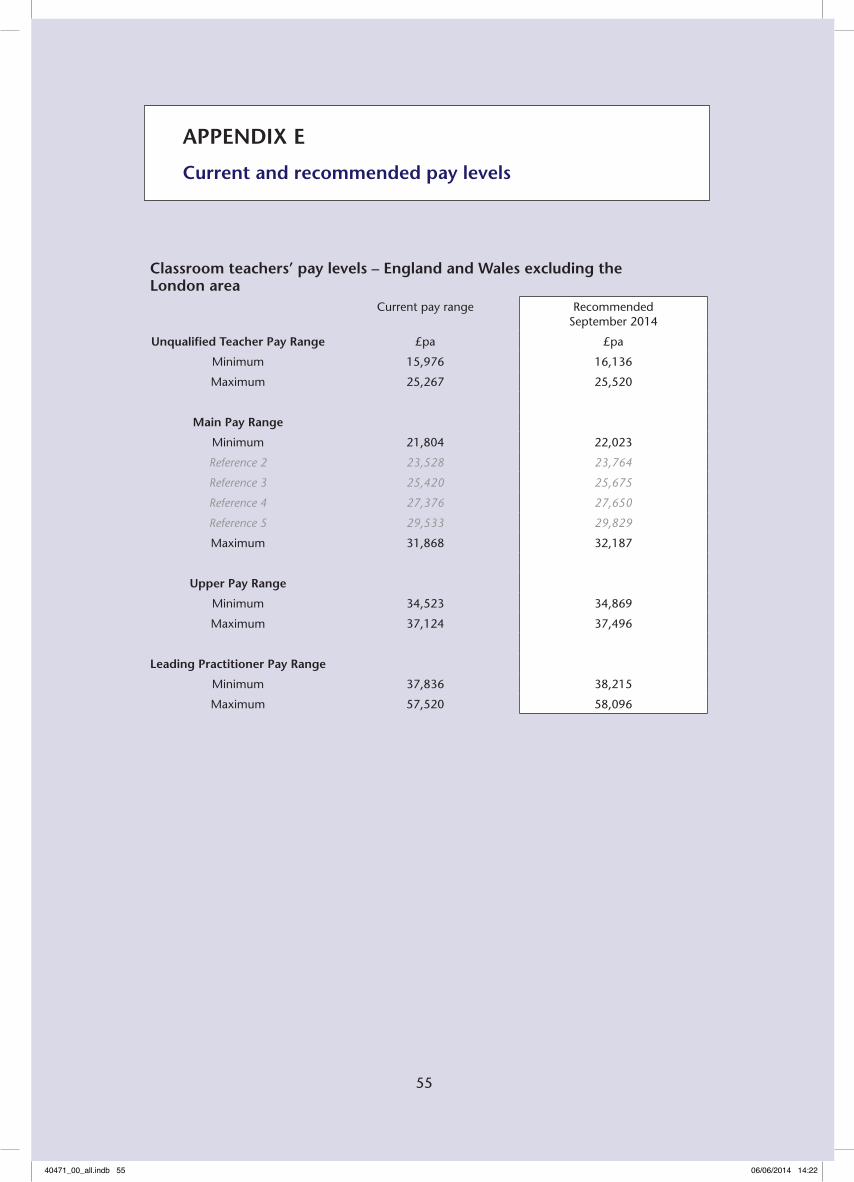
APPENDIX E
Current and recommended pay levels
Classroom teachers’ pay levels – England and Wales excluding the London area
Current pay range Recommended September 2014
Unqualified Teacher Pay Range £pa £pa
Minimum 15,976 16,136
Maximum 25,267 25,520
Main Pay Range
Minimum 21,804 22,023
Reference 2 23,528 23,764
Reference 3 25,420 25,675
Reference 4 27,376 27,650
Reference 5 29,533 29,829
Maximum 31,868 32,187
Upper Pay Range
Minimum 34,523 34,869
Maximum 37,124 37,496
Leading Practitioner Pay Range
Minimum 37,836 38,215
Maximum 57,520 58,096
55
40471_00_all.indb 55 06/06/2014 14:22
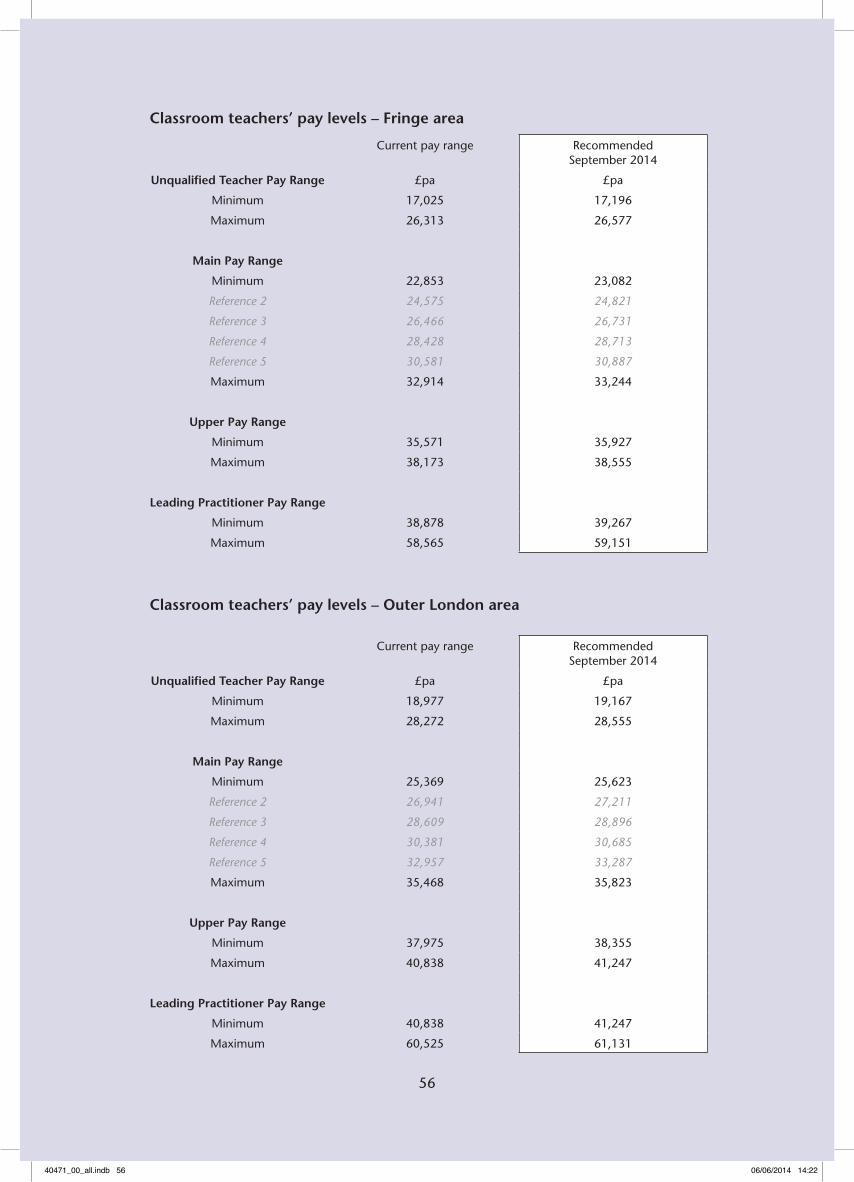
Classroom teachers’ pay levels – Fringe area
Current pay range Recommended September 2014
Unqualified Teacher Pay Range £pa £pa
Minimum 17,025 17,196
Maximum 26,313 26,577
Main Pay Range
Minimum 22,853 23,082
Reference 2 24,575 24,821
Reference 3 26,466 26,731
Reference 4 28,428 28,713
Reference 5 30,581 30,887
Maximum 32,914 33,244
Upper Pay Range
Minimum 35,571 35,927
Maximum 38,173 38,555
Leading Practitioner Pay Range
Minimum 38,878 39,267
Maximum 58,565 59,151
Classroom teachers’ pay levels – Outer London area
Current pay range Recommended September 2014
Unqualified Teacher Pay Range £pa £pa
Minimum 18,977 19,167
Maximum 28,272 28,555
Main Pay Range
Minimum 25,369 25,623
Reference 2 26,941 27,211
Reference 3 28,609 28,896
Reference 4 30,381 30,685
Reference 5 32,957 33,287
Maximum 35,468 35,823
Upper Pay Range
Minimum 37,975 38,355
Maximum 40,838 41,247
Leading Practitioner Pay Range
Minimum 40,838 41,247
Maximum 60,525 61,131
56
40471_00_all.indb 56 06/06/2014 14:22
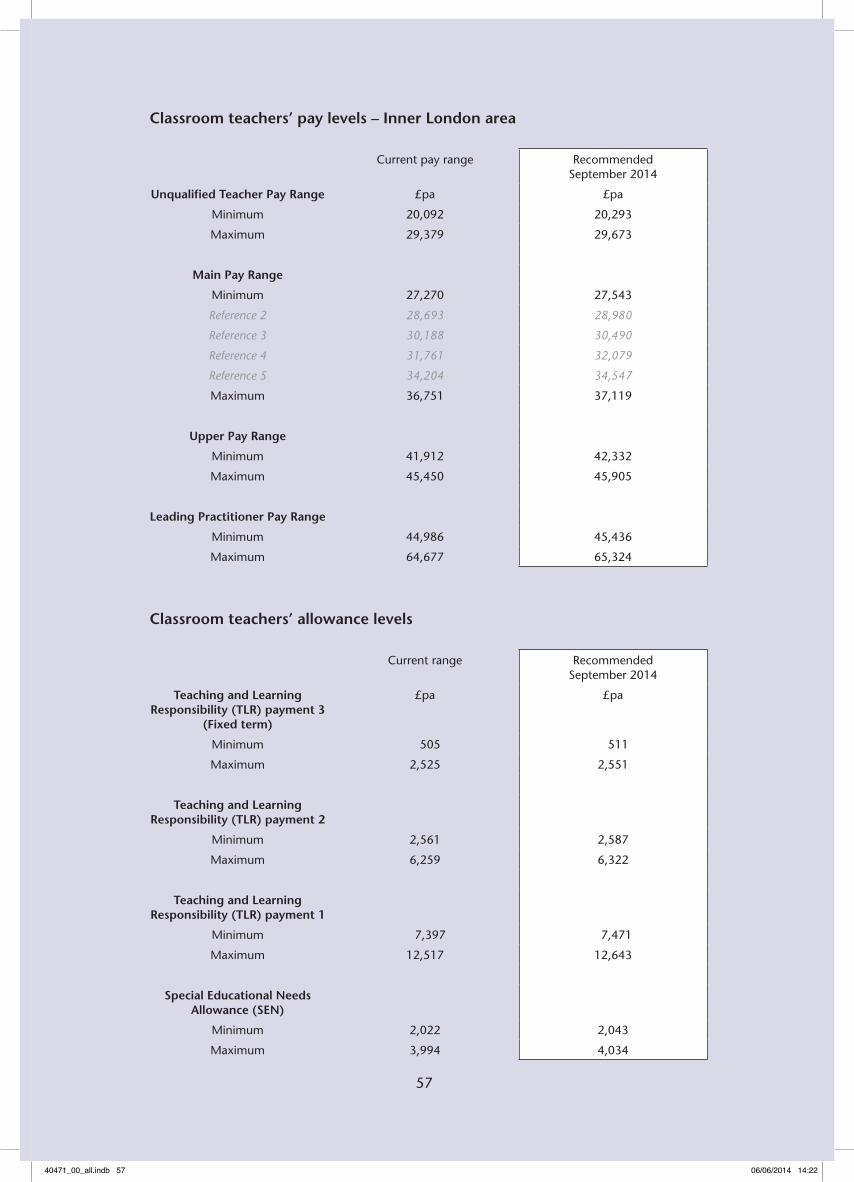
Classroom teachers’ pay levels – Inner London area
Current pay range Recommended September 2014
Unqualified Teacher Pay Range £pa £pa
Minimum 20,092 20,293
Maximum 29,379 29,673
Main Pay Range
Minimum 27,270 27,543
Reference 2 28,693 28,980
Reference 3 30,188 30,490
Reference 4 31,761 32,079
Reference 5 34,204 34,547
Maximum 36,751 37,119
Upper Pay Range
Minimum 41,912 42,332
Maximum 45,450 45,905
Leading Practitioner Pay Range
Minimum 44,986 45,436
Maximum 64,677 65,324
Classroom teachers’ allowance levels
Current range Recommended September 2014
Teaching and Learning Responsibility (TLR) payment 3
(Fixed term)
£pa £pa
Minimum 505 511
Maximum 2,525 2,551
Teaching and Learning Responsibility (TLR) payment 2
Minimum 2,561 2,587
Maximum 6,259 6,322
Teaching and Learning Responsibility (TLR) payment 1
Minimum 7,397 7,471
Maximum 12,517 12,643
Special Educational Needs Allowance (SEN)
Minimum 2,022 2,043
Maximum 3,994 4,034
57
40471_00_all.indb 57 06/06/2014 14:22
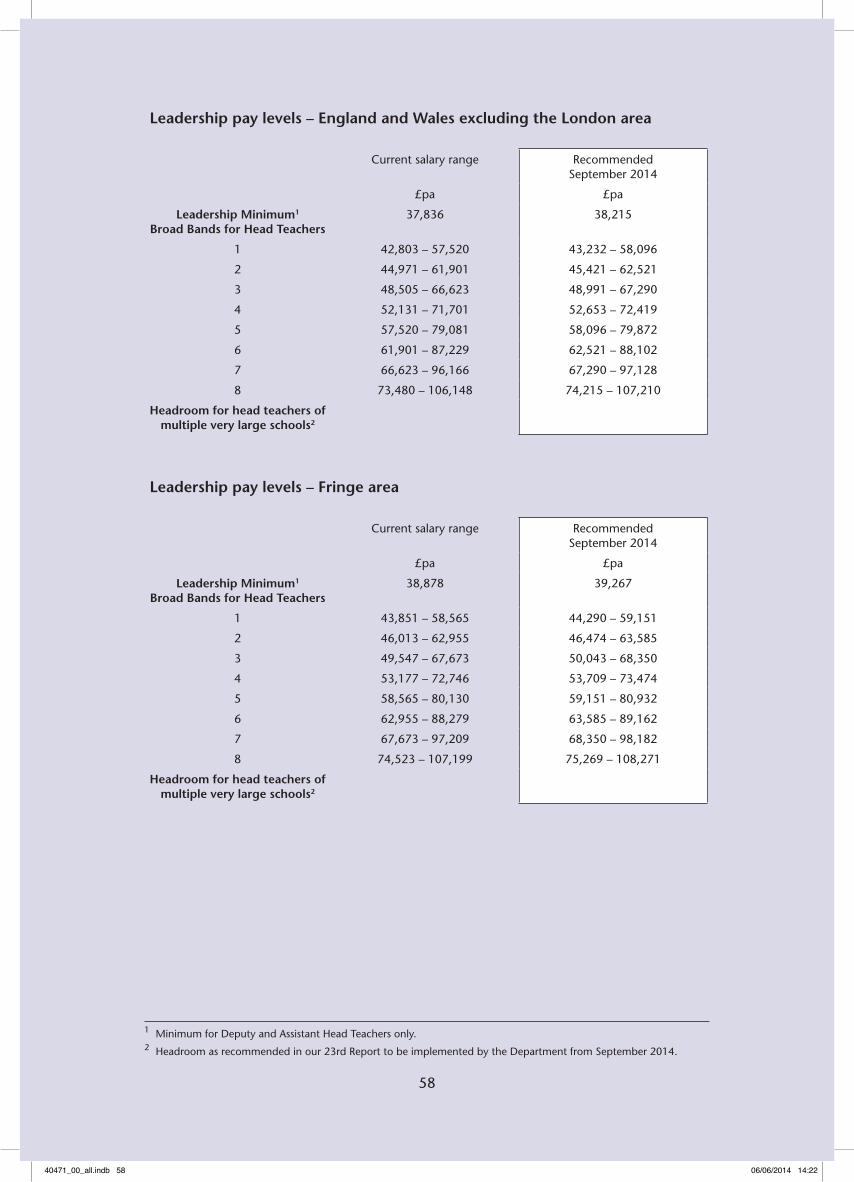
58
Leadership pay levels – England and Wales excluding the London area
Current salary range Recommended September 2014
£pa £pa
Leadership Minimum1 Broad Bands for Head Teachers
37,836 38,215
1 42,803 – 57,520 43,232 – 58,096
2 44,971 – 61,901 45,421 – 62,521
3 48,505 – 66,623 48,991 – 67,290
4 52,131 – 71,701 52,653 – 72,419
5 57,520 – 79,081 58,096 – 79,872
6 61,901 – 87,229 62,521 – 88,102
7 66,623 – 96,166 67,290 – 97,128
8 73,480 – 106,148 74,215 – 107,210
Headroom for head teachers of multiple very large schools2
Leadership pay levels – Fringe area
Current salary range Recommended September 2014
£pa £pa
Leadership Minimum1 Broad Bands for Head Teachers
38,878 39,267
1 43,851 – 58,565 44,290 – 59,151
2 46,013 – 62,955 46,474 – 63,585
3 49,547 – 67,673 50,043 – 68,350
4 53,177 – 72,746 53,709 – 73,474
5 58,565 – 80,130 59,151 – 80,932
6 62,955 – 88,279 63,585 – 89,162
7 67,673 – 97,209 68,350 – 98,182
8 74,523 – 107,199 75,269 – 108,271
Headroom for head teachers of multiple very large schools2
1 Minimum for Deputy and Assistant Head Teachers only.2 Headroom as recommended in our 23rd Report to be implemented by the Department from September 2014.
40471_00_all.indb 58 06/06/2014 14:22
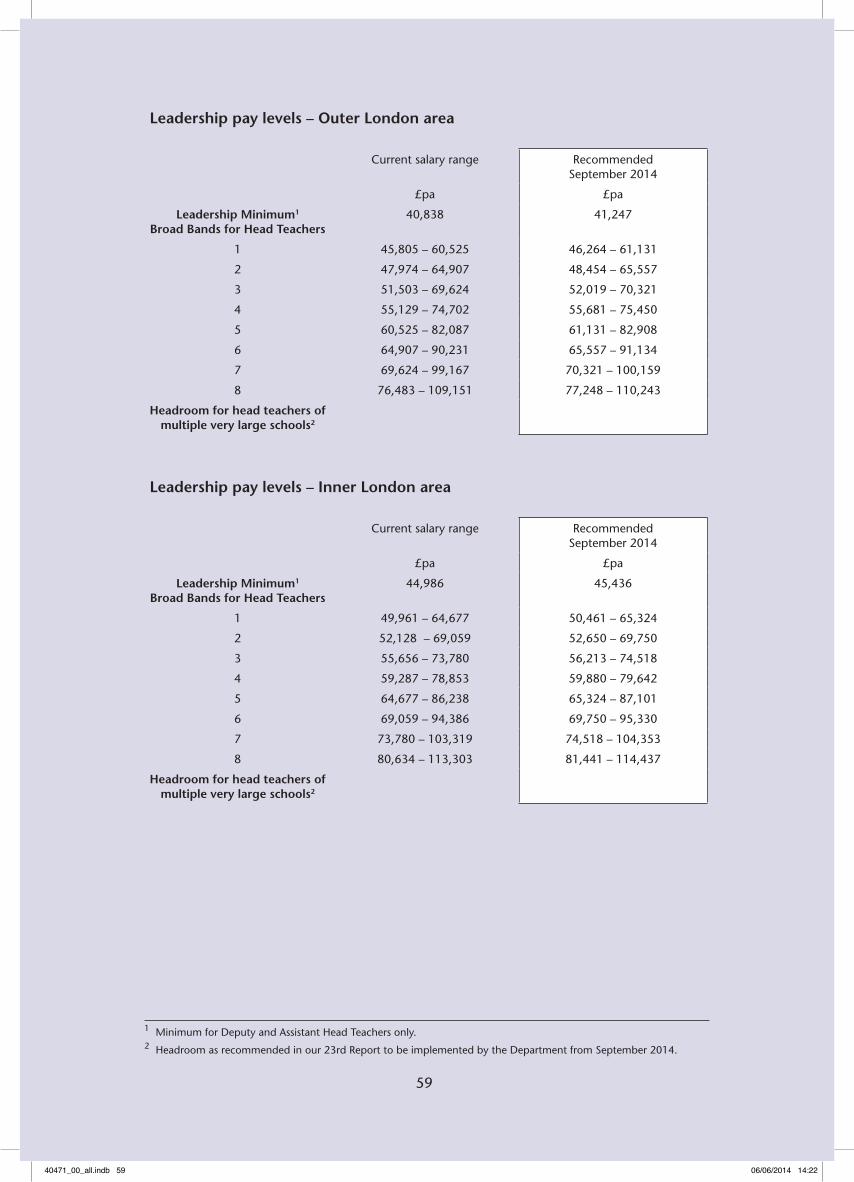
Leadership pay levels – Outer London area
Current salary range Recommended September 2014
£pa £pa
Leadership Minimum1 Broad Bands for Head Teachers
40,838 41,247
1 45,805 – 60,525 46,264 – 61,131
2 47,974 – 64,907 48,454 – 65,557
3 51,503 – 69,624 52,019 – 70,321
4 55,129 – 74,702 55,681 – 75,450
5 60,525 – 82,087 61,131 – 82,908
6 64,907 – 90,231 65,557 – 91,134
7 69,624 – 99,167 70,321 – 100,159
8 76,483 – 109,151 77,248 – 110,243
Headroom for head teachers of multiple very large schools2
Leadership pay levels – Inner London area
Current salary range Recommended September 2014
£pa £pa
Leadership Minimum1 Broad Bands for Head Teachers
44,986 45,436
1 49,961 – 64,677 50,461 – 65,324
2 52,128 – 69,059 52,650 – 69,750
3 55,656 – 73,780 56,213 – 74,518
4 59,287 – 78,853 59,880 – 79,642
5 64,677 – 86,238 65,324 – 87,101
6 69,059 – 94,386 69,750 – 95,330
7 73,780 – 103,319 74,518 – 104,353
8 80,634 – 113,303 81,441 – 114,437
Headroom for head teachers of multiple very large schools2
1 Minimum for Deputy and Assistant Head Teachers only.2 Headroom as recommended in our 23rd Report to be implemented by the Department from September 2014.
59
40471_00_all.indb 59 06/06/2014 14:22

40471_00_all.indb 60 06/06/2014 14:22