Lesson 11.4: Scatter Plots Objective: Determine the correlation of a scatter plot.
Chapter 13 Skills Practice • 793
© 2
012
Car
negi
e Le
arni
ng
Lesson 13.1 Skills Practice
Name ________________________________________________________ Date _________________________
School Spirit and Scatter Plots Using Scatter Plots to Display and Analyze Two-Variable Relationships
VocabularyWrite a definition for each term in your own words.
1. scatter plot
2. two-variable data set
3. variable

794 • Chapter 13 Skills Practice
© 2
012
Car
negi
e Le
arni
ng
Lesson 13.1 Skills Practice page 2
Problem SetConstruct a scatter plot or create a table of values for each data set. Describe any pattern you observe.
Circle the third point from the table on the graph and explain what it means.
1. Emma and Linnea, the managers of the girls’ basketball team, have collected information on the
average points scored by each player and the average minutes played by each player.
Average Minutes Played 10 20 15 12 5 8 12 14 9 16 6 3
Average Points Scored 7 14 10 8 3 5 9 9 7 12 4 1
0
2
0
4
6
8
10
12
14
16
18
5 10 15 20
Ave
rag
e P
oin
ts S
core
d
Average Minutes Played
x
yAverage Minutes Played vs.
Average Points Scored
The average points scored seems to increase as the average minutes played increases.
The point (15, 10) means that the average minutes played by one player is 15 minutes and that
same player’s average points scored is 10 points.
Chapter 13 Skills Practice • 795
© 2
012
Car
negi
e Le
arni
ng
Lesson 13.1 Skills Practice page 3
Name ________________________________________________________ Date _________________________
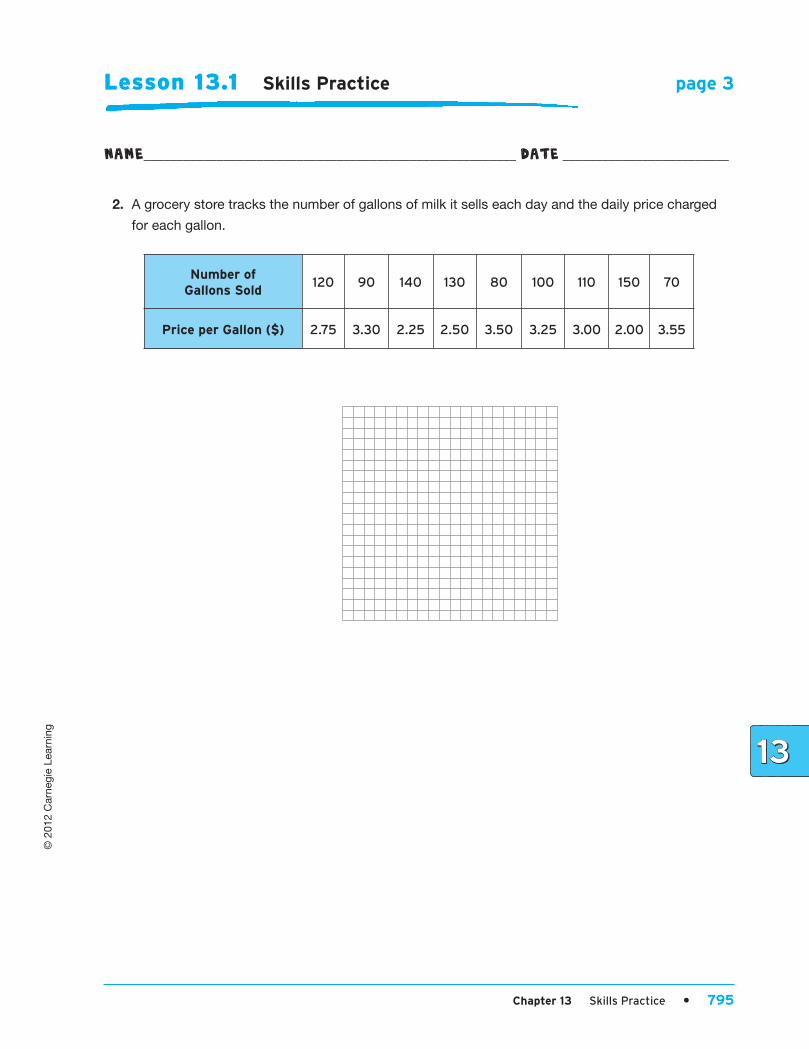
2. A grocery store tracks the number of gallons of milk it sells each day and the daily price charged
for each gallon.
Number of Gallons Sold
120 90 140 130 80 100 110 150 70
Price per Gallon ($) 2.75 3.30 2.25 2.50 3.50 3.25 3.00 2.00 3.55
796 • Chapter 13 Skills Practice
© 2
012
Car
negi
e Le
arni
ng
Lesson 13.1 Skills Practice page 4
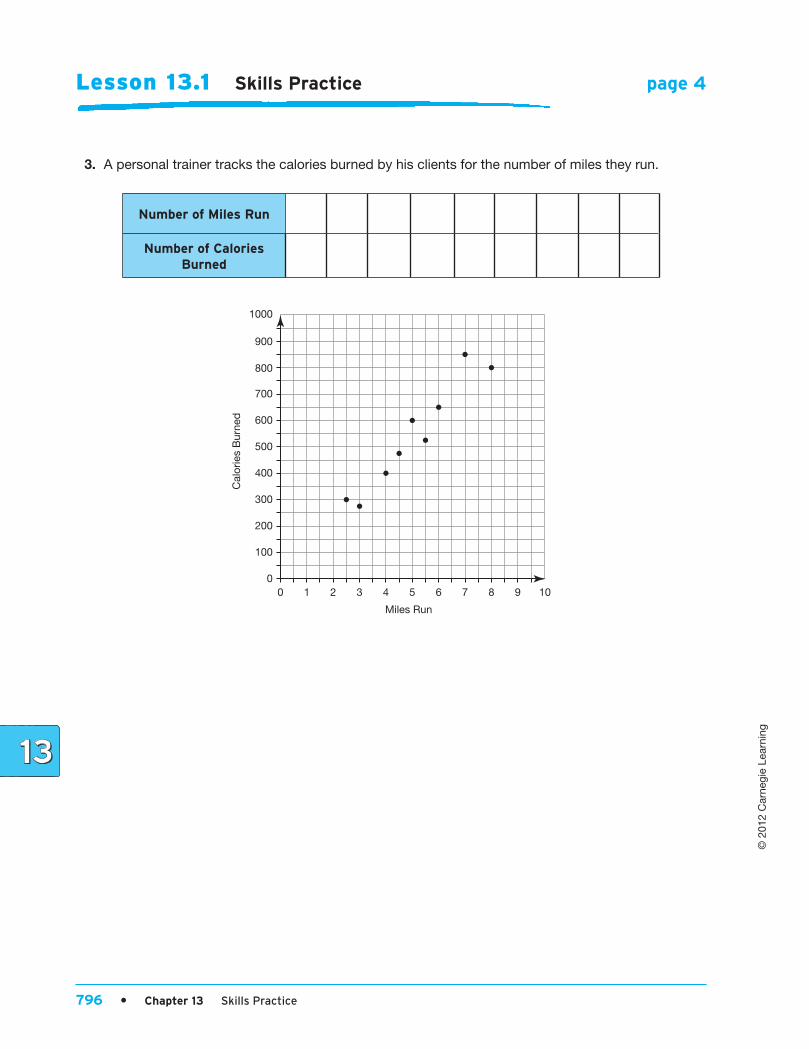
3. A personal trainer tracks the calories burned by his clients for the number of miles they run.
Number of Miles Run
Number of Calories Burned
200
100
210 3 40
5 6
Miles Run
7 8 9 10
300
400
Cal
orie
s B
urne
d
500
600
700
800
900
1000
Chapter 13 Skills Practice • 797
© 2
012
Car
negi
e Le
arni
ng
Lesson 13.1 Skills Practice page 5
Name ________________________________________________________ Date _________________________
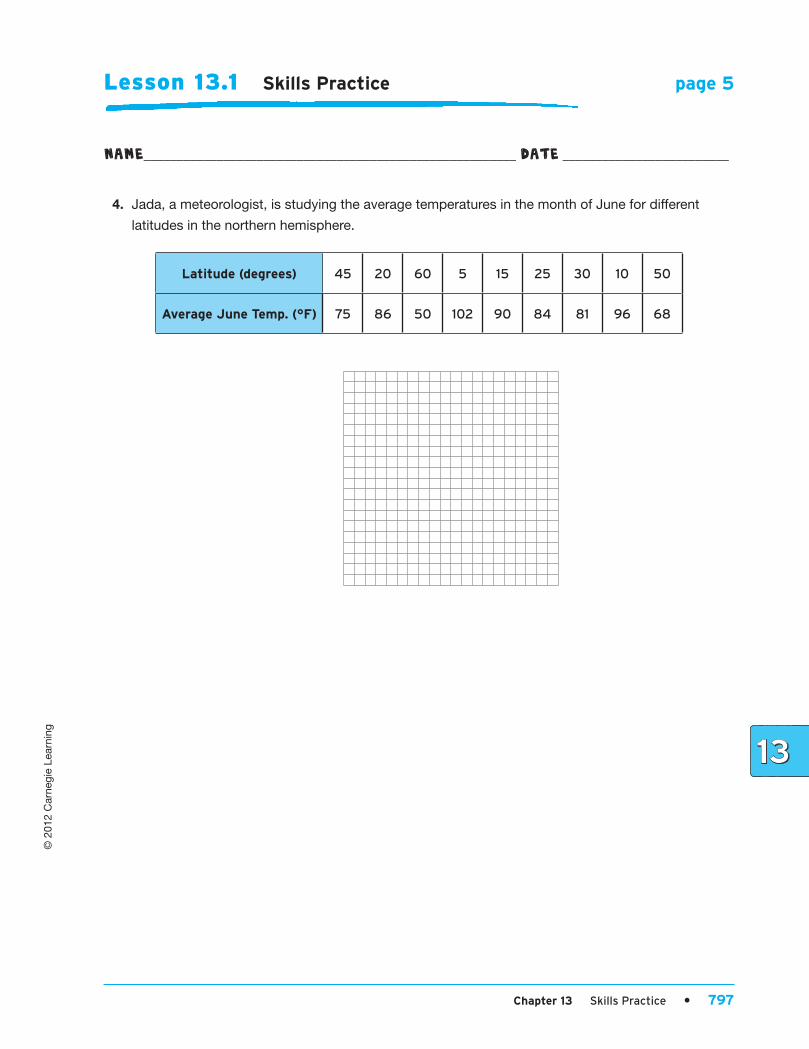
4. Jada, a meteorologist, is studying the average temperatures in the month of June for different
latitudes in the northern hemisphere.
Latitude (degrees) 45 20 60 5 15 25 30 10 50
Average June Temp. (°F) 75 86 50 102 90 84 81 96 68
798 • Chapter 13 Skills Practice
© 2
012
Car
negi
e Le
arni
ng
Lesson 13.1 Skills Practice page 6
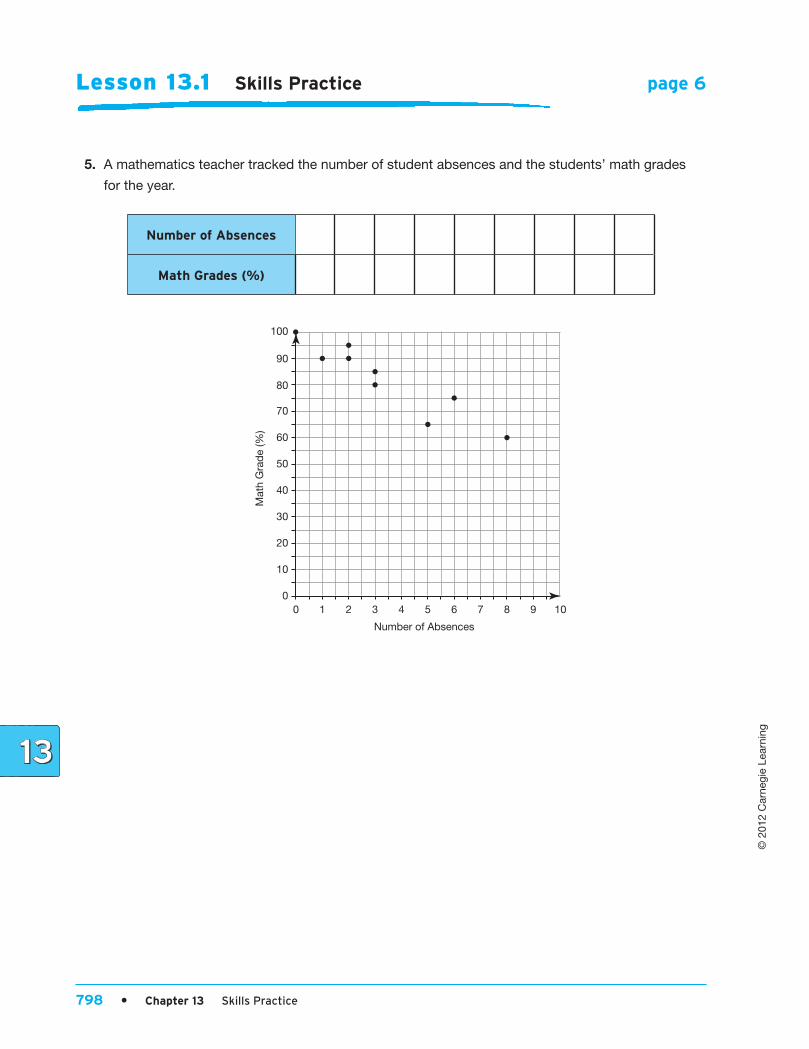
5. A mathematics teacher tracked the number of student absences and the students’ math grades
for the year.
Number of Absences
Math Grades (%)
20
10
210 3 40
5 6
Number of Absences
7 8 9 10
30
40
Mat
h G
rad
e (%
)
50
60
70
80
90
100
Chapter 13 Skills Practice • 799
© 2
012
Car
negi
e Le
arni
ng
Lesson 13.1 Skills Practice page 7
Name ________________________________________________________ Date _________________________
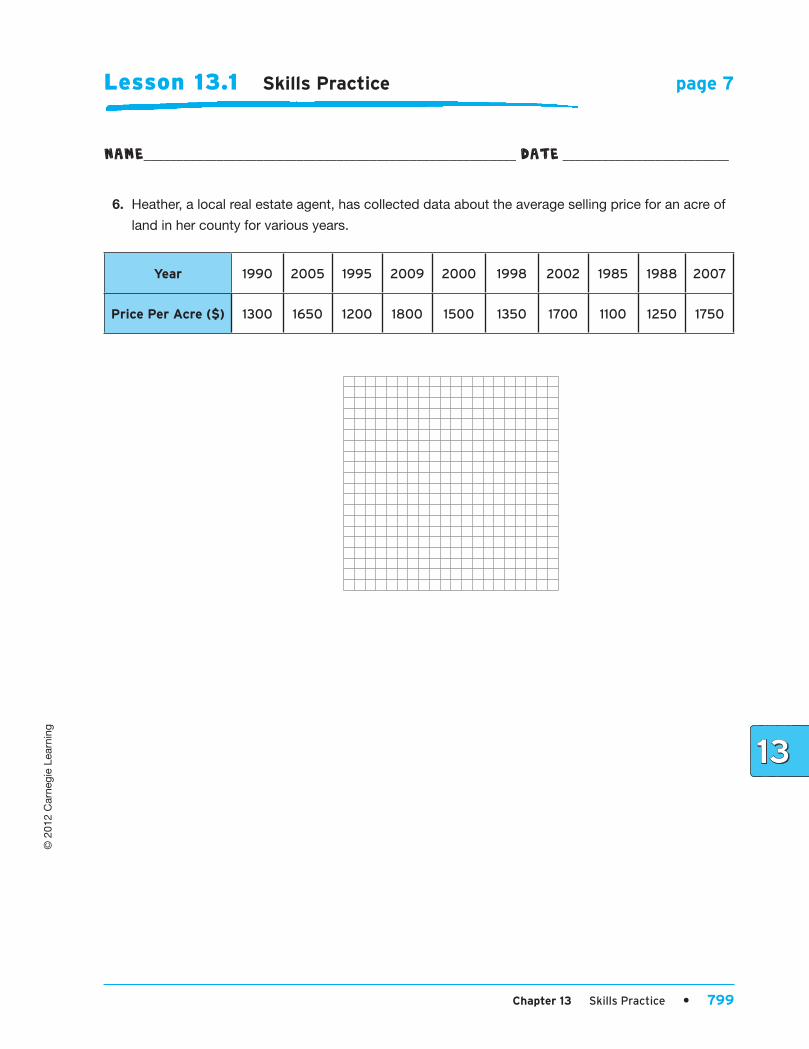
6. Heather, a local real estate agent, has collected data about the average selling price for an acre of
land in her county for various years.
Year 1990 2005 1995 2009 2000 1998 2002 1985 1988 2007
Price Per Acre ($) 1300 1650 1200 1800 1500 1350 1700 1100 1250 1750
800 • Chapter 13 Skills Practice
© 2
012
Car
negi
e Le
arni
ng
Chapter 13 Skills Practice • 801
© 2
012
Car
negi
e Le
arni
ng
Lesson 13.2 Skills Practice
Name ________________________________________________________ Date _________________________
Jump In! The Water’s Fine!Interpreting Patterns in Scatter Plots
VocabularyMatch each term to its corresponding definition.
1. independent variable (explanatory variable) a. when points on a scatter plot seem
to form a line
2. dependent variable (response variable) b. when as the independent variable increases
the dependent variable also increases.
3. linear association c. the variable whose value is not determined
by another variable
4. cluster d. a point that varies greatly from the overall
pattern of the data
5. positive association e. when points on a scatter plot are not in a
perfect line but are grouped close to an
imagined line
6. negative association f. the variable whose value is determined by an
independent variable
7. outlier g. when the dependent variable decreases as
the explanatory variable increases

802 • Chapter 13 Skills Practice
© 2
012
Car
negi
e Le
arni
ng
Lesson 13.2 Skills Practice page 2
Problem SetIdentify the dependent and independent variables in each. Determine whether the scatter plot shows
an association or not, and if so, tell if it is positive or negative. State the association in terms of the
variables. Identify any outliers.
1. A teacher surveyed students about the amount of sleep they got the night before the math test.
20
10
210 3 40
5 6
Hours of Sleep
Sleep and Test Scores
7 8 9 10
30
40
Mat
h Te
st S
core
50
60
70
80
90
100
The number of hours of sleep is the independent variable and math test scores is the
dependent variable. There is a linear association between the two variables. There is a
positive association between the two variables. Students’ math test scores increase as the
hours of sleep received increases. The points (5, 100) and (9.5, 70) are potential outliers.

Chapter 13 Skills Practice • 803
© 2
012
Car
negi
e Le
arni
ng
Lesson 13.2 Skills Practice page 3
Name ________________________________________________________ Date _________________________
2. Suzanne is collecting data for a research paper. She collects the following age and height data
for 10 adults.
Hei
ght
(inc
hes)
Age (years)
x
y Age vs. Height
20
62
60
64
66
68
70
72
74
76
78
30 40 50 60 70
804 • Chapter 13 Skills Practice
© 2
012
Car
negi
e Le
arni
ng
Lesson 13.2 Skills Practice page 4
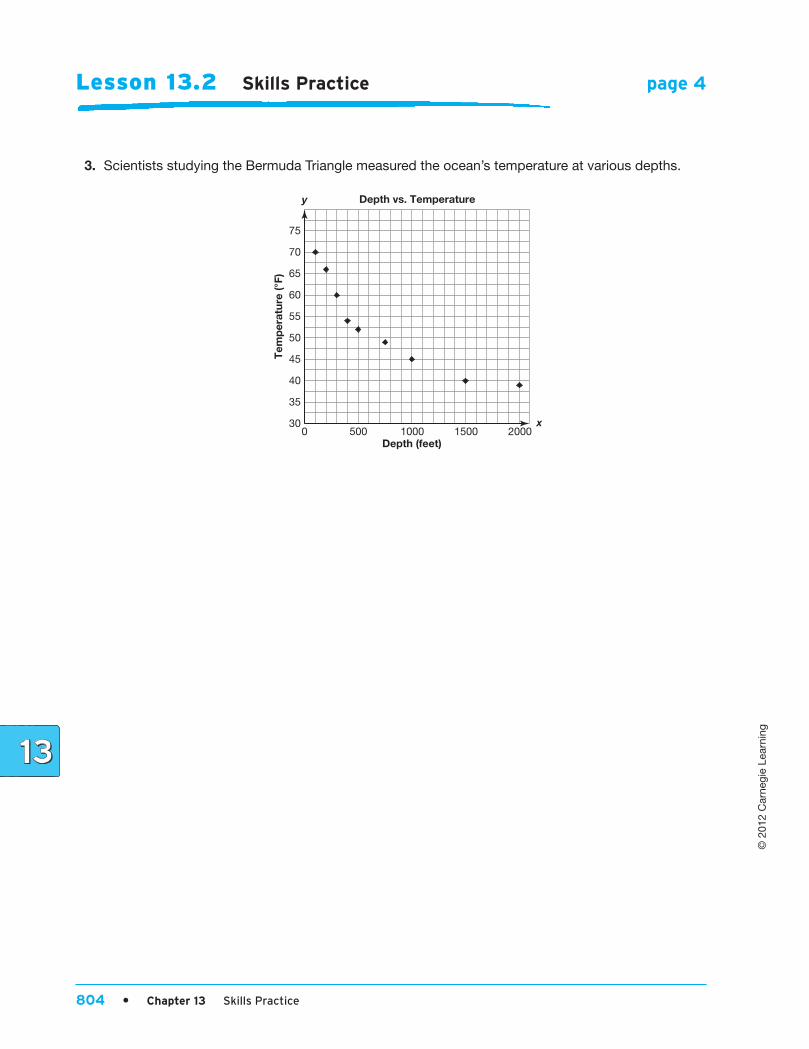
3. Scientists studying the Bermuda Triangle measured the ocean’s temperature at various depths.
0
35
30
40
45
50
55
60
65
70
75
500 1000 1500 2000
Tem
per
atur
e (°
F)
Depth (feet)
x
y Depth vs. Temperature
Chapter 13 Skills Practice • 805
© 2
012
Car
negi
e Le
arni
ng
Lesson 13.2 Skills Practice page 5
Name ________________________________________________________ Date _________________________
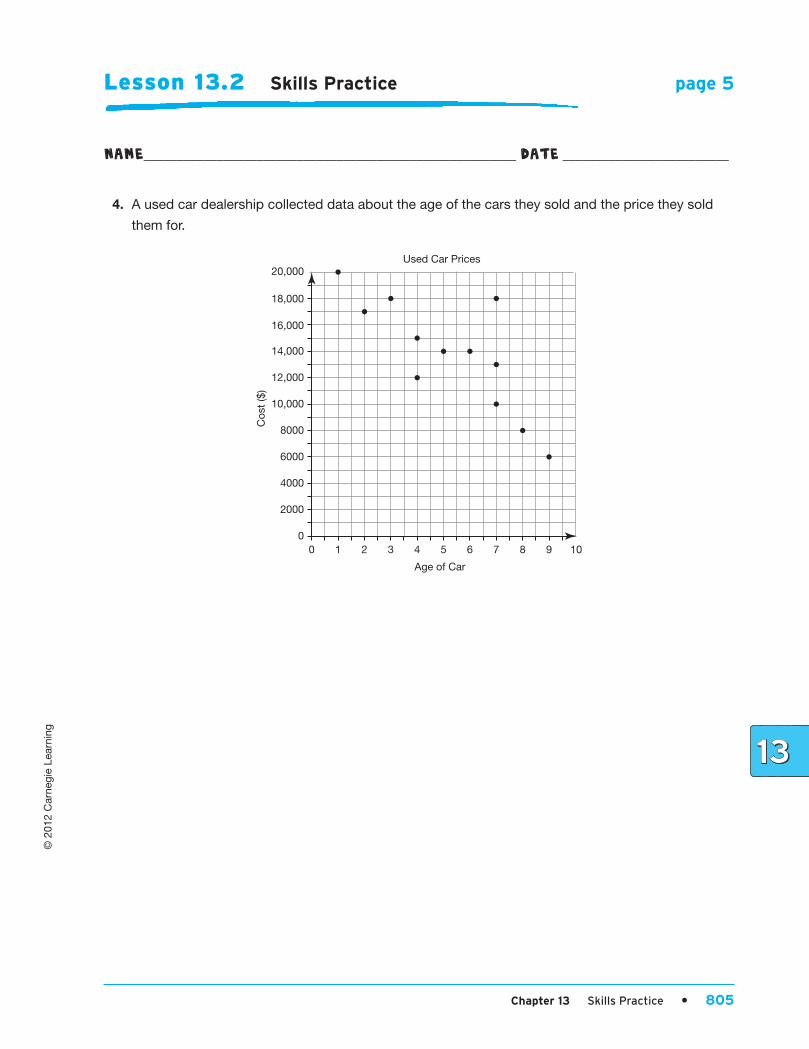
4. A used car dealership collected data about the age of the cars they sold and the price they sold
them for.
4000
2000
210 3 40
5 6
Age of Car
Used Car Prices
7 8 9 10
6000
8000
Cos
t ($
)
10,000
12,000
14,000
16,000
18,000
20,000
806 • Chapter 13 Skills Practice
© 2
012
Car
negi
e Le
arni
ng
Lesson 13.2 Skills Practice page 6
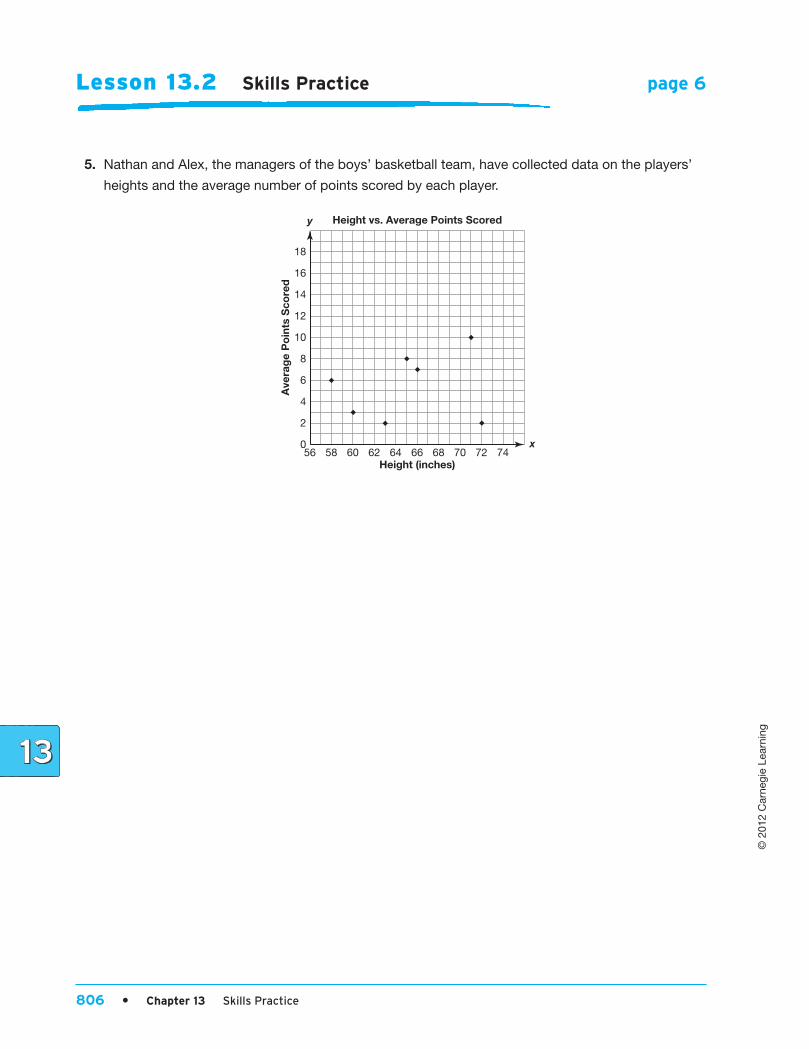
5. Nathan and Alex, the managers of the boys’ basketball team, have collected data on the players’
heights and the average number of points scored by each player.
Ave
rag
e P
oin
ts S
core
d
Height (inches)
x
y Height vs. Average Points Scored
56
2
0
4
6
8
10
12
14
16
18
58 60 62 64 66 68 70 72 74

Chapter 13 Skills Practice • 807
© 2
012
Car
negi
e Le
arni
ng
Lesson 13.2 Skills Practice page 7
Name ________________________________________________________ Date _________________________
6. Hugo has collected data about the unemployment rate in his county over the last several decades.
Une
mp
loym
ent
Rat
e (%
)
Year
x
y Year vs. Unemployment Rate
1970
5.5
5.0
6.0
6.5
7.0
7.5
8.0
8.5
9.0
9.5
10.0
10.5
11.0
1975 1980 1985 1990 1995 2000 2005 2010

808 • Chapter 13 Skills Practice
© 2
012
Car
negi
e Le
arni
ng
Lesson 13.2 Skills Practice page 8
7. A gas station has collected data about the number of gallons of regular unleaded gas it sells each
week and the average price charged for each gallon during that week.
Pri
ce p
er G
allo
n ($
)
Gallons Sold (thousands)
x
y Gallons Sold vs. Price per Gallon
140
2.40
2.30
2.50
2.60
2.70
2.80
2.90
3.00
3.10
3.20
160 180 200 220 240 260

Chapter 13 Skills Practice • 809
© 2
012
Car
negi
e Le
arni
ng
Lesson 13.2 Skills Practice page 9
Name ________________________________________________________ Date _________________________
8. Rayneisha, a department store manager, has collected data on the store’s advertising costs for a
certain year and the corresponding profit for that year.
Pro
fit (t
hous
and
s o
f $)
Advertising Costs (thousands of $)
x
y Advertising Costs vs. Profit
4
320
300
340
360
380
400
420
440
460
480
6 8 10 12 14 16 18 20 22

810 • Chapter 13 Skills Practice
© 2
012
Car
negi
e Le
arni
ng
Chapter 13 Skills Practice • 811
© 2
012
Car
negi
e Le
arni
ng
How Fast Are Your Nerve Impulses?Connecting Tables and Scatter Plots for Collected Data
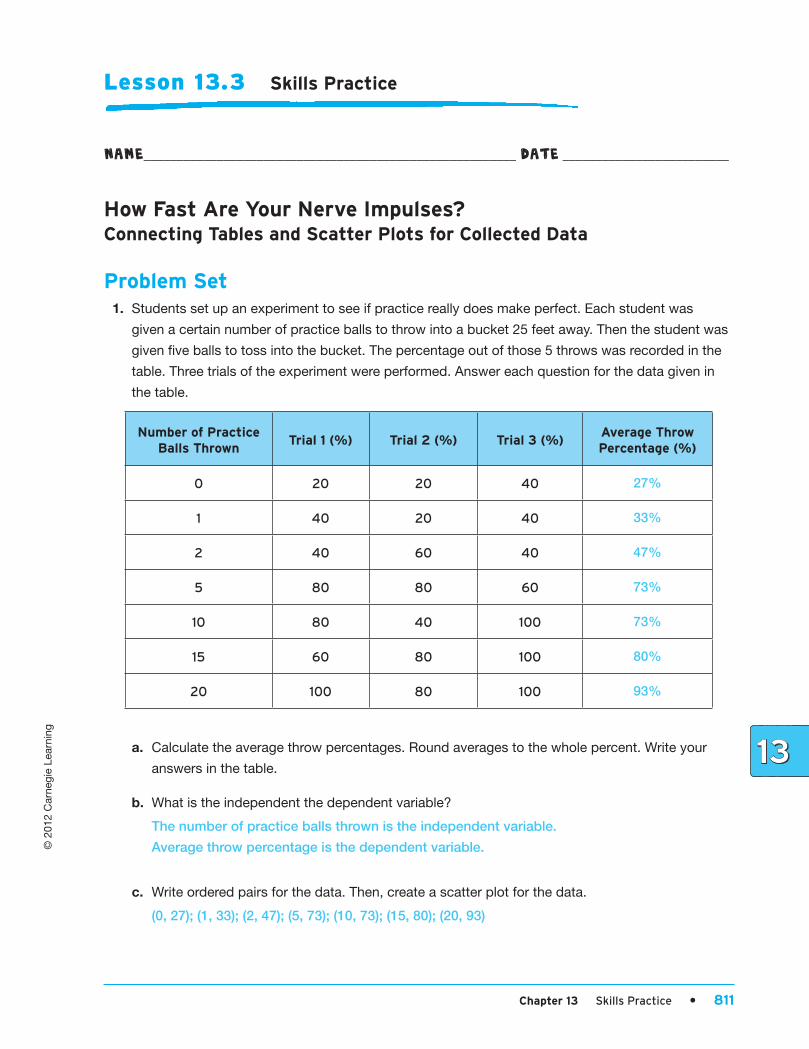
Problem Set 1. Students set up an experiment to see if practice really does make perfect. Each student was
given a certain number of practice balls to throw into a bucket 25 feet away. Then the student was
given five balls to toss into the bucket. The percentage out of those 5 throws was recorded in the
table. Three trials of the experiment were performed. Answer each question for the data given in
the table.
Number of Practice Balls Thrown
Trial 1 (%) Trial 2 (%) Trial 3 (%)Average Throw Percentage (%)
0 20 20 40 27%
1 40 20 40 33%
2 40 60 40 47%
5 80 80 60 73%
10 80 40 100 73%
15 60 80 100 80%
20 100 80 100 93%
a. Calculate the average throw percentages. Round averages to the whole percent. Write your
answers in the table.
b. What is the independent the dependent variable?
The number of practice balls thrown is the independent variable.
Average throw percentage is the dependent variable.
c. Write ordered pairs for the data. Then, create a scatter plot for the data.
(0, 27); (1, 33); (2, 47); (5, 73); (10, 73); (15, 80); (20, 93)
Lesson 13.3 Skills Practice
Name ________________________________________________________ Date _________________________

812 • Chapter 13 Skills Practice
© 2
012
Car
negi
e Le
arni
ng
Lesson 13.3 Skills Practice page 2
20
10
420 6 80
10 12
Number of Practices Balls Thrown
Practice Throws and Throw Percentage
14 16 18 20
30
40
Ave
rage
Thr
ow P
erce
ntag
e (%
)
50
60
70
80
90
100
d. Does there appear to be a linear association between the dependent and independent
variables? State the association in terms of the variables.
Yes, there is a linear association. As the number of practice throws increase, the average
throw percentage also increases.
e. Is there a positive or negative association between the number of practice throws and average
throw percentage?
There is a positive association between the number of practice throws and the average
throw percentage.
f. Write the ordered pair for the point on the scatter plot that represents the greatest average
throw percentage. Identify the values of the coordinates and what they mean.
The point (20, 93) means that after throwing 20 practice throws, the student’s average throw
percentage was 93%.
Chapter 13 Skills Practice • 813
© 2
012
Car
negi
e Le
arni
ng
Lesson 13.3 Skills Practice page 3
Name ________________________________________________________ Date _________________________
g. Write the ordered pair for the point on the scatter plot that represents the least practice balls
thrown. Identify the values of the coordinates and what they mean.
The point (0, 27) means that after throwing 0 practice throws, the student’s average throw
percentage was 27%.
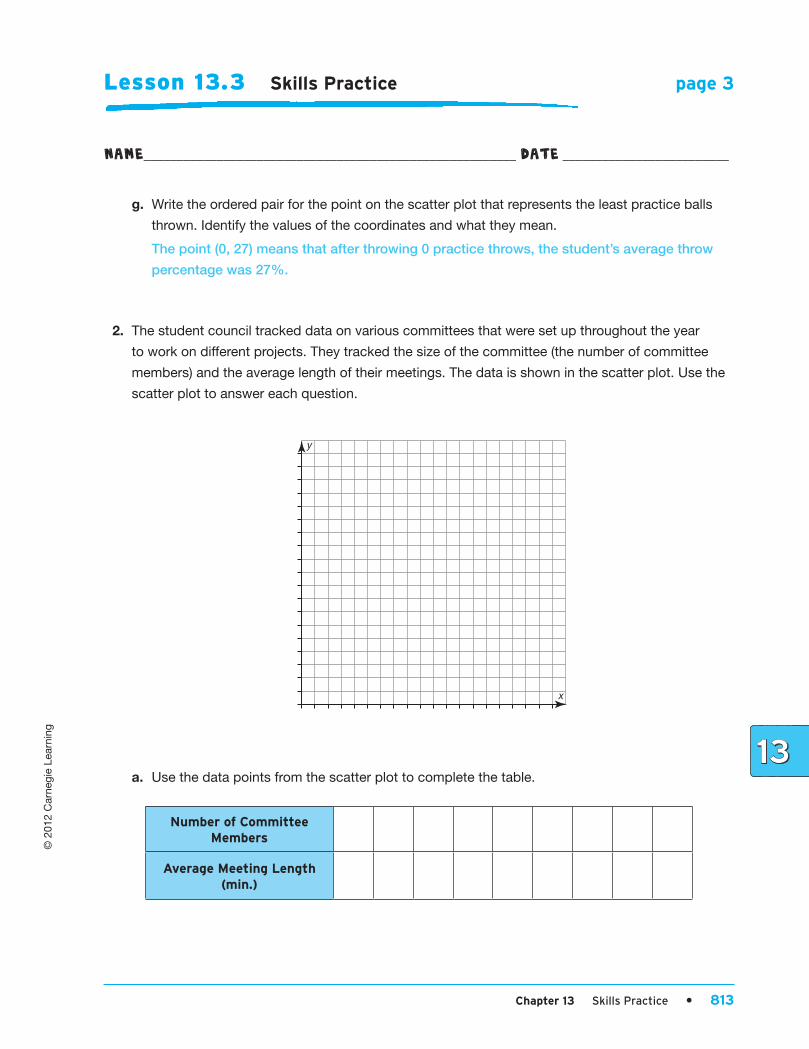
2. The student council tracked data on various committees that were set up throughout the year
to work on different projects. They tracked the size of the committee (the number of committee
members) and the average length of their meetings. The data is shown in the scatter plot. Use the
scatter plot to answer each question.
y
x
a. Use the data points from the scatter plot to complete the table.
Number of Committee Members
Average Meeting Length (min.)
814 • Chapter 13 Skills Practice
© 2
012
Car
negi
e Le
arni
ng
Lesson 13.3 Skills Practice page 4
b. Does there appear to be a linear association between the dependent and independent
variables? State the association in terms of the variables.
c. Is there a positive or negative association between the number of committee members and the
average meeting length?
d. Write the ordered pair with the greatest number of committee members. Explain the meaning of
each of the coordinates.
e. Write the ordered pair for the committee with the shortest meetings. Explain where you would
find the point on the scatter plot.
f. Write the ordered pair for the committee with the longest meetings. Explain where you would
find the point on the table.
g. Write the ordered pairs for the committees with the same number of members. How many
members did they have and how long were each of their average meetings?
h. Write the ordered pairs for the committees with the same length of meetings. How long are their
meetings and how many members do they each have?