School resources and education outcomes: Evidence from Sri ... · School resources and education...
37
1 School resources and education outcomes: Evidence from Sri Lanka Ashani Abayasekara* and Nisha Arunatilake Institute of Policy Studies of Sri Lanka *Corresponding author. [email protected] June 2018 Abstract Sri Lanka’s public education system suffers from poor education outcomes and wide disparities in academic achievement across schools. Using School Census data for the year 2017 and a hierarchical linear modeling technique, we examine the impact of school-level resources on student performance at the O-Levels, undertaken upon completion of secondary schooling.We find that schools with better-quality physical resources and those with larger shares of qualified and experienced teachers and principals perform better at the O-Levels. Teacher commitment— measured by teacher absenteeism—also matters. Our findings hold several policy implications for improving the quality and equity of education outcomes in Sri Lanka. Keywords: school-level resources; education outcomes; O-Levels; hierarchical linear modeling; Sri Lanka Acknowledgements: We are grateful for comments from anonymous referees and attendees at presentations at the Institute of Policy Studies and the Ministry of Education. Funding was received from the International Development Research Centre through its Think Tank Initiative.
Transcript of School resources and education outcomes: Evidence from Sri ... · School resources and education...
1
School resources and education outcomes: Evidence from Sri Lanka Ashani Abayasekara* and Nisha Arunatilake Institute of Policy Studies of Sri Lanka *Corresponding author. [email protected] June 2018 Abstract Sri Lanka’s public education system suffers from poor education outcomes and wide disparities in academic achievement across schools. Using School Census data for the year 2017 and a hierarchical linear modeling technique, we examine the impact of school-level resources on student performance at the O-Levels, undertaken upon completion of secondary schooling.We find that schools with better-quality physical resources and those with larger shares of qualified and experienced teachers and principals perform better at the O-Levels. Teacher commitment—measured by teacher absenteeism—also matters. Our findings hold several policy implications for improving the quality and equity of education outcomes in Sri Lanka. Keywords: school-level resources; education outcomes; O-Levels; hierarchical linear modeling; Sri Lanka
Acknowledgements: We are grateful for comments from anonymous referees and attendees at presentations at the Institute of Policy Studies and the Ministry of Education. Funding was received from the International Development Research Centre through its Think Tank Initiative.

2
1 Introduction It is now well accepted that a highly-skilled well-educated workforce is essential for Sri Lanka to remain competitive. Under the education structure of the country, successful performance at the General Certificate in Education (GCE) Ordinary Level (O-Level) examination—undertaken by students completing secondary schooling—is a pre-requisite for most further education courses. These include the GCE Advanced Level (A-Level) examination—which also serves as the university entrance examination—and many vocational training programs. To qualify for the A-Levels, a student needs to obtain six ordinary passes and at least three special passes with a pass for the first language (Sinhala or Tamil) and mathematics at the O-Levels (Minsitry of Education of Sri Lanka (MOE), 2008). In 2015, close to half the students (45%) either failed or only conditionally passed the O-Levels1 due to failing mathematics (Department of Examinations of Sri Lanka, 2016). In the same year, 11% of Sinhala medium students and 19% of Tamil medium students failed the O-Levels due to poor performance in their first language (Ibid). The effect of school resources on student performance is a subject of substantial interest and policy relevance, particularly in light of the strong emphasis placed by successive Sri Lankan governments in providing universal free education. Despite the well documented central role played by education in reducing economic and social inequalities and promoting inclusive economic growth, less is known about the specific types of educational investments that should be pursued. In maximizing the efficiency of government educational budget allocations, it is important that scarce state funds are directed towards resources that have a strong bearing on educational outcomes. Examining the significance of school resources takes on added importance in the present-day context, where the rising emergence of private supplementary tutoring in many parts of the world holds potential implications for the relationship between school-level factors and student performance. In this study we examine the impact of school-level resources on student performance at the O-Level examination in Sri Lanka. Our analysis begins with a standard ordinary least squares (OLS) estimation. We control for several school, student socioeconomic, teacher, principal, and provincial characteristics that potentially affect student performance. We then proceed to hierarchical linear modeling (HLM) techniques to account for hierarchical levels of grouped data. This is a commonly occurring phenomenon in many contexts including the education
1 Since 2014, students meeting all other requirements but with a failure in mathematics can pursue A-Level studies, conditional on obtaining a pass in mathematics within two years (MOE, 2014a).
3
sector, where observations are often structured at student, classroom, school, and school district and province levels (Woltman et al., 2012). Our results suggest that the quality of both physical and human resources have significant—albeit modest—impacts on education outcomes in schools. Schools with larger shares of in-field and experienced teachers and qualified principals perform better at the O-Levels. The commitment of teachers, measured by teacher absence, also matters. Additionally, school status, school type, school size, the share of scholarship-holding students—a proxy for student ability—and student socioeconomic indicators have significant impacts on O-Level performance. Disaggregation of the sample based on different school categories points to some notable differences in the effects of school, teacher, and principal characteristics across the different classifications. Reflecting its policy significance, a vast amount of research has explored the relationship between resources devoted to schools and educational outcomes, spanning several decades. In a meta-analysis of close to 400 studies of student achievement in the United States over a three-decade period, Hanushek (1997) concludes that there is no strong or consistent relationship between school resources and student performance. More recent studies find strong and positive relationships between teacher qualifications and education outcomes across the country (Clotfelter et al., 2010; Hill et al., 2005; Rockoff, 2004; Salloum et al., 2017). Studies focusing on developing countries can be traced to Heyneman and Loxley (1983), who explore the effects of school quality on primary-level student acheivement in science in both high- and low-income countries across diverse continents including Africa, Asia, Latin America, and the Middle East.They find that the effect of school resources and teacher quality—in terms of teacher education, verbal ability, time spent preparing lessons, and membership in professional organizations—on academic performance is relatively greater in low-income countries. Akiba et al. (2009) analyze the 2003 Trends in International Mathematics and Science Study data for a mix of 46 developed and developing countries and show that countries with better mathematics teacher quality—measured as the percentage of students taught by mathematics teachers who are fully certified, who majored in mathematics or mathematics education, and who have three or more years of teaching experience—produce higher mathematics achievement among eighth graders.

4
McEwan (2015) assesses 77 randomized experiments that evaluate the impacts of school-based interventions on learning in developing country primary schools, including Sri Lanka. He concludes that the largest effects are from treatments that provide computers or instructional technology, teacher training, smaller classes, student and teacher performance incentives, and instructional materials. Willms and Somer (2001) employ hierarchical linear modeling to examine the relationships between language and mathematics achievement and school practices in 13 Latin American countries. Across all countries, they conclude that the most effective schools tend to be those with high levels of school resources, frequent testing of students, high level of parental involvement, and good classroom discipline. Systematic investigations of the relationship between school resources and education outcomes in South Asia and Sri Lanka are limited. Asim et al. (2015) conduct a meta-analysis of 29 education-focused impact evaluations that use randomized control trials and quasi-experimental designs in South Asia. They find that programs targeting the supply-side of education—including teachers and schools—have a larger impact on improving learning outcomes, compared to initiatives that focus on increasing the demand for education in households and societies. Other existing literature on South Asia appears to be primarily focused on India. Kingdon (2006) uses a school fixed effects model to examine the relationship between teacher characteristics and student grades in 16 major Indian states and finds that holding a Masters-level qualification and pre-service training have significant but small effects on student achievement. Muralidharan and Sundararaman (2009), based on experimental evidence, show that two years of performance incentives to teachers could yield close to 0.3 and 0.2 standard deviation improvements in student mathematics and language scores, respectively. Banerjee et al. (2005) present evidence for the importance of teacher resources and computer-based learning on student outcomes using two experiments conducted in the Indian states of Mumbai and Vadodara. A prior study for Sri Lanka is that of Aturupane et al. (2013), which investigates the determinants of learning among fourth grade students using the National Education Research and Evaluation Center (NEREC) survey conducted by the University of Colombo. They find principals’ and teachers’ years of experience to be important determinants of learning outcomes, in addition to child and household level variables such as educated parents, better nutrition, high daily attendance, and enrollment in private tutoring classes. However, this analysis is limited to primary-level student achievement, and its main focus is on student-level factors as opposed to school and teacher characteristics. To our knowledge, ours is the first study to examine the impact of school resources on O-Level performance in Sri Lanka.

5
The remainder of the paper proceeds as follows. Section 2 provides an overview of Sri Lanka’s school education system. Section 3 presents our data and methods. The results are presented and discussed in Section 4. Section 5 concludes and offers policy implications.
2 Sri Lanka’s school education system Education in Sri Lanka is provided through an extensive network of schools, which stood at 11,053 in 2017 (Central Bank of Sri Lanka, 2017). Our study focuses on public schools, which, at 10,194, account for 92% of total schools.2 Since 1987, education administration in Sri Lanka has been decentralized, with more powers being given to provinces in the administration and management of education services. Under this new framework, schools are categorized into ‘national’ schools and ‘provincial’ schools (Arunatilake and Jayawardena, 2010). National schools come directly under the purview of the Central MOE. These are primarily elite and old central colleges that were established during the colonial period and retained by the central government. Several criteria for listing a school as a national school were established in 1985, which are reflective of schools with superior educational and other related facilities. Provincial schools come under the purview of the respective provincial ministries of education. There are nine provincial ministries of education, one per each province. As such, schools come under 10 different administrative units—the Central MOE and the nine provincial ministries of education. These education ministries are responsible for the planning, implementation, and management of all education programs (De Silva, 2003).3 Given this administrative structure, the performance of schools can be affected by the administrative capacity of the different ministries of education, in addition to school-level characteristics. Moreover, apart from the more obvious differences at the national and provincial MOE levels, socioeconomic disparities that exist in Sri Lanka at the provincial-level can have a bearing on the administrative capacity of each provincial MOE. For instance, it is reasonable to expect that education ministries located in provinces with higher GDP per capita or lower poverty levels would have better access to resources to perform their duties more effectively. As illustrated in Figure 1, the Western Province, the location of the capital, Colombo, is the most
2 Other types of schools include assisted and autonomous Private Schools which offer both the local syllabus and the British system, and Pirivenas (monastic colleges, similar to seminaries, where Buddhist priests in Sri Lanka are educated). 3 Within a province, schools are also grouped into education zones, and zones are in-turn grouped into education divisions. The divisional and zonal education offices come directly under the purview of the provincial education offices, and there is also significant overlap in the responsibilities of each level. It is therefore unlikely that these additional levels have a significant individual influence on the functioning and performance of schools.

6
affluent and accounts for 40% of Sri Lanka’s GDP, while the Northern province contributes to a mere 4.2%. The Western province also records the lowest poverty rate and highest urbanization rate. Poverty incidence is highest in the Uva and Northern provinces, while the North Western and North Central provinces record the lowest urbanization rates. Figure 1: Socioeconomic characteristics by province
Notes: The share of GDP refers to the contribution of each province, in monetary value, to national GDP. Poverty refers to the poverty headcount ratio orthe proportion of the population below the poverty line. Unemployment refers to the percentage of the labour force that is currently unemployed. Urbanization refers to the share of population in the urban sector. Sources: Central Bank of Sri Lanka (2017); Department of Census and Statistics of Sri Lanka (2013a; 2015a; 2015b). Sri Lanka’s school education system commences at age 5, and consists of 13 years of schooling, organized into four levels: primary (grades 1—5), junior secondary (grades 6—9), senior secondary (grades 10 and 11), and collegiate (grades 12 and 13). Education is compulsory up to age 14 (grade 9) in the country. Students are subjected to three national-level examinations. The first is the grade five Scholarship examination, faced by children in grade 5. The main objective of this exam is to provide subsidies to talented, yet economically disadvantaged students, to

7
pursue further education in better schools (Sedere et al., 2016).4 The second is the GCE O-Level examination, undertaken by students upon completion of secondary-level schooling, which is the focus of our study. It includes six compulsory subjects—mathematics, the first language (Sinhala or Tamil), religion, science, English, and history—and three optional clusters spanning a wide range of subjects such as commerce, agriculture, home science, health studies, aesthetics, languages, and information technology. The third is the GCE A-Level examination—available in the Science, Commerce, Arts, and Technology streams—faced by students after completing collegiate-level education. Since the Free Education Act of 1945, education in Sri Lanka is government-funded and offered free of charge at all levels, including the tertiary level. The state funds both investment inputs— such as expenditure on buildings, furniture, and equipment—and recurrent inputs—such as textbooks, uniform material, meals, expenditure on teachers and other staff, consumable supplies, as well as administrative and development related expenditure (Arunatilake, 2006). Publicly-funded education has consequently led to commendable school enrollment and literacy rates. Despite being a lower middle-income country, Sri Lanka has been successful in enrolling nearly all primary aged children and a large proportion of secondary-level school children in schools (World Bank, 2017). However, there are mounting concerns regarding the quality of education. Compared to developing country standards, expenditure on education in Sri Lanka is low. Current expenditure on education as a percentage of total government expenditure stands at 9%, which is far below the lower-middle income country average of 16% (World Bank, 2017). Low investments in education have affected the development of the education sector, both in terms of expenditure on capital goods and investments in human and physical capital development (National Education Commission (NEC), 2003; World Bank, 2005). Less privileged schools are in particular affected by low funding, as they depend more on public funds (Arunatilake and Jayawardena, 2013).
Public schools in Sri Lanka are categorized into five distinct groupings based on a list of factors that reflect the availability of school resources, amenities, and ease of access to the school (MOE, 2005). These factors are the availability of basic resources (electricity, water, telephone, and library facilities), the durability of existing equipment such as typewriters, photocopy machines, televisions, and computers, the number of usable toilets, the size of school buildings, 4 This is not a compulsory examination, and is of most importance to students who aspire to move into better quality schools for their secondary- and collegiate-level education.

8
availability of a principal’s office, teacher common rooms, and storerooms, the number of teachers and shares of those with professional qualifications, distance from school to nearest bus stop or train station, the number of available trips by bus or train towards the school between 7–8am, and distance from school to zonal and divisional education ministries and the nearest bank, post office, and government hospital. The five status categories are: (1) highly privileged; (2) privileged; (3) not privileged; (4) underprivileged; and (5) highly underprivileged. The distribution of schools by status is inequitable, as illustrated in Figure 2. Highly privileged schools are heavily concentrated among national schools, accounting for close to 60% of the total number of national schools. Among provincial schools, the Western and Southern provinces account for the largest shares of privileged schools. Underprivileged schools are most prevalent in the Eastern, Northern, and North Western provinces. Figure 2: Share of schools by status and province, 2017
Source: Own calculations based on School Census data (MOE, 2017).
Sri Lankan public schools are also classified based on the number and type of functioning classes. Schools with collegiate level classes are classified as either 1AB or 1C; the former offer A-Levels in all three subject streams—Science, Commerce and Arts, while the latter are limited to the Commerce and/or Arts streams. Type 2 schools have classes up to grade 11 which

9
terminate after the O-Levels, and Type 3 schools function only up to grade 5 or grade 8.5 Figure 3 indicates that an overwhelming share (90%) of 1AB schools belongs to the highly privileged and privileged status groupings, whereas 66% of Type 2 schools are either not privileged or underprivileged. Figure 3: Share of schools by status and type, 2017
Source: Own calculations based on School Census data (MOE, 2017). The distribution of teacher resources among schools shows similar patterns across regions, school status, and school type. Prior literature measures teacher quality based on both qualifications and experience, which capture the knowledge and mastery of content, as well as the ability to teach, or pedagogical skill (Ingersoll, 2002; Kennedy, 1992; Peske and Haycock, 2006). Further, as emphasized by Ingersoll (2002), with regard to teacher qualifications, it is essential to assign teachers to teach subjects that match their training or education—i.e. teachers who are ‘in-field’. Teachers in Sri Lanka are recruited to teacher service under four criteria: (1) graduate teachers; (2) trained teachers; (3) untrained teachers with two to three year diplomas; and (4) novice teachers who are not yet absorbed into Teacher Service (MOE, 2014b). We consider teachers who have either a degree in a particular subject, or have been specially trained
5In this study we limit our focus to 1AB, 1C, and Type 2 schools, since our objective is to examine O-Level performance.

10
to teach a particular subject (criteria 1 and 2), as in-field teachers—teachers with good subject knowledge in the subject they teach. Recruitments to teacher service are also carried out at different levels, referred to as “Classes” (MOE, 2014b). Teachers who do not hold a degree in education are recruited to Class 3 of Teacher Service. Depending on their educational qualifications, Class 3 teacher recruits are again categorized into Class 3—Grade I(a) (those with a degree), Class 3—Grade I(b) (pedagogy trained teachers), Class 3—Grade I(c) (those with diplomas), and Class 3—Grade II (those with only A-Levels). Teachers with a Bachelor of Education are directly recruited to Class 2—Grade II. Conditional on their initial recruitment, those who have been recruited to Class 3 need to obtain three to five years’ experience in teaching and pass an efficiency bar exam to be promoted to Class 2—Grade II. This recruitment structure suggests that all Class 2—Grade II teachers hold subject and pedagogical knowledge, as well as at least three years of experience. We therefore consider teachers of Class 2—Grade II and higher to be ‘experienced’ teachers.
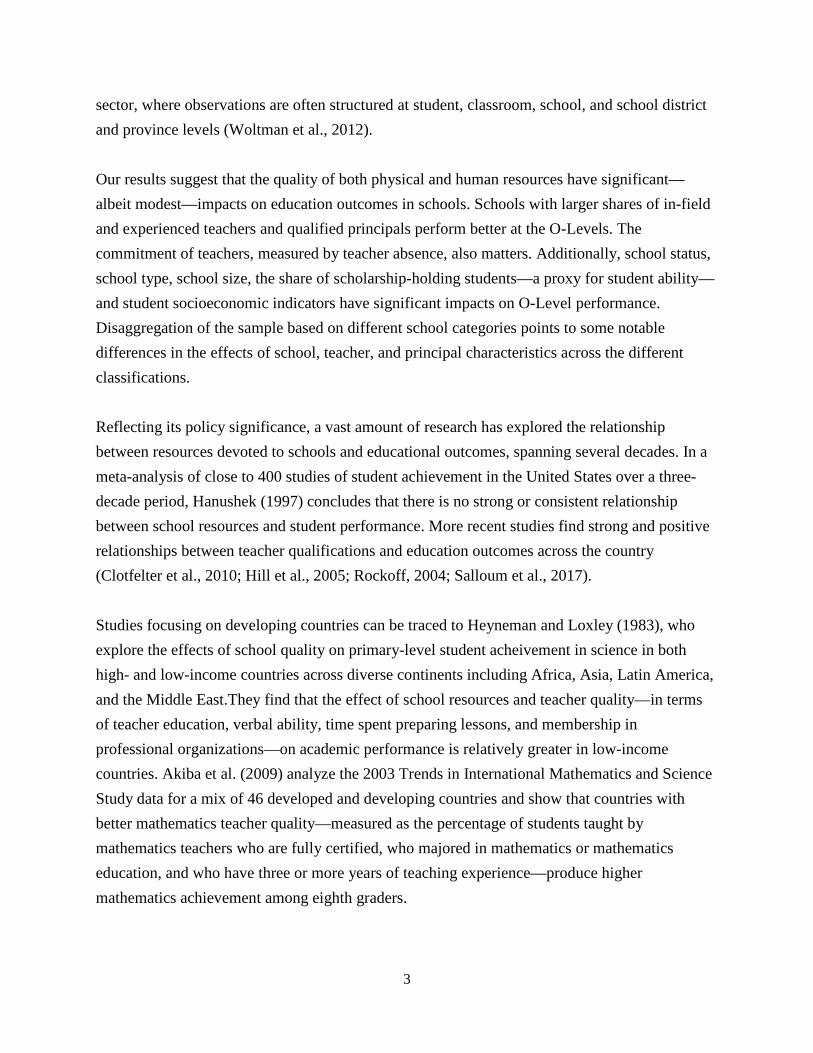
Figure 4 illustrates the allocation of teacher resources among schools based on three measures of teacher qualifications and experience:(1) the share of in-field and experienced mathematics teachers; (2) the share of in-field but inexperienced mathematics teachers; and (3) the share of other mathematics teachers (teachers who are not in-field and either experienced or inexperienced). These are shares out of recommended mathematics teacher numbers—which we believe provide a more accurate measure of teacher availability relative to teacher requirements in each school—as opposed to existing numbers.6 We obtain recommended teacher numbers from the MOE (2016), where the number of required secondary-level teachers for each subject in each school is determined based on the number of classes at the secondary level in a school.7 The principal in each school first determines the number of teachers needed for each grade and for each subject, after which permission for this estimated teaching cadre is sought from the Secretary to the MOE (for national schools) or the zonal Director of Education (for provincial schools). Once approval is obtained, the estimated cadre becomes the approved and recommended cadre of teachers for each school.
6 These shares could exceed one, when the available number of teachers exceeds the recommended number. 7 Prior to 2016, required teacher numbers were determined according to the number of students in a school. However, recognizing the need for a teacher in every class irrespective of the number of students in a class, since 2016, teacher requirements are based on the number of classes in a school.
11
Figure 4: Available mathematics teachers as a share of recommended teachers by province, school type and status, 2017
Notes: At one, the available teachers are equal to the recommended number of teachers. Province codes are: WS = Western. CN = Central. SU = Southern. NR = Northern. ES = Eastern. NW = North Western. NC = North Central. UV = Uva. SB = Sabaragamuwa. NS = National schools. Status codes are: HP =highly privileged. PR = privileged. NP = not privileged. UP = underprivileged. HU = highly underprivileged. Source: Own calculations based on School Census data (MOE, 2017). Some clear patterns are discernable across the different school categorizations. The regional distribution of teachers indicates that national schools and provincial schools in the Southern, Western, Uva, and Sabaragamuwa provinces have more than required mathematics teachers on average (a share above one). Close to 100% of these teachers are in-field (and either experienced or inexperienced) in national schools and 84% in Southern provincial schools, whereas a large share of teachers in the Uva and Sabaragamuwa provinces are unqualified. On the other hand, teacher shortages are prominent in the Eastern and North Western provinces. Across school type and status, the shares of available teachers gradually decline with rank. The composition of teachers shows a parallel trend: in-field mathematics teachers (both experienced and
12
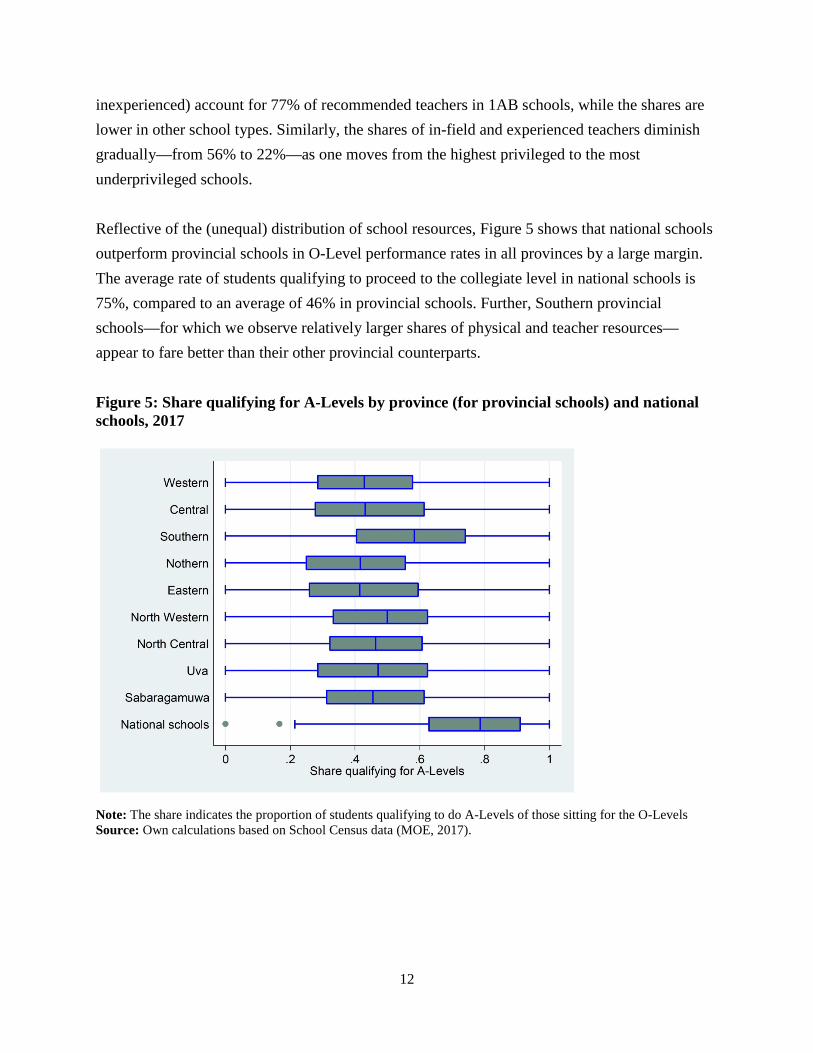
inexperienced) account for 77% of recommended teachers in 1AB schools, while the shares are lower in other school types. Similarly, the shares of in-field and experienced teachers diminish gradually—from 56% to 22%—as one moves from the highest privileged to the most underprivileged schools. Reflective of the (unequal) distribution of school resources, Figure 5 shows that national schools outperform provincial schools in O-Level performance rates in all provinces by a large margin. The average rate of students qualifying to proceed to the collegiate level in national schools is 75%, compared to an average of 46% in provincial schools. Further, Southern provincial schools—for which we observe relatively larger shares of physical and teacher resources—appear to fare better than their other provincial counterparts. Figure 5: Share qualifying for A-Levels by province (for provincial schools) and national schools, 2017
Note: The share indicates the proportion of students qualifying to do A-Levels of those sitting for the O-Levels Source: Own calculations based on School Census data (MOE, 2017).

13
3 Data and methods 3.1 Data We utilize a cross-section of school-level data from the annual School Census of government schools conducted by the MOE, for the year 2017. The School Census provides detailed data on schools as well as teachers. School information reports all physical and human resources of each school, while teacher information ranges from demographic information of teachers to their academic qualifications and experience. We obtain province-level information from the Department of Census and Statistics of Sri Lanka (DCS). The 2017 Census covers all 10,194 public schools in the country. Our sample, which focuses on O-Level examination performance, consists of 5,437 schools. We exclude schools which have only primary and lower secondary classes (4,076 schools), those for which the dependent variable is either missing or takes on unrealistic values (values above one) (522 schools), and those for which information on two independent variables—the shares of scholarship qualified students and school community funds—is missing (159 schools).8 Our dependent variable is the share of students who sit for the O-Level examination that qualify to continue studies at the A-Levels in each school. 3.2 Methods We commence with an OLS estimation and then proceed to a hierarchical linear modeling technique to account for relationships among ordered levels of grouped data. 3.2.1 Ordinary least squares We estimate the following model for a cross-section of schools for the year 2017: 𝑌𝑖 = 𝛼 + 𝑺𝑖′𝛽 + 𝑻𝑖′𝛾 + 𝑷𝑖′𝛿 + 𝜀𝑖 (1) where Y is an indicator of educational performance in school i, measured as the share of students qualifying from the O-Levels to proceed to A-Level classes; S is a vector of school and student socioeconomic characteristics potentially affecting O-Level performance; T is a vector of variables capturing teacher and principal quality; P is a vector of provincial-level socioeconomic characteristics; and ε is an error term. 8 These two variables are described in the subsequent section.

14
Our school characteristic variables consist of: (1) five dummy variables for the five groupings of school status; (2) three dummy variables for the three school types; and (3) three dummy variables capturing school size, measured by the total number of students in a school. School size is important in the Sri Lankan context, where parents prefer to send their children to larger and more prestigious schools with superior facilities (Arunatilake, 2006). The three size groupings we consider are schools with student numbers below 200 (low), between 200 and 1,000 (average), and over 1,000 (large).9 Our S vector also includes proxy variables for the general socioeconomic status of students in a school, given the unavailability of student-level data. One is the share of funds a school receives from parents, well-wishers, and past pupil associations: existing literature indicates that schools attended by children with more affluent parents or from richer communities attract more funds (Arunatilake and Jayawardena, 2013). Another proxy is a dummy variable indicating whether a school has a functioning school meal program. Such programs target poor and food insecure areas to improve nutrition levels of children (World Bank, 2014), and hence are more likely to be operational in schools attended by students of low socioeconomic status. Lastly, our S vector controls for the share of grade six students who gained admission to a school based on results obtained at the grade five scholarship exam. We use this variable as a proxy for the proportion of scholarship holders who sit for the O-Levels.10As mentioned before, a key objective of this exam is to provide financial assistance to talented economically disadvantaged students. This variable therefore serves as a measure of student ability as well as affluence. The teacher quality variables included in the T vector are the shares of in-field and experienced teachers, infield and inexperienced teachers, and other teachers, out of recommended teacher numbers in each school. We focus on mathematics, Sinhala, and Tamil teachers, since it is essential to pass these subjects at the O-Levels to progress to A-Level classes.11 We also account
9 This categorization is based on the recommended number of five classes of 30 students for each grade. For the six grades of secondary education (grades 6–11), this implies a total of 900 students. A student size of 200 would indicate that the entire secondary section just marginally exceeds the 150 recommended for one grade, and hence “low”. The “large” category above 1,000 reflects schools with student numbers that exceed the recommended average of 900. 10 The shares of scholarship holders as well as the share that pass the O-Level exam are both for the year 2015 in our sample. As such, we use the share of scholarship holders as a proxy for the scholarship holders sitting for O-Levels, assuming that this proportion remains roughly constant over the years in a given school. 11 The School Census groups Sinhala and Tamil teachers into one category (termed mother language) in questions relating to teacher qualifications and the subject taught. Accordingly, we include a common category (termed first language) for teachers of both languages.

15
for teacher leave, given the potential importance of teacher commitment in determining student performance. The measure we include is the average number of days of leave taken by teachers in a school as a proportion of the total number of annual school days. The teacher service categorization based on classes also applies to principals, which takes into account educational and professional qualifications, experience in administration and teaching, as well as problem-solving, logical thinking, and communication skills (MOE, 2014c; MOE, 2015). Based on such criteria, the Classes are, in descending order of ranking: (1) Sri Lanka Education Administration Service (SLEAS); (2) Sri Lanka Principals Service (SLPS); (3) Sri Lanka Teachers Service (SLTS); and (4) those not absorbed into teacher service. We combine categories (3) and (4) in our analysis, which both account for a low number of observations.12 Subsequently, we include three dummy variables for the SLEAS, SLPS, and the combined SLTS and non-teacher service grades to account for the quality of principals in a school. The student-teacher ratio, class size, and teacher salaries are other frequently used measures of school quality in the existing literature (Aturupane et al., 2013; Fowler and Walberg, 1991; Lekholm, 2011). However, these variables are not good indicators of school quality in Sri Lanka. Concerning student-teacher ratios and class sizes, although lower magnitudes are assumed to indicate better quality, as mentioned above, the opposite appears to be the case in Sri Lanka. With regard to teacher salaries, the MOE determines teacher salaries for given levels of qualifications and experience at the central level, and, as such, these do not vary much across schools (Arunatilake, 2006). Our final set of independent variables included in vector P consists of provincial-level factors that reflect the socioeconomic status of the province each school belongs to. We consider the poverty headcount ratio, the unemployment rate, and the urbanization rate in each province.13 3.2.2 Hierarchical linear modelling To account for potential correlation of performance rates within different levels in the education system, we next adopt a HLM approach, which is best suited when dealing with clustered or grouped data (Buxton, 2008). Due to the unavailability of student- and classroom-level data, we 12 It is unusual to expect principals that are only of the Teachers Service grade or who do not belong to a service grade. It is possible that schools with principals of either of these categories are political appointees without regard to qualifications or experience. 13 While GDP per capita is a potential important provincial variable, we omit this variable from our analysis due to high correlation between GDP per capita and the poverty headcount ratio and GDP per capita and urbanization rates.

16
focus on a two-level hierarchical model, consisting of the school level (level 1) and the national/provincial MOE level (level 2).14 There is a high likelihood that the test scores of students within the same school are correlated due to access to the same school resources and teachers/teaching methods. Similarly, average school test scores within a given education ministry might be affected by the administrative capacity of a specific ministry and the socioeconomic status of the province to which a ministry belongs. This phenomenon is known as intra-class correlation (ICC), which represents the proportion of variance in the dependent variable that is explained by the grouping structure of the hierarchical model. Failure to account for ICC using conventional OLS regression models can deliver biased standard errors and confidence intervals, leading one to conclude that there are real effects, when what is observed is merely random variation (Raudenbush and Bryk, 2002). The ability to simultaneously investigate relationships within and between ordered levels of grouped data is another advantage of HLM, making it more efficient at accounting for variance among variables at different levels compared to OLS (Woltman et al., 2012). The preference of HLM for nested data also lies in the fewer number of assumptions needed compared to other statistical models. HLM does not require independence of observations, and can accommodate missing data and small and/or discrepant group sample sizes (Ibid). Each level in a multilevel analysis is represented by its own sub-model, and each sub-model explains the relationship between a set of explanatory variables and the dependent variable at that particular level. Accordingly, separate level 1 models (schools) are developed for each level 2 unit (education ministries). They take the form of regressions developed for each school i: 𝑌𝑖𝑗 = 𝛼𝑗 + 𝑿𝑖𝑗′ 𝛽𝑗 + 𝜀𝑖𝑗 (2)
where Yij is the O-Level qualified share of students in school i in education ministry j; Xij is a vector of the school, student, teacher, and principal characteristics described above; αj is the intercept of the qualified share in school i in education ministry j; βj is the regression coefficient associated with Xij for the jth education ministry; and ε is an error term.
14We note that our level 2 number of observations, at 10, is a relatively small number. Existing literature on sample requirements in HLM, however, appears inconclusive. While in general a larger sample is preferred (Maas and Hox 2005), it is also argued that the sample size that matters most is that at the level at which the effect is measured, which for us is the school-level. We also note that other published studies have used a low number of groups—as low as five—at the highest level in hierarchical models (Woo, 2010).
17
In the level 2 model, the level 1 regression coefficients (αj and/or βj) are used as outcome variables and are related to each of the level 2 predictors. In our analysis we use αj, the intercept, as the outcome variable, which is known as a random intercept model.15 This is shown in Equation (3) below: 𝛼𝑗 = 𝛾0 + 𝑷𝑗′𝛿0 + 𝑈0𝑗 (3)
where Pj is the vector of provincial-level characteristics; γ0 is the overall mean intercept adjusted for P; δ0 is the regression coefficient associated with P relative to the level 1 intercept; andU0j are random effects of the jth level 2 unit adjusted for P on the intercept. The intercept and regression coefficients of Equation (2) at level 1 are called fixed effects because the effect is fixed for a given value of the level 1 predictor variables. The error term U0j
of the level 2 Equation (3) is called a random effect because the values vary by the level 2 unit. This error term is unique to HLM and differentiates it from a standard OLS regression equation (Woltman et al., 2012). The final step in the analysis involves combining the two levels of models by substituting Equation (3) into Equation (2), where variables and coefficients are grouped according to the level of hierarchy they affect: 𝑌𝑖𝑗 = 𝛾0 + 𝑷𝑗′𝛿0 + 𝑿𝑖𝑗′ 𝛽𝑗 + 𝑈0𝑗 + 𝜀𝑖𝑗 (4)
The combined model illustrated in Equation (4) includes the level 1 and level 2 predictors and a composite error (𝑈0𝑗 + 𝜀𝑖𝑗). Equation (4) is often referred to as a mixed model because it
includes both fixed and random effects (Gill, 2003). HLM is generally warranted when the ICC is of significant magnitude, generally above 10% (Occhipinti, 2012). Estimation of a “null” or “unconditional” hierarchical model—an intercept-
15 Here we assume a fixed slope of the regression line across provinces. In other words, the impact of the independent variables on O-Level performance is assumed to be the same for all provinces. This assumption is suited to our aim of estimating regression coefficients. It is also possible to allow for different slopes across provinces by estimating a random slope model, where the regression coefficient, or β, is also used as an outcome variable.
18
only model with no explanatory variables—enables calculation of the ICC. The null model can be specified as below, which is a condensed form of Equations (2) and (3): 𝑌𝑖𝑗 = 𝛾0+𝑈0𝑗 + 𝜀𝑖𝑗 (5)
where, as before, γ0 is the overall mean intercept; U0j is a random education ministry-specific effect on the intercept; and εij is an error term. Denoting the variance of εij as 𝜎2ε and the variance of U0j as 𝜎2u, the ICC is calculated as a ratio of the level 2 residual variance (𝜎2
u) over the total error variance:
ICC = 𝜎𝑢2
𝜎𝑢2+𝜎𝜀2 (6)
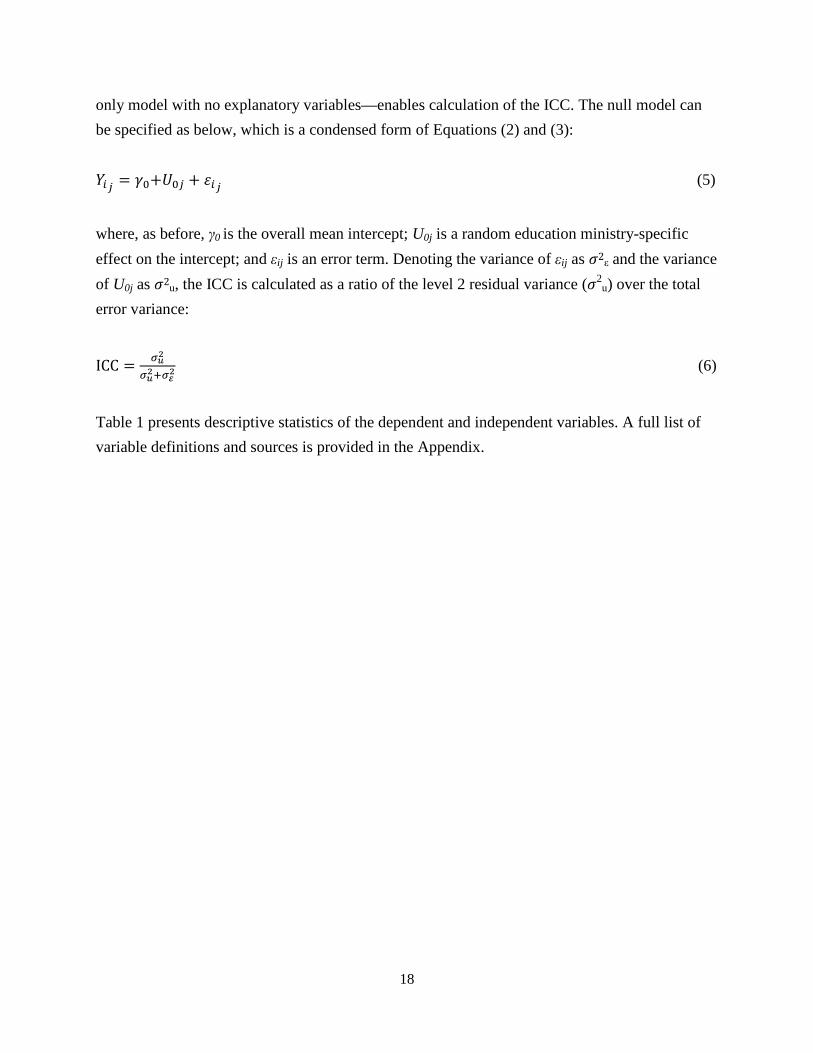
Table 1 presents descriptive statistics of the dependent and independent variables. A full list of variable definitions and sources is provided in the Appendix.
19
Table 1: Descriptive statistics Variables Mean Standard deviation Minimum Maximum
Dependent variable Rate qualified to progress to A-Level classes 0.48 0.25 0 1 School characteristics Highly privileged schools 0.13 0.34 0 1 Privileged schools 0.39 0.49 0 1 Not privileged schools 0.25 0.43 0 1 Underprivileged schools 0.15 0.36 0 1 Highly underprivileged schools 0.08 0.27 0 1 1AB schools 0.18 0.38 0 1 1C schools 0.32 0.47 0 1 Type 2 schools 0.50 0.50 0 1 Students less than 200 0.29 0.45 0 1 Students between 200-1000 0.55 0.50 0 1 Students over 1000 0.16 0.36 0 1 Scholarship exam qualified 0.02 0.10 0 1 Student socio-economic characteristics School community funds 0.25 0.25 0 1 School meal program 0.81 0.39 0 1 Teacher characteristics In-field and experienced math teachers 0.43 0.47 0 3 In-field and inexperienced math teachers 0.19 0.35 0 3 Other math teachers 0.42 0.53 0 5 In-field and experienced first-language teachers 0.34 0.48 0 3 In-field and inexperienced first-language teachers 0.08 0.26 0 2 Other first-language teachers 0.30 0.46 0 4 Teacher leave 0.15 0.04 0 0.34 Principal characteristics SLEAS 0.05 0.22 0 1 SLPS 0.74 0.44 0 1 SLTS/No Teacher Service 0.21 0.41 0 1 Provincial characteristics Poverty 8.11 4.09 2.0 16.55 Unemployment 4.79 0.85 3.1 5.9 Urbanization 14.53 11.66 4.0 38.8 Note: Teacher shares based on qualifications and experience may not add up to one for each group, as shares are shown as a percentage of recommended—as opposed to the total—number of teachers.
4 Results 4.1 Pooled sample estimates Table 2 presents estimates depicting the relationship between school resources and O-Level performance in Sri Lanka. Estimation of a null multilevel model produces an ICC of 0.15, implying that 15% of the total variation in test scores can be attributed to differences between education ministries each school falls under. Our main focus is on the HLM estimates in column 2, which is our preferred model. They indicate that O-Level performance lags behind that of very privileged schools in highly

20
underprivileged schools by 0.03 percentage points. The qualifying share of students for A-Level classes in 1C and Type 2 schools is lower than 1AB schools, by 0.06 and 0.13 percentage points, respectively. A similar trend is reflected in the school size variables, with average- and low-sized schools lagging behind their larger counterparts. The share of scholarship exam qualified students in a school has a relatively large positive impact on student performance, while the support received from parents, past pupil associations, and well-wishers also matter. Our estimates also show that teachers are important for student performance. With respect to mathematics teachers, it appears that all teachers—irrespective of their qualifications and level of experience—contribute significantly to O-Level results: for instance, controlling for other factors, a 10 percentage point increase in a school’s share of mathematics teachers—whether in-field, out-of-field, experienced or inexperienced—raises the share of A-Level qualifying students by 0.2-0.3 percentage points, on average. First language teachers, on the other hand, need to be in-field and experienced to have a positive impact on O-Level scores. The amount of leave taken as a proportion of working school days has a relatively large adverse impact on examination outcomes. The qualifications and experience of principals also matter: compared to the SLEAS category, principals belonging to the other two categories lower students’ chances of progressing to A-Levels. Of the provincial level variables, higher community-level unemployment rates raise the likelihood of better performance. It is probable that students are motivated to perform well and compete for limited jobs in provinces with lower employment opportunities. Our HLM estimates are largely similar—both in terms of magnitude and level of significance—to the OLS estimates shown in column 1. This similarity could be partly attributable to the relatively low value of the ICC, indicating that correlation in outcomes within schools falling under each education ministry is not overly significant so as to invalidate the results of models such as OLS which do not account for variation in outcomes at the education ministry level. Our explanatory variables are able to explain approximately 22% of the sample variation in O-Level performance rates across schools. It is possible that student-level characteristics—which we are unable to adequately account for—have a larger bearing on examination outcomes. Further, the increasing significance of private tutoring which operates on a large scale in Sri Lanka (Pallegedara, 2011; Sedere et al., 2016) could lower the impact that school-level characteristics have on student performance.16
16 We are unable to directly control for private tutoring due to data unavailability. Our proxies for student socioeconomic characteristics and the provincial level variables serve as indirect indicators of trends in tutoring across schools.

21
Table 2: School-level determinants for pooled sample Specification OLS HLM
(1) (2) Privileged -0.01 -0.01 (0.01) (0.01) Not privileged 0.00 0.00 (0.01) (0.01) Underprivileged -0.00 -0.00 (0.01) (0.01) Highly underprivileged -0.03** -0.03* (0.02) (0.02) 1C -0.06*** -0.06*** (0.01) (0.01) Type 2 -0.13*** -0.13*** (0.01) (0.01) Students between 200-1000 -0.11*** -0.10*** (0.01) (0.01) Students below 200 -0.13*** -0.12*** (0.01) (0.01) Scholarship exam qualified 0.27*** 0.25*** (0.03) (0.03) School community funds 0.03** 0.04*** (0.01) (0.01) School meal program 0.00 0.00 (0.01) (0.01) In-field and experienced math teachers 0.03*** 0.03*** (0.01) (0.01) In-field and inexperienced math teachers 0.03*** 0.02** (0.01) (0.01) Other math teachers 0.02** 0.02** (0.01) (0.01) In-field and experienced first-language teachers 0.02*** 0.02** (0.01) (0.01) In-field and inexperienced first-language teachers -0.02 -0.02* (0.01) (0.01) Other first-language teachers 0.01 0.01 (0.01) (0.01) Leave -0.27*** -0.39*** (0.09) (0.09) SLPS -0.07*** -0.06*** (0.02) (0.02) SLTS/Non-Teacher Service -0.06*** -0.05*** (0.02) (0.02) Poverty -0.00*** -0.01 (0.00) (0.00) Urbanization rate -0.00*** -0.00** (0.00) (0.00) Unemployment rate 0.02*** 0.02* (0.00) (0.01) Observations 5,437 5,437 R2 0.22 Number of groups - 10
22
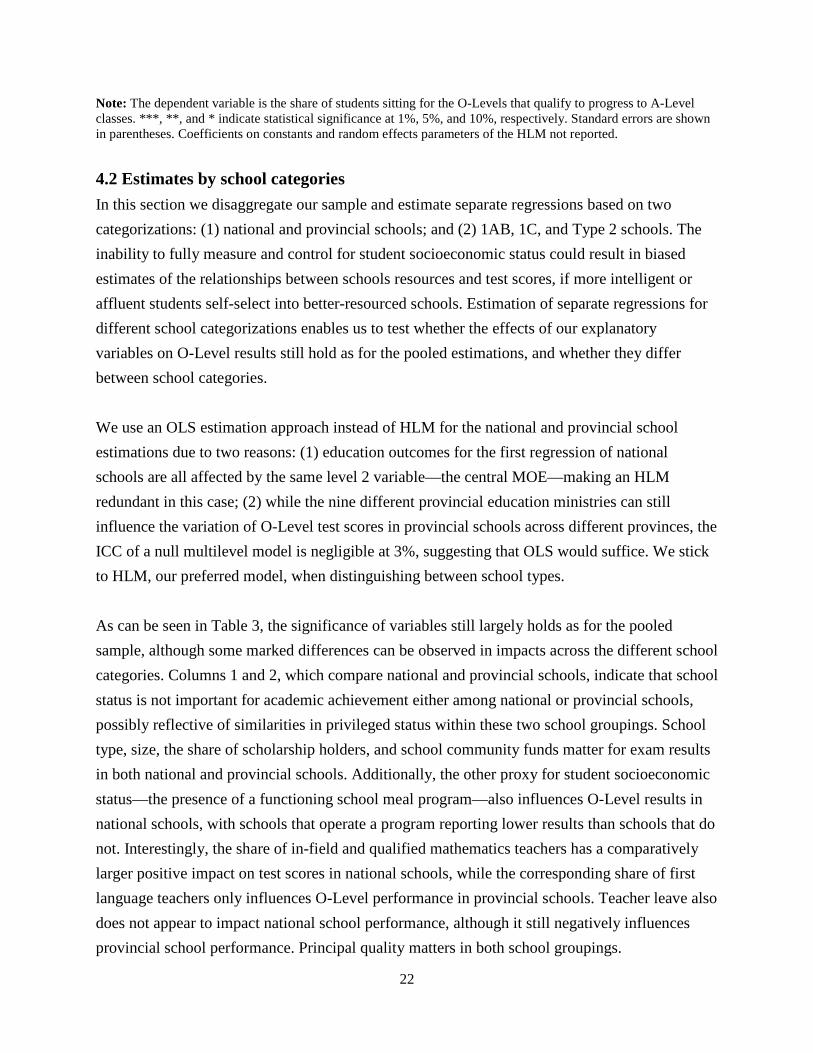
Note: The dependent variable is the share of students sitting for the O-Levels that qualify to progress to A-Level classes. ***, **, and * indicate statistical significance at 1%, 5%, and 10%, respectively. Standard errors are shown in parentheses. Coefficients on constants and random effects parameters of the HLM not reported. 4.2 Estimates by school categories In this section we disaggregate our sample and estimate separate regressions based on two categorizations: (1) national and provincial schools; and (2) 1AB, 1C, and Type 2 schools. The inability to fully measure and control for student socioeconomic status could result in biased estimates of the relationships between schools resources and test scores, if more intelligent or affluent students self-select into better-resourced schools. Estimation of separate regressions for different school categorizations enables us to test whether the effects of our explanatory variables on O-Level results still hold as for the pooled estimations, and whether they differ between school categories. We use an OLS estimation approach instead of HLM for the national and provincial school estimations due to two reasons: (1) education outcomes for the first regression of national schools are all affected by the same level 2 variable—the central MOE—making an HLM redundant in this case; (2) while the nine different provincial education ministries can still influence the variation of O-Level test scores in provincial schools across different provinces, the ICC of a null multilevel model is negligible at 3%, suggesting that OLS would suffice. We stick to HLM, our preferred model, when distinguishing between school types. As can be seen in Table 3, the significance of variables still largely holds as for the pooled sample, although some marked differences can be observed in impacts across the different school categories. Columns 1 and 2, which compare national and provincial schools, indicate that school status is not important for academic achievement either among national or provincial schools, possibly reflective of similarities in privileged status within these two school groupings. School type, size, the share of scholarship holders, and school community funds matter for exam results in both national and provincial schools. Additionally, the other proxy for student socioeconomic status—the presence of a functioning school meal program—also influences O-Level results in national schools, with schools that operate a program reporting lower results than schools that do not. Interestingly, the share of in-field and qualified mathematics teachers has a comparatively larger positive impact on test scores in national schools, while the corresponding share of first language teachers only influences O-Level performance in provincial schools. Teacher leave also does not appear to impact national school performance, although it still negatively influences provincial school performance. Principal quality matters in both school groupings.

23
Table 3: School-level determinants by school category Specification OLS HLM
National Provincial 1AB 1C Type 2 (1) (2) (3) (4) (5)
Privileged -0.01 -0.00 -0.03** -0.02 0.03 (0.02) (0.01) (0.01) (0.02) (0.02) Not privileged -0.09* 0.01 -0.01 -0.00 0.04* (0.05) (0.01) (0.02) (0.02) (0.02) Underprivileged 0.06 0.01 -0.02 -0.04* 0.05* (0.16) (0.01) (0.03) (0.02) (0.03) Highly underprivileged -0.11 -0.02 -0.08 -0.05** 0.02 (0.16) (0.02) (0.06) (0.03) (0.03) 1C -0.09*** -0.05*** - - - (0.04) (0.01) Type 2 -0.54*** -0.13*** - - - (0.16) (0.01) Students between 200-1000 -0.05** -0.11*** -0.10*** -0.09*** -0.14*** (0.03) (0.01) (0.01) (0.02) (0.03) Students below 200 - -0.13*** -0.20 -0.12*** -0.16*** (0.01) (0.17) (0.02) (0.03) Scholarship exam qualified 0.24*** 0.21*** 0.25*** 0.26** 0.02 (0.03) (0.05) (0.03) (0.11) (0.17) School community funds 0.08* 0.03** 0.04 0.03 0.04* (0.04) (0.01) (0.02) (0.02) (0.02) School meal program -0.05*** 0.01 -0.03*** 0.01 0.04* (0.02) (0.01) (0.01) (0.01) (0.02) In-field and experienced math teachers 0.07** 0.03*** 0.03** 0.03** 0.02** (0.03) (0.01) (0.02) (0.01) (0.01) In-field and inexperienced math teachers 0.05* 0.02** 0.02 0.02 0.02 (0.03) (0.01) (0.02) (0.02) (0.01) Other math teachers 0.01 0.02** -0.01 0.01 0.02* (0.03) (0.01) (0.02) (0.01) (0.01) In-field and experienced first-language teachers 0.04 0.02*** 0.01 0.00 0.02** (0.03) (0.01) (0.01) (0.01) (0.01) In-field and inexperienced first-language teachers 0.05 -0.02 0.01 0.00 -0.03* (0.08) (0.01) (0.03) (0.02) (0.02) Other first-language teachers -0.02 0.01 -0.02 0.01 0.01 (0.02) (0.01) (0.02) (0.01) (0.01) Leave -0.12 -0.29*** -0.39** -0.28* -0.41*** (0.28) (0.09) (0.18) (0.15) (0.13) SLPS -0.07*** -0.05** -0.08*** -0.01 0.03 (0.02) (0.02) (0.01) (0.03) (0.05) SLTS/Non-Teacher Service -0.01 -0.04* -0.04 0.01 0.03 (0.04) (0.02) (0.03) (0.03) (0.05) Poverty 0.00 -0.00*** -0.00 -0.00 -0.01** (0.00) (0.00) (0.00) (0.00) (0.00) Urbanization rate -0.00 -0.00*** -0.00 -0.00** -0.00*** (0.00) (0.00) (0.00) (0.00) (0.00) Unemployment rate 0.01 0.02*** 0.01 0.03* 0.02* (0.01) (0.00) (0.01) (0.01) (0.01) Observations 340 5,097 993 1,745 2,699 R2 0.46 0.14 - - Number of groups - - 10 10 10
24
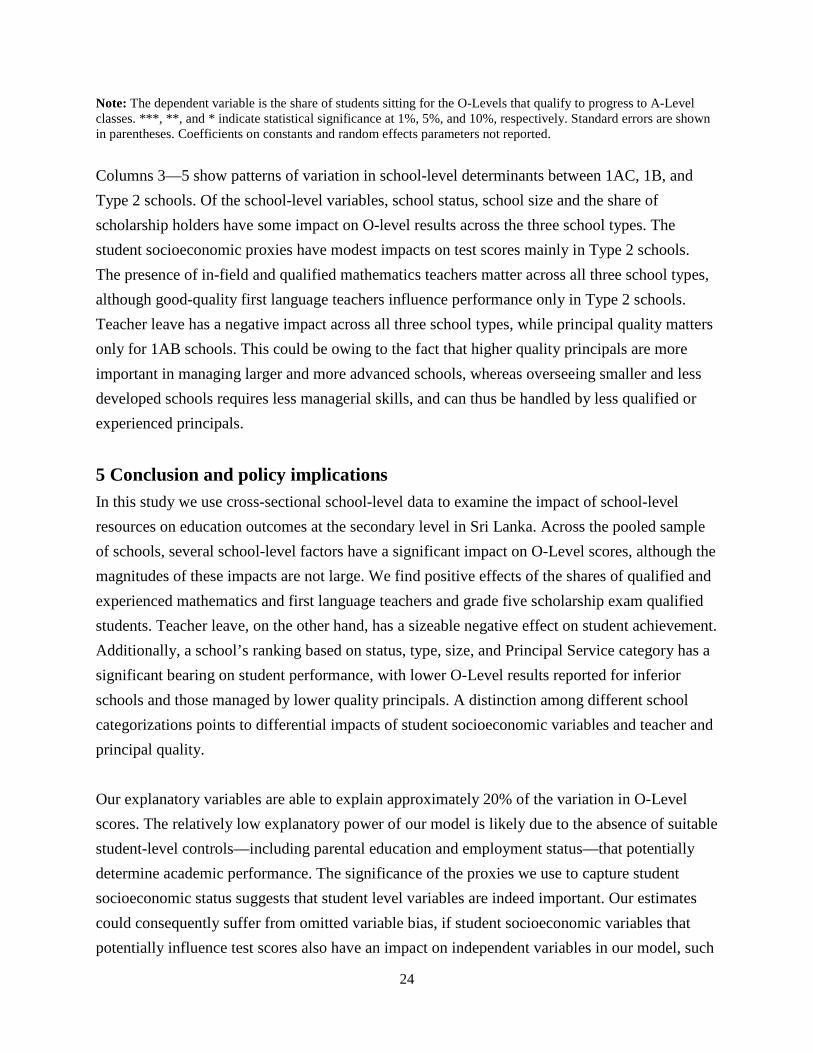
Note: The dependent variable is the share of students sitting for the O-Levels that qualify to progress to A-Level classes. ***, **, and * indicate statistical significance at 1%, 5%, and 10%, respectively. Standard errors are shown in parentheses. Coefficients on constants and random effects parameters not reported. Columns 3—5 show patterns of variation in school-level determinants between 1AC, 1B, and Type 2 schools. Of the school-level variables, school status, school size and the share of scholarship holders have some impact on O-level results across the three school types. The student socioeconomic proxies have modest impacts on test scores mainly in Type 2 schools. The presence of in-field and qualified mathematics teachers matter across all three school types, although good-quality first language teachers influence performance only in Type 2 schools. Teacher leave has a negative impact across all three school types, while principal quality matters only for 1AB schools. This could be owing to the fact that higher quality principals are more important in managing larger and more advanced schools, whereas overseeing smaller and less developed schools requires less managerial skills, and can thus be handled by less qualified or experienced principals.
5 Conclusion and policy implications In this study we use cross-sectional school-level data to examine the impact of school-level resources on education outcomes at the secondary level in Sri Lanka. Across the pooled sample of schools, several school-level factors have a significant impact on O-Level scores, although the magnitudes of these impacts are not large. We find positive effects of the shares of qualified and experienced mathematics and first language teachers and grade five scholarship exam qualified students. Teacher leave, on the other hand, has a sizeable negative effect on student achievement. Additionally, a school’s ranking based on status, type, size, and Principal Service category has a significant bearing on student performance, with lower O-Level results reported for inferior schools and those managed by lower quality principals. A distinction among different school categorizations points to differential impacts of student socioeconomic variables and teacher and principal quality. Our explanatory variables are able to explain approximately 20% of the variation in O-Level scores. The relatively low explanatory power of our model is likely due to the absence of suitable student-level controls—including parental education and employment status—that potentially determine academic performance. The significance of the proxies we use to capture student socioeconomic status suggests that student level variables are indeed important. Our estimates could consequently suffer from omitted variable bias, if student socioeconomic variables that potentially influence test scores also have an impact on independent variables in our model, such
25
as school status or school size. Future research might account for and explore in more detail the role of student-level characteristics in determining academic performance in Sri Lanka, subject to data availability.
Our results point to several implications for improving student performance at the O-Levels in Sri Lanka. The finding that O-Level results are lower in both smaller schools and 1C and Type 2 schools holds even after controlling for the share of grade five scholarship exam qualified students, suggesting that lower performance is not only due to differences in ability. These schools—the majority of which are provincial schools—thus require special attention if the overall O-Level performance rate is to be increased nationally. The significant positive relationship observed between high quality teachers and student achievement highlights the need for developing policies to ensure that schools attract, support, and retain qualified and experienced staff members. The systematic training and recruitment of teachers into teacher service is important in this regard. Existing research points to limited avenues for pre-service teacher training in Sri Lanka, and the subsequent ad-hoc recruitment of teachers without regard to qualifications and training (Sethunga et al., 2016; Arunatilake and Abayasekara, 2017). Our analysis also indicates that better performing schools—particularly national, southern provincial, 1AB, and highly privileged schools—have more than adequate numbers of mathematics teachers, while poorer schools face teacher shortages, particularly teachers of higher quality. A reallocation of qualified and experienced teachers from better performing schools to low-achieving schools is thus important. Relocating teachers is however a challenging task, given that teachers prefer to remain in privileged schools, with good administrative and pedagogical support. Sri Lanka’s current teacher recruitment structure reinforces such tendencies. At present teachers are required to serve in highly underprivileged or underprivileged schools for a minimum of only three years (MOE, 2007). Given the large share of underprivileged schools, this requirement is inadequate to ensure quality teachers in such schools. The tendency for teachers to move away from disadvantaged schools is also encouraged by recruitment of teachers at the Central MOE level, which affords flexibility in moving between schools. Giving schools powers to recruit teachers at the school-level could restrict teacher mobility. While less privileged schools may not necessarily succeed in attracting in-field teachers, with more restrictions on teacher movement, recruited teachers in
26
these schools will gain experience overtime, which, along with in-service training, would improve teacher quality. Providing sufficient financial and other incentives to attract and retain good quality teachers in disadvantaged schools is another important measure in meeting reallocation targets. Such incentives need to be large enough to be significant, and should be complemented by appropriate support and development to ensure that teachers have the capacity to be successful in disadvantaged and low-performing schools (OECD, 2012). Other related incentives, such as formally recognizing teaching in difficult schools in the advancement of the teaching career path, are also key. Evidence supporting the effectiveness of monetary incentives have been documented in the US (Clotfelter et al., 2008), while a combination of incentives including additional salaries, smaller class sizes, less instructional time, credit towards future promotion to administrative positions, and the ability to select the next school where one works, have proved successful in retaining good quality teachers in low-performing schools in South Korea (Kang and Hong, 2008). Our findings also show that student achievement is low in schools when the number of days of leave taken by teachers is high. Descriptive statistics indicate an average share of teacher leave days of 15% of total working school days, which is not an insignificant figure. In fact, teacher absenteeism appears to be a notable problem in many developing countries, with national averages of teacher absenteeism ranging from 3—27% (Guerrero et al. 2012). Both direct and indirect interventions have been implemented in several countries to improve teacher attendance, which provide useful examples for Sri Lanka to emulate. For example, program impact evaluations in India (Duflo and Hanna, 2005) and Peru (Cueto et al., 2008) show that combining monetary incentives with monitoring systems is effective in improving teacher attendance. Similarly, studies find that teacher satisfaction—in terms of the school environment (e.g. having a supportive school principal), their workload, and the availability of opportunities for professional development—has a significant and positive effect on teacher attendance (Abeles, 2009; Gaziel, 2004). Evidence also points to the importance of active parental and community involvement in schools as an indirect channel through which teacher absenteeism can be addressed (Vegas, 2007, cited in Guerrero et al., 2012). Lastly, our results reveal that schools managed by better qualified and experienced principals perform better at the O-Levels. The competency of principals and the school administration is also important in ensuring adequate numbers of different types of teachers in schools (Ingersoll,

27
2002). It is disconcerting to note that, on average, 27% of schools in our sample are managed by individuals who are not in either the SLEAS or SLPS grades. Enhancing the quality of principals’ training programs and the recruitment to Principal Service in a systematic and merit-based manner is key in ensuring that the majority of Sri Lankan schools are overseen by competent leaders.
28
References Abeles, L.R. (2009).“Absenteeism among Teachers – Excused Absence and Unexcused Absence. International Journal of Educational Administration, 1(1): 31—49. Akiba, M., LeTrende, G.K. and Sribner, J.P. (2007). “Teacher Quality, Opportunity Gap, and National Achievement in 46 Countries.” Educational Researcher, 36(7), 369—387. Arunatilake, N. (2006). “Education Participation in Sri Lanka – Why All are not in School.” International Journal of Educational Research, 45(3), 137—152. Arunatilake, N. and Abayasekara, A. (2017). “Are there Good Quality Teachers for all Classrooms in Sri Lanka?” Colombo: Institute of Policy Studies. Arunatilake, N., and Jayawardena, P. (2010). “Formula Funding and Decentralized Management of Schools – Has it Improved Resource Allocation in Schools in Sri Lanka?” International Journal of Educational Development, 30(1), 44—53. Arunatilake, N., and Jayawardena, P. (2013). “School Funding Formulas in Sri Lanka”. Paper commissioned for the EFA Global Monitoring Report 2013/4, Teaching and Learning: Achieving Quality for All. Geneva: UNESCO. Asim, S., Chase, R.S., Dar, A. and Schmillen, A. (2015). “Improving Education Outcomes in South Asia: Findings from a Decade of Impact Evaluations.” Policy Research Working Paper 7362, World Bank Group. http://documents.worldbank.org/curated/en/254411468188375892/pdf/WPS7362.pdf. Aturupane, H., Glewwe, P. & Wisniewski, S. (2013). “The Impact of School Quality, Socio-economic Factors and Child Health on Students’ Academic Performance: Evidence from Sri Lankan Primary Schools’, Education Economics, 21(1), 2—37. Banerjee, A., Cole, S., Duflo, E. and Linden, L. (2005). “Remedying Education: Evidence from Two Randomized Experiments in India.” Working Paper 11904, National Bureau of Economic Research, Massachusetts. http://www.nber.org/papers/w11904.pdf.
29
Buxton, R. (2008). “Multilevel Modelling”. Mathematics Learning Support Centre.http://www.statstutor.ac.uk/resources/uploaded/multilevelmodelling.pdf. Central Bank of Sri Lanka. (2016). Annual Report 2016. Colombo: Central Bank of Sri Lanka. Clotfelter, C.T., Glennie, E.J., Ladd, H.F. and Vigdor, J. L. (2008). “Teacher Bonuses and Teacher Retention in Low Performing Schools: Evidence from the North Carolina USD1,800 Teacher Bonus Program”. Public Finance Quarterly, 36(1), 63—87. Clotfelter, C. T., Ladd, H. F., and Vigdor, J. L. (2010). “Teacher Credentials and Student Achievement in High School: A Cross-Subject Analysis with Student Fixed Effects”. Journal of Human Resources, 45(3), 655—681. Cueto, S., Torero. M., León, J andDeustua, J. (2008).“Teaching Assistance and School Performance: The Case of the META Program.” Working Paper No. 53, GRADE, Lima. De Silva, E. J. (2003). “Situational Analysis of General Education – Management of Education”. National Education Commission. Colombo: National Education Commission. Department of Census and Statistics of Sri Lanka. (2013a). Census of Population and Housing Sri Lanka 2012. http://www.statistics.gov.lk/PopHouSat/CPH2011/Pages/Activities/Reports/SriLanka.pdf. Department of Census and Statistics of Sri Lanka. (2013b). Household Income and Expenditure Survey 2012–13. Colombo: Department of Census and Statistics. Department of Census and Statistics of Sri Lanka. (2015a). The Spatial Distribution of Poverty in Sri Lanka.http://www.statistics.gov.lk/poverty/SpatialDistributionOfPoverty2012_13.pdf. Department of Census and Statistics of Sri Lanka. (2015b).Sri Lanka Labour Force Survey: Annual Report 2015. http://www.statistics.gov.lk/samplesurvey/LFS_Annual%20Report_2015.pdf . Department of Examinations of Sri Lanka. (2016). G.C.E (O.L) Examination 2015: Performance of Candidates. http://www.doenets.lk/exam/docs/ol2016/G.C.E.(OL)%202015%20BOOK%20.pdf.
30
Duflo E. and Hanna, R. (2005). “Monitoring Works: Getting Teachers to Come to School.” Working Paper No.11880, National Bureau of Economic Research, Massachusetts. http://www.nber.org/papers/w11880.pdf. Fowler, W.J. and Walberg, H.J. (1991). “School Size, Characteristics, and Outcomes”. Educational Evaluation and Policy Analysis, 13(2), 189—202. Gaziel, H.H. (2004).“Predictors of Absenteeism among Primary School Teachers”.Social Psychology of Education, 7, 421—434. Gill, J. (2003). “Hierarchical Linear Models” in Kimberly Kempf-Leonard (ed.), Encyclopedia of Social Measurement. New York: Academic Press. Greenwald, R., Hedges, L., and Laine, R. (1996). “The Effect of School Resources on Student Achievement”.Review of Educational Research, 66, 361—396. Guerrero, G., Leon, J., Zapata, M., Sugimaru, C., and Cueto, S. (2012). “What Works to Improve Teacher Attendance in Developing Countries? A Systematic Review.” London: EPPI Centre, Social Science Research Unit, Institute of Education, University of London. https://eppi.ioe.ac.uk/cms/Portals/0/PDF%20reviews%20and%20summaries/Teacher%20attendance%202012Guerrero.pdf?ver=2013-03-07-143834-057. Hanushek, E.A. (1997). “Assessing the Effects of School Resources on Student Performance: An Update.” Educational Evaluation and Policy Analysis, 19(2), 141—164. Hedges, L., Laine, R., and Greenwald, R. (1994). “A Meta-Analysis of the Effects of Differential School Inputs on Student Outcomes.” Educational Researcher, 23, 5—14. Heyneman, S.P. and Loxley, W.A. (1983). “The Effect of Primary-School Quality on Academic Achievement across Twenty-nine High- and Low-Income Countries.” American Journal of Sociology, 88(6), 1162—1194. Hill, H.C., Rowan, B. and Ball, D.L. (2005). “Effects of Teachers’ Mathematics Knowledge for Teaching on Student Achievement.” American Educational Research Journal, 42(2), 371–406.
31
Ingersoll, R.M. (2002). “Out-of-Field Teaching, Educational Inequality, and the Organization of Schools: An Exploratory Analysis.” Center for the Study of Teaching and Policy. http://www.cpre.org/sites/default/files/researchreport/796_outoffield-ri-01-2002.pdf. Kang, N. and M. Hong. (2008). “Achieving Excellence in Teacher Workforce and Equity in Learning Opportunities in South Korea.” Educational Researcher, 37, 200—207. Kennedy, M. (1992). “The Problem of Improving Teacher Quality while Balancing Supply and Demand, in E. Boe, and D. Gilford (Eds.), Teacher Supply, Demand and Quality, pp. 63—126. Washington, DC: National Academy Press. Kingdon, G.G. (2006). “Teacher Characteristics and Student Performance in India: A Pupil Fixed Effects Approach.” Working Paper No. 059, Global Poverty Research Group, Oxford. http://www.gprg.org/pubs/workingpapers/pdfs/gprg-wps-059.pdf. Lekholm, A.K. (2011). “Effects of School Characteristics on Grades in Compulsory School”. Scandinavian Journal of Educational Research, 55(6), 587—608. Maas, C.J.M. and Hox, J.J. (2005). “Sufficient Sample Sizes for Multilevel Modeling.” Methodology, 1(3), 86—92. McEwan, P.J. (2015). “Improving Learning in Primary Schools of Developing Countries: A Meta-Analysis of Randomized Experiments.” Review of Educational Research, 85(3), 353–394. Ministry of Education of Sri Lanka. (2005). Implementation of Rules and Regulations of Sri Lanka Teacher Service Statute /Minute and National Teacher Transfer Policy. Circular No. 2005/01. http://www.moe.gov.lk/english/images/stories/circulars/2005-01s.pdf. Ministry of Education of Sri Lanka. (2007). National Teacher Transfer Policy. Circular No. 2007/20. http://www.moe.gov.lk/english/images/stories/circulars/2007_20e.pdf. Ministry of Education of Sri Lanka. (2008). Admission of Students in GCE Advanced Level Classes. Circular No. 2008/17-11. http://www.moe.gov.lk/english/images/stories/circulars/2008-17iiis.pdf.
32
Ministry of Education of Sri Lanka. (2014a). Reducing School Dropouts Due to Failure of Mathematics at the GCE Ordinary Level Exam. Circular No. 2014/26. Ministry of Education of Sri Lanka. (2014b). Service Minute of Sri Lanka Teachers’’ Service. Gazette No. 1885/38. http://www.moe.gov.lk/english/images/Services/SLTS/Gazzette2014-10-231885_38_E.pdf. Ministry of Education of Sri Lanka. (2014c). Education Services:Service Minute of the Sri Lanka Principals Service.http://www.education.gov.lk/english/images/Services/SLPS/principalserviceminitue2014_10_21e.pdf. Ministry of Education of Sri Lanka. (2015). Education Services: Service Minute of the Sri Lanka Education Administration Service.http://www.education.gov.lk/english/images/Services/SLEAS/2015/SLEAS_New_Service_Minute_2015_08_21_En.pdf. Ministry of Education of Sri Lanka. (2016). Determination of Academic Staff in a School. Circular No. 01/2016. http://www.moe.gov.lk/english/images/stories/circulars/2016_01s.pdf. Ministry of Education of Sri Lanka. (2017). School Census – 2016 June 1. Battaramulla: Ministry of Education of Sri Lanka. Muralidharan, K. and Sundararaman, V. (2009). “Teacher Performance Pay: Experimental Evidence from India.” Working Paper 15323, National Bureau of Economic Research, Massachusetts. http://www.nber.org/papers/w15323.pdf. National Education Commission. (2003). Proposals for a National Policy Framework on General Education in Sri Lanka. Nugegoda: National Education Commission.http://nec.gov.lk/wp-content/uploads/2014/04/National_Policy_2003.pdf. National Education Commission. (2016). Proposals for a National Policy on General Education in Sri Lanka. Nugegoda: National Education Commission. http://nec.gov.lk/wp-content/uploads/2017/02/NEC-GEP-final-English7.pdf.

33
Occhipinti, S. (2012). “Mixed Modelling using Stata”. Griffith Health Institute. https://www.griffith.edu.au/__data/assets/pdf_file/0011/439346/Stata_mixed_intro-1.pdf. OECD. (2012).Equity and Quality in Education: Supporting Disadvantaged Students and Schools.Paris: OECD. https://www.oecd.org/education/school/50293148.pdf. Pallegedara, A. (2011). “Demand for Private Tuition Classes under the Free Education Policy: Evidence based on Sri Lanka”. MPRA Paper no. 31969. Munich Personal RePEc Archive. https://mpra.ub.uni-muenchen.de/31969/1/MPRA_paper_31969.pdf. Peske, H.G. and Haycock. K. (2006). “Teacher Inequality – How Poor and Minority Students are Shortchanged on Teacher Quality.” The Education Trust. http://edtrust.org/wp-content/uploads/2013/10/TQReportJune2006.pdf. Raudenbush, S. W. and Bryk, A. S. (2002). Hierarchical Linear Models: Applications and Data Analysis Methods. Newbury Park, CA: Sage. Rockoff, J.E. (2004). “The Impact of Individual Teachers on Student Achievement: Evidence from Panel Data.” The American Economic Review, 94(2), 247—252. Salloum, S., Goddard, R. and Larsen, R. (2017). “Social Capital in Schools: A Conceptual and Empirical Analysis of the Equity of Its Distribution and Relation to Academic Achievement.” Teachers College Record, 119, 1—29. Sedere, U.M., Karunaratne, S., Karunanithy, M. and Jayasinghe-Mudalige, U.K. (2016). “Study on Evaluation and the Assessment System in General Education in Sri Lanka.” Nugegoda: National Education Commission. http://nec.gov.lk/wp-content/uploads/2016/04/3-Final-.pdf. Sethunga, P., Wijesundera, S., Kalamany, T., and Karunanayake, S. (2016). “Study on the Professional Development of Teachers and Teacher Educators in Sri Lanka.”Nugegoda: National Education Commission.http://nec.gov.lk/wp-content/uploads/2016/04/2-Final-.pdf. Vegas, E. (2007). “Teacher Labor Markets in Developing Countries”. The Future of Children, 17(1), 219—232.

34
Willms, J.D. and Somer, M. (2001). “Family, Classroom, and School Effects on Children’s Educational Outcomes in Latin America.” School Effectiveness and School Improvement, 12(4), 409—445. Woltman, H., Feldstain, A., J. MacKay, C., and Rocchi, M. (2012). “An Introduction to Hierarchical Linear Modeling”. Tutorials in Quantitative Methods for Psychology, 8(1), 52—69. Woo, M.S. (2010). “Equity in Educational Resources at the School Level in Korea.” Asia-Pacific Education Review, 11, 553—564. World Bank. (2005). Treasures of the Education System in Sri Lanka: Restoring Performance, Expanding Opportunities and Enhancing Prospects. The World Bank, Human Resource Development Unit, Colombo. http://documents.worldbank.org/curated/en/986131468164667945/pdf/470340WP0Box331ebruary200501PUBLIC1.pdf. World Bank. (2014). “School Health and Nutrition in Sri Lanka”. Report No. 71, South Asia: Human Development Sector Discussion Paper Series. http://documents.worldbank.org/curated/en/231091468188678045/pdf/97773-NWP-P113488-Box391484B-PUBLIC.pdf. World Bank. (2017). World Development Indicators. http://databank.worldbank.org/data/home.aspx.

35
Appendix: Variable descriptions Dependent variable O-Level performance rate: The share of students who qualify to proceed to A-Level classes out of the total number of students who sit for the O-Levels in a school. Source: MOE (2016c). Independent variables School characteristics
• School status dummies: Highly privileged: A dummy variable, which equals one if the school is categorized
as highly privileged Privileged: A dummy variable, which equals one if the school is categorized as
privileged Not privileged: A dummy variable, which equals one if the school is categorized as
not privileged Underprivileged: A dummy variable, which equals one if the school is categorized as
underprivileged Highly underprivileged: A dummy variable, which equals one if the school is
categorized as highly underprivileged
• School type dummies: 1AB: A dummy variable, which equals one if the school has A-Level classes in the
Science stream in addition to the Commerce and Arts streams 1C: A dummy variable, which equals one if the school has A-Level classes in the
Commerce and Arts streams, but not in the Science stream Type 2: A dummy variable, which equals one if the schools has classes only up to O-
Levels
• School size dummies: Students above 1000: A dummy variable, which equals one if the school has a student
population above 1,000 Students between 200-1000: A dummy variable, which equals one if the school has a
student population between 200 and 1,000 Students below 200: A dummy variable, which equals one if the school has a student
population below 200
Scholarship exam qualified: The share of grade six students that gained admission to the school based on results obtained at the grade five scholarship examination. Source: MOE (2016c). Student socioeconomic characteristics
• School community funds: The share of total funds a school receives from parents, well-wishers and/or past pupil associations. Source: MOE (2016c).
36
• School meal program: A dummy variable, which equals one if the school has an operational meal program. Source: MOE (2016c).
Teacher and principal characteristics
• In-field and experienced mathematics teachers: The share of recommended mathematics teachers teaching mathematics in a school, who hold either a degree or diploma in mathematics and belong to Class2–Grade II or higher of Teacher Service. Source: MOE (2016c).
• In-field and inexperienced mathematics teachers: The share of recommended mathematics teachers teaching mathematics in a school, who hold either a degree or diploma in mathematics and belong to Class 3 of Teacher Service. Source: MOE (2016c).
• Other mathematics teachers: The share of recommended mathematics teachers teaching
mathematics in a school, who are either untrained in mathematics or not absorbed into Teacher Service, and belong to either Class 2 or Class 3 of Teacher Service. Source: MOE (2016c).
• In-field and experienced first language teachers: The share of recommended first
language teachers teaching the first language in a school, who hold either a degree or diploma in Sinhala or Tamil and belong to Class2—Grade II or higher of Teacher Service. Source: MOE (2016c).
• In-field and inexperienced first language teachers: The share of recommended first
language teachers teaching the first language in a school, who hold either a degree or diploma in Sinhala or Tamil and belong to Class 3 of Teacher Service. Source: MOE (2016c).
• Other first language teachers: The share of recommended first language teachers teaching the first language in a school, who are either untrained in the first language or not absorbed into Teacher Service, and belong to either Class 2 or Class 3 of Teacher Service. Source: MOE (2016c).
• Leave: The average number of days of leave taken by teachers of a given school as a
proportion of the total number of working school days. Source: MOE (2016c).
• Principal Service grade dummies: SLEAS: A dummy variable, which equals one if the school principal/acting principal
belongs to the SLEAS grade SLPS: A dummy variable, which equals one if the school principal/acting principal
belongs to the SLPS grade SLTS/ Non-Teacher Service: A dummy variable, which equals one if the school
principal/acting principal belongs to the Teacher Service grade or does not belong to Teacher Service
37
Provincial characteristics • Poverty: The poverty headcount ratio—the proportion of the population that exists below
the poverty line in each province. Source: DCS (2015a).
• Unemployment: The unemployment rate—the percentage of the labor force that is currently looking for, but without jobs in each province. Source: DCS (2015b).
• Urban: The urbanization rate—the share of population in the urban sector in each
province. Source: DCS (2013).


![[XLS] · Web viewSRI ARUN KR SINGH CHOWDH SRI ARUN KR VERMA SRI ARUN PAL SRI ARVIND KUMAR SRI ASIM KR BORA SRI ASIT BARAN SHEE SRI ATANU BISWAS SRI BABULAL HEMBRAM SRI BANAMALI PATI](https://static.fdocuments.in/doc/165x107/5b2802e07f8b9a42018b4709/xls-web-viewsri-arun-kr-singh-chowdh-sri-arun-kr-verma-sri-arun-pal-sri-arvind.jpg)