School Performance Review Ysleta Executive Summary · Independent School District Board of...
744
EXECUTIVE SUMMARY The Comptroller's Texas School Performance Review (TSPR) is the nation's first state- level vehicle for improving the management and finances of public school districts. Since its 1991 creation, TSPR has conducted in-depth, on-site management reviews of 27 Texas school districts including Ysleta, representing nearly 22 percent of the state's total student enrollment (825,000 students). These reviews look for innovative programs to share with other districts, diagnose districts' administrative, organizational, and financial problems, and recommend ways to cut costs, reduce overhead, streamline operations, and improve the delivery of educational services, with the overall goal of ensuring that every possible tax dollar is spent in the classroom, educating children. Texas is in the forefront of the nation's jarring transition to an information-based economy, and the education given its children will play a vital role in determining the state's future prosperity. A well-trained workforce will be our state's greatest competitive asset in the next century. We must protect this resource and make absolutely sure that every Texas child has an opportunity to learn. At a time when Texas is engaged in a critical debate over how-and how much-to pay for the education of its schoolchildren, parents, students, principals, teachers, and other district employees as well as the taxpayers that foot the bills deserve to know that schools are accountable both for their cost and the quality of the education they deliver. Only then will they be willing to invest the time, energy, and resources needed to ensure that all future Texans receive the education they need to succeed. TSPR in El Paso TSPR began its review of the Ysleta Independent School District (YISD) in October 1997, just weeks after its review of the Socorro district started. As in its previous reviews of other Texas school districts, TSPR came to El Paso in response to a local call for assistance. In January 1997, YISD Superintendent Anthony Trujillo joined Senator Eliot Shapliegh in requesting a review. The request was unprecedented in that it called for reviews of El Paso's three largest districts: Socorro, Ysleta, and El Paso ISDs. In his letter, Mr. Trujillo told the Comptroller that he believed YISD was doing an outstanding job of educating students and using its resources in a most prudent way, but welcomed a chance to continually improve the district. With the help of Empirical Management Services, a Houston-based consulting firm, the TSPR team interviewed district employees, school board members, students, parents, business leaders, and representatives from community organizations. In addition, the review team collected comments from letters to the Comptroller and calls to a toll-free hotline. To obtain comments from community residents, TSPR held seven public forums spread out over three nights at the seven district high schools. The team conducted widespread focus groups and personal interviews that yielded valuable comments from current and former district employees, parents, community leaders, and students. Written surveys were sent to all administrators, 30 percent of all teachers, and a random sample of high
Transcript of School Performance Review Ysleta Executive Summary · Independent School District Board of...

EXECUTIVE SUMMARY The Comptroller's Texas School Performance Review (TSPR) is the nation's first state-level vehicle for improving the management and finances of public school districts. Since its 1991 creation, TSPR has conducted in-depth, on-site management reviews of 27 Texas school districts including Ysleta, representing nearly 22 percent of the state's total student enrollment (825,000 students). These reviews look for innovative programs to share with other districts, diagnose districts' administrative, organizational, and financial problems, and recommend ways to cut costs, reduce overhead, streamline operations, and improve the delivery of educational services, with the overall goal of ensuring that every possible tax dollar is spent in the classroom, educating children. Texas is in the forefront of the nation's jarring transition to an information-based economy, and the education given its children will play a vital role in determining the state's future prosperity. A well-trained workforce will be our state's greatest competitive asset in the next century. We must protect this resource and make absolutely sure that every Texas child has an opportunity to learn. At a time when Texas is engaged in a critical debate over how-and how much-to pay for the education of its schoolchildren, parents, students, principals, teachers, and other district employees as well as the taxpayers that foot the bills deserve to know that schools are accountable both for their cost and the quality of the education they deliver. Only then will they be willing to invest the time, energy, and resources needed to ensure that all future Texans receive the education they need to succeed. TSPR in El Paso TSPR began its review of the Ysleta Independent School District (YISD) in October 1997, just weeks after its review of the Socorro district started. As in its previous reviews of other Texas school districts, TSPR came to El Paso in response to a local call for assistance. In January 1997, YISD Superintendent Anthony Trujillo joined Senator Eliot Shapliegh in requesting a review. The request was unprecedented in that it called for reviews of El Paso's three largest districts: Socorro, Ysleta, and El Paso ISDs. In his letter, Mr. Trujillo told the Comptroller that he believed YISD was doing an outstanding job of educating students and using its resources in a most prudent way, but welcomed a chance to continually improve the district. With the help of Empirical Management Services, a Houston-based consulting firm, the TSPR team interviewed district employees, school board members, students, parents, business leaders, and representatives from community organizations. In addition, the review team collected comments from letters to the Comptroller and calls to a toll- free hotline. To obtain comments from community residents, TSPR held seven public forums spread out over three nights at the seven district high schools. The team conducted widespread focus groups and personal interviews that yielded valuable comments from current and former district employees, parents, community leaders, and students. Written surveys were sent to all administrators, 30 percent of all teachers, and a random sample of high

school students; in addition, a telephone survey was conducted of 600 area residents. Of the written surveys distributed, responses were received from 137 central office administrators, 85 principals and assistant principals, 413 teachers, and 773 students. Details from these surveys, public forums, and focus groups are provided in Appendix A through I. In addition to its interviews, the review team consulted databases of comparative educational information gathered by the Texas Education Agency (TEA)-the Academic Excellence Indicator System and the Public Education Information Management System. To make useful comparisons, the review team also asked YISD to select similar or "peer" Texas school districts. The district chose the Houston, Dallas, Fort Worth, Austin, El Paso, San Antonio, Corpus Christi, and Socorro school districts. With the exception of Socorro, these districts are among the state's largest. All are located in urban settings and have a minority enrollment in excess of 60 percent. In addition, the number of economically disadvantaged students exceeds 65 percent in all but three of the districts. Exhibit 1 compares YISD and peer district enrollment.
Exhibit 1 YISD and Selected Peer District Demographics
1996-97
Racial/Ethnic Percentage
District Student Enrollment
5 Year Enrollment Growth*
% African American
% Hispanic
% Anglo
% Other
% Economically Disadvantaged
Houston 209,375 6.4 34.3 51.8 11.1 2.9 65.0
Dallas 154,847 10.0 41.5 45.5 11.0 2.1 75.3
Austin
76,054 13.6 18.0 41.7 37.7 2.5 50.6
Fort Worth 75,813 7.0 33.2 38.4 25.9 2.5 58.7
El Paso 64,444 0.3 4.5 76.2 18.0 1.2 67.2
San Antonio 61,361 1.1 10.8 83.7 5.2 .3 91.1
Ysleta 47,366 (5.7) 2.6 85.4 11.1 .9 68.1
Corpus Christi 41,606 (0.6) 6.0 67.7 25.1 1.3 52.2

Socorro 21,098 40.2 1.2 89.0 9.3 .5 70.4
Region XIX
152,621 6.1 2.9 83.1 13.1 .9 70.6
State of Texas
3,828,975 10.7 14.3 37.4 45.6 2.7 48.1
Source: 1996-97 Academic Excellence Indicator System. * Snapshot '96, Texas Education Agency. Acknowledgments TSPR and its consulting firm, Empirical Management Services, wish to thank the Ysleta Independent School District Board of Trustees; Superintendent Anthony Trujillo; Lupe McVay, who acted as district liaison to the review team and assisted in scheduling and coordinating focus group sessions and other interviews; and the district employees, students, and community members who provided valuable information and assistance during TSPR's work in the district. In particular, we are grateful to Superintendent Trujillo for making district personnel available to the review team and to Carol Walters for coordinating data requests and providing relevant financial information. Ysleta ISD The Ysleta Independent School District is El Paso's second- largest district and is among the state's ten largest school districts. Eighty-eighty percent of YISD's students are minority members and 68 percent are economically disadvantaged. YISD also is among the state's poorest districts, ranking 832 out of the state's 1,037 school districts in property wealth per pupil. Yet superintendent Anthony Trujillo is proud to say that YISD students pass the Texas Assessment of Academic Skills test at higher rates than any other large urban district in the state, and at higher rates than the state and Region XIX on most tests taken. In 1993, YISD had seven schools classed as "low performing" by TEA. Today, TEA rates two YISD campuses as "exemplary," 22 as "recognized," and all others as "acceptable"; no campus is rated "low-performing." YISD's student enrollment has declined by about 5 percent over the past six years, but a recently implemented open-enrollment policy invites children from all over the El Paso community to freely come to school in the district. And students are coming; in the current school year, nearly 2,000 have transferred into the district. The increase in enrollment from outside the district has resulted in a slight rise in total enrollment, the first increase in more than 5 years. During the 1997-98 school year, YISD's 2,990 teachers, administrators, and support workers served more than 47,000 students in 56 school campuses. The district's annual operating budget is nearly $245 million. Texas School Performance Review: A History of Savings

TSPR's creation was prompted by an anticipated state budget shortfall that threatened the state's ability to meet the demands of a growing student population. While the state's finances have improved in recent years, many school districts still face budgetary difficulties; in general, Texas schools depend on local property taxes for half of their revenue, and many "property-poor" districts find it difficult to raise adequate funding even with relatively high tax rates. In all, Texas school districts face a continual cha llenge in deciding how to spread scarce funds across a wide range of programs and services without jeopardizing student performance. TSPR's mission is to increase the funds available for classroom instruction through improved efficiency in district support and administrative functions. A TSPR review is not a financial audit, although the school district's financial functions are one focus of the effort. Instead, TSPR examines the entire scope of district operations, including organization and management, educational service delivery, personnel management, community involvement, facilities management, financial management, asset and risk management, purchasing functions, computers and technology, food services, transportation, and safety and security. After the Comptroller accepts a district's invitation to study its operations, TSPR's review begins with a series of interviews, town hall meetings, and focus group discussions with key community leaders and organizations, parents, school administrators, teachers, district personnel, and students, to give the TSPR team a thorough understanding of community attitudes and expectations. This phase is followed by on-site work by a TSPR team of Comptroller personnel and consultants. Review teams work in the district for several weeks at a time, observing and talking to front- line personnel in every area, and compiling detailed information on how each district process works-or doesn't. TSPR also looks for innovative programs and practices, and documents them for potential use by other districts. TSPR's findings, commendations, recommendations, and implementation strategies are compiled in a comprehensive public report that is widely circulated within the community. TSPR returns to the districts it reviews, generally one year later, to prepare and release a progress report on the implementation of its recommendations. TSPR fields invitations from public school districts of every size and shape- large or small, rich or poor, rural or urban. The team settles in for months of detailed study at no charge to district taxpayers. TSPR's goal is to identify ways to cut costs, reduce administrative overhead, streamline operations, and improve educational services- in short, to help school districts operate more effectively and efficiently within their available resources. Most of the Comptroller's recommendations come directly from teachers, parents, students, and others who live or work in the district. TSPR has found that these hard-working folks often have known for years what would help them improve their schools- if only someone would ask. The Comptroller asks. Since 1991, TSPR has offered more than 2,700 detailed ways to save taxpayers more than

$300 million in 26 public school districts throughout Texas. And TSPR has accomplished this without recommending the firing or laying off of a single classroom teacher. Districts studied by the TSPR team to date include San Antonio, Richland Springs, San Saba, Cherokee, Lubbock, Victoria, West Orange/Cove Consolidated, Lake Travis, Dallas, Austin, Calhoun County, Midland, Paris, San Marcos Consolidated, Brownsville, Longview, San Angelo, Beaumont, Waco, United in Laredo, Tyler, Houston, Texarkana, Spring, Corpus Christi and Socorro. A review of the Port Arthur district will conclude within the next month, while studies of Wimberley and Hamilton are under way. Reviews of the El Paso, Comal, and Mount Pleasant districts are anticipated to begin early in the 1998-99 school year. In addition, TSPR conducts follow-up reviews in distric ts that have had at least one year to implement their recommendations. These subsequent reviews indicate that 89 percent of TSPR's combined proposals have been acted upon, saving local taxpayers more than $80 million during their first years of implementation, with much more in additional savings expected in the following years. Persons seeking detailed information on any of TSPR's previous reviews should call the Texas School Performance Review toll- free at 1-800-531-5441 ext 3-4900. Summary Results In all, TSPR found YISD to be a district that is experiencing significant results in the area of student performance. The district's innovative approaches for bringing out the best in the students in their charge could and should be replicated by school district across the state. Even so, in keeping with its charge to find ways to make a good district better, TSPR developed 141 recommendations during a seven-month review of YISD that ended in April 1998. The YISD review identified total savings of more than $32.7 million that could be realized by the fiscal 2002-03. TSPR's recommendations also identify investment opportunities of more than $6.7 million in fiscal 1998-99 and total investment opportunities of $9.2 million through fiscal 2003. Cumulative net savings from all recommendations (savings less recommended investments) is projected to total nearly $23.5 million by fiscal 2003. This report could produce gross savings in the first year of $3.2 million. Savings would rise in the second year of implementation to more than $6.7 million, or 8.4 percent of YISD's administrative budget (total budget minus instructional costs such as teacher salaries and classroom supplies), or 2.7 percent of YISD's total annual operating budget. The savings opportunities identified in the report are conservative and should be considered the minimum that can be realized if all of TSPR's recommendations are implemented. The total estimated savings and costs associated with TSPR's recommendations are listed
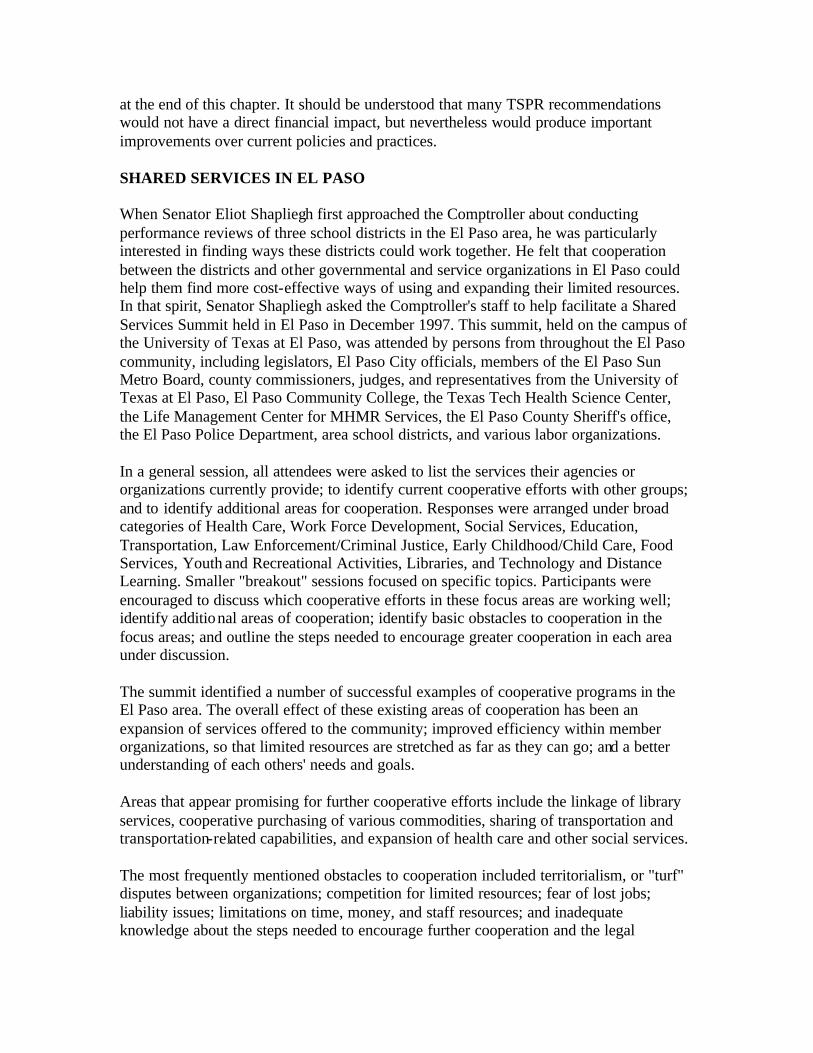
at the end of this chapter. It should be understood that many TSPR recommendations would not have a direct financial impact, but nevertheless would produce important improvements over current policies and practices. SHARED SERVICES IN EL PASO When Senator Eliot Shapliegh first approached the Comptroller about conducting performance reviews of three school districts in the El Paso area, he was particularly interested in finding ways these districts could work together. He felt that cooperation between the districts and other governmental and service organizations in El Paso could help them find more cost-effective ways of using and expanding their limited resources. In that spirit, Senator Shapliegh asked the Comptroller's staff to help facilitate a Shared Services Summit held in El Paso in December 1997. This summit, held on the campus of the University of Texas at El Paso, was attended by persons from throughout the El Paso community, including legislators, El Paso City officials, members of the El Paso Sun Metro Board, county commissioners, judges, and representatives from the University of Texas at El Paso, El Paso Community College, the Texas Tech Health Science Center, the Life Management Center for MHMR Services, the El Paso County Sheriff's office, the El Paso Police Department, area school districts, and various labor organizations. In a general session, all attendees were asked to list the services their agencies or organizations currently provide; to identify current cooperative efforts with other groups; and to identify additional areas for cooperation. Responses were arranged under broad categories of Health Care, Work Force Development, Social Services, Education, Transportation, Law Enforcement/Criminal Justice, Early Childhood/Child Care, Food Services, Youth and Recreational Activities, Libraries, and Technology and Distance Learning. Smaller "breakout" sessions focused on specific topics. Participants were encouraged to discuss which cooperative efforts in these focus areas are working well; identify additional areas of cooperation; identify basic obstacles to cooperation in the focus areas; and outline the steps needed to encourage greater cooperation in each area under discussion. The summit identified a number of successful examples of cooperative programs in the El Paso area. The overall effect of these existing areas of cooperation has been an expansion of services offered to the community; improved efficiency within member organizations, so that limited resources are stretched as far as they can go; and a better understanding of each others' needs and goals. Areas that appear promising for further cooperative efforts include the linkage of library services, cooperative purchasing of various commodities, sharing of transportation and transportation-related capabilities, and expansion of health care and other social services. The most frequently mentioned obstacles to cooperation included territorialism, or "turf" disputes between organizations; competition for limited resources; fear of lost jobs; liability issues; limitations on time, money, and staff resources; and inadequate knowledge about the steps needed to encourage further cooperation and the legal

implications of such steps. Shared Services in Ysleta ISD TSPR's review of YISD was intended to identify opportunities to improve the effectiveness and efficiency of the district's operations and to highlight model programs that could be replicated by other districts. TSPR found notable examples of cooperation with other public and private entities that enhance school district operations and could serve as models for other districts statewide. Examples include:
• the Cesar Chavez Academy, which not only provides alternative education for students in YISD, but also serves as the Juvenile Justice Alternative Education Program (JJAEP) for all students adjudicated by juvenile courts within El Paso County. This exemplary program combines strict discipline with effective educational opportunities.
• a contract with the City of El Paso to assess and collect YISD's property taxes. Twenty-six other jurisdictions, including the County of El Paso, El Paso ISD, Socorro ISD, El Paso Community College, and the El Paso Hospital District also contract with the City of El Paso, and have enjoyed high collection rates and efficient service.
• cooperation between YISD and the El Paso Parks and Recreation Department, which is resulting in the conversion of a swampy area next to a school facility into a recreational facility for use by the school and community.
In addition, this report outlines a number of areas where cooperation with other entities should be fostered and encouraged by YISD's leadership. The following recommendations for further cooperation appear within this report:
• YISD has a wide range of adult education opportunities, but statistics show that the demand for these services in the El Paso area exceeds their availability. Cooperation between the larger school districts in El Paso could allow for an expansion of available programs.
• YISD needs mechanic certification programs and bus driver training courses that could be provided through the El Paso Community College or the Region XIX Educational Service Center.
• The City of El Paso and YISD have discussed a program in which the city could provide certified police officers to provide security in the schools. The program is patterned after a program being used in Fort Worth and could be mutually beneficial to both the city and YISD.

Exemplary Programs and Practices TSPR identified numerous "best practices" in YISD. Through commendations in each chapter, this report highlights model programs, operations, and services provided by YISD administrators, teachers, and staff members. Other school districts throughout the state are encouraged to examine these programs and services to see if they may be adapted to meet their own needs. In addition to the programs noted in the Shared Services discussion above, other notable examples include the following:
• YISD's student performance is among the best in the state, and clearly outshines Texas' largest districts, the regional average, and the state as a whole in almost every category. The district's vision statement: "all students will graduate from high school fully bilingual and prepared to enter a four-year college or university" is widely known and prominently displayed. The fact that this statement can be recited on request by almost any employee, along with the district's constantly improving student test scores, clearly shows that all YISD employees understand their mission-to educate children.
• The superintendent implemented a program of open enrollment soon after coming to YISD. This program allows students to move from school to school as long as space is available. Competition between schools to improve educational services has helped raise YISD' state accountability ratings. The district had seven "low-performing" campuses in 1993; by 1997, it had two "exemplary," 22 "recognized," and no "low-performing" campuses.
Faced with declining enrollment like many other urban districts, YISD decided to capitalize on its excellent student performance record by opening its doors to students from other districts in 1996. More than 2,000 students transferred into YISD from other districts, increasing the district's state funding and allowing it to more fully use its existing capacity.
• Between 1996 and 1997, the number of students participating in advanced placement tests, which provide an opportunity to earn college credit, increased by 71 percent, from 416 to 712; the total number of students passing the examinations increased by 173 to 233. Based on grades and examination scores, YISD will defray the cost of testing fees.
• The percent of seniors taking the Scholastic Aptitude Test, a prerequisite for most colleges or universities, has risen from 27 percent in 1978 to more than 53 percent in 1997, a share that exceeds all but one of YISD's peer districts and the regional and state totals. To accomplish this, YISD has undertaken a number of initiatives including waived test fees, test-taking mini-camps for students, and training sessions for teachers and parents.

• YISD has been aggressive in acquiring and using technology in the classrooms and in its everyday operations. The district has more than 13,500 desktop computers in use, a ratio of one computer for every three students. This ratio exceeds the state's goal for 1998 of four students to one computer. Technology acquisition has been made possible by a number of grants and donations as well as a concerted effort on the district's part to set aside a portion of its budget each year for technology.
• The Student Entrepreneur Center is a unique educational initiative that gives students an opportunity to experience operating a "real world" business. The curriculum emphasizes the managerial skills needed to run a business and a market allows students to manufacture, display, and sell their goods.
• YISD provides comprehensive self- insured employee health coverage for its employees, and premiums paid by employees for dependent coverage have remained unchanged despite rising health care costs. The district has performance guarantees built into its contract with the third-party administrator for its preferred provider organization that ensure that employees receive high-quality service.
• YISD's Transportation Department recognized that it would be cost-efficient to house some buses at the Northeast Complex, so that the time spent driving to and from routes on the far side of the district could be reduced; this decision is saving the district about $700,000 annually in reduced mileage and driver time.
• YISD uses a special insulating paint on bus rooftops to provide students with a cooler ride on hot days. According to the director of Transportation, the paint keeps bus interiors from 10 to 15 degrees cooler than standard white paint.
Chapter by Chapter: Key Findings and Recommendations District Organization and Management: YISD board is seen by the community as divisive and continually engaged in sniping and personal insults that have seriously affected its governance process. Seventy-three percent of teachers and 70 percent of principals respond ing to a TSPR survey said that board members have only an average or below-average knowledge of the educational needs of students in their district. YISD's board members need additional training to fully understand their roles and responsibilities. A board parliamentarian should be appointed to conduct meetings in an orderly manner. Educational Service Delivery: YISD does an exceptional job of educating students, but board policies and internal documentation should be improved to ensure the continuation of this success if and when the district's leadership changes. The district's recent

successes should be documented in board policy so that future students receive the same high-quality education as today's students, and to identify the key elements necessary to replicate YISD's success in other districts. Personnel Management: YISD should undertake a careful analysis of its salaries to ensure that all employees are paid appropriately for their work. Disparities among administrative classifications indicate that a detailed wage and benefit analysis is warranted. Facilities Use and Management: YISD's current energy management program already has saved the district more than $5.4 million over the last five years, but an investment of $2.4 million in energy saving retrofits could boost these savings even further. Retrofits could be financed from decreased utility bills and still net more than $200,000 annually in additional savings. Financial Management: YISD's depository contract and investment strategies have allowed the district to earn additional interest. However, by investing in higher-yield products, the district should be able to increase its interest earnings by $47,500. Risk Management: YISD self- insures and self-administers its workers' compensation program. The district's contribution per employee is somewhat higher than in its peer districts and could be reduced through increased emphasis on injury management among employee groups with higher-than-average claim rates. Savings from improved strategies in this area are estimated conservatively at $250,000 annually. Computers and Technology: YISD decided nearly four years ago to purchase a new integrated financial system. This system still has not been fully implemented, and TSPR's review repeatedly found that this delay is a major roadblock to necessary improvements. Without a fully integrated system, the district simply cannot achieve the type of automation efficiencies that are critical in a district of this size. YISD must complete implementation of this system or determine whether full implementation is possible; in any case, the district should make the necessary adjustments to automate and integrate its administrative processes. Also, as mentioned earlier, YISD's commitment to instructiona l technology has resulted in high per-pupil computer ratios. But the district has not allocated an appropriate amount of training and support that will be critical if YISD's technology is to be used effectively by teachers and students. YISD should reallocate some of its funds dedicated for technology to ensure that teachers and administrators can maximize the benefits of technology. Warehousing: The Maintenance, Transportation, and Warehouse departments occupying the Support Service Center have grown too large for the existing space. Numerous recommendations in this report, including a passive order system in which supplies would be delivered directly to campuses, could free up some space within this facility. However, even when all of the recommended improvements are implemented, the space

remains inadequate to house the supplies, equipment and inventories required for a district of this size. The relocation of some or all of the departments housed in this facility would benefit the district by allowing the departments to better protect the district's assets and perform their duties more efficiently. Transportation: YISD's transportation costs exceed peer-district averages and the state's reimbursement for transportation. One of TSPR's strategies for reducing these costs calls for a staggered bell time for schools. This would allow drivers to make multiple trips to pick up and deliver children and significantly reduce costs. Also, YISD's bus fleet is aging, and YISD purchases new buses only in response to critical needs. Sixty percent of the fleet is 10 or more years old; two buses in use are 20 years old. To ensure the safety of children riding district buses, YISD should immediately establish and fund a replacement schedule that ensures that all buses are replaced every 15 years. Food Services: The Food Service Department has suffered from a lack of consistent management over the past 11 years and as a result has experienced poor operating results. The district should immediately hire or contract for food service management to restore stability to the department and improve operating results. Safety and Security: The frequency of incidents within the district indicates that YISD lacks adequate security patrol resources. YISD, in cooperation with the City of El Paso, is exploring a possible cooperative approach modeled after a program used in Fort Worth, in which the Fort Worth Police Department provides shared security services for the district's secondary schools. YISD should move ahead with this plan, which could save more than $1 million annually and significantly improve the security of its schools. Savings and Investment Requirements Many of TSPR's recommendations would result in savings and increased revenue that could be used to more effectively meet students' needs. The savings opportunities identified in this report are conservative and should be considered minimums. Proposed investments of additional funds usually are related to creating an efficiency or savings or enhancing productivity and effectiveness. As shown in Exhibit 2, full implementation of the recommendations in this report could produce savings of $8.7 million over the next two years. YISD could achieve total net savings of more than $22.5 million by 2002-2003 when all of TSPR's recommendations are implemented.
Exhibit 2 Summary of Net Savings
Year Total

1998-99 Initial Annual Net Savings 1999-00 Additional Annual Net Savings 2000-01 Additional Annual Net Savings 2001-02 Additional Annual Net Savings 2002-03 Additional Annual Net Savings One Time (Costs) Savings
$2,543,046 $6,136,219 $6,311,928 $7,105,336 $7,345,219 ($5,942,487)
TOTAL SAVINGS PROJECTED FOR 1999-2003 $23,499,258
Detailed implementation strategies, timelines, and estimates of fiscal impact follow each recommendation in this report. The implementation section associated with each recommendation highlights a series of actions needed to achieve results. Some should be implemented immediately, some over the next year or two, and some over several years. TSPR recommends that the YISD board ask district administrators to review these recommendations, develop a plan to proceed with implementation, and monitor subsequent progress. As always, TSPR is available to help implement its proposals.

Chapter 1 DISTRICT ORGANIZATION AND MANAGEMENT This chapter reviews the organization and management of the Ysleta Independent School District (YISD) in five major subsections:
A. Governance
B. Planning
C. District Management
D. School Management and Site-Based Decision-Making
E. Policies and Procedures

Chapter 1 DISTRICT ORGANIZATION AND MANAGEMENT A. Governance CURRENT SITUATION YISD's Board of Trustees consists of seven members elected from single-member districts and serving alternating three-year terms. At each election, either two or three board members are elected, depending on the number required to complete the board. The current board is listed in Exhibit 1-1.
Exhibit 1-1 YISD Board of Trustees
1997-98
Name Title Term Expires
Length of Service as of 1/98 Occupation
L. Carlos Sandoval President 2000 7 Months Business Owner
Ismael Legarretta Vice President
1998 5 Yrs., 7 Mos. Engineer/Business Owner
Adrienne "Tex" Pannell Secretary 1998 6 Yrs., 7 Mos. Manager
Michael Portillo, Jr. Member 1998 2 Yrs., 7 Mos. Account Manager
Fred Sanchez. Jr. Member 1999 7 Yrs., 7 Mos. Engineer
Ronda C. Scrivner Member 1999 5 Yrs., 7 Mos. Librarian
Blanca Dominguez Member 2000 3 Yrs., 7 Mos. Insurance Agent
Source: YISD Office of the Superintendent. YISD's Local Policy BAA describes the specific powers and duties of the school board imposed by Subchapter D of the Texas Education Code. According to YISD's Board Policy Manual, the board has the legal power to:
• Govern and oversee the management of the public school of the district;
• Adopt such rules, regulations, and by- laws as the board may deem proper;
• Levy and collect taxes and issue bonds;
• Change the name of the district;

• Adopt and, if necessary, amend a budget for the next succeeding fiscal year;
• Have district financial accounts audited at district expense by a Texas certified or public accountant holding a permit from the Texas State Board of Public Accountancy following the close of each fiscal year;
• Receive bequests and donations or other monies or funds coming legally into its hands in the name of the district;
• Select a depository for district funds;
• Order, canvas the returns, declare results, and issue certificates of elections as required by law;
• Acquire and hold real and personal property in the name of the district;
• Execute, perform, and make payments under contracts, which may include leases, lease with options to purchase, or installment purchase for the use, acquisition, or purchase of any property other than real property;
• Exercise the right of eminent domain to acquire property;
• Hold all rights and titles to the school property of the district, whether real or personal;
• Authorize the sale of any property, other than minerals, held for trust for free school purposes;
• Sell minerals and land belonging to the district;
• Employ, retain, contract with, or compensate a licensed real estate broker or salesman for assistance in the acquisition or sale of real property;
• Employ, by contract, a superintendent and adopt a policy providing for the employment and duties of district personnel, and set salary schedules therefor;
• Sue and be sued in the name of the district;
• Publish an annual performance report describing the educational performance of the district and each campus, including campus performance objectives and the progress of each campus toward those objectives;
• Adopt rules that require students to wear school uniforms; and
• Require payment of and adopt procedures to waive fees if a student or student's parent or guardian is unable to pay.

Board meetings are held on the second Wednesday of each month. Regular meetings are held at 6:00 p.m. in the board room of the central administration building (the Ysleta Room). The public is welcome to attend all meetings and citizens wishing to address the board may speak on issues related to any agenda item other than personnel-related matters during the Citizen Input agenda item. Citizens also may not make personal criticisms of individuals such as attacks on the personal character of a district employee. All individuals wishing to speak during Citizen Input are limited to three minutes, with 30 minutes allocated for the entire agenda item. The board cannot enter into discussions with individuals making presentations during Citizen Input. If the board wishes to discuss one of the items presented during Citizen Input, it must be placed on the agenda for a later meeting. The meeting agendas are developed from a variety of sources, including suggestions from board members or the superintendent and items presented by members of the superintendent's cabinet. A majority of the items included in the board agenda typically concern contracts. The agenda is organized by the superintendent and cabinet beginning three weeks prior to each regularly scheduled board meeting. The board president and other board members can add items to the agenda if they contact the superintendent or board president prior to the agenda's completion. The board agenda is finalized in the week prior to the regular board meeting; supporting materials for board review are delivered to each board member on the Wednesday afternoon before the week of the regular board meeting. Board members are given an opportunity to study the agenda material between Wednesday and Sunday, and any questions they may have must be submitted to members of the superintendent's cabinet by Monday morning of the week of the meeting. Members of the cabinet, in turn, must provide written responses to board members' questions no later than the morning before the meeting. The official minutes of open sessions are prepared by the superintendent's administrative assistant. The board secretary, along with other board members, reviews the official minutes of all meetings for accuracy and completeness prior to approval. Minutes for executive sessions either are taken by the board secretary or are recorded on tape. All minutes taken in executive session, whether by hand or via tape recording, are sealed, meaning they are not subject to open records requests. FINDING The board is divisive, engaging in "sniping" and personal insults that have seriously affected the governance process and the overall morale of employees throughout the district. The divisions between board members deepened when the bylaws were suspended in September 1997 and the board president, elected in May 1997, was replaced in a total reorganization of the board's executive committee. Each board member said that the divisions between members are so deep that their relationships can never be repaired without a change in membership. Yet most board members agreed that the board must put aside their personal differences if they are to make any progress. Members of TSPR's review team attended the November 13, 1997 board meeting, and witnessed the rancor and sniping between board members. For example, one board member, immediately before a controversial vote on the hiring of a new law firm for the district, made a derogatory comment about the board president. Immediately after this comment, the board president called a five-minute recess to calm tempers. Insults continued after the meeting reconvened, and the president was forced to call a second recess. After the second recess, the vote was taken and the meeting was abruptly adjourned without completing its agenda. Afterward, the superintendent said board meetings generally adjourn after the consent agenda is voted on and that the board seldom discusses the "policies and information" section of its agenda. The board as a whole does not fully understand its role and related responsibilities. Some board members stated that some of their colleagues do not attend board training sessions and are not adequately prepared for their roles. Some board members also said their colleagues often burden the superintendent's cabinet with unnecessary requests for information. Some members of the superintendent's cabinet estimate that as much as 35 percent of their time is spent

either preparing for board meetings or responding to requests from individual board members funneled through the superintendent. Effective March 1996, Texas Administrative Code Section 61.1 requires new board members to attend a minimum of 16 hours of continuing education plus local district orientation. Experienced board members are required to attend a minimum of 11 hours of continuing education each year. Moreover, at least three hours of continuing education must be received in "Team-Building Session/Assessment of the Continuing Education Needs of the Board-Superintendent Team" to determine the types of continuing education needed to enhance board-superintendent relations and improve the overall governance of the school district. Either the state's regional education service centers, registered continuing education providers, or the district itself may provide this training. According to TASB's director of Continuing Education, at the school board meeting held approximately two months prior to the school board elections, the president of the board announces when the election will be held and indicates the number of continuing education hours each board member has obtained during the preceding year. These figures then must be posted in the local newspaper as a matter of public record. TSPR examined the Texas Association of School Board's (TASB's) "Board Member Training Report, Summary of Credit Hours for YISD" for each board member from March 1, 1996 to July 31, 1997. Not all board members received the required minimum number of hours in board-superintendent team-building assessment, and three of the seven board members did not meet the overall minimum requirements for continuing education. One of the seven board members is newly elected and must meet the minimum continuing education requirements by April 1998. Recommendation 1: Establish a policy outlining minimum continuing education requirements for all board members, and immediately conduct extensive, facilitated team building training for the board. The board should establish a policy outlining minimum requirements for continuing education for all board members to ensure compliance with state law and enhance the board's understanding of its role. Board members must increase the number of continuing professional education workshops they attend to help them thoroughly understand their respective roles and responsibilities and become effective board members. At minimum, each board member should attend 11 hours of continuing education workshops over a 12-month period to comply with state law. IMPLEMENTATION STRATEGIES AND TIMELINE
1. The superintendent drafts a continuing education policy for the board that outlines the minimum number of continuing professional education hours needed by all board members to comply with the law.
June 1998
2. The board president assigns the superintendent the responsibility for collecting information related to available board training and for setting up a facilitated team building session for the board.
July 1998
3. The board approves the policy after a first and second reading. August 1998
4. Each month, the superintendent informs the board president of training opportunities available for board members.
August 1998 and each month thereafter

5. The board president sends monthly memoranda to each board member listing training opportunities.
June 1998 and each month thereafter
6. Board members attend training sessions relevant to school district governance and other topics of interest.
July 1998 and each month thereafter
FISCAL IMPACT This recommendation would have no fiscal impact on the district because board training and travel is already included in the district's annual budget. FINDING TSPR found that YISD board meetings are not conducted in an orderly, efficient manner. Moreover, Robert's Rules of Order are not followed by the board in the normal course of its business. For example, during the meeting of November 13, 1997, the president continuously lost control of the meeting because some board members refused to limit their discussion to the period immediately after motions were seconded. Instead, board members continued to discuss the motion on the floor while they were being polled for a "yes" or "no" vote. Robert's Rules of Order requires that such discussion be limited to the period immediately after a motion has been made and seconded; once a vote is called, discussion must end. This clearly was not the case during the meeting observed by the review team. Because Robert's Rules of Order were not followed, the meeting became argumentative and spiraled out of control, requiring the president to take two recesses. Recommendation 2: Appoint a board parliamentarian and conduct all meetings in accordance with Robert's Rules of Order. The board should appoint a parliamentarian and begin conducting its meetings in an orderly and efficient manner using the rules and procedures contained in Robert's Rules of Order. This would enable the president to exercise more control during board meetings and avoid potentially disruptive behavior by board members. IMPLEMENTATION STRATEGIES AND TIMELINE
1. The board president recommends one of the board members to be appointed as parliamentarian. June 1998
2. The board approves the appointment. June 1998
3. The superintendent provides each board member with a copy of Robert's Rules of Order. June 1998
4. The president of the board and parliamentarian become familiar with basic parliamentary procedures outlined in Robert's Rules of Order and conducts training session for all board members to familiarize them with process.
June - July 1998

5. The board begins following parliamentary procedure according to Robert's Rules of Order. July 1998
FISCAL IMPACT This recommendation can be implemented with existing resources. FINDING Each month, the superintendent and his cabinet prepare an agenda packet. Board members receive the agenda one week before each meeting and are provided with additional information as requested. The agenda packet is standard and includes a competitive solicitation report for all competitive sealed bids requiring board approval; a contract summary report for all contracts requiring board approval; and a monthly financial report that includes:
• a combined balance sheet;
• a combined statement of revenues, expenditures, and changes in fund balance;
• combined balance sheets by fund groups;
• graphs comparing budgeted figures to actual expenditures for all governmental funds combined, all governmental funds combined by expense category, expenditures for the Local Maintenance Fund, and expenditures by organization; and
• investments for the General, Food Service, and Debt Service funds.
Some board members told the review team that this financial information is not presented in a user- friendly executive reporting format that would simplify board review and analysis. The budget versus actual expenditure comparison graphs, for instance, are basic line graphs and are difficult to read. Furthermore, budgeted and actual expenditures are included for each school and center, but are not compared to prior years. Only budgeted expenditures, actual expenditures to date, available budget balances, and percent of budget expended are included in the report. The report lacks comparative analysis between years and percentage differences between years. Finally, the board agenda packet lacks a monthly summary of education-related program performance data such as the number of students participating in specific educational programs, comparative funding of specific programs between years, anticipated funding in subsequent years, and actual versus planned program performance. Recommendation 3: Develop a user-friendly executive reporting format to present financial, management, and program-related information to the board. In direct consultation with the board, the superintendent and cabinet should develop an executive reporting format for

presenting financial, management, and educational program-related data to the board. Exhibit 1-2 presents examples of summary-level executive management reports that could be presented.
Exhibit 1-2 Examples of Summary-Level Executive Management Reports
Report Title Sample Contents
Budget Control
• Summary of departmental budgets by function, with columns for prior year actual amounts, adopted budget, revised budget, projected balance at year end and associated variances • Departmental performance measures, including the status of performance measures for the month • Summary section highlighting operational or administrative issues affecting performance goals
Financial Management
• Revenue and expenditure data showing columns for current and prior-year actual amounts for similar periods • Notes explaining significant variances of interest • Bar graphs and pie charts depicting comparative revenue and expenditure information • Administrative cost ratios, cost per student, transportation costs per mile, and food and labor costs per meal, compared to prior years. • Monthly reconciliation of the fund balance, including specific items affecting the balance • Summary of monthly grant activity, including number and dollar value of grants submitted, number and dollar value of grants awarded, and the ratio of grants awarded to grants submitted-all compared to prior years • Notes explaining significant variances
Investment/Debt Management
• Actual excess cash invested monthly and year to date compared to prior year • Year-to-date investments by type of investment instrument, including yields and scheduled maturity • Market value of investments by type • Collateral pledged by financial institutions to cover district's investment • Outstanding debt, including principal and interest payments
Education Program Performance
• Comparative data related to performance such as annual graduation rates, dropout rates, and TAAS test scores by school • Comparative funding of specific education programs between fiscal years (ESL, Compensatory Education, Gifted and Talented, Magnet Schools) • Actual versus planned performance, with accompanying notes explaining significant variances between planned and actual performance
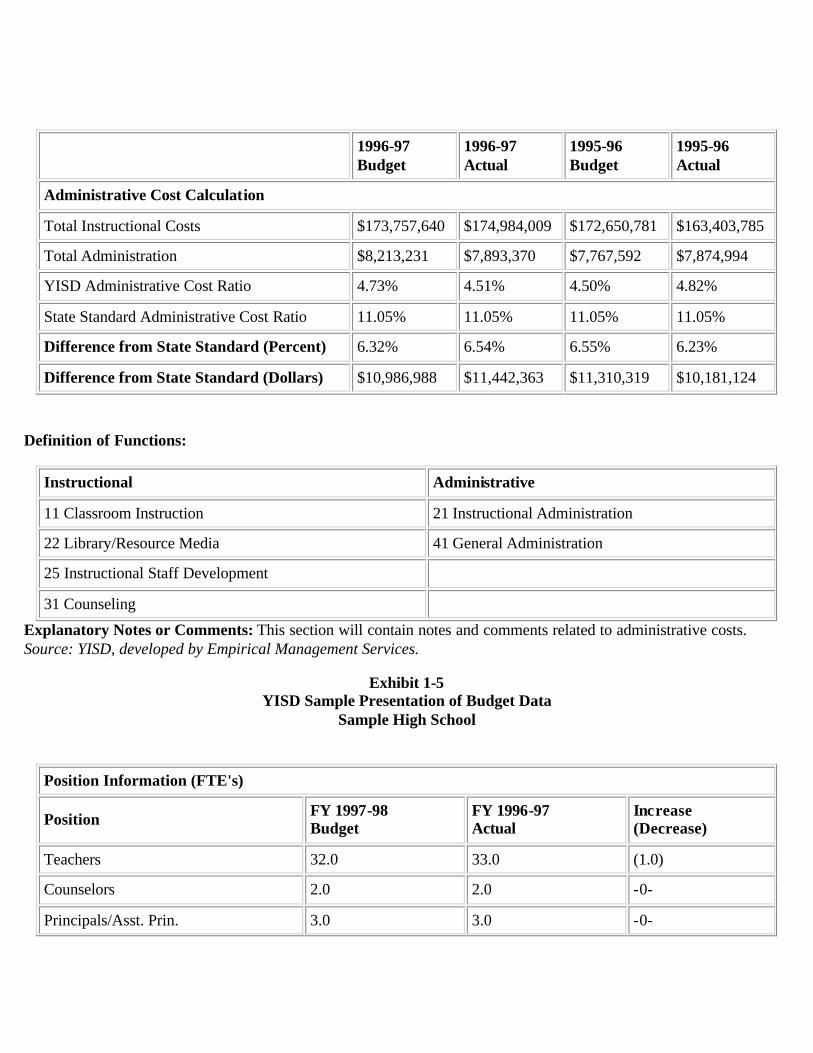
Source: Developed by Empirical Management Services. Exhibits 1-3 through 1-5 illustrate reporting formats that could be used by YISD.
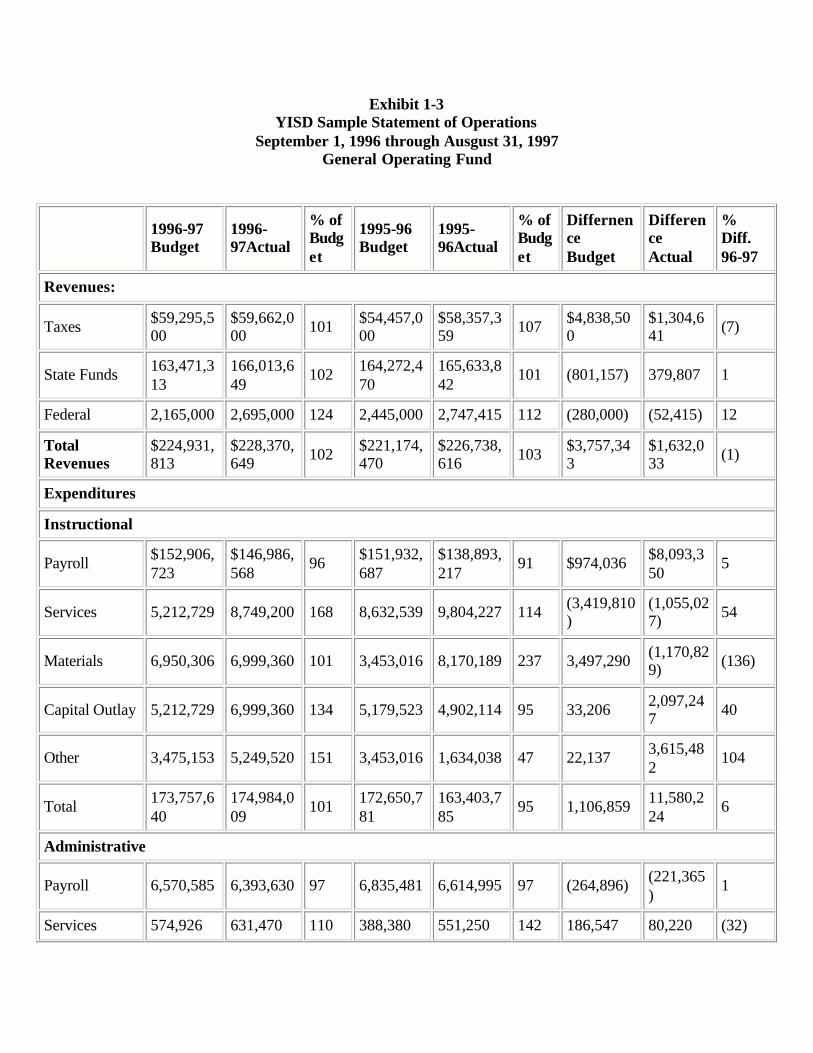
Exhibit 1-3 YISD Sample Statement of Operations
September 1, 1996 through Ausgust 31, 1997 General Operating Fund
1996-97 Budget
1996-97Actual
% of Budget
1995-96 Budget
1995-96Actual
% of Budget
Differnence Budget
Difference Actual
% Diff. 96-97
Revenues:
Taxes $59,295,500
$59,662,000 101 $54,457,0
00 $58,357,359 107 $4,838,50
0 $1,304,641 (7)
State Funds 163,471,313
166,013,649
102 164,272,470
165,633,842
101 (801,157) 379,807 1
Federal 2,165,000 2,695,000 124 2,445,000 2,747,415 112 (280,000) (52,415) 12
Total Revenues
$224,931,813
$228,370,649 102 $221,174,
470 $226,738,616 103 $3,757,34
3 $1,632,033 (1)
Expenditures
Instructional
Payroll $152,906,723
$146,986,568
96 $151,932,687
$138,893,217
91 $974,036 $8,093,350
5
Services 5,212,729 8,749,200 168 8,632,539 9,804,227 114 (3,419,810)
(1,055,027) 54
Materials 6,950,306 6,999,360 101 3,453,016 8,170,189 237 3,497,290 (1,170,829) (136)
Capital Outlay 5,212,729 6,999,360 134 5,179,523 4,902,114 95 33,206 2,097,247 40
Other 3,475,153 5,249,520 151 3,453,016 1,634,038 47 22,137 3,615,482
104
Total 173,757,640
174,984,009
101 172,650,781
163,403,785
95 1,106,859 11,580,224
6
Administrative
Payroll 6,570,585 6,393,630 97 6,835,481 6,614,995 97 (264,896) (221,365)
1
Services 574,926 631,470 110 388,380 551,250 142 186,547 80,220 (32)

Materials 328,529 473,602 144 310,704 472,500 152 17,826 1,103 (8)
Capital Outlay 492,794 315,735 64 155,352 157,500 101 337,442 158,235 (37)
Other 246,397 78,934 32 77,676 78,750 101 168,721 184 (69)
Total 8,213,231 7,893,370 96 7,767,592 7,874,994 101 445,639 18,376 (5)
All Other Expenditures
Payroll
24,985,515
23,675,461 95 40,503,42
6 22,623,158 56 (15,517,91
1) 1,052,303 39
Services 851,779 835,604 98 1,380,799 1,863,084 135 (529,020) (1,027,479)
(37)
Materials 1,135,705 1,671,209 147 1,841,065 798,464 43 (705,360) 872,745 104
Capital Outlay 851,779 1,392,674 164 1,380,799 1,064,619 77 (529,020) 328,055 86
Other 567,853 278,535 49 920,532 266,155 29 (352,680) 12,380 20
Total 28,392,631
27,853,483
98 46,026,621
26,615,480
58 (17,633,990)
1,238,003
40
Total Expenditures
$210,363,502
$210,730,862 100 $226,444,
994 $197,894,259 87 $(16,081,4
92) $12,836,603 13
Net Revenues $14,568,311
$17,639,787 $(5,270,5
24) $28,844,357
Other Resources (Uses)
(21,838,132)
(23,198,762) (627,514) (22,560,4
02)
Change to Fund Balance
(7,269,821)
(5,558,975) (5,898,03
8) 6,283,955
Beginning Fund Balance
24,513,394
28,054,181 23,085,09
5 21,770,226
Ending Fund Balance
$17,243,573
$22,495,206
$17,187,057
$28,054,181
Explanatory Notes:This section will contain notes explaining unusual variances. Source: YISD, developed by Empirical Management Services.
Exhibit 1-4 YISD Sample Administrative Cost Comparison
September 1, 1996 through August 31,1997 General Operating Fund
1996-97 Budget
1996-97 Actual
1995-96 Budget
1995-96 Actual
Administrative Cost Calculation
Total Instructional Costs $173,757,640 $174,984,009 $172,650,781 $163,403,785
Total Administration $8,213,231 $7,893,370 $7,767,592 $7,874,994
YISD Administrative Cost Ratio 4.73% 4.51% 4.50% 4.82%
State Standard Administrative Cost Ratio 11.05% 11.05% 11.05% 11.05%
Difference from State Standard (Percent) 6.32% 6.54% 6.55% 6.23%
Difference from State Standard (Dollars) $10,986,988 $11,442,363 $11,310,319 $10,181,124
Definition of Functions:
Instructional Administrative
11 Classroom Instruction 21 Instructional Administration
22 Library/Resource Media 41 General Administration
25 Instructional Staff Development
31 Counseling
Explanatory Notes or Comments: This section will contain notes and comments related to administrative costs. Source: YISD, developed by Empirical Management Services.
Exhibit 1-5 YISD Sample Presentation of Budget Data
Sample High School
Position Information (FTE's)
Position FY 1997-98 Budget
FY 1996-97 Actual
Increase (Decrease)
Teachers 32.0 33.0 (1.0)
Counselors 2.0 2.0 -0-
Principals/Asst. Prin. 3.0 3.0 -0-

Teacher Aides 6.0 8.0 (2.0)
Clerks 4.0 2.5 1.5
Food Service 7.0 6.0 1.0
Custodial/Other Staff 4.5 4.5 -0-
Total 58.5 59.0 (0)
Student Data (1996-97)
Total Enrollment 1,200 At-Risk 67%
Ethnicity Mobility Rate 23%
Hispanic 86% Attendance Rate 90%
Anglo 12% Dropout Rate (Gr. 9-12) 5%
African American 2% Graduation Rate 86%
Free/Reduced Lunch 78% Honors Classes 13%
Special Education 3% Limited English 31%
Grades Served: 9-12
Teacher Data (1996-97
Average Teacher Experience: 10 Years Percent with Advanced Degrees: 48% Percent Certified: 100%
Source: YISD, developed by Empirical Management Services. IMPLEMENTATION STRATEGIES AND TIMELINE
1. The board identifies critical management information desired by board members and designates the type, format, and content of executive management reports. June 1998
2. The superintendent directs appropriate members of the cabinet to create drafts of these reports for review by the board. June - July 1998
3. The board suggests appropriate revisions and draft executive management reports are finalized by the superintendent's cabinet. July - August 1998
4. The superintendent begins submitting executive- level management reports to the board each month.
September 1998 and ongoing
FISCAL IMPACT

This recommendation can be implemented with existing resources.

Chapter 1 DISTRICT ORGANIZATION AND MANAGEMENT
B. Planning Planning is essential to effective school district management. Proper planning establishes a mission and identifies goals and objectives, sets priorities, identifies ways to complete the mission, and determines performance measures and benchmarks to measure the achievement of goals and objectives. In its purest sense, planning anticipates the effect of decisions, indicates the possible financial consequences of alternatives, seeks to enhance educational programs and methods of support, and links student achievement to the cost of education. FINDING The District has a stated vision that "all students will graduate from high school fully bilingual and prepared to enter a four-year college or university." This vision statement can be repeated verbatim by most district employees at all levels, and programs and activities of the district are regularly measured against that statement during critical decision-making periods. Huge banners display the mission in the YISD Central Administration Building and at various campuses throughout the district. The superintendent, with assistance from the cabinet, is responsible for YISD's overall planning process. YISD has created three separate long-term plans: the district improvement plan; a technology plan; and a construction improvement plan. COMMENDATION YISD has a vision statement that is widely known and guides district decision-making. FINDING The board has not conducted a planning retreat in the past two years. District administrators, however, attend a two-day planning retreat away from the office setting each year. In spring 1996, YISD contracted with the INOVA International Services Group, Inc. (INOVA) for help with the development of a strategic plan. INOVA, in collaboration with the District Education Improvement Council (DEIC) and superintendent, selected a 25-member strategic

planning task force to meet five times during fall 1996 to develop a plan. The task force represented major district stakeholders and included seven teachers who were DEIC members, four campus principals, four community representatives who were DEIC members, two executive directors for Instruction, and eight members of the superintendent's cabinet. The associate superintendent for Instruction said INOVA's first charge was to collect information on the existing district strategic plan to determine its level of completion and to serve as part of a needs assessment for the new plan. Accordingly, INOVA met individually with the superintendent and each associate superintendent to review components of the current plan in the areas of finance, human resources, instruction, operations, and technology. Afterward INOVA assisted the DEIC in developing a "District Improvement Plan, Five-Year Strategic Profile," dated December 1996. This document contained many elements of a strategic plan including:
• definition of district beliefs and visions and identification of critical success factors;
• identification of driving forces in the areas of operations, human resources, finance, technology, professional development, and student achievement, and
• development of strategic goals and objectives in five areas of strategic focus: curriculum and instruction, human resources development, community engagement, resource management, and organizational dynamics.
Drafts of this plan were presented to campus principals on two occasions for their input before its formal presentation to the board for adoption. While the DIP does an excellent job of addressing YISD's instructional programs, it does not contain strategic goals and objectives for operational areas such as facilities, transportation, technology, food services, and the like. Nor does it show the relationship between these support functions and the district's overall vision. For example, having a goal of increasing breakfast participation can have a direct relationship to improved student performance; studies show that students who are not hungry are more attentive in class and have fewer discipline and attendance problems. The DIP recognizes these operational areas as a driving force of the district, and identifies some needs in these areas, but falls short of outlining strategic goals and objectives or specific implementation timelines and responsibility assignments for these critical areas of district operations.

Another missing element from the DIP and the process for developing the DIP is a strategy for monitoring and follow-up. A true strategic plan is a living document that is reviewed annually to determine progress, and action plans are modified as appropriate to ensure success. In its search for best practices, TSPR found that Spring ISD uses a comprehensive planning and management system to: establish a clear direction for the district; build support for and concentrate resources on district priorities; assist the district in accomplishing objectives; and provide valid information for decision-making. Spring ISD's strategic planning process is directed by its board and begins with a Five-Year Education Plan used by the board and all district administrators to make decisions. The plan is the result of a collaborative effort that involves input from teachers, administrators, parents, students, and community members. Surveys and interviews are used extensively to gather perceptions and information critical to the success of a comprehensive strategic plan. The district then establishes task groups of community members, parents, teachers, and administrators, with a district administrator serving as chair for each group and providing clerical support. The task groups meet and develop districtwide priorities to be presented to the board, and recommend action steps and performance measures for the coming year to guide district staff members and give the board a means of measuring success. Each year, the plan is updated and adjusted to reflect the results of the prior year's efforts. The board reviews the updates annually, adopts objectives for the upcoming year, and allocates budget resources based on the current year's priorities. Recommendation 4: Develop a comprehensive strategic plan that reflects the priorities of the board, superintendent, administration, and community, and the district's long-term goals and objectives for all areas of district operations. YISD should undertake a comprehensive strategic planning initiative to build upon the process started by the DEIC in developing the DIP. This process should include the board, superintendent, district and school administrators, teachers, students, and community members. The initiative should be designed to build upon the district's vision shared by all participants, along with the district's long-term goals, objectives, implementation initiatives, timelines, and responsibility assignments. Performance measures should be defined to measure the achievement of objectives and district priorities should be established and linked to the district's budget for all areas of the district including operational areas.

IMPLEMENTATION STRATEGIES AND TIMELINE
1. The superintendent and board president combine the strategic planning retreat with a team-building retreat and have the facilitator lead a goal-setting session to establish their priorities for the district.
August 1998
2. The board directs the superintendent to develop a strategic plan for the district from goals and objectives agreed to in the envisioning session.
August 1998
3. The superintendent forms a strategic planning oversight committee consisting of administrators, board members, principals, teachers, parents, members of Campus Educational Improvement Councils, community leaders, and business leaders.
August - September 1998
4. The superintendent designates the assistant superintendent for Curriculum and Instruction as chair of the committee.
September 1998
5. The superintendent presents the goals and objectives from the envisioning retreat to the chair of the strategic planning oversight committee.
September 1998
6. The associate superintendent for Curriculum and Instruction creates functional work teams to address the goals and objectives defined by the board and superintendent.
October 1998
7. The work teams develop action plans, timelines, and performance measures for the strategic plan.
October - December 1998
8. The strategic planning oversight committee prepares an initial draft of the strategic plan
January - March 1999
9. The strategic planning oversight committee presents the initial draft of the strategic plan to the board for review and comments.
March 1999
10. The work teams revise the initial draft to include the board's comments and present the strategic plan to the community for public input.
April - May 1999
11. The strategic planning oversight committee includes substantive comments received from the community into the draft and finalizes the strategic plan.
June 1999
12. The board approves the strategic plan. July 1999
13. The superintendent and board monitor and update the August 1999

strategic plan. and each year thereafter.
FISCAL IMPACT This recommendation can be implemented with existing resources.

Chapter 1 DISTRICT ORGANIZATION AND MANAGEMENT
C. District Management As specified in Section 11.202 of the Texas Education Code and paragraph 2 of the superintendent's employment contract, the superintendent is the chief executive officer of the district and is responsible for:
• assuming administrative responsibility and leadership for the planning, operation, supervision, and evaluation of the education programs, services and facilities of the district and for the annual performance appraisal of the district's staff;
• assuming administrative authority and responsibility for the assignment and evaluation of all personnel of the district other than the superintendent;
• making recommendations regarding the selection of personnel of the district other than the superintendent as provided by Section 11.163 of the Texas Education Code;
• initiating the termination or suspension of an employee, or the non-renewal of an employee's term contract;
• managing the day-to-day operations of the district as its administrative manager;
• preparing and submitting to the Board of Trustees a proposed budget as provided by Section 44.002 of the Texas Education Code;
• preparing recommendations for policies to be adopted by the Board of Trustees and overseeing the implementation of adopted policies;
• developing or causing to be developed appropriate administrative regulations to implement policies established by the Board of Trustees;
• providing leadership for the attainment of student performance in the district based on indicators adopted under Section 39.051 of the Texas Education Code and other indicators adopted by the State Board of Education or the district's Board of Trustees;
• organizing the district's central administration;
• performing any other duties assigned by action of the Board of Trustees;
• making decisions regarding the selection of all personnel other than the superintendent, subject to Texas Education Code Section 11.202(d);

• determining the terms of employment within the district;
• developing, evaluating, and revising a district improvement plan annually with the assistance of the district- level committee established under Section 11.251 of the Texas Education Code; and
• regularly consulting the district- level committee in the planning, operation, supervision, and evaluation of the district's educational program.
CURRENT SITUATION Anthony J. Trujillo has served as YISD superintendent since February 1992. Mr. Trujillo's contract was amended by the board in November 1996 to begin on November 13, 1996 and end on November 12, 2001. YISD's organizational structure is presented in Exhibit 1-6.
Exhibit 1-6 YISD Organization Structure

Effective September 1997
Source: YISD The superintendent's cabinet is the district's administrative management team and consists of the superintendent, the associate superintendent for Curriculum and Instruction, the associate superintendent of Human Resources, the chief finance officer, the executive directors of Technology and Information Systems, Facilities, Auxiliary Programs, Staff Development, Adult Basic Education and Governmental Relations, and Media Relations and Partners in Education. The superintendent meets with his cabinet each Tuesday morning. Cabinet meetings typically include the issuance of directives by the superintendent, status reports by members of the cabinet, and extensive discussions on issues related to district administration. FINDING In an effort to establish the central office as a support body for schools, the superintendent began

streamlining central administration upon his appointment five years ago. A detailed "Comparison Report of Reductions in Central Office Administration" between January 1992 and July 1995 compiled by the associate superintendent for Human Resources and attached to a memorandum dated July 27, 1995 indicates that a total of 22 administrative positions had been eliminated, producing $1,100,000 in annual savings. These reductions consisted primarily of the elimination of two of four instructional support teams; the savings were reallocated to YISD schools. In 1997-98, the superintendent established a goal to further reduce central administration spending by about $5 million for the 1998-99 fiscal year and to allocate about 60 percent of the district's resources to direct classroom instruction. During on-site interviews, the superintendent said he was convinced that, if the central office played a support role for schools and granted principals and teachers greater autonomy, the district would become more efficient and effective. Survey results appear to support the superintendent's theory. Exhibit 1-7 presents responses received from YISD principals and assistant principals related to their perceptions of the effectiveness of district- level administration and the efficiency of district operations.
Exhibit 1-7 Principal and Assistant Principal Results
Effectiveness and Efficiency of YISD Administration and Operations
Question A B C D F NR Total
What grade would you give the superintendent of YISD? 47% 39% 7% 5% 1% 1% 100%
In general, what grade would you give the other district-level administration in YISD? 14% 46% 32% 6% 0% 2% 100%
What is your overall grade for the operations of YISD? 8% 46% 33% 5% 1% 7% 100%
Source: YISD Principal and Assistant Principal Survey Results, 11/97. NR = No Response Eighty-six percent of principals and assistant principals responding to the survey gave the superintendent a grade of "A" or "B," and 60 percent gave other district- level administrators grades of "A" or "B," indicating considerable satisfaction with the effectiveness of central administration in its support role. Moreover, 54 percent of the respondents graded YISD operations as "A" or "B."

COMMENDATION YISD's superintendent has reduced the cost of central administration and reallocated these financial resources to the district's instructional program. FINDING YISD has an unconventional, decentralized organizational structure designed to give cabinet members direct access to the superintendent. District organization charts show only the major functions reporting to the superintendent and managed by members of the cabinet. Exhibit 1-6 shows seven functions reporting to the superintendent. The Finance, Auxiliary Services, and Facilities Divisions represent business and administrative functions that many districts consolidate within one function. For example, Corpus Christi ISD, with more than 41,000 students, consolidates its finance, business, technology, and human resources functions in a single business and administrative area. YISD separates these divisions because the superintendent prefers to eliminate layers of executive management that prevent business and administrative managers from having "unfettered access" to his office. At the division level, TSPR found that some functions are misaligned. For example, the Division of Instruction includes the Public Outreach Department and the Adult Basic Education/Governmental Relations Department that deal more specifically with external relations and community outreach rather than instruction. Although 77 percent of principals and assistant principals responding to TSPR surveys felt that effective lines of communication exist between their schools and central administration, communication between the superintendent and cabinet members and among various district divisions can be improved. The superintendent issues oral directives to cabinet members; few directives are issued in writing. For example, TSPR was told that the superintendent communicates district budget priorities verbally, and that these priorities are constantly changing, providing a perennial source of frustration for some members of the executive team. Moreover, according to some central and school administrators, schools tend to receive competing and conflicting directives from various divisions within the cabinet. As a result, schools sometimes do not know which directives should take priority. The superintendent told TSPR that he outlines broad district goals and objectives for improved student achievement and district administration and operations, and expects the executive team to handle the details. He feels that he provides adequate direction to the team during weekly cabinet meetings. While many positive comments were given, some central administrators and teachers, seem to feel differently. The following verbatim comments by central administrators and teachers were contained in TSPR's survey results: Central Administrators
• "...Communication is poor, weak, non-existent, and sometimes rude..."
• "...I recommend enhancing the communication structure among administrators, faculty, and students..."

• "...Commit to have more meetings with staff concerning efforts of YISD and expectations administrators have for the staff they are directly involved with..."
• "...There are real problems with communication. Those of us "out in the field' don't understand central administrators' frustrations, and the opposite is definitely true. It's as if team work and the concept of team work is non-existent..."
• "...More positive, effective communication should be a priority..."
• "...Opening the lines of communication within departments will eliminate duplication of work..."
Teachers
• "...implement truthful communication between administrators and teachers (presently, too many hidden agendas exist)..."
• "...have e-mail capacity between the schools and central office. Use available internet and intranet connections. Allow communication to open up (like the rest of the world)..."
In addition, as of December 1997 YISD had few formal department organization charts illustrating organizational structures or reporting relationships. In February 1998, however, the district developed organizational charts for all departments. Recommendation 5: Reorganize YISD to align similar functions, establish direct reporting relationships, improve communications, and clearly assign accountability and specific lines of authority. YISD should reorganize its departments to group similar functions and reflect direct reporting relationships with clear lines of authority to enhance accountability. This grouping should not be allowed to disrupt direct access to the superintendent by managers and directors of critical functions. Recommended organizational changes include:
• establishing an associate superintendent for Business and Administration position to oversee and coordinate Finance, Human Resources, and Business Services functions such as Food Service, Purchasing and Warehousing, Security, and Transportation,
• consolidating the purchasing and warehousing functions and transferring oversight and coordination responsibility to the associate superintendent for Business and Administration,

• renaming the position of associate superintendent of Curriculum and Instruction as the associate superintendent for Instructional Support and Operations to reflect oversight of both instructional support and school operations under decentralized site-based decision-making,
• creating the position of executive director for Community Relations and Information Services, and transferring YISD's governmental relations and public outreach functions to this area from the associate superintendent for Instruction and Operations,
• transferring the Division of Professional Development from direct reporting to the superintendent to the management of the associate superintendent for Instructional Support and Operations, to reflect the appropriate functional grouping,
• creating positions for an internal auditor, and
• creating an "extended" cabinet to provide direct access to the superintendent for managers and directors of critical functions below the executive level.
Exhibit 1-8 presents the proposed organizational structure for YISD.
Exhibit 1-8 YISD Proposed Organizational Structure

Source: TSPR Review Team IMPLEMENTATION STRATEGIES AND TIMELINE
1. The superintendent announces a reorganization of YISD for the end of the 1998-99 August 1998

school year.
2. The associate superintendents and executive directors revise all job descriptions to reflect new responsibilities.
September - October 1998
3. The superintendent informs associate superintendents and executive directors of positions to be consolidated or eliminated.
November 1998
4. The associate superintendents meet with each director to discuss new responsibilities. December 1998
5. The superintendent includes the organizational changes into YISD's 1999-2000 budget. January 1999
6. The superintendent implements the reorganization and forms the "extended" cabinet. August 1999
FISCAL IMPACT The fiscal impact of some of the organizational changes in this recommendation are reflected in the specific chapters in which the affected functions are reviewed. In this chapter, the fiscal impact is related to adding the associate superintendent for Business and Administration position for $92,880 annually ($86,000 in salary plus fringe benefits at 8 percent).
Recommendation 1998-99
1999-2000 2000-01 2001-02 2002-03
Reorganize YISD to more logically align similar functions $0 ($92,900) ($92,900) ($92,900) ($92,900)
FINDING During interviews conducted at YISD schools, some teachers and guidance counselors told members of the review team that they felt the superintendent's philosophy of having schools compete against each

other academically is detrimental to district morale. In their opinion, the superintendent pits principals against principals, departments against departments, and colleagues against colleagues in the interest of fostering competition and improving student performance. The superintendent's management style has been described as, "It's my way or the highway." The superintendent told TSPR he demands credible results from subordinates throughout the district. The superintendent said his focus on results is essential to improving student performance, and he is not apologetic about his management style. However, he acknowledged that various tough decisions regarding the reassignment and termination of campus and district- level employees inevitably have affected morale. When TSPR asked teachers to grade the superintendent as an instructional leader and administrative manager, 39 percent gave the superintendent an "A" or "B." Thirty-three percent, moreover, assigned grades of "D" or "F." This perception appears to contribute to low morale among teachers. The superintendent, meanwhile, points to the results and contends that great improvements in student achievement are a direct result of school-to-school competition. Recommendation 6: Conduct periodic forums with teachers and counselors. The superintendent should conduct periodic forums (at least quarterly) with teachers and counselors to enhance two-way communication and provide positive reinforcement. The forums should be informal and address issues of concern to teachers and counselors, providing an opportunity for employees to exchange ideas with the superintendent. The superintendent should use these forums to present rewards to high-performing schools and departments to boost employee morale while reinforcing the demand for results. IMPLEMENTATION STRATEGIES AND TIMELINE
1. The superintendent solicits input from teachers and counselors on an acceptable format for the forums. August 1998
2. The superintendent schedules the quarterly forums and agrees to a reporting format with the board. September 1998
3. The superintendent conducts the quarterly forums. October 1998 and every quarter thereafter
4. The superintendent uses feedback from the forums to provide positive reinforcement to teachers and counselors.
October 1998 and every quarter thereafter

FISCAL IMPACT This recommendation can be implemented with existing resources. FINDING YISD's board has changed legal counsel twice in the last eight months and three times in the past four years, resulting in higher legal costs. Higher costs are incurred when law firms are changed because new attorneys must familiarize themselves with district personnel, cases, and legal issues that occurred before the firms were under contract with the district. Between 1994-95 and 1996-97, YISD's legal fees averaged $350,506 annually for services such as general advice and counsel, contractual matters, administrative proceedings, professional liability, and litigation. Legal fees related to professional liability alone averaged $178,828 annually and accounted for more than half of all legal fees (Exhibit 1-9).
Exhibit 1-9 YISD Legal Fees
1994-95 Through 1996-97
Service 1994-95 1995-96 1996-97 Average
General Advice & Counsel $51,456 $56,242 $39,122 $48,940
Contractual Matters 14,023 18,394 15,960 16,323
Administrative Proceedings 15,643 61,945 20,565 21,764
Subtotal Routine Services $81,122 $136,581 $75,647 $97,783
Litigation 48,904 86,510 86,267 73,893
Professional Liability 171,696 167,739 197,051 178,828
Subtotal Special Services $220,600 $254,249 $283,318 $252,722
Grand Total $301,722 $390,830 $358,965 $350,506
Source: YISD Financial Division. YISD does not carry legal liability insurance coverage that pays any civil claim or claims made against the district because of wrongful acts by school administrators. This type of coverage typically pays legal fees and expenses once a lawsuit or civil claim is filed. Instead, in 1988-89 the district established a

$750,000 legal reserve fund at a local bank to absorb the cost of settlements and legal fees arising from lawsuits against board members and district employees. The Asset and Risk Management chapter discusses this fund in more detail. At the November 13, 1997 board meeting, YISD's superintendent recommended that the board use four separate law firms to provide legal services. In an effort to control spiraling legal costs, each firm would not receive a retainer and could not bill the district more than $125 per hour for legal services, whether the services were for routine legal matters or specialized matters such as litigation and professional liability. The board approved three of the law firms proposed and tabled the fourth, pending further negotiations. Texas school districts have used a number of different approaches to control their legal costs. These approaches include purchasing legal liability insurance for protection against professional liability claims. Recommendation 7: Purchase legal liability insurance for school administrators. YISD should contact legal liability insurance carriers to obtain bids for insurance to indemnify the district against civil claims in professional liability cases. The annual savings in legal fees should more than repay the cost of the annual premium. IMPLEMENTATION STRATEGIES AND TIMELINE
1. The superintendent directs the director of Purchasing to solicit bids for liability insurance for school administrators. June 1998
2. The director of Purchasing solicits competitive sealed bids for legal liability insurance. June - July 1998
3. The director of Purchasing reviews bids and recommends an insurance carrier to the board for approval.
August 1998
4. The board approves liability insurance carrier. August 1998
FISCAL IMPACT The annual premium cost for school leaders legal liability insurance is estimated at about $15,000, and should be offset from savings in district-born legal fees. Therefore no fiscal impact is assumed.

Chapter 1 DISTRICT ORGANIZATION AND MANAGEMENT
D. School Management and Site-Based Decision-Making Section 11.253(a) of the Texas Education Code (TEC) requires "each school district to maintain current policies and procedures to ensure that effective planning and site-based decision-making occur at each campus to direct and support the improvement of student performance." Site-based decision-making (SBDM) allows teachers, parents, and community members to help central and campus administrators improve student performance. The TEC requires each school district to establish campus-level planning and decision-making committees consisting of representative professional school employees, parents, business representatives, and community members. These committees advise and work with school administrators on campus planning, goal-setting, budgeting, and decision-making. TEC Section 11.253(c) also requires that "each school principal, with the assistance of the campus- level committee, develop, review and revise the campus improvement plan for the purpose of improving student performance for all student populations." The campus plan must outline the role of the school committees in goal-setting, curriculum, budgeting, staffing patterns, and school organization. The law also requires districts to establish a district- level planning and decision-making committee configured like the campus committees. At least two-thirds of the district's representatives on this committee must be classroom teachers. TEC Section 11.252(a) requires that "each school district have a district improvement plan that is developed, evaluated and revised annually in accordance with district policy, by the superintendent with the assistance of the district- level committee. The purpose of the district improvement plan is to guide district and campus staff in the improvement of student performance for all student groups in order to attain state standards in respect to academic excellence indicators (dropout rates, percentage of graduating students who meet course requirements established for a recommended high school program, results of Scholastic Aptitude Test)." Every two years, each school district must evaluate the effectiveness of its decision-making and its policies, procedures, and staff development activities related to district and campus-level decision-making and planning. This evaluation is intended to ensure that district policies, procedures and staff development activities are effectively structured to boost student performance. CURRENT SITUATION YISD has a established both district- level and campus- level decision-making processes to comply with state law. The district- level decision-making process is led by the superintendent through the District Educational Improvement Counc il (DEIC). The DEIC assists the superintendent in establishing and reviewing YISD's educational plans, goals, performance objectives, and major classroom programs. The DEIC, selected through a combination of districtwide election and appointments by the superintendent, consists of:

• four elementary school teachers
• two middle school teachers
• two high school teachers
• four other campus- and district- level professionals
• seven parents, community members, and business representatives
• the superintendent or his designee
Each school has a campus SBDM committee; these are called Campus Educational Improvement Councils (CEICs). CEICs are chaired by principals and made up of parents, community members, teachers, and other professional staff from the school. Each CEIC submits campus improvement plans to the associate superintendent for Curriculum and Instruction in accordance with the Texas Education Code. FINDING During school visits conducted by TSPR's review team, principals praised the superintendent for his aggressive efforts to implement site-based decision-making. Most principals told the review team that the superintendent is supportive of SBDM, and has allocated sufficient financial resources to the schools to implement SBDM. Most said they appreciate the authority and autonomy they receive through SBDM. TSPR's survey of principals and assistant principals supported such comments. For example, two-thirds of principals and assistant principals either agreed or strongly agreed that YISD has implemented SBDM effectively. Comments from community members received in focus groups and public forums also support this positive view of SBDM. Sample comments include:
• "...Site-based management is necessary for any principal to do his or her job efficiently. If not, we should be able to complain and get prompt response from the district when there is a problem. Keep up the good work Superintendent Trujillo!..."
• "...SBDM is well implemented at Cesar Chavez Academy. The administrator achieves great results..."
• "...SBDM allows schools to tailor responses to various issues..."
• "...SBDM is positive because it involves the community..."
• "...SBDM works with responsive central office support..."

Members of the review team, however, also heard negative comments some from individuals who said decisions made by CEICs are overridden or ignored by principals throughout the district. Some CEIC members feel that their CEICs are "stacked" in favor of principals, preventing them from offering objective input. The following are examples of negative comments made by some focus-group participants and community members attending public forums:
• "...SBDM exists in name only; teachers aren't always involved in decisions; this system works better at some campuses than others. They are democratic dictatorships..."
• "...SBDM is not effective. When parents and community members come to the central administration for something, SBDM is used as a scapegoat to push the issue back to schools..."
• "...The District Educational Improvement Council hand-picks CEICs, who are cronies of the superintendent..."
• "...SBDM depends upon the leader as to how well it works..."
• "...Site-based management allows principals to be dictators of their campuses. Our principal has told several parents that if they weren't happy with her decisions, they could transfer. She also said `this is my campus and I'll do what I want to do.' For this reason, I believe site-based management has the potential to make principals monsters that the children and parents are stuck with..."
TSPR noted that many CEIC members do not seem to understand that they serve in an advisory capacity. Most said they thought decisions of the CEIC, as a whole, were final and should be followed by the principal. Comments received from parents and community members related to the role of CEICs include:
• "...I am a member of the CEIC but feel most of our budget is already dictated to us by central office..."
• "...Principals have absolute authority over all decisions made by CEICs..."
• "SBDM does not work well; parents who sit on CEICs have their opinions ignored. The parents are there as window dressing..."
• "...If SBDM is to be effective, then schools should allow members of the CEIC to make decisions. Instead, the CEIC is often told about decisions made by administrators after the fact, especially regarding budget decisions..."

As advisors, CEIC members provide valuable input into decisions and should be listened to by principals and district management, but there are certain decisions that rest solely with the principal or central administration. Some districts have addressed this issue by preparing a matrix that clearly shows the roles and responsibilities of the CEIC, DEIC, principals, and central office administrators. Section F of YISD's Local Policy ELB-R states that "...training for each CEIC shall be scheduled in the summer or within the first six weeks of the school year. The training may include orientation of the process of site-based decision-making, consensus building, effective and efficient communication, conflict resolution, data used as analysis in planning, and other topics as requested by the CEIC..." The associate superintendent for Curriculum and Instruction told the review team that all new and existing CEIC members receiving training in their roles from YISD staff each year. Recommendation 8: Provide additional mandatory training for CEIC members to clarify and reinforce their roles and responsibilities as defined in the Texas Education Code. As part of existing training, CEIC members including principals should be trained in their roles and responsibilities in site-based decision-making, and methods for enhancing cooperation. A matrix of responsibilities may also provide clarity for all participants. This would encourage greater cooperation between CEIC members and principals on decisions that affect their schools. At least two training sessions should be offered each school year to allow CEIC members to openly discuss issues related to their responsibilities and any problems they may have with the manner in which school principals implement decisions made by the committee as a whole. IMPLEMENTATION STRATEGIES AND TIMELINE
1. The associate superintendent for Curriculum and Instruction revises YISD policy to require two mandatory training sessions related to SBDM for all members of CEICs.
June 1998
2. The board approves the policy requiring two mandatory training sessions. August 1998
3. The assistant superintendent for Curriculum and Instruction establishes a mandatory training schedule for the two sessions.
August 1998
4. The assistant superintendent for Curriculum and Instruction directs SBDM training staff to begin conducting training sessions.
September 1998 and each September and March thereafter.
FISCAL IMPACT

Because YISD already budgets for annua l training for CEICs, this recommendation can be implemented with existing resources. FINDING When YISD's superintendent implemented SBDM, responsibilities for budgeting and managing operations were transferred to the schools. Yet the principals did no t receive additional training in areas such as financial management (especially grants administration and purchasing), hiring, and human relations. The superintendent told TSPR that principals do not receive continuous training in site-based management, and agreed that many principals lack adequate knowledge of these areas. Comments by central administrators support the superintendent's view that principals are inadequately trained in budgeting and other financial matters. Recommendation 9: Provide extensive training in financial management, human relations, and hiring to all YISD principals. YISD should provide comprehensive, ongoing training for principals to ensure they have the skills to effectively serve as chief executives of their respective schools. At a minimum, the district should offer quarterly training in financial management, human relations, and hiring. IMPLEMENTATION STRATEGIES AND TIMELINE
1. The associate superintendent asks the director of Professional Development to develop in-service workshops related to budgeting and financial management, human relations, and hiring for principals.
June 1998
2. The director of Professional Development develops the appropriate in-service workshops.
July - September 1998
3. The director of Professional Development publishes a schedule of in-service workshops for principals. October 1998
4. Professional Development personnel conduct the appropriate workshops. October 1998 - August 1999 and yearly thereafter
5. The director of Professional Development surveys school principals on the effectiveness of the workshops and suggestions for new ones.
June 1999 and each June thereafter
6. The director of Professional Development uses the principals' responses and comments to improve and expand its program of in-service workshops.
August 1999 and each year thereafter
FISCAL IMPACT This recommendation can be implemented with existing resources since YISD maintains a professional development training staff. FINDING YISD has an administrative staffing allocation formula for elementary, middle, and high schools that uses a budgetary approach. The formula allocates 1997-98 budget resources for campus support based on 1997-98 average daily attendance (ADA) for each school, multiplied by $314. For 1996-97 the allocation amount was $312. For example, if a school has projected 1997-98 ADA of 1,250 students, it would receive a budget allocation of $392,500 for campus support. Campus support includes administrative staff in the following categories: (1) instructional resources and media services (librarian and library aides), (2) school administration (principals, assistant principals, and clerical staff), (3) guidance and counseling services (counselors), and (4) health services (nurses). Suggested budget development strategies outlining recommended staffing guidelines for elementary, middle, and high schools are defined for each campus support category in the 1997-98 Budgeting Instruction Manual. Exhibit 1-10 presents a sample of YISD's suggested staffing pattern for campus support.
Exhibit 1-10 YISD Administrative Staffing for Campus Support
1997-98

Staff Classification
Elementary Schools, Less than 1,000 Students
Elementary Schools, More than 1,000 Students
Middle Schools, Less than 1,000 Students
Middle Schools, More than 1,000 Students
High Schools, Less than 1,700 Students
High Schools, Between 1,700 and 2,500 Students
High Schools, More than 2,500 Students
Principal 1 1 1 1 1 1 1
Asst. Principal 1 2 1 2 2 3 4
Librarian/Aide 1 1 1 1 1 2 3
Counselor 1 1 2 3 4 6 7
Clerks 2 - 3 (A) 3 4 - 5 (B) 5 7 7 - 12 (C) 14
Source: Calculated from Staffing Guidelines included in 1997-98 Budgeting Instruction Manual, Pages 1-23 and 1-24. A. Elementary schools are allocated one additional clerk per 250 students over 750 students enrolled. B. Middle schools are allocated one additional clerk per 250 students over 700 students enrolled. C. High schools are allocated one additional clerk per 200 students over 1,200 students enrolled. Although YISD uses a budget-based administrative staff allocation model, the associate superintendent for Curriculum and Instruction told the review team that the district's emphasis on SBDM allows schools to maintain their staffs as they choose as long as they meet performance standards. Exhibit 1-11 illustrates YISD's actual allocation of administrative staff at its elementary, middle, and high schools.

Exhibit 1-11 Actual Staffing Allocation for Administrative and Support Staff
1997-98 School Year
High Schools
97-98 Enroll. Principal Asst.
Prin. Counselors Librarian Library Aide Nurse Nurse
Aide Clerical
Parkland High
1094 1 2 3 1 1 1 1 13
Riverside High
1387 1 4 5 1 1 1 0 14
Ysleta High 1784 1 3 6 1 1 1 1 13
Del Valle High 1876 1 3 7 1 1 1 1 13
Bel Air High 2166 1 2 7 1 1 1 0 15
Eastwood High
2231 1 3 7 1 1 1 0 15
Hanks High
2742 1 5 7 1 2 1 0 17
Middle Schools
97-98 Enroll. Principal Asst.
Prin. Counselors Librarian Library Aide Nurse Nurse
Aide Clerical
Rio Bravo 426 1 1 1 1 1 1 0 5
Ysleta 429 1 1 1 0 0 1 0 6
Ranchland 452 1 0 1 1 0 2 0 4
Hillcrest 596 1 1 2 1 0 1 0 5
Desert View
624 1 1 1 1 1 1 0 5
Parkland 692 1 1 2 1 0 1 1 5
Valley View 704 1 1 2 1 0 1 0 6
Camino Real
732 1 1 1 1 1 1 0 7

Eastwood 795 1 1 2 1 1 1 0 5
Riverside 802 1 1 1 1 0 1 0 5
Indian Ridge 670 1 1 2 1 0 1 0 4
Elementary Schools
Ramona 363 1 1 1 1 0 1 0 2
Cadwaller 365 1 1 1 1 0 2 0 2
Presa 454 1 1 1 1 0 1 0 3
South Loop
464 1 1 1 1 0 1 0 3
Ascarte 499 1 1 1 0 1 1 0 3
Sageland 537 1 1 1 1 0 1 0 2
Mesa Vista 554 1 1 1 1 1 1 0 2
Capistrano 614 1 1 1 1 0 1 0 3
Dolphin Terrace 617 1 1 1 1 0 1 0 2
Hacienda Heights 639 1 1 1 1 0 1 0 3
Marian Manor 647 1 1 1 1 0 1 0 4
Del Norte Heights
690 1 1 1 1 0 1 0 3
Cedar Grove
693 1 1 1 1 0 1 0 4
Eastwood Knolls 729 1 1 1 1 1 1 0 4
Eastwood Heights 731 1 1 0.5 1 0 1 0 2
Pasodale 740 1 1 1 0 1 1 0 4
Ysleta Pre-K 792 1 1 1 1 0 1 0 3

Lancaster 795 1 1 1 1 0 1 0 3
Desertaire 802 1 1 1 0 2 1 0 5
Vista Hills 820 1 1 1 1 1 1 0 3
Thomas Manor
821 1 1 1 1 1 1 0 3
Ysleta 821 1 1 1 1 0 1 0 4
Tierra Del Sol
824 1 1 1 1 1 1 0 3
Mission Valley
881 1 1 1 1 0 1 0 4
Scotsdale 910 1 1 0.5 1 1 1 0 3
Lebarron Park
912 1 1 1 1 1 1 0 5
North Loop
914 1 2 1 1 1 1 0 5
Parkland 927 1 1 1 0 1 1 0 3
Loma Terrace
982 1 2 0 1 1 1 0 4
Edgemere 1007 1 1 1 1 1 1 0 4
East Point 1013 1 1 1 1 0 1 0 4
Pebble Hills 1042 1 1 1 1 1 1 0 5
Glen Cove 1141 1 2 1 1 1 1 0 5
Source: Division of Instruction, 12/8/97 The allocations in Exhibit 1-11 include at least one assistant principal for each of the 29 elementary schools with enrollments of fewer than 1,000 students, but two assistant principals are allocated to North

Loop and Loma Terrace elementary schools. Additionally, the administrative staffing pattern presented in Exhibit 1-10 calls for high schools with enrollments between 1,700 and 2,500 to be allocated four to six counselors, but Exhibit 1-11 shows that three high schools with less than 2,500 students have seven counselors each. Moreover, clerical staff at seven middle schools and 15 elementary schools exceed the district's recommended administrative staffing guidelines shown in Exhibit 1-10. Exhibit 1-12 shows the 1996-97 ADA by campus and calculates the administrative allocation for each campus based on YISD's allocation formula versus the actual expenditures by campus.
Exhibit 1-12 YISD Budget Allocation Formula Campus Support
Comparison of Budget Allocation to Actual Expenditures 1996-97
High Schools 1996-97 ADA
Per Capita Allocation (A)
Total Admin. Allocation
Actual Expenditures 1996-97
Actual (Over)Under Allocation
Bel Air High 1,851 $312.00 $577,512 $993,684 ($416,172)
Del Valle High 1,688 $312.00 $526,656 $987,699 ($461,043)
Eastwood High 2,014 $312.00 $628,368 $1,005,433 ($377,065)
Hanks High 2,505 $312.00 $781,560 $1,173,582 ($392,022)
Parkland High 930 $312.00 $290,160 $662,546 ($372,386)
Riverside High 1,265 $312.00 $394,680 $751,170 ($356,490)
Ysleta High 1,624 $312.00 $506,688 $908,306 ($401,618)
Subtotal 11,877 $3,705,624 $6,482,420 ($2,776,796)
Middle Schools
Camino Real 688 $312.00 $214,656 $416,612 ($201,956)
Desert View 576 $312.00 $179,712 $414,232 ($234,520)
Eastwood 797 $312.00 $248,664 $449,664 ($201,000)
Hillcrest 586 $312.00 $182,832 $434,935 ($252,103)
Indian Ridge 689 $312.00 $214,968 $422,461 ($207,493)
Parkland 617 $312.00 $192,504 $409,446 ($216,942)
Ranchland Hills 423 $312.00 $131,976 $363,346 ($231,370)

Rio Bravo (B) $312.00 $0 $146,788 ($146,788)
Riverside 783 $312.00 $244,296 $468,780 ($224,484)
Valley View 687 $312.00 $214,344 $457,617 ($243,273)
Ysleta 389 $312.00 $121,368 $418,864 ($297,496)
Subtotal 6,235 $1,945,320 $4,402,745 ($2,457,425)
Elementary Schools
Ascarte 498 $312.00 $155,376 $342,644 ($187,268)
Cadwaller 353 $312.00 $110,136 $284,293 ($174,157)
Capistrano 551 $312.00 $171,912 $289,945 ($118,033)
Cedar Grove 702 $312.00 $219,024 $358,943 ($139,919)
Del Norte Heights
648 $312.00 $202,176 $289,362 ($87,186)
Desertaire 779 $312.00 $243,048 $312,246 ($69,198)
Dolphin Terrace 614 $312.00 $191,568 $319,469 ($127,901)
East Point 1,003 $312.00 $312,936 $369,214 ($56,278)
Eastwood Heights
648 $312.00 $202,176 $294,921 ($92,745)
Eastwood Knolls
771 $312.00 $240,552 $398,797 ($158,245)
Edgemere 952 $312.00 $297,024 $338,959 ($41,935)
Glen Cove 1,101 $312.00 $343,512 $421,576 ($78,064)
Hacienda Heights 600 $312.00 $187,200 $282,818 ($95,618)
Lancaster 790 $312.00 $246,480 $293,697 ($47,217)
Lebarron Park 918 $312.00 $286,416 $359,495 ($73,079)
Loma Terrace 946 $312.00 $295,152 $395,190 ($100,038)
Marian Manor 644 $312.00 $200,928 $321,168 ($120,240)
Mesa Vista 481 $312.00 $150,072 $295,275 ($145,203)
Mission Valley 821 $312.00 $256,152 $323,110 ($66,958)

North Loop 940 $312.00 $293,280 $368,537 ($75,257)
Parkland 780 $312.00 $243,360 $287,321 ($43,961)
Pasodale 1,033 $312.00 $322,296 $396,617 ($74,321)
Pebble Hills 1,058 $312.00 $330,096 $404,576 ($74,480)
Presa 452 $312.00 $141,024 $318,672 ($177,648)
Ramona 388 $312.00 $121,056 $294,530 ($173,474)
Sageland 527 $312.00 $164,424 $280,467 ($116,043)
Scotsdale 850 $312.00 $265,200 $366,810 ($101,610)
South Loop 449 $312.00 $140,088 $308,971 ($168,883)
Thomas Manor 772 $312.00 $240,864 $361,540 ($120,676)
Tierra Del Sol 807 $312.00 $251,784 $346,109 ($94,325)
Vista Hills 806 $312.00 $251,472 $312,309 ($60,837)
Ysleta 617 $312.00 $192,504 $310,353 ($117,849)
Ysleta Pre-K 362 $312.00 $112,944 $368,791 ($255,847)
Subtotal 23,661 $7,382,232 $11,016,725 ($3,634,493)
Grand Total 41,773 $13,033,176 $21,901,890 ($8,868,714)
Source: YISD Division of Instruction and Division of Finance Notes A) 1996-97 Per Capita Allocation Rate: $312.00; Unit of Allocation: Total ADA for each school B) Rio Bravo Middle School opened in September 1997. Expenditures represent start-up costs for campus administrators during the summer. According to district administrators, expenditures will not match the campus support allocation shown in Exhibit 1-12 because: actual expenditures include salary increases, including benefits, which are "post-allocation" add-ons in the budget development process; campuses are not required to budget the campus support as allocated.

A budget-based administrative staff allocation model, while equitably distributing financial resources for staff, does not provide for differences in student populations that may require specific types of school administrative expertise to support the school's instructional program, nor does it motivate schools to hire staff with additional years of experience or educational levels. For example, a school may be forced to allocate a disproportionate share of its $314 per ADA budget to fund an experienced principal or assistant principal to provide educational leadership for the school. As a result, the school may not be able to afford to hire the number of counselors necessary to help build students' self-esteem and raise expectations-prerequisites for student achievement. Hiring experienced or better-educated staff is simply more costly. Funding positions would allow the schools to hire the most qualified person for the job, whereas funding a given dollar amount per pupil may not end with the same results. An administrative staffing allocation model based on the ratio of student enrollment to full- time equivalent positions (FTE), by classification, is often used as a benchmark for providing the appropriate administrative staff to support a school's education program. This FTE-based model allows schools to allocate positions based on the appropriate student enrollment, yet have the flexibility to adjust the model based on unique characteristics of the student population. The Southern Association of Colleges and Schools (SACS) uses an FTE-based model to recommend minimum administrative staffing requirements for schools based on student enrollment (membership). For the 1997-98 school year, SACS has recommended minimum personnel requirements for elementary schools in its publication Policies, Principles, and Standards for Elementary Schools Accredited by the Commission on Elementary and Middle Schools and for middle schools in its Policies, Principles, and Standards for Middle Schools Accredited by the Commission on Elementary and Middle Schools. SACS' minimum standards for elementary schools are presented in Exhibit 1-13.
Exhibit 1-13 SACS Minimum Personnel Requirements for Elementary Schools
Membership
Principal, Headmaster, President
Professional Administrative or Supervisory Assistants
Library or Media Specialists
Library Aide or Clerk
Secretaries or Clerks
1 - 263 .5 0 .5 0 .5
264 - 439 1.0 0 1.0 0 1.0
440 - 659 1.0 0 1.0 .5 1.0
660 - 879 1.0 .5 1.0 1.0 1.5
880 - 1099 1.0 1.0 1.0 1.0 1.5
1100 - 1319 1.0 1.5 1.0 1.0 2.0
1320 + 1.0 2.0 1.0 1.0 2.0

Source: SACS Policies, Principals, and Standards for Elementary Schools Accredited by the Commission on Elementary and Middle Schools, 1997-98 School Year, Standard F:20 The minimum standards for middle schools are presented in Exhibit 1-14.
Exhibit 1-14 SACS Minimum Personnel Requirements for Middle Schools
Membership
Principal, Headmaster, President
Admin. or Supv. Assistants
Guidance Professionals
Library or Media Specialists
Library Aide or Clerk
Secretaries or Clerks
1 - 249 .5 0 .5 .5 0 .5
250 - 499 1.0 .5 .5 1.0 .5 1.0
500 - 749 1.0 1.0 1.0 1.0 1.0 1.0
750 - 999 1.0 1.0 2.0 1.0 1.0 1.5
1000 - 1249 1.0 1.5 2.5 1.0 1.0 2.0
1250 + 1.0 2.0 3.0 1.0 1.0 2.0
Source: SACS Policies, Principals, and Standards for Middle Schools Accredited by the Commission on Elementary and Middle Schools, 1997-98 School Year, Standard F:21 School districts develop and monitor FTE-based administrative staffing allocation models based on enrollment, and then calculate the associated budget allocation based on the number and classification of FTEs. Some school districts use these models with SBDM and allow site-based campus improvement committees and principals some degree of flexibility to modify the allocation model. For example, Spring ISD (SISD) develops FTE-based administrative staff allocations for each school and monitors those allocations each time it develops new enrollment figures. Although individual schools receive staffing based on the allocation model, school site-based teams and principals are allowed to change positions within the allocation model as long as they remain within their budget. Exhibit 1-15 illustrates SISD's staffing allocation for elementary schools.
Exhibit 1-15 Spring ISD Administrative Staffing Allocation
Elementary Schools
Position Student Enrollment Staff Allocation

Principal - 1.0
Assistant Principal 0 - 749 750 - 899 900+
.5 1.0 2.0
Counselor 0 - 749 750 - 999 1,000 - 1,249
1.0 1.5 2.0
Librarian - 1.0
Library Aide 440 - 659 660+
.5 1.0
Nurse - 1.0
Clerical Staff For each 250 students (or major fraction thereof) 1.0 (Minimum of 3.0)
Source: Spring ISD Personnel Department, Staffing Report, included in Spring ISD Performance Review Recommendation 10: Revise YISD's budget-based administrative staff allocation formulas to allow schools to allocate administrative staff based on the ratio of student enrollment to administrators where appropriate. YISD should use both the SACS minimum personnel requirements and best practices from Texas school districts to revise its budget-based administrative staff allocation models for elementary, middle, and high schools. The minimum FTE-based personnel requirements recommended by SACS may not meet YISD's needs; the district should use the SACS standards and SISD allocation model as starting points and determine how best to revise its formula. Revisions to the formula should consider the ratio of student enrollment to administrators rather than a per unit dollar allocation based on ADA. This will ensure appropriate administrative support for each school's unique student population and education
programs. IMPLEMENTATION STRATEGIES AND TIMELINE
1. The associate superintendent for Human Resources conducts a search for best practices among Texas school districts for administrative staffing allocation models.
June 1998
2. The associate superintendent for Human Resources, in conjunction with the associate superintendent for Curriculum and Instruction, reviews best practices models, SACS minimum personnel standards, and YISD's budget-based administrative staff allocation formula, and revises the formulas for YISD schools.
June - July 1998
3. The superintendent revises administrative staffing allocation formulas for YISD schools. August 1998
4. The superintendent implements revised administrative staffing allocation formulas for the 1999-2000 school year.
September 1998
FISCAL IMPACT While it is possible that revised FTE-based allocation formulas could result in reductions in campus administrators, the district is better served by reallocating any savings from such reductions back into the instructional programs of the district. It is not the intention of this recommendation to take money away from the campuses, but to make certain that funds are equitably distributed to campuses based on the needs of the children on those campuses. Therefore, no savings are estimated for this recommendation.

Chapter 1 DISTRICT ORGANIZATION AND MANAGEMENT E. Policies and Procedures FINDING YISD subscribes to the Texas Association of School Boards' policy service, which provides draft policies that respond to changes in the Texas Education Code or other rules established by the Commissioner of Education or the State Board of Education. However, TASB considers YISD to be a "non- localized district," meaning that YISD uses references and updates in TASB's Policy Reference Manual to create its own local policies, rather than accepting policies crafted by TASB's policy consultants. The associate superintendent for Human Resources coordinates all updates to the TASB policy manual. When these updates affect various functional areas within the district, the associate superintendent forwards the update to the appropriate cabinet member responsible for revising the affected local policies. This cabinet member then revises the appropriate section and forwards the update to the associate superintendent to be placed in the district's policy manual. Each update is logged using YISD's update numbering system (which is different from TASB's numbering system), date-stamped, and initialed by the associate superintendent's assistant when included in the policy manual. COMMENDATION YISD maintains a comprehensive policy manual, and has system in place for timely revision. FINDING The board has a conflict-of- interest policy, BBFA, Section F, that outlines the steps a trustee must follow when the district is making decisions about contracting with a company in which the Trustee or a person related to the Trustee has a substantial interest. However, apparent conflicts of interest on the part of board members remain a serious concern for the community at large. Texas' Local Government Code (TLGC) Section 171.004(a) requires local public officials with a substantial interest in a business entity or real property to file affidavits stating the nature and extent of the interest before a vote or decision on any matter concerning the business entity or real property, and to abstain from voting on the matter. A substantial interest in a business entity is defined in TLGC Section 171.002(a) as: (1) a person owning 10 percent or more of the voting stock or shares of the entity or 10 percent or more or $5,000 or more of the entity's fair market value; or (2) funds received by the person from the business entity exceed 10 percent of his or her gross income for the previous year.
Section 171.002 goes on to state that(1) a person has a substantial interest in real property if the interest is an equitable or legal ownership with a fair market value of $2,500 or more; and (2) a local public official is considered to have a substantial interest under this section if a person related to the official in the first degree by consanguinity or affinity, as determined under Chapter 573, Government Code. Section 171.003 states that a public official commits an offense if the he or she knowingly violates Section 171.004. Section 171.004 states that if a local public official has a substantial interest in a business entity or in real property, the official shall file, before a vote or decision on any matter involving the business entity or the real property, an affidavit stating the nature and extent of the interest and shall abstain from further participation in the matter if:
(1) in the case of a substantial interest in a business entity, the action on the matter will have a special economic effect on the business entity that is distinguishable from the effect on the public; or (2) in the case of a substantial interest in real property, it is reasonably feasible that an action on the matter will have special economic effect on the value of the property distinguishable from its effect on the public.
This affidavit must be filed with the official record-keeper of the governmental entity. If a local public official who is required to file such an affidavit does so, he or she is not required to abstain from further participation in the matter requiring the affidavit if a majority of the members of the governmental entity in question is composed of persons who are likewise required to file and who do file affidavits of similar interests on the same official action. TPSR reviewed board minutes for 1996-97 and found inconsistent application of the conflict of interest policy. Some board members abstained from votes and filed affidavits while others did not. Administrators told the review team that there was some confusion about when affidavits needed to be filed and when board members must abstain from votes. As of February 19, 1998, all board members had filed affidavits disclosing a substantial interest in a business entity. Recommendation 11: Enforce the board policy requiring board members who are business owners to file timely affidavits disclosing substantial interests in business entities. To ensure compliance with the Texas Local Government Code, YISD should require that appropriate affidavits are filed at the beginning of each year. When administrators or staff become aware of a potential conflict, the board member should be informed of board policy and the law in this regard, prior to the meeting in which a vote is taken.

IMPLEMENTATION STRATEGIES AND TIMELINE
1. The board president directs the superintendent to amend current policy and require board members with substantial business interests to file affidavits within the first month of each year.
June 1998
2. The superintendent drafts this policy for board review and comment. July 1998
3. The board reviews and approves the policy. August 1998
4. The board implements the policy and key administrators are made aware of the policy by the superintendent and instructed to notify him if a potential conflict exists prior to any vote by the board
September 1998
FISCAL IMPACT This recommendation can be implemented with existing resources.

Chapter 2 EDUCATIONAL SERVICE DELIVERY AND PERFORMANCE MEASURES This chapter examines eight key areas of YISD's educational service delivery and its related support services. These areas include:
A. Student Performance
B. Instructional Program Delivery
C. Gifted and Talented Education
D. Special Education
E. Career and Technology Education/Adult Education
F. Alternative Education
G. Compensatory Education/Bilingual Education
H. Guidance and Counseling
YISD selected eight Texas school districts as peer districts for comparison purposes: Austin, Corpus Christi, Dallas, El Paso, Fort Worth, Houston, San Antonio, and Socorro. With the exception of Socorro, the selected districts are among the state's largest. Socorro was added due to its geographic proximity and demographic similarity to YISD. The districts have several common characteristics. All are located in urban settings and each has a minority student enrollment in excess of 60 percent. In addition, the number of economically disadvantaged students exceeds 65 percent in all but three of the districts (Exhibit 2-1).
Exhibit 2-1 Demographic Characteristics
YISD versus Peer Districts 1996-97
Racial/Ethnic Percentage
District Student Enrollment
5 Year Enrollment Growth*
% African American
% Hispanic
% Anglo
% Other
% Economically Disadvantaged

Houston 209,375 6.4 34.3 51.8 11.1 2.9 65.0
Dallas 154,847 10.0 41.5 45.5 11.0 2.1 75.3
Austin 76,054 13.6 18.0 41.7 37.7 2.5 50.6
Fort Worth 75,813 7.0 33.2 38.4 25.9 2.5 58.7
El Paso 64,444 0.3 4.5 76.2 18.0 1.2 67.2
San Antonio 61,361 1.1 10.8 83.7 5.2 .3 91.1
Ysleta 47,366 (5.7) 2.6 85.4 11.1 .9 68.1
Corpus Christi 41,606 (0.6) 6.0 67.7 25.1 1.3 52.2
Socorro 21,098 40.2 1.2 89.0 9.3 .5 70.4
Region XIX 152,621 6.1 2.9 83.1 13.1 .9 70.6
State of Texas 3,828,975 10.7 14.3 37.4 45.6 2.7 48.1
Source: 1996-97 Academic Excellence Indicator System * Snapshot '96, Texas Education Agency YISD's vision statement says "All students will graduate from high school fully bilingual and prepared to enter a four-year college or university." This vision is known by most employees interviewed and is posted on signs and placards throughout the district. Improved student achievement, particularly as measured by performance on the Texas Assessment of Academic Skills (TAAS), is the focus of YISD's Division of Instruction. District scores on state-mandated tests have improved over the past several years, and although the district is the second-poorest in terms of wealth per student among the peer districts, its students consistently outperform those in the peer districts on TAAS. Exhibit 2-2 compares YISD with selected peer districts on wealth per pupil and student performance on TAAS during the 1996-97 school year. Appendix J compares YISD and peer districts' student performance for 1996-97 at each grade level. The district has made significant improvements in the area of student performance. In 1993, the district had seven schools rated as " low performing" by the Texas Education Agency. Based on its Spring 1997 TAAS results, YISD now has no low-performing schools, two exemplary schools, and 22 recognized schools.
Exhibit 2-2 District Property Wealth per Pupil and Percent of Students Passing the TAAS YISD Versus Peer Districts
1996-97 School Year
District Name
1996-97 Membership (Pupil)
1996-97 Wealth Per
Rank by Wealth
Percent of Students passing TAAS
Rank by Performance

Pupil
Houston ISD 209,375 $218,539 3 63.8% 6
Dallas ISD 154,847 $245,753 2 54.5% 8
Austin ISD 76,054 $312,152 1 65.5% 5
Fort Worth ISD 75,813 $145,971 4 57.0% 7
El Paso ISD 64,444 $122,471 6 65.6% 4
San Antonio ISD 61,361 $94,342 7 48.7% 9
Ysleta ISD 47,366 $81,571 8 73.4% 1
Corpus Christi ISD 41,606 $133,918 5 69.8% 2
Socorro ISD 21,098 $79,318 9 67.4% 3
Source: 1996-97 AEIS Report. CURRENT SITUATION A district report prepared in May 1997 shows the number of students served at the district's 56 regular campuses. (Exhibit 2-3). The total enrollment shown in the chart does not agree with the data shown in Exhibit 2-1 or 2-2 because of timing differences, but shows the campuses enrollment and grades served at that point in time.
Exhibit 2-3 YISD Enrollment by School and Grade
May 1997
Elementary EE PreK K 1 2 3 4 5 6 7 8 9 10 11 12 Total
Ascarate 73 77 69 79 76 77 62 513
Cadwallader 19 47 64 40 56 52 54 53 385
Capistrano 93 84 84 74 80 93 93 601
Cedar Grove 106 119 114 100 99 100 90 728
Chacon 134 94 77 73 58 436
Del Norte 122 106 88 97 81 93 86 673
Desertaire 97 102 114 116 128 121 129 807

Dolphin Terrace 85 76 83 102 84 92 110 632
East Point 149 142 146 145 149 160 157 1,048
Eastwood Heights 9 37 90 83 95 95 92 98 100 699
Eastwood Knolls 66 75 62 63 65 63 81 153 174 802
Edgemere 128 154 120 140 150 149 147 988
Glen Cove 22 30 145 172 161 151 155 178 163 1,177
Hacienda Heights
115 84 100 87 77 89 77 629
Lancaster 121 114 108 113 103 126 148 833
Le Barron Park
136 119 142 121 145 144 147 954
Loma Terrace 137 168 150 140 126 121 136 978
Marian Manor 102 73 99 98 100 99 104 675
Mesa Vista 17 77 71 74 85 69 63 58 514
Mission Valley 23 108 143 119 122 107 125 128 875
North Loop 149 156 130 137 135 132 129 968
Parkland 24 122 109 122 111 101 92 95 105 881
Pasodale 106 104 114 134 128 124 128 146 102 1,086
Pebble Hills 17 132 146 167 153 161 180 168 1,124
Prado PK Cntr 17 496 513
Presa 72 61 67 92 80 89 461
Ramona 16 53 70 56 57 62 40 58 412
Sageland 81 80 79 76 71 72 86 545
Scotsdale 26 125 101 137 130 120 117 142 898
South Loop 20 74 64 84 91 76 71 480

Thomas Manor 94 113 112 113 119 130 114 795
Tierra Del Sol 104 102 116 113 139 125 143 842
Vista Hills 8 124 111 119 110 115 134 130 851
Ysleta 89 100 81 99 81 86 111 647
Ysleta PK Cntr
787 787
Total Elem. 218 1,472 3,443 3,450 3,418 3,463 3,375 3,440 3,383 299 276 26,237
Middle EE PreK K 1 2 3 4 5 6 7 8 9 10 11 12 Total
Camino Real 155 284 282 721
Desert View 269 320 589
Eastwood 404 430 834
Hillcrest 318 295 613
Indian Ridge 366 362 728
Parkland 335 300 635
Ranchland Hills 240 197 437
Riverside 419 402 821
Valleyview 323 371 694
Ysleta 199 207 406
Total Middle
155 3,157 3,166 6,478
High EE PreK K 1 2 3 4 5 6 7 8 9 10 11 12 Total
Bel Air 730 461 352 366 1,909
Del Valle 548 517 357 344 1,766
Eastwood 771 512 498 329 2,110
Hanks 799 669 595 502 2,565
Parkland 314 307 197 174 992
Riverside 495 341 198 272 1,306
Ysleta 637 402 401 257 1,697

Total High 4,294 3,209 2,598 2,244 12,345
Alternative EE PreK K 1 2 3 4 5 6 7 8 9 10 11 12 Total
Acad Sci/Tech 3 27 15 19 18 82
Cesar Chavez Academy
3 9 17 116 33 15 15 208
Tejas School of Choice 2 18 22 32 17 22 12 125
Total Alternative
5 27 42 175 65 56 45 415
Dropout Recovery Ctr.
EE PreK K 1 2 3 4 5 6 7 8 9 10 11 12 Total
Highlander 4 17 20 13 54
New Directions
23 33 51 14 121
Jump Start 4 14 22 38 78
Hanks Academy 9 27 45 50 131
Phoenix 36 55 37 32 160
Plato 31 37 36 33 137
Accelerated Education 33 39 48 46 166
AST Nova Net Lab 34 36 46 40 156
T-Bird 9 18 4 3 34
RIP Cord 4 13 10 10 37
Total DRC 187 289 319 279 1,074
Homebound EE PreK K 1 2 3 4 5 6 7 8 9 10 11 12 Total
2 1 1 2 2 4 3 4 9 6 4 4 42 37
District EE PreK K 1 2 3 4 5 6 7 8 9 10 11 12 Total
220 1,472 3,443 3,450 3,419 3,464 3,377 3,442 3,547 3,486 3,488 4,665 3,569 2,977 2,572 46,591

Source: YISD Membership Report of May 22, 1997. YISD's total expenditures per pupil for instructional purposes in 1995-96 were higher than in all but two of its peer districts and slightly higher than the state average. YISD's percent of its instructional budget devoted to regular education was higher than any of its peer districts except Corpus Christi. As indicated in Exhibit 2-4, YISD's total costs per student in the 1996-97 school year were lowest of any peer district other than Austin. YISD's spending per student for instructional and instructional-related services were average among its peers; while YISD's expenditures for cocurricular activities were second-highest, it had one of the lowest costs per student for administration and transportation.
Exhibit 2-4 Costs Per Student
YISD and Peer Districts 1996-97
Function
San Antonio ISD
Houston ISD
Corpus Christi ISD
Fort Worth ISD
Dallas ISD
Socorro ISD
El Paso ISD
Ysleta ISD
Austin ISD
Peer Dist Avg.
State Avg.
Administration $582 $572 $601 $564 $515 $560 $596 $548 $536 $563 $554
Instructiona l Services
$2,895 $2,708 $2,664 $2,429 $2,737 $2,411 $2,512 $2,557 $2,482 $2,599 $2,644
Instruction Related $194 $138 $103 $181 $143 $124 $157 $132 $91 $140 $128
Pupil Services $251 $222 $204 $235 $194 $264 $209 $201 $155 $215 $196
Cocurricular Activities
$78 $35 $104 $72 $40 $119 $94 $104 $26 $74 $117
Transportation $85 $123 $94 $133 $24 $119 $117 $82 $173 $105 $130
Plant Maint. & Operation
$618 $628 $520 $669 $631 $623 $465 $522 $469 $571 $550
Community Services
$68 $10 $19 $23 $12 $23 $9 $12 $1 $19 $10
Total $4,772 $4,436 $4,309 $4,307 $4,298 $4,244 $4,159 $4,157 $3,934 $4,290 $4,329
Department Service
$176 $260 $289 $230 $244 $516 $335 $174 $544 $307 $363
Capital Outlay $110 $202 $95 $61 $135 $466 $262 $88 $247 $185 $181
Source: Texas Association of School Boards, Bench Marks, 1996-97. During the 1996-97 school year, YISD employed 2,988 teachers, 142 administrators, 427 support staff, 285

paraprofessionals, and 1,328 auxiliary personnel. Exhibit 2-5 and Exhibit 2-6 compare YISD's staffing characteristics with state averages for the 1996-97 school year.
Exhibit 2-5 Staffing
YISD Versus State Average 1996-97 School Year
Percent
Staff Category YISD State
Teachers 57.8 56.4
Professional Support 7.9 7.3
School Administration 2.3 2.7
Central Administration 0.7 1.0
Educational Aides 6.0 9.7
Auxiliary Staff 25.3 23.0
Turnover Rate for Texas 12.6 12.6
Minority Staff 65.8 33.9
African American 2.8 8.2
Hispanic 54.2 15.5
Anglo 42.2 75.6
Other 0.8 0.8
Teachers with No Degree 1.1 0.9
Teachers with Bachelors Degree Only 83.2 72.1
Teachers with Masters Degree 15.5 26.6
Teachers with Doctorate Degree 0.2 0.4
Beginning Teachers 9.9 6.6
1-5 Years Experience 25.6 26.8
6-10 Years Experience 16.4 17.4
11-20 Years Experience 30.2 29.6
More than 20 Years Experience 17.8 19.5
Source: 1996-97 AEIS Report.

Exhibit 2-6 Staff Information YISD and State
1996-97
Staff Category YISD State
Average Years of Experience, Teachers 11.1 11.7
Average Years in District 9.2 8.0
Average Salary (Excluding Supplements)
Beginning Teachers $23,800 $24,079
1-5 Years Experience 25,672 25,848
6-10 Years Experience 29,079 30,044
11-20 Years Experience 35,565 35,863
Over 20 Years Experience 41,832 41,225
Average Salary (Excluding Supplements)
Teachers $31,639 $32,426
Professiona l Support 38,753 39,697
School Administration 54,864 50,713
Central Administration 57,390 60,278
Source: 1996-97 AEIS Report.

Chapter 2 EDUCATIONAL SERVICE DELIVERY AND PERFORMANCE MEASURES
A. Student Performance The Texas Assessment of Academic Skills (TAAS) is a test used to measure student performance on state-mandated "essential elements" in the public school curriculum. The test is administered in reading and mathematics in grades 3-8 and 10; writing in grades 4, 8, and 10; and science and social studies in grade 8. A Spanish version of the TAAS is available for reading and mathematics in grades 3 and 4. In addition, end-of-course TAAS examinations are administered for Algebra I in grades 7-12 and for Biology I in grades 8-12. The Texas Education Agency's (TEA's) 1997 accountability standards for schools include four ratings: exemplary, recognized, acceptable, and low performing. For a school to receive an exemplary rating, at least 90 percent of all students as well as 90 percent of all African American, Hispanic, White, and economically disadvantaged students must pass the TAAS reading, writing, and mathematics subtests. For ratings of recognized, acceptable, and low performing, the 1997 passing rate standards established for each of the subtests were 75 percent, 35 percent, or less than 35 percent, respectively. TEA provides information on TAAS results as well as othe r demographic, staffing, and financial data to school districts and the public on an annual basis through the Academic Excellence Indicator System (AEIS) report. TSPR has used the AEIS report to compare the performance of YISD students with those in the peer districts, the state as a whole, and the Region XIX Education Service Center. The latest AEIS data available is for the 1996-97 school year. FINDING YISD student performance as measured by TAAS passing rates improved between 1996 and 1997 on all subtests except reading at grade 7. YISD students had a higher passing rate on all subtests than did students in the state on reading, math, and writing in grade 10. The passing rate of YISD students exceeded those in Region XIX on all subtests. The percentage of students in the district passing all tests increased in all grades except grade 8, which experienced a slight decline in passing rate from 52.0 percent to 51.8 percent (Exhibit 2-7).
Exhibit 2-7 Percentage of Students Passing TAAS
In YISD, Region, and State 1996-97
READING 96-97
MATH 96-97
WRITING 96-97
ALL TESTS 96-97

Grade 3 District 81.0 82.1 82.1 82.5 73.3 74.3
Region XIX 79.6 79.3 76.3 80.8 68.6 71.4
State 80.5 81.5 76.7 81.7 70.4 74.2
Grade 4 District 76.0 83.1 79.3 87.4 86.6 89.1 65.4 74.3
Region XIX 75.1 80.3 75.2 81.5 84.8 85.7 61.7 68.7
State 78.3 82.5 78.5 82.6 86.3 87.1 67.2 72.0
Grade 5 District 81.9 85.8 80.4 90.0 72.7 81.4
Region XIX 79.9 81.0 75.1 82.8 68.5 73.9
State 83.0 84.8 79.0 86.2 73.5 79.2
Grade 6 District 78.9 88.5 82.3 89.1 72.0 83.3
Region XIX 73.8 80.3 74.0 77.6 64.3 71.4
State 78.4 84.6 77.8 81.8 70.1 76.8
Grade 7 District 87.6 87.3 73.7 84.9 70.5 79.5
Region XIX 80.9 81.2 66.0 76.1 62.4 70.5
State 82.6 84.5 71.5 79.7 68.0 75.1
Grade 8 District 80.4 85.6 69.8 76.5 79.2 83.5 52.0 51.8
Region XIX 95.8 81.5 64.1 71.4 73.9 77.1 47.3 49.5
State 98.3 83.9 69.0 76.3 76.9 80.7 53.7 57.3
Grade 10 District 75.5 82.3 53.2 60.5 82.6 87.4 48.1 56.7
Region XIX 75.6 78.9 59.0 59.4 81.6 82.2 52.1 54.2
State 81.9 86.1 66.5 72.6 86.0 88.5 60.7 67.8
ALL GRADES District
80.5 85.2 73.7 80.8 82.5 86.3 65.4 73.4
Region XIX 77.2 80.4 69.5 75.1 79.7 81.4 61.2 66.9
State 80.4 84.0 74.2 80.1 82.9 85.3 67.1 73.2
Source: 1996-97 AEIS Report.
When compared by test taken and by race/ethnicity with students in the peer districts, the TAAS

passing rates of YISD students were the first, second, or third highest out of the nine districts except for White students (Exhibit 2-8 and Exhibit 2-9).
Exhibit 2-8 Percentage of Students Passing All TAAS
Tests Taken in All Grades Combined Spring 1997
District
All Tests Taken Reading Writing Math
African American Hispanic White Other
Economically Disadvantaged
Ysleta 65.4 80.3 82.5 73.7 61.4 63.4 78.8 75.4 61.8
Corpus Christi 63.5 79.1 83.9 70.2 48.9 57.3 81.1 85.4 53.7
Socorro 62.6 78.4 81.9 71.2 56.6 60.5 78.5 70.6 57.9
El Paso 60.0 76.9 79.3 67.4 52.1 54.2 79.4 74.1 50.1
Austin 58.8 74.5 77.8 64.8 35.2 43.4 79.5 74.6 38.5
Houston 57.3 73.1 74.5 65.6 53.2 50.2 86.2 80.9 51.6
Fort Worth
51.6 68.2 77.0 59.3 37.7 42.6 76.9 68.7 39.9
Dallas 50.8 66.7 73.1 59.8 42.5 53.4 73.8 68.8 45.7
San Antonio
40.9 59.4 68.8 49.9 31.9 40.9 60.2 42.0 39.1
Region XIX 61.2 77.2 79.7 69.5 55.7 57.7 78.8 74.0 54.9
State of Texas 69.1 80.4 82.9 74.2 46.9 54.2 79.8 81.5 52.5
Source: 1996-97 AEIS Report.
Exhibit 2-9 Rank of Percentage of Students Passing
All TAAS Tests Taken in All Grades Combined Spring 1997

District
All Tests Taken Reading Writing Math
African American Hispanic White Other
Economically Disadvantaged
Ysleta 1 1 2 1 1 1 5 3 1
Corpus Christi 2 2 1 3 5 3 2 1
Socorro 3 3 3 2 2 2 6 6 2
El Paso 4 4 4 4 4 4 4 5 5
Houston 6 6 6 5 3 6 1 2 4
Austin 5 5 5 6 8 7 3 4 9
Fort Worth 7 7 8 8 7 8 7 8 7
Dallas 8 8 7 7 6 5 8 7 6
San Antonio
9 9 9 9 9 9 9 9 8
Source: 1996-97 AEIS Report. Data from 1994 through 1997 indicates that YISD students continue to improve their mastery of TAAS as they progress through the educational system (Exhibit 2-10). The percent of students passing all sections of the TAAS increased from 75 to 89 in reading and 62 to 89 in math between the third and sixth grades.
Exhibit 2-10 Percentage of Students in Same Class Passing TAAS
1994-97
Reading Math
School Grade 3 1994
Grade 6 1997
Gain (Loss)
Grade 3 1994
Grade 6 1997
Gain (Loss)
Ascarate 66 88 22 59 93 34
Cadwallader 54 87 33 38 89 51
Capistrano 52 88 36 52 85 33
Cedar Grove 73 81 8 54 86 32

Del Norte 90 93 3 85 92 7
Desertaire 93 85 (8) 91 84 (7)
Dolphin Terrace 67 84 17 53 88 35
East Point 82 96 14 65 95 30
Eastwood Heights 93 90 (3) 81 96 15
Eastwood Knolls 87 87 0 91 89 (2)
Edgemere 88 92 4 80 96 16
Glen Cove 67 92 25 54 90 36
Hacienda Heights 47 88 41 29 90 61
Lancaster 63 90 27 50 90 40
Le Barron Park 60 87 27 36 90 54
Loma Terrace 83 95 12 82 93 11
Marian Manor 57 92 35 44 92 48
Mesa Vista 76 98 22 36 97 61
Mission Valley 67 85 18 48 90 42
North Loop 52 65 13 42 74 32
Parkland 78 89 11 71 91 20
Pasodale 62 85 23 51 83 32
Pebble Hills 80 93 13 59 85 26
Ramona 77 85 8 59 95 36
Sageland 70 90 20 66 87 21
Scotsdale 87 97 10 77 92 15
Thomas Manor 80 95 15 52 89 37
Tierra Del Sol 80 94 14 75 88 13
Vista Hills 88 87 (1) 78 88 10
Ysleta 81 69 (12) 67 76 8
District 75 89 14 62 89 27

Source: 1997 TAAS Performance Results and Ratings, YISD. Division of Instruction (Updated) COMMENDATION YISD's students outperformed all peers, the state, and region on the state-level instructional targets established through TAAS. FINDING Just after becoming superintendent in early 1993, Anthony Trujillo said that he wanted students to be able to go to any school in the district as long as space was available for them. This was before the state implemented its accountability system, and thus before the "low-performance" rating became an issue. But Mr. Trujillo knew the condition of the district's schools and felt that an open enrollment policy could prompt healthy competition among campuses, while eliminating the need for parents to claim residency with relatives to place their children in the schools they preferred. Under the open enrollment policy, schools that did not offer the services or assistance that students needed soon saw students exercising their option to move. This competition among individual schools, along with the superintendent's intense emphasis on student performance, had dramatic results. In 1993, the first year of the state's accountability system, YISD had seven low-performing campuses. The district did not keep comprehensive records concerning internal transfers at that time, but school officials estimate that nearly 3,000 students exercised their right to switch schools in 1993. In 1993-94, YISD had no low-performing schools and one school rated as "recognized." By 1994-95, eight schools were recognized; in 1995-96, 15 schools were recognized. In 1996-97, two schools were rated exemplary and 22 were recognized. In the last three years, not a single internal transfer request was based solely on a school's performance ratings, an understandable fact considering that nearly every school in the district is showing dramatic improvement. In 1996, faced with a declining student enrollment similar to that experienced by many other urban districts, YISD decided to capitalize on its strong student performance and made a bold move to open its doors to students from outside the district if space is available. In 1996-97, nearly 1,250 students transferred into YISD from the El Paso, Socorro, Canutillo, Clint, and Fabens districts. In 1997-98, the number of outside students applying to enter YISD rose to nearly 2,000. YISD expects transfer students and their parents to demonstrate a commitment to education. YISD's enrollment paperwork sets standards for students concerning conduct, attendance, and grades, and enrollment can be revoked if these standards are not met. The district also specifically requires a parent or guardian to participate in all parental activities established by the district or the individual campus. And YISD does not provide transportation for any transfer students; instead, their parents are expected to transport their own children, thus providing another sign of their commitment to the district's program. Opponents of the district's transfer policy claim that YISD's taxpayers are being required to pay for

educating other districts' children. What they fail to understand is that their taxes contribute only about 26 percent of the district's total revenues. Another 69 percent comes from the state and 5 percent from the federal government. YISD has the infrastructure, including buildings, administrators, and computer systems, to educate as many as 3,000 students more than its current enrollment. These infrastructure items represent fixed costs that do not rise with each new student who enters the district. YISD's instructional and instruction-related expenditures, which can rise with the number of students served, are more than covered by the state's educational funding, which is awarded on a per-student basis whether or not the student is from inside or outside the district. When students move from one district to another, the state's aid moves with them. In fact, for each new student entering the district, the state's contribution covers instructional and instruction-related expenditures for the child and also contributes a small percentage toward the district's fixed costs. COMMENDATION YISD has instituted an open enrollment program for students inside and outside the district that has reversed a trend of declining enrollment and provided for healthy competition among the district's campuses and with other area school districts.

Chapter 2 EDUCATIONAL SERVICE DELIVERY AND PERFORMANCE MEASURES
B. Instructional Program Delivery
Effective instructional program delivery requires a sound instructional management system. Administrators should be held accountable for ensuring that the resources allocated to instructional programs produce continual improvements in student performance. Planning and evaluation systems must be developed so that instructional program success can be monitored. Organization and Management Well-written board policies regarding curriculum are critical to establishing commonly understood standards for the district curriculum. Such standards ensure consistency in the curriculum across the district and provide a systematic basis for decision-making in all instructional settings. Finally, curricular policies must be clearly and thoroughly communicated to district staff and the community. Strong curricular policies include statements that provide clear direction for the actions of staff members, set a direction for the use of district resources, and establish decision-making processes and structures. Such policies, moreover, should be responsive to community goals. FINDING In YISD, the one commonly understood standard that all students, teachers, and administrators work from is the TAAS. A strong vision and direction comes from the superintendent, and few current employees of the district fail to understand his expectations. TSPR examined the instruction-related policies in YISD's policy manual (Exhibit 2-11) to determine if documentation of the district's approach was sufficient to ensure the continuity of the district's success, if and when the current district leadership changes.
Exhibit 2-11 YISD Instruction-Related Policies
Policy Policy Title
AE Basic District Foundations: Educational Philosophy
BJA Local School Governance: Qualifications and Duties of the Superintendent
CEA Budget Planning

CEB Determination of Budget Priorities
CK Safety Program
DNA Personnel: Evaluation of Staff
DP Personnel: Personnel Positions
EA Instructional Goals and Objectives
EB School Year
EC School Day
ED Organization of Instruction
EEJA Credit by Examination
EEJB Correspondence Courses
EEJD Academic Achievement
EEJE Individualized Learning: Credit by Examination Without Prior Instruction
EFA Instructional Materials Selection and Adoption
EFAA Textbook Selection and Adoption
EGA Curriculum Adoption
EGD Guides and Course Outlines
EHA Basic Instructional Program
EHBA Special Education
EHBB Gifted Students
EHBC Out-of-School Youth
EHBD Remedial Instruction
EHBE Bilingual and ESOL Instruction
EHBI Adult Education
EHBL Interscholastic Athletics
EHBM Computer Education
EHBN School Volunteers
EHBO Chapter 1 Parental Involvement
EHDA Summer School

EHDC Honors Program
EHDG Extracurricular Programs and Activities, K-12
EIA Grading Systems
EIE Student Promotion and Retention, PreK-12
EIED Graduation
EJ Guidance Program, Grades PreK-12
EL Instructional Communication Committee
ELA Site-Based Decision Making
ELB Districtwide Educational Improvement Council
EMC Graduation Exercises
Source: YISD Policy Manual. In all, YISD's policies do not provide the basis for the continuation of quality curricular management in the future. Exhibit 2-12 provides the review team's assessment of district curricular policies with respect to criteria developed by Curriculum Management Audit Center, Inc.
Exhibit 2-12 Assessment of YISD Policies
Related to Effective Curricular Management
Criterion Assessment
1. Aligned curriculum Criterion not met. Although references to the curriculum exist in district policy, no requirement that the written, taught, and tested curriculum be aligned exists.
2. Board adoption of the curriculum
Criterion met. Policy EGA requires that the curriculum be adopted when mandated by the State Board of Education, the Texas Education Agency, the state Legislature, or the local board of trustees.
3. Accountability for curriculum management through specific roles and responsibilities
Criterion not met. Board policies do not clearly assign responsibility for management of the curriculum.

4. Systemwide long-range planning Criterion not met. References to planning exist, but policies do not establish any specific requirements for long-range planning.
5. Written curriculum for all areas
Criterion met. Policy EGD states that "curriculum guides for each grade level, Pre-kindergarten through grade 6, and each course, grades seven through twelve, shall be supplied to every teacher and principal."
6. Periodic review of the curriculum
Criterion met only marginally. Regulation EGD-R provides for the periodic review and revision of curriculum guides "to reflect...changes in the curriculum and priorities established by the District." Board policy EGD assigns responsibility for the revision of course outlines and curriculum guides to the Division of Curriculum and Instruction, but does not specifically require any review of the curriculum.
7. Textbook/resource adoption by the board of trustees
Criterion met only marginally. Policy EFA outlines the Board of Trustees' legal responsibility for the purchase of library materials, but does not refer to textbook adoption. Policy EFAA also fails to address this topic, although its supporting regulations make textbook adoption a responsibility of the board.
8. Predictability of written curriculum from one level to another
Criterion not met. YISD has no policies concerning this criterion.
9. Curriculum linked from grade to grade within a school and between schools and from school to school within the system
Criterion not met. YISD has no policies concerning this criterion.
10. Staff training in the delivery of instruction
Criterion not met. District policies and regulations address in-service training and staff development but none refer specifically to training in curriculum delivery.
11. Delivery of curriculum
Criterion met. Policy EHA states that "Each school will implement the provisions of this policy in a manner which will enable all students to participate actively and successfully in both a foundation curriculum and an enrichment curriculum."
12. Monitoring the delivery of curriculum
Criterion not met. Policy DP requires each principal to regularly consult with the school- level committee in the supervision of the school educational program. However, no specific requirement addresses monitoring curriculum delivery.
13. Equitable access to the curriculum
Criterion met. Policy AE states that "accessibility to educational programs, services, and activities should be provided on an equitable basis regardless of a student's school of attendance."

14. Program and student assessment plan
Criterion partially met. Policy EIA and Regulation EIA-R provide for a student assessment plan but do not address program assessment.
15. Use of assessment data to determine program and curriculum effectiveness
Criterion met only marginally. Board policy does not address the use of assessment data, but Regulation EL-R requires that the district improvement plan provide for "measurable district performance objectives...and other measures of student performance that may be identified..." In addition, school improvement plans must include an assessment of the academic achievement of each student.
16. Reports to the board of trustees about program effectiveness Criterion not met. YISD has no policies concerning this criterion.
17. Program-centered budget Criterion met. Policy CEA states that "Budget planning shall be an integral part of overall program planning so that the budget may effectively address programs and priorities of the District."
18. Resources tied to curriculum priorities
Criterion not met. Policy CEA refers to district priorities in terms of budget and program planning, but not resource allocation.
19. An environment to support curriculum delivery Criterion not met. YISD has no policies concerning this criterion.
20. Data-driven decisions for the purpose of increasing student learning
Criterion met only marginally. Policy ELB implies, but does not explicitly state, that academic excellence indicators and "...other appropriate performance measures..." will be used to increase student performance.
Source: Empirical Management Services. A clear set of board policies are needed to establish, document, and preserve the operational framework for effective management. Recommendation 12: Develop and adopt a comprehensive set of board policies to document and direct curriculum management and ensure quality control now and in the future. IMPLEMENTATION STRATEGIES AND TIMELINE
1. The associate superintendent of Instruction contacts the Policy Services of the Texas Association of School Boards and other school districts to request sample policies related to curriculum management.
June 1998
2. The associate superintendent of Instruction directs staff members to review these policies July - October

and modify useful examples for YISD. 1998
3. The associate superintendent of Instruction submits proposed policies on curriculum management to the superintendent, who approves them for submission to the Board of Trustees.
November 1998
4. The board of trustees reviews the policies and considers their adoption as required by board policy.
December 1998
FISCAL IMPACT An external consultant to assist with policy review and development will require three days in the district plus five additional days for review at $750 per day ($750 x 8 = $6,000). In-district expenses are calculated at $200 per day ($200 x 3 = $600). Expenses related to copying, faxing, telephone calls, are estimated at $500. Staff-associated costs can be handled with available resources.
Recommendation 1998-99 1999-2000
2000-01
2001-02
2002-03
Develop and adopt board policies to document and direct curriculum management. ($7,100) 0 0 0 0
FINDING A functional organizational structure allocates personnel and other resources in a manner that will most effectively and efficiently support the mission of the organization. In a school district, a functional organizational structure should provide a blueprint for how resources can be most effectively focused as well as how direction can be provided in support of the district's curricular efforts. In recent years, YISD has made significant efforts to decentralize its central office functions and reduce the number of positions reporting to senior-level administrators. This increased the amount of financial resources available to individual campuses and the level of program accountability. However, the present district organization of 13 offices or departments that report to the associate superintendent of Instruction (Exhibit 2-13) does not appear to support the educational service delivery as effectively as it might.
Exhibit 2-13 YISD Division of Instruction Organization
To obtain a copy of this exhibit, please contact the Texas Performance Review at 512/475-0332, or
via e-mail at [email protected].

Source: YISD Division of Instruction. For example, YISD's personnel training functions are shared by several central office departments and divisions as well as the schools. Although much of the in-service training is most appropriately left to individual schools, most planning, coordination, and support functions related to training could be centralized to maximize the district's efficiency. Not only could the grouping of programs be more effective, but the associate superintendent's span of control is excessive. It is difficult to effectively manage and provide oversight and assistance to 13 offices or departments simultaneously. Recommendation 13: Reorganize the Division of Instruction to group offices according to their major functions. This will provide for more effective ongoing interaction between and among divisional components and reduce the number of direct reports to the associate superintendent of Instruction. TSPR's proposed organizational structure for YISD is illustrated in Exhibit 2-14.
Exhibit 2-14 YISD Proposed Organizational Structure
Division of Instructional Support and Operations

Source: Review Team IMPLEMENTATION STRATEGIES AND TIMELINE

1. The associate superintendent for Instruction announces a reorganization of the Division of Instruction to be effective at the end of the 1998-99 school year. July 1998
2. The superintendent approves and recommends the reorganization to the Board of Trustees. August 1998
3. The associate superintendent for Instruction initiates the revision of all job descriptions as needed.
September - October 1998
4. The associate superintendent meets with staff to discuss new or modified responsibilities.
November 1998 - May 1999
5. The associate superintendent implements the reorganization. July 1999
FISCAL IMPACT This recommendation can be accomplished with available resources. Curriculum FINDING YISD's Division of Instruction was restructured five years ago. Departments of elementary and secondary education were dissolved into four assessment and support teams (ASTs.) In 1995, the four teams were reduced to two eight-member teams, each serving about half of the district's schools. The stated purpose of the reorganization was to "assist schools in curriculum development and assessing instructional student needs, support site-based decision-making initiatives, and to implement the accountability framework of the district," namely the Accountability Assessment and Support System. YISD's Accountability Assessment and Support System is used to ensure that accountability occurs in the district. Exclusive of the director, each member of an AST is assigned as a liaison to three or four schools, usually within the same feeder pattern, or geographic grouping, of high, middle, and elementary schools. YISD's five-year goal is for every school to receive a TEA "exemplary" rating, achieved when at least 90 percent of all students pass all subject areas of the TAAS. The Accountability Assessment and Support System supports individual schools' efforts toward this goal. The level of support provided to each school depends on a "priority" designation assigned by YISD, which is based on TAAS passing rates. Each district school develops an annual campus action plan (CAP) based on results from the Academic Excellence Indicator System, with input and monitoring from the ASTs. Exhibit 2-15 lists 1995 and 1997 TAAS passing rates for all students at each YISD school and the increase or decrease in passing rates between the two years.

Exhibit 2-15 Percentage of Students Passing All Sections of TAAS by School
1995/1997
Reading Math Writing
High Schools 1995 1997 Gain/ Loss 1995 1997 Gain/ Loss 1995 1997 Gain/ Loss
Bel Air 54.0 72.5 18.5 26.4 58.2 31.8 69.1 81.0 11.9
Del Valle 67.2 78.2 11.0 40.9 65.7 24.8 81.9 88.5 6.6
Eastwood 79.6 89.5 9.9 55.3 60.8 5.5 88.1 92.3 4.2
Hanks 85.2 93.0 7.8 60.9 71.0 10.1 92.6 94.6 2.0
Parkland 64.9 78.7 13.8 42.7 55.5 12.8 78.1 89.2 11.1
Riverside 62.9 77.3 14.4 50.6 57.8 7.2 77.3 83.0 5.7
Ysleta 62.0 85.4 23.4 38.6 66.0 27.4 76.2 86.8 10.6
Cesar Chavez 56.3 71.0 14.7 33.3 44.1 10.8 63.2 77.4 14.2
Tejas 50.0 48.9 (1.1) 10.0 39.5 29.5 75.0 66.7 (8.3)
Middle Schools
Camino Real 75.2 86.9 11.7 52.1 82.7 30.6 76.7 81.7 5.0
Desert View 87.3 93.5 6.2 66.6 86.1 19.5 77.4 88.2 10.8
Eastwood 84.6 91.0 6.4 64.2 84.9 20.7 76.3 88.5 12.2
Hillcrest 69.3 80.3 11.0 48.8 82.8 34.0 74.4 84.5 10.1
Indian Ridge 79.1 89.6 10.5 50.6 74.5 23.9 71.1 84.6 13.5
Parkland 75.4 85.9 10.5 55.4 77.3 21.9 68.1 77.8 9.7
Ranchland Hills 64.1 81.4 17.3 38.8 77.2 38.4 61.8 74.0 12.2
Riverside 77.9 84.3 6.4 46.0 79.5 33.5 79.4 77.7 (1.7)
Valley View 75.7 79.8 4.1 44.8 78.2 33.4 62.3 79.0 16.7
Ysleta 63.5 82.4 18.9 35.9 80.3 44.4 57.3 81.6 24.3
Chacon 84.8 90.9 90.9 92.9 92.9
Elementary Schools

Ascarate 88.8 89.9 1.1 78.9 92.2 13.3 87.5 89.7 2.2
Cadwallader 82.1 83.5 1.4 75.0 89.7 14.7 82.1 100.0 17.9
Capistrano 66.8 85.4 18.6 61.7 87.0 25.3 91.0 96.9 5.9
Cedar Grove 75.5 77.1 1.6 62.9 82.7 19.8 94.7 87.0 (7.7)
Del Norte Hts. 81.1 88.9 7.8 81.8 90.9 9.1 98.1 96.2 (1.9)
Desertaire 91.4 82.7 (8.7) 74.8 78.0 3.2 88.2 87.7 (0.5)
Dolphin Terrace 84.4 83.9 (0.5) 73.8 91.3 17.5 89.4 85.1 (4.3)
East Point 86.6 84.8 (1.8) 73.3 91.2 17.9 98.0 87.5 (10.5)
Eastwood Hts. 85.5 85.8 0.3 76.6 90.7 14.1 87.1 89.2 2.1
Eastwood Knolls 91.0 91.4 0.4 78.4 88.0 9.6 83.2 94.9 11.7
Edgemere 88.1 89.0 0.9 80.9 93.5 12.6 93.8 96.5 2.7
Glen Cove 76.1 87.7 11.6 65.6 89.4 23.8 77.6 91.1 13.5
Hacienda Hts. 73.5 81.4 7.9 62.4 89.6 27.2 78.8 79.5 0.7
Lancaster 76.9 86.9 10.0 68.7 89.7 21.0 88.1 85.0 (3.1)
Le Barron 78.8 84.4 5.6 70.4 87.2 16.8 81.8 91.9 10.1
Loma 84.3 91.5 7.2 75.7 96.9 21.2 89.7 92.7 3.0
Marian Manor 73.7 69.2 (4.5) 62.7 86.7 24.0 90.4 78.8 (11.6)
Mesa Vista 84.2 90.8 6.6 75.6 89.4 13.8 83.8 95.5 11.7
Mission Valley 70.6 81.6 11.0 65.7 88.7 23.0 84.3 86.3 2.0
North Loop 55.8 67.4 11.6 45.1 78.4 33.3 66.1 72.7 6.6
Parkland 68.8 79.7 10.9 52.7 82.3 29.6 74.0 85.0 11.0
Pasodale 70.9 85.0 14.1 52.6 84.8 32.2 74.2 83.8 9.6
Pebble Hills 80.3 84.4 4.1 64.6 75.4 10.8 76.4 87.4 11.0
Presa 76.8 77.0 0.2 63.5 85.8 22.3 87.8 80.6 (7.2)
Ramona 81.4 86.1 4.7 68.9 91.1 22.2 81.8 92.6 10.8
Sageland 74.9 83.4 8.5 54.0 91.5 37.5 82.6 94.6 12.0
Scotsdale 88.3 94.7 6.4 79.6 95.3 15.7 88.4 100.0 11.6
South Loop 71.9 81.6 9.7 73.6 77.6 4.0 85.4 81.0 (4.4)

Thomas Manor 74.6 88.7 14.1 57.1 91.8 34.7 81.0 89.0 8.0
Tierra Del Sol 83.4 90.8 7.4 75.1 88.0 12.9 91.4 92.7 1.3
Vista Hills 82.8 86.0 3.2 77.8 82.4 4.6 89.0 85.1 (3.9)
Ysleta 70.1 71.0 0.9 58.6 77.8 19.2 81.6 66.7 (14.9)
Source: AEIS COMMENDATION YISD's assessment and support teams have been effective in supporting campus efforts to improve student performance. FINDING YISD's percentage of seniors taking the Scholastic Aptitude Test (SAT) has risen from 27 percent in 1978 to 53.4 percent in 1997. Over the same period, seniors' average score on the verbal portion of the SAT has fallen from 460 to 432, while the state average fell from 504 to 494 and the national average decreased from 508 to 505. Exhibit 2-16 provides data on SAT scores for YISD high schools and compares them to state and national averages. Peer group comparisons are provided in Exhibit 2-17.
Exhibit 2-16 SAT Score Distributions
of YISD High Schools 1996-97 School Year
School Verbal Math Total Tests Taken
Bel Air 408 429 837 123
Del Valle 404 424 828 192
Eastwood 463 465 928 244
Hanks 469 475 944 366
Parkland 432 417 849 101
Riverside 399 419 818 127
Ysleta 402 413 815 193
Cesar Chavez 310 333 643 10
Tejas * * * 2

AST 375 381 756 15
District 432 441 873 1,373
State 494 501 995 94,034
Nation 505 511 1,016 1,127,027
Source: SAT I Results YISD Office of Research, Testing, and Evaluation. *No data available (fewer than five test -takers)
Exhibit 2-17 SAT in Peer Districts' Scores YISD, State, and Region XIX
District Percent Tested Percent at or above 1000 SAT Average Score
San Antonio 69.1 4.3 710
Ysleta 65.9 8.2 776
Corpus Christi 64.6 17.2 876
Austin 63.6 26.7 946
Ft. Worth 60.9 15.6 850
Houston 59.5 14.7 839
El Paso 57.3 14.2 855
Dallas 53.4 8.4 768
Socorro 50.8 5.8 788
Region XIX 59.1 10.0 809
State of Texas 64.8 18.0 891
Maximum 100.0 100.0 1600
Source: YISD Office of Research, Testing, and Evaluation. YISD has initiated the Preliminary Scholastic Aptitude Test/Scholastic Aptitude Test (PSAT/SAT) Program Initiative, which aims "to have all secondary students take college entrance exams before graduation" by waiving or discontinuing test fees for both the PSAT and SAT. Included in the initiative are programs for test-taking mini-camps for students and sessions for training teachers and for involving parents in the process of preparing students for college admission with peers on other campuses.

COMMENDATION YISD has a program initiative designed to help students succeed on the Scholastic Aptitude Test. FINDING Interviews with central office and school administrators and teachers revealed a high degree of satisfaction with the district's accountability, assessment, and support systems. AST members have been responsive to their schools' needs and have provided them with an appropriate level of support. Teachers at individual schools have numerous opportunities to discuss program content and to meet for planning purposes. TSPR found, however, that YISD teachers have relatively few opportunities to interact on a districtwide basis with peers on other campuses. Recommendation 14: Create regular opportunities to share information by scheduling meetings for teachers from across the district for the purpose of discussing curricular ideas and initiatives. IMPLEMENTATION STRATEGIES AND TIMELINE
1. The associate superintendent of Instruction develops and recommends to the superintendent a plan that would allow teachers time off for time spent in after-hours district meetings.
June - October 1998
2. The superintendent and Board of Trustees approve the plan for incorporation into the 1999-2000 school calendar.
November 1998 - January 1999
3. The executive directors for Assessment and Support, with input from administrators, teachers, and support staff, plan the equivalent of two days of meeting time dedicated to the sharing of information by teachers from across the district.
February - May 1999
4. The assessment and support teams coordinate these meetings. September 1999 - May 2000
5. The coordinator of Research, Testing, and Evaluation evaluates the meetings for relevancy
Ongoing
6. The executive directors for Assessment and Support modify the meetings as needed, based on the coordinator's evaluation.
Ongoing
FISCAL IMPACT The time required for the sharing of curricula ideas and initiatives can be incorporated into the
district's staff development calendar. FINDING YISD board policy requires that curriculum guides be supplied to every teacher and principal. Although YISD has a number of guides designed for districtwide use, most are outdated and are used only occasionally by teachers. Many of the documents that guide the district's curriculum were developed by individual teachers or small groups of teachers and usually in response to a specific building or program need. Little effort has been made to ensure any consistency in curricular planning among schools or programs. A notable exception to this lack of districtwide curricular planning is YISD's involvement with the development of a standards-based curriculum in mathematics and science through the multidistrict Urban Systemic Initiative (USI). This curriculum is intended to set standards against which student performance can be measured. USI is funded through the National Science Foundation (NSF) and the El Paso Collaborative for Academic Excellence, whose membership includes the El Paso, Socorro, and Ysleta school districts and the University of Texas at El Paso. The three districts cooperating in USI have introduced certain curricula that have been recognized by NSF and other sources as being standards-based. One or more of these standard-based programs have been initiated in 60 of the participating districts' 150 elementary and secondary schools. In the 1997-98 school year, YISD is continuing to expand the number of schools involved, incorporate standards-based instruction into materials already available, increase related training activities offered to staff, and assess the results of these programs in terms of increased student performance. Two other efforts related to curriculum planning are the Math Curriculum Guide developed by the YISD Area Math Team and the Social Studies PK-12 Alignment Framework, 1997-98. The social studies framework is a document that attempts to correlate curriculum efforts of several state and national groups. District teachers developed both documents and volunteered to work on the projects. As stated in the math guide, the teachers desired "classrooms in which all mathematics instruction was relevant and aligned with the most current curriculum documents available." These two documents are notable in that they represent efforts by content area teachers to fulfill a need for curriculum documents that coordinate and align portions of the district's curriculum. As shown in Exhibit 2-15, Math is the only area of the TAAS where no school test scores declined, which is evidence of the success of these programs. While the district is enjoying tremendous success in the area of student performance, its stated goal is for every school to be rated exemplary. For this to occur, the most successful practices must be documented and used to guide and assist teachers throughout the district. Recommendation 15: Expanding on the work already begun in the areas of math and science, develop and implement a curriculum management plan that includes guide development for every course and grade level. YISD needs an effective, systematic process for developing curricula that eliminates the existing fragmentation of efforts and captures the exemplary practices of the most successful teachers. The

district should develop guides that are functional, easy to use, and comprehensive. The development effort should include input from all district stakeholders as well as curriculum specialists outside the district. YISD's central office should provide direction for the project and outline the expected results. IMPLEMENTATION STRATEGIES AND TIMELINE
1. The superintendent assigns the responsibility for developing a curriculum management plan to the associate superintendent of Instruction.
June 1998
2. The associate superintendent of Instruction, with appropriate input from staff members, defines and secures approval of the roles of various stakeholders in the design and development process.
June - October 1998
3. The executive directors for Assessment and Support develop a comprehensive matrix for one or two curriculum areas, includ ing a chart illustrating the major curricular emphases grade by grade and subject by subject and a schedule for addressing all K-12 curriculum areas at the rate of one or two per year.
November 1998 - May 1999
4. The executive directors for Assessment and Support develop a curriculum revision cycle that provides for the review and revision of all curriculum guides on a four year cycle.
November 1998 - May 1999
5. The executive directors for Assessment and Support establish teams of teachers and support staff to write guides in their curricular areas as scheduled to provide teachers with the information needed to plan and deliver effective instruction.
Ongoing beginning September 1999
6. The executive directors for Assessment and Support review and revise the guides as needed.
Ongoing beginning September 2003
FISCAL IMPACT Central office involvement could be provided with available resources. Release time for teacher participation is estimated at 12 teachers for three days each at $160.30 per day, or $5,770 for first-year design and development activities. Guide development costs are calculated at 12 teachers for five days at $160.30 per day; two typists for five days at $80 per day; and $1,000 for material and supplies, totaling $11,418 for four years beginning in 1998-99. Guide revision costs are calculated at 12 teachers for three days; one typist for five days; and $500 in materials and supplies, totaling $6,670 beginning in 2002-2003.
Recommendation 1998-99 1999-2000 2000-01 2001-02 2002-03
Develop curriculum and management plan ($17,200) ($11,400) ($11,400) ($11,400) ($6,700)

including guide development

Chapter 2 EDUCATIONAL SERVICE DELIVERY AND PERFORMANCE MEASURES
C. Gifted and Talented Education
State legislation passed in 1987 requires all school districts to provide services for gifted and talented (G/T) students. In 1990, the State Board of Education (SBOE) adopted a plan for serving gifted students that was designed to provide guidance to districts in how to meet the new legal requirements and ensure that all students have the opportunity to be fairly and accurately assessed for the services. In 1995, state legislation required SBOE to "develop and periodically update a state plan of the education of gifted and talented students." This plan was to be used for accountability purposes, "to measure the performance of districts in providing services to students identified as gifted and talented." SBOE's plan, adopted in 1996, provides direction for the refinement of existing services and for the creation of additional curricular options for gifted students. CURRENT SITUATION YISD's first programs for gifted and talented students were initiated in the 1979-80 school year on a pilot basis at three elementary schools. In 1990-91, the program was expanded to students in all district elementary schools. During that same year, a G/T program was initiated for students in grades 7-12. The program was coordinated at the district level until major decentralization efforts were initiated about five years ago. At that time, the position responsible for coordinating gifted and talented instruction was eliminated and campus administrators were assigned responsibility for program leadership. FINDING The Advanced Placement (AP)/Pre-Advanced Placement (Pre-AP) programs are YISD's primary vehicles for providing accelerated instruction in its middle and high schools. The AP program provides college- level instruction and preparation as well as the opportunity to earn college credit. These classes are open to all secondary school students. To help reduce any financial constraints associated with taking the examinations, the district has initiated a program that, based on grades or examination scores, provides for the advance payment or rebates of testing

fees. All AP and Pre-AP faculty members are selected by school principals. They must have completed AP training prior to the current school year. In addition, YISD secondary teachers are in the process of acquiring 30 hours of G/T training in five core areas as well as an annual requirement of six additional hours. Teams composed of high school and middle school teachers meet on a regular basis to coordinate the instructional content and teaching strategies used in the AP courses. Between 1996 and 1997, the number of AP examinations taken by YISD students increased 71.2 percent, from 416 to 712. As indicated in Exhibit 2-18, although the overall passing rate decreased from 41.6 percent to 32.7 percent, the total number of students passing AP examinations increased from 173 (416 x 41.6%) to 233 (712 x 32.7%). The percentage of students passing each AP test in 1996 and 1997 is provided, by high school, in Exhibits 2-19 and 2-20.
Exhibit 2-18 Percentage of Advanced Placement Tests Passed
May 1996/1997
Subject Area
Tests Taken 1996 1997
Percent Passed 1996 1997
Percent of Increase/ (Decrease)
All Tests State 62.1 60.2 (3.1)
District 416 712 41.6 32.7 (21.4)
U.S. History State 52.4 45.3 (13.5)
District 27 66 3.7 9.1 245.9
Biology State 58.0 54.1 (6.7)
District 5 41 20.0 2.4 (88.0)
Chemistry State 57.8 53.1 (8.1)
District 9 25 0 4.0 400.0
Computer Science A State 54.0 46.9 (13.1)
District 4 3 0 0 *
English, Language/Composition State 58.9 59.7 1.4
District 58 75 19.0 29.3 54.2

English, Literature/Composition State 63.2 63.4 0.3
District 103 139 28.2 21.6 (23.4)
European History State 71.4 70.3 (1.5)
District 9 16 22.2 18.8 (15.3)
French Language State 49.8 47.0 (5.6)
District 9 10 0 10.0 1000.0
Government/Politics State 62.1 58.0 (6.6)
District 5 50 0 16. 1600.0
Math/Calculus AB State 60.1 54.8 (8.8)
District 49 79 22.4 15.2 32.1
Physics B State 56.3 54.9
District 4 36 0 2.8 280.0
Spanish Language State 81.0 83.3 2.8
District 118 143 93.2 99.3 6.5
Spanish Literature State 75.0 74.1 (1.2)
District 15 5 40.0 60.0 50.0
Art History State NA 68.7 -
District 0 3 - 0 -
Economics Micro State NA 44.5 -
District 0 2 - 0 -
Economics Macro State NA 62.4 -
District 0 15 - 6.7 -
Music Theory State 69.3 NA -
District 1 0 0 - -
Physics C Mechanics State NA 71.6 -
District 0 2 0 0 0
Physics C Electricity & Magnetism State NA 61.3 -

District 832 1424 41.6 32.7 0
Source: YISD Division of Instruction.
Exhibit 2-19 Percentage of Students Passing
Advanced Placement Tests by High School, YISD May 1996
Subject Area Bel Air
Del Valle
East Wood
Hanks
Park- land
River- side
Ysleta
District
All Tests 25.0 49.3 75.8 32.7 42.9 39.3 45.8 41.6
U.S. History 0.0 - - - 0.0 - 10.0 3.7
Biology - - - * * * - 20.0
Chemistry - 0.0 - 0.0 - - - 0.0
Computer Science A
- - - * * - - *
English, Lang./ Compos. 0.0 - 66.7 20.0 14.3 27.2 - 19.0
English, Literature/ Composition 5.9 8.3 64.7 56.3 - 19.0 25.0 28.2
European History - - - - - - 22.2 22.2
French Language 0.0 - - 0.0 - 0.0 0.0 0.0
Government/Politics - - - 0.0 - 0.0 - 0.0
Math/Calculus AB 0.0 20.0 100.0 20.0 - 7.7 50.0 22.4
Physics B - - - - - - * *
Spanish Language 74.1 100.0 100.0 * * 100.0 100.0 93.2
Spanish Literature - - - - - 50.0 33.3 40.0
Art History - - - - - - - -
Economics Micro - - - - - - - -
Economics Macro - - - - - - - -
Music Theory - - * - - - - -
Physics C - - - - - - - -

Mechanics
Physics C Electric./Magnet.
- - - - - - - -
Source: YISD Division of Instruction. * Insufficient data to perform meaningful computation.
Exhibit 2-20 Percentage of Students Passing
Advanced Placement Tests by High School, YISD May 1997
Subject Area Bel Air
Del Valle
East Wood
Hanks
Park- land
River- side
Ysleta
District
All Tests 7.3 28.8 56.0 41.8 20.4 39.7 29.3 32.7
U.S. History 0.0 - 28.6 - 28.6 - 0.0 9.1
Biology 0.0 - - 10.0 0.0 0.0 0.0 2.4
Chemistry - 0.0 - 33.3 - - - 4.0
Computer Science A
- - - * - - - *
English, Lang./Composition
- - 47.8 71.4 20.7 0.0 - 29.3
English, Literature/Comp. 8.3 4.8 61.3 70.0 * 2.3 5.3 21.6
European History - - - - - - 18.8 18.8
French Language - 0.0 - - - - 25.0 10.0
Government/Politics 0.0 11.8 * 28.6 * - - 16.0
Math/Calculus AB 0.0 0.0 21.6 25.0 0.0 25.0 28.6 15.2
Physics B - 0.0 - - - 0.0 5.6 2.8
Spanish Language 100.0 100.0 100.0 100.0 100.0 98.0 100.0 99.3
Spanish Literature - - - - - 60.0 - 60.0
Art History - * - - - - - *
Economics Micro - - * * - - - *

Economics Macro 0.0 - - 33.3 - - - 6.7
Music Theory - - - - - - - -
Physics C Mechanics - - - * * - - *
Physics C Electric./Magnet. - - - * * - - *
Source: YISD Division of Instruction. * Insufficient data to perform meaningful computation. COMMENDATION YISD's efforts to encourage students to take AP and Pre -AP courses by reducing the costs associated with the examinations have resulted in a larger number of tests taken and passed. FINDING YISD's current gifted and talented program does not comply with the Texas State Plan for the Education of Gifted/Talented Students. The district has not established the required provisions for student identification and reassessment, appeals procedures concerning student placement, and procedures for student exits and transfers within the district or between districts. YISD offers its G/T students only a limited number of learning opportunities and program options in the four core academic areas. In addition, the district has not maintained appropriate records on required training for teachers and administrators. In fact, several campus administrators told TSPR that they were unaware of the professional training requirements. YISD recently began efforts to bring its G/T program into compliance with the state plan. Responsibility for this task has been assigned to a member of a district AST. A task force of teachers and administrators developed a five-year plan designed to correct the G/T program's deficiencies and presented it to the associate superintendent for Instruction in August 1997. Board policy to provide direction for the program has been developed and will be considered by the Board of Trustees in the next few months. The district also has initiated an inventory of required training to be completed by teachers, counselor, and administrators. The 1997-98 budget was amended in January 1998 to include $75,000 for the purchase of assessment instruments and professional development training. A similar amount has been committed for the 1998-99 budget. Recommendation 16:

Commit the resources required to complete the district's five-year plan for its Gifted and Talented Program. The district should not merely seek to bring its G/T program into compliance, but in keeping with YISD's goals for excellence in education, should also establish a goal of achieving exemplary status on the Texas State Plan. IMPLEMENTATION STRATEGIES AND TIMELINE
1. YISD fully implements its revised G/T program including components on student assessment, program design, curriculum and instruction, professional development, and family-community involvement.
September 1998
2. The district's curriculum support specialist develops a three-to-five year plan for achieving exemplary status as outlined in the state plan and secures staff and board approval.
September 1998 - January 1999
3. The district's initial plan implementation efforts are reviewed and revised as needed.
Ongoing
4. The district implements fully its plan to attain exemplary status under the state plan. May 2000
FISCAL IMPACT This recommendation could be achieved with available resources. The associated costs have been included in the estimated cost of developing a districtwide curriculum management plan.
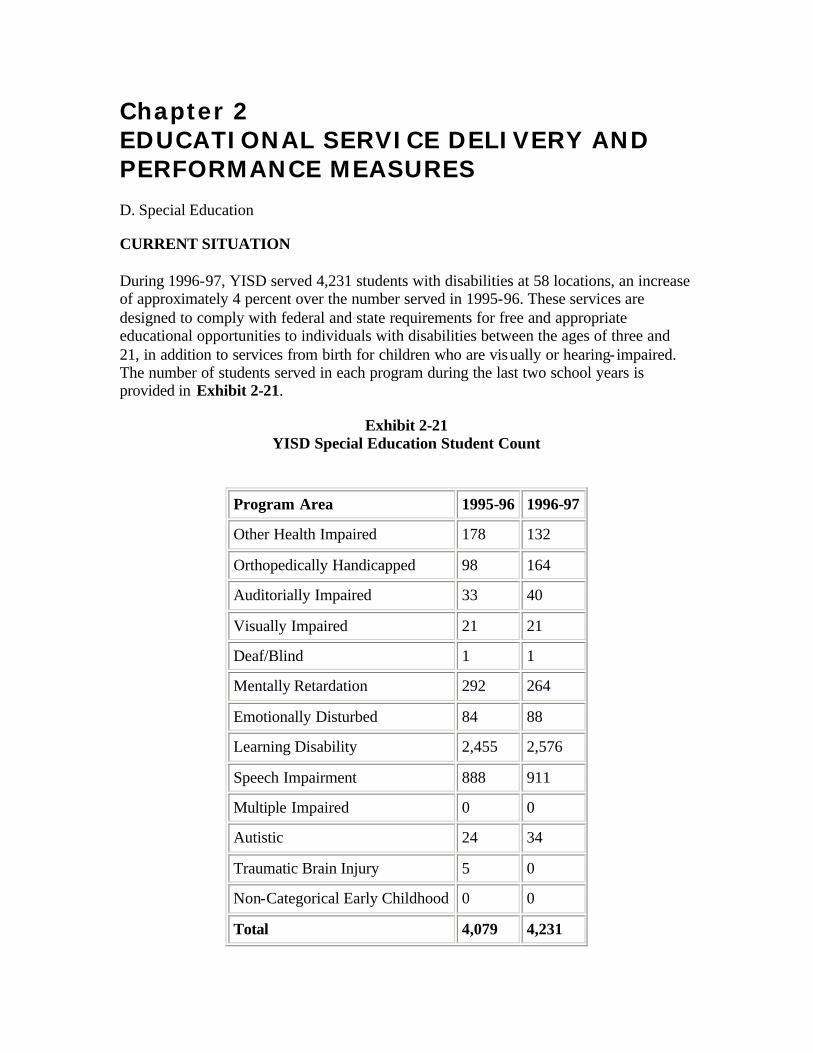
Chapter 2 EDUCATIONAL SERVICE DELIVERY AND PERFORMANCE MEASURES D. Special Education
CURRENT SITUATION During 1996-97, YISD served 4,231 students with disabilities at 58 locations, an increase of approximately 4 percent over the number served in 1995-96. These services are designed to comply with federal and state requirements for free and appropriate educational opportunities to individuals with disabilities between the ages of three and 21, in addition to services from birth for children who are visually or hearing- impaired. The number of students served in each program during the last two school years is provided in Exhibit 2-21.
Exhibit 2-21 YISD Special Education Student Count
Program Area 1995-96 1996-97
Other Health Impaired 178 132
Orthopedically Handicapped 98 164
Auditorially Impaired 33 40
Visually Impaired 21 21
Deaf/Blind 1 1
Mentally Retardation 292 264
Emotionally Disturbed 84 88
Learning Disability 2,455 2,576
Speech Impairment 888 911
Multiple Impaired 0 0
Autistic 24 34
Traumatic Brain Injury 5 0
Non-Categorical Early Childhood 0 0
Total 4,079 4,231

Source: YISD Division of Instruction. During 1996-97, YISD budgeted $15.5 million, or 12.1 percent of its instructional operating expenditures, for special education programs. As indicated in Exhibit 2-22, this share is slightly less than the average for YISD's peer districts (12.9 percent) but slightly higher than the state average (11.7 percent). The percent of YISD students enrolled in special education programs is lower than the state's as a whole and for all peer districts except El Paso and Dallas (Exhibit 2-22).
Exhibit 2-22 Percentage of Student Enrollment
and Budgeted Instructional Operating Expenditures in Special Education
YISD versus Peer Districts and State Total 1996-97 School Year
Percent
District Student Enrollment
Budget Instructional Operating Expenditures
Corpus Christi 13.7 12.8
San Antonio 11.9 19.4
Austin 11.7 16.8
Fort Worth 11.6 13.6
Socorro 10.1 11.3
Houston 9.8 9.6
El Paso 9.0 11.5
Ysleta 9.0 12.1
Dallas 6.6 8.6
State 11.6 11.7
Source: 1996-97 AEIS Report. A student may be exempted from the TAAS reading, mathematics, or writing tests by an admission, review, and dismissal (ARD) committee; the exemption then is specified in the student's individual education plan (IEP). In the last two years, approximately 40 to 48 percent of the state's special education students were exempted from one or more of the TAAS tests. In comparison, the percentage of students receiving an ARD committee exemption in YISD and its peer districts ranged from a high of 89 percent to a low of 16 percent. YISD exempted fewer of its special education students than any of its peer

districts or the state as a whole (Exhibit 2-23). YISD ranked in the middle of its peer districts in TAAS passing rates for special education students (Exhibit 2-24).
Exhibit 2-23 Percentage of Special Education Students
Exempted from TAAS in All Grades Tested YISD Versus Peer Districts and State Total
1995-96 and 1996-97 School Years
Reading Writing Math
District 96 97 96 97 96 97
Ysleta 26.3 18.5 28.3 21.2 22.7 16.1
El Paso 40.9 25.1 41.8 28.9 38.6 23.8
Corpus Christi 34.9 30.0 35.1 31.8 34.0 28.3
Austin 43.6 37.7 41.5 38.5 40.8 34.6
San Antonio 51.4 46.9 57.1 52.2 46.6 41.6
Socorro 64.5 57.5 68.5 55.3 61.6 53.2
Houston 52.3 69.6 53.9 73.8 48.0 64.3
Fort Worth 69.6 70.3 71.3 73.8 68.8 69.7
Dallas 89.4 85.4 86.4 80.8 88.8 84.1
State 45.2 43.8 48.1 45.9 42.5 40.5
Source: 1996-97 AEIS Report.
Exhibit 2-24 Percentage of Special Education Students Passing All
TAAS Tests in All Grades YISD Versus Peer Districts and State Total
1995-96 and 1996-97 School Years
Percent Passing
District 1996 Rank 1997 Rank
Austin 15.6 8 17.5 7
Corpus Christi 19.0 5 21.3 6
Dallas 26.5 3 24.1 5
El Paso 18.5 6 17.0 8

Fort Worth 25.5 4 32.5 3
Houston 39.2 2 40.2 1
San Antonio 10.1 9 11.2 9
Socorro 42.7 1 37.3 2
Ysleta 17.7 7 25.6 4
Source: 1996-97 AEIS Report. FINDING The Texas Education Code (TEC) requires districts to ensure that students with disabilities who take the TAAS but do not perform successfully receive an intensive program of instruction to improve their scores. The district's student handbook contains a statement to this effect and states that "Study guides shall be distributed to assist parents providing assistance during summer months." In YISD, accountability for the delivery of such services rests with the individual schools. A review of 1997-98 school action plans reveals that the schools address the TEC requirement in very different ways. At one YISD high school, for instance, the responsibility for improving special education students' TAAS scores is assigned to "all teachers." At another high school, planning documents prepared by each department call for increasing the passing rates of special education students, but the resulting initiatives do not constitute an "intensive program of instruction;" instead, the documents recommend a review of IEPs and discussions during ARD meetings. At a third high school, TSPR could find no mention at all of efforts to improve TAAS scores of special education students in its planning documents. Special education children who do not pass the TAAS are eligible for after-school tutoring and are required by the district to attend summer school. In addition, the parents of all children who take the TAAS receive a TAAS report on their students' performance. The report suggests remedial activities for parents preparing students for TAAS testing. Recommendation 17: Provide programs of intense remediation for students with disabilities who have not performed well on the TAAS. IMPLEMENTATION STRATEGIES AND TIMELINE
1. The associate superintendent of Instruction directs principals to ensure that their 1998-99 school action plans include intensive programs of remediation for students with disabilities who are unsuccessful on TAAS.
July 1998
2. The director of Special Education surveys all principals to determine August -

what sort of TAAS remediation is provided to students with disabilities. September 1998
3. The director of Special Education compiles a report on these methods. September - October 1998
4. The director of Special Education, with input from principals, other district staff, and parents, develops procedures to ensure each school offers these intensive programs of remediation, and provides central administration with any data elements necessary to determine program success.
November 1998
5. Principals initiate the procedures as approved and revise programs as needed for the 1999-2000 school year. Ongoing
6. The coordinator of Research, Evaluation, and Testing provides the data necessary to help determine the success of the programs implemented.
Ongoing
FISCAL IMPACT This recommendation can be achieved with available resources.

Chapter 2 EDUCATIONAL SERVICE DELIVERY AND PERFORMANCE MEASURES
E. Career and Technology Education/Adult Education
Career and Technology Career and Technology Education (CATE) gives students the opportunity to make informed occupational choices and develop marketable skills. State law requires school districts to provide a curriculum that affords each student the opportunity to "master the basic skills and knowledge necessary for managing the dual roles of family member and wage earner; and gaining entry- level employment in a high-skill, high-wage job or continuing the student's education at the post-secondary level." CURRENT SITUATION During the 1996-97 school year, YISD offered more than 220 courses in career and technology education in eight program areas to its high school students. Three courses-career investigation, life management skills, and technology education-were offered at the middle school level. Most CATE courses are offered at all high schools in the district, although courses in two program areas, agricultural science and technology and health science technology, are offered only at a single location. Exhibit 2-25 lists YISD's CATE courses for the 1997-98 school year by grade.
Exhibit 2-25 Career and Technology Offerings
in YISD by Course and Grade 1997-98 School Year
District-wide Offering Grades Offered
Course Area/Title 7 8 9 10 11 12
Career Investigation
Career Investigation X X
Technology Education 7 8 9 10 11 12
Introductory Industrial Technology X X
Advanced Industrial Technology X
Life Management Skills 7 8 9 10 11 12

Life Management Skills I, II X X
Law Enforcement 7 8 9 10 11 12
Law Enforcement Training X
Courts and Criminal Procedure (Experimental) X X
Home Economics Cooperative Education (HECE) 7 8 9 10 11 12
HECE I X X
HECE II X
Trade and Industrial Education 7 8 9 10 11 12
Industrial Cooperative Training I X X
Industrial Cooperative Training II X
Marketing Education 7 8 9 10 11 12
Marketing Education Lab I X X
Marketing Education Lab II X
Principles of Marketing X X X
Retail Merchandising X X X
Marketing Education I X X
Marketing Education II X
Entrepreneurship X X
Business Education 7 8 9 10 11 12
Keyboarding/Word Processing X X X X
Recordkeeping X X X X
Introduction to Business X X
Business Math X X X
Desktop Publishing (Experimental) X X
Microcomputer Applications X X X X
Microcomputer Applications (English as a Second Language) X X X X
Business Computer Applications I X X

Business Computer Applications II X
Business Computer Programming I X X
Business Computer Programming II X
Advanced Word Processing X X X
Accounting X X X
Computerized Accounting (Experimental) X X
Advanced Accounting (Honors) X X
Business Communications X X X
Shorthand (Speedwriting) X X X
Business and Consumer Law X X
Personal Finance X X
Business Management and Ownership X X
Business Education 7 8 9 10 11 12
Office Support Systems X X X
Business Financial Applications X X
Business Information Processing I X X
Business Information Processing II X
Business Information Processing X X
Business Information Processing X
Business Information Processing II X X
Legal Transcription X X
Medical Transcription X X
Bilingual Secretary X X
Medical Health Science Technology 7 8 9 10 11 12
Medical Health Care Science X X X
Home Economics Education 7 8 9 10 11 12
Comprehensive Home Economics I X X X X
Parenting and Child Development X X X

Advanced Child Development X X
Parenting for School Age Parents X X X X
Consumer and Family Economics X X X
Family/Individual Health X X X
Individual and Family Life X X X
Food Science and Nutrition X X X
Advanced Food Science and Nutrition X X X
Management X X X
Housing, Design, and Furnishings X X X
Interior Design X X X
Apparel X X X
Textiles and Apparel Design X X X
Family with Special Health Needs X X X
Services for Elderly X X
Technology Education 7 8 9 10 11 12
Technology Systems X X X X
Manufacturing Systems X X X X
Construction Graphics X X X
Manufacturing Graphics X X X X
Manufacturing Graphics Honors X X X
Energy Systems X X X X
Research and Development X X
Electricity/Electronics Systems X X X X
Computer Applications X X X X
Computer Applications Honors X X X
Communication Systems X X X X
Vocational Education for Handicapped (VEH) 7 8 9 10 11 12
VEH Building Maintenance I-II X X X X

VEH Building Maintenance I-II X X X X
Academy Of Science and Technology 7 8 9 10 11 12
Plumbing, Heating, Air Conditioning & Refrigeration X X
Auto Technician I-II X X
Diesel Mechanic I-II X X
Academy Of Science and Technology 7 8 9 10 11 12
Construction Trades I-II X X
Computer Maintenance Technician I-II X X
Cosmetology I X
Cosmetology II X
Culinary Arts I X X
Culinary Arts II X X
Drafting I X X
Drafting/Computerized II X
Electrical Trades I-II X X
Home Décor, Floral Accessories X X
Hospitality Services I-II X X
Medical Health Occupations I-II X
Medical Health Occupations Dental Assist. I X
Medical Health Occupations Dental Assist. II X
Medical Health Occupations Licensed Vocational Nurse I-II X X
Medical Health Occupations Emergency Medical Technician X
Metal Trades I-II X X
Media Technology/Audio-Video Production X X
Child Care and Guidance Lab I-II X X
Vocational Electronics I-II X X
Medical Transcription X X
Ysleta High School 7 8 9 10 11 12

Agricultural Science and Technology
Agricultural Science I (Intro. To World Agriculture) X X X X
Agricultural Science II (Applied Agriculture) X X X X
Intro. To Agricultural Mechanic X X X
Agricultural Mechanic X X
Agricultural Cooperative Training I X X
Agricultural Cooperative Training II (Advanced) X X
Equine Science X X X
Fruit, Nut, and Vegetable Production X X X
Animal and Plant Production X X X
Home Maintenance and Improvement X X X
Wildlife and Recreation Management X X X
Environmental Science X X X
Introduction to Horticulture X X X
Personal Leadership Skills Development X X X
Agricultural Management and Marketing X X X
Food Technology X X X
Animal Science X X X
Plant and Soil Science X X X
Horticulture Plant Production X X X
Landscape Design, Construction, and Maintenance X X X
Diversified Agriculture X X X
Agricultural Metal Fabrication Technology X X X
Agricultural Power and Machinery X X
Aquaculture Production X X
Source: YISD Division of Instruction. During the spring semester, 6,921 YISD students were enrolled in 74 CATE courses in grades 7-12. Exhibit 2-26 lists the courses with enrollments of 90 or more by sex and

race/ethnicity. These enrollments are expressed as a percentage of the total in Exhibit 2-27.
Exhibit 2-26 Enrollment in Selected CATE Courses
by Sex and Race/Ethnicity Spring 1997
Grades 7-8 ENROLLMENT ENROLLMENT
Course Name Male Female Total African American Hispanic Anglo Other Total
Introductory Industrial Technology
215 64 279 1 269 4 5 279
Life Management Skills
282 433 715 9 659 41 6 715
Career Investigation 192 164 356 23 283 43 7 356
Total 689 661 1,350 33 1,211 88 18 1,350
Percent 51.0 49.0 100 2.4 89.7 6.5 1.3 99.9
Grades 9-12 ENROLLMENT ENROLLMENT
Course Name Male Female Total African American Hispanic Anglo Other Total
Manufacturing Graphics 208 23 231 2 203 23 3 231
Construction Graphics 91 3 94 1 84 8 1 94
Energy Systems 149 13 162 8 127 26 1 162
Technology Systems 204 20 224 5 201 18 0 224
Comprehensive Home Economics
129 342 471 34 383 52 2 471
Individual and Family Living 22 84 106 1 96 9 0 106

Home Economics Cooperative Education
43 59 102 6 88 7 1 102
Law Enforcement Training
230 162 392 8 348 33 3 392
Marketing Education 45 51 96 3 74 19 0 96
Business Information Processing
53 197 250 10 222 17 1 250
Business Computer Applications
44 59 103 2 98 2 1 103
Microcomputer Applications 943 1,009 1,952 50 1,589 294 19 1,952
Total 2,161 2,022 4,183 130 3,513 508 32 4,183
Percent 51.7 48.3 100 3.1 84.0 12.1 .8 100
Source: Office of Career and Technology Education.
Exhibit 2-27 Percentage of Students Enrolled in
Selected YISD CATE Courses by Sex and Race/Ethnicity
Spring 1997
Grades 7-8 Percent of the Total Enrollment
Percent of the Total Enrollment
Course Name Male Female Total African American Hispanic Anglo Other Total
Introductory Industrial Technology
77.1 22.9 100 .1 96.4 1.4 1.8 99.7
Life Management Skills
39.4 60.6 100 1.3 92.2 5.7 .8 100.0

Career Investigation 76.8 23.2 100 6.5 79.2 12.1 2.0 99.8
Percent 51.0 49.0 100 2.4 89.7 6.5 1.3 99.9
Grades 9-12 Percent of the Total Enrollment
Percent of the Total Enrollment
Course Name Male Female Total African American Hispanic Anglo Other Total
Manufacturing Graphics 90.0 10.0 100 .9 87.9 10.0 1.3 100.1
Construction Graphics 96.8 3.2 100 1.1 89.4 8.5 1.1 100.1
Energy Systems 92.0 8.0 100 4.9 78.4 16.0 .6 99.9
Technology Systems 91.1 8.9 100 2.2 89.7 8.0 0 99.9
Comprehensive Home Economics
27.4 72.6 100 7.2 81.3 11.0 .4 99.9
Individual and Family Living 20.8 79.2 100 9.4 90.6 8.5 0 100.0
Home Economics Cooperative Education
42.2 57.8 100 5.9 86.3 6.9 1.0 100.1
Law Enforcement Training
58.7 41.3 100 2.0 88.8 8.4 .8 100.0
Marketing Education
46.9 53.1 100 3.1 77.1 19.8 0 100.0
Business Information Processing
21.2 77.8 99 4.0 88.8 6.8 .4 100.0
Business Computer Applications
42.7 57.3 100 1.9 95.1 1.9 1.0 99.9
Microcomputer Applications 48.3 51.7 100 2.6 81.4 15.1 1.0 100.1

Percent 51.7 48.3 100 3.1 84.0 12.2 .8 100.1
Source: Office of Career and Technology Education. FINDING During the 1996-97 school year, YISD undertook a reexamination of the strategies it uses in its CATE programming efforts. To conduct this study, the district formed a task force of district and community representatives (Exhibit 2-28). Its stated purpose was to "revisit YISD's current strategy for Career and Technology Education and rethink the district's success template for improved student employability and successful entry into the 21st Century workforce." The task force used a strategic planning process to identify, from a student's perspective, the CATE program's crucial strengths and weaknesses. Some major factors that were identified are summarized in Exhibit 2-29.
Exhibit 2-28 Membership CATE Task Force
1996-97
District Number of Participants
Teacher 5
Counselor 3
Supervisor 3
Administrator 5
Other 1
Community
Parent 2
Business 2
Post-Secondary Instruction 3
Other 1
Facilitator 1
Total 26
Source: CATE Strategic Profile, YISD, March 1997.
Exhibit 2-29 Most Frequently Mentioned Factors
CATE Strategic Profile Analysis

Program Strengths
Academy of Science and Technology
Offsite learning
Program Weaknesses
Lack of funding equity across district
Insufficient guidance/counseling support
Inadequate integration of CATE into district curriculum
Program Opportunities
Developing "CATE" mindset (workplace skills viewed as essential
by district)
Threats
Misconceptions about CATE
Loss of region's employers
Site-Based management (decisionmaking at the school level)
Appropriate Program Support
Opportunity for district administration to integrate CATE program into K-12 curriculum
Source: CATE Strategic Profile, YISD, March 1997. The process produced 20 strategic objectives in 10 major goal areas. The eight "key" recommendations developed from these goals and objectives and presented to the superintendent for review and consideration were to:
• build an integrated, market-driven CATE curriculum.
• commit to a fully funded CATE program.
• build ongoing community awareness and engagement.
• earn broad program support (internal/external).

• make student CATE success non-negotiable.
• integrate "and the workplace" in the YISD vision statement.
• adapt the "CATE Career Development Model" as the right platform for student achievement.
• make policy changes to accelerate the CATE process (Getting patrons to accept that workplace skills are essential.)
COMMENDATION The district has taken steps to identify areas for improvement in its career and technology education. FINDING YISD's vision statement says "all students will graduate from high school fully bilingual and prepared to enter a four-year college or university." The CATE Strategic Profile, March 1997, includes the philosophy of the career and technology program and a statement that students "will acquire skills to become self-sustained wage earners in the future labor market as they complete high school graduation requirements and prepare for post-secondary training." To pursue these goals, the district has developed agreements with four area post-secondary institutions. These agreements make it possible for students to earn credit for introductory college courses while still in high school. The students' secondary and post-secondary occupational training is coordinated to eliminate unnecessary duplication of course work. Tech-prep arrangements allow for the delivery of preparatory and training programs and services in secondary, post-secondary, and higher education institutions that could lead to a two-year associate degree, employment, or technical preparation in several fields. Exhibit 2-30 provides information on these courses and the community colleges, technical colleges and universities with which YISD has established agreements.
Exhibit 2-30 YISD Career and Technology Courses
Offered in Partnership With Post-secondary Institutions
Course Post-secondary Institution
Agribusiness Management and Marketing Sul Ross State University

Agricultural Metal Fabrication Technology Sul Ross State University
Animal and Plant Production Sul Ross State University
Animal Science Sul Ross State University
Horticulture Plant Production Sul Ross State University
Plant and Soil Science Sul Ross State University
Accounting A, B El Paso Community College
Business Computer Applications I El Paso Community College Texas State Technical College
Business Computer Applications II Texas State Technical College
Business Computer Programming Texas State Technical College
Machine Repair and Computer Repair El Paso Community College
Computer Maintenance Technician El Paso Community College Western Technical Institute
Construction Graphics El Paso Community College
Computer Applications El Paso Community College Texas State Technical College
HECE I, II El Paso Community College
Equine Science Sul Ross State University
Keyboarding Texas State Technical College
Keyboarding/Word Processing El Paso Community College
Speedwriting Texas State Technical College
Advanced Child Development El Paso Community College
Advanced Food Science and Nutrition Sul Ross State University
Food Science and Nutrition Sul Ross State University
Parenting and Child Development El Paso Community College
Manufacturing Graphics El Paso Community College Texas State Technical College
Medical Health Care Science El Paso Community College
Law Enforcement Training El Paso Community College

Plumbing, Heating, Air Conditioning, & Refrigeration El Paso Community College
Automotive Technician El Paso Community College
Drafting I, II El Paso Community College
Medical Health Occupations I, II El Paso Community College
Source: Career and Technology Education Programs and Courses 1997-98. Another benefit derived from student participation in programs offered in cooperation with colleges and universities is the familiarity students get with college- level programs. Studies show students are more likely to go on to a college or university if they have had this type experience in high school. COMMENDATION YISD offers a large number of career and technology education courses to its students through agreements with area post-secondary institutions. FINDING YISD is authorized to offer more than 200 state-approved CATE courses that are consistent with recommendations of the Texas Workforce Commission, Private Industry Council, Tech-Prep School- to-Work Consortium, the Office of Economic Development of the City of El Paso, and the Ysleta ISD Career and Technology Education General Advisory Council. During Spring 1997, students were enrolled in 74 of these. However, more than 75 percent of all YISD students in grades 9-12 were enrolled in only 12 CATE courses (Exhibit 2-27). The most popular course was Microcomputer Applications, the first course in a sequence leading to a career in the field of technology. The courses with the next-highest enrollments were Comprehensive Home Economics and Law Enforcement Training. The Upper Rio Grande Tech Prep/School to Work Consortium has listed 75 occupations with "the greatest potential for growth in the Upper Rio Grande Region." Of the 75 occupations, YISD's CATE program addresses 47. Out of 15 regional key industries identified by the consortium, YISD's CATE program addresses 10. Recommendation 18: Review all CATE courses and delete or modify those that are determined to be inconsistent with the program's newly developed strategic profile. IMPLEMENTATION STRATEGIES AND TIMELINES
1. The director of Career and Technology Education and other appropriate June-

individuals from the district and business and industry review all CATE course offerings using district-generated evaluation data and information from organizations such as the Texas Workforce Commission, the Upper Rio Grande Tech Prep/School-To-Work Consortium, and the Private Industry Council.
September 1998
2. The director of Career and Technology Education makes recommendations to the associate superintendent for Instruction regarding any modifications to course offerings.
October 1998
3. District staff determines the impact of the recommendations on district resources.
November 1998- March 1999
4. The director of Career and Technology Education and the associate superintendent of Instruction take recommendations to the superintendent for his review and consideration and approval by the Board of Trustees.
November 1998- March 1999
5. The director of Career and Technology Education implements the recommendations. June 1999
FISCAL IMPACT This recommendation can be implemented with the district's current budget. FINDING Programs offered in Career and Technology Education are evaluated in two ways. First, a committee including representatives from the Texas Workforce Commission, School-to-Work Consortium, City of El Paso Department of Economic Development, Private Industry Council, and YISD staff members conducts an annual review of all occupation-specific courses/programs. Each committee member is asked to review specific courses with respect to their "offering job placement opportunities in direct or related occupations areas, after completion of training." After committee members make their reports, a followup communication is sent to each member outlining the recommendations made and soliciting concurrence. If a committee member does not concur with the recommendations as presented, a rationale for this dissent is requested. The recommendations for program modifications as agreed upon then are forwarded to the associate superintendent of Instruction for consideration. CATE programs also are evaluated at each school. Program evaluation became the responsibility of principals with the implementation of site-based management. An evaluation form for each program is prepared by the Office of Career and Technology Education and sent to each school with offerings in that program. Once completed, the evaluations are kept on file at the individual schools.

The director of CATE, however, rarely receives any feedback concerning the school evaluations. Unless the principal recognizes a problem and requests assistance or chooses to share information, communication between teachers and the Office of Career and Technology Education regarding any facet of the program is informal and limited. Recommendation 19: File a summary of CATE program evaluations conducted at each school with the Office of Career and Technology Education. Program evaluations can be used by central administration to address systemic issues that go across campuses, to share successful programs throughout the district, and to assist individual principals when weaknesses are detected. IMPLEMENTATION STRATEGIES AND TIMELINES
1. The associate superintendent of Instruction directs principals to file a summary of all program evaluations with the director of Career and Technology Education.
June 1998
2. The director of Career and Technology Education develops a form or modifies an existing one for use by principals in filing the summary report and establishes a schedule for receipt of the reports.
June 1998
3. Principals send the summary report(s) to the director of Career and Technology Education as they are completed.
Ongoing
FISCAL IMPACT This recommendation can be accomplished with available resources. Adult Education BACKGROUND TEA administers the state's adult education program and distributes state and federal funds to serve adults over the age of compulsory attendance (17 years-old) who have not received a high school diploma or General Education Development (GED) certificate of equivalency. Of 55 adult education programs administered by the state, 50 are operated as regional cooperatives. A cooperative may inc lude school districts, public community colleges, public colleges and universities, community-based organizations, and business and industry groups. School districts or community colleges administer some programs independent of the cooperatives as well.

YISD operates an independent adult education program. During 1996-97, the program served 3,908 adults using state and federal adult funds. These adults received services at elementary and secondary schools, a learning center, a vocational/technical school, and a center for battered women. The educational functioning levels of these adults, which are the categories used by the state to classify participants, are shown in Exhibit 2-31.
Exhibit 2-31 Educational Functioning Level of Participants
in State and Federal Adult Program
Educational Functioning Level Numbers
Beginning Adult Basic Education 25
Intermediate Adult Basic Education 178
Beginning English as a Second Language 2,209
Intermediate English as a Second Language 588
Advanced English as a Second Language 372
Adult Secondary 536
Total 3,908
Source: ABE Evaluation. YISD's adult program staff cooperates with community groups including El Paso Community College, the Texas Rehabilitation Commission, Texas Workforce Commission, El Paso Center for Battered Women, and a variety of volunteer and community organizations. FINDING YISD has expanded its adult education programs and services by coordinating with and securing funding from various agencies and organizations. The district acquired a grant of about $780,000 from the City of El Paso to renovate an old church to serve as a learning center. The Adult Learning Center was completed in 1996 and served 2,059 students in the 1996-97 school year. The director of Adult Education secured about $1,112,000 for 1997-98 to provide expanded education and training services. About $447,000 represented state and federal funds allocated by TEA based on a formula, while the remaining $665,000 was received from four separate agencies and organizations (Exhibit 2-32).

Exhibit 2-32 Source of Funds for Adult Services
1997-98
Source Estimated Amount
Federal Adult Formula $316,000
State Adult Formula 131,000
Dept. of Human Resources (JOBS) 200,000
Texas Workforce Commission (NAFTA Workers) 350,000
Enterprise Zone 99,000
Catholic Conference 16,000
Total $1,112,000
Source: YISD Adult Education Office. COMMENDATION YISD has expanded the range of adult educational opportunities by securing funds from various public and private sources. This funding is evidence of YISD's aggressive approach, as well as a positive relationship with the funding entities and a high level of confidence in YISD's program. FINDING As noted above, 3,908 adults attended YISD's adult education programs during the 1996-97 school year. Yet the 1990 U.S. Census reported that 68,000 adult residents of El Paso were illiterate, or 19 percent of the population. A recent YISD needs assessment identified that 57,850 adults living within its service area need adult education services. Such data reveal a significant unmet need for these services. The 3,908 adults who attended YISD's adult education program attended classes for the equivalent of 227,978 hours, or an average of 58.4 hours per participant. The formula TEA uses to distribute state and federal funds for adult education relies on "contact" hours for 75 percent of the total formula. One contact hour is recorded whenever a teacher interacts directly with a student for one hour. State and federal funds for adult education are limited. If the total amounts appropriated for this purpose increase in any year, programs that record additional contact hours will be eligible for increased allocations. Recommendation 20: Recruit additional students for adult education programs funded by state and federal formulas.
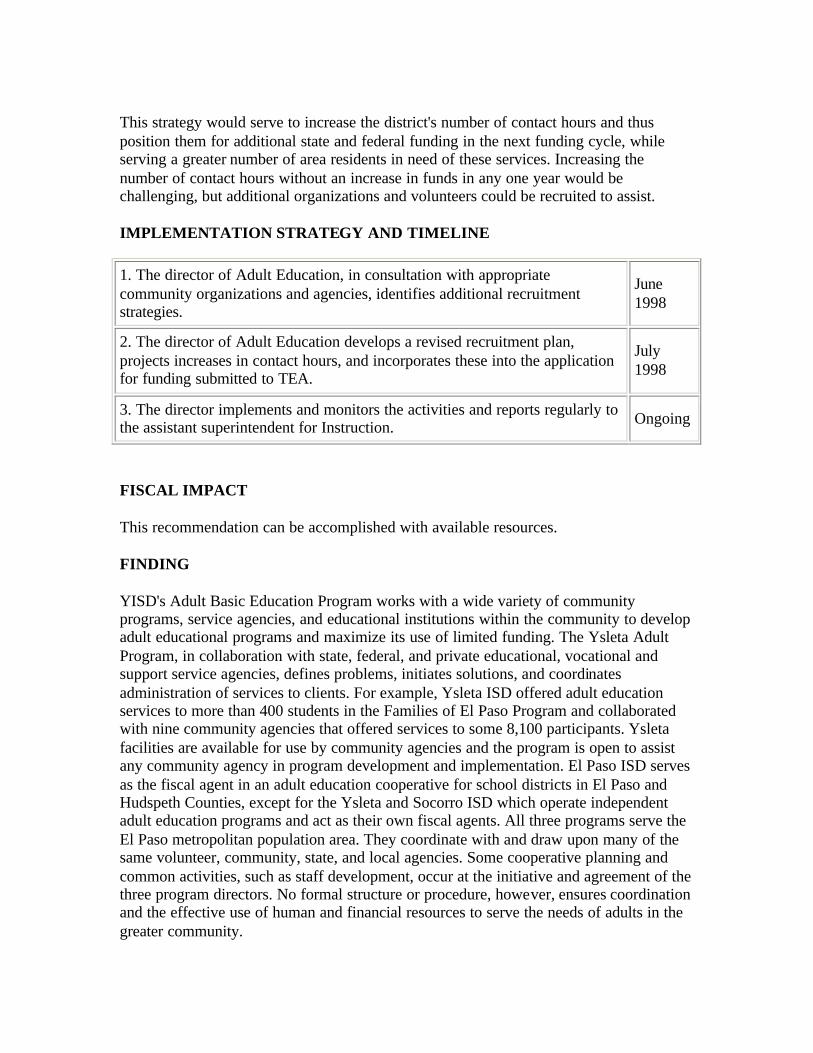
This strategy would serve to increase the district's number of contact hours and thus position them for additional state and federal funding in the next funding cycle, while serving a greater number of area residents in need of these services. Increasing the number of contact hours without an increase in funds in any one year would be challenging, but additional organizations and volunteers could be recruited to assist. IMPLEMENTATION STRATEGY AND TIMELINE
1. The director of Adult Education, in consultation with appropriate community organizations and agencies, identifies additional recruitment strategies.
June 1998
2. The director of Adult Education develops a revised recruitment plan, projects increases in contact hours, and incorporates these into the application for funding submitted to TEA.
July 1998
3. The director implements and monitors the activities and reports regularly to the assistant superintendent for Instruction. Ongoing
FISCAL IMPACT This recommendation can be accomplished with available resources. FINDING YISD's Adult Basic Education Program works with a wide variety of community programs, service agencies, and educational institutions within the community to develop adult educational programs and maximize its use of limited funding. The Ysleta Adult Program, in collaboration with state, federal, and private educational, vocational and support service agencies, defines problems, initiates solutions, and coordinates administration of services to clients. For example, Ysleta ISD offered adult education services to more than 400 students in the Families of El Paso Program and collaborated with nine community agencies that offered services to some 8,100 participants. Ysleta facilities are available for use by community agencies and the program is open to assist any community agency in program development and implementation. El Paso ISD serves as the fiscal agent in an adult education cooperative for school districts in El Paso and Hudspeth Counties, except for the Ysleta and Socorro ISD which operate independent adult education programs and act as their own fiscal agents. All three programs serve the El Paso metropolitan population area. They coordinate with and draw upon many of the same volunteer, community, state, and local agencies. Some cooperative planning and common activities, such as staff development, occur at the initiative and agreement of the three program directors. No formal structure or procedure, however, ensures coordination and the effective use of human and financial resources to serve the needs of adults in the greater community.

Recommendation 21: Explore opportunities for additional cooperation with the El Paso and Socorro ISDs' adult education programs. IMPLEMENTATION STRATEGIES AND TIMELINE
1. The superintendent requests a meeting with his counterparts to discuss the potential for expanding adult services through cooperation.
September 1998
2. If the superintendents determine that opportunities exist, each directs appropriate staff to cooperate in the development of a recommended plan and timeline to accomplish the desired results.
October 1998
3. The coordinated staff consults with affected organizations and develops the recommended plan for submission to the superintendents.
January 1999
4. The superintendents approve the plan, with revisions as necessary, and obtain any board approvals that may be required. April 1999
5. The superintendent directs implementation of the plan. May 1999
FISCAL IMPACT This recommendation can be accomplished with available resources.

Chapter 2 EDUCATIONAL SERVICE DELIVERY AND PERFORMANCE MEASURES
F. Alternative Education
FINDING YISD operates a variety of alternative education programs (AEP). Dropout Recovery Centers (DRCs) offer students who have been unsuccessful in academics, nontraditional educational programs that provide for flexible scheduling and self-paced learning activities. The centers employ open enrollment and students are accepted from throughout the metropolitan area. Participants are screened, assessed, and admitted. The common thread is lack of success in previous academic efforts, which has resulted in their dropping out of school. Various other conditions, such as parenting, employment, and social and health problems, are prevalent in the student population. In 1993, the district obtained a waiver from TEA that allows it to count as full average daily attendance (ADA) two hours of on-site study at a DRC in a predominantly electronic curriculum and three hours of independent study either on- or off-site, for a total of at least 20 hours per week. This allows for flexible scheduling and generates a significant amount of revenue for the program. At the time of this review, it was unclear whether TEA would renew the waiver. Hours of operation vary from program to program, but 7:00 a.m. to 7:00 p.m. is typical. Each program is headed by a lead teacher supported by other teachers, interns, and instructional aides on a full or part-time basis as determined by the site. Tutors from the local university and the Private Industry Council also are used. The computerized curriculum is provided through Nova NET or Plato. The DRC staff members review the curriculum for each course to determine its adequacy. If the content and skills activities provided through the program are sufficient for award of credit, students can complete the courses on the computer. If there are deficiencies, extension activities are provided by the teacher who is to award credit. Students graduate by completing the required 22 credits and passing the exit- level TAAS. As an alternative, certain centers provide GED preparation. The Cesar Chavez Juvenile Justice Alternative Education Program (JJAEP) serves students who have been adjudicated in the juvenile court, expelled, or who are Texas Youth Commission residential placements. JJAEP optimum enrollment is currently 150, but will expand to 200 with the addition of portable buildings. However, actual placements usually exceed the maximum intended by YISD staff. As of November 21,

1997, 194 students were being served in the JJAEP. Instruction is provided by direct teaching personnel with Nova NET providing an additional electronic curriculum. Extended activities such as student council and yearbook club also are provided. Some JJAEP students have gained scholarships and entered college. YISD's Tejas School of Choice operates as a separate school with a maximum of 150 students. One hundred and three students were enrolled on November 21, 1997. The school operates year-round and observes traditional high school hours of operation. Students are admitted through an interview process and a parental commitment to observe the school's rules and standards of the school. Students are required to wear uniforms. The Tejas curriculum leads to a regular diploma that may be awarded from the student's original high school. Certified subject area teachers provide instruction, along with Nova NET. The Park View Middle School AEP is a separate school for grade 6-8 students whose conduct is sufficient for removal under section 37.006 of the Texas Education Code. Sixty-three students out of 100 available slots were enrolled on November 21, 1997. YISD's Academy of Science and Technology provides a teen parenting program. Students may transfer to the academy to receive comprehensive programs or may remain at their home schools and be served by two support teachers at those locations. Childcare is not provided by the district, but five YWCA caseworkers assist in locating appropriate placements for students' children and may contract with care providers. Two support teachers serve students at each high school and DRC location. TEA audited the district's DRC program in November 1996 with on-site visits to four schools. TEA made a number of recommendations that the district is implementing. YISD's four alternative education models provide opportunities for dropouts and other at-risk students to achieve academic success in nontraditional settings. The DRCs, Cesar Chavez, JJAEP, Tejas School of Choice, and Park View Middle School AEP are evidence of the district's aggressiveness in serving students who do not succeed in the traditional program. The open enrollment policy attracts students from the greater metropolitan area. Exhibit 2-33 summarizes YISD's alternative programs and their enrollment, TAAS passing rates, GED attainment, and graduating numbers.
Exhibit 2-33 YISD Alternative Schools
1996-97

School Location
Nov. 21, 1997 Enrollment
% Pass. TAAS
Number GED
High School Diploma
Cesar Chavez (JJAEP)
7814 Alameda
194 * * 38
Park View Middle (JJAEP)
8445 Alameda 63 (opened Fall 1997-98)
Tejas School of Choice (JJAEP) 7500 Alpha 103 * * 20
Dropout Recovery Centers
Accelerated Learning Academy
Ysleta High 136 29 33
Hanks Academy Hanks High 284 47 87
Jump Start Academy Eastwood High 80 41 41
New Directions Academy
Del Valle High
138 53 20 70
Phoenix Academy Parkland High
165 39 56
Plato Academy Riverside High 151 41 59
* First time data will be available for the 1997-98 school year. Source: Division of Instruction. COMMENDATION YISD's alternative education programs provide noteworthy opportunities for at-risk students. FINDING As with traditional schools, DRCs function with a site-based decision-making model. Each has chosen a computer-based courseware system, Nova NET or Plato, as the base for its curriculum. Teachers have reviewed the electronic curricula in light of specific course expectations to identify their deficiencies. At some DRCs teachers responsible for the subject area or course, develop activities to supplement the courseware, such as reading reports and assessments. These activities are provided through direct instruction

so that all course requirements are met before credit is awarded. Each teacher has a file describing the supplemental requirements for each course, which vary among DRCs. Other DRCs use departmental committees to develop supplemental activities. YISD has no procedure to assure the consistency of performance requirements on supplemental activities for the same course. Moreover, the documentation of supplemental activities varies from comprehensive to limited and sketchy. Several school personnel interviewed said that certain regular program teachers questioned the quality of requirements for the award of credit. Recommendation 22: Evaluate, and modify as necessary, supplemental curriculum requirements and activities to ensure that credits are awarded with consistent rigor and quality among DRCs. IMPLEMENTATION STRATEGIES AND TIMELINE
1. The assistant superintendent for Instruction establishes a committee consisting of central office curriculum specialist in the subject areas where credit is offered, campus department heads, and DRC subject area teachers.
May 1998
2. The committee is divided into subject area subcommittees chaired by the central office specialist and directed to establish standard requirements for all courses to be awarded credit and criteria and procedures to evaluate activities used to supplement the computerized curriculum.
June 1988
3. Each subcommittee develops standards, procedures, and criteria and uses them to evaluate each DRC's curriculum requirements and activities.
June 1998
4. Subcommittee recommendations are reviewed by the committee, which directs each DRC to make necessary changes to assure rigor and quality for the award of credit.
July 1998
5. DRC subject area teachers complete recommended changes. August 1998
FISCAL IMPACT To implement this recommendation, 20 committee members would spend 10 additional days (four per subject area in English language arts, social studies, science and mathematics and four at the discretion of the assistant superintendent) at the teacher's average daily rate of $160.35.
Recommendation 1998-99 1999- 2000- 2001- 2002-
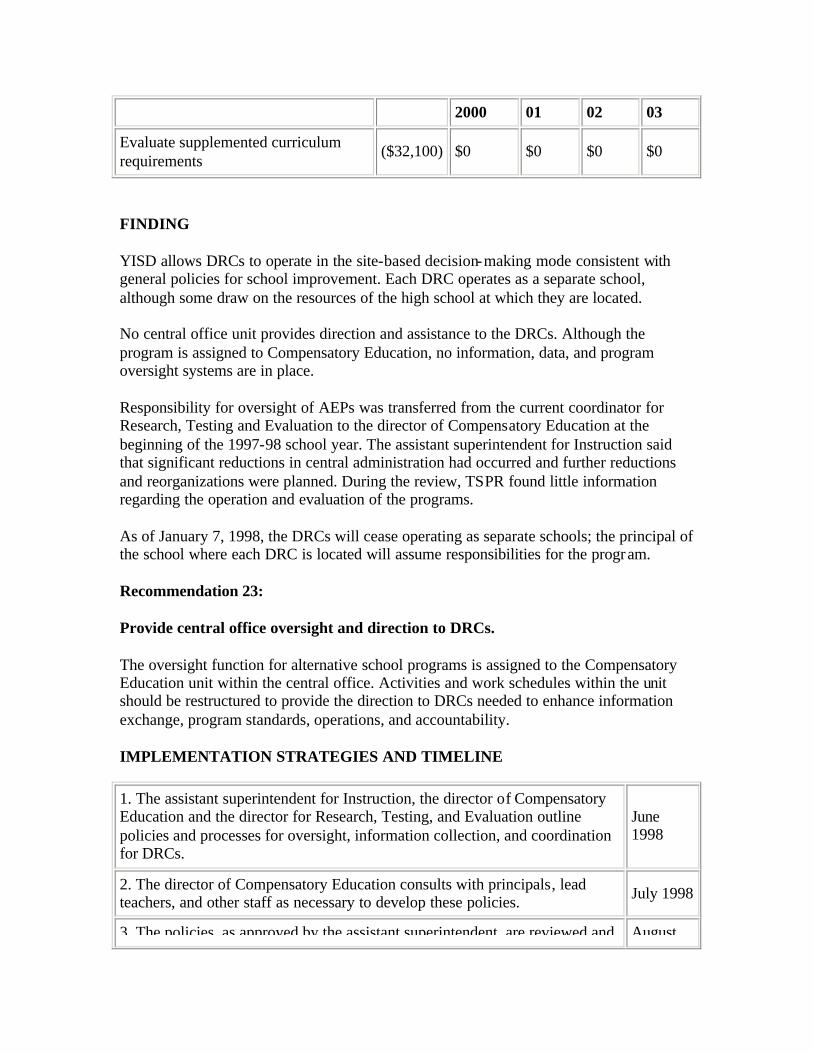
2000 01 02 03
Evaluate supplemented curriculum requirements
($32,100) $0 $0 $0 $0
FINDING YISD allows DRCs to operate in the site-based decision-making mode consistent with general policies for school improvement. Each DRC operates as a separate school, although some draw on the resources of the high school at which they are located. No central office unit provides direction and assistance to the DRCs. Although the program is assigned to Compensatory Education, no information, data, and program oversight systems are in place. Responsibility for oversight of AEPs was transferred from the current coordinator for Research, Testing and Evaluation to the director of Compensatory Education at the beginning of the 1997-98 school year. The assistant superintendent for Instruction said that significant reductions in central administration had occurred and further reductions and reorganizations were planned. During the review, TSPR found little information regarding the operation and evaluation of the programs. As of January 7, 1998, the DRCs will cease operating as separate schools; the principal of the school where each DRC is located will assume responsibilities for the program. Recommendation 23: Provide central office oversight and direction to DRCs. The oversight function for alternative school programs is assigned to the Compensatory Education unit within the central office. Activities and work schedules within the unit should be restructured to provide the direction to DRCs needed to enhance information exchange, program standards, operations, and accountability. IMPLEMENTATION STRATEGIES AND TIMELINE
1. The assistant superintendent for Instruction, the director of Compensatory Education and the director for Research, Testing, and Evaluation outline policies and processes for oversight, information collection, and coordination for DRCs.
June 1998
2. The director of Compensatory Education consults with principals, lead teachers, and other staff as necessary to develop these policies. July 1998
3. The policies, as approved by the assistant superintendent, are reviewed and August

approved by the superintendent. 1998
4. The director of Compensatory Education should provide ongoing oversight and coordination.
Ongoing
FISCAL IMPACT This recommendation can be accomplished with existing resources.

Chapter 2 EDUCATIONAL SERVICE DELIVERY AND PERFORMANCE MEASURES G. Compensatory Education/Bilingual Education
CURRENT SITUATION Compensatory Education YISD has developed and implemented a compensatory education program that provides a broad range of services to students based upon their particular needs. The district uses two major funding sources, Elementary and Secondary Education Act (ESEA) Title I (Title I) and State Compensatory Education (SCE), as its base for funding this program, but also combines other revenue sources to support it. The major compensatory education allotments are shown in Exhibit 2-34.
Exhibit 2-34 Projected Compensatory Education Allotments
1997-98 School Year
Source Amount Major Component
SCE $18,282,453 Instructional Personnel Guidance & Counseling Instructional Materials & Services
ESEA Title I $11,821,900 Instructional Personnel Professional Development Instructional Materials & Services
ESEA Title VI $335,200 Discretionary Grants
ESEA Title I Migrant $84,000 Recruiters Summer Program
Source: Division of Instruction. YISD uses its compensatory education resources to provide programs and services that supplement and enhance its regular programs. Program decisions are school-based; the categories of programs provided are shown in Exhibit 2-35.
Exhibit 2-35 Compensatory Education Program

Source: Division of Instruction. * ESOL - English for Speakers of Other Languages; SAC - Special Assignment Class Bilingual Education Chapter 29 of the Texas Education Code requires YISD to provide bilingual education in kindergarten through elementary grades; bilingual education, English as a second language (ESL), or other transitional language

instruction approved by TEA in post-elementary through grade 8; and instruction in ESL for grades 9-12. The law prescribes required components of these programs, including programming and curriculum, and student identification, assessment, and classification. Of YISD's 46,879 students in 1996-97, 9,798 were identified as Limited English Proficient (LEP). About 40 percent of those spoke little or no English. Spanish is the primary language of the LEP population. YISD had 1,028 recent immigrants enrolled as of December 1, 1997, almost all of whom spoke little or no English upon enrollment. The district's five-year District Improvement Plan (DIP) includes the following vision statement:
All students who enroll in our schools will graduate from high school fluently bilingual and prepared to enter a four-year college or university.
The DIP dictates districtwide implementation of two-way dual language programs in the next five years. All 33 elementary, 10 middle, and seven high schools will implement a "school within a school" to enable students to become bilingual. The multi- language Alicia R. Chacon International School will develop a program at the sixth-grade level. Beginning with the 1995-96 school year, YISD received an ESEA Title VII grant for a program called Project Mariposa. The $3.6 million grant extends through the 1999-2000 school year. Project Mariposa is designed to restructure the traditional bilingual education program so that students stay in the program for at least five years. Two modules provided under Project Mariposa are "late exit" and "dual language." Both modules include evaluation components to determine their effectiveness. As a result, YISD's Bilingual Education program is in transition. FINDING Federal Title I and SCE funds are provided to schools based on the number of students eligible for free and reduced-price lunches. These funds are used to provide additional teachers, materials, training, and other services. The YISD central office uses about $1 million of these funds each year for purposes such as private school allotments, indirect costs, and discretionary instructional personnel assigned to schools. Each school then receives a per-capita allotment for budgetary planning. YISD's Budgeting: 1997-98 Instructional Manual describes the purpose of the program, permissible and impermissible expenditures, and per-capita allotments for eligible children. The amounts for 1997-98 are shown in Exhibit 2-36.
Exhibit 2-36 Per Capita Allotments for State Compensatory Education and Title I
Source Type of Student Rate
SCE Disadvantaged $125.00
At-Risk $125.00
Pregnant Student $4,712.00

Title I Prekindergarten $500.00
Schoolwide and Targeted Assistance $250.00
Source: Budgeting 1997-98 Instructional Manual. The higher allotments for teen pregnancy and parenting and pre-kindergarten students reflect district priorities. All but three YISD schools are classified as schoolwide projects for Title I purposes. Schoolwide project schools have an economically disadvantaged population, as determined by free and reduced-price lunch participation, of at least 50 percent. This designation allows funds to be used for general school improvement purposes provided that certain requirements are met. Each project has a written plan integrated into the school improvement plan that includes regular education, instruction, special program planning, instructional support, and school improvement with a required amount of community involvement. This approach provides that the planning and budgeting of federal Title I dollars is an integral part, and not separate from, the school strategy for raising TAAS scores. Two schools, Hanks and Eastwood High Schools, are ineligible for Title I services. Tierra Del Sol Elementary is classified as a "targeted assistance" school, a category requiring direct services to be provided to a limited number of eligible students. Targeted assistance schools receive the same allotment per student as schoolwide projects and their services are part of the school improvement plan. Title I services are not extended to students other than those who are identified. The district has submitted a waiver request to TEA that is scheduled for consideration by the state's Ed Flex Committee in May 1998. The request is for approval of three Title 1 targeted assistance schools to implement schoolwide programs that provide services to all students. The three schools are Tierra del Sol Elementary, Desert View Middle, and Indian Ridge Middle. Two other schools, Eastwood High School and Hanks High School, are not currently eligible for Title 1, but will qualify for schoolwide projects beginning in 1998-99. These two actions will result in every school in YISD operating a schoolwide model providing for comprehensive school support with the start of the 1998-99 school year. Two important factors, student academic performance and increasing financial resources, provide a rationale for operating schoolwide model programs. First, all YISD student groups included in the state accountability system have increased performance on the TAAS significantly since 1994. However, tenth-grade exit- level mathematics results from the district's African-American students lag behind the current district average. Two-thirds of the district's high school African-American students are enrolled at Eastwood High School and Hanks High School. Title 1 resources will be used to support the instructional program for this student group. Second, schoolwide allocations will increase in 1998-99 by $25, from $250 per student to $275 at all schools (Pre-K from $500 to $525). YISD has implemented a site-based budgeting procedure which gives the principal and staff at each school full authority to determine how Tit le I and SCE funds are used. Student performance targets are set and funds are allotted to each school on a per-capita basis for eligible students. Schools determine how the funds will be spent, within the law's requirements, to attain the targets. All but three schools are Title I schoolwide projects and the funds can be spent for general school improvements. Title I and SCE funds are not identifiable as separate programs, but are fully integrated into the plan and budget. The significant increase in student performance on TAAS has occurred under this site-based budgeting procedure. COMMENDATION

SCE and Title I compensatory education funding are effectively integrated into the school planning, budgeting, and operating process and are focused on improving student performance on TAAS. FINDING YISD has established comprehensive procedures for collecting and analyzing data for program evaluations. Examples of such data collection and analysis are found in the "Project Mariposa External Evaluation Report" and "Accountability Through Limited English Proficient (LEP) Data Analysis for Principals - 1996-97" developed by the Bilingual Education/English as a Second Language Department. These reports provide summary information by grade level, school, and district regarding Language Assessment Scale (LAS) results and TAAS performance. One example of detailed analysis is the district's identification of LEP students who are considered in the "danger zone." Such analysis is provided to principals and other affected personnel in the "Accountability through LEP Data Analysis for Principals 1996-97 report." "Danger-zone" students are those who have not progressed in oral English proficiency, as measured on the LAS five- level scale (with level one representing no proficiency and level five representing proficiency). The criteria are that students:
• have been in school for three years and are still at level 1 or the LAS oral; • have been in school for four years and are still at level 1 or 2 on the LAS oral; or • have been in school for five or more years and are still at level 1, 2 or 3 on the LAS oral.
These data are provided to principals and teachers to identify those students whose progress is below expectations. Teachers then use this information for instructional purposes to revise teaching strategies and to use additional assessments for identified danger-zone students. COMMENDATION YISD's data collection and analysis procedures for program evaluation appropriately track the entry, progress, and exit of students. FINDING In Fall 1995, YISD established a comprehensive multilingual education program at the Alicia Chacon International School. The program primarily focuses on multi- language proficiency and cultural development. Languages offered at the school include: German, Japanese, Mandarin Chinese, Russian, and Spanish. The Alicia Chacon International School received a "Recognized" TEA accountability rating during the 1996-97 school year. On average during 1997-98, the school served 550 students in grades K-5. In 1998-99, the school plans to grow to 680 students and accommodate grade 6. Most students enter Alicia Chacon School in kindergarten. Students are selected for the Alicia Chacon School through a random lottery process whereby school administrators choose 110 names from a pool of over 300 applicants. Additionally, about 25 slots are also made available each year for siblings of students who have already been accepted into the program.

The school's basic programs are English and Spanish literacy, with a mix of about 50 percent of the students having English as their dominant language and the other 50 percent having Spanish as their dominant language. For example, a student whose dominant language is English spends 90 percent of the day learning Spanish and 10 percent of the day is spent mastering a third language-either German, Japanese, Mandarin Chinese, or Russian. Parents of those students enrolled in the school are expected to share responsibility for the education process. This is accomplished through parental volunteer requirements which include:
• attending workshops • assisting on field trips • serving on committees • participating in student study groups
Exit-level student goals for the program include:
• high levels of proficiency in the students' first and second language; • functional skills in a third language of the student's choice; • academic performance at or above grade level; • expanded vocabulary skills through study of Latin word origins; • appreciation of other people and cultures; and, • high level of motivation and perception of the students own academic competence.
COMMENDATION YISD has enhanced its bilingual education program by establishing a school starting at primary grade levels that focuses on multi-language proficiency, cultural development, parental participation, and high academic achievement. FINDING YISD has a stated goal that all its schools should be classified as exemplary by TEA by achieving a 90 percent passing rate on TAAS. The district has made significant progress toward this goal, with two schools rated as exemplary and 22 rated as recognized. Results of the 1996 and 1997 assessments for grades 3 and 4 on the Spanish and English form of TAAS are shown in Exhibit 2-37.
Exhibit 2-37 Percentage Passing TAAS Spanish and English Form
1996 and 1997 (Non-Special Education)
Grade 3 Grade 4
TAAS Year Number Percent Reading
Percent Mathematics Number
Percent Reading
Percent Mathematics
1996 1,026 59 64 702 52 61

Spanish
1997 1,158 63 74 893 53 76
1996 1,899 81 82 2,394 75 78
English
1997 1,835 81 82 2,062 83 87
Source: 1997 TAAS Performance Results and Ratings. These data show improvement on the Spanish version from 1996 to 1997 in mathematics, but limited gains in reading. In third grade reading for 1996, 1,026 students (59 percent) passed while, in 1997, just 893 students in fourth grade did so, achieving a passing rate of 53 percent; most of these were third graders assessed the prior year. The fourth grade Spanish passing rate was 30 percentage points below the passing rate for English reading and 18 points below grade 3. Project Mariposa represents a revised comprehensive approach to Bilingual Education, addressing all required components of the law. Although the program is comprehensive, documents reviewed and interviews with school personnel do not demonstrate the same levels of emphasis of the program for Spanish TAAS achievement as English TAAS achievement. Recommendation 24: Direct the Bilingual Education programs to focus on producing LEP student achievement on Spanish TAAS objectives similar to results on English-language TAAS tests. IMPLEMENTATION STRATEGIES AND TIMELINE
1. The director of Bilingual Education, in conjunction with the director of Assessment and additional personnel including principals and teachers, serve as a committee to revise documents to explicitly identify student performance on TAAS as a primary focus of the program and set out a plan to achieve desired results.
May 1998
2. The assistant superintendent for Instruction modifies the plans if necessary and presents it to the superintendent's cabinet for review and approval.
June 1998
3. The director of Bilingual Education modifies Title VII documents as necessary. June 1998
4. The assistant superintendent for Instruction and director of Bilingual Education meet with principals, Bilingual Education central office staff, evaluation employees, and other affected personnel to discuss the new policy and procedures and to emphasize the importance of TAAS performance.
July 1998
5. Implement the plan. August 1998

FISCAL IMPACT This recommendation can be accomplished with no additional cost to the program. FINDING The two Bilingual Education models are "late exit," a transitional program from Spanish to English for LEP students, and "dual language," a program to develop proficiency in both languages for classes of 50 percent English and 50 percent Spanish-speaking students. Standards for relative time spent in instruction in English and instruction in Spanish are prescribed (Exhibit 2-38).
Exhibit 2-38 Percentage of Day to be Spent
in English and Spanish by Grade
Source: YISD Bilingual Education/ESL Department. Interviews with principals indicated that the above time standard applies to both models. However, a number of school personnel question the efficacy of these time allotments and said that they are not universally followed. One principal said the central office has given him flexibility with the time standards. The Bilingual Education/ESL Department has technical staff members, six of which are funded by Title VII, to provide program support, training, and monitoring. The personnel perform school monitoring visits at the request of principals to compare actual program operation with program design and to provide technical assistance. Between March 8, 1996 and October 28, 1997 these employees conducted eight visits at five different schools. Recommendation 25: Establish an ongoing monitoring schedule with department staff, in addition to the requested monitoring visits, to ensure adherence to Bilingual Education guidelines.

All schools and teachers should adhere to time standards and other guidelines for operation, since deviation from such standards and guidelines renders program evaluations questionable. Effective monitoring is necessary to ensure that the program is implemented as designed. If the program design grants latitude to teachers and schools, then such monitoring is not critical; however, TSPR's review did not find that such latitude was intended in this case. IMPLEMENTATION STRATEGIES AND TIMELINES
1. The director of Bilingual Education and assistant superintendent for Instruction determine the specific guidelines for use of each language in the two models.
June 1998
2. The director of Bilingual Education revises documents, as may be necessary, to reflect time requirements, or the flexibility that may be allowed.
June 1998
3. The director of Bilingual Education establishes a monitoring schedule for all schools using department staff.
June 1998
4. The director of Bilingual Education meets with affected school personnel to provide training on the program design.
July 1998
5. Change agents monitor as scheduled and as requested by principals to ensure consistency of program operation.
August 1998
FISCAL IMPACT This recommendation can be implemented with existing resources. FINDING Project Mariposa's strategic operational plan and other documents provide for professional development activities for teacher and intern training. The district is conducting training that is designed to address the TAAS objectives, yet activities explicitly designed to help teachers address specific objectives of TAAS have not resulted in acceptable student performance. Recommendation 26: Seek out additional professional development activities for principals and teachers designed to significantly increase student performance on the Spanish TAAS. IMPLEMENTATION STRATEGIES AND TIMELINE
1. The director of Bilingual Education revises plans for professional development provided through the Project Mariposa grant, state bilingual aid and other relevant funds to emphasize increasing student performance on the Spanish TAAS.
June 1998
2. The professional development for Bilingual Educational personnel are conducted with emphasis on Ongoing

Spanish TAAS results.
FISCAL IMPACT This recommendation can be accomplished through existing training days without additional costs to the district.

Chapter 2 EDUCATIONAL SERVICE DELIVERY AND PERFORMANCE MEASURES H. Guidance and Counseling CURRENT SITUATION The Texas Education Code, Subchapter A, Chapter 33, establishes requirements for school district counseling services. Major provisions include:
• A district shall employ at least one certified counselor for every 500 students.
• The board shall adopt guidelines to ensure written consent is obtained from the parent, legal guardian, or person entitled to enroll the student for the student to participate in those activities for which the district requires parental consent.
• Each school shall conduct a preview of material used in the program annually; counselors shall work with faculty, staff, students, parents, and community to plan, implement, and evaluate the program, which includes:
1) a curriculum to develop full educational potential; 2) intervention needed for educational, career, personal, or social development; 3) individual planning systems for education, career, personal, and social development; and 4) support for teacher, staff, parents, and other members of the community to promote educational, career, personal, and social development.
TEC Section 33.006 describes the responsibility of the school counselor: "... to fully develop each student's academic, career, personal and social abilities." The statute gives specific direction to the district's guidance and counseling program. The district has flexibility with regard to the assignment, training, and funding of counseling personne l, but must ensure that students are provided effective academic, career, personal, and social development counseling services. YISD provides guidance services through certified counselors in sufficient numbers to meet the requirements of the law. Personnel are funded from various sources, with State Compensatory Education (SCE) providing $2,298,370 in 1997-98, to focus on low-income and at-risk students. Each elementary school have one assigned counselor and secondary schools are assigned counselors based on student population. Each high school

is assigned one vocational counselor. FINDING YISD has established an ambitious goal that every student who graduates will be fluent in English and Spanish and will be prepared to enter a four-year college. To that end, the board has increased graduation requirements to include Algebra II and Physics, a rigorous academic expectation for all students. In addition, the district has committed itself to providing opportunities for students to develop employment skills. While the district has realized commendable results in improving its TAAS passing rates, academic indicators suggest that the district has a long way to go toward accomplishing its ultimate goals. For example, only 17 percent of the students who took the 1997 Algebra I end-of-course test passed. The 1997 grade 10 TAAS for math produced a 62 percent passing rate; the reading passing rate was 83 percent. YISD's current counseling activities are determined by individual counselors. On-site direction and supervision of counselors is the responsibility of each principal, with minimal guidance from the central office. Consequently, the academic and career components of the guidance and counseling program required by state law are not consistently applied. A document called "Counselor Accountability," released in July 1997, was developed by YISD guidance personnel as a proposal to provide structure for the guidance and counseling program. However, the plan does not contain identifiable and specific relationships to the provisions of the law and particularly the four components of academic, career, personal, and social development. Moreover, TSPR found little evidence of accountability measures for academic and career counseling. The Performance Evaluation Form and Job Description included in the document were developed by TEA in conjunction with the Texas Counseling Association and Texas School Counselors Association. These job descriptions, along with other materials in the proposed document, attempt to outline a total guidance and counseling program. However, there is little specific direction on the "how to" and the "expected student outcomes" for academic and career components. Recommendation 27: Modify and adopt the proposed July 1997 "Counselor Accountability" document to provide greater emphasis on student service in academic and career counseling and professional development for counselors. IMPLEMENTATION STRATEGIES AND TIMELINES
1. The YISD committee that developed the "Counselor Accountability" document reconvenes to revise the proposed document and to develop a
August 1998

professional development plan and schedule.
2. The revised document is submitted to the assistant superintendent for Instruction for review.
October 1998
3. The revised document, as recommended by the assistant superintendent for Instruction, is adopted by the superintendent's cabinet.
October 1998
4. Copies of the document are distributed to counselors and principals at orientation and training in the revised approach to the counseling program.
November 1998
5. Principals, assisted by counselors, conduct orientation sessions for school personnel.
December 1998
6. Additional professional development is delivered to counselors as needed.
January 1999
FISCAL IMPACT This recommendation can be accomplished with existing resources.

Chapter 3 COMMUNITY INVOLVEMENT This chapter examines YISD's community involvement activities in five sections:
A. Parental Involvement and Community Relations
B. Internal and External Communications
C. Organization and Planning
D. Student Entrepreneur Center
E. Administrative Support Services
A district's community involvement activities fall into three broad areas: internal communications, external communications, and community outreach initiatives. Internal communications ensure that district employees and students are informed about and involved in school district activities. External communications ensure that parents, volunteers, community leaders, and businesses are informed about and involved in school district activities. Community outreach initiatives engage community members to contribute to and support the school district's activities. BACKGROUND A school district's community involvement programs and activities are highly visible to the public and affect the community's perceptions and support of the district. Effective community involvement relies on open and clear communication between the schools, district administration, and the community. Under site-based decision making (SBDM), YISD schools have broad responsibility for their own community involvement programs, resulting in a variety of programs and activities. The nature and effectiveness of these programs, however, varies between schools. Public input surveys conducted by the TSPR review team found that 67 percent of YISD community respondents know little or nothing about the district's programs and services. Although respondents believed that the district has solid relationships with community groups and that parents feel welcome in schools, they also are largely unaware of community involvement activities that are in place in the district. Satisfaction with community involvement programs varies by school and by community group. YISD spent $19 per student on community involvement-related functions in the 1996-97

school year based on expenditures reported to the Public Education Information Management System (PEIMS) (Exhibit 3-1). YISD had the third-lowest spending level for community involvement activities among its peer districts.
Exhibit 3-1 Community Involvement Spending
YISD Versus Peer Districts 1996-97
District Community Involvement Spending ($ per student)
San Antonio ISD $69
Austin ISD $55
Dallas ISD $51
Fort Worth ISD $30
Socorro ISD $27
Ysleta ISD $19
Houston ISD $11
El Paso ISD $5
Corpus Christi ISD Not reported
Source: Micro Benchmarks, Texas Association of School Boards.

Chapter 3 COMMUNITY INVOLVEMENT A. Parental Involvement and Community Relations
BACKGROUND Parental involvement and community involvement activities at YISD take place largely at the school level. Parental involvement is typically stronger at elementary schools, while interest and participation drop off at the middle and high school levels. Although the TSPR team requested information on parental involvement and community activities taking place at all schools, no comprehensive list exists in the district. Exhibit 3-2 shows some sample parental involvement programs identified by the district that were reported by select elementary and secondary schools.
Exhibit 3-2 YISD Parent Involvement Programs
Select Elementary and Secondary Schools 1996-97
School Program Title Program Features
Elementary Schools
Cedar Grove Elementary
Family Math Night Literacy workshop
Tutoring for entire family in mathematics. Teaches parents to read and write.
Edgemere Elementary Parenting Class
Parents can conference with teachers, counselors, and other providers on parenting issues.
Edgemere Elementary Ready To Be Ready
Parents of children up to age 3 are encouraged to begin the education process while learning prevention techniques.
LeBarron Park Elementary
Adult and student basketball teams
After school program targeted to at-risk children.
Mission Valley Elementary
Adult Literacy English as a Second Language (ESL), reading, General Equivalency Diploma (GED) classes, and computer classes.
Pebble Hills Elementary
Parent TAAS Meeting Understanding the importance of the TAAS test and how parents can assist

their children to prepare for the test.
Pebble Hills Elementary Ready to be Ready
Parents of children up to age 3 are encouraged to begin the education process while learning prevention techniques.
Presa Elementary Parent Literacy ESL and reading taught by ESL teachers.
Scotsdale Elementary Family Read-a-Thons Parents and children reading together.
Secondary Schools
Riverside Middle
Parenting classes Parents receive assistance with computer training, ESL, and health and nutrition issues.
Ysleta Middle ESL and GED classes and adult basketball/soccer league
ESL and GED preparation classes provided to parents. Parents participate on basketball and soccer teams, using school facilities.
Del Valle High Adult computer class, parent support group, parental job skills training
Parents learn computer and job skills. Parent support groups provided for drug and alcohol problems, unemployment issues, and gang awareness.
Source: YISD Media Relations/Partners-In-Education Department. Strong volunteer participation in select elementary and secondary schools has been recognized during the past three years at the schools listed in Exhibit 3-3.
Exhibit 3-3 YISD Volunteer Participation
Elementary and Secondary Schools
School Volunteer Award 1994-1995
Volunteer Award 1995-1996
Volunteer Award 1996-1997
Elementary Schools
East Point Elementary X
Hacienda Heights Elementary X

LeBarron Park Elementary X X
Mission Valley Elementary X X X
Parkland Elementary X
Sageland Elementary X
Thomas Manor Elementary
X
Vista Hills Elementary X
Ysleta Elementary X X X
Alicia R. Chacon Intn'l Language School X
Ysleta Pre-K Center X X X
Secondary Schools
Camino Real Middle X
Eastwood Middle X X
Hillcrest Middle X
Ranchland Hills Middle X
Valley View Middle X
Bel Air High X X X
J. M. Hanks High X X X
Source: YISD Volunteer Department. FINDING YISD's tuition-free summer school program, which includes a mandatory parental component, was the first program of its kind in the state. The program, which began in the 1991-92 school year, requires parents to participate in the summer school program for two hours each week for each child in the program. In addition to academic programs, parents participate in such activities as theatrical productions, lectures, and computer programs. The total cost of the summer school program averages $3 million annually. In 1990-91, the last year of the traditional summer school program, the program had an enrollment of 7,734 students. In 1991-92, the first year of the tuition-free summer parental involvement program, 15,016 students took remedial and enrichment courses.

Some 5,401 parent surveys were turned in at the end of the first summer school session, indicating a high rate of participation and satisfaction with the program. District personnel developed a large resource manual of guest speakers, videotapes, and activities on a number of issues of interest to parents. Computer labs were opened for parents at many YISD middle and high schools. In 1997, the district's summer school program included special programs and events to enhance the participation of parents in their children's education. For example, more than 11,000 parents participated in the El Paso outdoor pageant theater "Viva El Paso." In addition, 1,460 parents attended a field trip to the University of Texas at El Paso; 615 visited the facilities of El Paso Community College. The success of the summer school program has prompted the state to fund similar summer school programs throughout the state. COMMENDATION YISD's summer school program effectively increases the level of parental involvement. FINDING YISD supports school volunteer efforts with a strong training program. Every school has a training program for volunteers; both existing and new volunteers attend the program to learn about volunteer opportunities and any recent changes in district policies or procedures. In addition, volunteer coordinators at each school are trained to be able to orient additional volunteers who join the program after the annual district orientation session. In this way, both old and new volunteers can interact and learn how they can best meet the district's needs, and what types of support they can expect from the district. The volunteer orientation session covers information contained in a comprehensive handbook, Opening the Door to Volunteering, which is given to every participant at the orientation. This brochure contains information in both English and Spanish, which increases support from all segments of the YISD community. The handbook contains welcoming messages from the superintendent and board president that thank volunteers for their contributions to the district. The handbook provides clear information on topics including:
• volunteer goals and responsibility to students.
• volunteer guidelines.
• policies and procedures.

• the roles of volunteers, school volunteer coordinators, teachers, and principals.
• identification and response to suspected cases of child abuse.
• volunteer job categories and descriptions.
The message given to volunteers is that their efforts are valued and vital to the students' ultimate success. The handbook contains a quote emphasizing the importance of the volunteers' efforts:
"A hundred years from now it will not matter what my bank account was, the sort of house I lived in, or the kind of clothes I wore but the world may be different because I was important in the life of a child."
COMMENDATION YISD effectively supports its schools' volunteer programs by providing a comprehensive training program and orientation in every school. FINDING YISD allows its district administration building and other facilities to be used for various after-school and weekend programs. Providing this facility to community groups after school provides some additional revenue and serves to raise awareness of the district's programs and increase the general level of community involvement. During after-school hours and weekends, the administration building is used about 75 percent of the time by community groups and about 25 percent by district groups for programs and extracurricular events. Use of the building by community groups raised about $7,000 for the district during 1996-97. Several groups, including Ballet Folklorico, various church groups, area colleges, and a support group use the building. Another example of effective joint facility use is the agreement between YISD and the El Paso Parks and Recreation Department. Parks and Recreation cooperates with the district to share facilities in several ways. First, the district is funding conversion of city property (a swampy area next to Lancaster Elementary School) into a recreational facility for use by the school and the community. Del Valle High School's basketball and tennis courts and baseball field are open for community use during non-school hours; the city pays the lighting costs of these facilities. Finally, during the summer, many of the district's physical education facilities are open for community use. COMMENDATION YISD allows the community to use its facilities after school hours.

FINDING YISD's Community Outreach program is an after-school basketball program for elementary school students in fourth, fifth, and sixth grades in 19 YISD schools. When federal funding for drug prevention programs was cut, the Community Outreach program provided an alternative activity to keep students busy after school. The program's long-range objective is to assist students who are involved in sports to obtain athletic scholarships and develop an early interest in college- level sports. The program is funded through the Kiwanis Club and a federal grant from Drug-Free Schools and Communities. It has had broad appeal to both YISD students and parents. COMMENDATION The Community Outreach program offers fourth, fifth, and sixth grade students an alternative extracurricular program. FINDING YISD's business partnership and mentoring program, Partners-In-Education, matches volunteers from businesses and civic and political organizations with a school to provide tutoring, mentoring, apprenticeship, and on-site classes at various business locations. In addition, some partners assist their schools through monetary or in-kind donations or by developing curriculum-related programs. For example, Rockwell sends engineers to Mesa Vista Elementary School to perform mathematics and science demonstrations. These partnerships are initiated both by individual schools and at the district level. If a business expresses interest in becoming a partner, the Media Relations/Partners-in-Education Department assesses its resources against school needs and matches the business with an appropriate school. Partnerships are formalized through signed agreements outlining specific activities agreed to by each party. Each school reports its total number of partners to the district at the end of the year. Every elementary school has at least one partner and many have multiple partners. At the secondary school level, about two-thirds of schools have business partners. Based on interviews with the National Partners- in-Education Association, this level of participation compares favorably with state averages, although the association does not track specific school statistics. Exhibit 3-4 and Exhibit 3-5 detail YISD's business partnerships by elementary and secondary schools respectively.
Exhibit 3-4 YISD Business Partnerships
Elementary Schools and Pre-K Centers 1996-97 School Year

School
Number of Business partners/ mentors School
Number of Business partners/ mentors
Alicia R. Chicon Intn'l
1 Mesa Vista Elementary
11
Ascarate Elementary 4 Mission Valley Elementary 4
Cadwallader Elementary 3 North Loop
Elementary 5/26
Capistrano Elementary 2 Parkland
Elementary 5
Cedar Grove Elementary
4 Pasodale Elementary
3
Del Norte Heights Elementary
2 Pebble Hills Elementary
4
Desertaire Elementary 5/3 Presa Elementary 1
Dolphin Terrace Elementary 2 Ramona
Elementary 4/9
East Point Elementary 5 Sageland
Elementary 3
Eastwood Heights Elementary
3 Scotsdale Elementary
3
Eastwood Knolls Elementary
3 South Loop Elementary
4/11
Edgemere Elementary 4 Thomas Manor
Elementary 4
Glen Cove Elementary 1 Tierra Del Sol
Elementary 3
Hacienda Heights Elementary 10/25 Vista Hills
Elementary 4
Lancaster Elementary
3 Ysleta Elementary 4
LeBarron Park Elementary
1 Prado Pre-K Center
1

Loma Terrace Elementary 4 Robert F. Kennedy
Pre-K 6
Marian Manor Elementary 4/6 Ysleta Pre-K
Center 2
Total Number of business partners/mentors: 132/80
Source: YISD Media Relations/Partners-in-Education Department.
Exhibit 3-5 YISD Business Partnerships
Secondary Schools 1996-97 School Year
School
Number of Business partners/ mentors School
Number of Business partners/ mentors
Camino Real Middle 4/7 Del Valle High 6
Cesar Chavez 8 Eastwood High 4
Desert View Middle 2 J. M. Hanks High 4
Eastwood Middle 2 Parkland High 1
Hillcrest Middle 2 Riverside High 4
Indian Ridge Middle 3 Ysleta High 5
Parkland Middle 6 Academy of Science and Technology 7
Pasodale Middle 3 Bel Air Center for Health Professions
5
Ranchland Hills Middle
2 Sageland Microsociety 1
Riverside Middle 4 Special Program 22
Valley View Middle 4 Student Entrepreneur
Center 1

Ysleta Middle 3 Tejas School of Choice 1
Bel Air High 9
Total Number of business partners/mentors: 113/7
Source: YISD Media Relations/Partners-in-Education Department. COMMENDATION The Partners-In-Education program has effectively established business partnerships for almost every YISD school. FINDING YISD does not consistently track its community involvement programs, making it difficult to communicate lessons learned and share successful programs with other schools. For example, the district relies on its schools to maintain information on its parental involvement programs. TSPR requested information on parental involvement programs from all district schools; only 10 out of 60 provided the requested information. Some stated that the information would need to be compiled before it could be submitted. Maintaining a list of ongoing activities, current participants, and additional needs is critical if parent and community vo lunteers are to be used effectively. In addition, information provided by the schools is not always accurate. The district gives schools an award based on the number of volunteer hours they log (Exhibit 3-3). TSPR found, however, that the logged hours include only those that both the school and the volunteers choose to report. As a result, the actual number of volunteer hours may be considerably higher than what is reported since some volunteers and schools do not consistently report this information to the district. Recommendation 28: Establish a clearinghouse of successful community involvement programs. All school community involvement activities should be tracked and reported centrally. By acting as a clearinghouse of ideas for successful community involvement programs, the district could boost community participation at each school and encourage greater interaction among the schools themselves. In this way, the Public Outreach and Media Relations/Partners- in-Education departments could better support schools' efforts to increase community involvement by offering resources, suggestions, and action plans for boosting community participation. IMPLEMENTATION STRATEGIES AND TIMELINE
1. The superintendent directs the associate superintendent for Curriculum and Instruction and the interim coordinator of Media Relations/Partners-in-
June 1998

Education to establish procedures for each school to report community involvement activities, and to establish a central resource and clearinghouse of best practices.
2. The associate superintendent for Curriculum and Instruction and the interim coordinator of Media Relations/Partners- in-Education communicate these ideas to appropriate departments within the Division of Instruction and to all schools and district staff to provide technical assistance to each school to enhance their performance.
August 1998
FISCAL IMPACT This recommendation can be accomplished with existing resources.

Chapter 3 COMMUNITY INVOLVEMENT B. Internal and External Communications
CURRENT SITUATION YISD seeks community support for its programs and ventures through newsletters, press releases, brochures, and promotional materials. YISD's communications are directed to its employees, community leaders, area businesses, news media, parents, volunteers, and the El Paso community at large. FINDING One of YISD's vehicles for reaching community members is Ysleta Reports, a monthly newspaper. The paper's 20,000 copies are distributed to students and employees at all elementary, middle, and high schools and the adult learning center. Distribution also includes many areas of the YISD community including two large shopping malls, YMCA and YWCA facilities, real estate offices, city and county offices, police stations, and libraries. In addition, about 1,000 copies each month are mailed to key members of the civic and business communities. The newspaper is printed at a cost per issue of $4,000. The paper is partially self-supporting with paid advertising of approximately $1,800 per issue. Ysleta Reports uses outside resources such as freelance photographers and design layout and graphics specialists. Key articles are printed in both English and Spanish. The interim coordinator of Media Relations/Partners-in-Education acts as editor with reporting assistance from students, parents, teachers, and other school staff members who are asked by the principal to submit story ideas and articles for publication. YISD held a workshop led by media representatives in October 1997 that trained more than 70 persons to work on the newspaper. COMMENDATION Ysleta Reports provides a valuable learning opportunity for students, parents, and district staff while reaching a wide audience. FINDING As is the case with parent involvement and community activities, many internal and external communication efforts occur at the department and campus levels. A sample listing of the types of print media and brochures used by YISD to communicate with various community constituents is shown in Exhibit 3-6.
Exhibit 3-6 YISD Publications by Audience

Name of Publication Target Audience
Ysleta Reports General community
YISD Calendar General community
Opening the Door to Volunteering Volunteers
Como Se Dice? (Common words and phrases used by educators and their Spanish translation). General community
YISD's Mentoring Program Businesses
Expanding the Classroom through Partnerships Businesses
Multilingual Magnet School Parents and general community
Communications Magnet School Parents and general community
A Slice of the Ysleta P.I.E. General community
Source: YISD Public Outreach and Media Relations/Partners-in-Education departments. In addition, the Public Outreach Department and other district departments disseminate other critical information to both internal and external audiences. YISD uses a variety of media to reach these audiences, including:
• Media Coverage - News releases are faxed to all local news outlets. News releases may be generated either at the school or district level. In addition, Media Relations/Partners- in-Education may arrange news conferences, publicity events, and photo opportunities for local news media to gain positive coverage for the district.
• Parental Communication Vehicles -The district and individual schools send memoranda, pamphlets, and flyers home with all students. These documents include memoranda on pertinent district programs or changes in policies and procedures.
• Employee Communication Vehicles - The district and individual schools distribute memoranda, pamphlets, and flyers to all district employees or to supervisors for posting within departments to pub licize policy changes and inform employees about new programs and procedures. A system of facsimile transmissions to schools and district offices has been established for rapid dissemination of information.

COMMENDATION YISD uses a variety of print media to reach each of its critical internal and external audiences. FINDING An effective media relations function reports factual information in a timely manner, while striving to present a complete picture of the key facts. The review team contacted seven area media representatives to hear their perceptions of the district's handling of media issues, and received conflicting responses on YISD's effectiveness. These interviews suggest that Media Relations/Partners- in-Education does an adequate job, but key district contacts are not always available when reporters seek information. Some reporters told the TSPR review team that it can take several hours to make initial contact with district personnel, although once contact has been established, response times are fairly short. Further, they said Media Relations/Partners-in-Education tends to be more reactive than planned in its approach. Two factors affect the YISD Media Relations/Partners-in-Education's ability to provide accurate and timely responses to the media. First, the department has no system to track the volume and nature of media inquiries it receives, or its response time to requests. Second, the interim coordinator of Media Relations /Partners- in-Education is the key contact with the media, but the district has not designated a back-up staff member to handle media responsibilities in the interim coordinator's absence. In some cases, cabinet members have acted as spokespersons for the district in the coordinator's absence without input from a department representative. Media Relations/Partners- in-Education has already taken certain steps to create a unified approach to crisis management. For example, the department has held workshops at various schools to train staff on handling sensitive media issues. Each school has an appointed staff person to provide updated program information and scheduled events using a standardized form. Recommendation 29: Respond to all media requests within two hours. YISD should respond to all media requests within two hours of receipt. The interim coordinator, who should remain as the district's designated spokesperson, should develop response procedures for media inquiries and train a designated back-up to handle media issues in their absence. Media Relations/Partners- in-Education should track and analyze media requests based on volume, response time, and the nature of the inquiry. IMPLEMENTATION STRATEGIES AND TIMELINE

1. The superintendent directs the interim coordinator of Media Relations/Partners- in-Education to track information flow to the media, including volume, response time, and the nature of media inquiries.
June 1998
2. The interim coordinator of Media Relations/Partners-in-Education develops and implements procedures for ensuring correct handling of sensitive media situations, including internal coordination, communications, and media relations.
August 1998
3. The interim coordinator for Media Relations/Partners- in-Education designates and trains a staff member to act as a back-up to carry out these responsibilities in the interim coordinator's absence.
September 1998
4. The interim coordinator for Media Relations/Partners- in-Education monitors communication procedures, and solicits feedback from the media as well as district constituents to ensure coordination and the delivery of prompt, accurate information to the media.
October 1998 and ongoing
FISCAL IMPACT This recommendation can be accomplished within existing resources.

Chapter 3 COMMUNITY INVOLVEMENT C. Organization and Planning
Planning, evaluation, and resource allocation are critical tools for effectively managing school district operations. A long-range plan promotes strong community relations and increased community participation. Under SBDM, YISD's planning function is carried out both by the district and by individual schools. Specific plans for school programs and activities are coordinated and developed at the schools through their Campus Educational Improvement Committees, which are responsible for each school's planning. The district, in turn, is responsible for planning and implementing districtwide programs and allocating resources to support the schools' activities. District goals relative to community involvement are listed in the District Education Improvement Plan (Exhibit 3-7).
Exhibit 3-7 Ysleta Independent School District
District Education Improvement Council (DEIC) Community Involvement
Goal: YISD will ensure meaningful school community engagement through comprehensive communications emphasizing shared responsibility to increase student success.
Strategies
1. To establish parent/community/business support groups at all schools that meet the districts defined engagement rubrics by 1997-98.
2. By 1997-98, to implement an early outreach program(s) at all schools reaching 90% of the YISD families. This will establish the school as a major resource for parent(s) or guardian(s) to prepare children for learning from birth.
3. By 1997-98, to ensure awareness and support from community stakeholders through developing effective internal and external communication strategies as measured by 95% satisfaction on surveys.
4. To implement a "community service" learning requirement starting with the high school graduation class of 2001-2002.
Source: YISD District Improvement Plan Five Year Strategic Profile. FINDING

Prior to February 1997, YISD's Public Outreach Department performed all community outreach functions. In that month, Public Outreach was reorganized into two departments, Media Relations/Partners- in-Education and Public Outreach. Both functions reported to the Division of Instruction. Media Relations/Partners- in-Education is responsible for media relations and business partnerships between the schools and the El Paso business community. The Media Relations/Partners-In-Education Department now reports directly to the superintendent. The director of Public Outreach oversees Community Outreach, Volunteers, the Student Entrepreneur Center, Ysleta Foundation and Alumni Initiatives, and the Print Shop and Mail Center. Although the Division of Instruction is charged with coordinating community involvement activities and providing resources and support to the schools, these activities are now scattered within eight of the division's twelve sections (Exhibit 3-8).
Exhibit 3-8 YISD Community Involvement and Communications Functions
Current Organizational Chart
Source: YISD departments/sections marked with an asterisk. *Perform community outreach, involvement, and communications activities. The Records Management office in the Finance Department is responsible for the communications func tion of responding to open records requests from the public. The department processes about 40 open record requests per month. Although Records Management has established clearly defined policies and procedures for processing the requests, response time is sometimes slower than the 10 days required by the Texas Public Information Act. Based on a random sample of two months of open records

requests, the review team found that about 90 percent all requests were responded to within a 10-day period, but some took as long as 27 days to complete. Exhibit 3-9 shows community involvement activities and the departments/sections that handle them.
Exhibit 3-9 YISD Community Involvement Function
Activities by Department/Section
Source: YISD community involvement departments/sections. Because YISD's critical community involvement functions are handled in several different sections and departments, often with little coordination, a fragmented message is presented to the community. For example, several groups, including the Student Entrepreneur Center, the Media Relations/Partners- in-Education Department, Public Outreach Department, and individual schools all contact local businesses to seek support for district activities. TSPR found little coordination among these areas concerning approaches or frequency of contact with area businesses. Multiple contact points such as these make it difficult for businesses to establish a personal and effective relationship with the district.Similarly, the review team found that no one area within the district is responsible for providing general information about the district or referring general

inquiries to the appropriate persons or departments. In some cases, an information request or a complaint must be directed to four or five areas within the district before being routed to the appropriate department. A lack of cohesive focus on community services has reduced the effectiveness of planning, resource allocation, and monitoring of critical programs. Recommendation 30: Create a Community Initiatives and Information Services Department to facilitate and coordinate all community involvement activities and provide a single point of contact for individuals with complaints or seeking information about the district. YISD should create one department responsible for all key community involvement areas. The district should create an executive director of Community Initiatives and Information Services, who would serve on the superintendent's cabinet. Exhibit 3-10 provides an organizational structure for community involvement activities performed by the new department.
Exhibit 3-10 Community Initiatives and Information Services

Proposed Organizational Chart
Source: Empirical Management Services. The Community Initiatives and Information Services Department will improve efficiency and coordination of programs and communication to community groups while providing a strong, visible organizational unit with a clear, unified theme and message. Publications, administrative materials, and audiovisual services will also be improved.

IMPLEMENTATION STRATEGIES AND TIMELINE
1. The superintendent upgrades an existing director-level position to executive director of Community Initiatives and Information Services. June 1998
2. The associate superintendent for Curriculum and Instruction, the interim coordinator of Media Relations/Partners- in-Education, and the new executive director of Community Initiatives and Information Services define supporting management roles and responsibilities in consultation with the schools.
July 1998
3. The associate superintendent for Curriculum and Instruction, the interim coordinator of Media Relations/Partners- in-Education, and the new executive director of Community Initiatives and Information Services present the structure of the reorganized department to the superintendent and board for approval.
August 1998
4. The new executive director of Community Initiatives and Information and the Personnel Department review job descriptions to ensure that position descriptions and qualifications match position requirements.
August 1998
5. The new executive director of Community Initiatives and Information and the Personnel Department announce details of the reorganization and resulting changes in responsibility with the cooperation of the schools and senior administrators.
September 1998
6. The new executive director of Community Initiatives and Information Services implements the approved reorganization plan.
September 1998 ongoing
FISCAL IMPACT Under the proposed organizational structure, a director level position would be upgraded to executive director of Community Initiatives and Information Services. The difference in salary midpoints between these position levels (levels six and seven) is $9,505, which would cost the district approximately $10,300 annually, including fringe benefits of eight percent.
Recommendation 1998-99 1999-2000
2000-01 2001-02 2002-03
Create a Community Initiatives and Information Services Department.
($10,300) ($10,300) ($10,300) ($10,300) ($10,300)

Budgets FINDING Budgets for the Media Relations/Partners- in-Education and Public Outreach Departments do not accurately reflect actual spending by program and function, partly because of numerous reorganizations and changes in areas of responsibility. The section of the budget entitled Public Outreach does not correspond with costs associated with the Public Outreach Department as it is now structured. Indeed, the actual budget for the Public Outreach Department cannot be precisely determined since some of its costs are embedded in budgets of other departments. Exhibit 3-11 shows the reported budget for the district's community involvement activities.
Exhibit 3-11 Reported YISD Community Involvement Activities Budget
By Department/Section 1997-98
Budget Category
Media Relations/ Partners In Education
Public Outreach
Pupil and Parent Services
Open Records Mgmt.
Total Budget
Payroll Costs $165,479 $157,753 $280,386 $63,146 $666,764
Purchased and Contracted Services
$42,200 $70,228 $434,685 $57,600 $604,713
Supplies and Materials $30,347 $49,448 $14,850 $2,765 $97,410
Other Operating Expenses $43,600 $54,250 $34,275 $2,000 $134,125
Capital Outlay $5,000 $3,500 $4,888 $2,000 $15,388
Total $286,626 $335,179 $769,084 $127,511 $1,518,400
Source: YISD Budget Department. As the above exhibit shows, the reported Public Outreach budget is $335,179. Based on the review team's interviews with the Budget Department, however, actual spending for

activities performed by Public Outreach is estimated at more than $1.2 million annually (Exhibit 3-12).
Exhibit 3-12 Estimated Actual Spending on Public Outreach Programs
By Department/Section Fiscal 1997-98
Budget Category
Public Outreach
Student Entrepreneur Center
Mail/Print Services
Alumni Initiatives
Ysleta Foundation
Total Budget
Payroll Costs $157,753 $344,738 $201,006 $107,821 $21,732 833,050
Purchased and Contracted Services
70,228 64,536 8,000 1,000 500 144,264
Supplies and Materials
49,448 55,367 10,078 4,998 4,893 124,784
Other Operating Expenses
54,250 48,600 6,500 7,200 6,500 123,050
Capital Outlay 3,500 17,943 23,922 1,000 0 46,365
Total $335,179 $531,184 $249,506 $122,019 $33,625 $1,271,513
Source: YISD Budget Department. *Public Outreach budget includes volunteer activity costs. The lack of an adequate budget process restricts the district's ability to evaluate each functional area's actual budget requirements and to determine whether district resources are being used effectively. Recommendation 31: Revise budgets to more accurately reflect community involvement costs by program and function. Budgets should be developed for each community involvement area listed in Exhibit 3-11 and Exhibit 3-12 to accurately track and report actual spending so that the district may determine the cost-effectiveness of each of these critical activities. Such detailed

budgeting would allow the district to set its priorities more effectively and identify ways to improve performance. IMPLEMENTATION STRATEGIES AND TIMELINE
1. The associate superintendent for Curriculum and Instruction, in cooperation with the budget director and department heads, reviews critical community involvement activities, develops a budget for each area, and develops a revised system for tracking, analyzing, and reporting budget amounts.
July 1998
2. The superintendent approves the new budget and tracking system. September 1998 and ongoing
FISCAL IMPACT This restructuring of the budget process can be accomplished at no additional cost to the district.

Chapter 3 COMMUNITY INVOLVEMENT D. Student Entrepreneur Center CURRENT SITUATION The Student Entrepreneur Center is a unique educational initiative designed to prepare students for the world of business. The center's mission is to give YISD students the tools and spirit to run successful businesses. Particular emphasis is placed on entrepreneurial skills, with the aim of preparing students for gainful self-employment in the El Paso area, in the hope that more students will stay in and serve the community. FINDING The Student Entrepreneur Center houses and hosts many programs, classes, and events that directly benefit YISD students. The Student Entrepreneur Center facility consists of several office buildings and a large outdoor area used for "mercados" and other functions. The facility also provides space to community groups in exchange for services that help to build the entrepreneurial spirit among YISD constituents, primarily students. For example, office space is provided to Junior Achievement in return for the organization's efforts to teach YISD students the critical skills needed to start and operate a business. In addition, the center provides training to both teachers and students in the classroom through speakers' bureaus. Teachers and students are trained at the center in large group settings called "universities." The curriculum emphasizes the managerial skills needed to run a successful enterprise, and encompasses four essential elements:
• the role of the small business in the U.S. economy. • the skills needed to be an entrepreneur. • the creation of a small business. • the management and expansion of a small business.
Students can participate in a "mercado" or market, a simulation of a business marketplace or collection of street vendors that features 20 to 30 booths, all managed by students. The mercados allows students to display either the products they manufacture or services they offer to customers at the mercado. All sales dollars generated go back to the student. The market also offers entertainment to attract customers, including student music, dance, and theatrical performances. In addition, an art gallery showcases paintings, sculpture, and other artwork by both students and community members. These events offer students the opportunity to explore the fine arts. Students at the Student Entrepreneur Center receive instruction in the classroom and in group settings." YISD teachers learn to incorporate and encourage business principles in their curricula, and to present the center's curriculum on entrepreneurial management. In this way, teachers also learn what it takes

to start and run a business and how to teach students these skills through a planned curriculum. The center's director actively encourages business participation and is very active in the business community through participation on boards and membership in various business organizations. The director also frequently makes speeches, holds workshops, attends conferences, and uses multiple forums to gain exposure and support for the Student Entrepreneur Center. COMMENDATION The Student Entrepreneur Center is an innovative business management learning center that showcases students' talents and effectively solicits community support. FINDING The Student Entrepreneur Center's mission is to give students the skills they need to run successful businesses through a combination of academic and practical skills training. In keeping with this mission, the center has sought expertise rather than funding from area businesses. The center's operating budget of more than $500,000 a year is provided primarily by the school district (Exhibit 3-13).
Exhibit 3-13 YISD Student Entrepreneur Center Budget
1997-98 School Year
Budget Category Student Entrepreneur Center
Payroll Costs $344,738
Purchased and Contracted Services $64,536
Supplies and Materials $55,367
Other Operating Expenses $48,600
Capital Outlay $17,943
Total $531,184
Source: YISD Budget Department. The review team repeatedly heard comments in both focus groups and interviews expressing concern about the district's level of spending on the Student Entrepreneur Center's facilities, such as its covered outdoor facility for fine arts performances. This facility is intended to give several different types of student businesses, such as production companies, lighting companies, and cleaning businesses, an opportunity to offer their products or services in a real- life setting with assistance from the business community.

While overall comments about the center's mission were very positive, community members repeatedly expressed concern about the district's ability to fund this project without financial support from the El Paso business community. The Greater El Paso Chamber of Commerce has a membership of around 2,000 businesses. As many as 1,500 businesses have had some level of involvement with the Entrepreneur Center. A large percentage of the center's budget is allocated to salaries and the costs of operating and administering student programs such as the mercados. Other school districts reviewed by the Comptroller's office have identified ways to offset their operating costs. For example, at the Tyler Independent School District (TISD), a district facility called Camp Tyler was being used by the community without charge. The district determined the camp's operating costs and developed a cost recovery schedule to defray some of these costs. Recommendation 32: Offset operating costs of the Student Entrepreneur Center with funding from the El Paso business community. The district should request business support to offset the center's operating costs using creative approaches, such as underwriting specific events like mercados. Similarly, area employers could provide in-kind donations or seed money to student businesses in industries related to their own. The district, in turn, could reward business participation with formal recognition programs to bolster community support and awareness of the Student Entrepreneur Center. In addition, the district could apply to foundations for financial support of the center, or establish its own foundation to attract funding. IMPLEMENTATION STRATEGIES AND TIMELINE
1. The superintendent and the associate superintendent for Curriculum and Instruction work with the director of the Student Entrepreneur Center to develop a long-range plan for attracting business funding for the Student Entrepreneur Center.
June 1998
2. The director of the Student Entrepreneur Center presents the long-range plan to the superintendent, school board, and Student Entrepreneur Center board for approval.
August 1998
3. The director of the Student Entrepreneur Center implements the approved plan and ties its objectives to the center's performance measures and action plans.
September 1998
FISCAL IMPACT

The center's initial goal should be to offset operating costs by a modest five percent, which could be achieved with an annual contribution of $50 from one-third of the 1,500 El Paso businesses involved with the Student Entrepreneur Center. The center could rotate the businesses solicited each year so that the same companies are not repeatedly asked to donate. Ideally, contribution goals could be increased in future years as creative funding approaches are further developed.
Recommendation 1998-99
1999-2000
2000-01
2001-02
2002-03
Offset operating costs of the Student Entrepreneurial Center.
$25,000 $25,000 $25,000 $25,000 $25,000

Chapter 3 COMMUNITY INVOLVEMENT E. Administrative Support Services CURRENT SITUATION The Print Shop and Mail Center report to the Public Outreach Department. The Print Shop produces school newsletters, letterhead, forms, booklets, training manuals, and financial reports. The Print Shop is unable to provide full color services, or printing on paper larger than 11 inches by 17 inches. Schools and departments, as a result, must seek up to $250,000 in services from outside vendors per year. The Print Shop and Mail Center coordinate printing and copying services and mail distribution. Their primary objective is to ensure that publications and mailroom services are timely, accessible to the schools and community, and as cost-effective as possible. The Print Shop and Mail Center share adjacent facilities on the second floor of the administration building; seven employees serve both functions. An evaluation of YISD's printing services conducted in November 1996 by a consultant from the University of Texas at El Paso cited several problems:
The location of the print shop is potentially hazardous because existing equipment may exceed the weight limitation for second floor office space. The operation of copying and printing also causes floor vibration. The location also poses potential problems due to the use the building's two elevators to move heavy loads in and out of the building. The Print Shop is overcrowded with machinery and personnel, its 2,500 square feet of space is inadequate, and the floor itself is not strong enough to support the heavy equipment. A facility necessary to house the present equipment and to allow for expansion would require at least a 10,000 square foot area.
The director of Facilities stated that a structural engineer examined the print shop and found no structural problem with the facility. Although the current Print Shop location can sustain the current weight of the machinery, it is not feasible to expand operations by adding equipment or personnel. The floor's vibration was found at times to cause the copy machines to become misaligned. FINDING YISD's Print Shop and Mail Center provide in-house copying and printing services for both schools and the district. The department uses a "charge-back" system to recoup basic supplies and materials costs from schools. However, only materials that can be counted, such as paper and maintenance fees for the large copy machines are charged to the user departments on a pro-rated basis. The director of Public Outreach said that the Print Shop

recoups printing costs as directed by school district policy and the external auditor's report. Capital and operating costs incurred by the department that are not recouped include labor, the replacement cost of non-countable supplies and materials, utilities, facilities use and depreciation. Thus the Print Shop does not accurately capture and recoup all its printing costs and it cannot effectively allocate scarce resources or accurately assess the cost-effectiveness of its operation. Without a cost analysis that includes full operational costs, there is no way to compare Print Shop costs to outside vendor costs. The district has discussed several alternatives for handling current and future facility needs for this department. The first option is to build a free-standing building on the district administration building's parking lot. A second option would involve relocating the Print Shop to a ground-floor location within the district administration building. No such space is available at present, however. The district also has considered relocating part of the Print Shop to a nearby building not actually on district property. This alternative would create management challenges, however, since the Print Shop supervisor would have to manage print operations in two separate facilities. The supervisor of Mail Printing Services indicated that a construction request has been made to the district for a new building to house the department. In addition, plans are underway to replace one of the printing presses next year. An internal service fund accounts for the financing of goods or services provided by one department to other departments of the district on a cost-reimbursement basis. Since working capital is required, there is usually a contribution transfer of cash or fixed assets from the general fund or General Fixed Asset Account Group. Rates for services such as copying and printing include all costs for materials and supplies, facility purchase and us, utilities, labor, capital equipment and replacement costs, and all other operating costs. TEA guidelines for internal service funds suggest that these items be contributed to the fund at fair market value, which approximates the net book value. Since internal service funds are proprietary funds, depreciation of fixed assets must be recorded. Rates charged for use of internal service equipment and facilities include the current cost of maintenance and operation, a reasonable charge for depreciation, and a surcharge so that equipment can be replaced on a scheduled basis. Recommendation 33: Set up an internal service fund for print operations. Print Shop services should be set up as an internal services fund so that the full cost of all print services are charged to user departments within the district. Prices should be calculated to cover the full cost of operations and include the replacement cost of supplies and materials, payroll costs, and operating expenses. This method of cost allocation would allow schools and departments to purchase printing and printing services from sources outside YISD if they are less expensive.

In deciding whether to relocate the Print Shop, to increase volume capacity, or to expand the types of services provided in-house, the district should base its evaluation on the true cost of handling print jobs in-house, including equipment replacement, construction, and facilities use. IMPLEMENTATION STRATEGIES AND TIMELINE
1. The print supervisor and the budget director analyze the full cost of printing and copying services, including labor and all operating costs. July 1998
2. The print supervisor calculates the full cost of each service to be provided by the Print Shop and develops a comprehensive pricing sheet.
October 1998
3. The CFO and budget director set up an internal service fund for charging costs back to internal clients.
January 1998
4. The print supervisor communicates the new price structure and internal service fund procedures to schools and departments.
March 1998
5. The print supervisor monitors and evaluates the pricing structures to ensure that prices accurately reflect full production costs and revises the plan and pricing structure as necessary.
May 1999 ongoing
FISCAL IMPACT No additional cost to the district would result from this recommendation.

Chapter 4 PERSONNEL MANAGEMENT This chapter reviews YISD's human resource management functions in seven sections:
A. Organization and Management
B. Automation
C. Personnel Operations
D. Recruiting, Selection, and Hiring Practices
E. Employee Compensation
F. Records Management
G. Staff Development
BACKGROUND
Staffing typically is a school district's largest single expenditure and personnel management consequently should be a high priority for any employer. An effective human resources department is responsible for:
• performing comparisons with surrounding districts and local employers on employee statistics, salaries, and benefits.
• developing human resources policies and procedures manuals. • maintaining human resources records. • developing and updating job descriptions. • selecting, hiring, and recruiting employees. • developing comprehensive staff development programs and requirements. • ensuring that performance evaluations are standardized and conducted for all
levels of employees. • ensuring that promotions, transfers, and dismissals are conducted in accordance
with state statutes and local board policy. • tracking employee statistics such as absenteeism, turnover, terminations, and
grievances. • developing employee relations programs. • ensuring that all managers are trained on the correct procedures for documenting
due process.
Exhibit 4-1 summarizes YISD's 1997-98 budget and indicates that nearly 80 percent of the budget is attributed to payroll costs.

Exhibit 4-1 YISD Budgeted Expenditures (General Fund)
1997-98
Appropriation Total (Millions $) Percent of Total
Payroll Costs $195,737,553 79.9%
Professional and Contracted Services $16,520,660 6.7%
Supplies and Materials $15,148,928 6.2%
Debt Service $8,206,009 3.4%
Other Operating Expenses $5,226,320 2.1%
Capital Outlay $3,997,155 1.6%
Total $244,836,625 100%
Source: YISD 1997-98 School Budget. Exhibit 4-2 summarizes district employees by classification.
Exhibit 4-2 Number of Employees per Employee Classification
1997-98
Classification Number of Employees % of Total Employees
Teachers 3,008 37.2%
Professional Support:
Librarians 47 .6%
Nurses 59 .7%
Counselors 94 1.2%
Diagnosticians/Psychologists 29 .4%
Therapists 54 .7%
School Administrators 142 1.8%
Central Office Administrators 125 1.5%
Paraprofessionals:
School Secretaries/Clerks 303 3.7%
Central Office Secretaries/Clerks 132 1.6%

Instructional Aides 443 5.5%
Ancillary:
Maintenance 157 1.9%
Custodial 357 4.4%
Food Service 466 5.8%
Transportation 261 3.2%
Warehouse 24 .3%
Security 72 .9%
Print Shop 7 .1%
Telecommunications 6 .1%
Part-Time Employees 2,310 28.5%
Total Employees 8,096 100%
Source: YISD Human Resources Division. Exhibits 4-3 and 4-4 compare YISD's staffing levels to those of its peer districts. YISD has a student-to-staff ratio of 13 to 1, slightly below the peer-district average of 14 to 1.
Exhibit 4-3 Administrative/Professional Personnel
Ysleta Versus Peer Districts 1996-97
District Student Enrollment
Professional Staff
Central Admin.
School Admin.
Professional Support Teachers
Houston ISD 209,375 14,243 129 498 1,763 11,853
Ft. Worth ISD 75,813 5,284 50 252 705 4,277
Dallas ISD 154,847 11,325 17 462 1,644 9,202
Austin ISD 76,054 5,533 51 218 619 4,645
San Antonio ISD
61,361 4,558 58 155 653 3,692
Corpus Christi ISD
41,606 3,077 20 139 454 2,465
Ysleta ISD 47,366 3,553 37 118 407 2,991
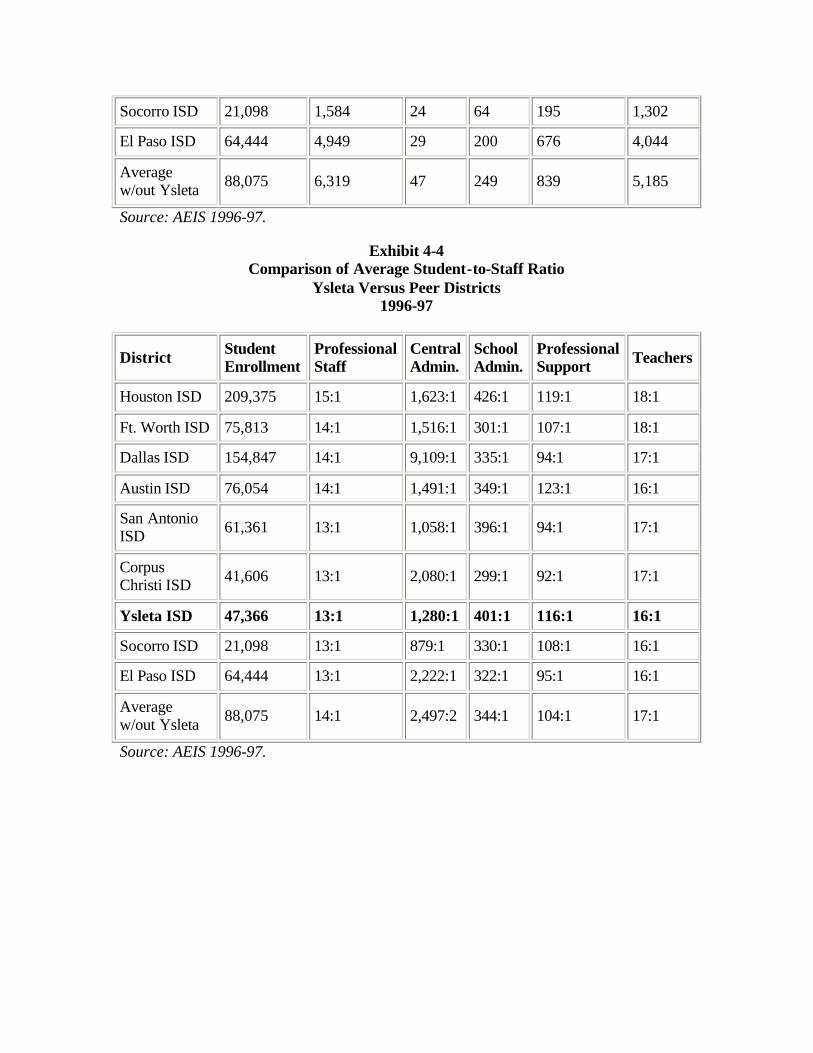
Socorro ISD 21,098 1,584 24 64 195 1,302
El Paso ISD 64,444 4,949 29 200 676 4,044
Average w/out Ysleta 88,075 6,319 47 249 839 5,185
Source: AEIS 1996-97.
Exhibit 4-4 Comparison of Average Student-to-Staff Ratio
Ysleta Versus Peer Districts 1996-97
District Student Enrollment
Professional Staff
Central Admin.
School Admin.
Professional Support Teachers
Houston ISD 209,375 15:1 1,623:1 426:1 119:1 18:1
Ft. Worth ISD 75,813 14:1 1,516:1 301:1 107:1 18:1
Dallas ISD 154,847 14:1 9,109:1 335:1 94:1 17:1
Austin ISD 76,054 14:1 1,491:1 349:1 123:1 16:1
San Antonio ISD 61,361 13:1 1,058:1 396:1 94:1 17:1
Corpus Christi ISD 41,606 13:1 2,080:1 299:1 92:1 17:1
Ysleta ISD 47,366 13:1 1,280:1 401:1 116:1 16:1
Socorro ISD 21,098 13:1 879:1 330:1 108:1 16:1
El Paso ISD 64,444 13:1 2,222:1 322:1 95:1 16:1
Average w/out Ysleta 88,075 14:1 2,497:2 344:1 104:1 17:1
Source: AEIS 1996-97.

Chapter 4 PERSONNEL MANAGEMENT A. Organization and Management CURRENT SITUATION YISD's Human Resources Division is divided into three departments: Human Resources, Employee Relations, and Risk Management. Human Resources consists of 41.5 full- time equivalent (FTE) positions whose major responsibilities include assisting in the hiring of qualified personnel; maintaining human resources records and appraisal forms; administering employee insurance and workers' compensation claims; administering the district's risk management function; administering employee compensation and classification; and tracking teacher certifications and deficiencies. The Human Resources Division organizational structure is depicted in Exhibit 4-5. The Risk Management Department is discussed in the Asset and Risk Management chapter of this report. The division mission statement is:
"To develop a spirit of cooperation and cohesiveness within the Human Resources Division and to use a comprehensive, management information system for district personnel in a way that provides opportunities for problem-solving and group decision-making that [are] both proactive and outcome-based, includes planning for long-range goals, promotes a supportive environment, and serves as a model for other departments so that there is a more efficient delivery of services, enhanced staff morale, and a shared aim."
Exhibit 4-5
YISD Human Resources Division
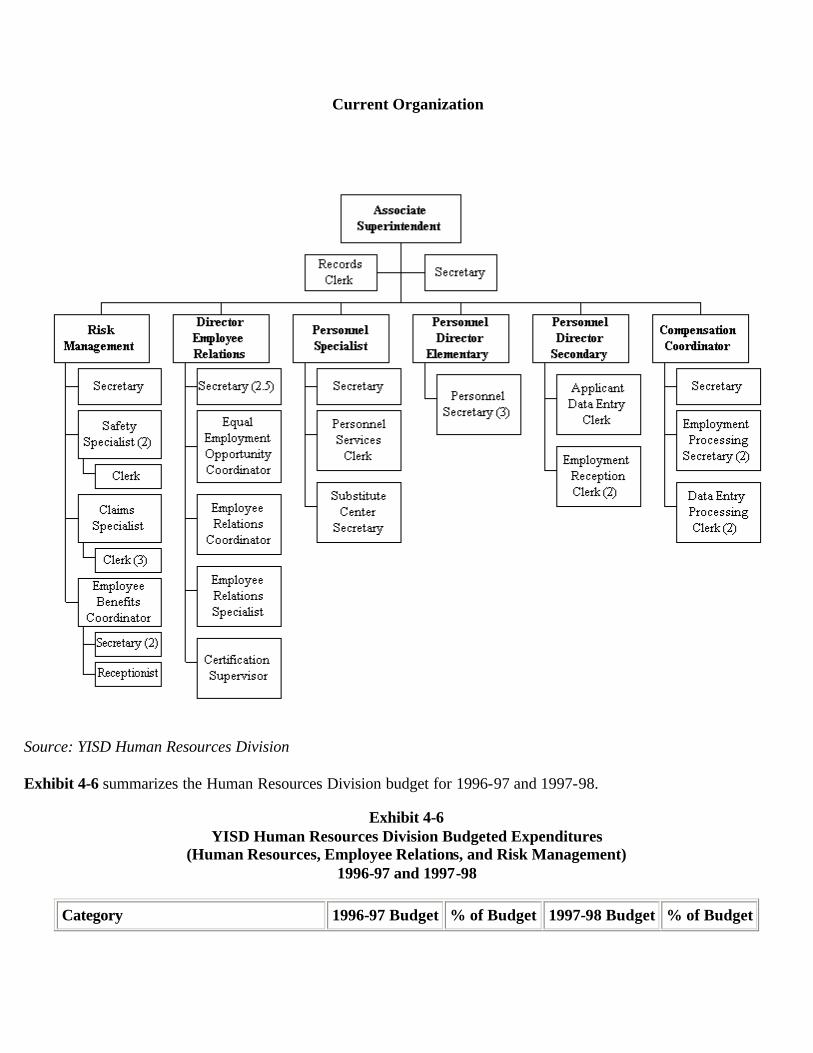
Current Organization
Source: YISD Human Resources Division Exhibit 4-6 summarizes the Human Resources Division budget for 1996-97 and 1997-98.
Exhibit 4-6 YISD Human Resources Division Budgeted Expenditures
(Human Resources, Employee Relations, and Risk Management) 1996-97 and 1997-98
Category 1996-97 Budget % of Budget 1997-98 Budget % of Budget

General Administration
Payroll $1,298,369 50.1% $1,557,581 49.0%
Purchased & Contracted Services $162,645 6.3% $345,517 10.9%
Supplies & Materials $97,765 3.8% $128,745 4.1%
Travel/Subsistence $22,199 .9% $23,500 .7%
Insurance/Bonding $622,772 24.0% $824,602 26.0%
Misc. $276,666 10.7% $176,803 5.6%
Capital Outlay $22,335 .9% $26,377 .8%
Sub Total $2,502,751 96.5% $3,083,125 97.0%
New Teacher Positions (Instructional)
Payroll $90,431 3.5% $94,486 3.0%
Sub Total $90,431 3.5% $94,486 3.0%
Total $2,593,182 100% $3,177,611 100%
Source: YISD Human Resources Division. FINDING Human Resources maintains a pool of qualified applicants for teaching, custodial, and food service positions. This practice ensures that an ample supply of employment candidates is available when needed. The district also maintains substitute pools for food service and custodial positions. These substitute pools also can be used to fill vacant positions of qualified applicants. Employees in the substitute pool who wish to be considered for a permanent position must go through the application and interview process when a vacancy is posted. Principals have had mixed reactions about the substitute pools; some feel that the substitute pool is great while others feel that it hampers their ability to hire the individuals they want. Some principals feel that they are required to hire employees from the substitute pool to fill vacancies rather than hire individuals that apply for a vacancy that are not in the current substitute pool. However, according to the compensation coordinator, individuals in the substitute pool are not given preferential treatment during the hiring process. YISD also contracts with a temporary agency for clerical positions. This practice allows the district to have sufficient staff when workloads are heaviest without creating unnecessary permanent positions. YISD spent a total of $76,613 on temporary services in 1996-97 and another $18,686 from September 1 to November 1, 1997. TSPR conducted written surveys in conjunction with this review. A total of 1,036 responses were received from central office administrators, principals and assistant principals, teachers, and students. The responses suggest that some services provided by the Human Resources Division need improvement (Appendix A through I ). Some survey respondents expressed concerns about YISD's hiring, promoting, and compensation practices. Some felt that individuals are hired and promoted based on a "buddy system" rather than on their qualifications. They also felt that employee morale is low and should be improved.

While not all of these comments can be attributed solely to decisions made by the Human Resources Division, the survey results indicate that there are communication problems between Human Resources and district employees. Recommendation 34: Conduct an annual survey to determine satisfaction levels with the district's Human Resources Division and use the survey results to identify ways to improve services. The Human Resources Division should conduct annual user-satisfaction surveys to determine the effectiveness of its services and gather suggestions for improvements. The results of this survey should be used as guidelines for changes in division policies and practices. IMPLEMENTATION STRATEGIES AND TIMELINE
1. The superintendent directs the associate superintendent of the Human Resources to conduct annual user satisfaction surveys. June 1998
2. The associate superintendent of Human Resources develops a user satisfaction survey. July 1998
3. The associate superintendent of Human Resources presents the user satisfaction survey to the superintendent for review and suggestions. July 1998
4. The associate superintendent of Human Resources finalizes the user satisfaction survey. August 1998
5. The associate superintendent of Human Resources distributes, collects, and analyzes the user satisfaction surveys annually and makes useful modifications to procedures as based on survey results.
September - November Annually
FISCAL IMPACT This recommendation can be implemented with existing resources.

Chapter 4 PERSONNEL MANAGEMENT B. Automation CURRENT SITUATION The Human Resources Division is currently using an Information Design Inc. (IDI) software system to maintain personnel information. The division also maintains several internal databases to track personnel statistics and produce management reports. Two years ago, the district purchased an integrated management information system that features a human resources module built into the payroll module. The payroll module, however, still had not been implemented at the time of TSPR's review. The associate superintendent of Human Resources told the review team that one of the division's goals is to maintain a database of qualified applicants so that principals and department heads can access applicant pools electronically, and that the integrated system has the necessary features to facilitate YISD applicant tracking and processing. However, because the integrated management information system has not yet been implemented, the division is in the process of buying and installing a stand-alone computer server and human resources software for employee applicant processing and other monitoring needs. The software being obtained is intended to consolidate all current databases and enhance the computer system. FINDING As noted above, Human Resources has not installed the integrated management information system personnel software purchased by the district two years ago. The personnel software is a component of the system's payroll module. The division currently uses IDI personnel software and PC-based databases for personnel processing. Interviews with district staff indicate that the integrated management information system personnel software has not been implemented by the district because of hardware constraints and lack of cooperation between the district and the vendor. The hardware that was purchased two years ago was not intended to handle the volume of transactions that are now occurring in the district. There is a contractual agreement between the vendor and YISD, however, there have been personnel changes at both the vendor and YISD. Because of these changes and disagreement about responsibilities, the system is not completely implemented. Because the district's current automated personnel systems are not integrated, personnel data must be entered into a computer at least twice, once for payroll purposes and once for personnel records. Recommendation 35:

Develop an integrated solution that will meet all of YISD's human resources and payroll automation needs. The associate superintendent for Human Resources should define the division's complete automation needs and discuss these needs with representatives of the integrated management information system to determine if the system can meet these needs. Solutions should be developed based on results of these discussions. Additional software may be needed to enhance the computer system's present capabilities. If so, the district should ensure that any additional software purchased interfaces with the integrated management information system. This should allow the district to eliminate its present need for duplicative data entry. IMPLEMENTATION STRATEGIES AND TIMELINE
1. The superintendent directs the associate superintendent of Human Resources to assess the needs of the Human Resources Division and the capabilities of the integrated management information system.
June 1998
2. The associate superintendent of Human Resources and the MIS director discuss the computer system's capabilities with vendor representatives to determine its compatibility with the division's needs and solutions.
June - July 1998
3. The associate superintendent of Human Resources determines the optimal solution to meets the division's needs.
August 1998
4. The associate superintendent of Human Resources makes a recommendation to the superintendent for approval.
August 1998
5. The associate superintendent of Human Resources implements the approved recommendation.
September 1998
FISCAL IMPACT The fiscal impact will depend upon the results of the software and hardware assessment and cannot be calculated at this time. However, indirect savings should result from elimination of double entry of personnel and payroll information. FINDING The Human Resources Division does not have its own local area network (LAN). As a result, its personnel files cannot be shared electronically. Instead, each department within the division maintains its own databases, sometimes creating duplicative clerical effort. Exhibit 4-7 shows the major tasks performed by clerks in Human Resources. The table clearly indicates that some duplication does exist.

Exhibit 4-7 Selected Tasks Performed by
Clerks in the Human Resources Department
Job/Task Description
Employment/ Compensation Clerks (4) & Secretary
Personnel Specialist Clerks (2) & Secretary
Personnel Director (Elementary) Secretaries (3)
Personnel Director (Secondary) Clerks (3)
Number of Clerks Assigned to Task
Applicant Processing
Process employee applications; ensure all required paperwork is completed and submitted
1 1 2 2 6
Enter applicant information into database
1 1
Schedule applicant interviews
1 1
Prepare applicant folders for review by principals and administrators
2 2 4
Process employee resignations, terminations, and exit forms
2 2
Prepare listing of new hires for the board
1 1
Maintain personnel files
2 0 0 1 3

Maintain applicant correspondence
1 1 2 3 7
Schedule and conduct applicant testing
2 2 4
Employment Contracts
Prepare employment contracts for new employees
2 2
Applicant Processing
Forward employee pay information to Payroll and Budget Departments
2 2
Prepare renewal contracts for employees
1 1
Prepare letters of intent for employees
1 1
Prepare and update job descriptions
1 1
Verify employee service records
2 1 3
Administrative
Update automated jobs line
1 1
Update automated
1 1

substitute caller system
Prepare job posting notices 1 1
Maintain departmental budget
1 1
Order supplies for department 1 1
Coordinate PEIMS reporting with Payroll Department
1 1
Maintain departmental correspondence
1 1
Coordinate all job fair, recruiting, and substitute teacher training activities
1 1
Source: Interviews with Human Resources personnel; YISD job descriptions Recommendation 36: Install a local area network in the Human Resources Division and consolidate the division's databases and clerical activities. This LAN would connect all departments within the division. All commonly used personnel information should be maintained in one database on the server. Once a LAN is installed, the division should eliminate duplicated clerical efforts and allocate its clerical resources to other tasks. IMPLEMENTATION STRATEGIES AND TIMELINE
1. The superintendent directs the associate superintendent of Human Resources to install a LAN within all components of the Human Resources Division.
June 1998

2. The associate superintendent of Human Resources determines the requirements of the Human Resources Division. June 1998
3. The associate superintendent of Human Resources, along with the MIS director, research available solutions for a LAN and prepare bid specifications, if necessary.
June - July 1998
4. The associate superintendent of Human Resources presents the recommended solution to the superintendent for approval. August 1998
5. The associate superintendent of Human Resources obtains and implements the approved LAN.
September 1998
FISCAL IMPACT The cost for a LAN would depend upon the solution selected. However, since division employees already have computers, the division should be able to network its departments for $25,000 or less.
Recommendation 1998-99 1999-2000
2000-01
2001-02
2002-03
Install a LAN and consolidate clerical activities
($25,000) $0 $0 $0 $0

Chapter 4 PERSONNEL MANAGEMENT
C. Personnel Operations
CURRENT SITUATION The Human Resources Division is responsible for all phases of hiring new employees, training administrators on the employee evaluation process, ensuring that employee evaluations are conducted, establishing salary schedules, conducting investigations of employee misconduct allegations, conducting EEO investigations, and assisting administrators with developing performance improvement plans as needed. Exhibit 4-8 summarizes the operating budget for the Human Resources Department within the Human Resources Division.
Exhibit 4-8 YISD Human Resources Division Budgeted Expenditures
Human Resources Department 1996-97 and 1997-98
Category 1996-97 Budget
% of Budget
1997-98 Budget
% of Budget
General Administration:
Payroll $819,341 78.4% $958,271 81.2%
Purchased & Contracted Services
$31,300 3.0% $24,300 2.1%
Supplies & Materials $39,618 3.8% $56,840 4.8%
Travel/Subsistence $11,206 1.1% $11,000 .9%
Misc. $33,000 3.2% $16,500 1.4%
Capital Outlay $20,172 1.9% $19,000 1.6%
Sub Total $954,637 91.3% $1,085,911 92.0%
New Teacher Positions (Instructional)

Payroll $90,431 8.7% $94,486 8.0%
Sub Total $90,431 8.7% $94,486 8.0%
Total $1,045,068 100% $1,180,397 100%
Source: YISD Human Resources Department. FINDING Automated substitute caller systems allow districts to establish a database of qualified substitutes that are called automatically by the computer system whenever an employee is absent. YISD currently uses this system strictly for teachers. However, the system can be used for all employees. To use such a system, an employee dials a telephone number that accesses the database; enters a series of identification numbers that identify the employee's name, work category, and work location; and also enters absentee codes to indicate the purpose of the absence and that determine if a substitute is needed, what type of substitute, and also tells the payroll system that the employee was absent. The automated system then searches for an approved, qualified substitute for the absent employee. Once a candidate is found, the computer calls the candidate to determine his or her availability. If the substitute candidate accepts the assignment, the process is complete. If the substitute candidate rejects the assignment, the computer searches the database again and calls another qualified candidate. Automated substitute systems also can allow absent employees to leave specific directives for their substitutes. In addition, automated substitute caller systems can interface with payroll modules so that employee attendance can be electronically monitored. YISD's automated substitute-teacher caller system has been in place for five years and is very effective. Human Resources intends to expand the automated substitute caller system to include all categories of employees. COMMENDATION YISD's automated substitute-teacher caller system facilitates its contacts with substitutes and tracks employee absences. FINDING The Human Resources Department has a reclassification committee that meets annually to evaluate all reclassification requests submitted by employees. Exhibit 4-9 summarizes recent employee reclassifications. This process appears to be well-planned and executed. According to the compensation coordinator, YISD employees have come to rely on this
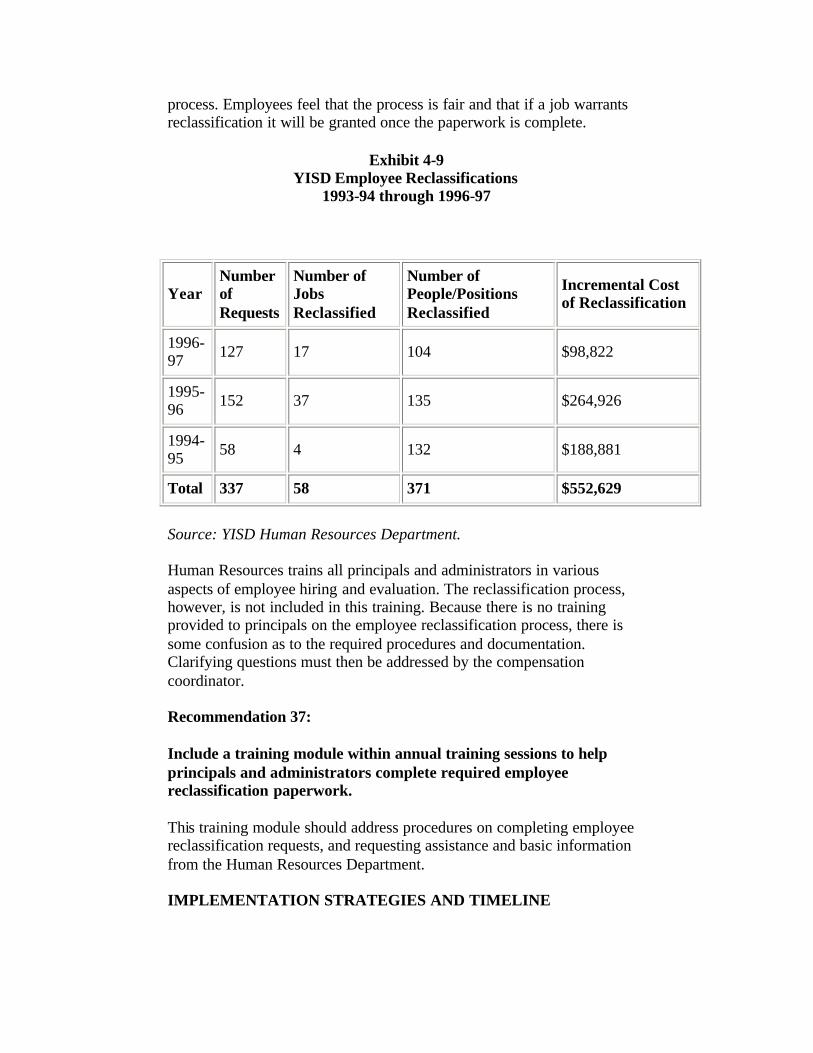
process. Employees feel that the process is fair and that if a job warrants reclassification it will be granted once the paperwork is complete.
Exhibit 4-9 YISD Employee Reclassifications
1993-94 through 1996-97
Year Number of Requests
Number of Jobs Reclassified
Number of People/Positions Reclassified
Incremental Cost of Reclassification
1996-97 127 17 104 $98,822
1995-96 152 37 135 $264,926
1994-95 58 4 132 $188,881
Total 337 58 371 $552,629
Source: YISD Human Resources Department. Human Resources trains all principals and administrators in various aspects of employee hiring and evaluation. The reclassification process, however, is not included in this training. Because there is no training provided to principals on the employee reclassification process, there is some confusion as to the required procedures and documentation. Clarifying questions must then be addressed by the compensation coordinator. Recommendation 37: Include a training module within annual training sessions to help principals and administrators complete required employee reclassification paperwork. This training module should address procedures on completing employee reclassification requests, and requesting assistance and basic information from the Human Resources Department. IMPLEMENTATION STRATEGIES AND TIMELINE

1. The associate superintendent for Human Resources directs the compensation coordinator to conduct annual training sessions on employee reclassification requests.
June 1998
2. The compensation coordinator develops standard training materials.
June - August 1998
3. The compensation coordinator provides the associate superintendent of Human Resources with the standard training materials for review and suggestions.
August 1998
4. The compensation coordinator finalizes training materials based on suggestions provided by the associate superintendent of Human Resources.
September 1998
5. The compensation coordinator conducts annual employee reclassification training during the Human Resources Division training sessions.
Annually
FISCAL IMPACT This recommendation can be implemented with existing resources. FINDING The Human Resources Division's Employee Relations Department consists of 2.5 clerical and five professional employees including the department director. Exhibit 4-10 summarizes the department's budget for 1996-97 and 1997-98. Employee Relations is responsible for several major functions. These include processing all employee Equal Employment Opportunity (EEO) and American Disabilities Act complaints; processing misconduct and sexual harassment complaints filed by students, parents, and employees; writing employee improvement plans for low-performing employees; writing employee disciplinary action plans; conducting training sessions for all school and central office administrators in the areas of sexual harassment, investigations, performance appraisals, and EEO; ensuring that employee evaluations are performed; and assisting employees in obtaining emergency teaching certificates and monitoring the progress of employees seeking teacher certification.
Exhibit 4-10 YISD Human Resources Division Budgeted Expenditures
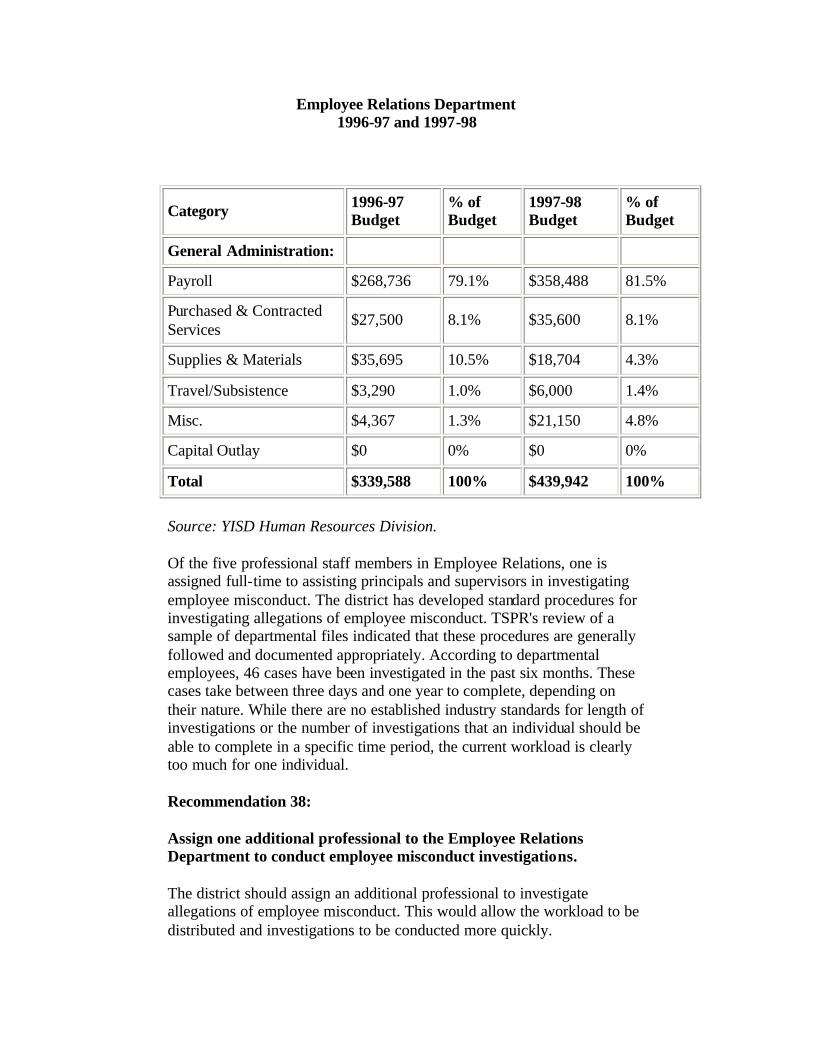
Employee Relations Department 1996-97 and 1997-98
Category 1996-97 Budget
% of Budget
1997-98 Budget
% of Budget
General Administration:
Payroll $268,736 79.1% $358,488 81.5%
Purchased & Contracted Services
$27,500 8.1% $35,600 8.1%
Supplies & Materials $35,695 10.5% $18,704 4.3%
Travel/Subsistence $3,290 1.0% $6,000 1.4%
Misc. $4,367 1.3% $21,150 4.8%
Capital Outlay $0 0% $0 0%
Total $339,588 100% $439,942 100%
Source: YISD Human Resources Division. Of the five professional staff members in Employee Relations, one is assigned full-time to assisting principals and supervisors in investigating employee misconduct. The district has developed standard procedures for investigating allegations of employee misconduct. TSPR's review of a sample of departmental files indicated that these procedures are generally followed and documented appropriately. According to departmental employees, 46 cases have been investigated in the past six months. These cases take between three days and one year to complete, depending on their nature. While there are no established industry standards for length of investigations or the number of investigations that an individual should be able to complete in a specific time period, the current workload is clearly too much for one individual. Recommendation 38: Assign one additional professional to the Employee Relations Department to conduct employee misconduct investigations. The district should assign an additional professional to investigate allegations of employee misconduct. This would allow the workload to be distributed and investigations to be conducted more quickly.

IMPLEMENTATION STRATEGIES AND TIMELINE
1. The superintendent directs the associate superintendent of Human Resources to hire an individual to conduct employee misconduct investigations.
September 1998
2. The associate superintendent of Human Resources advertises the position, interviews candidates, and hires one.
September - October 1998
FISCAL IMPACT This recommendation would have an annual cost of $38,440, assuming an annual salary of $31,000 and a 24 percent fringe benefits rate.
Recommendation 1998-99 1999-2000 2000-01 2001-02 2002-03
Assign one additional employee relations professional
($38,440) ($38,440) ($38,440) ($38,440) ($38,440)

Chapter 4 PERSONNEL MANAGEMENT D. Recruiting, Selection, and Hiring Practices Districts must make aggressive efforts to recruit qualified teachers and employees. To attract and retain the brightest and best employees, they must ensure that their compensation structure and work conditions are competitive in terms of local labor markets. CURRENT SITUATION YISD's Human Resources Department is responsible for recruiting teachers. Recruiting activities and programs of the department include:
• Student Teachers as Substitutes-Each year, the district pays three student teachers to teach as substitutes in critical shortage areas while they complete their student teaching or coursework in an effort to retain them as permanent teachers when they become certified.
• Troops to Teachers-Each year the US Department of Defense reimburses YISD for up to 50 percent of the salaries of five former military personnel hired as teachers.
• Tuition Assistance for Student Teachers-Twenty-three Bilingual Education and eight Special Education student teachers receive $250 from YISD for two days of training to help defray the cost of their tuition and books to increase the availability of qualified bilingual teachers.
• Grow Our Own Program-To move current employees into critical teaching vacancies, the district reimburses paraprofessional and ancillary employees pursuing degrees in Bilingual Education and Special Education. Employees participating in this program are reimbursed for full college expenses upon satisfactory completion of each college course. The reimbursements come from the district's general fund. Twelve employees are participating in this program.
• Alternative Certification-Alternative certification programs attract teachers into the profession from nontraditional sources, such as hiring individuals from the business world and retired individuals with experience in accounting and computers. Alternative certification programs are used on an as needed basis each year at no cost to the district.
• District Permits-YISD has issued eight teaching permits to staff: one to teach orchestra, two to teach Japanese, one to teach Mandarin Chinese, one to teach Russian, one to teach bagpipes, one to teach a special ESL class, and one to teach the American Sign Language class. The individuals did not have teaching backgrounds, but were needed to fill very specific vacant positions. Therefore, the district granted a permit to these individuals, as allowed by the Texas Education Code.

• UTEP Field-Based Programs-The district's Teacher Associates Program and Block Program provide teaching experiences for college students in district classrooms to familiarize them with YISD.
• Student-Teacher Reception-Each spring, the district sponsors a reception for hundreds of student teachers. Each school has an opportunity to demonstrate its programs so that student teachers can meet the school staff and become familiar with their operations.
• Teacher Transfer Fair-Each spring, the district allows teachers desiring a change of assignment to interview with various schools and decide which school best suits their skills and interests.
• UTEP Job Fairs-Twice a year, the district participates in a regional job fair at UTEP, at which principals and other staff members interview student teachers to identify prospective candidates for current and future vacancies.
• Summer School Employment-Student teachers are offered summer school teaching positions and assigned a mentor during the program to provide advice and assistance.
• Five-Day Contract Addendum-The district issues an addendum to the contract of each new teacher without previous teaching experience requiring them to attend a five-day district-prescribed training program to acquaint them with district policies.
• National Advertising-The district places ads in local newspapers and professional journals to solicit applications and expand the pool of prospective job candidates.
• Riverside High School Teacher Magnet School-This school-within-a-school will evolve into a four-year college preparatory program of specially designed courses for students interested in a career in education, to broaden the district's pool of qualified teachers.
• Project Reach Out-This program, administered through the Division of Professional Development, provides mentors to first-year teachers to familiarize them with YISD policies and offer support.
• High School Principal Duties-"In cooperation with the commissioner, each high school principal shall appoint a volunteer teacher as the recruiting officer for the school to assist in providing information about the merits of the teaching profession and in identifying and encouraging talented students to become teachers." Texas Education Code 21.004(e).
The Human Resources Department maintains statistics on employee turnover rates and reasons that teachers leave their positions. Employee turnover is a measure of workforce stability, job satisfaction, and the adequacy of programs and initiatives designed to retain qualified personnel. Exhibits 4-11 and 4-12 summarize employee turnover rates and the reasons for their departure.
Exhibit 4-11 YISD Employee Turnover Rate
1996-97
Employee Category Turnover Rate
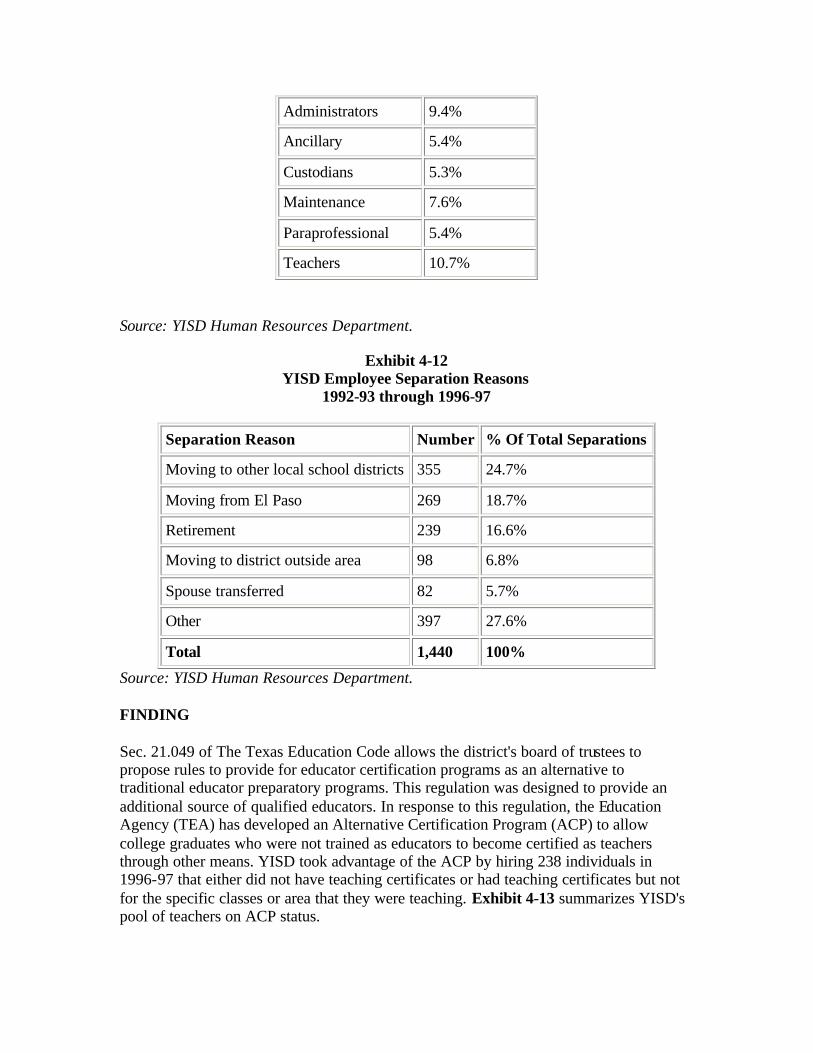
Administrators 9.4%
Ancillary 5.4%
Custodians 5.3%
Maintenance 7.6%
Paraprofessional 5.4%
Teachers 10.7%
Source: YISD Human Resources Department.
Exhibit 4-12 YISD Employee Separation Reasons
1992-93 through 1996-97
Separation Reason Number % Of Total Separations
Moving to other local school districts 355 24.7%
Moving from El Paso 269 18.7%
Retirement 239 16.6%
Moving to district outside area 98 6.8%
Spouse transferred 82 5.7%
Other 397 27.6%
Total 1,440 100%
Source: YISD Human Resources Department. FINDING Sec. 21.049 of The Texas Education Code allows the district's board of trustees to propose rules to provide for educator certification programs as an alternative to traditional educator preparatory programs. This regulation was designed to provide an additional source of qualified educators. In response to this regulation, the Education Agency (TEA) has developed an Alternative Certification Program (ACP) to allow college graduates who were not trained as educators to become certified as teachers through other means. YISD took advantage of the ACP by hiring 238 individuals in 1996-97 that either did not have teaching certificates or had teaching certificates but not for the specific classes or area that they were teaching. Exhibit 4-13 summarizes YISD's pool of teachers on ACP status.

Exhibit 4-13 Teacher Positions
Filled through Alternative Certification Program or On Permit 1996-97
Category Number Percent of Total Teachers
High School
Non-certified (on permit) 107 11.87%
Certified, not in area of assignment 20 2.21%
Middle School
Non-certified (on permit) 23 4.97%
Certified, not in area of assignment 6 1.29%
Elementary Schools
Non-certified (on permit) 55 3.36%
Certified, not in area of assignment 22 1.34%
Total
Non-certified (on permit) 185 6.25%
Certified, not in area of assignment 48 1.62%
233 7.87%
Source: YISD Human Resources Department. Exhibit 4-14 summarizes teacher employment activities.
Exhibit 4-14 YISD Teacher Employment Statistics
1992-93 through 1996-97
Statistic 1992-93 1993-94 1994-95 1995-96 1996-97
Applications processed 1559 1509 1279 1605 1640
Teachers hired 320 304 337 271 340
Teachers hired from UTEP 41% 54% 48% 41% 44%
Source: YISD Human Resources Department YISD's Human Resources Division has developed a five-year strategic plan for building

and maintaining a high-quality workforce. The plan lists goals and their projected costs for the next five years (Exhibit 4-15).
Exhibit 4-15 YISD Human Resources Division
Five-Year Strategic Plan for Teacher Employment
Strategic Initiative Total Cost for Five Years
Increase the educational level of district teachers:
• Increase percentage of teachers with MA degrees from 22 percent to 33 percent
• Expand the salary difference over BA degrees from $1,500 to $2,000
$452,000
Identify and nurture potential teachers at the high school level:
• Appoint a teacher recruiting officer at each high school and pay this person a $1,500 annual supplement
$15,000
Increase percentage of fully certified teachers, especially at high school levels, from 91 percent to 95 percent:
• Offer a sign-on bonus of $1,500 for fully certified teachers in specific areas including math, science, bilingual, and special education
$130,000
Expand the options available for schools to assess teacher aptitude/characteristics:
• Hire consulting firm during 1997-98 school year to assist in identifying the problem and the appropriate assessment tools which may include:
- pre-employment testing and/or structured interviews - additional sources of information such as portfolios, classroom observations, etc.
• Determine teacher candidate's commitment to District Charter
$50,000

and Vision
Streamline hiring process:
• Implement computerized applicant tracking and make information available to principals
• Tie applicant tracking to position control and personnel action forms in the system
$0
Source: YISD Human Resources Department. Exhibit 4-16 categorizes YISD's teachers by degree held. The district has obtained more teachers with masters and doctoral degrees over the past three years.
Exhibit 4-16 YISD Teachers by Degree 1996-97 through 1997-98
Degree Held 1996-97 1997-98
Bachelors 2,289 2,333
Masters 644 653
Doctorate 10 10
Total 2,943 2,996
Source: YISD Human Resources Department. COMMENDATION YISD has effectively incorporated the recruitment of qualified teachers as an integral part of its five-year strategic plan. FINDING The Texas Education Agency (TEA) maintains statistics on school district student and staff ethnicity. These statistics are derived from information reported by school districts through the Public Education Information Management System (PEIMS). Exhibit 4-17 summarizes the ethnicity of YISD's students and teachers.
Exhibit 4-17 YISD Students and Teachers
by Ethnic Classification 1996-97

African American Hispanic Other
Total Minority Anglo Total
# % # % # % # % # % #
Students 1,231 2.6% 40,432 85.4% 436 .9% 42,099 88.9% 5,267 11.1% 47,366
Teachers 83 2.8% 1,622 54.2% 24 .8% 1,729 57.8% 1,261 42.2% 2,990
Source: AEIS 1996-97 Almost 89 percent of the district's students are minorities compared to only 58 percent of its teachers. Eleven percent of the district's student population is Anglo, but 42 percent of its teachers are. Demand for minority educators is high in Texas, which has a growing Hispanic population and a pressing need for bilingual teachers, counselors, and teachers' aides. The Texas State Board for Educator Certification ind icates that during the past 10 years, it has issued 174,172 initial teaching certificates; of those, just 7 percent (12,192) were issued to Hispanic graduates while 3.5 percent (6,096) were issued to African-American graduates. While the district has aggressive recruiting practices within its community, it has done very little in the way of outside recruiting, other than advertisements in various newspapers throughout the US. Most of the district's personnel recruiting is done through UTEP. YISD maintains statistics on local recruiting efforts such as the number of contacts made at semi-annual UTEP Job Fairs and the YISD annual Student Teacher Reception, including the number of teachers hired and the number of applications received as a result of those contacts. However, the district does not monitor how many applications they receive, and the number of teachers hired, from their teacher job postings in national newspapers, nor do they identify types of recruitment efforts that will be conducted, the expected outcomes, and mechanisms that could be used to monitor, track, and evaluate the success of these efforts. YISD, like other Texas districts, must conduct its recruiting efforts with limited resources. YISD's surrounding districts are growing, and local competition for teachers is strong. The district should expand its recruiting efforts outside of the El Paso community. This would provide YISD with an expanded pool of qualified teachers. Recommendation 39: Develop a formal recruiting process that stresses minority recruiting and recruitment outside the El Paso community. YISD also should establish a mechanism to track its recruiting efforts and their outcomes. The district should establish a process to identify the types of recruiting the district will conduct, the expected outcomes, and the mechanisms that will be used to monitor, track, and evaluate their success. For example, the district should maintain a database that lists

places visited for recruiting, the number of contacts made, the number of employees hired as a result of those contacts, and the length of time these employees remain with the district. This would allow the district to focus its recruiting efforts on the geographical areas that produce the greatest number of new employees and discontinue recruiting in locations where few employees are hired. Also, the district should expand its minority recruiting efforts. The district should identify colleges and universities where it has been successful in recruiting minority teachers and intensify its recruiting efforts at those institutions. IMPLEMENTATION STRATEGIES AND TIMELINE
1. The superintendent directs the associate superintendent for Human Resources to develop a recruitment policy with specific initiatives.
June 1998
2. The associate superintendent for Human Resources develops the policy.
July - August 1998
3. The associate superintendent for Human Resources implements the approved policy.
September 1998 Ongoing
FISCAL IMPACT This recommendation can be implemented with existing resources. FINDING YISD updates its job descriptions as vacancies occur. TSPR reviewed 48 YISD job descriptions. Of these, only 27 percent had been updated within the previous two fiscal years; seven percent were updated in 1997; and six percent were updated in 1996. Furthermore, six percent of the job descriptions had not been updated prior to 1991. Job descriptions should provide employees with clear information on his or her specific duties and responsibilities. These descriptions also form a basis for annual performance evaluation. In addition, job descriptions increasingly are used to defend workers' compensation and civil lawsuits. Recommendation 40: Update all job descriptions during the 1998 calendar year and continue to update all job descriptions annually thereafter. All job descriptions should be reviewed and updated annually by the Human Resources Department. Job descriptions should be written in a consistent format and include the

mental and physical demands of the position, the job classification, and pay range. Because many district job descriptions need updating, Human Resources should have all employees complete a questionnaire that identifies their actual job duties. Once the questionnaires have been completed, an ad-hoc committee should be assembled to compile the questionnaire responses and develop detailed job descriptions for each position. In subsequent years, all employees should be required to review their job descriptions annually and indicate any changes that may be needed. IMPLEMENTATION STRATEGIES AND TIMELINE
1. The superintendent directs the associate superintendent of Human Resources to update all job descriptions.
June 1998
2. The associate superintendent for Human Resources develops and distributes job description questionnaires.
June 1998
3. Employees complete and submit questionnaires. July 1998
4. The associate superintendent for Human Resources establishes an ad-hoc committee to develop job descriptions.
July 1998
5. The ad-hoc committee develops job descriptions based upon questionnaire responses.
August 1998
6. Each individual whose job description changes, reviews and proposes revisions to the job description as appropriate, in concert with his or her immediate supervisor.
September 1998
7. The associate superintendent for Human Resources meets with employees and supervisors as necessary for clarification or issue resolution.
October 1998
8. The superintendent reviews key documents with appropriate staff members and approves the revised package of job descriptions.
October 1998
9. The compensation coordinator disseminates approved job descriptions to all employees.
December 1998
10. The associate superintendent for Human Resources updates all job descriptions annually. Ongoing
FISCAL IMPACT This recommendation can be implemented with existing resources.

Chapter 4 PERSONNEL MANAGEMENT E. Employee Compensation CURRENT SITUATION Employee compensation is nearly 80 percent of YISD's operating budget (Exhibit 4-18)
Exhibit 4-18 YISD Budgeted Payroll Costs
1997-98
Payroll Category Amount Percent of Payroll
Salaries and Wages:
Teacher, Librarians, Counselors $106,884,181 54.0%
Professional $16,565,008 8.4%
Substitute $2,077,900 1.0%
Support Personnel $32,136,014 16.2%
Special Assignment Supplemental $3,417,397 1.7%
Extra Duty Pay - Teacher, Librarians, Counselors $2,777,672 1.4%
Extra Duty Pay - Professionals $3,014,843 1.5%
Part-time, Temporary and Substitutes - Support Personnel $2,233,512 1.1%
Employee Allowances:
Group Health and Life Insurance $13,369,241 6.8%
Teacher's Retirement On-Behalf Payments $8,490,149 4.4%
Worker's Compensation Insurance $3,020,459 1.5%
Social Security and Medicare $1,621,074 .8%
Teacher Retirement $1,249,270 .6%
Sick Leave $1,002,578 .5%

Unemployment Compensation $116,678 .1%
Employee Allowances $16,280 0%
Total Payroll Costs $197,992,256 100%
Source: YISD 1997-98 Amended Budget School districts must pay different workers' compensation and unemployment rates for different classifications of employees. Moreover, insurance premiums raise the fringe benefit rate more for employees receiving lower salaries. Exhibit 4-19 summarizes YISD's employee fringe benefit rates.
Exhibit 4-19 YISD Employee Fringe Benefit Rate
1996-97
Employee Category Benefit Rate
Ancillary 36.85%
Paraprofessional 24.06%
Teachers/Nurses/Librarians 10.98%
Administrators 8.01%
Source: YISD Human Resources Department. FINDING The superintendent's current contract was finalized on November 13, 1996. The contract ends on November 12, 2001, subject to termination or extensions. The contract automatically extends for additional one-year terms after November 12, 2001 unless the board chooses to terminate the contract. The superintendent's contract was one of the most controversial issues mentioned in focus groups and public comments. Community members expressed concern over the amount of compensation in the superintendent's contract and suggested that the review team examine the contract and salaries of top- level administrators. Exhibit 4-20 summarizes the terms and conditions of the superintendent's contract along with its associated cost to the district. In addition to the terms stated in the exhibit summary, item 13 under Governance and Duties of the contract states that "subject to the Texas Education Code Sec. 11.202 (d), the superintendent has sole authority to make decisions regarding the selection of all personnel other than the superintendent (Sec. 11.163)." The compensation section of the superintendent's contract states that the superintendent shall receive the same cost-of- living increases to his annual base salary as the board

adopts for all administrative staff. It goes on to state that the superintendent is employed on an annual basis and not as a 226-day employee. The superintendent is entitled to such holidays as are listed on the official district calendar for employees who work 226 days per year.
Exhibit 4-20 Summary of Superintendent Contract
Issued November 11, 1996 Salary & Benefits
Term/Condition 1996-97 1997-98 1998-99*
1999-2000*
2000-01* Total
Annual Salary $145,732 $174,570 $184,695 $195,407 $206,741 $907,145
Annual vacation leave (in addition to that received by all administrators): 12 days, and increases by one additional day on January 1st of each year.
$7,738 $9,269 $10,624 $12,105 $13,722 $53,458
Automobile: Monthly allowance of $660, increasing annually with any cost of living adjustment granted other employees of the district.
$8,237 $8,379 $8,865 $9,379 $9,923 $44,783
Annual travel allowance for spouse.
$1,650 $1,746 $1,847 $1,954 $2,068 $9,265
Annual merit award.
$10,000 $10,000 $10,000 $10,000 $10,000 $50,000
Membership dues to two professional and two civic organizations.
$1,000 $1,000 $1,000 $1,000 $1,000 $5,000
Retirement plan contributions (in $16,000 $24,000 $24,000 $24,000 $24,000 $112,000

addition to any required by law).
Life Insurance: $1,000,000 universal life insurance policy payable to superintendent.
$16,500 $16,500 $16,500 $16,500 $16,500 $82,500
Health Benefits: All health benefits for superintendent and spouse until December 31, 2013, unless employment contract is terminated.
$2,412 $2,388 $2,388 $2,388 $2,388 $11,964
Total Salaries & Benefits Costs
$209,269 $247,852 $259,919 $272,734 $286,342 $1,276,116
Additional Benefits (Not Included in Salary Totals)
Sick Leave: 12 days, and increases by one additional day on November 1st of each year. (1)
$7,738 $9,269 $10,624 $12,105 $13,722 $53,458
Health Insurance: Payments are made quarterly and are based on reimbursements received from Sweetwater ISD. (2)
$5,720 $6,488 $7,188 $7,888 $8,588 $35,872
Travel: All expenses associated with district-related travel. (3)
$17,296 $19,946 $20,000 $20,000 $20,000 $97,242
Source: YISD Human Resources and Finance Departments. * Projected based upon previous cost of living increases.

(1) The superintendent receives an additional sick leave day each year. This amount represents the salary equivalent of a sick leave day but is not included in the total salaries and benefits. (2) Sweetwater ISD, California, reimburses the superintendent for health insurance premiums. This amount is not included in the the superintendent's salaries and benefits for Ysleta. (3) This is not additional income to the superintendent. These costs represents actual and estimated travel expenses for the superintendent's district-related travel.
Exhibit 4-21 compares the YISD superintendent's base contracted wages to those of superintendents in YISD's peer districts. The superintendent re-negotiated his contract in November 1996 and received a $30,000 pay increase at that time.
Exhibit 4-21 YISD Superintendent Salaries
YISD versus Peer Districts 1996-97
District Student Enrollment Salary
Dallas ISD 154,847 $160,000
Houston ISD 196,281 $157,437
Ysleta 46,760 $145,732
Austin ISD 76,497 $140,441
El Paso ISD 64,219 $136,756
Ft. Worth ISD 75,813 $135,187
Socorro ISD 20,886 $122,200
Corpus Christi ISD 41,447 $118,889
San Antonio ISD 61,529 $118,000
Source: TASA Salaries and Benefits in Texas Public Schools, 1996-97. TSPR performed a salary comparison analysis for administrative and teaching positions within YISD using data from the Texas Association of School Boards (TASB) as well as YISD. Exhibits 4-22 through 4-27 summarize these salary comparisons. Note that there is a large disparity between the superintendent's base salary and that of the next highest-paid position. The comparisons indicate that YISD compensates some categories of employees higher than peer averages and others at lower-than-average rates. Data used for salary comparisons are from the 1996-97 Texas Association of School Administrator's (TASA) Salaries and Benefits in Texas Public Schools Study. YISD, and its peer districts, issued pay raises to employees for 1997-98. The raises are not reflected in these exhibits.

The three groups compared were:
• Districts in the Regional XIX Education Service Center (ESC), which are districts in the same geographical area as YISD.
• Districts in TEA's Enrollment Group 7, with student enrollment of 25,000 or more.
• Peer districts selected by YISD administrators for this report.
Exhibit 4-22 YISD Salary Comparisons - Executive Level
YISD to Peer Districts 1996-97
Position YISD
Peer District Average without YISD *
Enrollment Group Average
Region XIX Average without YISD *
Superintendent $645/Day $145,732
$587/Day $132,701
$577/Day $130,458
$392/Day $88,666
Associate Superintendent Curriculum
$357/Day $80,723
$370/Day $85,611
$365/Day $82,384
$287/Day $64,750
Associate Superintendent Human Resources
$381/Day $86,171
$262/Day $83,539
$366/Day $82,671
$354/Day $79,977
Source: TASA Salaries and Benefits in Texas Public Schools, 1996-97. *Calculated from TASA data. Average daily and annual salaries shown since the number of days worked varies between school districts. Special campuses for alternative education are not included as data for these campuses is not available from TASA.
Exhibit 4-23 YISD Salary Comparisons - Director Level
YISD versus Peer Districts 1996-97

Position YISD
Peer District Average without YISD
Enrollment Group Average
Region XIX Average without YISD *
Director of Finance $269/Day $60,709
$295/Day $69,648
$295/Day $66,623
$233/Day $52,663
Director of Food Service
$274/Day $61,946
$260/Day $61,429
$269/Day $60,719
$203/Day $44,323
Director of Instruction
$290/Day $65,602
$309/Day $72,911
$302/Day $68,300
$274/Day $61,841
Director of Human Resources
$273/Day $61,727
$286/Day $67,643
$291/Day $65,852
$263/Day $59,367
Director of Maintenance & Operations
$215/Day $48,548
$286/Day $68,557
$294/Day $66,554
$181/Day $43,835
Director of Special Ed
$276/Day $62,324
$290/Day $68,495
$295/Day $66,597
$261/Day $58,922
Director of Instructional Technology
$265/Day $59,965
$280/Day $66,444
$284/Day $64,197
$275/Day $62,114
Director of Transportation
$273/Day $61,772
$236/Day $56,488
$274/Day $61,875
$148/Day $33,977
Director of Career & Technology
$292/Day $65,948
$304/Day $72,627
$277/Day $62,602
$255/Day $57,629
Director of Athletics $292/Day $65,948
$317/Day $74,697
$308/Day $69,640
$246/Day $54,021
Director of Communications
$246/Day $55,592
$271/Day $64,070
$264/Day $59,657
$225/Day $50,905
Director of Data Processing
$212/Day $47,930
$300/Day $71,370
$286/Day $64,569
$172/Day $38,916
Source: TASA Salaries and Benefits in Texas Public Schools, 1996-97. *Calculated from TASA data. Average daily and annual salaries shown since the number of days worked varies between school districts. YISD salaries are inconsistent when compared to peer districts, the state, and the region. Many factors such as not making a one-time pay adjustment to bring salaries equivalent to peers, cost of living differences, and size of district may contribute to in consistencies in YISD salaries.

Recommendation 41: Perform a detailed wage and benefit analysis among districts of similar size and composition before issuing future contracts to executive administrators. The district should perform detailed wage and benefit analysis before issuing future contracts to any executive position including the superintendent. The analysis should include districts of similar size and composition in addition to local industry, and would assist the district in establishing reasonable, competitive wages and benefits. IMPLEMENTATION STRATEGIES AND TIMELINE
1. The board directs the associate superintendent for Human Resources to conduct wage and benefit analysis prior to recommending and issuing contracts for executive level personnel.
June 1998
2. The associate superintendent for Human Resources conducts wage and benefit analysis for executive level positions. Annually
FISCAL IMPACT This recommendation can be implemented with existing resources. FINDING TSPR performed salary comparisons for campus-level employees using the same data sources and peer districts noted in the previous finding. Exhibits 4-24 through 4-27 summarize these comparisons.
Exhibit 4-24 YISD Salary Comparisons - School Administrators
YISD versus Peer Districts 1996-97
Position YISD
Peer District Average without YISD *
Enrollment Group Average
Region XIX Average without YISD *
High School Principal
$320/Day $72,283
$292/Day $68,072
$312/Day $70,451
$278/Day $62,766
Middle School Principal
$280/Day $63,261
$274/Day $61,061
$275/Day $62,219
$250/Day $56,591

Elementary Principal
$266/Day $60,023
$266/Day $59,386
$260/Day $58,740
$252/Day $56,684
High School Assistant Principal
$245/Day $55,392
$234/Day $50,488
$235/Day $53,511
$218/Day $48,650
Middle School Assistant Principal
$227/Day $51,205
$227/Day $48,145
$215/Day $48,511
$223/Day $49,922
Elementary Assistant Principal
$223/Day $45,074
$226/Day $47,474
$203/Day $45,765
$208/Day $45,084
Librarian $195/Day $36,702
$199/Day $38,411
$163/Day $36,899
$195/Day $35,456
Elementary Counselor
$210/Day $38,875
$225/Day $42,771
$193/Day $39,895
$207/Day $41,642
High School Counselor
$219/Day $42,172
$231/Day $46,771
$194/Day $43,842
$207/Day $43,934
Source: TASA Salaries and Benefits in Texas Public Schools, 1996-97. *Calculated from TASA data. Average daily and annual salaries shown since the number of days worked varies between school districts.
Exhibit 4-25 YISD Salary Comparisons - Professionals
YISD versus Peer Districts 1996-97
Position YISD
Peer District Average without YISD *
Enrollment Group Average
Region XIX Average without YISD *
Nurse $156/Day $28,870
$171/Day $32,882
$168/Day $31,152
$170/Day $33,104
Diagnostician $195/Day $37,683
$227/Day $45,236
$183/Day $41,403
$217/Day $44,530
Instructional Coordinator
$216/Day $48,927
$221/Day $42,117
$225/Day $50,878
$198/Day $45,741
Speech Language Therapist
$155/Day $28,669
$188/Day $37,321
$154/Day $34,698
$176/Day $36,214

Speech Language Pathologist
$195/Day $36,616
$197/Day $38,796
$159/Day $35,918
$176/Day $37,600
Physical Therapist
$246/Day $52,105
$231/Day $45,767
$189/Day $41,621
$219/Day $43,403
Accountant $125/Day $28,258
$159/Day $38,686
$171/Day $38,718
$138/Day $31,280
Source: TASA Salaries and Benefits in Texas Public Schools, 1996-97. *Calculated from TASA data. Average daily and annual salaries shown since the number of days worked varies between school districts.
Exhibit 4-26 YISD Salary Comparisons - Teachers
YISD versus Peer Districts 1996-97
Position YISD Peer District Average without YISD *
Region XIX Average without YISD *
Teacher - Beginning $24,500 $25,270 $24,291
Teacher - 5 Years $26,668 $27,606 $27,227
Teacher - 10 Years
$28,948 $30,538 $30,904
Teacher - 15 Years
$32,650 $33,697 $34,503
Teacher - 20 Years $35,510 $36,785 $37,067
Source: TASA Salaries and Benefits in Texas Public Schools, 1996-97. *Calculated from TASA data.
Exhibit 4-27 YISD Teacher Salaries
YISD versus Peer Districts 1996-97
Variable Houston ISD
Dallas ISD
Ft. Worth
Austin ISD
El Paso ISD
Socorro ISD
San Antonio
Corpus Christi
Ysleta ISD

ISD ISD ISD
Beginning $26,290 $25,250 $27,100 $25,110 $24,633 $24,263 $26,200 $23,313 $24,500
1-5 Years $27,906 $28,237 $29,190 $27,360 $26,537 $26,704 $28,487 $26,515 $26,668
6-10 Years
$31,468 $30,387 $31,870 $29,910 $28,898 $29,624 $31,800 $30,345 $28,948
11-15 Years $33,844 $32,780 $34,700 $32,910 $32,650 $33,384 $34,847 $34,460 $32,650
15-20 Years $36,219 $36,050 $38,510 $36,010 $36,102 $32,650 $37,829 $37,982 $35,510
Source: TASA Salaries and Benefits in Texas Public Schools, 1996-97. TEA publishes statistical data through the Academic Excellence Indicator System (AEIS). These statistics are derived from information submitted by individual districts. Exhibit 4-28 compares YISD's average actual salaries by classification with those of peer districts. On average, YISD's compensation for teachers, professional support personnel, and central administrators is lower than that of other peer districts. However, YISD's salaries for school administrators fall in the midrange.
Exhibit 4-28 Average Actual Salaries
YISD versus Peer Districts 1996-97
District Teachers Professional Support
School Administration
Central Administration
Dallas ISD $33,967 $47,643 $55,338 $92,625
Ft. Worth ISD $34,706 $41,763 $54,251 $71,625
Corpus Christi ISD $34,442 $41,483 $49,996 $70,998
El Paso ISD $32,772 $41,375 $50,387 $69,296
Socorro ISD $32,343 $43,625 $56,612 $68,457
Houston ISD $34,367 $42,153 $56,259 $65,268
San Antonio ISD $36,248 $43,108 $56,183 $64,659
Region XIX $32,140 $40,475 $52,458 $62,726

Austin ISD $32,308 $40,998 $51,528 $62,421
Ysleta ISD $31,639 $38,753 $54,864 $57,390
Source: AEIS 1996-97. The conclusions of the TASB salary study conducted for YISD in 1989-90 were never implemented. Instead, the district uses an internally-developed salary structure that is reviewed and updated annually. Each position in the salary structure typically indicates a starting salary, a mid-point salary, and a maximum salary. Actual salaries are then based upon factors such as education and experience. For example, a new secretary with no previous experience would receive a starting salary of $12,638. YISD's salary structure contains eight administrative classifications with a pay range as high as 50 percent between minimum and maximum salaries. Exhibits 4-29 and 4-30 summarize the current salary ranges paid by YISD. TSPR found that the salary range gaps between minimum and maximum salaries are too large.
Exhibit 4-29 Administrative/Professional Personnel Pay Schedules*
1997-98
Level Minimum Midpoint Maximum % Difference Between Minimum and Maximum
1 $29,394 $36,741 $44,088 50%
2 $32,332 $40,416 $48,497 50%
3 $35,566 $44,456 $53,347 50%
4 $39,121 $48,902 $58,683 50%
5 $43,033 $53,793 $64,550 50%
6 $49,489 $61,635 $74,234 50%
7 $56,911 $71,140 $85,365 50%
8 $65,450 $81,812 $98,174 50%
Source: YISD Human Resources Department. *Based upon 226 days per year.
Exhibit 4-30 Paraprofessional Personnel Pay Schedules*
1997-98
Level Minimum Midpoint Maximum

I $12,638 $16,851 $21,063
II $14,663 $19,544 $24,426
III $16,995 $22,672 $28,331
IV $19,725 $26,288 $32,869
V $22,871 $30,501 $38,131
Source: YISD Human Resources Department. * Based upon 226 days per year/eight hours per day, Recommendation 42: Redefine salary ranges based on wage and benefit comparisons. The district should examine its compensation philosophy for all classifications of employees to determine whether a different approach would be more effective in recruiting and retaining qualified employees. Salary extremes at both the low and high ends should be reconsidered, as well as any disparity between employee classifications. IMPLEMENTATION STRATEGIES AND TIMELINE
1. The associate superintendent for Human Resources conducts wage and benefit comparisons of other districts of the same size and composition.
July - October 1998
2. The associate superintendent for Human Resources analyzes the survey results and establishes a committee to determine wage and benefit alternatives and recommendations.
October 1998
3. The committee develops wage and benefit alternatives and recommendations.
November - December 1998
4. The associate superintendent for Human Resources presents the committee's recommendations to the superintendent for review.
January 1999
5. The superintendent presents the recommendations to the board for review and approval.
February 1999
6. The associate superintendent for Human Resources implements approved wage and benefit schedules. Ongoing
FISCAL IMPACT This recommendation can be implemented with existing resources.

FINDING Nineteen percent of YISD's teachers have at least 20 years of service. Exhibit 4-31 analyzes YISD's teaching staff by years of experience, while Exhibit 4-32 summarizes average teacher salaries by years of experience. The Teacher's Retirement System of Texas (TRS) administers a defined benefit pension plan for school district employees. Under this plan, the state pays retirees a retirement annuity based on a benefit formula based on the employee's years of service, multiplied by a benefit rate of 2 percent for each year of service, times the average of the three highest annual salaries. TRS members are eligible for full or normal retirement at age 65, with five or more years of service; age 60 with 20 or more years of service; or age 50 with 30 or more years of service. On September 1, 1997, TRS members with any combination of age and years' service equal to 80 were eligible to retire (called the Rule of 80). Members also have the option to retire early with reduced benefits.
Exhibit 4-31 YISD Teachers by Years of Experience
1995-96 through 1997-98
Years of Experience 1995-96 1996-97 1997-98
Beginning 183 291 219
1 - 5 Years 809 767 806
6 - 10 Years 508 490 543
11 - 20 Years 930 904 855
Over 20 Years 515 533 585
Total 2,945 2,985 3,008
Source: YISD Human Resources Department and AEIS 1995-96 and AEIS 1996-97.
Exhibit 4-32 YISD Average Teacher Salaries
1995-96 through 1997-98
Years of Experience 1995-96 1996-97 1997-98
Beginning $23,800 $24,500 $25,250
1 - 5 Years $25,212 $25,747 $26,906
6 - 10 Years $27,492 $28,036 $29,388

11 - 20 Years $31,157 $32,829 $33,145
Over 20 Years $37,438 $29,832 $39,722
Source: YISD Human Resources Department . Early retirement incentive plans (ERIPs) often are used to encourage employees to retire sooner than they had planned. Early retirement incentives provide temporary increases in retirement benefits for a limited time called a retirement "window." Retirement incentives can benefit employers by allowing for a controlled exit of employees, reducing payroll costs, creating a smaller workforce, and providing an opportunity to reorganize staff. The objective of an ERIP is to provide financial incentives for a district's most experienced and highly paid employees to retire. Opponents of ERIPs have argued that encouraging experienced employees to leave in this way may have a detrimental impact on school districts. Districts must carefully consider all aspects of the retirement incentive and weigh the benefits against the possible negative impact of losing experienced employees. ERIPS can be adjusted to reduce the number of eligible employees. In 1996, YISD offered its employees an ERIP consisting of an incentive of 25 percent (a one-time lump sum payment in addition to the annual salary) of the employee's annual salary to retire or resign. Ninety-five employees, about 30 percent of those eligible, accepted the ERIP for a total cost to the district of $903,000. However, the district recognized a net savings of $619,000 after paying the ERIP incentive. The superintendent told the review team that he would like to cut central administration by $5 million. Upon the February 1998 TSPR Findings Meeting with YISD administration, the superintendent reinstituted an ERIP. This incentive is based on a percent of an eligible employee's years of experience. For example, 25 years equals 30 percent of base salary; 30 years equals 20 percent of base salary. The Human Resources Department identified a total number of 435 eligible employees, of which 280 were either teachers, librarians, or nurses. Eighty-eight employees opted for the plan, including 57 teachers and 6 central office administrators. YISD's compensation coordinator said that due to a reorganization currently under way, the district would most likely not replace all of the central administrators. The district also offered a $1,000 savings bond to individuals with more than 80 accumulated sick-leave days. A savings bond was provided for each additional block of 25 sick- leave days over the 80 day minimum. For example, if a teacher had accumulated 128 sick- leave days he or she would receive a $2,000 savings bond. The district estimated that their ERIP (including savings bonds) would cost $434,781. However, projected savings in the first year would be $329,527 and $764,308 in the second year.

Recommendation 43: Continue to offer an early retirement incentive plan to enable the district to better control employee retirements and redirect its financial resources. In addition to offering an ERIP to its employees, YISD also should develop an employee replacement plan in the event that too many key administrators and/or teachers accept the ERIP. The district's ERIP should be reviewed and modified based on current needs, TRS requirements, and Internal Revenue Service regulations. Before hiring any replacements, the position needs to be reviewed to determine whether it is still needed. The plan also should comply with the Age Discrimination in Employment Act; it must be voluntary and apply to all classes of employees. IMPLEMENTATION STRATEGIES AND TIMELINE
1. The superintendent, the district's attorney, the chief finance officer, and the associate superintendent of Human Resources fully explore the impact of a retirement plan on overall district operations.
February 1998 Annually
2. The superintendent presents findings and recommendations to the board for discussion and/or approval.
March 1998 and Annually
FISCAL IMPACT This fiscal impact reflects additional savings that could be recognized by YISD if they were to offer another ERIP with a 50-percent incentive to employees. The savings to the district is estimated at $3,807,271 over five years. For conservative estimating purposes, TSPR assumed that all positions currently occupied would be refilled. TSPR calculated a three-year average salary for the district based on AEIS information and including fringe benefits. Key assumptions in the fiscal impact include the following:
• four hundred thirty five employees are eligible to participate in the ERIP.
• an average salary for eligible employees is $44,474 (average salary with benefits = $49,357).
• average fringe benefits at 10.98 percent.
• an estimated 43 employees (30 percent of remaining eligible employees), accept the ERIP. Annual salaries plus benefits for these employees total $2,122,361 (43 x $49,357).

• participants receive a lump sum payment of 50 percent of their average salary in two annual installments of $11,118 each ($44,474 x 50 percent = $22,237/2 years = $11,118 per employee per year), or a total of $478,074 for two years.
• forty-three new hires replace retiring employees at a salary of $25,250 plus benefits, for an annual cost of $1,204,965 (43 new hires x $28,044 = $1,204,965)
Recommendation 1998-99 1999-2000 2000-01 2001-02 2002-03
Employees accept plan $0 $2,122,361 $2,122,361 $2,122,361 $2,122,361
Lump sum payment to employees accepting plan
$0 ($478,074) ($478,074) $0 $0
Hire new employees to replace employees accepting plan
$0 ($1,204,965) ($1,204,965) ($1,204,965) ($1,204,965)
YISD ERIP Savings* $329,527 $764,308 $0 $0 $0
Net Savings $329,527 $1,203,630 $439,322 $917,396 $917,396
* Provided by the Human Resources Department and based on YISD's ERIP offered in the spring 1998.

Chapter 4 PERSONNEL MANAGEMENT F. Records Management
Federal and state regulations list very specific guidelines for employee record-keeping. Because the number of employee lawsuits is on the rise, it is critical to document every aspect of an individual's employment. Organizations must have specific procedures in place to ensure that all documentation is completed, filed, and maintained accurately and in a timely manner. CURRENT SITUATION The three departments within Human Resources are located in different areas within the central office facility. Each maintains individual employee files. Human Resources is not computer-networked and all files are maintained manually. FINDING Each department in Human Resources compiles permanent records for employees' files. When a document is created that needs to become part of any employee's file, it is maintained in the department where it was created, with separate files maintained in each department. When Human Resources staff need access to an employee's medical or disciplinary records, for instance, they must obtain them from the appropriate department within Human Resources that maintains them. According to the associate superintendent for Human Resources, this separation is maintained for legal purposes because this information is confidential. To ensure that employment records are efficiently managed, all employment files should be maintained in a central location because time and efficiencies are gained by not having to interrupt a process to physically retrieve a file that is located in a separate office. After the Human Resources Division is fully networked, this process could be facilitated by making files available electronically for Human Resources employees with appropriate security clearance. The Records Management Department is in the process of obtaining a document- imaging system that would allow all records to be scanned onto CD-ROM diskettes and read on a personal computer. Recommendation 44: Scan all active employee records onto CD ROM and consolidate employee files into one electronic employment file. The Human Resources Division should participate in the research and selection process

for the document imaging system being acquired by Records Management, to ensure that the system can handle both department's imaging requirements. Once the system is obtained, Human Resources should scan all active employee records into the system. Employee documentation then should be consolidated into a single electronic format for each employee. All paperwork contained in separate employee files should be consolidated into one Human Resources file area in a secure, fire-proof location with limited access. Because some materials maintained in an employee's file are subject to open records requests, Human Resources should establish a procedure to ensure that such requests do not contain confidential employee information such as social security numbers, addresses, telephone numbers, and any information on employee family members. To prevent this from happening, all confidential materials should be contained in a separate but removable section of each employee file. IMPLEMENTATION STRATEGIES AND TIMELINE
1. The superintendent directs the associate superintendent for Human Resources to consolidate separate employee files. June 1998
2. The associate superintendent for Human Resources organizes and consolidates employee files.
July - October 1998
3. The Human Resources Division participates in the evaluation and selection of a document- imaging system with the Records Management Department.
June 1998
FISCAL IMPACT This recommendation can be implemented with existing resources.

Chapter 4 PERSONNEL MANAGEMENT G. Staff Development District employees need continuous training to remain knowledgeable in current practices and processes. Such training requires significant time and monetary resources. Effective planning and resource allocation is essential to ensure that all employees receive the best training possible with the limited finances available. The Texas Education Code, Subchapter J, addresses training requirements for school districts. It states that staff development must be conducted in accordance with minimum standards developed by the state's education commissioner for program planning, preparation, and improvement. Staff development must include technology training and training in conflict resolution and discipline. Training must be predominately campus-based, related to objectives developed and approved by the campus site-based decision-making committee (SBDM). The regulation goes on to state that a school district may use districtwide training that is developed and approved through the district- level planning and SBDM committee as described in Section 11.251 of the code. CURRENT SITUATION YISD's Division of Professional Development (Professional Development) is responsible for planning the district's training activities. However, the Division of Instruction and the individual schools also plan staff development activities. The executive director of Professional Development reports to the superintendent. YISD appropriated more than $2 million for training for the 1996-97 fiscal year and has allocated a similar amount for 1997-98. The major focus of these activities are leadership and teacher training. The 1997-98 Professional Development initiatives are:
"...capacity-building for all district employees. Considering site-based management, the concentration of training is on leadership development for employees who are in a variety of leadership positions. Teacher professional development focuses on the instruction thrust of the district, i.e., mathematics, reading, and technology. The remainder of training sessions are based on school or department needs and are developed and provided on an as needed basis throughout the year."
The division budget is summarized in Exhibit 4-33. This budget includes the cost of teacher attendance at seminars and pay for substitute teachers.

Exhibit 4-33 YISD Division of Professional Development
Budgeted Expenditures 1996-97 and 1997-98
Category 1996-97 Budget
% of Budget
1997-98 Budget
% of Budget
Fund 199 - General:
Payroll $686,332 26.0% $583,838 26.1%
Purchased & Contracted Services
$420,977 15.9% $155,000 6.9%
Supplies & Materials $111,143 4.2% $43,861 2.0%
Travel/Subsistence $41,624 1.6% $39,000 1.7%
Misc. $110,458 4.2% $54,500 2.4%
Capital Outlay $0 0% $17,000 .8%
Sub Total $1,370,534 51.8% $893,199 39.9%
Fund 207 - Goals 2000
Payroll $121,280 4.6% $123,131 5.5%
Purchased & Contracted Services $4,240 .2% $0 0%
Supplies & Materials $2,175 .1% $100 0%
Travel/Subsistence $14,990 .6% $100 0%
Misc. $0 0% $0 0%
Capital Outlay $0 0% $0 0%
Sub Total $142,685 5.4% $123,331 5.5%
Fund 210 - ESEA I
Payroll $76,377 2.9% $97,590 4.4%
Purchased & Contracted Services
$99,629 3.8% $77,000 3.4%
Supplies & Materials $62,539 2.4% $25,721 1.1%
Travel/Subsistence $7,839 .3% $36,500 1.6%

Misc. $100,045 3.8% $25,000 1.1%
Capital Outlay $0 0% $0 0%
Sub Total $346,429 13.1% $261,811 11.7%
Fund 282 - Urban Systemic Initiative
Payroll $693,603 26.2% $914,090 40.8%
Purchased & Contracted Services
$0 0% $0 0%
Supplies & Materials $37,029 1.4% $16,500 .7%
Travel/Subsistence $25,983 1.0% $15,000 .7%
Misc. $10,423 .4% $0 0%
Capital Outlay $0 0% $0 0%
Sub Total $767,038 29.0% $945,590 42.2%
Fund 488 - So. Regional Ed. Board Grant
Payroll $0 0% $0 0%
Purchased & Contracted Services
$0 0% $0 0%
Supplies & Materials $1,144 0% $0 0%
Travel/Subsistence $11,422 .4% $15,000 .7%
Misc. $5,170 .2% $0 0%
Capital Outlay $0 0% $0 0%
Sub Total $17,736 .7% $15,000 .7%
Total $2,644,422 100% $2,238,931 100%
Source: YISD Division of Professional Development. Professional Development's organizational structure is depicted in Exhibit 4-34.
Exhibit 4-34 YISD Division of Professional Development

Current Organization
Source: YISD Division of Professional Development. FINDING Professional Development offers the following training programs, institutes, and seminars: Leadership Development
• Leadership Development Process Training Program-All principals and central office administrators receive training in leadership throughout the year. A cadre of district, school, and central office administrators participated in Train the Trainers sessions and are available to conduct this training for a variety of district managers.
• Assistant Principals' Leadership Seminars-These seminars are conducted monthly throughout the year for district assistant principals, to create an in-district pool of potential principals. Topics range from the development of personal platforms to specific leadership skills and proficiencies.
• Site-Based Decision-Making Leadership Training-School Educational Improvement Councils receive orientation training for new members each September and May.

• Quality Leadership Training Program-School-based trainers receive monthly training on a variety of topics dealing with professional development techniques, strategies, and planning.
• Conflict Resolution Training-Administrators and others in leadership positions can attend six-hour sessions on conflict resolution.
• Administrators' Retreat-A two-day Administrators' Retreat is conducted every summer on issues pertaining to the district and the change process.
Professional Development for Teachers
• The Urban Systemic Initiative (USI)-The National Science Foundation funds this initiative for the purpose of developing mathematics and science literacy and the integrating technology into instruction. USI mentor teachers present districtwide Math/Science Institutes that support standards-based curricula such as Systemic Initiative for Montana Mathematics and Science (SIMMS), Connected Math program (CMP), and Math Investigations across three districts via the El Paso Collaborative for Academic Excellence; facilitate standards-based instruction at individual schools; facilitate grade- level meetings that support instruction; and provide extensive workshops and training in the math and science for parents and the community.
• Math Investigations-Kindergarten through fifth-grade teachers receive on-going training and support on this standards-based mathematics program. Five YISD elementary schools use Math Investigations to some extent.
• Gifted and Talented Certification and Rectification Training Program-Every summer, kindergarten through sixth-grade teachers are offered the state-required 30-hour training for Gifted and Talented certification. In addition, the district also provides six-hour sessions required to maintain this certification.
• Math Constructivism-Kindergarten through twelfth-grade mathematics teachers receive training on student-centered math strategies. Training to augment teachers' math content knowledge, data analysis skills, and reflective practices also is provided.
• SIMMS High School mathematics Training-Math teachers from four high schools participate in the Systemic Initiative for Montana Mathematics (SIMMS) and Science Project which provides training for ninth-grade teachers in developing hands-on exploration activities based on real-world problems throughout the school year.

• TAAS Mathematics Curriculum Training-About 200 elementary teachers receive Sharon Wells TAAS math curriculum training once every six weeks.
• Connected Math Project-Training on the CMP, a standards-based mathematics program, is offered to middle school ma thematics teachers.
• Mathematics Professional Development Awards-Four of YISD's high school math departments have received $4,000 Professional Development Awards. Each school created their own year- long mathematics professional development plan based on their training needs and their students' instructional needs.
• Discretionary Fund Mini-Grants-YISD offers its teachers the opportunity to submit mini grant applications in categories ranging from technology equipment to math and science professional development. Title II funds are used to provide for contractual fees, substitutes, and teacher stipends.
• Math Their Way-Elementary pre-kindergarten through second-grade teachers participate in training for the Math Their Way curriculum. Follow-up training is offered to teachers who have already had the initial week- long training.
• The Early Literacy Initiative-This initiative is the umbrella for Reading Recovery (RR), Descubriendo la lectura (DLL), Literacy is For Everyone (LIFE), and Students and Teachers Approaching Reading Successfully (STARS) programs. RR and DLL address the needs of the bottom 20 percent of first grade students at risk of reading failure; LIFE and STARS are designed to strengthen reading instruction for students in grades Kindergarten through second-grade. About 80 teachers participate in a graduate- level course in reading during each school year to acquire intervention reading strategies for at-risk first-grade students.
• New Teacher Induction Program-The New Teacher Induction Program supports beginning teachers in the district. Teachers with no previous experience must sign an addendum to their contract committing to five additional days of staff development during the first year of teaching. About 200 new teachers participate in this training each year.
• Project Reach Out-Project Reach Out is a mentor/beginning teacher program designed to provide beginning teachers with assistance and support from experienced mentor teachers. About 70 mentor teachers receive training in peer coaching, the coaching cycle, and effective instructional strategies each year.

• Hooked on Literacy-A five-day summer institute on early literacy is provided for all kindergarten through second-grade teachers in the district. In addition, six sessions are provided during the school year. These sessions support the Reading Recovery/Descubriendo la Lectura program.
• Interdisciplinary Curriculum Training-Dr. John, a consultant, provides on-site training on multi-disciplinary curriculum at Indian Ridge Middle School, Parkland High School, Ranchland Hills Middle School, and Riverside High School.
• Assessment Issues Conference-This conference provides its participants with the knowledge and tools needed to redefine and redesign current assessment practices.
• Professional Development Leadership Training-This districtwide initiative supports teachers/coordinators, curriculum specialists, deans of instruction, and other campus personnel in charge of organizing, coordinating or providing professional development at their respective campuses.
• Advanced Placement Institute-This institute is a collaborative project with UTEP that offers week-long training sessions and advanced placement classroom teaching to all high school and middle school teachers who teach advanced placement (AP) or Pre-AP courses.
• Distance Learning-Distance learning, the ability to observe another classroom or teacher through the use of computers or video conferencing, is offered to schools for professional development training on various [topics].
• Technology Training-Technology training offered in conjunction with the Instructional Media Department offers about 60 sessions of technology training each year; these sessions are available for all district personnel.
Specialized Campus/Department Requests
• Specific training in topics such as strategic planning and decision-making is provided to district departments and campuses upon request.
Professional Development for Parents/Community
• Family Science and Family Math training sessions for parents are provided by USI mentor teaches as requested by campuses.
• Training for El Paso County librarians in the scientific process and in displaying science modules is provided upon request.

• Training also is provided for the Student Organization for Future Educators (SOFE), a UTEP organization that provides students, teachers, parents, and the community with opportunities to participate in the most recent standards content and instructional strategies used in mathematics and science.
• USI math and science mentors collaborate with the Personnel Department to provide a two-day training session for about 400 district substitutes in the areas of cooperative learning, classroom management, and other substitute teacher issues. This training was conducted for the first time during 1997-98. The district plans on offering this annually.
COMMENDATION The Division of Professional Development offers a total of 62 different training programs to district employees. FINDING The Division of Professional Development has an impressive reading recovery program: Reading Recovery/Descubriendo La Lectura. Reading recovery is an initiative that identifies young students with poor reading skills that could potentially cause them to have problems learning throughout their school years. Once students are identified, they are placed into a reading recovery program to assist them in developing stronger reading skills. Reading Recovery teachers demonstrate reading programs for young children by working with students individually behind a one-way mirror while they are observed by groups of first-grade teachers. In this way, these teachers increase their knowledge of literacy learning by observation and ensuing discussions. These classes are offered in both Spanish and English two times per week. In addition, certified RR/DLL teachers participate in ongoing professional growth sessions known as continuing contact classes. The classes help observing teachers see how their fellow teachers are using the new tools and techniques they have acquired to teach learning skills. The teacher that performs the demonstration receives constructive feedback from the observing teachers. COMMENDATION The district offers a unique way to help teachers develop their skills by observing master teachers in action and receiving constructive feedback from their peers. FINDING In 1993-94, Ysleta joined the Socorro and El Paso school districts in obtaining a five-year, $15 million grant from the National Science Foundation's Urban Systematic Initiative (USI). USI has contributed to rising TAAS scores in mathematics in these

districts. The USI funds 16 full-time YISD mentor-teachers who develop workshops on instructional strategies for faculty, and provide hands on- instruction to all schools, in mathematics and science. USI teacher-mentors do not have regular classroom assignments while participating in the initiative, so they are available to assist teachers throughout the district. YISD mentor-teachers also conduct parent- family nights to get parents involved in their children's education through hands-on exercises in science and mathematics activities. COMMENDATION The district obtained a grant to fund the positions of mentor-teachers for mathematics and science. FINDING YISD employs more than 5,700 individuals full-time, all of whom receive some form of training throughout the year. Support teams are assigned to assist specific schools with their training needs but no single department is responsible for coordinating, monitoring, and tracking districtwide staff development. Because of this, the district does not have comprehensive information on staff development offered or received by individual employees. According to district administrators, Professional Development is not always included in the district's instructional planning sessions. Therefore, they may plan activities that do not correlate to the present focus of the Instruction and Curriculum Department. Consistent with SBDM, many departments and schools provide their own training activities. Moreover, teachers, administrators, and central office personnel often attend seminars offered by entities outside of YISD. Professional Development maintains a database of all training sponsored by YISD. The database is updated when employees submit documentation of external training classes they've attended, however, employees do not consistently submit their documentation. This adds to the difficulty of monitoring and coordinating staff development activities. TSPR administered written surveys to central office administrators, principals, assistant principals, teachers, and students. Survey questions and responses are summarized in Exhibit 4-35.
Exhibit 4-35 Overall Grading
YISD Professional Staff Development
Has the staff development program used in your school improved your classroom

teaching and management?
Respondent Group SA A NO D SD NR
Teachers 15% 38% 12% 20% 14% 1%
What grade would you assign to how well current procedures identify staff training, needs that help you in developing instructional materials and in delivering instructional programs.
Respondent Group A B C D F NR
Central Administrators 7% 31% 36% 20% 5% 1%
Please grade the combined efficiency and effectiveness of the Division of Professional Development of Ysleta ISD.
Respondent Group A B C D F NR
Principals and Asst. Principals 24% 49% 19% 4% 2% 2%
SA-Strongly Agree NO-No Opinion SD- Strongly Disagree A-Agree D-Disagree NR-No Response TSPR received mixed responses as to the effectiveness of staff development sessions; some felt that their needs were met, while others felt that the sessions offered were not supporting the objectives of the programs taught to students. Principals, in particular, seemed pleased with the effectiveness and efficiency of Professional Development, while 53 percent of teachers felt staff development improved their classroom teaching and management. Finally, YISD's professional development activities focus mainly on teachers and administrators. Little training is provided to paraprofessionals other than job-specific training, such as safety training and food service management, provided by individual departments. Yet paraprofessional personnel are a valuable district resource and should receive opportunities to increase their knowledge and skills. Recommendation 45: Centrally coordinate staff development activities and functions, including the identification of needed staff development activities and the facilitating of training received by employees. Without circumventing the spirit of SBDM, Professional Development should centrally coordinate the training needs of individual campuses and departments, and obtain staff
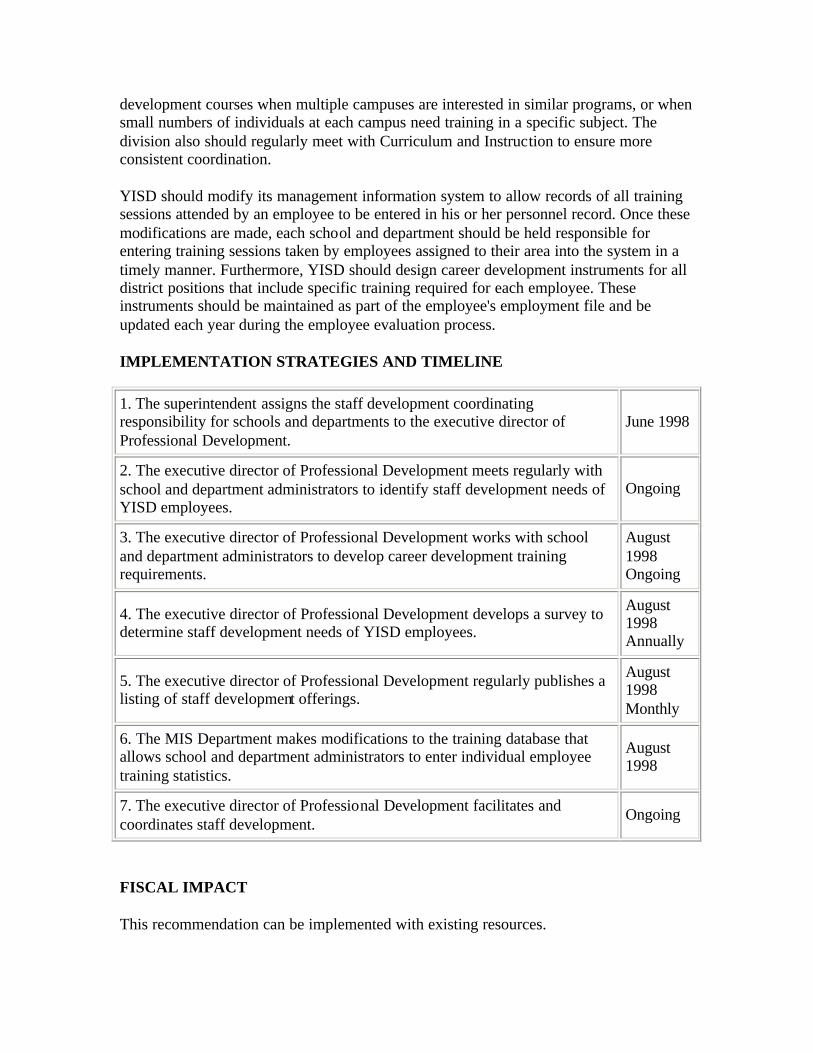
development courses when multiple campuses are interested in similar programs, or when small numbers of individuals at each campus need training in a specific subject. The division also should regularly meet with Curriculum and Instruction to ensure more consistent coordination. YISD should modify its management information system to allow records of all training sessions attended by an employee to be entered in his or her personnel record. Once these modifications are made, each school and department should be held responsible for entering training sessions taken by employees assigned to their area into the system in a timely manner. Furthermore, YISD should design career development instruments for all district positions that include specific training required for each employee. These instruments should be maintained as part of the employee's employment file and be updated each year during the employee evaluation process. IMPLEMENTATION STRATEGIES AND TIMELINE
1. The superintendent assigns the staff development coordinating responsibility for schools and departments to the executive director of Professional Development.
June 1998
2. The executive director of Professional Development meets regularly with school and department administrators to identify staff development needs of YISD employees.
Ongoing
3. The executive director of Professional Development works with school and department administrators to develop career development training requirements.
August 1998 Ongoing
4. The executive director of Professional Development develops a survey to determine staff development needs of YISD employees.
August 1998 Annually
5. The executive director of Professional Development regularly publishes a listing of staff development offerings.
August 1998 Monthly
6. The MIS Department makes modifications to the training database that allows school and department administrators to enter individual employee training statistics.
August 1998
7. The executive director of Professional Development facilitates and coordinates staff development.
Ongoing
FISCAL IMPACT This recommendation can be implemented with existing resources.

Chapter 5 FACILITIES USE AND MANAGEMENT This chapter reviews YISD's facilities use and management functions in the following areas:
A. Management and Organization
B. Facilities Planning and Design
C. Facility Use
D. Plant Maintenance
E. Custodial Services
F. Energy Management
BACKGROUND
A comprehensive facilities program is responsible for planning and analyzing facilities use; providing plant maintenance and custodial services; and developing an effective energy management program.
The program must integrate facilities planning with all other aspects of school planning, including strategic planning. Facilities personnel should be involved in design and construction activities and be knowledgeable about operations and maintenance activities.
YISD's Facilities Department is responsible for facility planning, construction, renovation, maintenance, custodial oversight, and groundskeeping for all of the district's schools and other facilities. Exhibit 5-1 summarizes the Facilities Department's budget for fiscal 1996-97 and 1997-98.
Exhibit 5-1 Facilities Department Budget Summary
Fiscal 1996-97 and 1997-98

Source: YISD Finance Department. * Honeywell energy management contract in the amount of $625,000 was transferred from the Auxiliary Service budget for 1997-98. ** $226,000 was budgeted for a land purchase in 1997-98.

Chapter 5 FACILITIES USE AND MANAGEMENT
A. Management and Organization
CURRENT SITUATION YISD's Facilities Department is headed by an executive director who has an architectural degree and more than 18 years of construction experience. The executive director has a technical and administrative staff of three employees. Maintenance management responsibilities are handled by four team leaders and two custodial supervisors. The team leaders, in turn, are supported by six foremen. Two custodial supervisors manage 366.5 full time equivalent (FTE) custodians who report primarily to school principals. Excluding custodians, the department is staffed by 170 employees. Exhibit 5-2 presents the Facilities Department's organizational structure.

Exhibit 5-2 Facilities Department Organizational Chart
Total Staff = 170
Source: YISD Facilities Department. Exhibit 5-3 summarizes department staffing by position classification.

Exhibit 5-3 YISD Facilities Department
Summary of Employees by Position Classification Fiscal 1997-98
Position Classification Total Positions
Management/Supervision 4
Administrative/Clerical 9
Foremen 6
Craftsmen (Skilled) 91
Helpers 6
Grounds/Landscaping 54
Totals 170
Source: YISD Facilities Department. Exhibit 5-4 compares the department's staffing with the selected peer districts. Most district facilities departments perform similar functions; however, some districts outsource varying components of facilities maintenance.
Exhibit 5-4 Facilities Department Staffing
YISD versus Peer Districts
Variable El Paso ISD
Ysleta ISD
Northeast ISD
Corpus ISD
Socorro ISD
Ave. w/o YISD
1996-97 Enrollment 64,444
47,366 45,184 41,606 21,098 43,083
Total Number of Schools 80 56 54 56 23 53
Facilities-Related Positions
Management and Supervision 9 4 6 6 2 5.8
Administrative and Clerical 8 9 9 5 6 7.0
Foreman 8 6 4 9 8 7.3
Carpenters, Roofers, Painters, Glaziers, & Masons 32 19 16 31 11 22.5
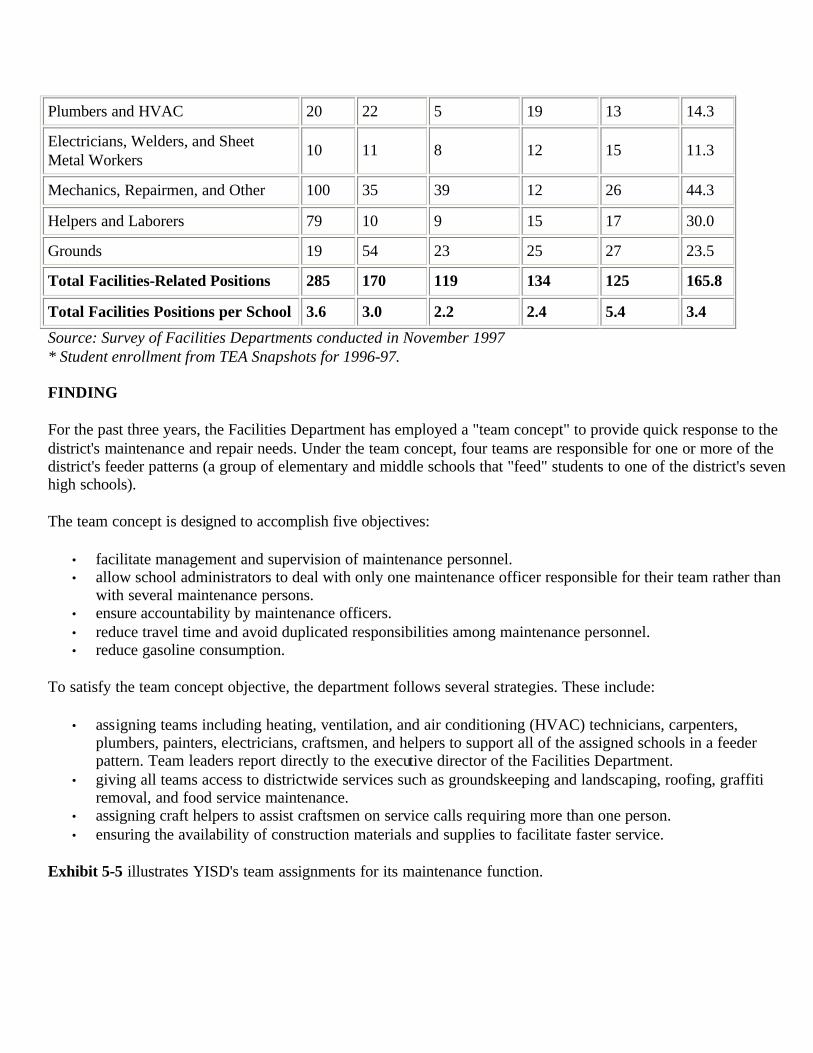
Plumbers and HVAC 20 22 5 19 13 14.3
Electricians, Welders, and Sheet Metal Workers
10 11 8 12 15 11.3
Mechanics, Repairmen, and Other 100 35 39 12 26 44.3
Helpers and Laborers 79 10 9 15 17 30.0
Grounds 19 54 23 25 27 23.5
Total Facilities-Related Positions 285 170 119 134 125 165.8
Total Facilities Positions per School 3.6 3.0 2.2 2.4 5.4 3.4
Source: Survey of Facilities Departments conducted in November 1997 * Student enrollment from TEA Snapshots for 1996-97. FINDING For the past three years, the Facilities Department has employed a "team concept" to provide quick response to the district's maintenance and repair needs. Under the team concept, four teams are responsible for one or more of the district's feeder patterns (a group of elementary and middle schools that "feed" students to one of the district's seven high schools). The team concept is designed to accomplish five objectives:
• facilitate management and supervision of maintenance personnel. • allow school administrators to deal with only one maintenance officer responsible for their team rather than
with several maintenance persons. • ensure accountability by maintenance officers. • reduce travel time and avoid duplicated responsibilities among maintenance personnel. • reduce gasoline consumption.
To satisfy the team concept objective, the department follows several strategies. These include:
• assigning teams including heating, ventilation, and air conditioning (HVAC) technicians, carpenters, plumbers, painters, electricians, craftsmen, and helpers to support all of the assigned schools in a feeder pattern. Team leaders report directly to the executive director of the Facilities Department.
• giving all teams access to districtwide services such as groundskeeping and landscaping, roofing, graffiti removal, and food service maintenance.
• assigning craft helpers to assist craftsmen on service calls requiring more than one person. • ensuring the availability of construction materials and supplies to facilitate faster service.
Exhibit 5-5 illustrates YISD's team assignments for its maintenance function.

Exhibit 5-5 YISD Maintenance Function
Team Assignments
Source: YISD Facilities Department. COMMENDATION The Facilities Department uses the maintenance teams to provide more efficient service to schools and departments with minimal management.

Chapter 5 FACILITIES USE AND MANAGEMENT
B. Facilities Planning and Design
Facilities planning and design is intended to ensure that all aspects of facilities management function together to create a safe, healthy environment for students. The most critical aspects of facilities planning and design are long-range planning and standardization of design and materials. Ongoing assessments of the condition of all facilities are essential to the planning process.
CURRENT SITUATION
YISD's facilities planning process involves the superintendent, Facilities Department, Finance Division, Department of Instruction, principals, and community stakeholders. In all TSPR found that districtwide facilities planning processes are not well documented, and planning activities are generally poorly coordinated among departments.
FINDING
YISD employs a "pay as you go" approach to fund school renovation and new construction. Each year, the district earmarks $10 - $15 million from general funds for plant maintenance and operations and construction projects. The district has spent more than $40 million on these purposes over the past four years.
YISD has used creative financing strategies to avoid the excessive use of bond issues and other debt that would result in tax increases. The condition of the district's schools has not suffered; the review team visited 29 of the district's 56 schools and found most were in good condition.
Because of the district's avoidance of debt in financing renovation and new construction projects, it s plant maintenance and operations costs tend to be higher than those of its peer districts. By the same token, YISD's debt service costs are much lower than those of its peer districts. Exhibit 5-6 compares YISD's plant maintenance and operations cost per student to selected peer districts and Region XIX and state averages. YISD's actual plant maintenance and operations cost per student ranked second-highest among the peer districts in fiscal 1995 and 1996, and third for its budgeted figures for fiscal 1996-97. For the last three fiscal years, however, YISD's long-term debt balance and its debt service per student was lower than all other peer districts and the Region XIX and state averages (Exhibit 5-7). Exhibit 5-8 illustrates the relationship between YISD's 1996-97 budgeted plant maintenance and operations costs and debt service and that of the peer districts.

Exhibit 5-8
Plant Maintenance and Operations and Debt Service Per Student
YISD versus Peer Districts
Fiscal 1996-97

Source: Texas Association of School Boards Benchmarks 1994-97.
COMMENDATION
YISD has financed school renovation and new construction projects out of general funds, avoiding the debt service associated with long-term financing arrangements. FINDING
YISD establishes a planning committee for each proposed school construction or renovation project. Planning committee participants include the superintendent, Facilities executive director, each maintenance team leader, principals, and representatives from the neighborhood in which the school will be constructed or renovated.
The student population in YISD's Parkland feeder pattern is growing, and principals in that area have formed a planning committee to determine how schools should be organized to best accommodate their students' educational needs. During school visits, TSPR met with the Parkland feeder pattern principals to discuss the facility planning committee process and the level of school administration and community input.
The Parkland feeder pattern planning committee is considering the construction of two schools that would accommodate pre-kindergarten through second grade and three schools for grades 3 through 6.
The types of issues addressed by the planning committee include:
• the optimal number of schools needed to accommodate student growth in the feeder pattern, and the construction cost impact on the district if four larger, versus five moderate-sized, new schools are built.
• the administrative cost of building an additional school (such as additional costs for a principal, assistant principal(s), and custodial staff).
• possible increases in transportation costs that would result for students residing far enough away from the new school sites to need school bus service.
COMMENDATION
YISD's Facilities Department provides stakeholders in school renovation and new construction projects with valuable input into the planning and decision-making processes.
FINDING
YISD has completed components of a facilities Master Plan, however, a formal Facilities Master Plan does not exist.

Facilities planning coordinates the district's educational programs with its physical space and resources.
Some of the key components of a Facilities Master Plan include:
• identification of the current and future needs of district facilities and educational programs.
• analysis of the condition of existing schools (inventory analysis).
• development of student growth projections and community expansion plans.
• analysis of costs and capital requirements.
• development of facilities program management and design guidelines.
While the Facilities Department in achieving good results, not all of the planning processes are well documented and some are not complete. Failing to document successful planning processes or procedures could result in a loss of institutional knowledge and interrupt the progress of the district in this area should existing leadership change.
The Texas Education Agency (TEA) recommends the facilities planning process model shown in Exhibit 5-9 to assist districts in organization and planning. Using TEA's planning model as a guide, the exhibit also shows which aspects of the facilities planning process that YISD has completed, which aspects were accomplished but not documented, and which still require additional work.
Exhibit 5-9
Facilities Planning Process Recommended by TEA
versus Current YISD Process
Program Element Mission Responsibilities Deliverables YISD
Deliverables
Planning Needs Assessment
Identify current and future needs.
Demographics, facilities survey, boundary, funding, education program, market, staff capability, transportation analysis
Partially complete. The educational program needs and transportation analyses are not complete.
Scope Outline required building areas; develop schedules
Programming, cost estimating, scheduling, cost analysis
Complete

and costs.
Strategy Identify structure.
Facilities project list, master schedule, budget plan, organizational plan, marketing plan
Complete
Public Approval
Implement public relations campaign. Public and media relations Complete
Approach Management Plan
Detail roles, responsibilities, and procedures.
Program management plan and systems Not documented
Program Strategy
Review and refine details. Detailed delivery strategy Not documented
Program Guidelines
Educational specifications, design guidelines, Computer Assisted Design Drawing (CADD)standards
Not documented
Source: TEA and YISD.
A significant component of the facilities planning process that YISD's Facilities Department has completed is a five-year construction budget (Exhibit 5-10).
Exhibit 5-10
YISD Facilities Department
Five-Year Construction Budget

1 Includes: Furniture, Testing, Architect Fees, Asbestos Abatement, Construction, and Landscaping costs 4 Budgeted FY 1996-97 column is the Architect costs 5 Budgeted FY 1996-97 column is the Architect cost plus $500,000 *Each of these projects have a $500,000 payment to the General Fund

Recommendation 46:
Complete the facilities planning components necessary for a comprehensive facilities master plan.
Using TEA's facilities planning model as a guideline, the Facilities Department should complete the remaining planning components so that the district will have a comprehensive facilities master plan. The existing long-range construction plan should be incorporated as a component of the overall facilities planning process. Processes that are being accomplished but are not documented should be documented. The community should be involved in the process and the plan should reflect the goals and objectives included in the district's strategic plan.
IMPLEMENTATION STRATEGIES AND TIME LINE
1. The executive director of Facilities uses the TEA model to complete the facility planning process and forms a facilities master planning committee including the superintendent, assistant superintendent of Instruction, chief finance officer, and other cabinet positions the planning committee members feel are needed.
June 1998
2. The executive director of Facilities and the superintendent assess those facilities planning components that require completion and assign deliverables to committee members.
July 1998
3. Facilities planning committee members complete their assignments. August - September 1998
4. The executive director of Facilities develops a preliminary facilities master plan based on committee members' input and deliverables. October 1998
5. The executive director of Facilities, in conjunction with the facilities planning committee, designs a method to obtain community involvement in the Facilities Master Planning process.
October 1998
6. The executive director of Facilities completes the facilities master plan. November - December 1998
7. The board approves the plan. January 1999
FISCAL IMPACT
This remaining components of the facilities master plan could be completed with existing resources.
FINDING

Student enrollment projections are an integral part of the facilities planning process. YISD's Finance Department projects enrollment with a combination of the "cohort survival model" and a TEA method for forecasting attendance. The cohort survival model projects student enrollment five years in advance through such factors as demographic and construction trends. TEA's method, projects enrollment two years in advance and is tied to the state's funding formula. To project new construction, YISD considers the age, structural integrity, and capacity of present facilities the number of portable buildings available, and enrollment trends likely to affect facility needs, as well as health and safety issues.
Interviews with the executive director of Facilities, the assistant superintendent of Instruction, and the chief finance officer revealed that YISD's departments do not coordinate various plans that could change student enrollment. For instance, the executive director of Facilities had no information about the impact of the district's open enrollment program on facility use rates. Also, neither the chief finance officer or the assistant superintendent for Instruction were familiar with school expansion plans prepared by the Facilities Department.
Increased coordination between district departments could improve both the district's student enrollment projection function and facilities planning.
Recommendation 47:
The Facilities and Finance Department and Instruction should meet twice a year to develop enrollment projection and jointly prepare a management report.
Student enrollment projections should be developed by a team representing the Facilities, Instruction, and Finance Departments. These departments should share enrollment data and incorporate it in the district's normal management reports. The heads of the Facilities, Instruction, and Finance Departments should meet at least twice a year to discuss student enrollment projections and trends.
IMPLEMENTATION STRATEGIES AND TIMELINE
1. The superintendent establishes a student enrollment projection committee consisting of the superintendent and the executive director of Facilities, the assistant superintendent for Instruction, and the chief finance officer.
July 1998
2. Student enrollment projection committee members meet to develop student enrollment projections. August 1998
3. The committee meets at least twice a year to discuss the district's enrollment projections and trends.
January 1999, and semi-annually thereafter
4. The superintendent ensures that committee enrollment projections and trends are incorporated into the district's strategic and Facilities Master Plans.
January 1999, and annually thereafter

FISCAL IMPACT
This recommendation can be implemented with existing resources.
FINDING
YISD's principals are allowed to contract for small building renovation jobs at their schools without consulting the Facilities Department, as long as the funds are within the campus budget or are raised by campus based organizations like the Parent-Teacher Organization or boosters and safety clubs.
During a tour of the district's facilities with the executive director of Facilities, the TSPR review team learned that the offices of several counselors and the assistant principal at Del Valle High School were being renovated without the input of the Facilities Department. The executive director also mentioned that the installation of carpet on the walls of the Riverside High School theater had not been approved by Facilities. This is entirely within the principals rights. However, without input from Facilities, the principal may not have been aware of specifications for materials that meet city fire codes, have the most durability, and can be purchased at the best price.
Performing such projects without the involvement of the Facilities Department also could result in inadequate construction specifications and inadequate insurance and bonding requirements that protect the district against accidents, faulty workmanship, and materials.
Recommendation 48:
Establish a board policy that requires principals to obtain approval from the Facilities Department before initiating small construction projects on school campuses.
IMPLEMENTATION STRATEGIES AND TIMELINE
1. The executive director of Facilities develops a board policy concerning renovation and construction projects on school campuses. July 1998
2. The executive director of Facilities submits the draft of the board policy to the superintendent and cabinet for review. July 1998
3. The executive director of Facilities revises the draft policy as recommended by the superintendent and cabinet.
August 1998
4. The superintendent submits the policy to the board for approval. August 1998
FISCAL IMPACT
This recommendation can be implemented with existing resources.

FINDING
YISD's Facilities Department uses a simplified design approach that calls for standard 900 square-foot classrooms in all new and renovated schools. The interiors of the classrooms are modified as appropriate, based on each school's programs and needs. The schools' exteriors are designed to be consistent with the surrounding neighborhoods. For example, newly constructed or renovated schools in the Ysleta feeder pattern are designed with a Spanish colonial architectural style to match the architectural design in that neighborhood. Schools in the Eastwood High School feeder pattern are designed with a more modern lineal architectural design to match the dominant style in that area.
This sort of standardization allows the district to use common materials and building systems on all its projects, and reduces architectural and engineering fees since fewer lines of inventory items need to be stocked, and higher volumes can be ordered, reducing overall procurement and inventory costs. In addition, standardization creates a uniform, cohesive appearance in the school's facilities.
While the district's Facilities Department uses a simplified design approach that has been repeated in most new and renovated schools, neither the approach nor design standards are formally documented. Documentation can provide the basis for construction bids from potential vendors, historical rationale for why certain decisions were made, and can provide vital information to new employees, the board and the community at large.
Recommendation 49:
Develop a Facilities Design construction handbook.
A construction and design handbook should outline the goals of the district's standardization effort, and establish guidelines for implement ing standardization procedures. This handbook should contain districtwide guidelines for new and renovation construction projects and specifications for the standardization of equipment, materials, and building systems.
IMPLEMENTATION STRATEGIES AND TIMELINE
1. The executive director of Facilities directs the maintenance team leaders to begin developing a design and construction standards handbook. August 1998
2. Maintenance team leaders consult with Facilities Departments from other school districts that use design and construction standards handbooks to determine best practices.
September - October 1998
3. Maintenance team leaders select an exemplary design and construction standards handbook to use as a model in the development of the YISD handbook.
November 1998
4. The executive director of Facilities contracts with an outside consultant to assist Maintenance team leaders with the development of the handbook.
December 1998 - March 1999
5. The executive director of Facilities reviews, modifies and approves the construction April 1999

design handbook.
6. The executive director of Facilities and the superintendent presents the handbook to the board for approval.
May 1999
FISCAL IMPACT
The Facilities Department should contract with an outside consultant to assist in the development of the facilities design and construction standards handbook. An outside consultant should be available for a one-time fee of $7,500.
Recommendation 1998-99 1999-2000 2000-01 2001-02 2002-03
Develop a Design and Construction Handbook ($7,500) $0 $0 $0 $0
FINDING
The deadline for bringing facilities into compliance with the Americans with Disabilities Act of 1990 (ADA) was January 26, 1995. This deadline is significant to school districts, because in addition to filing a complaint with the federal government, an individual can file a private lawsuit under ADA, charging that a public school has failed to make itself accessible to the disabled.
The ADA does not require the complete renovation of each existing building, but sets strict requirements for new construction. Older buildings do not have to be made completely accessible to people with disabilities; the law requires access to all educational programs and services, not to every building. To determine compliance, districts must perform a self-evaluation to ensure that all programs and services are accessible to the disabled.
Exhibit 5-11 summarizes YISD's ADA Improvement Program over the past three years. YISD has spent more than $1.5 million to bring its facilities into compliance with ADA requirements. Although the district has allocated funding to bring YISD facilities into ADA compliance, the executive director of Facilities told the review team that the district remains uncertain as to the funding required to complete ADA renovations.
Exhibit 5-11
YISD ADA Improvement Program
1994-95 through 1996-97

Fiscal Year
Number of Projects Type of Projects Amount
1994-95 1 Classroom wing remodeled, restrooms, bus drop-off, and handicap ramps. $861,206
1995-96 7 Restrooms and handicap ramps. 253,631
1996-97 11 Elevators, chairlifts, handicap ramps, sidewalks, restrooms, sinks, training classrooms, and bus drop-offs. 391,302
Total 19 - $1,506,139
Source: Facilities Department.,
Recommendation 50:
Conduct an ADA evaluation of all YISD facilities and include a strategy for bringing each facility into ADA compliance in the Facilities Master Plan.
YISD should determine the extent of renovations and upgrades needed to bring all its facilities into compliance with ADA standards. Once the extent of necessary renovations and upgrades has been determined and a total cost estimated, the district should develop a prioritized plan to bring each facility into compliance and include it in the Facilities Master Plan.
IMPLEMENTATION STRATEGIES AND TIME LINE
1. The executive director of Facilities, in conjunction with the director of Purchasing, develops a request for proposals (RFP) to conduct an ADA evaluation of all facilities within YISD.
August 1998
2. The director of Purchasing issues the RFP, evaluates the responses in conjunction with the director of Plant Operations, and selects a firm to conduct the evaluation.
September - October 1998
3. The executive director of Facilities presents the contract to the board for approval. November 1998
4. The executive director of Facilities authorizes the consulting firm to begin and monitor the evaluation.
December 1998
5. The executive director of Facilities includes the prioritized upgrades and renovations, with associated costs, in the long-term Facilities Master Plan.
January 1999
FISCAL IMPACT

An ADA evaluation could be conducted for a one-time cost of approximately $25,000.
Recommendation 1998-99 1999-2000 2000-01 2001-02 2002-03
Conduct ADA evaluation for all YISD facilities ($25,000) $0 $0 $0 $0

Chapter 5 FACILITIES USE AND MANAGEMENT
C. Facility Use
A school district must continually monitor its classroom space to determine whether it is sufficient to comfortably accommodate students. To assess the adequacy of classroom space, the district must track total square footage, the number of classrooms, and student enrollment on an ongoing basis. CURRENT SITUATION YISD owns 907 acres of property and buildings encompassing 5.6 million square feet, including 383 transportable or temporary buildings. Transportable buildings are specially constructed mobile facilities that provide a low-cost temporary alternative to new construction when additional space is needed. Most YISD schools have one or more transportable buildings that supplement the campus' permanent facilities. As mentioned earlier in the chapter, the district is divided into seven feeder patterns, one for each high school. The feeder patterns are developed based on the elementary and middle schools that "feed" students to each of the district's seven high schools. Exhibit 5-12 shows the use rates of YISD schools by feeder pattern. This analysis shows that most of the schools in the Eastwood and Hanks High School feeder patterns have facility use rates above 100 percent before the use of temporary or transportable buildings. In contrast, at least three schools in both the Bel Air and Ysleta High School feeder patters are underused.
Exhibit 5-12 YISD Facility Utilization by Feeder Pattern


Source: YISD Facilities Department. FINDING According to the Finance Department's Student Attendance Office, YISD has not changed any of its attendance zones in more than 10 years. As noted above, most schools in the Eastwood and Hanks High School feeder patterns have facility use rates above 100 percent before the use of temporary or transportable buildings is considered; in contrast, use rates for schools in the Ysleta High School feeder pattern range from 44 percent to 119 percent. The three middle schools in the Ysleta High School feeder pattern (Ysleta Middle, Camino Real Middle, and Rio Bravo Middle) have use rates of 44 percent, 67 percent, and 71 percent respectively. Enrollment could be leveled at these three middle schools if attendance zones were adjusted. Recommendation 51: Analyze and adjust attendance zones to maximize the use of current facilities. YISD should analyze student population in existing school attendance zones and prepare more detailed student enrollment projections by school. The district should internally conduct a land-use study to assist in the estimation of current and future levels of single and multi- family housing within the district. More detailed campus- level enrollment projections and adjustments in attendance zones would help the district use its permanent facilities as efficiently as possible and reduce the need for many of the district's temporary buildings. IMPLEMENTATION STRATEGIES AND TIME LINE
1. The executive director of Facilities and the chief finance officer work together to develop an attendance projection model based on enrollment and demographics of each individual school zone.
June 1998
2. The executive director of Facilities and the chief finance officer recommend attendance zone changes to reduce the need for temporary buildings.
June and July 1998
3. The superintendent presents the proposed attendance zone policy to the board for approval.
August 1998
4. The superintendent implements the new approved policy. September 1998
FISCAL IMPACT Attendance zones can be adjusted with existing district resources.

FINDING Effective school facilities use at least 80 percent of their capacity, according to TEA. As shown in Exhibit 5-12, YISD has provided some schools with more portable buildings than they need, resulting in enrollment levels below 80 percent of full capacity. Best practices show that temporary buildings should constitute no more than 5 percent of total campus square footage, and YISD's 383 temporary buildings fall within this guideline. Eleven YISD schools with temporary buildings are operating at enrollment levels of 44 to 79 percent of capacity before the use of temporary buildings should be considered (Exhibit 5-13).
Exhibit 5-13 YISD Schools with Excess Temporary Buildings
School
Number of Portables Percentage of Capacity Before Use of Temporary Buildings
Ranchland Middle School 8 71%
Hacienda Heights Elementary 1 77%
Mesa Vista Elementary 1 79%
Marian Manor Elementary 3 77%
Desert View Middle School 1 67%
Dolphin Terrace Elementary 2 80%
Riverside High School 11 81%
Ramona Elementary 10 72%
Ysleta Middle School 1 44%
Camino Real Middle School 2 67%
Capistrano Elementary 6 70%
Total 46 N/A
Source: YISD Facilities Department. In a previous review of Beaumont ISD, the review team found that adjusted attendance zones would improve efficiency and generate savings. The team estimated that Beaumont ISD could eliminate some portable buildings, and reduce maintenance costs for these building. The district followed these recommendations and was able to redirect $11.8 million bond money to more productive projects.
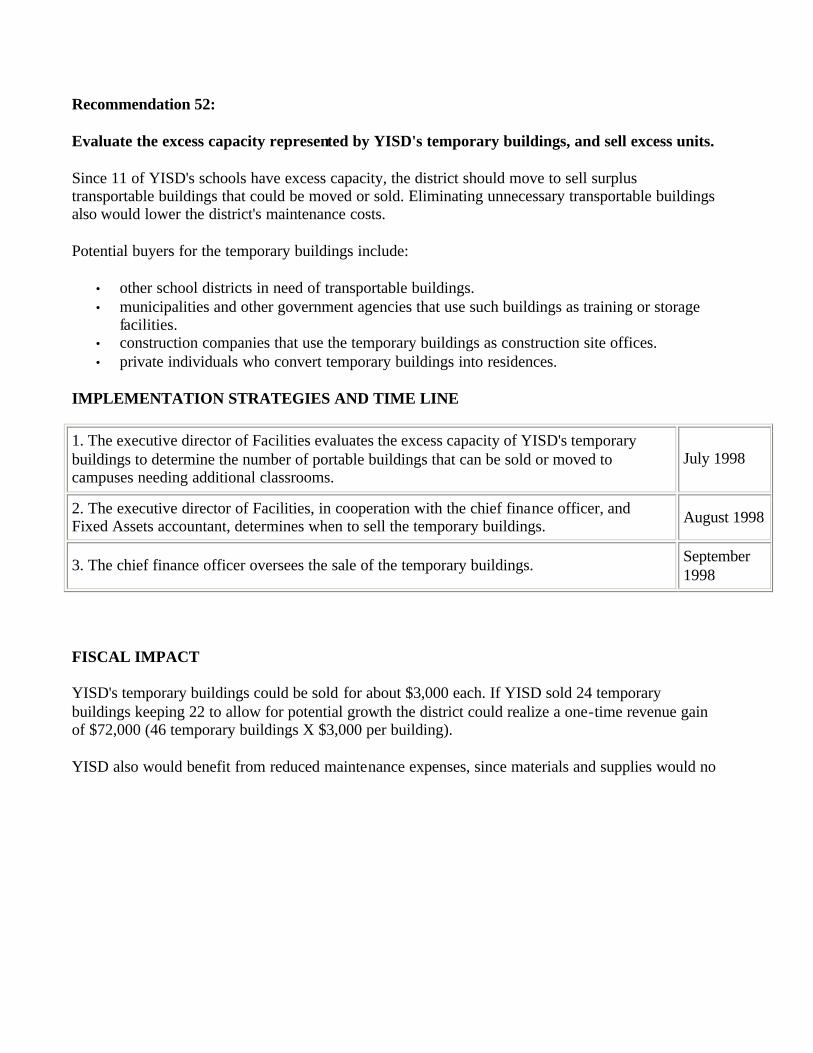
Recommendation 52: Evaluate the excess capacity represented by YISD's temporary buildings, and sell excess units. Since 11 of YISD's schools have excess capacity, the district should move to sell surplus transportable buildings that could be moved or sold. Eliminating unnecessary transportable buildings also would lower the district's maintenance costs. Potential buyers for the temporary buildings include:
• other school districts in need of transportable buildings. • municipalities and other government agencies that use such buildings as training or storage
facilities. • construction companies that use the temporary buildings as construction site offices. • private individuals who convert temporary buildings into residences.
IMPLEMENTATION STRATEGIES AND TIME LINE
1. The executive director of Facilities evaluates the excess capacity of YISD's temporary buildings to determine the number of portable buildings that can be sold or moved to campuses needing additional classrooms.
July 1998
2. The executive director of Facilities, in cooperation with the chief finance officer, and Fixed Assets accountant, determines when to sell the temporary buildings. August 1998
3. The chief finance officer oversees the sale of the temporary buildings. September 1998
FISCAL IMPACT YISD's temporary buildings could be sold for about $3,000 each. If YISD sold 24 temporary buildings keeping 22 to allow for potential growth the district could realize a one-time revenue gain of $72,000 (46 temporary buildings X $3,000 per building). YISD also would benefit from reduced maintenance expenses, since materials and supplies would no

longer be needed for portables that are sold. YISD's maintenance cost for the 1996-97 school year was $7,287,962, and the approximate square footage for all district facilities is 5,648,812 square feet. The approximate maintenance cost per square foot, then, is $1.29 ($7,287,962/5,648,812). The estimated square footage per portable is 750 x 24 portables = 18,000 square feet. Eliminating 18,000 square feet of space would result in an annual maintenance savings of $23,220 (18,000 X $1.29). FISCAL IMPACT
Recommendation 1998-99
1999-2000
2000-01
2001-02
2002-03
Sell temporary buildings $72,000 $0 $0 $0 $0
Reduce maintenance cost by selling transportable buildings $23,220 $23,220 $23,220 $23,220 $23,220
Net Savings $95,220 $23,220 $23,220 $23,220 $23,220

Chapter 5 FACILITIES USE AND MANAGEMENT D. Plant Maintenance CURRENT SITUATION An efficient and effective maintenance operation for a school district requires well defined structures and possesses which include:
• adequate information to plan and manage daily maintenance operations; • a good work order system that enables maintenance staff to be responsive to
repair requests from schools and districts facilities; • a proactive system (preventive maintenance) that ensures maintenance staff
regularly services equipment in order to minimize down time; and, • a mechanism to monitor maintenance service levels and obtain periodic feedback
regarding maintenance functions that need improvement.
FINDING YISD's facilities maintenance function could operate more efficiently if computer technology already owned by the district were fully implemented. In 1994, the district purchased maintenance and construction management software developed by J.D. Edwards, which includes applications for work order processing, preventive maintenance tracking, and construction project accounting. After nearly four years; however, the district still has not implemented the construction management software in 80 percent of its schools. Implementation finally began in October 1997, when the district started test piloting the work order and preventive maintenance applications as 12 of its 56 schools. Because of the lack of automation, the process for prioritizing work orders and completing service requests is inefficient at most YISD schools and administrative facilities. When an item needs repair at one of the schools in which the system has not been implemented, work orders are submitted to the Maintenance Department via telephone, facsimile, or mail. Work order forms are not numbered, and there is no formal system in place to log work orders, prioritize service requests, or prepare cost estimates. In addition, the school or department requesting maintenance service cannot track the status of a service request once it is submitted because completed work orders are not returned to the originating school or department. If the process were fully automated, work order status could be monitored by the originating school or department on-line. YISD's preventive maintenance program also is not automated except at those schools being test piloted and the district practices preventive maintenance in only a limited number of areas, such as in heating and air conditioning, plumbing and boilers, and

vehicle maintenance. The district's preventive maintenance program includes the following items:
• cleaning, adjusting, and testing the air conditioning and heating units • cleaning plumbing drains and roof drainage pipes • cleaning and inspecting both interior and exterior lighting and finishes • inspecting and painting interior exterior surfaces as needed • inspecting elevators • inspecting gas meters and lines • inspecting boilers • inspecting water coolers • inspecting and cleaning kitchen (food service cafeterias)
Although the Maintenance Department performs many preventive maintenance activities for district facilities; a method for systematically tracking and monitoring completed maintenance activities does not exist. For example, critical preventive maintenance tracking and monitoring functions the district does not perform include:
• maintaining record of when equipment is purchased and equipment life expectancy;
• maintaining detailed preventive maintenance schedules for all major equipment such as heating, ventilation and air conditioning units and the recommended dates for maintenance
• maintaining detailed records of the cost and frequency of repairs and maintenance;
• performing cost benefit analysis on keeping equipment that has undergone excessive repair; and
• maintaining detailed equipment replacement schedules.
Additionally, the review team requested historical project data for each facility within the district. While accumulation of this data is the responsibility of the construction area of the Facilities Department, and not the Maintenance area, the project accounting application of the maintenance and construction module has the capability of summarizing historical project data in a centralized database. To date, the Facilities Department has never used the construction project accounting application. Examples of the types of summary data that the management review team requested included:
• permanent facility number assigned by the school district; • year of construction completion; • building square footage; • type of construction; • architectural design firm for each building; • construction contractor for each building; • number of classrooms for each building;

• construction cost; • architectural and engineering cost; • furniture and equipment cost; • technology cost; • site purchase cost; • number of acres of land; and, • cost per square foot for construction, furniture and equipment and site
development.
Summary data about existing facilities of this nature is necessary for both cost and project management aspects of future facilities projects. The accumulation of critical maintenance data in a computerized system would allow the Facilities Department to establish performance standards for all maintenance functions. Performance standards define and document the desired goals and level of quality for maintenance functions and provide a measurement system to assess quality on a continuous basis. With predetermined performance standards, Maintenance work can be monitored to ensure that schools and district departments receive efficient, quality services Recommendation 53: Expedite full implementation of the maintenance and construction management module. YISD should immediately complete the implementation of its computerized maintenance and construction management module to increase the operational efficiency and cost-effectiveness of processes including the prioritization and tracking of work orders; cost estimates for maintenance requests; preventive maintenance scheduling; and the tracking of historical project data from various schools and department s. Once the module is implemented throughout the district, YISD should receive the additional benefit of monitoring maintenance performance and establishing standards based on historical and desired performance, that would further improve the operating efficiency of maintenance functions. IMPLEMENTATION STRATEGIES AND TIMELINE
1. The executive director of Facilities develops an expedited implementation schedule to introduce the automated maintenance and construction management module at all district schools and facilities.
January - February 1998
2. The executive director of Facilities communicates the expedited implementation schedule to all maintenance personnel, school principals, and department heads.
March 1998
3. The executive director of Facilities, along with Maintenance team April - May

leaders, schedules appropriate work order system training for school principals and department heads not already using the automated maintenance and construction management module.
1998
4. The executive director of Facilities ensures full implementation of the automated maintenance and construction management module.
June 1998
5. The executive director of Facilities, along with Maintenance team leaders, receives detailed management reports from the automated maintenance and construction management module that provide information such as labor and material costs, work backlogs, equipment maintenance schedules, and historical project cost and operational data.
June 1998
FISCAL IMPACT This recommendation can be implemented by existing Maintenance and Management Information Systems staff. FINDING TSPR's surveys of district managers and teachers indicate that many customers see room for improvement in YISD's maintenance service. In all, principals and assistant principals seem to feel that the condition of YISD's facilities is good, but rate maintenance service levels as average or below. As noted in the previous finding, such results may well demonstrate the inadequacies of the district's work order and preventive maintenance systems. About 71 percent of the principals and assistant principals who responded to TSPR's survey graded the condition of YISD facilities at "A" or "B" (Exhibit 5-14). By contrast, 81 percent of this group feels that maintenance service is only average or below, grading it at "C" or lower.
Exhibit 5-14 Principal and Assistant Principal Opinion Survey Results
Survey Question
A B C D F No Response
Grade the condition of Ysleta ISD facilities. 11% 60% 24% 5% 0% 0%
Grade maintenance services. 4% 15% 35% 26% 20% 2%
Source: Stakeholder surveys, November 1997.

Teachers' perceptions of the condition of school facilities were similar to those of their principals and assistant principals; 69 percent responded to the question "Please grade the extent to which the facilities encourage a positive learning environment" with a grade of "A" or "B." Teachers seemed to feel more positively about maintenance efforts; 60 percent rated maintenance and cleanliness at their schools at "A" or "B." Exhibit 5-15 presents teachers survey ratings on facilities' environment, cleanliness, and maintenance.
Exhibit 5-15 Teachers Stakeholder Opinion Survey Results
Survey Question
A B C D F No Response
Grade the extent to which facilities encourage a positive learning environment
27% 42% 20% 7% 2% 2%
Grade the schools with regard to cleanliness and maintenance 23% 37% 25% 11% 2% 2%
Source: Stakeholder surveys, November 1997. Exhibit 5-16 presents verbatim comments provided by principals, assistant principals, and teachers. These comments highlight areas in which these district stakeholders feel maintenance services could be improved.
Exhibit 5-16 Principals/Assistant Principals and Teachers
Opinion Survey Results
Principals and Assistant Principals Survey Teacher Survey
"In what one or two ways could the operational efficiency of Ysleta ISD be improved?"
"How do you think the safety of the facilities can be improved?"
"Establish accountability for maintenance and grounds personnel."
"Update and modernize heating, cooling and water quality. Better drainage around portables."
"Improve building maintenance, ground maintenance...."
"Repairs to building. Carpet needs to be replaced, leaks in roof repaired...."
"Allow schools to contract minor repairs (building)."
"In what one or two ways do you think that the operational efficiency of YISD could be

improved?
"The maintenance department is extremely inefficient. Adequate central support for this vital service is totally inadequate."
"Better maintenance materials such as water pumps and motors need to be available for immediate use whenever needed."
"Maintenance of plants could be improved considerably."
"We have had problems with maintenance workers who come to our school once a week or less."
"Quicker method of responding to small emergency requests such as plumbing and air conditioning/heating problems."
Source: Stakeholder surveys, November 1997. These survey results are particularly interesting in light of the fact that the Facilities Department has no formal mechanism in place to obtain feed back about the campuses satisfaction with its maintenance service. Recommendation 54: Conduct an annual maintenance and custodial customer satisfaction survey. The executive director of Facilities and the Maintenance team leaders should develop and distribute a customer satisfaction survey to all district employees. Survey results should be used by the Facilities Department to improve maintenance services and respond more effectively to customer needs and concerns. IMPLEMENTATION STRATEGIES AND TIMELINE
1. The executive director of Facilities and the Maintenance team leaders develop an annual customer satisfaction survey. June 1998
2. The executive director of Facilities directs the distribution of the Maintenance customer service satisfaction survey to all district employees.
September 1998
3. The executive director of Facilities and the Maintenance team leaders organize, compile, and analyze the survey results. October 1998
4. The executive director of Facilities and the team leaders develop programs and strategies to address the key issues and concerns raised in the survey.
November 1998 and each month thereafter
FISCAL IMPACT

This recommendation can be implemented by existing Facilities Department staff. FINDING The Maintenance, Transportation, and Warehouse Departments occupy the Support Service Center and their operations have grown too large for the existing space. The Support Service Center is inadequate in the following areas.
• The portion of warehouse space allocated for maintenance materials and supplies such as lumber, sheet rock, cement, plumbing supplies, HVAC supplies, and fencing supplies is limited. Consequently these types of items must be purchased directly from the district's supply vendors as they are needed. When the items are not readily available from the warehouse, maintenance jobs are delayed.
• The center has inadequate space for maintenance-related records. • The center lacks adequate storage space for grounds equipment. The fenced area
on the Support Service Center parking lot where most of the groundskeeping equipment is stored is congested, and some equipment that should be stored inside is stored outdoors.
• The lack of storage area has placed burdens on the Transportation Department as well. The Transportation area has eight maintenance bays to accommodate required vehicle maintenance, however only six of these bays are being used for maintenance, the other two are used for storage by the Facilities Department and more room is still needed to store bus tires and other transportation parts.
• Parking is insufficient to accommodate the number of employees assigned to work in the Support Service Center building.
YISD identified one potential facility for expansion in close proximity to the Support Service Center; this facility had more than 100,000 square feet of space and included a loading dock necessary for the delivery of materials and supplies. Recommendation 55: Identify an appropriate site and relocate the district's central warehouse facility. YISD should determined the appropriate amount of warehouse space needed for accommodating the district's textbook operations and relocate the central warehouse functions to provide additional space for the Maintenance and Transportation Departments. If the textbook supply component of Warehouse operations was relocated to another facility, more room could be made available in the Support Service Center building to better accommodate the Maintenance and Transportation operations. With the implementation of the Passive Order System (POS) that is discussed in the Purchasing and Warehouse Services Chapter and the work order component of the

Construction Management module, it is anticipated that the district will be allowed to manage their warehouse space more efficiently and determine the appropriate space required for warehousing inventory. Once this is determined then the exact amount of additional warehouse space can be decided. During this process, Facilities management should consider locating other functions such as the Printing Department that is also overcrowded, in the new central warehouse in order to optimize space usage. IMPLEMENTATION STRATEGIES AND TIMELINE
1. The executive director of Facilities, in conjunction with the chief finance officer and the director of Purchasing, develops requirements for an alternative location for the central warehouse.
June - August 1998
2. The executive director of Facilities conducts an internal feasibility study with other departments that will use the facility, to determine the potential cost and service improvement benefits of purchasing additional warehouse space.
September - November 1998
3. The executive director of Facilities, in conjunction with the chief finance officer, prepares an internal cost estimate based on the current purchase price of the candidate building along with any associated renovation costs.
December 1998 - January 1999
4. The chief finance officer, superintendent, and board review the results of the study and make a decision regarding the feasibility of purchasing additional warehouse space, with associated financing arrangements.
January 1999
5. The board approves the purchase of the warehouse facility. February 1999
FISCAL IMPACT If a vacant or abandoned facility that meets the district's needs can be located to house the district's central warehouse operation, it could be obtained for approximately $500,000. Most renovation to an existing facility could be performed by the district's Maintenance staff or contracted out to a construction company, depending on the complexity of the renovations required and the time required for completion. Renovation costs could total $250,000, depending on the condition of the facility. Actual relocation of the Warehouse Department could be completed by district employees.
Recommendation 1998-99 1999- 2000- 2001- 2002-

2000 01 02 03
Identify an appropriate site and relocate the district's central warehouse facility.
($750,000) $0 $0 $0 $0

Chapter 5 FACILITIES USE AND MANAGEMENT
E. Custodial Services Custodial services are essential to maintain a safe school environment, provide minor maintenance, and both monitor and report facility repair needs to appropriate authorities. Industry standards suggest that efficient custodial staffing patterns allocate about one custodian per 19,000 gross square feet of space, depending on the duties assigned. CURRENT SITUATION YISD custodians clean and maintain 5.7 million square feet of space in district facilities. District custodians are responsible for cleaning and performing general maintenance for 56 schools and eight support facilities. During the 1997-98 school year, the district employed 368.5 full- time custodians (two are supervisors and six are substitutes). YISD custodians once reported to the Facilities Department. However, during the 1995-96 school year, the custodial services function was decentralized and principals became responsible for issuing custodians daily work assignments and preparing and monitoring custodial budgets. Oversight responsibility for custodial services, including quality monitoring for cleaning standards and training for equipment and product usage, was assigned to two custodial supervisors who report to the Facilities Department. Exhibit 5-17 presents YISD's budgeted custodial expenditures for 1996-97 and 1997-98.
Exhibit 5-17 YISD Budgeted Custodial Expenditures
Fiscal 1996-97 and 1997-98
Description 1996-97 1997-98 Percent + Increase (Decrease)
Payroll $8,477,567 $8,884,292 4.80%
Contracted Services 892,648 941,591 5.48%
Supplies 871,449 1,026,772 17.82%
Other Operating Exp. 82,420 40,753 (50.55%)
Capital Outlay 267,735 230,824 (13.79%)
Total 10,591,819 11,124,232 5.03%
Source: YISD Facilities Department. Exhibit 5-18 compares the average building square footage covered by custodians in YISD and its peer districts. YISD custodians rank third in terms of average square footage assigned.
Exhibit 5-18 Building Square Footage Covered by
Custodial Staff YISD versus Peer Districts

District Gross Square Footage of Floor Space
Total Number of Custodians
Average Square Footage Assigned to Each Custodian
Socorro ISD 2,900,786 152.0 19,084
Northeast ISD 5,097,314 383.5 16,982
Ysleta ISD 5,648,812 368.5 15,329
Corpus Christi ISD
4,807,214 325.5 14,769
El Paso ISD 8,204,000 562.0 14,598
Average w/o YISD 5,252,329 356 16,358
Source: Survey of peer district Maintenance Departments, November 1997. FINDING YISD has two custodian supervisors assigned to provide management support to school custodians regarding cleaning supply choices and equipment use. These districtwide custodial supervisors also rotate among schools to ensure cleanliness standards are maintained. This method of custodial supervision provides adequate districtwide management support while conserving staff resources. The custodial supervisors provide periodic supply and equipment training to custodial staff at schools. Custodia l supervisors also arrange for outside supply and equipment vendors to provide training to custodians at least annually. COMMENDATION YISD maximizes staff resources by using two districtwide custodial supervisors to ensure adequate quality control and training. FINDING YISD custodians are hired by and report directly to school principals. As noted above, custodial industry standards suggest that one custodian is required to clean 19,000 square feet of space in most commercial buildings. Instead of the 19,000 square feet industry guideline, however, YISD uses a four-part formula developed by its Budget Department to assign custodial staffing. The formula considers square footage of facility space, number of classrooms, number of portables, and the age of the building. Exhibit 5-19 outlines YISD's custodial staffing formula.
Exhibit 5-19 YISD Custodial Budget Guideline/Staffing Formula
Factor Formula
Square Footage 1 custodian/45,000 square feet of space
Number of Classrooms 1 custodian/20 classrooms, 4 rest rooms and hallways (excluding portables)

Number of Portable Classrooms 1 custodian/10 portables
Age of the Facility 5% per 10 years, age factor
Source: YISD Budget Department. While principals are given this custodial formula as a staffing guideline, they are not required to use it. In fact, TSPR learned that only eight facilities comply with the formula (Exhibit 5-20). According to YISD's formula, the district has 61.5 custodians more than it requires.
Exhibit 5-20 YISD Actual Custodial Staff Allocation
Compared to Budget Guideline/Staffing Formula 1997-98

Source: Compiled by TSPR. Under Current Custodial Positions, custodial supervisors and substitutes are excluded from the calculation.

Interestingly, the industry standard of 19,000 square feet per custodian also suggests that the district has 61.5 more custodians than it needs. Exhibit 5-21 compares YISD's custodial staffing allocations at each facility to the industry guideline of one custodian for every 19,000 square feet.
Exhibit 5-21 Comparison of YISD Custodial Allocations to Industry Guideline
1997-98


Source: Compiled by TSPR. Under Building Area (SF) only main building space is accounted for, these figures do not include temporary building square footage. If properly applied, YISD's custodial staffing formula achieves the same result as the recognized industry cleaning standard, while giving additional weight to variables such as the age of facilities, number of classrooms, and number of portables. Proper application of the district's custodial staffing formula would bring YISD closer into line with patterns in peer districts that maintain more efficient custodial staffing. (see Exhibit 5-20). Recommendation 56: Require the district's custodial staffing formula to be properly applied across YISD schools, to make the most efficient use of custodial staffing resources. IMPLEMENTATION STRATEGIES AND TIMELINE
1. The Budget director requests updated facilities data required for the custodial staffing formula from the executive director of Facilities. May 1998
2. The Budget director develops a spreadsheet derived from the custodial staffing formula showing the number of custodians required at each facility and submits the information to the superintendent.
May 1998
3. The superintendent directs the reduction of 61.5 custodians through attrition, beginning in the 1998-99 school year. June 1998
4. Principals and the custodial supervisors monitor the quality and productivity of custodial services at each facility and take corrective actions to maintain quality, as necessary.
August 1998 and ongoing, thereafter
FISCAL IMPACT By properly applying the district's custodial staffing formula, the district should reduce its number of custodians from 368.5 to 307. The average custodian salary is $15,900 and the benefits rate is 36.85 percent ($15,900 x 36.85 percent = $21,759). Given the present annual attrition rate of 5.3 percent for custodians, YISD's custodial staff could be reduced by 19.5 in 1998-99; 18.5 in 1999-2000; 17.5 in 2000-01; and six in 2001-02.
Recommendation 1998-99 1999-2000 2000-01 2001-02 2002-03
Require the district's custodial staffing formula be properly applied to maximize custodial staffing resources.
$424,301 $826,843 $1,207,626 $1,338,180 $1,338,180
FINDING A study by the American School and University study for Region 6, which includes the state of Texas, suggests that custodial supply costs for schools should fall between $8 and $10 per student annually. Exhibit 5-22 compares

YISD's custodial supply cost per student with those of its peer districts. YISD's custodial supply cost per student is nearly three times that of its peers and more than twice the recommended industry guideline.
Exhibit 5-22 YISD and Peer District Comparisons of Custodial Supply Cost
Fiscal 1997-98
Peer District Total Custodial Supply Budget
Enrollment Average Custodial Supply Cost per Student
Ysleta ISD $1,026,772 47,366 $21.67
Socorro ISD $178,645 21,098 $8.46
El Paso ISD $528,800 64,444 $8.20
Northeast ISD DNR - N/A
Average w/o YISD $353,723 42,771 $8.33
Source: Survey of peer district Maintenance Departments, November 1997 Note: DNR = Did not respond; N/A = Not applicable. TSPR contacted YISD's Facilities Department management and Finance Office staff to determine the reason for these excessively high custodial supply costs. The Finance budget director stated that the district's custodial supply cost appears to exceed industry standards because it combines custodial costs with building maintenance supplies for minor repairs and upkeep by maintenance staff. The budget director further stated that TEA requires these cost to be combined for Public Education Information Management Systems (PEIMS) reporting purposes. However, combining custodial and maintenance costs in the same account code makes it difficult to monitor and control costs. While TEA requires these costs to be combined for reporting purposes, it also allows school districts to use local accounting code options to further break down costs to facilitate analysis. YISD's peer districts seem to take advantage of this option since all were able to segregate their custodial and maintenance costs. Recommendation 57: Budget and account for custodial and maintenance cost separately and use a disaggregated figure as a tool for monitoring and controlling expenses in both areas. IMPLEMENTATION STRATEGIES AND TIMELINE
1. The chief finance officer directs the budget director to separate custodial and maintenance costs when developing budgets for the 1998-99 school year. June 1998
2. The budget director changes the budget work sheets that are submitted to schools, developing budget account codes for both custodial and maintenance costs.
June 1998
3. The chief finance officer directs the MIS Department to program the district's accounting system with separate account codes for custodial and maintenance costs.
July 1998
4. The chief finance officer directs the budget and accounting code changes to be implemented. August 1998
FISCAL IMPACT

This recommendation could be implemented with the assistance of the district's Finance Office.

Chapter 5 FACILITIES USE AND MANAGEMENT F. Energy Management Energy management ensures the cost-effective use of the district's utilities. Energy audits and other sources of data are essential to control energy costs. Such data are issued by management to determine priorities and to monitor and evaluate the success of a program. While the energy management program is intended to minimize waste, it also should ensure comfort in occupied spaces and encourage energy awareness across the district. CURRENT SITUATION YISD has a formal energy management program that was implemented by Honeywell, Inc. According to the executive director of Facilities, the energy management program is in its fourth year of operation and has saved the district more than $1.3 million annually in utility costs. Honeywell uses Fast Accounting System for Energy Reporting (FASER) energy accounting software to provide effective energy management and building operations monitoring. FASER is one of the industry standard software tools dedicated to energy accounting, analysis and reporting and is designed to:
• track energy consumption factors, costs and budgets.
• validate utility bill accuracy.
• monitor energy consumption and cost trends.
• track and monitor weather data variances.
• track and monitor facility occupancy and building operation changes.
• perform statistical analysis.
• determine energy savings/cost avoidance performance.
• provide a wide range of valuable energy audit reports.
FASER defines cost avoidance as the dollar savings produced by subtracting actual spending from what would have been spent had energy usage not been reduced. Beginning next year, the energy management program will focus on educating campus staff on utility conservation techniques. FINDING YISD entered into its energy management program with Honeywell in Fall 1993. Prior to the implementation of the

energy management program, the district conducted an energy audit in 1992 that included a comprehensive mechanical inspection of lighting, heating, and cooling mechanisms in all district facilities. The district's energy management program consisted of two phases. Phase I and Phase II included:
Phase 1 - Total Cost $7,800,000 Phase II - $1,800,000
• 10 year performance contract - total cost • Grant completed April 1995
• $763,000 annual guarantee of energy savings, plus other cost reductions
• Installed two higher-capacity, more efficient gas fired chillers (Riverside High School and Cultural Arts Center)
• Major lighting modernization for most campuses and five football stadiums - $3,600,000
• Installed tower free cooling with a plate-to-frame heat exchanger and circulating pump improvements
• Energy automation systems for 20 campuses - $2,000,000
• Additional lighting modernization at 23 campuses
• Districtwide modernization of fire alarm systems
• Water quality improvements - $175,000
Exhibit 5-23 shows Honeywell's estimate of YISD's energy savings over the last four years.
Exhibit 5-23 Summary of Savings from Energy Cost-Avoidance Initiatives
1993-94 through 1996-97
Fiscal Year Cost Avoidance
1993-94 $1,248,372
1994-95 $1,282,995
1995-96 $1,368,849
1996-97 $,1531,696
Total $5,431,912
Source: YISD Energy Reports from Honeywell . COMMENDATION YISD's formal energy management program has saved the district more than $5.4 million over the past four

years. FINDING Industry guidelines suggest that a cost-effective energy management program should yield school districts an average energy cost of $1 or less per square foot per year. Overall, YISD's average energy cost is less than $1 per square foot (Exhibit 24).
Exhibit 5-24 Summary of Average Energy Cost
YISD Buildings 1996-97
Total Energy Cost Gross Square Footage of Buildings Average Annual Energy Cost Per Sq. Foot
$5,251,699 5,648,812 $0.93
Source: YISD Finance Office When TSPR analyzed energy costs at individual YISD facilities, however, it found that that energy costs per square foot range anywhere from 42 cents to $2.11 per square foot (Exhibit 5-25).
Exhibit 5-25 YISD Energy Cost per Square Foot
1996-97


Source: YISD Finance Office. Exhibit 5-26 isolates and ranks those YISD schools that exceed the recommended energy cost guideline of $1 per square foot of space.
Exhibit 5-26 YISD Schools that Exceed Recommended Average Energy
Costs Guidelines Fiscal 1996-97
Source: YISD Finance Office. YISD, in conjunction with the district's energy management firm is in the process of developing and implementing a passive energy management program to further reduce costs. The passive energy management program will take the form of individualized energy conservation programs developed for each campus. In addition to the implementation of a passive energy management program, the district would benefit from an updated energy audit. The updated energy audit would provide YISD with a road map for installing energy conservation retrofits, especially at those schools where energy cost exceed the $1.00 per square foot guideline. The State Energy Conservation Office's (SECO) Loans to Save Texas and Resources (LoanSTAR) Program offers low-interest loans at a current rate of 4.04 percent for financing retrofits, similar to what will potentially be required by YISD. For example, retrofit work financed through this program includes energy efficient lighting systems, high-efficiency heating, ventilation, and air conditioning systems, energy , management systems, boiler efficiency improvements, energy recovery systems, building shell improvements, and loan management projects. In 1994 Longview ISD had similar energy retrofit projects that needed funding for $966,140. Longview ISD hired a private performance contractor to do this work. The firm, guaranteed savings sufficient to repay the loan as a result of the

energy retrofit. Longview's director of Plant and Auxiliary Services told the review team that the district has realized total savings of $380,000 to date, with a net savings of $90,000 after the loan repayment. Recommendation 58: Conduct an energy audit of the entire district and develop strategies to further reduce energy costs, focusing on those schools that exceed the recommended guideline of $1 per square foot. In addition to the planned passive energy management program, the district should conduct another comprehensive energy audit to identify other conservation measures to further reduce costs. At a minimum, the energy audit should:
• evaluate facilities that have been recently renovated to ensure that new additions to facilities are integrated with existing automated energy management systems.
• survey mechanical equipment (heating and cooling) at all district facilities to ensure that it is operating efficiently.
• expand automated energy management systems to all non-automated facilities.
• ensure that all newly installed lighting is energy efficient.
Energy cost per square foot is a good measure of facilities' energy efficiency. Experts told the review team that, on average, energy costs per square foot should range from 70 cents to 85 cents in an efficient facility. However, other factors such as local climate, the utility company providing service, and the specific uses of campus facilities may impact this average. The district should try to reduce the energy cost per square foot to $1 per square foot by implementing energy retrofits at schools that exceed energy cost of $1 per square foot. IMPLEMENETATION STRATEGIES AND TMELINE
1. The executive director of Facilities directs the energy management firm to conduct a comprehensive energy audit of the entire district focusing most on those facilities where energy cost is high than the recommended industry guideline.
August-September 1998
2. The executive director of Facilities reviews the results of the energy management audit and develops strategies (including installation of energy conservation retrofits) to lower energy cost to the desired level.
October 1998
3. The executive director of Facilities and SECO or a contracted Energy Management company make presentations on the findings of the energy audit and propose recommendations for prioritizing and financing major energy retrofit projects to the board.
November 1998
4. The board approves energy retrofit projects. December 1998
5. The executive director of Facilities directs the implementation of energy retrofit projects. January - August 1999

FISCAL IMPACT Nineteen YISD facilities exceed the suggested $1.00 per square foot industry standard by an average of $.24. A comprehensive energy audit will enable the district to determine the exact energy conservation measure investment (i.e., mechanical retrofits or installation of automated energy systems) needed for each facility. The executive director of facilities conservatively estimated that on average, energy retrofits could be completed for about $130,000 for each facility whose energy costs exceed the suggested industry guideline. Using the district's conservative energy estimate of $130,000 for each of the 19 facilities with energy cost of greater than $1.00 per square foot, YISD would require an investment of $2,470,000 ($130,000 x 19). The district could finance its energy retrofit through SECO at a low-cost interest rate of 4.04 percent or through a energy performance contract with a energy management company, over a 10 year pay back period. Under this scenario, the annual pay back ($2,470,000 x 4.04 percent interest divided by 10 years) is $256,979. When the energy retrofit is completed, YISD should realize $474,932 ($.24 per square foot x 1,978,884 square foot) in annual cost savings. The district's net savings after the energy retrofit investment will be $217,953.
Recommendation 1998-99 1999-00 2000-01 2001-02 2002-03
Conduct energy audit and obtain loan to complete energy conservation retrofits. ($256,979) ($256,979) ($256,979) ($256,979) ($256,979)
Implement energy conservation measures (retrofits) in those schools that exceed the suggested guideline of $1.00 per square foot.
$0 $474,932 $474,932 $474,932 $474,932
Net (cost)/savings ($256,979) $217,953 $217,953 $217,953 $217,953

Chapter 6 ASSET AND RISK MANAGEMENT This chapter assesses YISD's asset and risk management functions in four sections:
A. Cash and Investment Management
B. Risk Management
C. Fixed Assets
D. Bond Issuance and Indebtedness
BACKGROUND
Effective asset and risk management maximizes rates of return on invested assets; mitigates the risk of catastrophic financial loss through unforeseen events; safeguards assets from loss through damage and theft; and manages debts incurred to purchase equipment and expand facilities.

Chapter 6 ASSET AND RISK MANAGEMENT A. Cash and Investment Management
Careful cash and investment management includes the establishment and maintenance of favorable banking relationships, the accurate projection of cash receipts and disbursements, and the maximization of returns on funds deposited in safe investment vehicles. CURRENT SITUATION YISD's depository and investment authority is held by the Office of the Superintendent, who delegates day-to-day responsibilities to the chief finance officer (CFO). The CFO and district comptroller together manage the district's cash and investment management functions. These functions include depositing and investing district funds and preparing reports on the district's cash position and investment performance. YISD's investment policy is to invest all available funds at the highest rates possible, with the maximum security possible, while meeting the district's cash flow demands and conforming with federal, state, and local laws governing the investment of public funds. Operating and Activity Fund Accounts FINDING YISD maintains its cash accounts at Norwest Bank El Paso, N. A. The district has 12 operating accounts and 56 school and student fund accounts, all of which are interest bearing accounts. Twelve accounts for a district this size is not inappropriate, particularly given the individual purpose of each account. For example, the district self insures for worker compensation and needs a separate account to track receipts and disbursements. The payroll, workers' compensation, medical and dental, and flexible spending accounts are zero balance accounts (ZBA); their balances are automatically swept into the district's computer bank clearing (CBC) account, which is invested nightly in repurchase agreements. Excess cash in the bond sinking, food service, and school operating fund accounts is invested by the comptroller in bank certificates of deposit (CDs). Exhibit 6-1 presents YISD's bank balances as of August 31, 1997.
Exhibit 6-1 YISD Bank Accounts
Norwest Bank El Paso N. A. as of August 31, 1997
Account Name Purpose Balance As of Investment Features

August 31, 1997
Computer Bank Clearing General Fund $14,839,150 Nightly Repurchase
Agreements
Payroll Payroll $-0- Swept into CBC
Contractual Obligation Bond Sinking $167,921 CDs
Food Service Food Service $844,692 CDs
I & B Pre-88 Bond Sinking $698 CDs
I & B -1992 Bond Sinking $452 CDs
I & B-1993 Bond Sinking $581 CDs
I & B-97R Bond Sinking $12,854 CDs
Workers' Compensation Workers' Comp. Program $-0- Swept into CBC
Medical & Dental Health Benefits $-0- Swept into CBC
Flexible Spending Employee Flexible Spending Deductions $-0- Swept into CBC
School Operating Funds School Funds $1,408,529 CDs
Student Activity Funds Student Group Activities $842,652 Controlled by school
Source: YISD Bank Statements & Bank Reconciliations. COMMENDATION The district maintains an appropriate number of bank accounts and invests its excess operating cash in safe, liquid investment vehicles. Investment Accounts FINDING The book value of the district's invested funds was $44,023,472 on August 31, 1997 and the weighted average stated interest rate was 5.10 percent. The average amount of funds invested during 1996-97 was $76,132,544 consisting of $59,343,389 in CDs and $16,789,155 in repurchase agreements. These amounts were computed from the district's

monthly investment portfolio reports. Exhibit 6-2 summarizes YISD's investment portfolio as of August 31, 1997.
Exhibit 6-2 YISD Investments as of August 31, 1997
Investment Type
Invested as of August 31, 1997
Percentage of Total
Weighted Average Interest Rate
Operating Funds: Certificates of Deposit Repurchase Agreements Trust Account-Professional Liability
$21,060,000 $20,899,343 $218,129
48% 48% -
5.20% 5.00% 5.36%
Debt Service Funds: Certificates of Deposit
$1,846,000 4% 5.19%
Total Invested Funds $44,023,472 100% 5.10%
Average CD Investments-Fiscal 1997 $59,343,389
Average Repurchase Agreement Investments-Fiscal 1997 $16,789,155
Average Funds Invested-Fiscal 1997 $76,132,544
Source: Review team computations and YISD's monthly financial statement package. The district's investment policy allows for investments in a variety of vehicles, including obligations of federal, state, and local governmental entities, CDs, repurchase Agreements, and investment pools. YISD's investment policy requires that district investments be made in a manner that ensures preservation of capital in the overall portfolio. Capital is preserved through diversification of the investment portfolio, so that losses on individual securities do not significantly erode the portfolio's overall value. While the district's investment policy allows for investment in a variety of vehicles, the district's investment strategy focuses primarily on CDs and overnight repurchase agreements. The district's investment strategy is summarized in Exhibit 6-3.
Exhibit 6-3 YISD's Investment Strategy

Fund Investment Strategy
Operating Funds
Overnight repurchase agreements are primary investment. The interest rate for Treasury bills is reviewed weekly to determine if they provide a better return. Each day, the district determines what funds should be left in the account to meet daily operating requirements.
Capital Projects
U.S. government securities or CDs are primary investments. Investment officer reviews available balances versus operating needs to determine excess funds available for investment.
Agency Funds
U.S. government securities or CDs are primary investments made through district's depository to mature at the time funds are needed.
Debt Service Funds
U.S. government securities or CDs are primary investments made through district's depository to mature at the time funds are needed.
Source: YISD. The district's investment goal is to attain a rate of return approximating the U.S. Treasury bill (T-bill) yield of like maturities as published in business periodicals. The district's depository agreement with its bank ensures that the investment goal will be reached because the bank pays the district more than the T-bill rate. In addition, the depository agreement provides that excess collected balances not invested in other authorized investment vehicles will be swept nightly into overnight repurchase agreements. This feature is particularly attractive because it means that district funds are always invested and earning interest. The agreement also requires the district to maintain compensating balances in its checking accounts to compensate the bank for account maintenance, daily balance reporting, items processing, and various other banking services. These compensating balances fluctuate depending upon the district's cash requirements. Interest earned on these balances above the monthly service charge is refunded to the district each month. Exhibit 6-4 presents the rates that district receives on investment funds deposited with the bank.
Exhibit 6-4 Rate Paid to YISD by Depository Bank
Type of Investment *Basis Points above T-Bill Rate
Certificate of deposit 7-59 Day Maturity .25
Certificate of deposit 60-89 Day Maturity .275
Certificate of deposit 90-179 Day Maturity .300
Certificate of deposit 180 Days or More .325

Repurchase agreements - $1-9 Million .15 Basis points below Fed Funds Rate
*NISI Repurchase agreements greater than $9 Million
.40 Basis points below Fed Funds Rate
Source: YISD's Depository Contract *Fed Funds Rate: The Rate charged by Federal Reserve Bank to other Banks that borrow Federal Reserve Funds. *A basis point is equal to .01 of a percent. Example: 25 basis points equals one-quarter of a percent. *NISI=Norwest Investment Services, Inc. COMMENDATION YISD has negotiated favorable interest rates and strategies with its depository bank that result in additional interest earnings for the district. FINDING YISD's peer districts invest in a variety of investment vehicles that generally yield greater returns than the district's portfolio. Exhibit 6-5 compares YISD's investments and average yields to those of some of its peer districts.
Exhibit 6-5 Investment Type & Average Yield
YISD Versus Selected Peer Districts
District Investment Type Average Yield 1996-97
Ft. Worth ISD
U.S Treasury obligations U.S. govt. agency obligations Repurchase agreements Texpool Local government investment pools
6.19% 6.15% 5.62% 5.58% 5.47%
El Paso ISD Treasuries/agencies Repurchase agreements Local government investment pools
6.17% 5.71% 5.35%
Houston ISD Commercial paper U.S. govt. agency obligations Investment pools
5.80% 5.60% 5.60%
Socorro ISD Investment pools Repurchase agreements
5.34% 5.04%

Ysleta ISD CDs Repurchase agreements
5.27% 5.38%
Source: YISD and peer district surveys. For fiscal 1997, TexPool and Lonestar, which is administered by the Texas Association of School Boards, returned average yields of 5.37 and 5.34 percent respectively, compared with 5.29 percent on average for the district. Recent changes in the state's Public Investment Act and administration of the Texpool fund has dramatically improved Texpool's safety and performance. Exhibits 6-6 compares YISD's investment performance to that of TexPool and Lonestar for fiscal 1997.
Exhibit 6-6 YISD, Texpool, and Lonestar Annual
Investment Yield 1996-97
Source: Computed from YISD's Monthly Portfolio and Texpool and Lonestar fund data Recommendation 59: Revise the district's investment strategy to invest in products that yield higher returns. IMPLEMENTATION STRATEGIES AND TIMELINE
1. The Board of Trustees revises the investment strategy to include investments that yield higher returns than CDs and repurchase agreements.
June 1998
2. The chief finance officer directs the comptroller to begin investing in investment pools and other higher yielding investments.
June 1998

3. The comptroller contacts investment sources and begins the investment process.
August 1998 and each month thereafter
FISCAL IMPACT In fiscal 1996-97, the average spread in financial performance between the district's investments in CDs and returns provided by investments pools was 0.08 percent. YISD's average investment in CDs during fiscal 1997 was $59,343,389. If these funds were invested at the additional spread, the fiscal increase would be $47,500 per year ($59,343,389 x .0008).
Recommendation 1998-99
1999-2000
2000-01
2001-02
2001-03
Revise investment strategy to invest in products that yield higher returns.
$47,500 $47,500 $47,500 $47,500 $47,500

Chapter 6 ASSET AND RISK MANAGEMENT
B. Risk Management
Risk management has become an essential part of school district operations because of the rising cost of insurance. The goal of risk management is to minimize financial losses and liability for the district and its employees brought about by unexpected events. Effective risk management involves:
• analysis of alternatives for insurance coverage such as self- insurance and other new vehicles.
• identification of risk exposure.
• classification of identified risk exposures.
• evaluation of identified risk exposures in terms of frequency and severity.
• management of risk exposure through avoidance, reduction, deductibles, or insurance.
• development, maintenance, and monitoring of effective loss prevention programs and practices.
CURRENT SITUATION YISD's Risk Management Department is a unit of the Division of Human Resources. The director of Risk Management is responsible for district risk management and employee benefits. Twelve positions assist the director with the department's day-to-day operations. The department's specific responsib ilities are as follows:
• Self-Funded Health Plan • Tax Sheltered Annuities • Savings Bond Program
• Disability Insurance Program
• Cancer Insurance Program
• Flexible Benefit Plan & Flexible Spending Account Program

• Student Accident Insurance
• District Leave Policies and Regulations
• Unemployment Compensation Program
• Resignation/Retirement Reporting and Processing • Safety Training • Hazardous
Communications Act
• Incident/Accident Investigations
• Hazardous Waste Management
• Motor Vehicle Records Evaluations
• Personal Protective Equipment Management
• Workers' Compensation Claims Administration
• Property & Casualty Program
• Employee Assistance Program
• Asbestos Abatement Program
• Drug Alcohol Testing Programs
• Subrogation Activities • General Liability Activities
Exhibit 6-7 presents Risk Management's organization:
Exhibit 6-7 Risk Management Department Organization

Source: Risk Management Department. Employee Health Insurance FINDING YISD offers its employees a choice between two health care plans. One is a self- insured plan administered by Advantage Care Network, a preferred provider organization (PPO) developed by Young Insurance Agency. The other is a health maintenance organization (HMO) developed by Anthem Health Plan of Texas and administered by Anthem Health. The district's health plan costs are accounted for in an internal service fund. The fund accounts for employee and employer health plan contributions; HMO premiums; life insurance premiums; and the primary costs of self- insurance, including health benefits (medical and prescription), internal payroll, legal and consultant fees, administrative fees, and stop-loss premiums. The fund has been solvent since its inception, adding an average of $1,541,505 per year to its fund balance
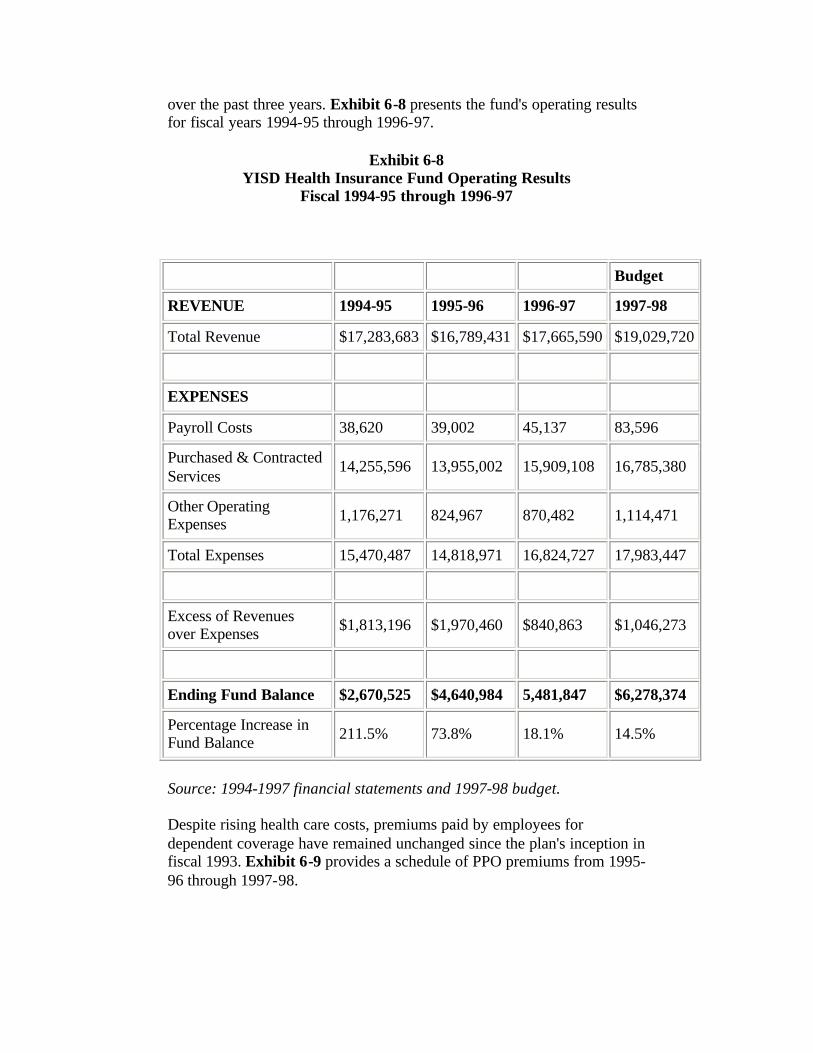
over the past three years. Exhibit 6-8 presents the fund's operating results for fiscal years 1994-95 through 1996-97.
Exhibit 6-8 YISD Health Insurance Fund Operating Results
Fiscal 1994-95 through 1996-97
Budget
REVENUE 1994-95 1995-96 1996-97 1997-98
Total Revenue $17,283,683 $16,789,431 $17,665,590 $19,029,720
EXPENSES
Payroll Costs 38,620 39,002 45,137 83,596
Purchased & Contracted Services
14,255,596 13,955,002 15,909,108 16,785,380
Other Operating Expenses 1,176,271 824,967 870,482 1,114,471
Total Expenses 15,470,487 14,818,971 16,824,727 17,983,447
Excess of Revenues over Expenses $1,813,196 $1,970,460 $840,863 $1,046,273
Ending Fund Balance $2,670,525 $4,640,984 5,481,847 $6,278,374
Percentage Increase in Fund Balance 211.5% 73.8% 18.1% 14.5%
Source: 1994-1997 financial statements and 1997-98 budget. Despite rising health care costs, premiums paid by employees for dependent coverage have remained unchanged since the plan's inception in fiscal 1993. Exhibit 6-9 provides a schedule of PPO premiums from 1995-96 through 1997-98.

Exhibit 6-9 Schedule of PPO Premiums
Fiscal 1995-96 through 1997-98
1995-96 1996-97 1997-98
Employee Only-Contributed by YISD $193.00 $201.00 $197.00
Employee & Spouse $170.69 $170.69 $170.69
Employee & Children $144.18 $144.18 $144.18
Employee & Family $235.40 $235.40 $235.40
Source: Risk Management Department. COMMENDATION The district maintains a solvent self-insured health care program, and premiums paid by employees for dependent coverage have remained unchanged despite rising health care costs. FINDING During fiscal 1996-97, Advantage Care PPO and YISD's Risk Management Department developed a wellness program called the LifeStyle Advantage Program. All employees and their covered spouses who are enrolled in the district's self- insured PPO are eligible to participate. The goals and objectives of the program are to improve the health status of employees; encourage, promote, and facilitate healthy quality-of- life choices; reduce health care costs through prevention and education; and improve employee morale and productivity. The program is administered in six steps as summarized in Exhibit 6-10.
Exhibit 6-10 YISD's Wellness Program
Six Steps to a Healthy Lifestyle
Steps Description
1 Fitness and Lifestyle Screening
2 Risk Assessment
3 Fitness Testing
4 Physician Consent for Exercise Component

5 Participation in Fitness Facility
6 Six Month Reassessment
Source: Risk Management Wellness Program Brochure A wellness survey was conducted at the "Reaching for the Gold" employee conference, an employee motivational event held in August 1996 (Exhibit 6-11).
Exhibit 6-11 YISD's Wellness Program
Results of Employee Wellness Survey, August 1996
Areas of Interest Percentage of Employees Interested
Activity/Exercise 76%
Weight Management 63%
Muscle/Body Toning 56%
Nutrition 51%
Well Being 40%
Cholesterol Management 31%
Diabetes Management 13%
Smoking Cessation 9%
Stress Management 9%
Other 2%
Source: Risk Management Department. COMMENDATION YISD has implemented a wellness program to encourage employees to develop healthy lifestyles and adopt preventive health care practices. FINDING YISD has performance guarantees built into its contract with the third-party administrator (TPA) of its PPO health plan. These guarantees are intended to ensure that district employees receive the highest level of

service possible from the TPA. Service performance is measured by claims turnaround time, accuracy of claims paid, customer service, PPO network contracting deadlines and utilization review efficiency. Utilization review is used by health plans to measure the amount and appropriateness of health services used by its members. The district assesses financial penalties on the TPA if specified levels of performance are not attained. For example, the district requires that 95 percent of non-investigated claims be processed within 14 days of receipt. The financial penalty for noncompliance is 10 percent of the administrative fee in each month the standard is not met. The TPA submits periodic reports to the district so that its compliance can be measured. During fiscal 1997, the TPA met or exceeded the performance standard in all categories except claims turnaround time. The TPA fell short of the requirement to process 95 percent of non- investigated claims within 14 days; as a result, the district collected $12,278 in penalties. Similar performance guarantees are built into other contracts administered by the Risk Management Department. COMMENDATION The district has placed performance guarantees in its PPO health plan contract that ensure that district employees receive high-quality service from the plan's administrator. FINDING YISD's group health and life insurance costs per employee are higher on average than those of its peer districts. The district's cost per employee during 1996 was $2,252, compared with an average of $1,589 for the peer districts. Exhibit 6-12 compares YISD's annual group health and life insurance cost per employee to that of its peer districts for 1993-94 through 1995-96.
Exhibit 6-12 Group Health & Life Insurance Costs per Employee
YISD & Peer Districts 1993-94 through 1995-96
Actual
District 93-94 94-95 95-96
El Paso * $2,457 $1,959 $2,355
Ysleta ISD * $2,253 $2,227 $2,252

Houston ISD $1,659 $1,900 $2,101
San Antonio ISD $1,726 $1,726 $2,094
Socorro ISD * $1,804 $1,827 $2,044
Austin ISD $1,726 $1,460 $1,411
FT. Worth ISD $1,040 $1,086 $1,072
Dallas ISD $870 $875 $851
Corpus Christi ISD $695 $691 $785
Average without YISD $1,497 $1,441 $1,589
Source : 1993-94 through 1995-96 TASB Benchmarks and TEA AEIS reports. * Largest Region XIX Districts. When compared to the other peer districts in Region XIX, however, YISD's health care costs are only slightly higher than average. Furthermore, Region XIX health care costs are higher than both peer district and statewide averages. Exhibit 6-13 compares YISD's health care costs per employee to those of the largest Region XIX districts. Exhibit 6-14, in turn, compares Region XIX health care costs per student to peer district and state averages. Benchmark data for 1995-96 is the latest available from the Texas Association of School Boards.
Exhibit 6-13 Group Health & Life Insurance 1995-96 Costs per Employee YISD & Region XIX
Exhibit 6-14 Group Health & Life Insurance 1995-96 Costs per Student Region XIX & State of Texas
Source: TASB Benchmarks and TEA-AEIS Reports.
Source: TASB Benchmarks and TEA-AEIS Reports.
Exhibits 6-15 and 6-16 show health plan alternatives offered by YISD and

its peer districts and the premiums charges for the various options. All Region XIX districts pay 100 percent of employee health care coverage and premiums generally are higher than those of all peer districts considered together.
Exhibit 6-15 Health Plan Premiums
Employee Only YISD Versus Peer Districts
Fiscal 1997-98
District Type of Plan Employer Contribution
Employee Contribution
Total Health Premium
Ysleta ISD
HMO PPO
$181.20 $197.00
$-0- $-0-
$181.20 $197.00
Socorro ISD
HMO
$138.00
$-0-
$138.00
San Antonio ISD
District Heath Plan -Low Option -High Option Humana HMO Pacificare HMO PCA HMO HMO Blue
$130.91 $130.91 $130.91 $130.91 $130.91 $130.91
$-0- $9.82 $40.58 $43.45 $16.38 $21.46
$130.91 $140.73 $171.49 $174.36 $147.29 $152.37
Houston ISD
Point of Service Preferred Provider/HMO Exclusive Provider/HMO Indemnity Plan
$86.28 $86.28 $86.28 $86.28
$24.51 $7.32 $-0- $-0-
$110.79 $93.60 $86.28 $86.28
Ft. Worth
NYLCare-HMO
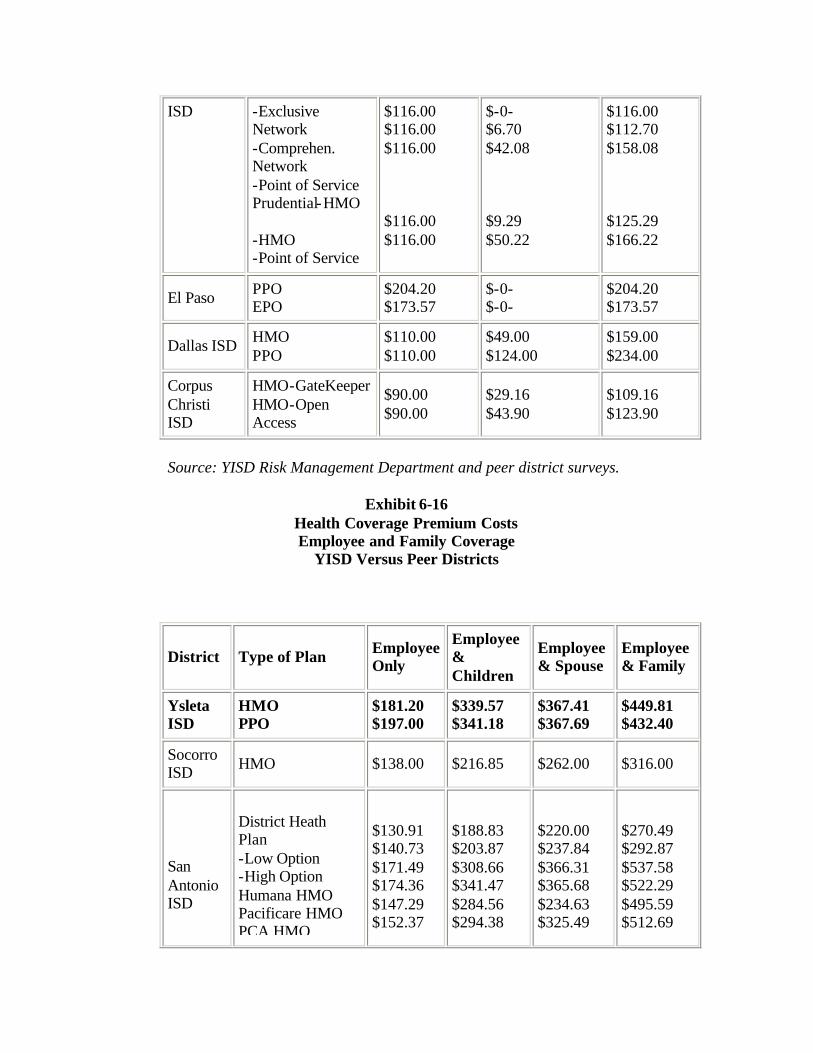
ISD -Exclusive Network -Comprehen. Network -Point of Service Prudential-HMO -HMO -Point of Service
$116.00 $116.00 $116.00 $116.00 $116.00
$-0- $6.70 $42.08 $9.29 $50.22
$116.00 $112.70 $158.08 $125.29 $166.22
El Paso PPO EPO
$204.20 $173.57
$-0- $-0-
$204.20 $173.57
Dallas ISD HMO PPO
$110.00 $110.00
$49.00 $124.00
$159.00 $234.00
Corpus Christi ISD
HMO-GateKeeper HMO-Open Access
$90.00 $90.00
$29.16 $43.90
$109.16 $123.90
Source: YISD Risk Management Department and peer district surveys.
Exhibit 6-16 Health Coverage Premium Costs Employee and Family Coverage
YISD Versus Peer Districts
District Type of Plan Employee Only
Employee & Children
Employee & Spouse
Employee & Family
Ysleta ISD
HMO PPO
$181.20 $197.00
$339.57 $341.18
$367.41 $367.69
$449.81 $432.40
Socorro ISD HMO $138.00 $216.85 $262.00 $316.00
San Antonio ISD
District Heath Plan -Low Option -High Option Humana HMO Pacificare HMO PCA HMO
$130.91 $140.73 $171.49 $174.36 $147.29 $152.37
$188.83 $203.87 $308.66 $341.47 $284.56 $294.38
$220.00 $237.84 $366.31 $365.68 $234.63 $325.49
$270.49 $292.87 $537.58 $522.29 $495.59 $512.69

HMO Blue
Houston ISD
Point of Service Preferred Provider/HMO Exclusive Provider/HMO Indemnity Plan
$110.79 $93.60 $86.28 $86.28
$204.94 $133.36 $120.88 $125.17
$159.20 $136.85 $124.37 $126.49
$269.15 $204.08 $186.61 $189.58
FT. Worth ISD
NYLCare-HMO -Exclusive Network -Comprehen. Network -Point of Service Prudential-HMO -HMO -Point of Service
$116.00 $122.70 $158.08 $125.29 $166.22
$244.78 $263.29 $330.91 $286.87 $347.96
$264.39 $287.03 $352.94 $293.08 $381.00
$344.68 $375.77 $475.56 $392.51 $477.73
El Paso PPO EPO
$204.20 $173.57
$360.25 $306.21
$421.18 $358.00
$577.25 $490.66
Dallas ISD
HMO PPO
$159.00 $234.00
$289.00 $385.00
$331.00 $433.00
$379.00 $489.00
Corpus Christi ISD
HMO-GateKeeper HMO-Open Access
$109.16 $123.90
$233.38 $264.48
$209.32 $237.56
$305.76 $347.00
Source: YISD Risk Management Department and peer district surveys. YISD Risk Management personnel note that their health care plans provide substantial benefits to the district's employees and that greater benefits could account for relatively high premiums. Comparisons of health plan benefits among YISD's peer districts are difficult because health care plans have many different features, all of which must be rated and evaluated. Exhibits 6-17 and 6-18 present highlights of YISD's two health care plans.
Exhibit 6-17 YISD Health Plan Highlights-PPO

Benefit Description In Network Out of Network Out of Area
Claim Forms None Required Required
Deductible Individual/Year Family/Year Per Hospital Admission
None None None
$300 $900 $200
$300 $900 $200
Coinsurance Percentage Out-of-Pocket max per Participant Maximum per family (3 members)
90% $500 $1,500
75% $1,250 $3,750
80% $750 $2,250
Maximum a. coinsured expense b. coinsurance out-of-pocket c. individual per lifetime
$5,000 $500 $1,000,000
$5,000 $1,250 $1,000,000
$3,750 $750 $1,000,000
Copayment Prescription Brand Name Generic Medical Office Visit Physician Free Hospital Hospital Emergency Room
100% after copay $12 $5 100% after $15 copay None 100% after $50 copay (waived if admitted)
75% after copay $12 $5 N/A 75% after $200 copay 75% after $50 copay (waived if admitted)
100% after copay $12 $5 N/A 80% after $200 copay 80% after $50 copay (waived if admitted)
Practitioner Services Medical Office Visits (MD's fee) Medical Office Visits (Lab)
100% after $15 copay 90% $15 copay 90%
75% 75% 75% 75%
80% 80% 80% 80%

Outpatient Psychiatric Inpatient/Outpatient surgical
Hospital Services Inpatient (semi-private room & board) Intensive care and all other charges Psychiatric Outpatient
90% 90% 90%
75% 75% 75%
80% 80% 80%
Utilization Management Services Inpatient Outpatient MRI/CAT Scan
Applicable Applicable
Authorization for certain medical procedures are not required. Pre-certification required
Authorization for certain medical procedures are not required. Pre-certification required
Diagnostic X-ray and Lab
90% 75% 80%
Accidental Injury
$300 per occurrence $300 per occurrence $300 per
occurrence
Source: Young Insurance Agency brochure.
Exhibit 6-18 YISD Health Plan Highlights-HMO
Benefit Description Employee Pays
Physician Services Office Visits Authorized Consultations, Referrals
$10 per visit $10 per visit $10 per visit $10 per visit No copay $10 per visit

Routine Physical Examinations Pre-Natal Office Visits Well Child Care Vision Screen by Primary Care Physician (PCP) Speech and Hearing Screen by PCP Allergy Testing & Treatment Allergy Injections Physician Hospital Visit Physician Skilled Nursing Facility Visit Outpatient Mental Health Consultation
$10 per visit $10 per visit $10 per visit No copay No copay No copay
Outpatient Lab Procedures & X-Rays
No copay
Surgical & Obstetrical Physician Services
No copay
Covered Physician Family Planning Services Counseling Services IUD and Insertion Diaphragm and Fitting Sterilization Procedures Infertility Testing & Treatment Infertility Drugs
$10 per visit $25 per visit plus office visit copay $20 per visit plus office visit copay Covered as any other surgery 50% copay per visit 50% copay per prescription
Hospital/Facility Services Semi-private Room & Board Outpatient Surgery General Nursing Care, Intensive Care, Cardiac Care Unit
$200 per admission No copay No copay
Emergency/Urgent Care Hospital Emergency Room Extended Hours Facility for Urgent Care
$50 per visit $25 per visit $25 copay

Ambulance Services
Outpatient Services Facility Outpatient Surgery Center & other Outpatient Services
No copay
Skilled Nursing Facility Services Semi-private Room and Board Skilled Nursing Facility
$200 per admission No copay
Other Health Care Services Teeth, Gums or Alveolar Process Services Human Organ & Tissue Transplants Home Health Care Physician Home Visit, Skilled Nurse Visit Hospice Care Short-term Rehabilitation Therapy Durable Medical Equip. For Home Use Prosthetic Medial Appliances
Same as surgical copay No copay $10 copay per visit No copay $10 per visit No copay No copay
Inpatient Mental Health Benefits Inpatient Services Inpatient Provider Services Day Treatment Facility, Crisis Stabilization Unit or Residential Treatment Center
$50 copay per day No copay $50 copay per day
Chemical Dependency Treatment Office Visit Inpatient Rehabilitation Day Treatment Facility
$10 per visit Same as hospital admission copay No copay
Other Provisions Deductible per Contract Year Lifetime Maximum Benefit Out-of-Pocket Maximum per Contract Year
None None $1000 per person/$2000 per family

Prescription Drug Benefit Brand Name & Generic Drugs
$5 copay per prescription
Source: Anthem Health Benefits brochure. Although YISD's health care costs are generally higher than those of other Texas districts, they are in line with the largest districts in Region XIX. YISD has successfully managed its health care costs even while health care costs in general have risen dramatically. This success is reflected in the fact that PPO premiums for dependent care coverage have not increased in several years. Although the district has done an effective job in managing its health care plans, additional savings might be achieved by implementing various strategies to reduce costs without sacrificing benefits. Such strategies might include exploring other managed-care options, such as exclusive provider organizations (EPOs). EPOs are similar to (HMOs) and PPOs except that their members must remain within the network to receive benefits and they have different legal and licensing requirements. Other strategies include participation in purchasing and shared-service alliances with other governmental entities, such as El Paso ISD, Soccoro ISD, the City of El Paso, El Paso County, the Central Appraisal District, the University of Texas at El Paso, and the Housing Authority; requesting breakdowns of administrative fees from the insurance company and using this information as a basis to negotiate lower fees; improving utilization review methods; and offering incentives for healthy lifestyles and participation in the wellness program. Recommendation 60: Explore strategies designed to further control health care costs without sacrificing health plan benefits. IMPLEMENTATION STRATEGIES AND TIMELINE
1. The director of Risk Management surveys available options and contacts other districts in the state that have comprehensive, cost-effective health coverage.
June & July 1998
2. The director of Risk Management and the Benefits Committee review alternatives, such as purchasing and shared service alliances with other governmental agencies and establishing an exclusive provider organization.
July 1998
3. The director of Risk Management and the Benefits Committee August

perform comparative analysis of all data obtained to make informed decisions regarding changes in health coverage that cut costs while maintaining quality benefits.
1998
FISCAL IMPACT This recommendation can be implemented with existing resources. Workers' Compensation Insurance FINDING YISD self- insures and self-administers its workers' compensation program. Self- insured means the district assumes the risk of workers' compensation losses and pays all claims rather than paying an insurance company to assume the risk. The district has found it more cost-effective to self- insure than to carry workers' compensation insurance with a commercial carrier. TPAs typically act as agents for school districts in all matters pertaining to processing and handling workers' compensation claims. YISD's claims specialist, assisted by four workers' compensation clerks, performs many of these functions for the district. To ensure the quality of claims processing, the district voluntarily participates in a program developed by the Texas Workers' Compensation Commission (TWCC) known as the Compliance Plan. This program requires YISD to conduct self-audits of its workers' compensation claims according to a TWCC self-audit methodology and submit reports with appropriately documented findings to TWCC's Division of Compliance and Practices. These audits are intended to strengthen claims processing in two primary areas: the delivery of benefits to injured employees and the filing of required forms with TWCC. YISD's goal is to achieve 97.5 percent compliance, based upon a statistically representative sample, in each of four compliance categories: Timeliness of temporary income benefit payments (TIBs) or disputes; (2) Appropriateness of TIBs or disputes; Timeliness of impairment income benefit payments (IIBs) or disputes; and Appropriateness of IIB payments or disputes. The compliance categories relate to when and how benefits are paid or disputed. Timeliness refers to whether a benefit that was due for payment or dispute was paid or disputed on time. Appropriateness refers to whether a benefit that was due for payment or dispute was either paid at the correct compensation rate or , if disputed, was disputed in accordance with TWCC rules and regulations.

YISD will conduct self-audits according to the schedule shown in Exhibit 6-19.
Exhibit 6-19 YISD Self-Audit Schedule
Audit Audit Period Sample Provided Report Due Date
Benchmark 9/1/96 to 5/31/97 8/15/97 12/8/97
Grace Period 6/1/97 to 8/31/97 Not Available Not Available
Self-Audit #1 9/1/97 to 5/31/98 8/15/98 9/26/98
Grace Period 6/1/98 to 8/31/98 Not Available Not Available
Self Audit #2 9/1/98 to 5/31/99 8/15/99 9/26/99
Source: YISD. As of March 31, 1998, the benchmark audit was still in progress. The district will use the benchmark audit as an opportunity to perfect its auditing techniques and react to feedback from TWCC about its auditing proficiency. Grace periods are provided between audits to allow the district's staff to make improvements in the workers' compensation claims process. COMMENDATION YISD voluntarily participates in a program called the Compliance Plan, designed to strengthen workers' compensation claims processing controls by ensuring that claims are paid and reports are filed in accordance with applicable laws, rules, and regulations. FINDING YISD's contributions for workers' compensation costs per employee are higher on average than those of its peer districts. For the last three fiscal years, YISD has averaged 517 claims a year. The average amount paid for these claims over the three-year period was $1,829,533 annually or $3,539 per claim. Most injuries occurred to teachers, custodians, and food service workers, and were most common in elementary schools. Future costs of open claims as of August 31, 1996 and 1997 were estimated to be $750,233 and $824,628, respectively; actual costs may vary. Exhibits 6-20 and 6-21 compare YISD's annual workers' compensation contributions per employee to those of peer districts for 1993-94 through

1995-96. Data for Fiscal 1996-97 will not become available from TASB until May 1998.
Exhibit 6-20 Workers' Compensation Annual Contribution per Employee
Fiscal 1993-94 through 1995-96 YISD Versus Peer Districts
1993-94 1994-95 1995-96
Ft. Worth ISD $926 $902 $863
Ysleta ISD $688 $666 $703
Houston ISD $565 $698 $611
Dallas ISD $403 $385 $502
Austin ISD $584 $464 $440
El Paso ISD $1,071 $839 $383
San Antonio ISD $422 $217 $371
Corpus Christi ISD $261 $315 $344
Socorro ISD $702 $665 Not Available
Average w/o YISD $617 $561 $502
Source : 1993-94 through 1995--96 TASB Benchmarks and AEIS Reports.
Exhibit 6-21 Workers' Compensation Annual Contribution per Employee
YISD and Peer Districts

1993-94 through 1995-96
Source: 1993-94 through 1995--96 TASB Benchmarks and TEA AEIS reports. Exhibit 6-22 compares workers' compensation claims per employee for YISD and the peer districts for 1994-95 through 1996-97.
Exhibit 6-22 Worker's Compensation Claims Per Employee
YISD Versus Peer Districts Fiscal 1994-95 through 1996-97
District 1994-95 1995-96 1996-97
FT. Worth ISD 0.152 0.151 0.176
Dallas ISD 0.149 0.146 0.135
Ysleta 0.093 0.091 0.101
El Paso 0.087 0.085 0.088
Socorro ISD 0.122 0.099 0.083
San Antonio ISD 0.065 0.081 0.078
Corpus Christi ISD 0.068 0.067 0.071
Houston ISD 0.075 0.058 0.059
Average W/O YISD 0.103 0.098 0.086
Source: Peer district surveys and TEA AEIS Reports.

Exhibit 6-23 presents YISD's workers' compensation claims history for 1994-95 through 1996-97.
Exhibit 6-23 YISD Workers' Compensation Claims History
1994-95 through 1996-97
Claims Period Number of Claims Amount Paid Amount Paid Per Claim
1994-95 526 $2,230,266 $4,240
1995-96 505 $1,863,826 $3,691
1996-97 520 $1,394,568 $2,682
Average 517 $1,829,553 $3,539
Source: Risk Management Department. Exhibit 6-24 presents YISD's workers' compensation claims by worker category. Exhibit 6-26 presents YISD's workers' compensation claims by organization.
Exhibit 6-24 YISD Workers' Compensation Claims
by Worker Category 1995-96 through 1996-97
Personnel Classification
Number of Incidents 1994-1995
Number of Incidents 1995-1996
Number of Incidents 1996-1997
Percent 1994-1995
Percent 1995-1996
Percent 1996-1997
Teacher 206 203 159 39.2% 40.2% 30.6%
Custodial\Maint. 117 127 118 22.2% 25.1% 22.7%
Food Service 71 81 90 13.5% 16.1% 17.3%
Secretary\Clerk 56 37 49 10.6% 7.3% 9.4%
Transportation 34 28 47 6.5% 5.5% 9.0%
Administrator 11 8 16 2.1% 1.6% 3.1%
Warehouse 3 3 12 0.6% 0.6% 2.3%
Security 11 6 12 2.1% 1.2% 2.3%

Other 9 9 12 1.7% 1.8% 2.3%
Nurse\Aide\Therapist 8 3 5 1.5% 0.6% 1.0%
Total 526 505 520 100.0% 100.0% 100.0%
Source: Risk Management Department
Exhibit 6-25 YISD Workers' Compensation Claims by Organization
1994-95 through 1996-97
Incidents Percent of Total
Organization 1994-95 1995-96 1996-97
1994-95
1995-96
1996-97
High Schools 82 73 113 15.6% 14.5% 21.7%
Middle Schools 75 64 45 14.3% 12.7% 8.7%
Elementary Schools 217 229 218 41.3% 45.3% 41.9%
Central Office 43 30 29 8.2% 5.9% 5.7%
Maintenance Dept. 46 59 42 8.7% 11.7% 8.2%
Transportation Dept. 46 32 49 8.7% 6.3% 9.4%
Other 17 18 24 3.2% 3.6% 4.4%
Total 526 505 520 100.0% 100.0% 100.0%
Source: Risk Management Department According to one of the largest underwriters of workers' compensation, employers throughout the country are implementing a combination of comprehensive safety systems for work-site-based worker's compensation management to control costs more effectively. Prevention of workers' compensation losses through various safety engineering techniques can lower claims costs over time. These include the following safety engineering and injury management techniques:
• Reporting workers' compensation claims by worker category. These statistics would allow YISD to design and

implement a safety training program focusing on worker categories with the highest number of claims.
• Adding safety accountability standards to job descriptions, particularly for those positions that have a higher exposure to safety-related accidents, such as food service workers, maintenance workers, and bus drivers.
• Encouraging employees to provide input about job tasks that could result in non-accident-related injuries such as carpal tunnel syndrome.
Recommendation 61: Develop strategies to lower workers' compensation claims cost by at least 10 percent through increased emphasis on injury management, with particular attention on the teacher, custodial, and food service worker categories. YISD should focus its safety training on the teacher, custodial, and food service worker categories, since they have had the highest incidence of work-related injuries for the past three fiscal years. In addition, YISD should prepare more detailed workers' compensation reports and analyze claims by worker category. The following information, summarized by worker category, should be prepared on a monthly basis.
• Accident type
• Frequency of accident occurrences
• Location of accident(s)
• Frequency of accident locations
The Risk Management Department should develop and implement safety programs that target worker categories with the highest risk factors. Adding safety accountability standards to employee job descriptions and encouraging employees to provide division management with information about job tasks that could result in injury should reduce workers' compensation claims and employee time lost to injuries. IMPLEMENTATION STRATEGIES AND TIMELINE
1. The director of Risk Management directs the safety director to June 1998

develop safety accountability standards and directs the Personnel Department to incorporate these standards into job descriptions.
2. The director of Risk Management and the safety director increase employee awareness of rewards available for suggestions that lead to a safer workplace.
June 1998
3. The director of Risk Management and the safety director review, upgrade, and expand the employee safety incentive program.
June-August 1998
4. The director of Risk Management directs the safety specialists to begin accumulating claim data by worker classification.
August 1998
5. The safety specialists use the claims data to identify worker categories with the highest risk factors and design safety programs for those workers.
August 1998 and thereafter
FISCAL IMPACT The district's workers' compensation internal service funds paid $3,073,775 in 1996-97 for workers' compensation costs. This amount includes $1.6 million paid to medical providers and $1.2 million for weekly benefits. If the district set a conservative goal to save 10 percent of these costs and incurred 1 percent worth of training costs, the fiscal impact would be $252,000 ($2.8 million x 10 percent = $280,000 less $28,000 in training costs).
Recommendation 1998-99 1999-2000 2000-01 2001-02 2001-03
Develop strategies to lower workers' compensation claims cost
$252,000 $252,000 $252,000 $252,000 $252,000

by at least 10 percent through increased emphasis on injury management.
FINDING YISD's procedures for processing workers' compensation claims continue to be duplicative, despite changes made in response to recommendations made by its independent auditors in 1995. The auditors' management letter noted that:
The Risk Management department uses a stand-alone computer to administer the claims made for workers' compensation. A listing is generated and given to accounting where it is re- input into the accounts payable system. The stand-alone program should be modified so that it can generate a computer file that can be transferred electronically to the accounts payable system. This would reduce the amount of time spent duplicating the input, and reduce the chance of error.
In a follow-up remark made during its 1996 audit, the auditors noted:
The District plans to take advantage of features included in the new J.D. Edwards software, which will eliminate the need for a stand-alone system. This improvement is being tested and is expected to be completed by January 31, 1997.
The district implemented the workers' compensation module in January 1997. Nevertheless, YISD's payment procedures for weekly workers' compensation benefits continue to involve three software programs and repetitive data entry (Exhibit 6-26).
Exhibit 6-26 Procedures for Requesting Workers' Compensation Checks

1) Each week, as income benefits come due or are terminated, the benefits clerk inputs and deletes requests for checks on a Lotus 123 spreadsheet. 2) Once a week, the benefits clerk generates a check request list from the Lotus 123 spreadsheet. 3) The data entry clerk inputs the check request list into the software system. 4) Accounts payable personnel review the list on-line, approve the payments, and post the amounts to the general ledger. 5) The data entry clerk inputs payment information for each claim into Risk Management's workers' compensation software to keep reserves updated.
Source: Risk Management Department Recommendation 62: Consolidate the processing and reporting of workers' compensation claims and medical payments into one computer system and eliminate repetitive data entry. The Risk Management Department, in conjunction with the MIS department, should modify the workers' compensation module to handle the functions of the Lotus 123 spreadsheet and Risk Management's stand-alone workers' compensation software. IMPLEMENTATION STRATEGIES AND TIMELINE
1. The Director of Risk Management, in conjunction with the MIS Department, assesses systems requirements for processing workers' compensation claims and medical payments.
May 1998
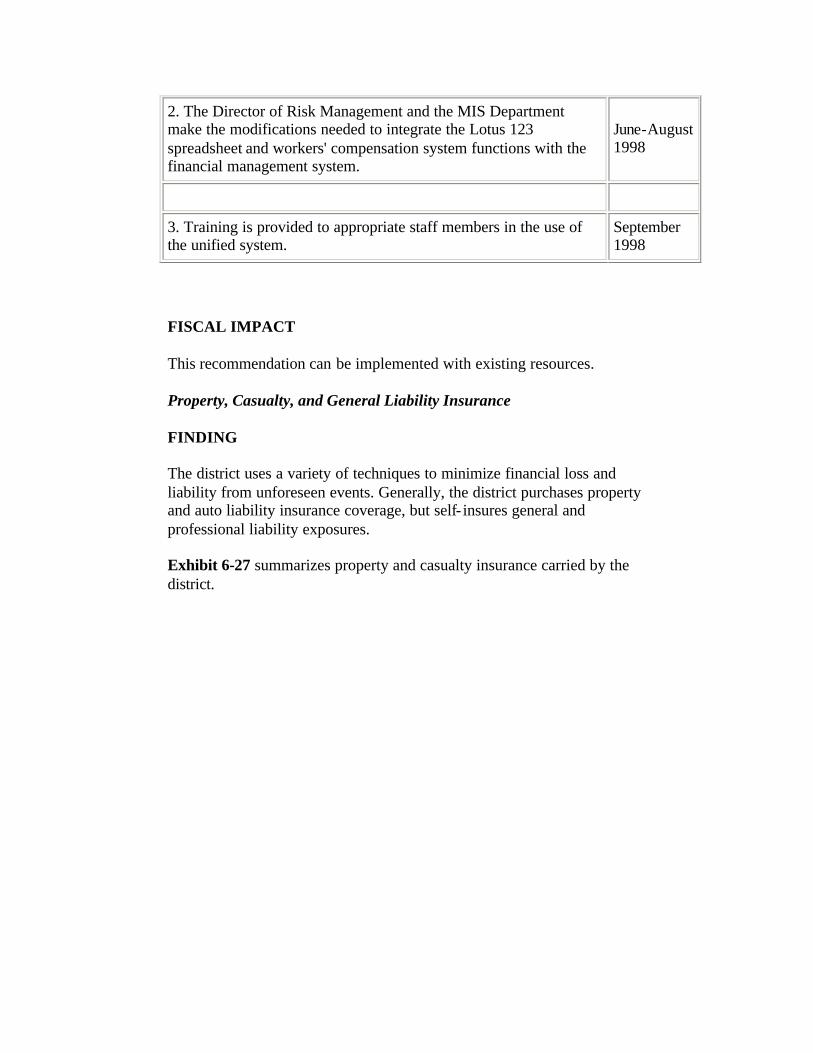
2. The Director of Risk Management and the MIS Department make the modifications needed to integrate the Lotus 123 spreadsheet and workers' compensation system functions with the financial management system.
June-August 1998
3. Training is provided to appropriate staff members in the use of the unified system.
September 1998
FISCAL IMPACT This recommendation can be implemented with existing resources. Property, Casualty, and General Liability Insurance FINDING The district uses a variety of techniques to minimize financial loss and liability from unforeseen events. Generally, the district purchases property and auto liability insurance coverage, but self- insures general and professional liability exposures. Exhibit 6-27 summarizes property and casualty insurance carried by the district.

Exhibit 6-27 YISD Property, Casualty, and Auto Liability Insurance Coverage
Fiscal 1997-98
Insurance Company
Type of Policy Annual Premium Policy
Term Limits
United States Fire Insurance Co.
Automobile Liability Coverage
$129,810 9/1/97-98
Bodily injury $100,000 per person; $300,000 each accident ; Property damage $100,000 per occurrence. No deductible.
Lafayette Life Insurance Co.
Basic Group Term Life Insurance
$144,000 10/1/97-98
$10,000 basis term life insurance per full time employee
American Fidelity Assurance
Aggregate Stop Loss Health Coverage-
$.65/employee/mo. 10/20/97-98
Attachment point at $150,000 per covered person $12,384,000 aggregate
American Fidelity Assurance
Individual Stop Loss Health Coverage
$5.51/empl. $14.34 family
10/20/97-98
$1,000,000 lifetime maximum
National Surety/Fireman's Fund
All Risk Property Coverage
$436,254 1/1/97-98
$50,000,000 per occurrence; $100,000 deductible per occurrence
Fireman's Fund Insurance Co. of
Property Insurance-
$5,000 1/1/97-98 $50,000,000 per
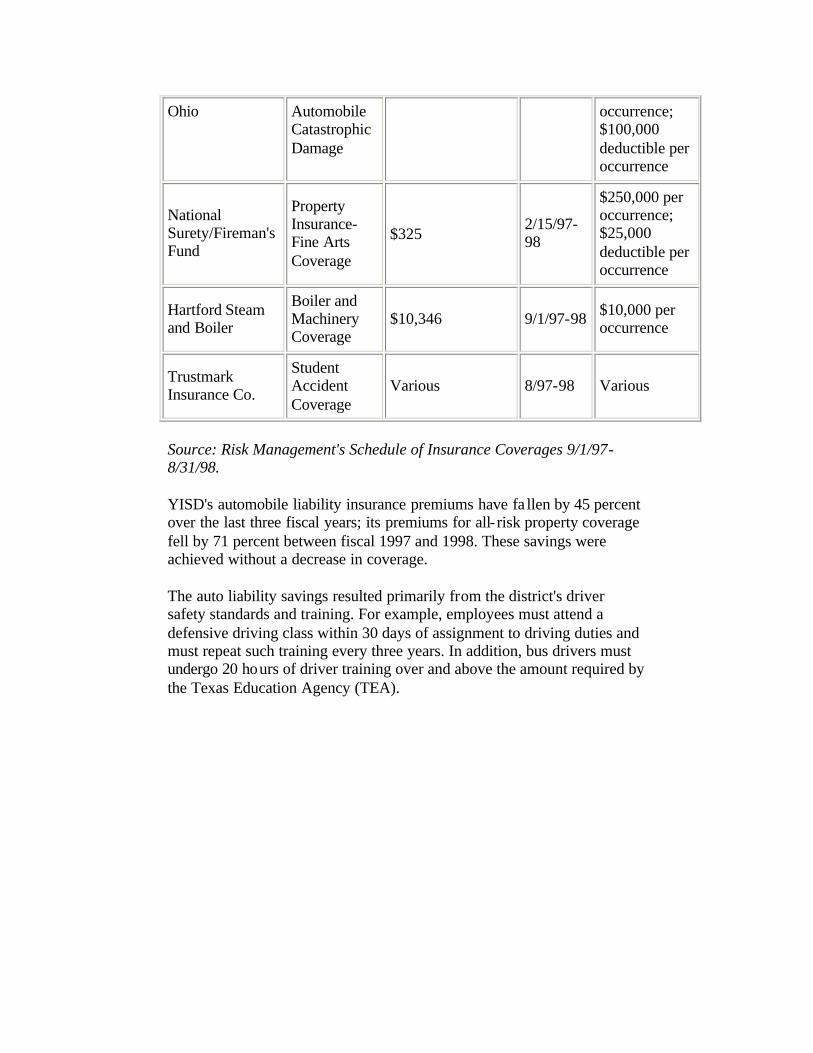
Ohio Automobile Catastrophic Damage
occurrence; $100,000 deductible per occurrence
National Surety/Fireman's Fund
Property Insurance-Fine Arts Coverage
$325 2/15/97-98
$250,000 per occurrence; $25,000 deductible per occurrence
Hartford Steam and Boiler
Boiler and Machinery Coverage
$10,346 9/1/97-98 $10,000 per occurrence
Trustmark Insurance Co.
Student Accident Coverage
Various 8/97-98 Various
Source: Risk Management's Schedule of Insurance Coverages 9/1/97-8/31/98. YISD's automobile liability insurance premiums have fa llen by 45 percent over the last three fiscal years; its premiums for all- risk property coverage fell by 71 percent between fiscal 1997 and 1998. These savings were achieved without a decrease in coverage. The auto liability savings resulted primarily from the district's driver safety standards and training. For example, employees must attend a defensive driving class within 30 days of assignment to driving duties and must repeat such training every three years. In addition, bus drivers must undergo 20 hours of driver training over and above the amount required by the Texas Education Agency (TEA).

The district opened competitive sealed proposals for the all-risk insurance on November 3, 1997. Three proposals were received and assessed based on various district criteria as well as an independent evaluation by the district's property and casualty consultant. The new coverage obtained from this process is for three years beginning March 1, 1998 at an annual premium of $127,275. Exhibits 6-28 and 6-29 present a comparison of the premiums and depict the district's savings.
Exhibit 6-28 Comparison of Auto Liability Premiums 1994-95 through 1996-97
Exhibit 6-29 Comparison of All Risk Insurance Premiums
Source: YISD Risk Management Department
Source: YISD Risk Management Department
COMMENDATION YISD achieved significant savings on the renewal of its auto liability and all-risk insurance policies. FINDING

Historically, YISD has elected to forego insuring certain risks, electing instead to self insure. As this report was being prepared, the district was developing requests for proposals for general and professional liability and errors and omissions coverage. Exhibit 6-30 summarizes YISD's insurance coverage, indicates how the risk of loss is mitigated, and lists possible risks remaining for the district.
Exhibit 6-30 Summary of Risks not Mitigated through Insurance
Type of Insurance Risk Management Technique Remaining Risks
General Liability
-Texas Tort Claims Act provides immunity. -Risks retained by the district.
-Claims not covered by the Act -Legal fees, -Catastrophic unforeseen event(s)
Professional Liability -Risks retained by district. Reserve fund established to absorb costs.
-Catastrophic unforeseen event(s)
Crime Coverage (includes employee dishonesty)
-Risks retained by the district.
-Catastrophic unforeseen event(s)
Excess Workers' Compensation Insurance
-Risks retained by the district. Workers' compensation fund balance used to absorb costs.
-Catastrophic unforeseen event(s)
Peace officer Bonds
-Risks retained by the district. District security officers do not carry guns and district has not had an incident since 1990.
Unforeseen incident
Source: YISD. According to district officials, YISD does not carry general liability

coverage because it is immune from claims of negligence by the Texas Tort Claims Act, which protects agencies of the state from most civil liability. However, this immunity does not extend to criminal acts or litigation concerning violations of federal laws such as the Americans with Disabilities Act or Civil Rights Act. Also, state immunity does not prevent individuals from filing suit against a school district. Consequently, many districts incur expenses for lawsuits despite their limited immunity. Most Texas school districts, including YISD's peer districts, carry some form of general liability insurance to cover legal expenses and provide added security. The director of Risk Management told TSPR that the district does not carry excess workers' compensation insurance because it has never had a catastrophic workers' compensation claim, and current contributions and reserves are sufficient to cover future losses. The district last solicited bids for this insurance in 1994, and that effort received no response. The district also does not carry employee dishonesty insurance. Most districts in Texas, including YISD's peer districts, purchase fidelity bonds to insure themselves against employee dishonesty and malfeasance. Recent Texas cases have highlighted the need for this type of insurance. In one case, a high-ranking district employee was convicted of diverting district funds for personal use through an elaborate purchasing scheme. In another, unrelated case of employee dishonesty, the district's dishonesty policy limit was only $10,000 per occurrence. This inadequate coverage resulted in an additional cost to the district of more than $100,000; moreover, the insurance carrier refused to renew the district's employee dishonesty policy. The district currently does not carry professional liability insurance. During 1988-89, YISD established a $750,000 legal reserve fund at a local bank to absorb the cost of settlements and legal fees arising from lawsuits against school board officials and district employees. As of August 31, 1997, the cash balance in this account was $218,129. Exhibits 6-31 and 6-32 present an analysis of the reserve fund activity since it was established. Both exhibits show that the district's legal expenses have increased dramatically in recent years, substantially depleting the fund balance.
Exhibit 6-31 Professional Liability Trust Fund 1988-89 Through 1996-97 Activity
Year Deposits Interest Admin. Legal Fees Year End

Fees Fund Balance
1988-89 750,000 4,082 2,469 751,613
1989-90 63,221 7,967 41,759 765,108
1990-91 90,435 8,901 92,135 754,507
1991-92 38,022 6,228 168,594 617,707
1992-93 51,520 6,765 96,582 565,880
1993-94 42,740 5,899 52,354 550,367
1994-95 32,165 4,650 171,697 406,185
1995-96 20,112 3,558 167,739 255,000
1996-97 650,000 12,784 2,604 *697,051 218,129
Total $1,400,000 $355,081 $49,041 $1,487,911
Source: Division of Finance. * Includes a $500,000 settlement amount.
Exhibit 6-32 Professional Liability Trust Fund 1988-89 Through 1996-97 Activity
Source: Division of Finance. YISD's professional liability legal fees rose by 276 percent between fiscal 1994 and 1997. This increase includes a $500,000 legal settlement made during fiscal 1997. This absence of professional liability insurance could pose a significant financial risk to the district. Purchase of this insurance is being recommended in the "District Organization" chapter of this review.

YISD's risk retention strategies have been successful in that the district has managed to control its insurance costs by self- insuring many risks. However, as shown in Exhibits 6-31 and 6-32, dramatic fluctuations in losses sometimes occur. Historically favorable loss experience is no guarantee that future catastrophic losses will not occur. Uninsured, unforeseen events could lead to devastating financial losses. Recently, the Texas Department of Insurance, in cooperation with the Comptroller's office prepared an insurance purchasing guide for school districts and placed it on the Internet at www.tdi.state.tx.us.sdguide.splash.html. This guide gives helpful tips to school districts about insurance and certain type coverages, legal requirements, and ways to contain costs. Recommendation 63: Review liability insurance programs at least annually to ensure that risk strategies are appropriate, based on the cost of insurance and the amount of potential loss. IMPLEMENTATION STRATEGIES AND TIMELINE
1. The director of Risk Management identifies and analyses major risks and potential loss exposures to determine whether they are protected by insurance.
June 1998
2. The Director of Risk Management assesses the risk associated with its lack of various liability insurance coverages.
June 1998
3. The Director of Risk Management solicits bids to purchase additional insurance as necessary.
June 1998
FISCAL IMPACT This recommendation can be implemented with existing resources.

Chapter 6 ASSET AND RISK MANAGEMENT
C. Fixed Assets
Fixed assets include land, buildings, building contents, vehicles, and equipment. Proper management of fixed assets involves identifying, recording, and safeguarding existing assets, while ensuring that asset additions, sales, and retirements are properly reflected in the accounting records. The school board has a fiduciary responsibility to protect the district's assets; consequently, the board directs the administration to ensure that all fixed assets are identified and their appropriate cost maintained in the district's records. Property records form the basis for developing adequate insurance coverage and obtaining reimbursement in cases of loss. Furthermore, accurate property records support the fixed-asset balances reflected in the district's annual financial report. CURRENT SITUATION District policy makes the superintendent responsible for establishing an accounting system for school property at each school. Administrative personnel at each school conduct a physical count of property at the end of each fiscal year and notify the district's Accounting Department of fixed-asset additions and retirements made during the year. TEA's Resource Guide requires that assets costing $5,000 or more must be recorded in the fixed-asset group of accounts. Items costing less than $5,000 are recorded as an operating expense of the appropriate fund under TEA guidelines. However, the guidelines allow school districts to establish lower thresholds for the purpose of maintaining accountability and control of assets costing less than $5,000. For example, audiovisual and computer equipment costing less than $5,000 does not have to be capitalized in the fixed-asset group of accounts, however, most school districts maintain lists of such assets and their location for control and accountability purposes. YISD maintains lists of assets with a value of $500 or more. When a fixed asset is purchased, school personnel complete a fixed-asset additions and deletions form that is sent to the Accounting Department for entry into the computerized accounting system. At the end of the year, the district sends each school a computer printout of its fixed assets that is intended to assist the school in conducting its year-end physical inventory. After completion of the physical inventory, school personnel send the district a certificate of accuracy and their version of the year's additions and deletions. FINDING District procedures for receiving fixed assets are inadequate and do not ensure that fixed assets are properly received, recorded, and safeguarded. The district has no uniform policy specifying where fixed assets are to be delivered. Instead, district procedures allow school and department personnel to determine where their orders should be delivered. While in the district, TSPR's review team observed computer and audiovisual equipment

being delivered to the central district office's mailroom. Some fixed assets are delivered directly to individual schools; others are delivered to the warehouse. In all, YISD has little assurance that its assets are properly received and recorded. Furthermore, while school and department personnel are required to complete a fixed-asset additions and deletions form to report transactions to central office, district accounting staff told the review team that at times schools do not complete the form because they feel it won't be processed. Recommendation 64: Develop comprehensive, consistent procedures regarding the receipt and recording of fixed assets to be controlled by the warehouse. Fixed-asset deliveries, transfers, and disposals should be controlled by the warehouse. Warehouse personnel should be held accountable for ensuring that assets are properly identified, delivered, and recorded. The property control officer should be officed at the warehouse to provide another level of accountability. IMPLEMENTATION STRATEGIES AND TIMELINE
1. The property control officer reviews and evaluates existing procedures through interviews and site visits. May 1998
2. The property control officer develops policies and procedures regarding the receipt of fixed assets.
May-July 1998
3. The CFO and comptroller review the policies and procedures to make revisions, provide positive feedback, and approve the final procedures.
July-August 1998
4. The property control officer develops training programs for warehouse and other appropriate district personnel.
July-August 1998
5. The property control officer implements revised policies and procedures and initiates training programs.
September 1998
FISCAL IMPACT This recommendation can be implemented with existing resources. FINDING Most of YISD's assets are difficult if not impossible to locate using the fixed-assets subledger. The district does not tag its fixed assets for identification purposes. Although each asset is assigned an identification number by the central office when it is entered into the fixed asset system, this number is not affixed to the asset. Furthermore, the fixed-

assets subledger does not arrange assets by room. During visits to two schools, TSPR's review team attempted to locate several assets on the school's subledger and could not because the assets were neither tagged nor listed by room. The district reported to the review team that the financial system's fixed asset module allows for tracking by location and will be online in the future. Bar-coding assets at the warehouse would eliminate the need for central-office input of fixed-asset addition and deletion forms. YISD already has the infrastructure and equipment needed to use bar-coding technology. The district has experimented with bar-coding in the past to track inventory within the warehouse but has never fully integrated the process with its fixed-assets accounting system. Recommendation 65: Bar-code all fixed assets at the central warehouse; reconfigure the fixed-assets subledger to list assets by room. A bar-coding system would eliminate paperwork, reduce human error, and automate the fixed-asset accounting process. Assets would be easier to find if they are tagged and arranged by room on the fixed-assets subledger. In addition, district employees should be held responsible for assets located in their room or area. IMPLEMENTATION STRATEGIES AND TIMELINE
1. The comptroller and property control officer, in cooperation with warehouse and management information system personnel, determine requirements to adopt bar-coding technology in the district and integrate it with the fixed-asset accounting system.
May-July 1998
2. The comptroller and property control officer devise a fixed-asset accounting system for use with bar-coding technology, and provide training for warehouse personnel.
May-August 1998
3. The Comptroller and Property control officer implement bar-coding technology.
September 1998
FISCAL IMPACT This recommendation can be implemented with existing resources. FINDING Prior to December 1996, YISD tracked all nonconsumable assets with a unit cost of between $200 and $500 and capitalized items having a unit cost of $500 or more. Capitalization is an accounting procedure that records certain items in the fixed asset

group of accounts instead of charging them to operating expense in the year of purchase. In December 1996, the district began capit alizing and tracking nonconsumable items with a unit cost of $500 or more. TEA guidelines require a $5,000 per- item capitalization threshold, while noting that districts may wish to adopt lower thresholds. The $200-$500 items that were in the fixed-asset records as of December 1996 continue to be tracked. The fixed assets subledger for two schools visited by the review team listed many items with a value of less than $500. Eliminating these items from the subledger would relieve the administrative burden on those charged with the responsibility of tracking them. Recommendation 66: Eliminate items on the fixed-asset lists with a dollar value of less than $500. One exception would be for electronic and audiovisual equipment such as videotape recorders (VCRs), televisions, computer monitors, and overhead projectors. The value of these items may fall below the threshold but they are commonly stolen and should be tracked. IMPLEMENTATION STRATEGIES AND TIMELINE
1. The property control officer works with the comptroller to emphasize to school and department administrators the district's policy on fixed- asset tracking.
May-June
2. The chief finance officer works with the comptroller and property control officer to inform school personnel that, during the inventory, items worth less than $500 will be eliminated from the subledger. This would not apply to valuable but low-dollar items such as VCRs, televisions, computer monitors, and the like.
June-August
FISCAL IMPACT This recommendation can be implemented with existing resources. FINDING YISD's inventory procedures do not ensure an accurate physical inventory. The central office places undue reliance on certificates of accuracy that accompany completed school inventories; the certificate does not merit such reliance because it is simply an analysis of the account balance, not a verification that the physical assets exist. Exhibit 6-33 is a representation of the certificate:
Exhibit 6-33 Certificate of Accuracy Fixed Assets Inventory

The 1996-97 physical inventory of fixed assets was conducted on (date) at (school name) campus and consisted of the following values:
Prior Year Balance $174,932 Additions $26,420
Deletions $6,356
Current Year Balance $194,996
I THE UNDERSIGNED DO HEREBY CERTIFY THAT THE ABOVE INFORMATION AND THE ATTACHED FIXED ASSET INVENTORY, CONSISTING OF ALL ITEMS,
REGARDLESS OF CONDITION, IS ACCURATE AND COMPLETE. NEW RECEIPTS
AND CHANGES HAVE BEEN MADE TO THE INVENTORY LISTINGS AS A RESULT OF A PHYSICAL VERIFICATION.
PRINCIPAL DATE Source: Division of Finance. Attached to these certificates are lists of additions and deletions. The certificate of accuracy and attached lists, however, provide no assurance that an actual inventory has been taken. In fact, TSPR's examination of the certificates and supporting worksheets and interviews with district personnel suggest that the inventory process merely verifies the years' additions and deletions. The district's independent auditors made the following observations and recommendations during the 1995 audit:
Each campus is responsible for its own fixed asset inventory. Therefore, the tracking systems vary at each campus or department along with the degree of control. A uniform set of procedures should be implemented to ensure that each school or department can adequately identify and track

their furniture and equipment. Also, these procedures should prohibit any individual from removing equipment from the campus without a properly approved change form. This form should be routed to accounting so that the appropriate entries can be made to the inventory.
In a follow-up observation made during the 1996 audit, the auditors noted:
Our current year testwork indicates that some assets are still recorded as being located at a campus, although they can not be located. When the new software has been implemented, the district may want to consider taking a complete inventory and purging any non-existing assets from the listings. This will provide each campus with an accurate beginning inventory for which they can be held accountable.
The district recognizes that there are problems with its fixed-assets inventory and control. In August 1997, a new position called property control officer was created to bring this area under control. Preliminary recommendations made by the control officer include:
• Implement perpetual inventories. • Develop and maintain an inventory procedures manual. • Provide detailed instructions for those involved in taking the physical inventory. • Use bar-coding and tag fixed assets. • Use temporary employees to assist in taking inventory.
Recommendation 67: Implement the fixed-asset inventory control and procedure recommendations outlined by external auditors and the district's property control officer. IMPLEMENTATION STRATEGIES AND TIMELINE
1. The property control officer finalizes his review and report of the fixed-assets area.
March 1998
2. The external auditor's and property control officer's recommendations are reviewed, modified as necessary, and approved by the chief finance officer and comptroller.
March-May 1998
3. The external auditor's and property control officer's recommendations are implemented.
June 1998
FISCAL IMPACT This recommendation can be implemented with existing resources.
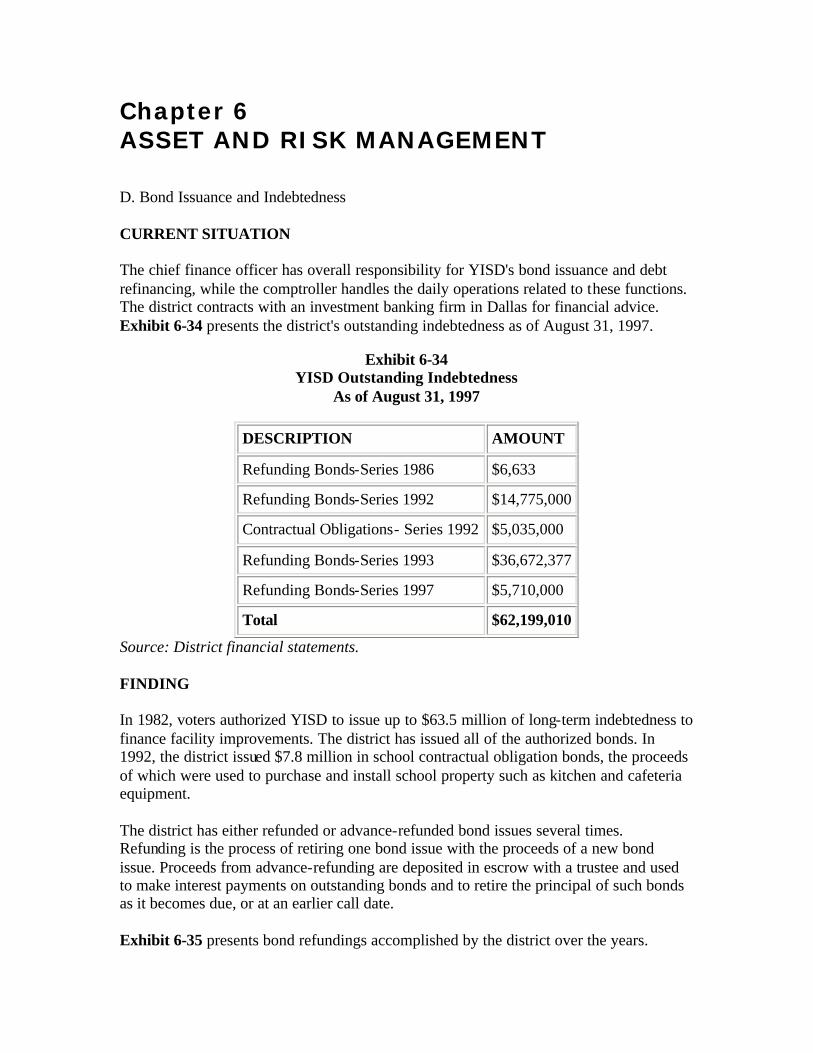
Chapter 6 ASSET AND RISK MANAGEMENT
D. Bond Issuance and Indebtedness CURRENT SITUATION The chief finance officer has overall responsibility for YISD's bond issuance and debt refinancing, while the comptroller handles the daily operations related to these functions. The district contracts with an investment banking firm in Dallas for financial advice. Exhibit 6-34 presents the district's outstanding indebtedness as of August 31, 1997.
Exhibit 6-34 YISD Outstanding Indebtedness
As of August 31, 1997
DESCRIPTION AMOUNT
Refunding Bonds-Series 1986 $6,633
Refunding Bonds-Series 1992 $14,775,000
Contractual Obligations- Series 1992 $5,035,000
Refunding Bonds-Series 1993 $36,672,377
Refunding Bonds-Series 1997 $5,710,000
Total $62,199,010
Source: District financial statements. FINDING In 1982, voters authorized YISD to issue up to $63.5 million of long-term indebtedness to finance facility improvements. The district has issued all of the authorized bonds. In 1992, the district issued $7.8 million in school contractual obligation bonds, the proceeds of which were used to purchase and install school property such as kitchen and cafeteria equipment. The district has either refunded or advance-refunded bond issues several times. Refunding is the process of retiring one bond issue with the proceeds of a new bond issue. Proceeds from advance-refunding are deposited in escrow with a trustee and used to make interest payments on outstanding bonds and to retire the principal of such bonds as it becomes due, or at an earlier call date. Exhibit 6-35 presents bond refundings accomplished by the district over the years.

Exhibit 6-35 District Refunding History
Year Amount Purpose Benefit
1986 $39,794,475 Advance Refund previously issued bonds
Reduced total debt service by $2.4 million.
1992 $23,175,000 Advance Refund previously issued bonds
Resulted in debt service savings to district.
1993 $38,827,377 Refund previously issued bonds
No overall debt savings. Refunding reduced annual debt service requirements over the next several years.
1997 $5,710,000 Refund previously issued bonds
Resulted in debt service savings to district of $216,740 (present value).
Source :Bond Official Statements 1992-1997 and 1996 auditor's report. COMMENDATION YISD has refunded its debt to save interest costs of more than $2.6 million.

Chapter 7 FINANCIAL MANAGEMENT This chapter reviews YISD's financial management functions in five major sections:
A. Financial Systems and Management Reporting
B. Accounting Operations
C. Budgeting and Planning
D. Payroll
E. Internal and External Auditing
BACKGROUND
Texas school districts generate financial information to facilitate decision-making by their own administrators as well as state agencies and lawmakers and the general public. Various requirements have been established for school districts to maintain proper budgeting and financial reporting systems. Financial oversight for school districts is guided by:
• federal and state laws, rules, and regulations. • the Texas Education Agency (TEA) Financial Accountability System Resource
Guide. • YISD board policies and procedures. • internally established policies and procedures. • Generally Accepted Accounting Princip les (GAAP). • Governmental Accounting Standards Board guidelines.
Every Texas school district is required to account for its financial resources by fund. A fund is defined as an accounting entity with a self-balancing set of accounts that records cash and other financial resources together with all liabilities and residual balances. Funds are maintained separately for specific activities or objectives.
The ongoing challenge for Texas school districts is to develop, maintain, and effectively use financial management systems to integrate the following elements:
• long-range and strategic plans. • annual budgets linked to long-range plans. • long-range debt requirements balanced with current operating needs. • effective systems of internal financial control. • accurate and timely financial information produced for a variety of users. • effective automated processes.

Chapter 7 FINANCIAL MANAGEMENT
A. Financial Systems and Management Reporting CURRENT SITUATION YISD's Division of Finance is managed by a chief finance officer (CFO) and consists of 55 full-time employees organized into the five departments shown in Exhibit 7-1.
Exhibit 7-1 Division of Finance Organization
Source: YISD Division of Finance. FINDING YISD's internal financial reports are difficult to read and understand. Two different monthly financial packages are prepared for internal use. One is prepared for the CFO, which contains comprehensive financial information. The other is prepared for the board and contains selected information from the CFO's report. Although both documents contain valuable information, the print in both documents is very small, making it difficult to read. Line graphs are unclear and difficult to interpret. In 1991, the Government Finance Officers Association (GFOA) developed criteria for Popular Annual Financial Reports (PAFRs). "Popular" financial reports provide financial information in an easier to read format than what is contained in most comprehensive financial reports. The goal of the PAFR program is to encourage financial reporting that is more understandable to users not versed in accounting or finance. Popular financial reports are evaluated on various criteria including reader appeal and ease of use (Exhibit 7-2).

Exhibit 7-2 Government Finance Officers Association Popular Annual Financial Report Criteria
Category Criteria
Reader Appeal
1. The report is short enough to easily maintain user interest. 2. The format of the report is logical and easy to understand. 3. The report's print style is easy to read. 4. The photographs, charts, or other artwork enhance the report's appeal.
Understandability
1. The report avoids jargon and technical language that may not be clear to readers who lack a financial or accounting background. 2. The report uses charts and graphs effectively to clarify the financial data presented. 3. The report uses narrative effectively to explain financial data and to highlight significant items. 4. The report helps readers to understand financial data in context through trend analysis. 5. The report minimizes the potential for misinterpreting the information presented.
Source: Government Finance Officers Association. Recommendation 68: Develop internal financial reports that are easier to read, interpret, and understand. The district should use the Government Finance Officers Association's Popular Annual Financial Report criteria as a guide to enhance the presentation of its financial reports. Financial data should be clarified using charts, tables, larger fonts, written analysis, and executive- level summaries. IMPLEMENTATION STRATEGIES AND TIMELINE
1. The CFO and comptroller solicit input from the superintendent and board members to redesign schedules and improve the format, presentation, and readability of the monthly reporting package.
June 1998
2. The CFO and comptroller use GFOA's criteria for PAFRs to produce exemplary internal financial reports.
August 1998 Ongoing

FISCAL IMPACT This recommendation can be implemented with existing resources.

Chapter 7 FINANCIAL MANAGEMENT B. Accounting Operations CURRENT SITUATION YISD's accounting operations include accounts payable, grant accounting, cashier, payroll, school funds, general ledger, tax collections, fixed asset accounting, and travel reimbursement. After review of the district's travel expenses, the review team found that they were reasonable compared to averages for peer districts and districts in the Region XIX Education Service Center. The comptroller is responsible for day-to-day accounting operation activities, with the assistance of a payroll coordinator and an accounts payable/general accounting coordinator. Exhibit 7-3 presents the organization of the Comptroller's Office.
Exhibit 7-3 Comptroller's Office Organization

Source: YISD Division of Finance. FINDING YISD collected 96 percent of its 1996-97 property tax levy during fiscal 1997. When collections of the prior year's delinquent taxes are included, the total collection rate increases to 99 percent. In Texas, central appraisal districts perform property appraisals for tax valuations. Generally, school districts levy and collect property taxes. In some instances, however, the taxes are collected by other entities and remitted to the district. Since 1986, YISD has had an interlocal tax collection contract with the City of El Paso, which collects the district's current and delinquent property taxes on the district's beha lf. Each month, the city provides the district with a tax collections report. Both the comptroller and CFO review these reports in detail for errors, omissions, or irregularities.

School districts adopt separate tax rates each year for maintenance and operations (M&O) and debt service, both of which contribute to the total rate. This combined rate is applied to assessed property values to compute the district's total levy. Exhibit 7-4 presents YISD's tax rates, property valuation, and tax levy from 1994-95 through 1997-98.
Exhibit 7-4 YISD Tax Rates
1994-95 through 1997-98
Year M&O Debt Service
Rate per $100 of Valuation
Assessed Property Value
Total Levy
1994-95 1.40442 0.24558 1.65 $3,484,798,060 $57,499,168
1995-96 1.403126 0.202853 1.605979 $3,794,863,214 $60,944,706
1996-97
1.452215 0.197312 1.649527 $3,821,363,136 *$63,034,416
1997-98
1.376295 0.203956 1.580251 $3,621,932,339 $57,235,622
Source: Audited financial statements and interviews with district personnel. * Does not include a billing adjustment of $786,468. The reduced tax levy in 1997-98 is primarily due to the increased homestead exemption passed by the Legislature and approved by the voters of Texas. However, general revenues for YISD have increased slightly because of increased state and federal funding. Exhibit 7-5 and Exhibit 7-6 compare YISD's tax collection rates to those of its peers for 1994-95 through 1996-97.
Exhibit 7-5 YISD and Responding Peer Districts
Current Tax Collections 1994-95 through 1996-97
District 1994-95 1995-96 1996-97
Ft. Worth ISD 96% 98% 98%
Houston ISD 96% 96% 97%
El Paso 97% 98% 97%

Socorro ISD 96% 96% 96%
Ysleta ISD 97% 98% 96%
San Antonio ISD 96% 97% 96%
Average without YISD 96% 97% 97%
Source: YISD and peer district surveys.
Exhibit 7-6 YISD and Peer District Overall Tax Collections*
1994-95 through 1996-97
District 1994-95 1995-96 1996-97
Houston ISD 100% 100% 101%
Ysleta ISD 99% 100% 99%
El Paso 98% 99% 99%
San Antonio ISD 98% 99% 99%
Socorro ISD 98% 99% 99%
FT. Worth ISD 98% 99% 99%
Average without YISD 98% 99% 99%
Source: Source: YISD and peer district surveys. *Overall tax collection rates include both current and delinquent taxes. Exhibit 7-7 compares YISD's delinquent taxes as of August 31, 1997 to those of its peer districts.
Exhibit 7-7 Cumulative Delinquent Taxes
YISD Compared to Peer Districts As of August 31, 1997
District 1996-97 Levy Cumulative Delinquent Taxes
Percentage Delinquent Taxes to Levy
San Antonio ISD $96,102,891 $12,970,970 13%
Socorro ISD $26,098,563 $2,528,160 10%
FT. Worth ISD $170,398,804 $17,882,380 10%

El Paso $126,435,035 $9,539,410 8%
Ysleta ISD *$63,820,884 $5,000,560 8%
Houston ISD $625,831,887 $21,064,034 3%
Source: YISD and peer district surveys. * Includes a billing adjustment of $786,468. As shown in the above chart, YISD has the second lowest percentage of delinquent taxes compared to its peer districts. This low percentage demonstrates that the City of El Paso is effectively collecting delinquent taxes for the district. COMMENDATION YISD is achieving a high overall tax collection rate through an interlocal agreement with the City of El Paso. FINDING YISD's Accounting Department experienced difficulties in closing its books for 1996-97. The books were not closed until October 20, 1997, 35 business days after the year's end. Normally, the Accounting Department closes the books in 25 days. This delay was caused by errors that occurred during various stages of the closing process. Exhibit 7-8 outlines the problems involved.
Exhibit 7-8 Year-End Closing Problems
1996-97
Problem Resolution
The "Received Not Vouchered Report" (which shows materials received but not invoiced) did not agree with the general ledger. The accounting system was not producing an accurate report with all the needed information.
The MIS Department revised the report and modified underlying computer files used by the report for source data.
Campus records showed quantities received from the warehouse that did not agree with warehouse records of quantities shipped to the school.
The Accounting Department researched and manually corrected these errors.
School records showed items as being received that had not been received.
The Accounting Department researched and manually corrected these errors.
Vendor payments did not post correctly throughout the The Accounting Department

computer system for purchased items. researched and manually corrected these errors.
Accounts Payable clerks vouchered purchase orders in August 1997 for items not received and invoiced until September 1997.
The Accounting Department researched and manually corrected these errors.
Source: YISD Accounting Department. District accounting personnel told the review team that year-end closing problems resulted primarily because they were not sufficiently familiar with the accounting module of the automated financial system. This software was used for the first time to close the books during 1996-97. The Finance Division is experiencing various problems with the accounting and finance module; these problems are discussed in more detail in the Computer and Technology chapter of this report. Exhibit 7-9 compares the time YISD requires to close its books with times required in selected peer districts.
Exhibit 7-9 Average Days to Close
YISD versus Peer Districts
Business Days to Close
District Monthly Year-end
FT. Worth ISD 3 65
Ysleta ISD 11 35
Houston ISD 5 30
San Antonio ISD 7 30
El Paso 4 25
Socorro ISD 10 23
Corpus Christi ISD 3 30
Average without YISD 5 34
Source: Accounting Department and peer district surveys The 35-day period required to close the books is a problem because it delays producing reports with up-to-date financial information and delays the processing of financial transactions for the new fiscal year. Recommendation 69:

Modify software and closing procedures to correct reporting and processing problems. Both the finance system and human error played a role in YISD's monthly and year-end closing difficulties. The district should correct system problems as necessary so that the vouchered reports agree with the general ledger. To eliminate cases of human error, training should be provided to staff to make full use of the accounting software and to expedite monthly closing times to five days and year-end closing times to 20 days. IMPLEMENTATION STRATEGIES AND TIMELINE
1. The comptroller directs the accounting coordinator to determine the staff's level of knowledge of the district's accounting software, and to develop appropriate training and procedure revisions for monthly and year-end closings.
June 1998
2. The comptroller and accounting coordinator implement closing procedures and provide training to appropriate staff to reduce the time required to close.
June 1998
FISCAL IMPACT This recommendation can be implemented with existing resources. FINDING YISD does not have a comprehensive accounting procedures manual. Texas school districts typically use TEA's Financial Accountability System Resource Guide as their accounting manual. However, TEA's guide is designed to supplement, not replace, a district manual. Division management told TSPR that the district has no single document outlining its accounting policies and procedures, but does have a document entitled "Business Practices Overview," which is neither complete nor comprehensive and systematic. Exhibit 7-10 summarizes this document's table of contents.
Exhibit 7-10 Business Practices Overview Manual
Summary of Contents
Chapter Title Description
1. Previous Reference Documents
A one-page summary of previously distributed documents including:
• adopted budget (memo from Budget director). • overview of business transactions using accounting
software.

• school operating funds. • technology matching programs.
2. Legal Framework for Purchasing
Lists procurement methods for contracts valued at $25,000 or more (competitive bidding, request for proposal, catalogue purchases, interlocal contracts).
3. School Purchasing Guide Describes general school purchasing procedures.
4. Purchase Order Module
Describes school purchasing procedures using J.D. Edwards' financial software purchasing module.
5. General Operating and School Operating Funds
Describes procedures for general and operating school funds.
Source: YISD Division of Finance. Although this document includes general guidelines and procedures for purchasing and school funds, it lacks many of the elements of a truly comprehensive procedures manual. A procedures manual provides accounting staff with detailed procedures for performing critical accounting and reporting functions. Examples of procedures include:
• budget preparation procedures. • district procedures for approving checks and journal vouchers. • procedures for cash receipts and travel reimbursements. • procedures for counting and reconciling district fixed assets. • bank account reconciliation procedures. • year-end closing procedures. • district procedures for preparing and distributing monthly and annual financial
reports. • payroll processing procedures.
A 1996 Texas Performance Review report on the Houston Independent School District (HISD) commended HISD for its financial procedures manual, which consists of 16 sections in two volumes. Exhibit 7-11 outlines the contents of each section.
Exhibit 7-11 HISD Financial Accounting Manual Contents
Volume I Volume II
Section Contents Section Contents

100 General Information 900 General Accounting
200 Accounts Payable 1000 Grants/Special Revenue Fund
300 Centralized Activity Funds 1100 Internal Auditing Services
400 Non-Centralized Activity Funds 1200 Payroll
500 Budgeting And Financial Planning 1300 Purchasing
600 Financial Reports 1400 Rental of School Facilities
700 Fixed Assets 1500 Benefits and Risk Management
800 Food Services 1600 Capital Project Programs
Source: HISD Financial Accounting Manual. In the development of procedures, many districts find that in documenting the processes, a re-examination occurs that allows improvements to take place while eliminating steps that do not add value. Further, well-documented procedures provide new employees a training guide and protects the knowledge of experienced employees. Recommendation 70: Develop a formal accounting procedures manual that fully documents day-to-day operating procedures. The district should examine exemplary accounting procedures manuals produced by other districts and develop a customized manual for YISD to improve the clarity and efficiency of accounting operations at all levels of the district. A system for regular update and periodic reviews should be established so that procedures are kept up-to-date and polices are changed or eliminated when no longer needed. IMPLEMENTATION STRATEGIES AND TIMELINE
1. The CFO and comptroller direct each staff member to document all critical accounting processes.
May-June 1998
2. The comptroller develops a draft procedures manual that includes best practices methods. July 1998
3. The CFO approves the final procedures manual and distributes it to all accounting staff.
September 1998
FISCAL IMPACT This recommendation can be implemented with existing resources.

FINDING The Finance Division's Accounts Payable and General Accounting Department has 18 full-time employees and three temporary employees. During fiscal 1996-97, the department's accounts payable clerks processed 82,675 vendor and travel invoices. The district's accounts payable computer system tracks the number of invoices processed by each clerk. Although this information has been used by the department to reorganize workloads, it has not been used to measure performance or help management determine the efficiency and effectiveness of its accounts payable processes. Examples of useful performance measures include:
• purchase orders completed within 30, 60, 90 days by person. • vouchers processed by staff per period. • errors made by ordering entity (purchase order errors, receiving errors, etc.). • errors made by vendors on invoices.
Recommendation 71: Define and use performance measurements to evaluate staff performance and accounts payable functions. The district should fully use the accounts payable computer system to track the overall efficiency of the Accounts Payable and General Accounting Department and of staff within the department. Inefficiencies should be corrected, and staff deficiencies appropriately addressed. IMPLEMENTATION STRATEGIES AND TIMELINE
1. The comptroller directs the accounting coordinator to identify relevant performance measures for the Accounts Payable and General Accounting Department.
June 1998
2. The accounting coordinator identifies sources of data for relevant performance measures and devises a tracking methodology including tracking statistics already provided by the computer system.
August 1998
3. The performance measures are used to evaluate the effectiveness, efficiency, and cost of key activities and of staff performance within the Accounting Department.
September 1998
FISCAL IMPACT

This recommendation can be implemented with existing resources. The Accounts Payable Department should benefit from increased efficiency through improvements in performance. FINDING The Accounts Payable Department pays some invoices before they are due. The review team selected 50 district checks at random and requested supporting documentation for them; this documentation was reviewed to evaluate accounts payable payment procedures and practices. Of the checks examined, 17, or 34 percent, were for vendor invoices with payment terms, as opposed to checks for items such as travel reimbursements, workers' compensation payments, and construction costs. The review team noted that 13 out of the 17 vendor invoices were paid early (Exhibit 7-12).
Exhibit 7-12 Invoices paid Before Due Date
Check No. Description Date Due Date Paid Days Early
329493 Microphone Repair 6/22/97 5/29/97 24
324216 Computer Material 4/30/97 4/9/97 21
317492 Report cards 2/20/97 1/31/97 20
324931 School Supplies 5/7/97 4/17/97 20
311342 PC Boards 12/8/96 11/20/96 18
335483 Books 8/29/97 8/13/97 16
321699 Pencils 3/26/97 3/13/97 13
331113 Stools 7/1/97 6/18/97 13
315524 Software Manuals 1/27/96 1/15/97 12
317775 CD-ROM 2/17/97 2/5/97 12
313156 Book Displays 12/20/96 12/11/96 9
313194 Copier Rental 12/17/96 12/11/96 6
311397 School Supplies 11/24/96 11/20/96 4
Source: YISD Accounts Payable Department. Accounts Payable personnel said they pay early to allow for mail time. Also, a few vendors require payment immediately upon billing, particularly if the district has reached

its credit limit. While these exceptions may explain some of the results in Exhibit 7-12, they still demonstrate a general tendency to pay invoices early. Paying invoices well before they are due is not a good cash management practice. Some districts use an aging report, which lets Accounts Payable staff know when vendor invoices are due for payment. Although the accounting system can produce an aging report, an independent CPA firm that reviewed the district's cash management policies and procedures in 1996-97 found that the district has not used this function because it finds it too cumbersome. Hence, all incoming invoices are coded "due upon receipt." The district loses interest income for each day the cash is paid out early. Paying early is advantageous only if the vendor gives a discount for early payment that is more than the lost interest. Recommendation 72: Eliminate the practice of paying invoices early by developing more effective cash management tools. The district should review and revise its procedures to ensure that it processes and mails checks in time to reach vendors by the due date-but not well before. If the vendor offers an early-payment discount, this should be considered if it benefits the district. The Accounts Payable aging report should be used as a cash management tool to help the district project cash requirements, monitor invoice due dates, and schedule payments to maximize cash flow. IMPLEMENTATION STRATEGIES AND TIMELINE
1. The comptroller and accounting coordinator produce an efficient, useful accounts payable aging report. June 1998
2. The comptroller and accounting coordinator redesign payment procedures so that vendor invoices are paid on the due date, not well ahead of time.
June-August 1998
3. The accounts payable cle rks are trained in the new procedures and in the use of the accounts payable aging report.
August-September 1998
FISCAL IMPACT This recommendation can be implemented with existing resources. There would be additional interest earnings when excess cash is invested but the increased earnings cannot be estimated at this time.

Chapter 7 FINANCIAL MANAGEMENT
C. Budgeting and Planning Budgeting and planning are critical for effective financial management and control. The process of allocating and prioritizing resources plays a more important role in school districts than in privately owned organizations. The type, quantity, and quality of school district goods and services often are not subject to market forces of supply and demand; therefore, the budget primarily reflects decisions made by the school board, school administrators, and the public. CURRENT SITUATION The director of the Budget and Planning Department reports to the CFO and is responsible for preparing the district's budget. Six staff positions (one vacant at the time of the review) assist in the department's day-to-day operations (Exhibit 7-13).
Exhibit 7-13 Budget & Planning Department Organization
Source: YISD Division of Finance. YISD's board and administration are committed to site-based decision-making (SBDM) and therefore support campus-level budgeting. Under site-based budgeting, principals are responsible for the preparation, maintenance, and outcomes of their schools' budgets. YISD's budgeting process begins early in the calendar year with discussions of financial status and future goals and objectives. Exhibit 7-14 presents the district's central office budget

preparation process; Exhibit 7-15 outlines the school- level process; and Exhibit 7-16 presents the 1997-98 budget calendar.
Exhibit 7-14 YISD Central Office Budget Development
Source: YISD Budget & Planning Department.
Exhibit 7-15 YISD School Budget Development
Source: YISD Budget & Planning Department.
Exhibit 7-16 YISD Budget Development Calendar
1997-98
January • Review current status and issues. • Make preliminary estimates of enrollment, revenue, and costs.
February
• Review preliminary estimates and discuss allocations. • Train Campus Educational Improvement Councils. • Revise budget packets, instructions, and formula allocations. • Review allocations.
March • Board discusses revenues, allocations, and costs. • Hold budget workshop and distribute budget packets. • Hold budget development workshop for new principals.

April
• Review budget projections. Discuss salary increases and technology/equipment fund priorities. • Conduct automated budget system training. • Present current-year projections, salary/tax increase proposals, and central allocations to board. • Submit budget packets for cabinet approval.
May • Discuss salary increase proposals. • Cabinet submits budget packets back to budget office.
June
• Discuss salary increase proposals. • Hold preliminary discussion of additional requests and final discussion on salary increase proposals. • Submit salary increase proposals to board. • Discuss special revenue fund budgets and continue discussion of additional requests. • Approve technology and equipment fund budgets and additional requests.
July • Approve proposed budget including facilities fund. • Present proposed budget to board. • Publicize meeting to adopt proposed budget with 10 days' notice.
August
• Superintendent posts 72-hour notice of meeting of board to adopt budget and approve salary increases. • Board adopts budget, approves salary increases, and presents effective tax rate. • Publish effective and rollback tax rates, schedules, and fund balances. • Publish Notice of public hearing on tax rate as needed. • Post 72-hour notice of public hearing as needed. • Hold public hearing as needed; schedule and announce meeting to adopt tax rate 3-14 days from this date. • Publish notice of vote on tax rate. • Post 72-hour notice for meeting at which the board will adopt tax rate. • Hold board meeting to adopt tax rate.
Source: 1997-98 Budget Instruction Manual. District revenues come from many sources and are disbursed in a variety of ways. The district's official 1997-98 budget includes more than $256 million in revenues and approximately $245 million in appropriations from the General Operating, Food Services, and Debt Services Funds. The remaining $11 million is the excess of revenues for other uses. More than two-thirds of the revenues in the district's official budget comes from state sources, primarily Foundation School Program entitlements (Exhibit 7-17). Property taxes, interest on investments, and other miscellaneous income provide another 26 percent. Approximately 81 percent of the district's budget is allocated to operations that directly affect students. Instructional services make up about 68 percent and support services make up the other 13 percent. The

remaining 19 percent consists of administrative and other support services (Exhibit 7-18 through Exhibit 7-21).
Exhibit 7-17 YISD Sources of Revenue
Fiscal 1997-98 (In Thousands)
Source: 1997-98 YISD Budget.
Exhibit 7-18 YISD Expenditures by Function Fiscal 1997-98 (In Thousands)
Exhibit 7-19 YISD Expenditures by Object Fiscal 1997-98 (In Thousands)
FUNCTION AMOUNT OBJECT AMOUNT
Instruction $146,315 Payroll Costs $195,738
Instruction-related 18,385 Contracted Services 16,521
Student Support 32,750 Supplies & Materials 15,149
Other Support 38,082 Other Operating Costs 5,226
Community Services 493 Debt Service 8,206
Debt Services 8,206 Capital Expenditures 3,997
Facilities 606 Total $244,837
Total $244,837
Source: 1997-98 YISD budget. Source: 1997-98 YISD budget.
Exhibit 7-20 Expenditures by Function
Exhibit 7-21 Expenditures by Object

Source: 1997-98 YISD budget. Source: 1997-98 YISD budget.
Grant budgets are approved by the granting agency and are not included in the district's official budget, nor are budgets for board designated funds approved by the board on a project-by-project basis. Some funds, such as proprietary funds and internal service funds are not required to be budgeted. These funds include some technology and adult education areas, and workers' compensation, health insurance, and speech therapy services. Budgets in these areas are prepared, however, on an annual basis for management purposes. FINDING Exhibit 7-14 through Exhibit 7-16 illustrate the intensive effort expended in developing YISD's annual budget. YISD produces an official budget document and a detailed budget instruction manual to assist school and department personnel in budget preparation. These documents are well-written, well-organized, and visually appealing. However, a reader must switch between the documents to obtain a clear understanding of budget assumptions, priorities, and trends. Moreover, the summary information included in the budget instruction document is limited. The official budget document meets minimum TEA requirements but could be more informative and descriptive. Budget documents are most effective when they can be used by both district staff and the community at large to understand the district's inner workings. The Government Finance Officers Association (GFOA) is a national organization that presents an annual Distinguished Budget Presentation Award to governmental entities. Many school districts across the country use the award criteria not only to apply for the award but to improve the content and format of their budget documents. Exhibit 7-22 provides a brief assessment of YISD's budget documents using the GFOA's evaluation criteria. To fully meet the GFOA Distinguished Budget Award criteria, all of these elements should be included in a single budget document.

Exhibit 7-22 Comparison of YISD Budget Documentation to GFOA Criteria
GFOA Criteria
Meets/Partially Meets/Does Not Meet
Budget Presentation/Documentation Weaknesses
Budget as an Operations Guide
Describe activities, services, or functions carried out by organizational units.
Does Not Meet
Does not provide narrative or a clear, consistent presentation of the assigned services, functions, and activities of organizational units.
Provide objective methods (quantitative and/or qualitative) of measuring results by unit or program. Information should be included for prior-year actual, current-year budget and/or estimate and budget year.
Meets
Include an organization cha rt or charts for the entire organization. Does Not Meet Budget documents do not include an
organizational chart of the district.
Budget as a Communication Device
Include schedule(s) or summary table(s) of personnel or position counts for prior, current, and budgeted years, including descriptions of significant changes in levels of staffing or reorganizations planned for the budget year.
Does Not Meet Documents contain no detail about the type and number of positions authorized in the budget.
Provide summary information, including an overview of significant budgetary issues, trends, and resource choices. Summary information should be presented within the budget document either in a separate section (e.g., executive summary) or integrated within the transmittal letter or other overview
Partially Meets
Some summary information is included in the budget instructions, but it is not sufficient to fully meet this criterion, the intent of which is to encourage presentations that allow the reader to quickly grasp the major budgetary issues, trends, and choices addressed in the budget.

sections.
GFOA Criteria Meets/Partially Meets/Does Not Meet
Budget Presentation/Documentation Weaknesses
Budget as a Policy Document
Explain the effect, if any, of other planning processes (e.g., strategic plans, long-range financial plans, capital- improvement plans) upon the budget and budget process.
Partially Meets
YISD includes a copy of its strategic goals and objectives in the budget instructions, but there is no explanation of their effect upon the budget and budget process.
Describe the process for preparing, reviewing and adopting the budget for the coming fiscal year. Describe the procedures for amending the budget after adoption. If a separate capital budget process is used, a description of the process and its relationship to the operating budget should be provided.
Meets
Use charts and graphs where appropriate to highlight financial and statistical information. Provide narrative interpretation when the messages conveyed by the graphs are not self-evident.
Does Not Meet Charts, graphs, and narrative interpretations are not used in YISD's budget document.
Provide narrative, tables, schedules, crosswalks, or matrices to show the relationship between different revenue and expenditure classifications (e.g., funds, programs, organizational units).
Does Not Meet Relationships between different revenue and expenditure classifications are not described.
Include a table of contents to make it easy to locate information in the document.
Meets
Include definitions for any terminology (including abbreviations and acronyms) that is not readily understood by a reasonably informed lay reader.
Does Not Meet No glossary of terminology, including abbreviations and acronyms, is included.
GFOA Criteria Meets/Partially Budget Presentation/Documentation

Meets/Does Not Meet
Weaknesses
Budget as a Policy Document
Include statistical and supplemental data that describe the organization and the community or population it serves and provide other pertinent background information related to the services provided.
Does Not Meet Information and data regarding the community and population are not presented in the documents.
Format budget document to enhance understanding and utility of the document to the lay reader. It should be attractive, consistent, and oriented to the reader's needs.
Partially Meets The document is formatted in a logical fashion, but a non-financial user might find it to be user- unfriendly.
Include a coherent statement of organization-wide financial and programmatic policies and goals that address long-term concerns and issues.
Meets
Describe the organization's short-term financial and operational policies that guide the development of the budget of the upcoming year.
Does Not Meet The policies that are guiding the development of the budget are not adequately presented.
Include a coherent statement of goals and objectives of organizational units (e.g., departments, division, offices, or programs).
Does Not Meet Contains no statements of the goals and objectives of individual organizational units.
Include a budget message that articulates priorities and issues for the budget for the new year. The message should describe significant changes in priorities from the current year and explain the factors that led to those changes. The message may take one of several forms (e.g., transmittal letter, budget summary section).
Does Not Meet Documents do not contain a budget message meeting this criterion. Changes in priorities are not identified or explained.
GFOA Criteria Meets/Partially Meets/Does Not
Budget Presentation/Documentation Weaknesses

Meet
Budget as a Financial Plan
Include and describe all funds that are subject to appropriation. Partially Meets Not all funds are adequately described.
Present a summary of major revenues and expenditures, as well as other financing sources and uses, to provide an overview of the total resources budgeted by the organization.
Meets
Include summaries of revenue and other resources and of expenditures for prior-year actual, current-year budget and/or estimated current-year actual and proposed budget year.
Meets
Describe major revenue sources, explain the underlying assumptions for the revenue estimates, and discuss significant revenue trends.
Partially Meets
Major revenue sources are identified, but underlying assumptions for revenue estimates and discussions of significant revenue trends are not adequately explained.
Include projected changes in fund balances, as defined in the document, for governmental funds included in the budget preparation, including all balances potentially available for appropriation.
Meets
Include a budgeted capital expenditures list and a list of major capital projects for the budget year, whether authorized in the operating budget or in a separate capital budget.
Meets
GFOA Criteria Meets/Partially Meets/Does Not Meet
Budget Presentation/Documentation Weaknesses
Budget as a Financial Plan
Describe if and to what extent capital improvements or other major capital spending will impact the
Does Not Meet The budget contains no explanation of the impact of capital spending on current and future operating budgets.

entity's current and future operating budget. The focus should be on reasonably quantifiable additional costs and savings (direct or indirect) or other impacts that result from capital spending.
Include financial data on current debt obligations, describe the relationship between current debt levels and legal debt limits, and explain the effects of existing debt levels on current and future operations.
Partially Meets
Financial data on current debt obligations is included, but the relationship between current debt levels and legal debt limits and the effects of existing debt levels on current and future operations are not explained.
Explain the basis of budgeting for all funds, whether GAAP, cash, modified accrual, or some other statutory basis.
Does Not Meet The basis of budgeting is not described.
Source: GFOA and TSPR assessment. Recommendation 73: Establish a budget document that serves as a policy document, a financial plan, an operations guide, and a communications device. All four major GFOA budget criteria should be addressed in a single budget document. Since so much information must be included in this document, it should be organized in a manner allowing the reader to understand its contents at a glance. YISD should continue to publish its budget instruction manual. It is detailed and well-presented, and contains useful information such as an overview of the budget process, a budget calendar, and instructions on budget amendments. Exhibit 7-23 presents a suggested outline for the district's main budget document.
Exhibit 7-23 YISD Suggested Budget Document Outline
1. Table of Contents
2. Superintendent's message
• Summary of trends, budgetary issues, and resource choices. • Summary of how organization-wide long-term goals and other planning affected the

development of the budget.
3. Major division priorities within the long-term plan
4. Budget year priority changes
• Major new issues and events for the budget year.
5. Overview
• El Paso community pertinent information. • YISD accomplishments. • Districtwide organizational chart.
6. Process and Calendar
• Approved budget. • Amended budget. • Calendar.
7. Planning
• Long-term. • Short-term.
8. Revenue
• Narrative including trends, issues, and assumptions, with supporting graphs and charts. • Summary of revenue sources including comparison years. • Detail of revenue sources including comparison years.
9. Expenditures
• Narrative including trends, issues, and assumptions, with supporting graphs and charts. • Summary of expenditures by expenditure category, including comparison years. • Detail of expenditures and staffing by organizational unit, including comparison years. • Unit organization chart. • Description of unit functions. • Goals and objectives. • Staffing and campus allocation models for instructional units).

10. Funds (i.e., operating, construction, debt service)
• Description of funds and their uses. • Basis of accounting (GAAP, cash, modified accrual or other). • Budgeted change in fund statement.
11. Glossary
• Terminology. • Abbreviations and Acronyms.
Source: Empirical Management Services. IMPLEMENTATION STRATEGIES AND TIMELINE
1. The chief finance officer directs the director of Budget and Planning to establish an alternative budget format.
May 1998
2. The director of Budget and Planning engages the district in the GFOA budget award evaluation process to gain support and technical assistance in establishing an improved budget format.
May 1998
3. The director of Budget and Planning continues to obtain regular input from community and school-based organizations to ensure that revised budget documents are more useful to community members.
June - December 1998 Ongoing
FISCAL IMPACT This recommendation can be implemented with existing resources. FINDING The director of Budget and Planning told TSPR that the district's budget and business clerks would benefit from a district certification program allowing them to become certified in district policies and procedures in areas such as:
• Budget Development.
• Purchasing.
• Accounts Payable.

• Travel Policy.
• Fixed Asset Accounting.
• Warehouse Procedures.
• Cash Management.
• Work Orders.
• Computers and Technology.
A certification program would ensure that financial clerks understand district financial policies and procedures, thereby becoming more effective in their responsibilities. Exhibit 7-24 presents verbatim responses received in the review team's survey of YISD central administrators.
Exhibit 7-24 Verbatim Responses from Central Administrator Survey
What suggestions do you have for improving the efficiency and effectiveness of financial management at YISD?
• "Site-based management implies administrators who might not come from a budget background being placed in difficult situations by financial people...."
• "Have each department have a true financial administrator, not a converted teacher or principal."
• "Business office should be more customer driven."
Source: central administrator survey. The Texas Association of School Business Officials (TASBO) offers professional certification programs for Texas school business administrators, officials, and specialists. Three tiers of certification are offered. Many of the district's budget and business clerks already qualify to apply for the lowest tier, which would yield certification as a Certified Texas School Business

Specialist. The requirements for this level of certification include certain education, school business experience, and application requirements, including TABSO membership. Successful applicants have two years to complete the program, after which they remain certified for one or more three-year periods. Budget and business clerks would learn about cooperative purchasing opportunities and agreements, purchasing law, financial planning and budgeting, financial and payroll accounting, and other related business topics. To renew their certification, recipients must meet continuing education requirements established by TASBO's Board of Directors. Recommendation 74: Provide incentives for budget and business clerks to achieve certification as Certified Texas School Business Specialists. Incentives include district contributions towards the cost of certification, additional vacation days for each course requirement completed, and/or salary increases upon certification. IMPLEMENTATION STRATEGIES AND TIMELINE
1. The CFO directs the director of Budget and Planning to develop incentives for budget and business clerks to apply with TASBO to become Certified Texas School Business Specialists.
May-July 1998
2. The TASBO certification program is described to business and budget clerks, along with the incentives available to employees who successfully complete the program.
August 1998
FISCAL IMPACT Assuming the district contributes $100 towards the certification of each employee per year, provides a salary increase of $1,000 upon completion of the two-year certification program, and two clerks begin the program each year, the program's cost would be $200 in the first year and $400 in the second year plus an additional $2,400 in year three, $4,400 in year four and $6,400 in year five for program costs and salary increases.

Recommendation 1998-99
1999-2000 2000-01 2001-02 2001-03
Provide incentives for budget and business clerks to achieve certification. ($200) ($400) ($2,400) ($4,400) ($6,400)
FINDING During 1996-97, a five-year District Improvement Plan was developed by a task force of students, parents, faculty, district central office staff, and community members. This plan is one of several improvement plans the district has developed in recent years. The plan promotes five areas designed to increase student achievement (Exhibit 7-25).
Exhibit 7-25 District Improvement Plan Goals
FOCUS AREA GOALS
Curriculum and Instruction
• Implement a standards-based curriculum that produces high levels of student performance.
• Establish project-based learning by using a diversity of instructional settings and technology to promote student-centered educational experiences.
Human Resource Development
• Implement a comprehensive professional development program for developing and sustaining an enriched learning environment.
• Build and maintain a quality workforce.
Community Engagement
• Ensure meaningful school community engagement through comprehensive communications emphasizing shared responsibility to increase student success.

Resource Management (Technology Use)
• Maximize student success by providing an environment conducive to learning, institutionalizing student support systems, and integrating technology into the learning process.
Organizational Dynamics
• Sustain and enhance organizational philosophy/structure to improve student achievement.
Source: YISD District Improvement Plan. Each goal in the improvement plan is supported by specific objectives. However, there are neither time lines, nor measurable outcomes to determine the extent to which these goals have been achieved. While the annual budget may have been prepared with these long-term goals in mind, the district has not explicitly linked the two. Recommendation 75: Link the budget to specific goals and objectives of the district. The dollar amounts budgeted for specific goals and objectives in the District Improvement Plan should be identified. For example, an increase in teachers' salaries might be tied to the district's goal to improve student achievement through institutionalizing student support systems. Exhibit 7-26 uses one goal and three specific objectives from the district's improvement plan to illustrate how budget priorities and plan elements might be linked.
Exhibit 7-26 General Fund Budget by Strategic Priorities
Implement a standards-based curriculum, as represented in instructional practices and student

assessments, which produces high levels of student performance.
Specific Goals Budget Commitment
Percentage of Budget
1. Increase the number of students per campus receiving academic recognition by 5 percent.
$1,480,000 0.5%
2. Complete the implementation of a pre-K program for all four-year-olds by 1999. $1,000,000 0.4%
3. Realize 25 percent annual reductions of previous failure rates for each campus. $5,000,000 2%
Source: District Improvement Plan and Empirical Management Services. IMPLEMENTATION STRATEGIES AND TIMELINE
1. The CFO instructs the budget director to develop a methodology for establishing specific goals and budget amounts for the District Improvement Plan. July 1998
2. The CFO reviews and approves the methodology developed by the budget director. August 1998
3. The methodology is communicated to school budget administrators through hands-on training.
September -December 1998
4. The methodology is implemented during budget preparation. January 1999
5. The CFO applies the methodology to the comprehensive strategic plan developed by the district. July 1999
FISCAL IMPACT This recommendation can be implemented with existing resources. FINDING

State law stipulates that school districts cannot overspend their overall budgets in any functional area without the board's prior approval of a budget amendment. Although the district was under budget in each budget function for fiscal 1997, some departments and schools within the district occasionally overspent their budgets. One school overspent its 1995-96 budget by approximately $376,000, or 25 percent, and its 1996-97 budget by approximately $241,000, or 17 percent. The district holds principals and department heads accountable for their own budgets and, consequently, took appropriate disciplinary action. However, Budget and Planning is not charged with tracking or correcting over-expenditures by schools or departments on a monthly basis. The district's annual variance report, which shows variances for every department in the district, is prepared and reviewed by central office only once a year. Exhibit 7-27 presents General Fund variances for 1994-95 through 1996-97 for schools and departments that overspent their budgets.
Exhibit 7-27 General Fund Budget Variances
Percentage of Departments over Budget 1994-95 through 1996-97
Department 1994-95 1995-96 1996-97
Schools 51% 48% 25%
Departments 25% 20% 20%
Total Departments 41% 38% 23%
Amount of Overages ($861,596) ($931,756) ($766,405)
Percent of Total Budget 0.38% 0.40% 0.36%
Source: 1994-1997 budget variance reports and Empirical Management Services. Although the finance system has a lockout feature that prevents encumberances for functions that are already overbudget, district personnel have chosen to deactivate this feature. Therefore, even though the district has a serviceable budget amendment process in place, which allows schools and departments to request board approval to change spending limits as needed during the year, they can overspend even without a budget amendment. Appropriation control is an important

feature because it forces schools and departments to obtain budget amendments for overspent functions. Recommendation 76: Reactivate the appropriation control feature on the finance system and perform a monthly variation analysis to prevent overspending. The district should activate the lockout feature of the finance system to prevent school and department expenditures for functions that are already over budget. Budgeting and Planning should perform a monthly variation analysis for all schools and departments to verify that budgets approved by the board are not over-expended without an approved budget amendment. Once all departments and schools spend within approved limits and appropriately seek budget amendments, the annual variance reports should be sufficient to ensure compliance. IMPLEMENTATION STRATEGIES AND TIMELINE
1. The superintendent directs the CFO to reactivate the appropriation control feature and establish a monthly budget variance report.
August 1998
2. The budget director produces the variance reports and ensures that the finance system prevents schools and departments from overspending approved budget amounts.
September 1998
3. Budget department personnel review the reports to verify that unauthorized expenditures do not continue.
September 1998 Ongoing
FISCAL IMPACT This recommendation can be implemented with existing resources.

Chapter 7 FINANCIAL MANAGEMENT D. Payroll
CURRENT SITUATION The payroll coordinator is responsible for the district's payroll and reports to the comptroller. The coordinator and eight full-time and two part-time employees produce the district's biweekly and monthly payroll. The Payroll Department is responsible for paying employees accurately and on time and for tracking reductions in employee pay for payroll taxes, employee benefits, and court-ordered deductions. During 1996-97, the Payroll Department produced an average of about 9,200 checks a month for YISD's employees. FINDING The Payroll Department keeps volume statistics on a monthly basis. Once a year, the payroll coordinator prepares volume and workload analysis statistics for each position in the Payroll Department. The results are used to evenly distribute workloads and justify positions in the department. Exhibit 7-28 summarizes volume data for 1995-96 and 1996-97. Exhibits 7-29 and Exhibit 7-30 summarize workload performance measures used for 1996-97.
Exhibit 7-28 Payroll Volume Data
1995-96 through 1996-97
*Biweekly Payroll Monthly Payroll
Year Average No. of Employees
Average Payroll Dollars
Average No. of Employees
Average Payroll Dollars
1995-96 2,101 $892,230 4,294 $11,182,438
1996-97 2,144 $1,037,302 4,332 $11,560,848
Source: YISD Payroll Department. * Biweekly averages include summer pay totals.
Exhibit 7-29 Workload Estimates for Biweekly Payroll
1996-97

Function Average No. per Processing Period
Hours Required
Time Cards 3680 92
Extra Duty Reports 50 .83
Absent Duty Reports (ADRs) 523 21
New Employees 113 7
Employee Changes 67 4
Employee Resignation 35 2
Total Hours Required 126.83
Hours Available per processing period (6 days x 7.75 hrs a day) 46.5
Estimated Staff Required 2.73
Actual Biweekly Staff 3.0
Source: YISD Payroll Department.
Exhibit 7-30 Workload Estimates for Monthly Payroll
1996-97
Function Average No. per Processing Period
Hours Required
ADRs 6383 372
Supplemental 26 1.3
Misc. (Chap 13, Student Loans, Tax Levies) 7.5
Annuities 63 27.5
Child Support 105 7
Change Forms 20 16
Professional Dues 2016 2
Extra Duty Pay 2525 21
Term\Retire 15 6.75
New Employees 33 16.25

Total Hours Required 477.3
Hours Available per processing period (15 days x 7.75 hrs a day)
116.25
Estimated Staff Required 4.1
Actual monthly-weekly Staff (Includes one receptionist/mail clerk)
5
Source: YISD Payroll Department COMMENDATION YISD has developed and effectively uses payroll volume and workload statistics to monitor and balance workloads in the Payroll Department. FINDING As Exhibit 7-29 and Exhibit 7-30 show, much payroll processing time is devoted to paper-driven and manually intensive procedures such as handling Absent Duty Reports and timecards. The system, designed by Information Design Inc. (IDI), was leased in 1993 and was to be replaced by the payroll module of the automated finance system that was purchased in 1994. However, as mentioned earlier in this chapter and in the Computer and Technology chapter of this report, the district has experienced difficulty in fully implementing the automated finance system. The payroll module has not been implemented because of various conversion and compatibility problems. The payroll coordinator said that IDI has released several updates to their software since 1993, and the district receives free updates as part of its annual support agreement. These free updates represent enhancements that would improve payroll processing. However, the district has not installed these updates, even though it would be beneficial prior to the implementation of the payroll module. The IDI updates offer improved means of entering time and attendance information. Moreover, the use of a scanner to scan payroll documents into the computer system would ease manual processing loads and would be fairly easy to implement with system enhancements. Exhibit 7-31 through Exhibit 7-33 show that YISD's Payroll Department produces fewer paychecks per payroll employee and serves fewer employees per payroll employee than do most of the peer districts. This indicates possible overstaffing, perhaps as a result of system inefficiencies.
Exhibit 7-31 Pay Checks Produced and Employees Served per Payroll Employee

YISD Versus Peer Districts 1996-97
Per Payroll Employee
District Average Page Checks Per Month
District Employees
Payroll Staff
Payroll Checks
District Employees
Houston ISD 54,000 20,741 24 2,250 864
San Antonio ISD 16,887 6,859 8 2,111 837
El Paso 12,450 7,378 6 2,075 1,230
Corpus Christi ISD 12,000 4,471 6 2,000 745
Socorro ISD 5,400 2,353 3 1,800 784
Ysleta ISD 9,200 5,172 8 1,150 647
Fort Worth ISD 11,200 7,818 13 862 601
Average Without YISD 1,850 844
Source: AEIS, YISD Payroll Department, and peer district surveys.
Exhibit 7-32 Pay Checks Produced per Payroll Employee YISD versus Peer Districts 1996-97
Source: YISD Payroll Department and peer district surveys.
Exhibit 7-33 District Employees Served Per Payroll Employee

1996-97
Source: YISD Payroll Department and peer district surveys.
Recommendation 77: Install IDI upgrades to improve payroll operations. Payroll personnel should install IDI upgrade features to improve the district's payroll processing. The enhanced version of the payroll and personnel modules should provide short-term improvements while the district evaluates whether to fully implement or replace the automated finance system. IMPLEMENTATION STRATEGIES AND TIMELINE
1. The comptroller and payroll coordinator install IDI enhancements to improve the efficiency and effectiveness of payroll and personnel processing.
August 1998
2. The comptroller and payroll coordinator make changes in Payroll Department procedures and inform staff of software enhancements.
September 1998 Ongoing
FISCAL IMPACT System improvements in the payroll and personnel areas could lead to greater efficiency and possible staff reductions. FINDING The Payroll Department does not have an employee handbook to inform district

employees about payroll policies and various topics such as problem resolution, sick leave accrual, salary computations, and paperwork submission deadlines. A handbook would reduce the number of calls, complaints, and visits the department receives from employees who are not familiar with district payroll policies. Recommendation 78: Write and distribute an employee payroll handbook. IMPLEMENTATION STRATEGIES AND TIMELINE
1. The CFO directs the comptroller and payroll coordinator to produce an employee payroll handbook. June 1998
2. The comptroller and payroll coordinator compile the payroll department's policies and practices into a payroll handbook.
June-August 1998
3. The CFO reviews and approves the draft. August 1998
4. The CFO produces and distributes the handbook to district employees and issues updates and modifications as necessary.
September 1998 Ongoing
FISCAL IMPACT This recommendation can be implemented with existing resources. FINDING The Payroll Department does not have disaster recovery procedures or emergency backup plans. For example, it has no back-up plan to ensure that the payroll is produced on time if the computer system experiences significant downtime. Massive staff power and overtime would be required to manually prepare up to 2,100 biweekly and 4,300 monthly checks. The Payroll Department has, on average, nine days to process biweekly payrolls, and 15 days to process monthly payrolls. Exhibit 7-34 and Exhibit 7-35 show the Payroll Department's processing time for a typical month (November 1997).
Exhibit 7-34 Payroll Processing Timeline
Biweekly Payroll November 1997
Day Activity Time
10/27-10/31 Process Biweekly Payroll 5 days

11/1-2 Week End
11/3 Biweekly edit 1 day
11/4 Biweekly final 1 day
11/5 ACH Biweekly tape due to bank 1 day
11/6 Print, verify, sort, distribute checks 1 day
11/7 PAYDAY
Total Days 9
Source: YISD Payroll Department.
Exhibit 7-35 Payroll Processing Timeline
Monthly Payroll November 1997
Day Activity Time
11/1-2 Weekend
11/3-7 Processing 5 days
11/8-9 Weekend
11/10-14 Processing 5 days
11/15-16 Weekend
11/17-19 Processing 1 day
11/20 Monthly edit 1 day
11/21 Monthly final 1 day
11/22-23 Weekend
11/24 ACH Tape due to bank 1 day
11/25 Print, verify, sort, distribute checks 1 day
11/26 PAYDAY
Total Days 15
Source: YISD Payroll Department. The district's payroll system resides on an HP 947 computer. On Monday, October 27, 1997, while the review team was in the district, the HP 947 experienced problems with its disk drives and was down for three-and-a-half days. The problem began when the

district's Uninterruptible Power Supply malfunctioned. While the malfunction was being investigated, voltage spikes occurred in several circuits, leading to failure of other electrical components in the district's hardware infrastructure. The MIS Department believes these electrical problems contributed to failure of the HP 947 disk drives. The problems were resolved and the systems achieved full recovery on Thursday afternoon, October 30. The Payroll Department had just met a biweekly payroll on Friday, October 24 and was due to pay the monthly payroll on Friday, October 31. The October 31 payroll was not seriously affected because most of the crucial processing had already been done. If the problem had occurred a week earlier, though, both the biweekly and monthly payrolls might have been adversely affected. Recommendation 79: Develop formal backup and disaster recovery procedures for the Payroll Department. IMPLEMENTATION STRATEGIES AND TIMELINE
1. The CFO directs the comptroller and payroll coordinator to assess the risk of payroll processing disasters and develop procedures to mitigate the risk.
June 1998
2. The comptroller and payroll coordinator develop and document disaster recovery procedures in conjunction with the MIS Department.
August 1998
3. Department personnel are made aware of the emergency procedures and are provided the necessary training to implement them.
September 1998
FISCAL IMPACT This recommendation can be implemented with existing resources. FINDING For each pay period, the Payroll Department produces a computer tape for direct deposit payroll. This tape is hand-carried to the bank for processing. When carried by hand, the tape could become corrupted, damaged, or misplaced. Transmitting the data electronically through an automated clearinghouse (ACH) would be safer and more efficient. ACH services are provided by the district's bank. Recommendation 80: Electronically transfer direct deposit payroll data directly to the bank.

The district should make any necessary modifications to the automated system to enable ACH transfers to take place. IMPLEMENTATION STRATEGIES AND TIMELINE
1. The CFO, in conjunction with the comptroller and MIS Department, determines the technical requirements for transmitting payroll data directly to the bank.
June 1998
2. The CFO and comptroller consider the feasibility and cost-effectiveness of the procedure, given the technical requirements.
July-August 1998
3. The procedure is implemented. September 1998
FISCAL IMPACT This recommendation can be implemented with existing resources.

Chapter 7 FINANCIAL MANAGEMENT E. Internal and External Auditing Internal auditors provide managers and trustees with competent evaluations of an organization's systems of internal control. Such evaluations assess the quality of performance of assigned responsibilities, the reliability and integrity of information, compliance with laws and regulations, the safeguarding of assets, the economical and efficient use of resources, and the accomplishment of organizational goals and objectives. CURRENT SITUATION During 1994-95, the district eliminated its internal audit function. The internal auditor reported directly to the superintendent and was eliminated because of concerns about cost and quality. The audits that the internal auditor performed focused primarily on school and student activity funds and special projects requested by the superintendent. In late 1995, a certified public accounting firm was engaged by the district to perform a broad range of audits and reviews. The firm reported administrative ly to the chief finance officer. Areas examined by the firm included the district's tax-sheltered annuity plan and elective deferral limitations; district cash management policies and procedures; the district Construction Department; and district travel policies and procedures. In the 1996-97 school year, the district terminated its contract with the external CPA firm because the superintendent felt the function should be performed internally. In November 1997, one internal auditor position was included in the district's budget, although no one had been hired to fill this position at the time of the review. FINDING Although YISD has budgeted one internal auditor position, it has not established a board-approved internal audit charter, which would provide the functional and organizational framework for internal auditing operations. The Institute of Internal Auditors has developed a sample charter that describes the purpose, authority, responsibility, and reporting relationships of internal auditors. A charter, which is reviewed by the board, provides the internal auditors broad, unrestricted access to every facet of the district's infrastructure. Past TSPR reviews have recommended an internal audit function for districts with enrollments of 20,000 students or more. It is unusual for a district with a student enrollment of more than 47,000 students, an operating budget of $245 million, and total assets of more than $452 million, not to have an internal audit department. Exhibit 7-36 presents peer district internal audit staffing.
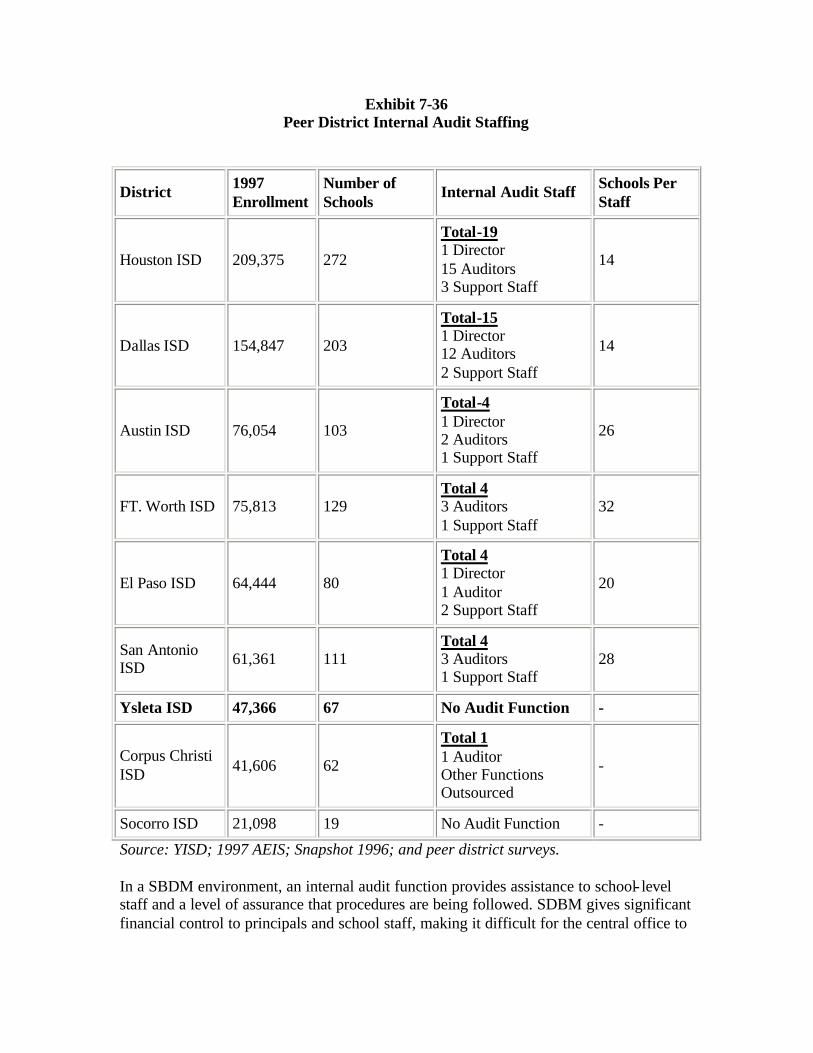
Exhibit 7-36 Peer District Internal Audit Staffing
District 1997 Enrollment
Number of Schools
Internal Audit Staff Schools Per Staff
Houston ISD 209,375 272
Total-19 1 Director 15 Auditors 3 Support Staff
14
Dallas ISD 154,847 203
Total-15 1 Director 12 Auditors 2 Support Staff
14
Austin ISD 76,054 103
Total-4 1 Director 2 Auditors 1 Support Staff
26
FT. Worth ISD 75,813 129 Total 4 3 Auditors 1 Support Staff
32
El Paso ISD 64,444 80
Total 4 1 Director 1 Auditor 2 Support Staff
20
San Antonio ISD 61,361 111
Total 4 3 Auditors 1 Support Staff
28
Ysleta ISD 47,366 67 No Audit Function -
Corpus Christi ISD 41,606 62
Total 1 1 Auditor Other Functions Outsourced
-
Socorro ISD 21,098 19 No Audit Function -
Source: YISD; 1997 AEIS; Snapshot 1996; and peer district surveys. In a SBDM environment, an internal audit function provides assistance to school- level staff and a level of assurance that procedures are being followed. SDBM gives significant financial control to principals and school staff, making it difficult for the central office to
monitor. This issue was raised by the district's independent auditors during the 1996 audit. In their management letter to the board, the auditors stated that:
"Due to financial constraints and concerns about quality, the District closed its internal audit department during the 1994-95 fiscal year and selected an external certified public accounting firm to perform selected audits and reviews of certain procedures. The continuing implementation of the new financial accounting software should provide additional controls that previously were not available. However, the adoption of site-based management has resulted in distributing more responsibilities to the campuses (i.e., preparation of purchase orders, acknowledging receipt of goods, etc.). With more of these procedures moving away from the central office, it is important the District maintain an ongoing program that will review and update all accounting related procedures.
The District should appoint an audit committee made up of various members of management. This committee should document the goals of the overall audit strategy and process, including the independent audit. After documenting the goals, a plan should be adopted and implemented to achieve these goals. In formulating the plan the committee should consider the need for employee training, as well as an ongoing review of existing procedures. The committee, and any related staff, should serve as more than an enforcement function in that they should be responsible for recommending and implementing procedures for the improvement of the overall internal control structure of the District." Recommendation 81: Establish an Internal Audit Department that reports directly to the board's finance committee. Based on the examples of other districts, the district should maintain an internal audit staff of at least two auditors plus one support staff. This department should be staffed with a director, one professional internal auditor, and a support staff person, all of whom should adhere to the Standards for the Professional Practice of Internal Auditing and the Code of Ethics developed by the Institute of Internal Aud itors. YISD's internal auditors should seek the Institute's Certified Internal Auditing designation. The audit department should develop an audit plan to be approved by the board's finance committee. Audit results should be reported directly to the finance committee. IMPLEMENTATION STRATEGIES AND TIMELINE
1. The CFO develops job descriptions for internal auditors and support June 1998

staff.
2. The board's finance committee approves the job descriptions. July 1998
3. After auditors and support staff are hired, they develop a mission statement, an internal charter, audit plan, and audit procedures. August 1998
4. The finance committee approves the Internal Audit Department's mission statement, internal charter, and audit plan.
September 1998
5. The Internal Audit Department prepares and submits internal audit reports to the board's finance committee.
September 1998 Ongoing
FISCAL IMPACT The estimated fiscal impact to create and maintain an internal audit function is presented in Exhibit 7-37.
Exhibit 7-37 Estimated Internal Audit Department Costs
Position Initial Costs ContinuingCosts
One Internal Audit director (base salary of $60,000 plus 24 percent benefits) $74,400 $74,400
One additional internal auditor already budgeted already budgeted
One support staff (salary of $22,000 plus 24 percent benefits) $27,300 $27,300
Professional library (audit guides, professional standards, textbooks, periodicals, audit supplies)
$3,000 $1,200
Continuing education (40 hrs per auditor per year @ $20 per hour)
$0 $2,400
Annual conferences (one per year @ $2,000 per person) $0 $6,000
Computers and equipment ($5,000 per person, initial cost) $15,000 $3,000
Total Estimated Cost $119,700 $114,300
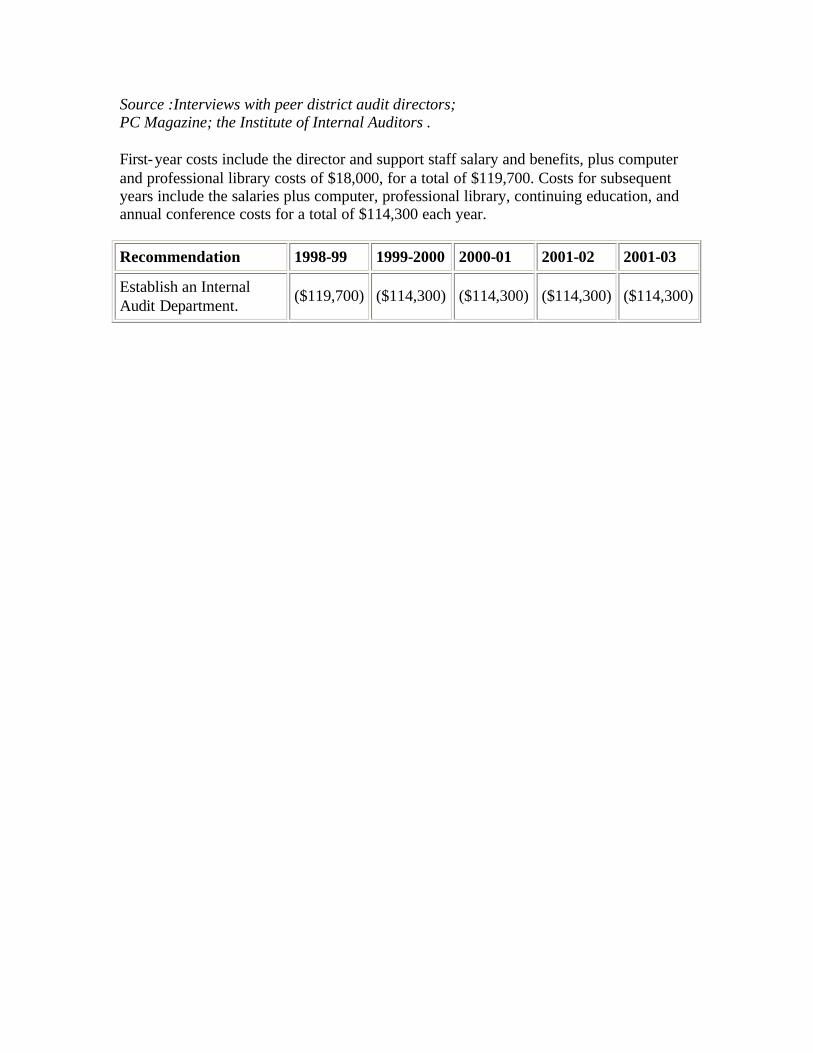
Source :Interviews with peer district audit directors; PC Magazine; the Institute of Internal Auditors . First-year costs include the director and support staff salary and benefits, plus computer and professional library costs of $18,000, for a total of $119,700. Costs for subsequent years include the salaries plus computer, professional library, continuing education, and annual conference costs for a total of $114,300 each year.
Recommendation 1998-99 1999-2000 2000-01 2001-02 2001-03
Establish an Internal Audit Department.
($119,700) ($114,300) ($114,300) ($114,300) ($114,300)

Chapter 8 PURCHASING AND WAREHOUSE SERVICES This chapter reviews YISD's purchasing and warehousing functions in three sections:
A. Purchasing
B. Warehouse Services
C. Textbooks
Purchasing functions within a school district should ensure that supplies, equipment, and services are purchased from the right source, in the right quantity, at the lowest price, and in accordance with Texas purchasing guidelines. These criteria should be met for each purchase without sacrificing quality and timeliness. Warehousing operations include the receipt, storage, and distribution of a wide variety of goods, including school supplies, textbooks, and vehicle parts.

Chapter 8 PURCHASING AND WAREHOUSE SERVICES
A. Purchasing In 1995, the Texas Education Code (TEC) was revised to include changes in state purchasing regulations designed to provide the best value to school districts through a competitive bidding process. Generally, when districts purchase items valued at $25,000 or more (or multiple like items with a cumulative value of more than $25,000 in a twelve month period), one of the following competitive bid processes must be followed:
• competitive sealed proposals: vendors submit a written bid, and all submitted bids are publicly opened to ensure fairness in the bidding process.
• requests for proposals: vendors submit a written bid, and all submitted bids are opened as they come in.
• purchased from the state catalogue: vendors that have completed competitive bid requirements at the state level and can sell products directly to districts.
• procured through an interlocal contract: board-approved agreements with a local entity that allows the district to purchase specific items from that entity's bid.
• through a design/build contract: vendor has been selected for a competitive bid to complete an entire project; it is the vendor's responsibility to obtain merchandise for the project.
Districts must advertise bids worth more than $25,000 at least once a week for two weeks in any newspaper published in the county in which the district is located. Those between $10,000 and $25,000 must be advertised in two successive issues of any newspaper in the district's county. TEC requires advertisements to specify the categories of property to be purchased and to solicit vendors that are interested in supplying them. Vendors can submit their names to the district and be placed on a potential vendor list when they want to supply the district with their merchandise or services so that they will receive notice of bids when they are issued or be considered for small dollar contracts. Generally, purchases must be made from the lowest responsive bidder. Exceptions to competitive bidding requirements include contracts for professional services rendered, including architect fees, attorney fees, and fees for fiscal agents. TEC also allows a district to purchase items that are available from only one source ("sole-source" purchases) if certain criteria are met, including:

• an item for which competition is precluded because of the existence of a patent, copyright, secret process, or monopoly.
• a film, manuscript, or book. • a utility service including electricity, gas, or water. • a captive replacement part or component for equipment (those that are specific to a particular
piece of equipment and are not available from more than one vendor).
CURRENT SITUATION YISD's Purchasing Department is responsible for purchasing all materials, supplies, equipment, and services for the district and for upholding the overall integrity of the district's competitive bidding process. The Purchasing Department is overseen by the chief finance officer (CFO) and managed on a day-to-day basis by a contracting officer who reports directly to the CFO. The Purchasing Department has 13 full-time-equivalent positions (FTEs) including the contracting officer (Exhibit 8-1).
Exhibit 8-1 YISD Purchasing Department
Organizational Structure
Source: YISD Purchasing Department.
The Purchasing Department also employs four part-time work-study students not reflected in the organizational chart. These students perform clerical duties and provide assistance in processing competitive bids. Exhibit 8-2 summarizes the Purchasing Department's operating budget.
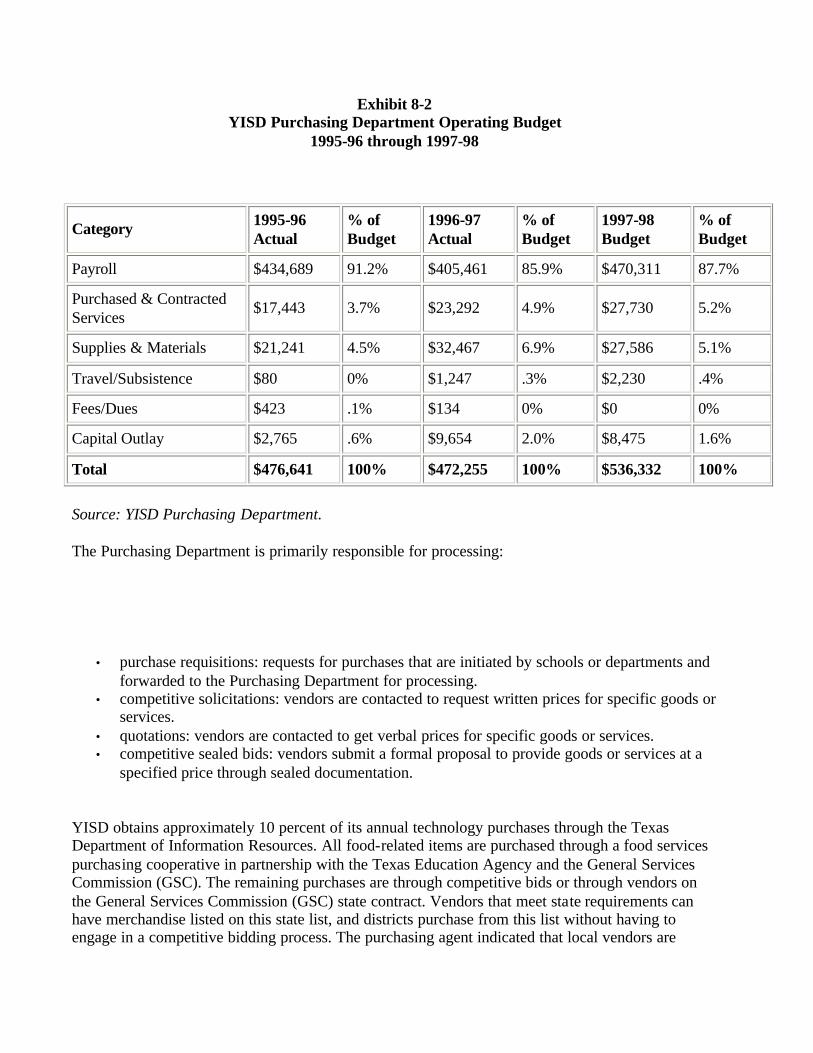
Exhibit 8-2 YISD Purchasing Department Operating Budget
1995-96 through 1997-98
Category 1995-96 Actual
% of Budget
1996-97 Actual
% of Budget
1997-98 Budget
% of Budget
Payroll $434,689 91.2% $405,461 85.9% $470,311 87.7%
Purchased & Contracted Services
$17,443 3.7% $23,292 4.9% $27,730 5.2%
Supplies & Materials $21,241 4.5% $32,467 6.9% $27,586 5.1%
Travel/Subsistence $80 0% $1,247 .3% $2,230 .4%
Fees/Dues $423 .1% $134 0% $0 0%
Capital Outlay $2,765 .6% $9,654 2.0% $8,475 1.6%
Total $476,641 100% $472,255 100% $536,332 100%
Source: YISD Purchasing Department. The Purchasing Department is primarily responsible for processing:
• purchase requisitions: requests for purchases that are initiated by schools or departments and forwarded to the Purchasing Department for processing.
• competitive solicitations: vendors are contacted to request written prices for specific goods or services.
• quotations: vendors are contacted to get verbal prices for specific goods or services. • competitive sealed bids: vendors submit a formal proposal to provide goods or services at a
specified price through sealed documentation.
YISD obtains approximately 10 percent of its annual technology purchases through the Texas Department of Information Resources. All food-related items are purchased through a food services purchasing cooperative in partnership with the Texas Education Agency and the General Services Commission (GSC). The remaining purchases are through competitive bids or through vendors on the General Services Commission (GSC) state contract. Vendors that meet state requirements can have merchandise listed on this state list, and districts purchase from this list without having to engage in a competitive bidding process. The purchasing agent indicated that local vendors are

encouraged to become GSC approved if they are not already. According to the Region XIX cooperative purchasing manager, YISD does not participate in their cooperative purchasing program. However, the district purchases from previously approved lists such as those prepared by the GSC. After a purchase requisition is processed and approved by the Purchasing Department, it becomes a purchase order. Blanket purchase orders, also called open purchase orders, allow approved employees to purchase items from a vendor up to an established dollar limit. The requisition code is an internal code identifying the type of purchase order being processed. Exhibit 8-3 summarizes the types of purchase orders that YISD processes.
Exhibit 8-3 Types of Purchase Orders Processed
Purchase Requisition Code (As entered on Purchasing System) Code Description Approval Route
OT - Technology Purchase
Requisition for technology purchased through the Local Technology Fund.
Initiated at the school/department; approved on-line by the principal or department head; approved on-line by the chief financial officer; approved on-line by the Purchasing Department.
OR - Regular Purchase
Requisition for purchases made with school or departmental budgeted funds.
Initiated at the school/department; approved on-line by the principal or department head; approved on-line by the Purchasing Department.
OS - Warehouse Purchase Requisition for a warehouse inventory item.
Initiated at the school/department; approved on-line by the principal or department head;

routed to warehouse for delivery of items.
OB - Blanket Purchase Order
Requisition is for a blanket purchase order or open purchase order. The purchase order allows items to be purchased over a specific time period up to a certain dollar amount.
Initiated at the school/department; approved on-line by the principal or department head; approved on-line by the Purchasing Department.
Source: YISD School Purchasing Guide; J.D. Edwards Purchase Order Module: Introduction. YISD's financial management software, contains a purchasing module that allows the district to enter purchase requisitions electronically at school and department sites. The system can determine availability of funds by budget code and provide for on- line approvals. All schools and departments process requisitions and purchase orders through the automated system. Exhibit 8-4 presents the number of purchase orders issued during the past three fiscal years.
Exhibit 8-4 YISD Number of Purchase Orders Issued
1995-96 through 1997-98
Fiscal Year Total Purchase Orders
1995-96 26,542
1996-97 26,554
1997-98* 6,987
Total 60,083
Source: YISD Purchasing Department. * 9/1/97 - 11/1/97.

FINDING TSPR conducted written surveys as a part of its review. A total of 1,036 responses were received from central office administrators, principals and assistant principals, teachers, and students. A majority of students and teachers found the availability of books, supplies and classroom materials lacking based on their grades of "C", "D", or "F" on related questions although the ratings by principals and assistant principals were higher in this area (Exhibit 8-5).
Exhibit 8-5 Survey Grading
YISD Purchasing Function
How would you grade the availability of the supplies, materials, equipment and textbooks you need to support instruction at YISD?
Respondent Group A B C D F NR
Teachers 17% 32% 22% 19% 9% 1%
What grade would you give the requisition process in obtaining needed materials?
Respondent Group A B C D F NR
Teachers 7% 20% 27% 26% 18% 2%
How many times do you have to follow-up with the principal or school clerk on ordering supplies you have requested before those supplies are received?
Respondent Group 0 1 to 2 3 to 5 6 to 8 9 or More NR
Teachers 17% 40% 28% 8% 5% 2%
What grade would you give to YISD overall in terms of obtaining the needed supplies and the methods used?
Respondent Group A B C D F NR
Teachers 8% 30% 31% 21% 10% 0%

Do you have sufficient books, lab supplies, and classroom materials?
Respondent Group SA A N D SD DK
Students 12% 35% 15% 19% 15% 4%
The necessary supplies and materials are made available to support instruction.
Respondent Group Strongly Agree Strongly Disagree
1 2 3 4 5 NR Total
Principals and Assistant Principals 40% 42% 11% 5% 0% 2% 100%
Source: TSPR survey results. While not all of the responses in the above exhibit can be attributed solely to decisions made by the Purchasing Department, the survey results indicate that, especially for teachers, there is a belief that improvements are needed in the way they obtain supplies. YISD does not formally evaluate products that are purchased to be sure that they meet the needs of the schools and departments. Nor are products generally evaluated prior to issuing bids. When custodians expressed frustration about products being inferior, or simply not being right for the job, a survey was developed in early in 1997 to determine their satisfaction with the quality of products received. Bid specifications were changed if the survey results indicated a product satisfaction level of less than 95 percent. YISD's custodian survey was the first of its type to determine user satisfaction of Purchasing

operations. Other districts use surveys to determine satisfaction levels for staff in all schools and departments in such areas as availability of quality merchandise, ease of purchase voucher processing, quickness, and customer service in the purchase process. Recommendation 82: Conduct annual user satisfaction surveys to determine the effectiveness of services provided and solicit suggestions for improvements. The Purchasing Department should develop a survey instrument to measure the level of customer satisfaction in all areas of Purchasing operations. The results of these annual surveys should be used as a guideline for change so that its processes will become more customer-friendly. All products, services, and vendors should be evaluated and the results published so that future purchases better meet the needs of all schools and departments. IMPLEMENTATION STRATEGIES AND TIMELINE
1. The superintendent directs the contracting officer to conduct annual user satisfaction surveys.
June 1998
2. The contracting officer develops the surveys and presents them to the chief finance officer for review and approval.
July 1998
3. The contracting officer distributes, collects, and analyzes the user satisfaction surveys annually.
September - November Annually
4. The Purchasing Department staff meet to review the survey results, publish preferred vendor, service, and product lists, and modify procedures based upon survey responses.
Annually
FISCAL IMPACT This recommendation can be implemented with existing resources. FINDING An effective purchase order system is user- friendly, produces a variety of management reports,

tracks purchases by commodity and vendor, and can completely automate the bid process. Such automated systems enhance accountability and process purchase orders more quickly and with fewer employees. YISD's Purchasing Department has been unable to reduce its staffing or demonstrate operational improvements as a result of the use of its automated purchasing module. Exhibit 8-6 summarizes the system's limitations.
Exhibit 8-6 System Capabilities
Feature
Standard Report or Option Available
Requires Special Report
Requires Programming Not Available
Generate reports of total purchases made by vendor for specified date ranges.
Yes
Generate reports of total purchases made by commodity by vendor for specified date ranges.
Yes Commodity Codes must be used.
Establish a warning flag when total expenditures by commodity are reaching a predetermined dollar threshold. For example, when expenditures for a specific commodity reach $20,000 a warning is sent to Purchasing.
A report could be designed to download to a spreadsheet.
Generate reports of total purchases made by fund for specified date ranges. Yes
Generate detailed reports of purchase orders entered by requester for specified date ranges.
Yes
Generate reports of total number and dollar amount of purchase orders approved by individual approving purchase orders for specified date ranges.
Yes
Generate a prelist report that lists all Yes

purchase orders and detailed information prior to approval.
Generate purchase order reports at the campus and department level that list details of all purchase orders for specified date ranges.
Yes
Print date entered and date approved on the purchase order.
Yes
Print requester name on the purchase order.
Yes
Establish and print the central warehouse as the ship to address on the purchase order.
Yes
Generate a report based upon any captured field.
Yes
Automatic update of purchase order holding file once budget amendments are made.
Yes
Generate up-to-date approved vendor lists based upon awarded bids. Yes
Category codes need to be entered for each vendor when bid is awarded.
Exhibit 8-6 (continued) System Capabilities
Feature Available Not Available
Comments/Other
Hold purchase orders in a pending state until bids have been processed and approved. X YISD not using this
feature.
Display and print account code distribution on an accounts payable check. X
Encumber funds at point of entry when requisitioning warehouse items. X YISD not using this
feature.
Enter and process a purchase order using multiple funds on the same purchase order.
X

Require account codes to be entered for warehouse orders. X Must use General Ledger.
Perform on- line inquiries as to the status of the purchase order. X
Stop a purchase order from being processed if funds are not available. X
Place purchase order in holding file until a budget amendment is made.
X
Reject a purchase order when there is no line item or amount in the budget for that account.
X
Number of levels of on- line approval will the system allow. X Unlimited.
Display on screen and print a general description of the account classification used for a purchase on the purchase order. For example, when account 6399 is being used, the system prints "supplies" on the purchase order.
X
Review and approve purchase orders through a on-screen process. X
Disallow additions/modifications to warehouse requisitions once they have been released by the requester and are opened by warehouse.
X
Automate the competitive bid process. Available through the Internet.
Compile on- line purchase orders into an automated bid by using commodity codes. Unable to
determine.
The system interfaces with the Human Resources automated substitute caller system for payroll purposes. X
Source: J.D. Edwards World Solutions Company Because of the finance system's access levels established by the CFO, Purchasing personnel must access multiple screens to convert a purchase requisition to an approved purchase order. At present, three purchasing clerks are assigned full-time to manually process competitive bids. The system also is relatively slow and can produce only a limited number of management reports. For instance, it

does not track purchases by item category, making it difficult for the Purchasing Department to determine when like purchases exceed $25,000 over a 12-month period, as required by law. Exhibit 8-7 shows the types of tasks, by position, that are performed by the Purchasing Department.
Exhibit 8-7 Selected Tasks Performed by
Clerks in the YISD Purchasing Department
Job/Task Description
Lead Bid Clerk
Bid Clerks (2)
Lead Order Clerk
Order Clerks (2) Secretary
Contract Clerk
Purchasing Agents (2)
Number of Employees Assigned to Task
Automated Purchasing System
Process and approve purchase requisitions < $1,000.
• • • • 6
Process and/or review all purchase orders prior to approval.
• • 3
Process all catering orders for Cultural Arts Center.
• 1
Print and mail purchase orders and process purchase order reprints.
• • • 4
Maintain sole source requests. • • 3
Assist and train users with the automated purchasing system.
• • • • 6
Bid Process
Tabulate bids. • • • 4
Review and write bid specifications. • • • 4

Prepare bid packages and check bid folder. • • • 4
Prepare bid invitations and bid ads.
• • • 4
Advertise bids in newspaper. • 1
Schedule prebid conferences. • • • 4
Call to obtain telephone quotes for bids/ solicitations.
• • • • • 7
Maintain and update approved vendor list. • 1
Review bids with pending renewal dates.
• • • 4
Process contracts for schools & departments.
• 1
Process change orders for all schools and depts.
• 1
Job/Task Description
Lead Bid Clerk
Bid Clerks (2)
Lead Order Clerk
Order Clerks (2)
Secretary Contract Clerk
Purchasing Agents (2)
Number of Employees Assigned to Task
Automated Purchasing System
Prepare items to Board and/or Superintendent for approval.
• • • 3
Receive and log bids. • • • 4
Enter awarded bid information on the system.
• • 3

Work with user departments to ensure regulatory compliance in bid specs.
• • • • • • • 10
Administrative/Other
Type forms, reports and correspondence.
• • • • • • 8
Approve PO increase or decrease amounts.
• 1
Provide customer service to vendors and schools.
• • • • • • • 10
Generate daily, weekly, and monthly PO activity reports.
• • 3
Order supplies for department.
• 1
Administer departmental budget.
• 1
Source: YISD; interviews with Purchasing Department employees. Some of the functions in the above chart could be eliminated or simplified if the bidding process were fully automated. For example, if schools and departments were to enter their bid requisitions on- line, the consolidation and tabulation of bids done manually by three bid clerks would no longer be necessary. With a fully automated system the process would be less labor intensive, requiring fewer clerks at the district level. Exhibit 8-8 summarizes the number of competitive bids processed by YISD and peer districts.
Exhibit 8-8 Average Number of Business Days to Process Competitive Sealed Bids
YISD versus Peer Districts September 1, 1996 through August 31, 1997

Variable Houston ISD
Dallas ISD
Ft. Worth ISD
Austin ISD
El Paso ISD
Socorro ISD
San Antonio ISD
Corpus Christi ISD
Ysleta ISD
Number of Competitive sealed bids and solicitations processed in 1996-97.
N/R N/R 504 200 N/R 65 164 200 160
Average number of business days to process a competitive sealed bid (including board approval.)
N/R N/R 25 Days 25 Days N/R N/A
4-6 Weeks 30 Days
20 -30 Days
District uses an automated bid system.
N/R N/R Yes No N/R No Yes No No
Dollar threshold of competitive sealed bids and solicitations that must be presented to board for approval.
N/R N/R $10,000 $25,000 N/R $25,000 $25,000 $25,000 $100,000
Source: Interviews with district Purchasing directors. N/R = No response Exhibit 8-9 summarizes the number of purchase orders processed by peer districts and YISD.
Exhibit 8-9 Purchase Orders Processed per Purchasing Department Employee
YISD versus Peer Districts September 1, 1996 through August 31, 1997

Variable Houston ISD
Dallas ISD
Ft. Worth ISD
Austin ISD
El Paso ISD
Socorro ISD
San Antonio ISD
Corpus Christi ISD
Ysleta ISD (1)
Number of purchase orders processed 9/1/96 - 8/31/97
N/R N/R N/R 22,000 N/R 11,420 17,191 25,736 26,554
Total employees in Purchasing Department (including Director)
N/R 23 8 9 N/R 3 18 9 12
Number of purchase orders processed per employee, per month
N/R N/R N/R 204 N/R 317 80 238 184
Average number of business days to process purchase orders
N/R N/R 1 - 2 Days 4 N/R N/A 2-3 Days 7 Days 3 Days
District uses an automated purchase order system
N/R N/R Yes Yes N/R Yes No No Yes
Purchase orders are entered on-line at the school/depart-ment
N/R N/R Yes Yes N/R Yes No No Yes
Source: Interviews with district Purchasing directors. N/R = No response (1) = Survey documentation provided by YISD Contracting officer The above chart shows that Corpus Christi Independent School District (CCISD) processes approximately the same number of purchase orders per year as YISD with three fewer employees in

its Purchasing Department. TSPR's 1997 review of CCISD found that the purchasing/central receiving function should eliminate one unnecessary position pending full implementation of their automated system. Recommendation 83: Fully automate all purchasing, bidding, and management reporting processes. The contracting officer should work with the MIS Department and the vendor for the financial system to develop a solution that fully automates the bidding and purchase order processes. If the vendor cannot meet those needs, the district should consider acquiring other systems to integrate with the finance system. Two bid clerk positions should be eliminated once the automation process is fully implemented. The bid lead clerk should train the two purchasing agents to handle the technical aspects of the bid process and the two part time clerical staff (currently assigned to the Purchasing Department) to perform the clerical aspects of the bid process. IMPLEMENTATION STRATEGIES AND TIMELINE
1. The superintendent directs the contracting officer to explore automation options and develop an integrated solution. June 1998
2. The contracting officer along with the MIS Department, identify alternatives that fit the Purchasing Department's and district's needs and submit them to the superintendent for approval.
July 1998
3. The contracting officer begins implementing the approved solution. September 1998
4. The superintendent authorizes the elimination of two bid clerk positions as full implementation of the bidding and purchase order processes reduces the need for manual functions.
June 1999
FISCAL IMPACT Estimated savings for the elimination of each bid clerk is $18,000 plus 26 percent fringe benefits based on the average salaries of clerks currently in the Purchasing Department. Staff reductions should occur by attrition, which is 5.4 percent annually for auxiliary positions. One position should

be eliminated at the end of 1998-99, resulting in a savings of $22,680. At the end of 1999-2000, the second position should be eliminated, resulting in a cumulative savings of $45,360 for that year and each year thereafter.
Recommendation 1998-99
1999-2000
2000-01
2001-02
2002-03
Fully automate all purchasing, bidding, and management reporting processes. $0 $22,680 $45,360 $45,360 $45,360
FINDING The Purchasing Department reviews and approves all purchase requis itions from schools and departments. Although the district purchases most of its merchandise from previously approved bid lists, such as those prepared by GSC, the department still reviews and approves these purchases as a quality check. All purchase requisitions are initially reviewed by purchasing clerks; those valued at less than $1,000 can be approved by the clerks, while those above this level are forwarded to purchasing agents for approval. This cumbersome process lengthens the time for requisition processing to an average of four days before final purchase order approval is obtained (Exhibit 8-10).
Exhibit 8-10 Purchase Order Processing Time
October 1, 1997 - November 30, 1997
Week of and (Total Number) of P.O.s Processed
Average Number of Days to Process (Percentage of Total Processed For The Week)
0 Days 1-3 Days 4-6 Days 7-10 Days 11-29 Days 30+ Days
10/03/97 (385) 11% 43% 39% 8% 0% 0%
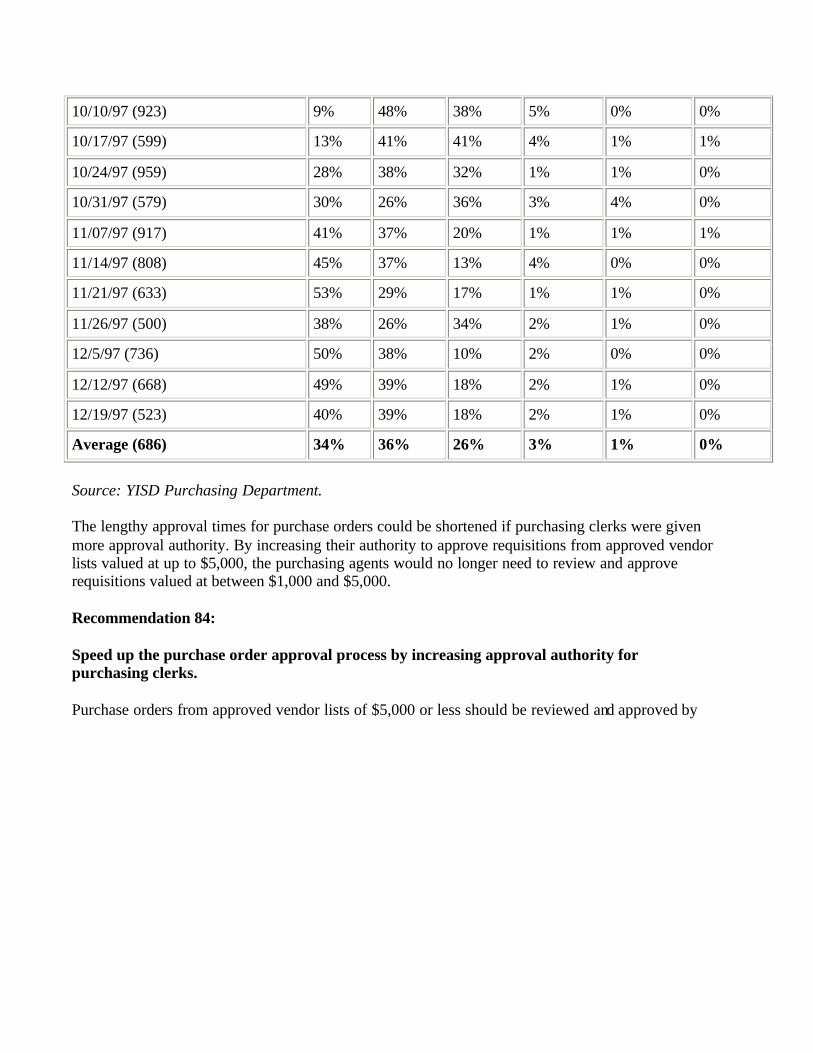
10/10/97 (923) 9% 48% 38% 5% 0% 0%
10/17/97 (599) 13% 41% 41% 4% 1% 1%
10/24/97 (959) 28% 38% 32% 1% 1% 0%
10/31/97 (579) 30% 26% 36% 3% 4% 0%
11/07/97 (917) 41% 37% 20% 1% 1% 1%
11/14/97 (808) 45% 37% 13% 4% 0% 0%
11/21/97 (633) 53% 29% 17% 1% 1% 0%
11/26/97 (500) 38% 26% 34% 2% 1% 0%
12/5/97 (736) 50% 38% 10% 2% 0% 0%
12/12/97 (668) 49% 39% 18% 2% 1% 0%
12/19/97 (523) 40% 39% 18% 2% 1% 0%
Average (686) 34% 36% 26% 3% 1% 0%
Source: YISD Purchasing Department. The lengthy approval times for purchase orders could be shortened if purchasing clerks were given more approval authority. By increasing their authority to approve requisitions from approved vendor lists valued at up to $5,000, the purchasing agents would no longer need to review and approve requisitions valued at between $1,000 and $5,000. Recommendation 84: Speed up the purchase order approval process by increasing approval authority for purchasing clerks. Purchase orders from approved vendor lists of $5,000 or less should be reviewed and approved by

purchasing clerks without the need for a purchasing agent's approval. Items valued at between $1,000 and $5,000 that are not from an approved list should still be approved by the purchasing agents. This will allow purchase orders to be approved and processed more quickly and purchasing agents to focus on obtaining competitive prices for merchandise and approving purchase orders above the $5,000 level. Management reports should be designed to randomly check purchases approved by purchasing clerks. The reports would allow the contracting officer or any other administrator to spot-check the work of purchasing clerks. IMPLEMENTATION STRATEGIES AND TIMELINE
1. The CFO directs the contracting officer to implement a procedure that would allow purchase orders below the $5,000 level to be approved by purchasing clerks.
June 1998
2. The contracting officer implements and monitors the procedure. June 1998 Ongoing
FISCAL IMPACT This recommendation can be implemented with existing resources. Savings should result from improved efficiencies. FINDING The Purchasing Department mails all competitive bid solicitations and announcements to vendors. Exhibit 8-11 summarizes the amount the Purchasing Department spent on postage over the past two fiscal years.

Exhibit 8-11 Purchasing Department Postage Expenditures
1995-96 through 1997-98
Fiscal Year Postage Amount Percent of Purchasing Dept. Supplies Budget
1995-96 $5,000 23.5%
1996-97 $7,000 21.6%
1997-98 * $2,000 43.5%
Total $14,000 -
Source: YISD Purchasing Department. * 9/1/97 - 11/1/97 TSPR found that the department is not using electronic technology to distribute bids effectively. For example, instead of printing bid packages for vendors, the district could provide the documents on a diskette or place them on the Internet. The district does have a `Fax on Demand' system that allows vendors to obtain competitive sealed bid and solicitation information by fax. Purchasing staff told TSPR that few vendors actually use this system due to the unwieldy size of the bid documents. Recommendation 85: Automate the distribution of competitive sealed bids and solicitations. The district should be able to cut the postage expenses involved in circulating competitive bid materials by 25 percent. Mailing diskettes instead of printed bids and placing bids on the Internet would also save paper and staff time needed to print and package documents.

IMPLEMENTATION STRATEGIES AND TIMELINE
1. The CFO directs the contracting officer to develop new procedures for distributing competitive bids electronically and/or on disk.
June 1998
2. The contracting officer implements the new procedures and evaluates their impact on customer service.
June 1998 Ongoing
FISCAL IMPACT It is estimated that a minimum reduction of 25 percent in bid-related postage expenses could be achieved by implementing this recommendation, which would produce estimated annual savings of $1,750 ($7,000 x .25).
Recommendation 1998-99 1999-2000 2000-01 2001-02 2002-03
Automate distribution of bids $1,750 $1,750 $1,750 $1,750 $1,750
FINDING There are a number of federal purchasing rules and requirements beyond what is contained in the TEC for several district programs, including Special Education, Bi- lingual Education, Compensatory Education, and Career & Technology. For each of these programs, central office employees (program directors) are responsible for ensuring compliance with these requirements, including those in the area of purchasing.

Program directors do not consistently approve purchase requisitions on- line for purchases involving federal funds. Rather, these funds were budgeted to the schools, and clerks entered purchase requisitions on the automated purchasing system, using program funds to pay for the purchases. Although some of the program directors approved a hard copy of purchase requisitions, this process exposed the district to risk since changes could be made to purchase requisitions after they had received program approval. Non-compliance could result in the district losing funds. Once TSPR pointed out this problem to the district, it revised its procedures so that on- line approval of purchase requisitions are now consistently handled by program directors. TSPR found that the Purchasing Department does not check to verify that account codes on purchase requisitions have been correctly entered before issuing its approval. With program managers and other school and department staff entering codes on- line for purchase requisitions, there is a likelihood that coding errors could cause funds to be taken from the wrong accounts. According to the vendor, the district's automated purchase order system is capable of printing a basic description of all account codes used by the district. Recommendation 86: Require all program approvals to be performed on-line and verify the accuracy of all account code entries. All purchase requisitions should be approved on- line by individuals who are responsible for the program funds. All purchase requisitions should be reviewed by the Purchasing Department prior to approval to ensure that merchandise is purchased from the appropriate accounts. The automated purchase order system should be modified to print a basic description of all account codes used on a purchase order to facilitate the account code verification process. IMPLEMENTATION STRATEGIES AND TIMELINE
1. The CFO requires program managers to approve purchase requisitions on- line. Completed
2. The CFO requires all purchase requisitions to be verified in the Purchasing Department prior to approval. August 1998
3. The MIS Department modifies the automated purchase order system to print account code descriptions on all purchase orders.
July - August 1998
FISCAL IMPACT

This recommendation can be implemented with existing resources. FINDING Board policy requires that all purchases resulting from a sealed bid or request for proposal must first be recommended by an Evaluation Committee prior to award. The Purchasing Department assembles an evaluation committee for each competitive sealed bid that it processes. The evaluation committee is comprised of employees from the user department and the Purchasing Department. These committees evaluate the vendor responses and make a recommendation for bid award. Once the committee makes its recommendation, the contracting officer presents the recommendation to the CFO or the superintendent for review and approval if the bid amount is $100,000 or less (administratively approved), or to the board if the bid is greater than $100,000. The board is not consistently provided a listing of administratively approved bids. Boards are ultimately responsible for all financial actions taken by a school district, including purchasing decisions. Internal control and monitoring are enhanced when reports of administrative approved bids are regularly presented to the board. Recommendation 87: Require monthly reports to the board of trustees of all competitive sealed bid and solicitation awards. A monthly informational report should be provided to the board that lists all bids that were approved administratively along with the approved vendor and the approved bid amount. This report will serve as an internal control and allow the board to monitor and request additional information when appropriate. IMPLEMENTATION STRATEGIES AND TIMELINE
1. The board directs the superintendent to develop a policy requiring all bids to be reported to the board on a monthly basis.
June 1998
2. The superintendent present s policy to board for approval. July 1998
3. The superintendent implements approved policy. July 1998 Ongoing
FISCAL IMPACT

This recommendation can be implemented with existing resources.

Chapter 8 PURCHASING AND WAREHOUSE SERVICES B. Warehouse Services An efficient warehouse operation should ensure that all purchases and deliveries to schools and departments are complete and timely; inventory levels are sufficient to meet requests for supplies from individual schools and departments; property and equipment are properly accounted for and controlled; and surplus or obsolete property is properly disposed of and removed from district records. CURRENT SITUATION YISD's central warehouse, built in 1987, spans 40,068 square feet and houses administrative and maintenance personnel along with instructional and janitorial supplies. Shipping and receiving functions, textbook receiving and deliveries, and transportation are handled at this facility. Instructional and janitorial supplies stored in the central warehouse had a combined inventory value of $19,888,121 for the year ending August 31, 1997. The department operates with 31 FTE positions. Operating statistics for the central warehouse are depicted in Exhibit 8-12.
Exhibit 8-12 YISD Warehouse Operating Measures
1996-97
Operating Measures Number
Number of warehouse requisitions processed with merchandise delivered to schools. 14,536
Number of purchase order shipments received at the warehouse and delivered to schools. 17,779
Total miles driven by 10 warehouse vehicles, receiving and distribution. 60,629
Number of work orders received for furniture movement, event set-up, pick-up of obsolete inventory. 689
Number of work orders processed to pick up computers for repair. 426
Number of purchase orders placed to stock the central warehouse. 1,444
Number of gallons of gasoline received. 420,000
Number of equipment transfer forms processed. 2,168

Number of public sales conducted for salvage/surplus furniture and equipment. 6
Source: YISD Warehouse. The warehouse supervisor manages the district's shipping and receiving function, including central receiving. Exhibit 8-13 illustrates the organizational structure for the central warehouse.
Exhibit 8-13 YISD Warehouse Department

Current Organization
Source: YISD Warehouse Department. Exhibit 8-14 summarizes the Warehouse Department's budget.
Exhibit 8-14 YISD Warehouse Department Budgeted Expenditures
1995-96 through 1996-97

Category 1995-96 Budget
% of Budget
1996-97 Budget
% of Budget
1997-98 Budget
% of Budget
Payroll $825,108 83.4% $840,976 94.6% $884,278 91.6%
Purchased & Contracted Services
$12,868 1.3% $16,058 1.8% $26,463 2.7%
Supplies & Materials $25,296 2.6% $42,023 4.7% $33,182 3.4%
Travel/Subsistence $2,556 .3% $4,054 .5% $8,000 .8%
Miscellaneous Operating Expenses ($740) -.1% $45,348 5.1% $4,880 .5%
Reclassified Transportation Expense
0 0% ($72,543)* -8.2% 0 0%
Fees/Dues/Awards $535 .1% $98 0% 0 0%
Inventory Write-Off $77,878 7.9% 00 0% 0 0%
Capital Outlay $46,302 4.7% $12,738 1.4% $8,800 .9%
Total $989,803 100% $888,752 100% $965,603 100%
Source: YISD Warehouse Department * This was an adjustment to the financial statements due to account code error and did not affect the Warehouse Department budget. All deliveries from vendors are received at the central warehouse shipping dock. There, receiving clerks check all boxes received to ensure that the contents are not damaged; log the delivery as received and the date on the automated purchase system; and check each box against receiving reports for content and quantity. Items that must be shipped on to schools and departments are transferred to the distribution area where delivery schedules are prepared. The delivery staff deliver the items to schools and departments, obtain the authorized receiving party's signature on delivery receipts, and bring the receipts back to the warehouse where they are logged each day. All warehouse items are requisitioned by schools and departments on- line through the automated system. The warehouse provides each school and department with one hard-copy catalog in addition to an on- line catalog of available items. The system maintains a perpetual inventory system which constantly updates the overall inventory according to purchases and distribution of supplies and materials. And, it automatically informs the user when an item needs to be reordered, and how much is needed based on the historical use of that item. The Warehouse Department conducts a complete physical inventory on August 31 and during the Christmas break of each year. A random physical inventory is taken each

month. In addition, each year the warehouse inventory is audited by the district's independent auditing firm, in accordance with state law. The type and value of warehouse purchases are depicted in Exhibit 8-15.
Exhibit 8-15 YISD Warehouse Purchases
Fiscal 1996-97
Category Total Value
Food Service Supplies $15,146,874
Basic Supplies $3,223,101
Maintenance Supplies $526,405
Janitorial Supplies $390,237
Print Shop Materials $336,943
Unleaded Gasoline $268,745
Athletics, P.E. Supplies $131,211
First Aid, Nurses Supplies $67,501
Printed Forms $47,671
Computer Supplies $19,178
Total $20,157,866
Source: YISD Warehouse Department. FINDING TSPR's review team observed the Warehouse Department's operations in October 1997 and found the department to be exceptionally clean and generally well-organized and well-run. The department uses a pallet system for storing merchandise that maximizes the warehouse's space and aids the efficient preparation of requisitions. All readily stolen items are maintained in locked cages. Warehouse employees conduct routine user surveys and adjust their inventory and services accordingly. They have established a procedure allowing schools to pick up their merchandise when emergencies arise. The warehouse has set up a counter that resembles a department store checkout lane. The warehouse also has a display board showing samples of some of the most commonly used items available. This display board is rotated to and displayed at all the district's schools during the course of each year, so that teachers and school administrators can readily see the merchandise that is available. Moreover, the Warehouse Department distributes a monthly newsletter called Warehouse

Notes to all schools and departments. The newsletter keeps district employees informed of warehouse operations and available items. The newsletter also contains information on textbooks and the automated finance system. COMMENDATION Warehouse operations are efficient and provide good customer service. FINDING The Warehouse Department's policies and procedures manual is highly detailed and documents every aspect of warehouse operations. It contains many graphics and lists the procedures and steps for all critical functions. Exhibit 8-16 shows the areas covered by the manual.
Exhibit 8-16 Critical Functions of the Warehouse Operations Manual
Procedures and steps contained in Warehouse Department Manual
• requesting vacation/comp-time or personal business leave • using bar-coding equipment
• reporting jury duty • measuring gas tanks and pumps
• reporting personal injury • receiving gasoline shipments
• inclement weather • checking merchandise against purchase orders
• involvement in accidents • holding public sales
• issuing employee or vehicle gas cards • delivering and receiving equipment/supplies to schools
• processing work orders • transferring of fixed assets and equipment
• sick leave accumulation • transferring surplus equipment
• distributing merchandise • conducting annual textbook inventory audits
• delivery schedules • requesting textbooks
• entering a sales order • receiving textbooks
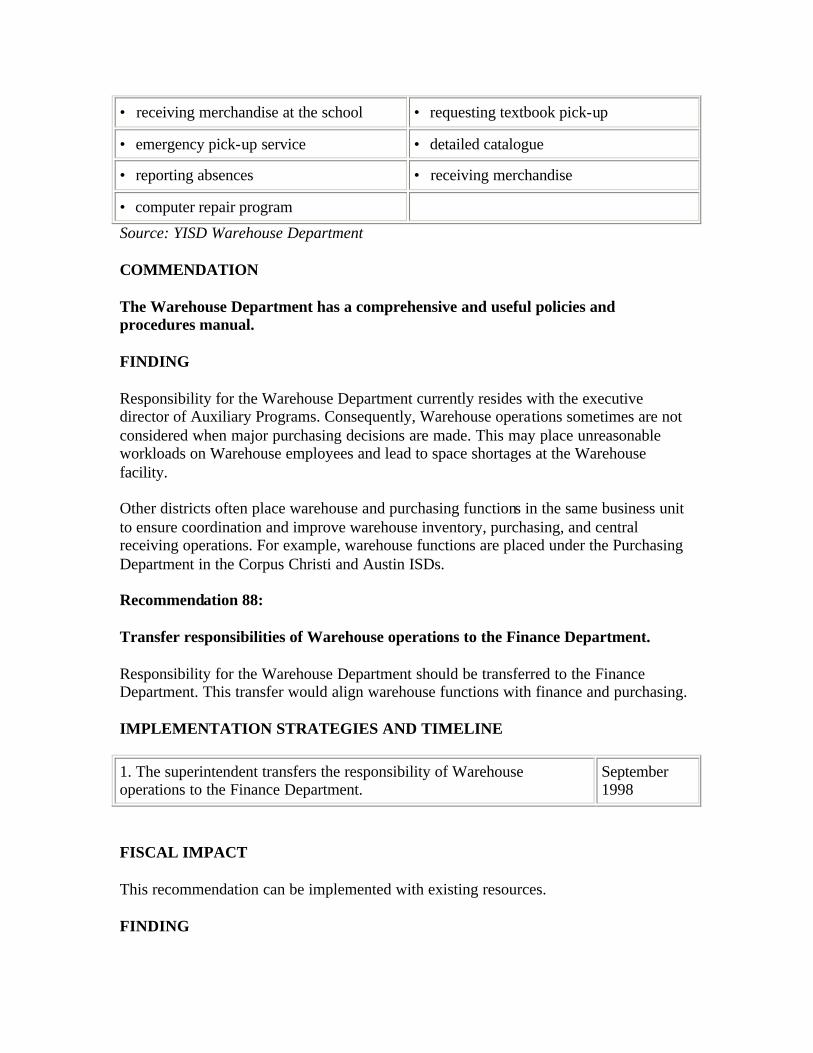
• receiving merchandise at the school • requesting textbook pick-up
• emergency pick-up service • detailed catalogue
• reporting absences • receiving merchandise
• computer repair program
Source: YISD Warehouse Department COMMENDATION The Warehouse Department has a comprehensive and useful policies and procedures manual. FINDING Responsibility for the Warehouse Department currently resides with the executive director of Auxiliary Programs. Consequently, Warehouse operations sometimes are not considered when major purchasing decisions are made. This may place unreasonable workloads on Warehouse employees and lead to space shortages at the Warehouse facility. Other districts often place warehouse and purchasing functions in the same business unit to ensure coordination and improve warehouse inventory, purchasing, and central receiving operations. For example, warehouse functions are placed under the Purchasing Department in the Corpus Christi and Austin ISDs. Recommendation 88: Transfer responsibilities of Warehouse operations to the Finance Department. Responsibility for the Warehouse Department should be transferred to the Finance Department. This transfer would align warehouse functions with finance and purchasing. IMPLEMENTATION STRATEGIES AND TIMELINE
1. The superintendent transfers the responsibility of Warehouse operations to the Finance Department.
September 1998
FISCAL IMPACT This recommendation can be implemented with existing resources. FINDING

YISD did not purchase the warehouse order module available through the automated finance system's vendor. Instead, the district modified the current purchasing system to accommodate warehouse orders. This modified system allows schools and departments to place additional items on a warehouse requisition after the original requisition has been processed and items have been delivered. Because the original order remains open, the school or department could receive the items on the original order twice when those orders are modified. In other words, when items are added to an existing order, the current system allows the original order to be filled twice. Although the warehouse clerk contacts the school for clarification prior to processing orders that appear to have been modified, there is no guarantee that all such orders will be noticed. When items are inadvertently double ordered, the result is an inventory of unneeded items. Recommendation 89: Modify the automated warehouse system to automatically close warehouse requisitions after they have been processed by the Warehouse Department. Although the automated warehouse system generally works well, it should be modified to prevent additions or changes to purchase requisitions once they have been released for processing. When additional items are needed, schools and departments should submit a new purchase requisition. IMPLEMENTATION STRATEGIES AND TIMELINE
1. The superintendent directs the warehouse director to pursue modifications in the automated warehouse system. June 1998
2. The warehouse director in cooperation with the executive director of Technology and Information Systems ensures that modifications are made and implemented.
September 1998
FISCAL IMPACT This recommendation can be implemented with YISD's existing computer programming staff. FINDING According to the warehouse director, the warehouse stocks an average of three month's inventory for items available to schools and departments in their in-house catalog. Total inventory purchases for 1996-97 totaled $19,161,941 (Exhibit 8-17).

Exhibit 8-17 YISD Average Warehouse Inventory
1996-97
Variable Amount
Amount of inventory purchased (basic supplies, athletics & P.E., first aide, nurses supplies, printed forms, maintenance, and computer supplies) $19,161,941
August 31, 1997 inventory $1,142,220
Average monthly usage $96,817
Average months of inventory on hand 11.8%
Source: YISD Warehouse Department. The warehouse placed 1,442 purchase orders during 1996-97 to replenish inventory items. These items are stored at the warehouse and used to fill individual orders placed by schools and departments. Warehouse personnel then deliver the orders to the schools and departments. The warehouse has implemented a next-day delivery service. In addition to supplies ordered for the warehouse, the central warehouse receives most deliveries intended for schools and district departments (14,526 orders in 1996-97), checks them in, and then delivers them to the schools and departments. TSPR has identified a particularly useful model program in Virginia, in which the Fairfax County Public Schools' passive order system (POS):
• minimizes the time and effort required by school staff to process supply orders.
• makes it less likely that schools and departments will run out of critical supplies.
• eliminates the "stockpiling" of supplies at schools.
• reduces peak summer workloads at the central warehouse.
• reduces warehouse inventory levels by establishing predictable demand.
The POS is typically used to deliver instructional and janitorial materials and supplies directly to schools. It requires schools and departments to estimate their annual demand for materials and supplies and break them down by monthly demand. These estimates then are forwarded to the warehouse for consolidation, bid preparation, and ordering. Each month, supplies are delivered directly to schools by the vendor based on a schedule

established by the principals, so that the schools know when products will be delivered. Each month, the warehouse sends each school a list of items they are scheduled to receive during the following month. Schools have 10 days to return the list with any adjustments to their orders. Under POS, materials and supplies arrive at each school when needed, eliminating unexpected shortages and the need to stockpile critical items. Only a limited number of high-demand supplies are inventoried at the Warehouse for emergencies. Fairfax County was able to make approximately 1,500 deliveries in 1995-96 with a warehouse staff of 15 FTEs, equating to 100 deliveries per position. Fewer deliveries are required because, with a properly implemented POS, deliveries are not made daily by Warehouse staff since vendors would deliver most merchandise directly to the schools. There are a total of 31 individuals assigned to the Warehouse Department, including the director. Of these, there are currently 23 individuals assigned to either order filling, delivery, dockmaster or foremen. YISD assigns the 23 warehouse positions as follows: one receiving foreman, one distribution foreman, one receiving dockmaster, 12 individuals to perform daily deliveries of school and office supplies, five employees are assigned to order filling of these deliveries, and three to delivering food service items, custodial supplies, and maintenance supplies. YISD's warehouse director told TSPR that the district once attempted to institute a form of POS, and that it did not succeed because schools ordered excessive quantities and did not have the storage room to accommodate them. Passive order systems, however, are designed to encourage schools to order supplies in quantities needed for immediate use only. A properly implemented POS should eliminate the need to store excessive inventories at the schools or the warehouse and enable more accurate projections of inventory requirements to ensure the ordering of proper quantities. Recommendation 90: Implement a passive order system for routine supplies. A passive order system should be implemented with a phased- in approach, starting with bulk and high-demand instructional and janitorial supplies and materials. Each year, items should be added to the POS until nearly all items are included in the system after a three-year period. Orders should be drawn up once a year and modified to meet any unplanned requirements. Warehouse stock should be reduced to a one month's supply from the current level of up to 11 months for some items, while eliminating obsolete items. Reduced inventories of instructional and janitorial supplies and materials should allow the district to stock more commonly used maintenance supplies. IMPLEMENTATION STRATEGIES AND TIMELINE

1. The CFO directs the warehouse director to implement a POS. June 1998
2. The warehouse director conducts interviews and site visits with districts using POS.
June - July 1998
3. The warehouse director determines the initial stock items that will be available in the POS.
August 1998
4. The warehouse director develops procedures, forms, and tracking systems for implementation of POS.
August 1998 - January 1999
5. The warehouse director pilots POS at ten sites and begins limited implementation of POS with vendors. January 1999
6. The warehouse director trains Warehouse employees in planning passive orders and monitoring needs and implements POS districtwide for initial items.
January 1999 - July 2000
7. The warehouse director includes additional items to the POS until the POS is fully implemented.
July 2000 - July 2001
FISCAL IMPACT A fully implemented POS will allow YISD to deliver warehouse supplies to schools once per month, reducing the 14,526 deliveries to schools during 1996-97 to 670. A reduced delivery schedule will eliminate the need for at least seven Warehouse positions that can be eliminated through attrition. It is estimated that three fewer employees would be needed to fill orders and four fewer positions to perform deliveries of school and office supplies. Eight delivery staff and two order fillers would remain, along with the three employees currently assigned to delivering food service items, custodial supplies, and maintenance supplies. The two foreman and one dockmaster positions would also remain. The average salaries of each of the seven reduced positions is $21,000 per year each, plus 36.85 percent in fringe benefits for a total of approximately $28,700 per position. The attrition rate for these auxiliary positions is 5.4 percent per year. Based on these figures, one position per year can be eliminated through attrition, resulting in savings of $28,700 for salary and benefits beginning in 1999-2000. Savings for each year thereafter will include one additional position until all seven have been eliminated. Additional savings could result from lower inventory levels and increased cash flow and interest.
Recommendation 1998-99 1999-2000 2000-01 2001-02 2002-03

Implement a passive order system -0- $28,700 $57,400 $86,100 $201,100
FINDING In the course of TSPR's surveys and interviews, many complaints were registered about the slowness in processing purchase orders and quality of merchandise received. Principals expressed concern that repairs of minor maintenance problems that occur at schools are taking too long to complete. The maintenance crews expressed frustration because repairs are often held up until parts are ordered and received. When the warehouse does not stock parts needed for a particular repair, the repair crew must return to the shop, prepare a purchase requisition for the parts, and return to the job a second time after the requisition is approved and the part received. This process is both time-consuming and burdensome to the Maintenance Department's scheduling process. Open purchase orders would help because they allow designated employees to spot purchase a needed item based on pre-purchase approval up to a specified dollar limit. Although the district processes some open purchase orders, Maintenance Department staff members said that many of their foremen do not use them. Recommendation 91: Require the use of more open purchase orders for transportation, maintenance, and custodial crews. The district should require the Maintenance and Transportation Department to establish more open purchase orders with approved vendors. This would allow maintenance workers to obtain needed repair parts without waiting for a purchase order to be processed and approved. Open purchase orders should be for a limited dollar amount and reissued each month. Also, the district should analyze the types and quantities of parts purchased and stock the most frequently used items. IMPLEMENTATION STRATEGIES AND TIMELINE
1. The superintendent directs Maintenance and Transportation Departments to establish more open purchase orders.
June 1998
2. The Maintenance and Transportation Departments establish more open purchase orders.
July 1998 Ongoing
FISCAL IMPACT

This recommendation can be implemented with existing resources.

Chapter 8
PURCHASING AND WAREHOUSE SERVICES C. Textbooks The Texas Education Agency (TEA) is responsible for selecting and purchasing most of the textbooks used by Texas districts. TEA buys textbooks from publishers and lends them to districts. Each district is responsible for returning these "borrowed" textbooks to TEA. If textbooks are lost during the school year, the district either recovers its cost from the student or the student's parent or guardian, or compensates the state for the loss. CURRENT SITUATION The warehouse director is primarily responsible for the Textbook Services Department, which is located in the central warehouse facility. The department is staffed with a textbook clerk and two employees who assist with textbook deliveries. Day-to-day responsibility for the distribution and tracking of textbooks in the district is held by the receiving/textbook foreman. The primary functions performed by the Textbook Services Department include estimating the number of textbooks needed by the district each year; preparing supplemental orders of additional textbooks from TEA; inventorying textbooks; distributing books to individual schools; tracking lost books; and returning surplus books to TEA. FINDING YISD's textbook inventory is stored in the central warehouse on pallets; all volumes are readily located and inventoried. The textbook inventory appeared to be well-organized and in all was one of the best that this TSPR review team has seen. COMMENDATION The Textbook Services Department maintains a clean, organized, and efficient operation. FINDING The YISD Textbook Services Department uses an automated textbook inventory system developed by Hays Associates in about 25 schools in the district. This system can be configured to connect the warehouse with schools throughout the district. This allows schools to place and verify orders and track textbooks assigned to students by location. TSPR has learned that districts that have installed this textbook inventory system districtwide have reduced their costs for replacing lost or damaged books by an average of 50 percent. These districts have attributed the cost reductions to improved tracking.

Over the past three years, YISD has averaged $104,385 in lost textbooks. (Exhibit 8-18)
Exhibit 8-18 YISD State Textbook Losses
1994-95, 1995-96, and 1996-97 School Years
School Year Total Losses
1994-95 $98,751
1995-96 $87,353
1996-97 $127,048
Average $104,385
Source: YISD Textbook Department. The assistant principal of Parkland High School is extremely satisfied with the textbook inventory system. He indicated that the system was easy to learn and use. In fact, he has assigned students to perform the data entry and generation of reports. All YISD schools already have the required computers and wiring to implement the system. Schools that do not use the automated system must track textbooks manually. The textbook secretary indicated that in a recent meeting, the major reason cited by assistant principals for not using the automated system was that either they did not know it existed at their school or they did not know the system's capabilities. Some schools stopped using the system because they did not want to pay the annual support fee, which ranges from $50 to $200 per year. Recommendation 92: Require all schools to use the automated textbook inventory system to account for textbooks and to facilitate efficient ordering, tracking, and delivery of textbooks throughout the district. IMPLEMENTATION STRATEGIES AND TIMELINE
1. The director of MIS evaluates the current computer system to determine what would be required to install the textbook inventory software, using the district's existing infrastructure, to connect schools with the textbook warehouse.
June 1998
2. The director of MIS, in conjunction with the textbook foreman, determines the desired features of the networked textbook inventory system.
July 1998
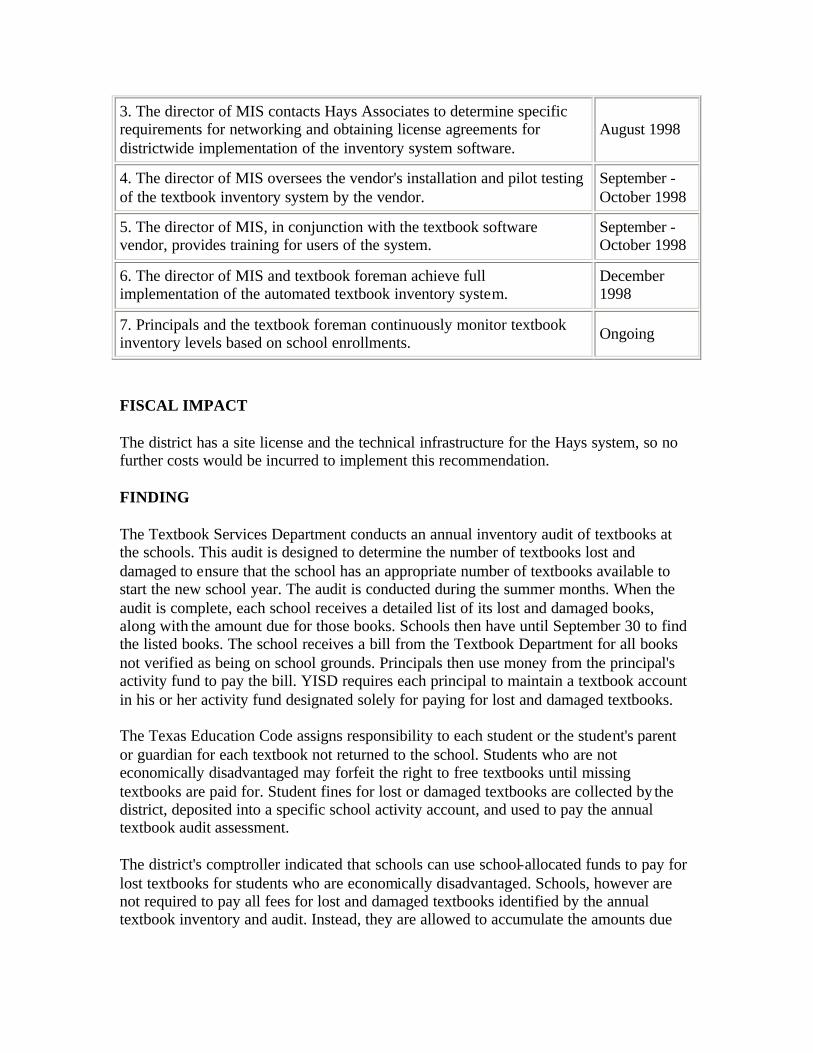
3. The director of MIS contacts Hays Associates to determine specific requirements for networking and obtaining license agreements for districtwide implementation of the inventory system software.
August 1998
4. The director of MIS oversees the vendor's installation and pilot testing of the textbook inventory system by the vendor.
September - October 1998
5. The director of MIS, in conjunction with the textbook software vendor, provides training for users of the system.
September - October 1998
6. The director of MIS and textbook foreman achieve full implementation of the automated textbook inventory system.
December 1998
7. Principals and the textbook foreman continuously monitor textbook inventory levels based on school enrollments. Ongoing
FISCAL IMPACT The district has a site license and the technical infrastructure for the Hays system, so no further costs would be incurred to implement this recommendation. FINDING The Textbook Services Department conducts an annual inventory audit of textbooks at the schools. This audit is designed to determine the number of textbooks lost and damaged to ensure that the school has an appropriate number of textbooks available to start the new school year. The audit is conducted during the summer months. When the audit is complete, each school receives a detailed list of its lost and damaged books, along with the amount due for those books. Schools then have until September 30 to find the listed books. The school receives a bill from the Textbook Department for all books not verified as being on school grounds. Principals then use money from the principal's activity fund to pay the bill. YISD requires each principal to maintain a textbook account in his or her activity fund designated solely for paying for lost and damaged textbooks. The Texas Education Code assigns responsibility to each student or the student's parent or guardian for each textbook not returned to the school. Students who are not economically disadvantaged may forfeit the right to free textbooks until missing textbooks are paid for. Student fines for lost or damaged textbooks are collected by the district, deposited into a specific school activity account, and used to pay the annual textbook audit assessment. The district's comptroller indicated that schools can use school-allocated funds to pay for lost textbooks for students who are economically disadvantaged. Schools, however are not required to pay all fees for lost and damaged textbooks identified by the annual textbook inventory and audit. Instead, they are allowed to accumulate the amounts due

for lost textbooks each year. Many schools have not fully paid their lost and damaged textbook accounts, as summarized by. Exhibit 8-19.
Exhibit 8-19 Amounts Due for Lost Damaged Textbooks by School
November 1, 1997
School Original Amount Due
11/1/1997 Balance Due
2/6/98 Balance Due
Bel Air High School $109,967 $21,907 $0
Eastwood High School $76,851 $36,470 $36,470
Parkland High School $31,997 $0 $0
Ysleta High School $98,429 $29,683 $29,683
Riverside High School $33,590 $0 $0
Academy of Science & Technology $9,223 $0 $0
Hanks High School $42,286 $0 $0
Del Valle High School $72,931 $42,135 $35,135
Tejas School of Choice $911 $79 $79
RIP CORD $17,640 $0 $0
Cesar Chavez Alternative School $11,780 $1,301 $1,301
Bel Air Center for Health $479 $479 $479
Highlander Academy $1,666 $0 $0
Jump Start Academy $5,269 $0 $0
Phoenix Academy $7,353 $0 $0
Accelerated Education Academy $3,127 $3,127 $3,127
Plato Academy $13,151 $0 $0
Nova Net Lab $1,847 $0 $0
Hanks Academy $1,656 $0 $0
Parkland Middle School $10,877 $0 $0
Eastwood Middle School $27,597 $0 $0

Riverside Middle School $4,245 $0 $0
Hillcrest Middle School $2,475 $0 $0
Ysleta Middle School $1,085 $0 $0
Valley View Middle School $11,359 $8,167 $8,167
Desert View Middle School $6,722 $6,722 $4,784
Ranchland Middle School $17,358 $10,617 $10,617
Indian Ridge Middle School $4,213 $0 $0
Camino Real Middle School $11,176 $11,176 $11,176
Ascarate Elementary School $384 $0 $0
Cadwallader Elementary School $10,337 $0 $0
Cedar Grove Elementary School $3,364 $3,364 $3,364
Del Norte Heights Elementary School
$609 $0 $0
Dolphin Terrace Elementary School
$1,918 $0 $0
Eastwood Knolls Elementary School $5,918 $0 $0
Edgemere Elementary School $650 $0 $0
Hacienda Heights Elementary School
$4,727 $3,759 $3,759
Loma Terrace Elementary School $8,262 $40 $40
Marian Manor Elementary School $1,857 $840 $840
Thomas Manor Elementary School $487 $0 $0
North Loop Elementary School $1,652 $0 $0
Parkland Elementary School $2,799 $0 $0
Sageland Elementary School $7,496 $0 $0
Scotsdale Elementary School $4,559 $0 $0
South Loop Elementary School $4,072 $0 $0
Eastpoint Elementary School $6,378 $0 $0

Mesa Vista Elementary School $2,696 $0 $0
Pasodale Elementary School $10,846 $10,846 $3,591
Presa Elementary School $641 $0 $0
Eastwood Heights Elementary School
$2,405 $1,097 $0
Capistrano Elementary School $11,171 $11,171 $4,277
Vista Hills Elementary School $1,093 $0 $0
Glen Cove Elementary School $3,490 $0 $0
Le Barron Park Elementary School $2,201 $0 $0
Pebble Hills Elementary School $1,136 $0 $0
Tierra Del Sol Elementary School $10,490 $717 $0
Lancaster Elementary School $2,485 $1,624 $0
Mission Valley Elementary School $2,862 $0 $0
Desertaire Elementary School $6,725 $0 $0
Total $760,969 $205,321 $156,890
Source: YISD Textbook Department. Recommendation 93: Require all schools to pay for lost textbooks each year from campus activity funds. The district should require students who are not economically disadvantaged (or their parents or guardians) to pay for lost and damaged textbooks. Principals should be required to pay the full amount assessed during the annual textbook audit within 30 days of the audit. Principals receive money from vending machines and typically deposit this into their activity funds; this money should be used to pay textbook fines for students that do not pay. With the full implementation of the automated textbook system called for in the previous recommendation, improved districtwide tracking of textbooks will reduce future losses. IMPLEMENTATION STRATEGIES AND TIMELINE
1. The board directs the superintendent to develop a policy whereby schools must collect textbook fines from students and pay the full balance of audited losses at the end of each year.
June 1998

2. The superintendent presents policy to board for approval. July 1998
3. The superintendent disseminates approved policy to all school administrators.
July 1998
4. The superintendent implements approved policy. July 1998 Ongoing
FISCAL IMPACT This recommendation can be implemented with existing resources. Although fewer lost and damaged textbooks are expected, the savings will come from reduced student fines and activity fund expenditures. Hence there are no savings to the general fund.

Chapter 9 COMPUTERS AND TECHNOLOGY
This chapter examines YISD's computer and technology functions in three sections:
A. Technology Planning
B. Network/Connectivity
C. Instructional Technology
BACKGROUND YISD's Division of Technology provides support for district campuses and central office departments by managing the district's telecommunications and administrative information systems and providing instructional technology and media support throughout the district. The Division of Technology is led by the Executive Director of Technology and Information Systems. YISD's Division of Technology is organized into three departments: Management Information Systems
• Telecommunications
• Media/Technology
The Management Information Systems (MIS) Department contains divisions for Student Information, Finance, Network, Operations, Computer Support, and Technical Writing. The Telecommunications Department maintains the district's communications infrastructure, including its telephone service, and works closely with the network group in the MIS Department. The Media/Technology Group is responsible for the training and application of technology within the district, inc luding video, voice, and data technology. YISD's five-year technology plan was developed by a Technology Task

force that used surveys, interviews, and focus groups to involve more than 150 teachers, students, parents, principals, support employees, administrators, and business and community representatives. YISD has been aggressive in acquiring and using technology in its everyday operations. The district has more than 13,500 desktop computers in use. This large computer base gives the district a ratio of almost one computer for every three students, which is well ahead of the Texas Education Agency's (TEA's) goals of one computer for every four students by 1998. Telecommunications In the 1995-96 school year, YISD converted to a new, standardized telephone system that has reduced the amount of maintenance needed and greatly improved the efficiency and control of district telecommunications. At present, the district is planning a second stage of telecommunications implementation that will network and provide for central control of all district telephones. The district's tentative plans call for this effort to begin in the 1998-99 school year. Some of the benefits expected from this initiative include four-digit dialing between all district campuses, as well as voice mail for all teachers and administrators. Ysleta Educational Services Network The Ysleta Educational Services Network (YESNet) is a districtwide network that will allow district campuses to communicate with one another and the central office and to access the Internet and other educational resources. The YESNet includes a wide-area network (WAN) that establishes the connections between the campuses and the central office and the campus local area networks (LANs) that provide voice, data, and video capability to every campus classroom and voice/data capability to every administrative workstation. The campuses use YESNet to connect to the district finance system and the student administrative accounting system, and in the future will use it to access instructional resources as well. Campus Technology Acquisition In addition to the resources allocated to each campus annually for technology purchases, the district has used a variety of programs to ensure

that its campuses have adequate numbers of up-to-date computers that can be used within the district network. YISD has, for instance, established a "mini-grant" program that allows campuses to propose technology programs tailored to the needs of their students or to the particular strengths of their faculties. Moreover, over the last several years the district has allocated matching funds from its Local Technology Fund for the acquisition of new equipment and the replacement of obsolete equipment. Campuses can apply for this funding to stretch their buying power. Over the last three years, the district has earmarked more than $4 million from its Local Technology Fund to match campus- level funds. In the past, YISD campuses have used computer labs primarily to provide computer-based instruction to students; however, with the completion of the campus LANs and the resultant capability to deliver resources across the LAN, campuses can begin to use computers in the classroom for general instruction. During 1997-98, YISD and NetSchools will begin implementing an infrared distribution system. NetSchools is a wireless system that allows students to download instructional material to portable computers. Every student is issued a portable computer to use in their classrooms as well as the library, cafeteria, and study halls. Implementation of the system also will include training for classroom teachers in the integration of computers and network resources (primarily the Internet) into the curriculum. The system will be piloted in several campuses, including elementary, middle, and high school campuses, with a phased plan of implementation in upcoming school years. The new system will represent the most comprehensive use of technology by students to date. Financial and Administrative Systems Finance System: YISD is implementing a financial software system to integrate all of the district's financial applications, including personnel and payroll, within a single information system. The Division of Technology is, of course, heavily involved in this implementation. A finance team from the Division of Technology is working closely with the Finance Division, Human Resources Division, and campus representatives to faciilitate the transition from the current software and to lay the foundation for ongoing support of the new system.

A budget development module of the new software was used by campuses in spring 1996 to directly enter their 1996-97 budgets. The module was enhanced and more fully used for budget development for the 1997-98 year. Beginning in September 1996, the district implemented the general ledger and purchasing modules of the system. A work order system for maintenance, transportation, warehouse delivery, and catering is being piloted at 11 campuses with full use by all campuses planned by spring 1998. Human resources and payroll modules are planned to be fully implemented in the next school year, along with a position control module that also will be used in the budget development process. Schools Administrative Student Information System: The Schools Administrative Student Information (SASI) system has been implemented at all district campuses. SASI is a database of student demographic information, attendance and progress information, scheduling and course information, and other administrative data. Information about special education students, bilingual students, and TAAS tests also is tracked through this system. The data within the system form the basis for the required submission of YISD data to the state's Public Education Information Management System (PEIMS) PEIMS information must be submitted three times a year, and the SASI system has allowed for more efficient handling of these data and more campus involvement in the submission process. With the implementation of the district database version of SASI, all of the individual campus databases can be aggregated into a single districtwide database, which will facilitate research, allow the production of management information based on the entire district population, and ease the management and support of the campus databases. The SASI system implementation began with a pilot at four campuses during the 1994-95 school year and was fully operating at all schools by the beginning of the 1995-96 school year. Since that time, campuses have refined their data entry requirements and responsibilities; special program information was incorporated into the system; and additional modules are being added to the system each year. For example, during 1997-98, school nurses will begin using the SASI system to record student health and immunization information. Using one system to record all this information will greatly improve its availability to users and make the transfer of students' records from one district school to another much easier. Instructional Media Technology The Division of Technology is responsible for the support of instructional technology throughout the district. The major initiatives of this department

include the automation of campus libraries, librarian training, support of campus technology liaisons, evaluation of instructional software and acquisition of district licenses where appropriate, and evaluation of new instructional technology. The district has undertaken a variety of instructional technology initiatives, including the Windows on Science program, which allows students to learn how science applies to every day life. Students use computers to link the organizations like NASA to learn more about science. The district also uses an electronic textbook for high school economics courses and campuses have implemented a wide variety of classroom curricula for computers, including mathematics, writing programs, and science courses. The district uses a distance learning facility (a facility that offers televised classes at three high school campuses and the central office via Southwestern Bell phone lines) and an electronic curricula and staff training system. The district is considering expanding its distance learning program to other high school campuses. The sys tem will integrate with distance learning packages used at the Region XIX Education Service Center and other educational institutions. In addition, the central office's Professional Library is equipped with a Teacher Innovation Center that allows distric t faculty and administrators to preview software, work with both Macintosh and IBM machines, and experiment with software curricula currently available in the district.

Chapter 9 COMPUTERS AND TECHNOLOGY A. Technology Planning CURRENT SITUATION In 1990, YISD developed a comprehensive five-year technology plan to meet state funding requirements. This plan provided direction for technology implementation in specified programs. In 1993, the district initiated site-based decision making (SBDM) and made technology implementation a priority. This necessitated an update to the plan that identified new budgetary and technology initiatives. During the past five years, the district has dedicated $8.3 million per year to fund hardware and software purchases, install the YISD WAN and campus LANs, provide a variety of instructional software for campus use, and fund miscellaneous technology-related initiatives such as training. FINDING Each year, YISD spends local resources of $7 million and $1.3 million in state technology allotments to acquire computer technology. At this writing, YISD has 13,500 personal computers, or one computer for every three students. Three-fourths of all district staff members have access to a computer. Each school is connected to the central office via a dedicated T-1 communications line, and every classroom is wired to support video, voice, and data transmissions. As noted above, three high schools are set up to receive televised courses via distance- learning equipment donated by Southwestern Bell. In addition, the district maintains a public television station and production facility to broadcast information on community projects and the accomplishments of the district, students, and staff. YISD offers its campuses mini-grants allowing schools to propose and receive additional district funding for programs designed to improve instruction and test scores. About half of the grants awarded involve instructional programs that directly use computer technology. The program has been very successful in promoting the use of computers on campuses and in classrooms. Over the last three years, the district also has allocated matching funds of more than $4 million from its Local Technology Fund for the acquisition of new equipment and the replacement of obsolete equipment. The district sets aside money to match campus funds allocated for technology purchases. COMMENDATION

YISD has a significant technology infrastructure and encourages the use of computer technology at the campus level. FINDING The Division of Technology is in the fourth and final year of a technology plan for the district. This plan, in its present form, lacks specific strategies for its initiatives, including accountability measures, detailed implementation plans, and detailed cost and funding plans. Furthermore, the existing plan has no professional development or risk management plan. The Division of Technology is developing a new long-range technology plan to guide technology decisions to support the district's overall goals, as well as a professional development plan. During February and March of 1998, a committee of teachers, administrators, and staff prepared a draft of a new Long Range Technology Plan for 1998-2000. The 1998-2000 Plan addresses training and professional development needs as the district's highest priority. YISD's plan, in its draft form, provides for an aggressive training initiative, a broad-based system of technical support, and a plan to keep hardware as updated as possible. The professional development courses currently offered by the division address productivity software, basic networking skills, and some instructional software. Teachers and administrators have varying levels of expertise and the revised training plan will call for multitiered training to address their needs. The division also plans to include certification for Novell software and other established certifications in its training program. The division's risk management plan will address the following:
• Network security and access: The district's network security interfaces with the security modules of individual applications in most instances. Security provisions and access requirements currently in place will be modified as part of the plan. These multiple layers of security will make it more difficult for unauthorized access to the district's network and systems.
• Internet firewall and filter: The district has an Acceptable Use Policy (AUP) that outlines the proper use of the district's network and the internet; this will be modified as part of the risk management plan. Campus administrators oversee compliance with the AUP.
• Virus protection: Network security provisions and the Internet firewall and filter policies will be used to limit exposure to computer viruses.

• Disaster recovery plan: The procedures already in place will be modified to address the need for redundant power sources.
COMMENDATION: YISD's Division of Technology recognized the shortcomings of the original technology plan and is drafting a plan that contains the critical elements of an effective plan. FINDING Despite the fact that YISD has only one grant writer, who started in August 1997, the district is actively pursuing technology support from business and foundations and has successfully applied for and received several grants, including grants from the Telecommunications Infrastructure Fund (TIF). In 1997, the district received TIF grants for five of its seven high schools. TIF grants are for amounts up to $100,000 and may be used by schools for infrastructure, hardware, software, and training. Recently. the district also applied for a $250,000 grant from the National Endowment for Humanities, and is waiting to hear whether the grant has been approved. In addition, YISD's grant writer is submitting an application for a $7.5 million Technology Innovation Challenge Grant from the Department of Education, and for $4 million in TIE (Technology in Education), a state initiative funded under the federal Technology Literacy Challenge Fund. Finally, YISD applied to the Universal Service Fund, an entity created by the Federal Telecommunications Act of 1996. The Universal Service Fund allows school districts to apply for reimbursement of a partial amount of qualifying expenditures. The discounts are based on the number of students qualifying for free and reduced lunches. Discounts of up to 90 percent on eligible technology and telecommunications expenditures are available. In addition to the above districtwide efforts, individual campuses apply for a variety of funding sources. YISD also has a successful business relationship with Time Warner's cable company subsidiary, Paragon Cable Company. Paragon provides each school with an Internet connection, typically in the school library. The district has business partners for its individual schools that focus their efforts on individual schools and not necessarily on supporting and enhancing districtwide computer technology. One exception is a joint program between the district and the University of Texas El Paso (UTEP) that trains select teachers in integrating technology into classroom instruction. These teachers receive scholarships from the university and attend class at night. COMMENDATION

YISD has aggressively sought technology support from businesses and foundations and has successfully applied for and received several technology-related grants. FINDING Although YISD has been extremely successful in obtaining technology-related support, best practices in this area call for developing a coherent plan to pursue outside funding sources including federal, state and local programs, businesses, and private foundations. Such a plan identifies potential funding opportunities and builds teams to apply for funding or services. For example, to obtain support from federal and state programs, foundations, and the business community, a district must conduct research to match its needs with specific funding opportunities. The regional office of the U.S. Department of Education in Dallas and the Chamber of Commerce in El Paso could provide valuable information resources. In addition, the recent federal E-Rate program established by the Federal Communications Commission (FCC), provides discounts to eligible schools on certain telecommunications services. This program will provide districts with discounts of up to 50 percent on eligible telecommunications expenses, such as the leasing of T1 phone lines. The discounts are provided by qualified telecommunications providers such as GTE and Southwestern Bell. YISD's Proposed Technology Plan for 1998-2000 calls for the establishment of a Technology Foundation to solicit assistance for school-based programs from business and the community. In setting up this foundation, strategies for soliciting funds and for use of funds will be critical success factors. Recommendation 94: Establish and implement a plan for aggressively seeking both monetary and nonmonetary grants and contributions from the business community, foundations, state and federal grant programs, and other sources. First, individuals with grant writing expertise should be brought together to develop a plan to maximize the district's grant possibilities, this team of individuals should work under the direction of the district's writer to aggressively pursue all possible funding sources. The district also should explore collaborations with the business community and universities to develop creative programs to raise money, obtain computer technology, maintain and support it, and train staff. A goal of increasing grant funding by $100,000 each year should be set and aggressively pursued. IMPLEMENTATION STRATEGIES AND TIMELINE

1. The superintendent, the executive director of Technology and Information Systems, the district grant writer, and the coordinator of Business Partners identify individuals with grant writing expertise within the district and establish a committee to develop a plan to obtain additional funds, resources, and assistance from parties outside the district for supporting the use of computer technology.
June 1998
2. The committee meets with the technology steering committee to discuss needs for computer support. July 1998
3. The committee identifies opportunities for obtaining monetary and nonmonetary assistance for computer technology and assigns responsibility for those opportunities to committee members.
July 1998 ñ August 1998
4. The committee members contact potential business partners, foundations, and other entities (state and federal) to discuss opportunities to support the district's use of computer technology.
September 1998 and ongoing
5. The committee develops and submits proposals to potential business partners, foundations, and other funding sources.
October 1998 and ongoing
6. The committee works with the technology steering committee to use the resources received from outside sources.
November 1998 and ongoing
7. The committee meets to evaluate efforts and to determine new opportunities.
December 1998 and ongoing
FISCAL IMPACT Successful initiatives with the business community, foundations, and other sources should allow the district to realize a goal of $100,000 in additional revenue and service donations to be raised each year.
Recommendation 1998-99 1999-2000 2000-01 2001-02 2002-03
Establish a plan to aggressively seek both monetary and non-monetary grants and contributions.
$100,000 $200,000 $300,000 $400,000 $500,000
FINDING

The main recommendation from YISD's five-year technology plan was to provide all staff members with ongoing training in current and future computer technology. However, when the plan was implemented, less than 4 percent of the $73 million spent on technology was spent on training. The Gartner Group, the world's leading independent technology research and analysis firm, suggests that every dollar spent on hardware and software should be matched by a dollar for support, maintenance, and training. The district continues to dedicate $8.3 million per year to purchasing new hardware, software, and other technological infrastructure. This investment, however, has not been matched with an additional investment in training and support. The district's technology training initiatives in 1997 had space to train just 400 employees. At this rate, the district would need more than seven years simply to train all its teachers in a single application. The next YISD Technology plan (1998-2000) presents a useful opportunity to emphasize computer training. Recommendation 95: Allocate additional hardware and software funds to technology support and training. YISD has spent $73 million in the last five years on computer infrastructure, but used only a small percentage of this amount for training. Allocating a portion of the funds reserved for computer infrastructure to training initiatives would increase the district's return on its investment in technology. Additional courses, train-the-trainer programs, and outside trainers all could provide computer support and training to the district's staff. User surveys, focus groups, and school site visits could be used in subsequent years to assess areas within district's technology program that need additional resources. IMPLEMENTATION STRATEGIES AND TIMELINE
1. The executive director of Technology and Systems assesses YISD's needs for hardware, support, maintenance, upgrades, and training.
March 1999 - April 1999
2. The executive director of Technology and Systems compares needs to the Strategic Systems and Technology Plan. May 1999
3. The executive director of Technology and Systems meets with Finance and Budget to discuss funding options.
4. The executive director of Technology and Systems develops a resource allocation plan.
July 1999

5. The executive director of Technology and Systems presents the resource allocation plan to the superintendent and board for approval.
August 1999
6. The executive director of Technology and Systems implements the plan.
September 1999
7. The executive director of Technology and Systems monitors the plan and assesses progress toward the district's goals.
September 1999 and ongoing
FISCAL IMPACT The district should allocate $1 million from its computer infrastructure programs to enhance its technological support and training efforts in the 1998-1999 school year. Because this is not additional money, but rather a reallocation of existing dollars, no fiscal impact is assumed. FINDING YISD uses an IBM AS/400 mainframe computer for its J.D. Edwards business applications and its SASI system. The district maintains an HP 3000 mainframe for its payroll applications. The HP 3000 will be phased out when the payroll module of the current finance system is implemented. The integrated financial system includes the following modules:
• Accounts Payable
• General Ledger and Basic Financials
• Financial Modeling, Budgeting, & Allocations
• Financial Reporting
• Payroll
• Payroll Time Billing
• Human Resources Management
• Equipment Management
• Inventory Management
• Sales Order Processing/Sales Analysis (returned for credit)

• Purchase Order Processing
• Job Cost Accounting
• Contract Management
• Product Data Management
• Shop Floor Control (returned for credit)
• PEIMS Module
• TRS Module
All of the modules have been implemented except the Payroll and Human Resources Management modules. The SASI system provides campuses with student demographic information, attendance and progress information, scheduling and course information, and other administrative data tracked by the district. An analysis conducted by IBM showed that the current AS/400 runs at full capacity at most times. The study showed that the current processor was inadequate and that greater memory and storage capacity were needed. IBM's study recommended additional capacity to reduce capacity usage to below 80 percent. The situation has gotten worse since IBM conducted its study. The Division of Technology has connected all of the campuses to the finance system on the AS/400, which puts an additional load on the processors. Recommendation 96: Upgrade or replace the district's AS/400 to include a faster processor, more memory, and more storage capacity. The upgrade should allow the district staff to gain timely access to financial and student information. YISD has invested significantly in the applications running on the AS/400 and needs to upgrade the processor and memory to meet its current and future needs. The district's initiated the RFP process following an initial recommendation from the review team, and the board approved the purchase of a new AS/400 at the March board meeting. IMPLEMENTATION STRATEGIES AND TIMELINE

1. The executive director of Technology and Information Systems and the coordinators for SASI, Finance, and Operations discuss the IBM recommendations and evaluate the future needs of the district.
Completed
2. The executive director of Technology and Information Systems and the coordinators for SASI, Finance, and Operations review the Finance System upgrade and processing requirements.
Completed
3. The executive director of Technology and Information Systems and the coordinators for SASI, Finance, and Operations compare the current district needs to the Strategic Information Systems and Technology Plan.
Completed
4. The executive director of Technology and Information Systems and the coordinators for SASI, Finance, and Operations determine the district's current and future processing and scheduling requirements and decide on the upgrade specifications.
Completed
5. The executive director of Technology and Information Systems presents the recommendation to the superintendent and board for approval.
March 1998
6. The district purchases the approved equipment. The executive director of Technology and Information Systems oversees the installation.
April 1998
7. The executive director of Technology and Information Systems and the coordinators for SASI, Finance, and Operations monitor the use of the upgraded equipment and anticipate future upgrades.
April 1998 and ongoing
FISCAL IMPACT Based on preliminary numbers provided by IBM and current and projected use of the system as of April 1997, the hardware, software, and transition costs are estimated at $250,000.
Recommendation 1998-99 1999-2000 2000-01 2001-02 2002-03
Upgrade or replace the AS/400. ($250,000) $0 $0 $0 $0
FINDING As noted throughout this report, implementation of the integrated finance and accounting system, purchased in October 1994, has been only partially successful. YISD has had trouble fully implementing the finance system and, based on interviews with district personnel in the Finance and MIS departments, this is a major technology issue facing the district. For example, the payroll module has not been implemented and, consequently,

neither have the human resources management or position control system modules. The district has learned that the finance system's payroll module would not meet its needs without significant modifications. Specifically, the system was not designed to handle the complexities of a school district's payroll, including staff with multiple positions and pay rates and stipends for additional duties accepted by district staff. As a result, the district is using an IDI payroll system while the current vendor develops a replacement payroll module. YISD has developed an interface with the finance system so that payroll information from the IDI system can be electronically loaded into the general ledger. YISD signed its contract with the assumption that the vendor could develop a workable payroll module. YISD and the vendor's support personnel continue to work on resolving this issue. The district has defined specifications, installed and tested several versions, and currently awaits another revision for testing. Problems surrounding the finance system include the following:
• The vendor had minimal public-sector and school district experience and its software was designed primarily for manufacturing businesses. The finance system selected had been used in only one other public school at the time of the selection, and that district was in another state.
• State requirements for Texas school districts including PEIMS data submissions and complex payroll requirements were not available on the system.
• A third-party project manager was not used to manage and oversee the implementation of the finance system.
• User training has been inconsistent within YISD departments. Few users have the knowledge needed to query the system and generate ad hoc reports.
• Vendor support has not met expectations. While vendor personnel are knowledgeable about specific modules, they do not know how the individual modules integrate and interface.
• Provisions for accountability were not built into the vendor's contract. The original contract for the software did not link performance to payment.
• Timelines for full implementation have not been established. The original contract did not contain dates for the development of modules such as payroll. Nor has the vendor provided the district with an accurate timeframe for completion of the required modules; moreover, the district paid for these modules even though they have not been developed.

Finance personnel also told the review team that the following software limitations hamper the accounting process and weaken the internal control environment:
• Although the district has been converting its computer systems since 1994, all processes still have not been fully integrated. The payroll and personnel systems are an example.
• The system, which runs on the district's IBM AS/400, is very slow. For example, it sometimes takes days to generate a report from the system. District personnel said this is a hardware problem caused by underestimates of size requirements made by the software vendor.
• The system cannot handle split- funded purchase orders. For example, if two departments jointly purchase a printer, the system will not allocate the purchase order between the departments. One department bears the full cost; a manual journal voucher must be prepared to allocate a portion of the cost to the other department.
• The system allows school personnel to order items from the warehouse without providing an account code. District accounting staff must call individual schools to ask for missing codes.
• The system's report writing and query capabilities are not user friendly. The MIS Department has to write reports that should be easily produced by Accounting Department personnel. For example, an alphabetical listing of vendors and the amounts they were paid over a given time period could not be readily produced without the assistance of MIS.
• The check register does not show account distribution. This is an important feature because it allows Accounting Department personnel to determine how funds are allocated among various general ledger accounts.
District accounting personnel also said that inadequate training and technical support from the vendor has frustrated efforts to correct these problems. Recommendation 97: Develop a comprehensive strategy to evaluate whether the implementation of the district's integrated financial system can be completed; if not, seek another system that better meets YISD's needs. The district should develop a strategy to address problems associated with the current computer software system. YISD should either undertake an internal assessment of its current finance system and determine how to complete the implementation, or select

another integrated financial system software package that better meets its needs. This assessment should be completed within the next few months and a decision made on whether to complete the implementation or begin the process of selecting an alternative system. If a decision is made to complete the implementation of the existing finance system, the district must develop a payroll module to meet the district's needs. The district bought the payroll module with the understanding that the vendor would develop a payroll module to meet its requirements. The district should hold the vendor to its contractual obligation. Additionally, the district should work with the vendor to address technical support concerns related to its software product. Finally, the district should develop performance measures that must be met before the annual service agreement is renewed. Options to consider and evaluate as the district develops its strategy include:
• completing the implementation of all purchased modules;
• developing custom modules and interfaces to the Finance System as an alternative to the system's current deficiencies;
• selecting a new system;
• developing a timeline for completion of the implementation, with interim milestones to be reached;
• retaining a project manager to oversee the project;
• identifying vendor support requirements, including response time provisions, and
• establishing a training program for users including ad hoc reporting.
IMPLEMENTATION STRATEGIES AND TIMELINE
1. The executive director of Technology and Information Systems forms a committee including the Payroll manager, Human Resources director, Budget director, and chief financial officer to assess the current finance system. The assessment includes determining user needs, system deficiencies, and options for completing the implementation.
June 1998
2. The committee reviews the district's contract with the vendor to ascertain the vendor's and the district's obligations and the remedies available.
June 1998

3. The committee develops a strategy to either complete the implementation or select and purchase a new system. The strategy includes developing a plan with performance measures, deadlines, consequences for noncompliance, support and training requirements, and an estimated timetable for selecting and purchasing a new system, if required.
July 1998
4. The committee presents the plan to the superintendent for approval. August 1998
5. The committee implements the plan, monitors compliance with the plan by the vendor, and completes implementation of the finance system. Or the committee recommends an alternative system be selected and the district begins the process of selecting, purchasing, and implementing another system.
August 1998 to completion of selection
FISCAL IMPACT No additional funds are necessary to determine the district's course of action. However, if the decision is made to select new integrated finance system software, the district may incur additional expenses for the purchase of another system.

Chapter 9 COMPUTERS AND TECHNOLOGY
B. Network/Connectivity CURRENT SITUATION The YISD Network YISD's network is a system of interconnected computers, printers, servers, and communication devices that allow campuses to share resources and communicate with each other. The network electronically connects all of the district's schools with the central office, warehouse, and other locations. By connecting all locations, the district makes better use of its software resources and gives students and faculty access to those resources. More information and sources can be incorporated into the curriculum and students become better computer and network users. YISD's network, as indicated above, is a wide-area network that ties together several dozen local area networks. The YISD WAN connects more than 45,000 users, providing them with access to everything from instructional software to library systems to administrative systems (such as SASI and the finance system) to various productivity software (word processors, spreadsheets, databases, etc.). When complete, the WAN will provide every campus with connections to the SASI and financial systems; connection to the Internet; and connections that will link the campus networks (LANs) within the district. Each LAN that is a part of the WAN resides in a relatively restricted area, for example a campus, technology dome, library, or classroom.
• The district has tried to connect as many of its LANs as possible to maximize the network's effectiveness. It may not make sense to attempt to connect every preexisting LAN because of the age and type of equipment involved; however, connecting as many as possible is a district goal. Each campus may have a number of LANs, each with a specific function.
Campus Main Distribution Facility

The main distribution facility (called the MDF or Comm Room) is the central control point for all campus telecommunications equipment. This facility is located at the district's central administration building and has the communication facilities and equipment that create campus LANs. These facilities and equipment include the T1 connection from Southwestern Bell, a router to control computer traffic a large hub to connect all the computers and other equipment, and at least one server. The server is used for the SASI system. LAN Cabling The cabling for the campuses-the physical connections needed to establish the network- is being completed in two phases. The goal of the first phase was to establish T1 connections between the campuses and the central office, to cable as many of the administrative areas as possible (principals, assistant principals, attendance and scheduling clerks, budget clerks, etc.), and to cable some of the instructional rooms (classrooms, libraries, or technology centers). The goal of the second phase of the cabling project is to connect the remainder of each campus of the network, including each of the classrooms. Classroom Connectivity Campus and administrative connections, called composite and dual drops, have been installed throughout the district. Composite drops are the connections installed in all district classrooms. The composite drops are Category 5 cables that provide voice/data/video connections, and include an additional two strands of fiber, giving the district the flexibility to use fiber applications when they become available on a cost-effective basis. These composite connections provide capability for a telephone in every classroom, for access to the network data services (library, Internet, and other instructional software), and for video applications. Dual drops are the connections provided for administrative work areas. These connections also are Category 5 cable, with the capability to deliver voice/data. The dual drops, however, do not include fiber connections. The dual drops allow the user to be connected to the SASI or financial systems, to have a phone connection, and to connect to outside and campus networks (Internet, etc.). Campus Connectivity and Bandwidth Each of the campuses is connected to departments in YISD's central

office. This allows the communication from individual campuses to the central office and establishes connections between campuses. The connections established via YISD's WAN will allow campuses to link to each other, to establish collaborative classrooms, and to engage in many other useful instructional and administrative collaborations. With the installation of the new telephone master switch at the central office, the campuses will be able to use four-digit intercampus dialing and other features (homework hotlines, voice mail, etc.). The Internet and the entire current networking environment have been called the information superhighway. If the networking environment is the superhighway, then bandwidth provides the lanes for the highway. The T1s provide 1.54 Mega bits of capacity for each campus which will allow for fast internet access and access to applications on the wide area network.. FINDING YISD has made a significant investment in its network and communications infrastructure. The district is in the final year of an ambitious technology plan involving an investment of $73 million in upgrades to its computer infrastructure. As part of this plan, the district has connected each campus to the central administration building with a T1 line and pulled two strands of fiber optic cable and three category 5 cables to each classroom within every campus. This infrastructure will support the district's foreseeable network and communications needs, providing for the transmission of voice, video, and data transmission. COMMENDATION The district has established the network infrastructure (a high-speed WAN and campus LANs) to meet its current and future connectivity needs . FINDING The district has allocated significant resources to creating a WAN capable of supporting the district's network and communications needs for the foreseeable future. However, the district has not provided Internet access to all campuses. At this writing, the district provides Internet access over the WAN to seven schools and plans to have four more connected by the end of March 1998. The Division of Technology plans to provide all schools with an initial Internet connection (for up to 25 machines each) by the end of 1998.

The district plans to serve as its own Internet service provider. The district has completed a direct connection between YISD and UT-Austin for Internet access. This connection significantly enhances the district's available bandwidth for Internet access. Other avenues for further enhancement of the district's bandwidth needs include Region XIX and an increased connection with UTEP. The cost for the connection to UT is estimated at $2,000 per month. While planned for, district staff expressed doubt that everything could be accomplished with the limited resources of the department. Recommendation 98: Complete the implementation of Internet access to all campuses and central administration. The district needs to complete its implementation of Internet access to all campuses by:
• acquiring a proxy server to provide internet addresses for district staff and students.
• assigning Internet protocol (IP) addresses to district staff and students who will be given access to the Internet.
• acquiring a filter/firewall to prevent access to district systems by unauthorized personnel and to limit district staff and students' ability to view objectionable material.
• training staff and students on the use of the Internet.
IMPLEMENTATION STRATEGIES AND TIMELINE
1. The executive director of Technology and Information Systems completes negotiations with the University of Texas to provide Internet connectivity.
Completed
2. The Network Section of the MIS Department and Telecommunications Department purchases, installs, and sets up the proxy server and the filter/firewall.
June 1998 - August 1998
3. The Telecommunications and Instructional Media Technology Departments develop a plan to assign IP addresses to staff and students.
June 1998
4. The Telecommunications Department assigns IP addresses to staff and students; the Instructional Media Technology Department develops a training plan for Internet use.
July 1998 - August 1998

5. District staff are trained on Internet use. September 1998 and ongoing
FISCAL IMPACT Providing Internet access to district campuses would require an estimated recurring cost of $4,000 per month for the trunk line (T1) to UT-Austin and the corresponding support. Furthermore, the district would incur an additional cost for the initial setup, including a proxy server and a firewall/filter to eliminate objectionable material and unauthorized access to the district's network. Both Microsoft and Netscape provide free Internet browsers to school districts.
Recommendation 1998-99 1999-2000 2000-01 2001-02 2002-03
Complete the implementation of Internet access.
($100,000) ($50,000) ($50,000) ($50,000) ($50,000)
FINDING YISD's network infrastructure can support a districtwide phone system that allows four-digit dialing and voice mail for all district staff and

phones in all classrooms. The major cost involved is a switch to connect the central phone system to the schools. The switch allows the conversion of voice communications from the phone service provider to the district's network. Savings would result from reduced cost to the district for phone circuits currently being leased, reduced cost for long distance service based on economies of scale, and reduced maintenance costs. The district has estimated its cost to provide phone service, voice mail, and dial tones to all district locations at $3.9 million. The district already has trunk lines running from the central office to all campuses. This system will support the foundation for phone service. The major cost involved is the purchase of an SL100 switch to direct and route phone calls. The costs for all other related costs will be evaluated for funding by the Universal Service Fund program, which was created as part of the Federal Telecommunications Act of 1996 and provides for a reimbursement of up to 80 percent of school district expenditures associated with telecommunications infrastructure and service. The reimbursement is based on the percentage of low-income students enrolled in a district. This switch is estimated to cost $1.2 million and is not eligible for federal reimbursement. However, the district is exploring other initiatives and alternatives for funding. Currently the district spends $45,000 per month in phone circuit costs or $540,000 per year, and $35,000 per month in phone maintenance costs or $420,000 per year. While the district has discussed this project, they have not aggressively moved forward with implementation. Recommendation 99: Use the current network infrastructure to provide phone service, voice mail, and dial-tone access to all campuses and district facilities. This is a project that would provide significant benefits to the district through increased contact between teachers and parents and increased communication among district staff. YISD can use its current infrastructure to provide phone service to all campuses and other buildings. The district should acquire a phone switch to direct calls, a voice-mail system and the necessary handsets. The individual campuses are already wired and classrooms have phone jacks. A phone in each classroom can be a valuable tool for district personnel, and will facilitate enhanced communication between teachers and parents.

The district could eliminate the circuit cost ($540,000/year) by installing a centralized phone system which would allow the district to become the phone service provider to the individual campuses. Additionally, the district can qualify for an 80 percent discount or reimbursement ($340,000/year) of maintenance costs from the Universal Service Fund. IMPLEMENTATION STRATEGIES AND TIMELINE
1. The Division of Technology develops an implementation plan with detailed cost estimates. January 1999
2. The executive director of Technology and Information Services purchases the SL100 switch, voice-mail system, and the handsets.
March 1999 - May 1999
3. The Telecommunications Department oversees the installation of the switch and voice-mail system; the handsets are delivered and set up in classrooms on the campuses and in other district facilities.
June 1999 - July 1999
4. The Telecommunications Department tests the district's phone system and voice-mail system.
August 1999
5. The Telecommunications Department maintains the phone systems and distributes instructions on usage.
September 1999 and ongoing
FISCAL IMPACT The following estimate is based on current equipment and assumptions associated with the Universal Service Fund. The fiscal impact chart shows the initial cost offset by savings from current monthly phone charges and discounted support cost given an 80 percent discount rate based on its current percentage of low-income students. The estimated savings would pay for the system within five years.

Recommendation 1998-99 1999-2000 2000-01 2001-02 2002-03
Internal telephone service, voice mail and dial tone to all district locations
($3,860,000) $0 $0 $0 $0
Savings over current cost to provide phone service to campuses
$540,000 $540,000 $540,000 $540,000 $540,000
Savings on support for campus network (80 percent reimbursement by the Universal Service Fund)
$340,000 $340,000 $340,000 $340,000 $340,000
Net Savings (Cost) ($2,980,000) $880,000 $880,000 $880,000 $880,000

Chapter 9 COMPUTERS AND TECHNOLOGY
C. Instructional Technology CURRENT SITUATION Under site-based management, YISD's principals control the budget for their campuses and decide how to allocate resources. Principals control almost all school-based expenditures with the exception of certain services such as maintenance, transportation, and food service, which are billed back to the campuses by the central office. Since each campus sets its own priorities and makes its own decisions, the application and integration of technology into the classroom varies significantly from campus to campus. FINDING In July, YISD hired a new executive director of Technology and Information Services. The director has a telecommunications background and is very familiar with the technology and its systems. The executive director makes weekly site visits to district schools to discuss their use of technology and potential improvements and enhancements that can be made to benefit the schools and their students. COMMENDATION Through weekly site visits to district campuses, the executive director of Technology and Information Services gains a better understanding of the needs of the individual schools and his understanding of school district and individual school operations. FINDING YISD has focused its technology initiatives on the acquisition of hardware, software, and connectivity infrastructure and has made significant progress in this area. The District Improvement Plan focuses on acquisition and does not mention integration of technology into the delivery of classroom instruction, or accountability for the district's investment in computer and telecommunications systems. Yet YISD estimates that only 10-20 percent of its teachers have enough computer knowledge and experience to effectively integrate computers into their classrooms. Minimum technological standards for schools, classrooms, and teachers normally address equipment, training, and teaching standards. Equipment standards typically address the platforms the district uses. YISD's computers

have been acquired over the last 10 years and are either IBM-compatible/Intel-based machines or Apple Macintoshes. Many of these computers do not support current software applications. Equipment standards address minimum standards for district computers and for classroom configurations depending on curriculum and grade. For example, certain instructional programs require a given amount of memory or processing capability for the programs to run properly. A typical benefit of greater standardization of equipment is reduced maintenance and support costs. Training standards provide for the training of teachers in the use of computers and the network and the software applications available. Training standards also promote the use of technology in the curriculum and the delivery of instructional materials. Teaching standards provide a means of evaluating the effectiveness of classroom technology. Furthermore, these standards provide a means of accountability for the district's investment in computers and telecommunications technology. Recommendation 100: The district should set minimum standards for the integration of technology into the instruction of students. IMPLEMENTATION STRATEGIES AND TIMELINE
1. The Instructional Media Technology coordinator conducts a skills assessment of YISD's instructional staff to determine their knowledge of teaching technology and their needs.
June 1998 - August 1998
2. The coordinator works with the assistant superintendent for Curriculum to assess the equipment needed to adapt computer and telecommunications technology to the classroom.
June 1998 - August 1998
3. The coordinator analyzes the results of this assessment and develops draft instructional technology and professional development standards for that prioritizes training needs, establishes a schedule for training, and quantifies goals and objectives.
September 1998 - October 1998
4. The coordinator presents the draft to the Technology Steering Committee, the assistant superintendent for Curriculum, and the director of Staff Development for comment and approval.
November 1998 - December 1998
FISCAL IMPACT This recommendation can be implemented with existing resources. FINDING
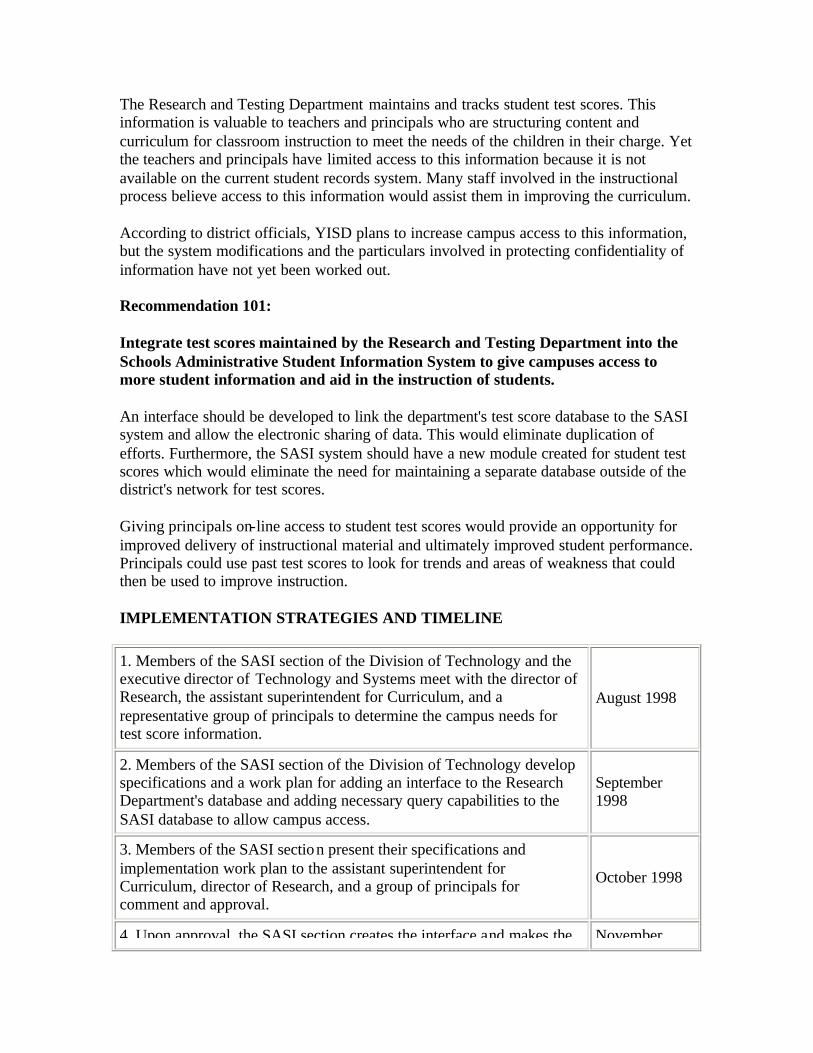
The Research and Testing Department maintains and tracks student test scores. This information is valuable to teachers and principals who are structuring content and curriculum for classroom instruction to meet the needs of the children in their charge. Yet the teachers and principals have limited access to this information because it is not available on the current student records system. Many staff involved in the instructional process believe access to this information would assist them in improving the curriculum. According to district officials, YISD plans to increase campus access to this information, but the system modifications and the particulars involved in protecting confidentiality of information have not yet been worked out. Recommendation 101: Integrate test scores maintained by the Research and Testing Department into the Schools Administrative Student Information System to give campuses access to more student information and aid in the instruction of students. An interface should be developed to link the department's test score database to the SASI system and allow the electronic sharing of data. This would eliminate duplication of efforts. Furthermore, the SASI system should have a new module created for student test scores which would eliminate the need for maintaining a separate database outside of the district's network for test scores. Giving principals on-line access to student test scores would provide an opportunity for improved delivery of instructional material and ultimately improved student performance. Principals could use past test scores to look for trends and areas of weakness that could then be used to improve instruction. IMPLEMENTATION STRATEGIES AND TIMELINE
1. Members of the SASI section of the Division of Technology and the executive director of Technology and Systems meet with the director of Research, the assistant superintendent for Curriculum, and a representative group of principals to determine the campus needs for test score information.
August 1998
2. Members of the SASI section of the Division of Technology develop specifications and a work plan for adding an interface to the Research Department's database and adding necessary query capabilities to the SASI database to allow campus access.
September 1998
3. Members of the SASI section present their specifications and implementation work plan to the assistant superintendent for Curriculum, director of Research, and a group of principals for comment and approval.
October 1998
4. Upon approval, the SASI section creates the interface and makes the November

necessary modifications to the SASI system to give campuses access to test scores.
1998 - December 1998
5. The SASI section of the Division of Technology and a representative group of campuses test the interface.
January 1999 - May 1999
6. The SASI section of the Division of Technology makes a presentation to the principals and assistant principals on the new feature of the SASI systems and teaches them how to use it.
August 1999
FISCAL IMPACT This project should involve no additional cost to the district.

Chapter 10 TRANSPORTATION
This chapter reviews YISD's transportation functions in six sections:
A. District Transportation Reporting and Recordkeeping
B. Organization and Staffing
C. Management Policies
D. Routing and Scheduling
E. Fleet Maintenance
F. Opportunities for Shared Services
BACKGROUND The Texas Education Code (TEC) authorizes, but does not require, each Texas school district to provide transportation between home and school, from school to career and technology training locations, for cocurricular activities, and for extracurricular activities. The Federal Individua ls with Disabilities Education Act (IDEA) requires a school district to provide transportation for students with disabilities if the district also provides transportation for the general student population or if disabled students require transportation to receive special education services. The TEC also states that a school district may receive state funding for transporting regular and special program students between home and school and career and technology students to and from vocational training locations. The funding rules are set by the Texas Education Agency (TEA). Local funds must pay for transportation costs that the state does not cover. For the regular transportation program, TEA reimburses qualifying transportation expenses according to a prescribed formula that is based on linear density, the ratio of the average number of regular program students transported daily to the number of miles driven daily. TEA uses this ratio to assign each school district to one of seven groups, with each group receiving a different per-mile reimbursement. TEA reevaluates group assignments each biennium. To assign groups and funding for the next biennium, TEA calculates linear density using operational data from the first school year of the previous biennium.

During the 1995-96 and 1996-97 school years, YISD was in Group VII, the highest reimbursement group. Group VII includes districts with linear densities of 2.40 or higher, which qualifies them to receive a reimbursement of $1.43 a mile for regular program transportation, compared to an actual cost of $2.61 a mile in 1996-97. YISD will remain in Group VII in the 1997-98 school year, based on its operational data for 1995-96. State funding for regular program transportation is limited to transportation for students who live two or more miles from the school they attend. The state does not reimburse districts for students living within two miles of their school unless they face hazardous walking conditions on the way to school. All transportation for special program students, except certain field trips, is eligible for state reimbursement. The Legislature has set a rate of $1.08 a mile for reimbursements for special program transportation. This reimbursement compares to YISD's actual cost of $2.60 a mile for special program transportation in 1996-97. Career and technology education transportation costs are reimbursed based on the previous year's actual cost per mile for regular program transportation. In 1996-97, YISD received a reimbursement from the state of $4.63 a mile for career and technology transportation. This figure is high because YISD did not appropriately track and therefore undercounted the miles that their buses operated. Cocurricular trips take students to activities that are considered part of the student's required curriculum. Cocurricular trips are regularly scheduled and usually take place during school hours, but they may not run every day. The state does not provide funding for these routes. Extracurricular transportation takes students to after-school and weekend events. Extracurricular transportation consists largely of transportation to and from athletic events. No state funding is provided for extracurricular transportation. Each school district is responsible for the capital cost of purchasing school buses. Districts may purchase school buses through the state's General Services Commission (GSC) under a state contract. Districts also may use a lease-purchase method to obtain buses. In 1995-96, YISD purchased three buses from a vendor, and did not use the GSC contract. TEA's School Transportation Operations Reports provide a four-year history of each transportation service's cost and mileage. These reports are intended to track all costs and mileage related to transportation, includ ing

services not funded by the state. TEA's School Transportation Route Services Report provides ridership information for state-funded routes only. Previously this report recorded both the average number of students riding the bus daily and the yearly total number of students riding the buses, but in 1995-96 the report stopped recording yearly rider totals. In order to perform trend analysis, TSPR took annual ridership figures from 1993-94 and 1994-95 from the TEA reports. Yearly rider totals from 1995-96 and 1996-97 were calculated by multiplying regular school year riders by 180 days and summer school riders by 55 days. Exhibit 10-1 shows the results of this trend analysis for cost, miles, and riders. Since 1993-94, YISD's total costs increased by 7 percent, total miles increased by 6 percent, and ridership fell by 15 percent. For the regular program, costs increased 8 percent, miles increased by 42 percent, and ridership fell by 17 percent.
Exhibit 10-1 YISD Regular and Special Program Transportation Operation Costs
1993-94 through 1996-97 School Years
Item 1993-94 1994-95 1995-96 1996-97 Percent Change
Total Operating and Capital Costs
Regular Program $2,125,208 $2,713,368 $2,693,289 $2,294,584 8%
Special Program $2,071,743 $1,912,171 $2,129,584 $2,202,398 6%
Total $4,196,951 $4,625,539 $4,822,873 $4,496,982 7%
Annual Miles
Regular Program 619,018 545,716 582,163 878,810 42%
Special Program 1,010,994 862,599 828,239 846,969 -16%
Total 1,630,012 1,408,315 1,410,402 1,725,779 6%
Annual Riders
Regular Program 1,479,560 1,259,100 *1,242,900 *1,221,025 -17%
Special Program 178,008 169,936 *201,600 *186,660 5%
Total 1,657,568 1,429,036 *1,444,500 *1,407,685 -15%

Sources: TEA School Transportation Operation Report, 1993-97; and TEA School Transportation Route Services Report 1993-97. * Calculated as described in the preceding to paragraph. Exhibit 10-2 shows the performance change over the past four years. YISD's cost per mile increased 2 percent and cost per rider increased 26 percent. The increase is more pronounced for regular program service. The regular program cost per mile fell by 24 percent and the cost per rider increased 31 percent.
Exhibit 10-2 Cost and Ridership Performance Measures
1993-94 through 1996-97
Item 1993-94 1994-95 1995-96 1996-97 Percent Change
Cost per Mile
Regular Program $3.43 $4.97 $4.63 $2.61 -24%
Special Program $2.05 $2.22 $2.57 $2.60 27%
Average Weight Cost $2.57 $3.28 $3.42 $2.61 2%
Cost per Rider
Regular Program $1.44 $2.16 $2.17 $1.88 31%
Special Program $11.64 $11.25 $10.56 $11.80 1%
Average Weight Cost $2.53 $3.24 $3.34 $3.19 26%
Sources: Sources: TEA School Transportation Operation Report, 1993-97; and TEA School Transportation Route Services Report, 1993-96. Exhibit 10-3 details YISD's transportation costs over four years by object

of expenditure. The district's total annual costs increased by $300,031 during this period. Salaries and benefits accounted for $177,477 of the increase, while supplies and materials accounted for $97,991.
Exhibit 10-3 YISD Transportation Costs by Type of Expenditure
1993-94 through 1996-97 School Years
Object 1993-94 1994-95 1995-96 1996-97 Percent Change
Salaries and Benefits
$3,444,818 $3,706,819 $3,915,320 $3,622,295 5%
Purchased and Contracted Services
$82,659 $118,672 $129,837 $138,829 68%
Supplies and Materials
$328,593 $424,630 $462,183 $426,584 30%
Other Operating Expenses $98,944 $103,156 $105,893 $58,230 -41%
Total Operating Expenses $3,955,014 $4,353,277 $4,613,233 $4,245,938 7%
Capital Outlay $241,937 $272,262 $209,640 $251,044 4%
Total Operating and Capital Costs $4,196,951 $4,625,539 $4,822,873 $4,496,982 7%
Source: TEA School Transportation Operation Reports, 1993-97. YISD receives state funding for four categories of services: regular two-mile eligible; regular service to hazardous areas; special education; and career and technology. Exhibit 10-4 shows the level of state funding over the last four school years. Total annual funding increased by 19 percent.
Exhibit 10-4 YISD State Funding
1993-94 Through 1996-97

Funding 1993-94 1994-95 1995-96 1996-97 Percent Change
Two-Mile Regular Program $540,438 $489,810 $465,688 $789,188 46%
Hazardous Areas $54,044 $45,378 $0 $0 -100%
Special Program $803,064 $656,207 $622,879 $714,360 -11%
Career and Technical
$108,257 $168,265 $316,711 $294,672 172%
Total $1,505,803 $1,359,660 1,405,278 $1,798,220 19%
Source: TEA School Transportation Route Services Reports, 1993-97.

Chapter 10
District Transportation Reporting and Recordkeeping A. District Transportation Reporting and Recordkeeping CURRENT SITUATION YISD is required to submit two annual transportation reports to TEA's School Transportation Unit. Form ST-01, the "School Transportation Operation Report", records information on costs, mileage, vehicle inventory, and other miscellaneous information. Form ST-002, the "School Transportation Route Services Report", records information on mileage and ridership. These reports are used to determine state funding levels and district performance. The Operation Report is designed to capture all costs and all mileage operated for any transportation purpose during the preceding fiscal year. Costs are tracked based on the state's Public Education Information Management System (PEIMS). PEIMS allocates costs by function:
• Student Transportation
• Cocuricular/Extracurricular Activities
• Debt Service
These function costs are recorded by object as shown in Exhibit 10-3. School districts report their transportation cost using these function and object categories. A key piece of information in the Operations Report is mileage data that is designed to capture all mileage traveled in vehicles for student transportation, whether eligible for state funding or not. All reported mileage should be derived from beginning and ending vehicle odometer or hubodometer readings." All vehicles should have their odometer readings checked at the start of the fiscal year. Each district allocates the costs and miles to the "regular program" and the "special program." As defined in the Operation Report, all costs and mileage are assigned to one of these two categories. Allocation should be based on the amount of time worked, number of miles traveled, or number of vehicles. The Operation Report, which is the sole source of all mileage and cost information as shown in Exhibits 10-1 through 10-3 is used to determine the cost per mile for the regular program and also sets the reimbursement rate for the career and technology

service in the following year. The second TEA report, the Route Services Report, is designed to gather the data needed to determine the level of state funding for school districts' regular and special program transportation. The report only reflects annual mileage on service eligible for state funding. The mileage on the Route Service Report is divided among four programs: regular, special, career and technology, and private. Each program receives funding based on different state reimbursement rates. For the special program and career and technology program, state fund ing is a per-mile amount applied to the total miles reported for these programs. For the regular program, however, the funding amount is based on the linear density measure described in the Background section. The private program is very small and applies only to students living in isolated locations. In these cases, the parents transport their children in their own vehicles and receive funding directly from the state. YISD does not currently have any students participating in a private program. The Route Services Report records ridership data on an average daily basis. Vehicle mileage is recorded on an annual basis. FINDING TSPR found from reviewing School Transportation Operation reports and School Transportation Route Service reports from YISD, the district has been underreporting miles and miscounting riders which has resulted in a loss of state transportation funding which they are entitled. TSPR assessed YISD's performance and the reasonableness of its reported data by comparing the district's cost statistics to a peer group of Texas school districts (Exhibit 10-5). The data from 1995-96 were used since it is the latest available information for the peer group. The peer districts and YISD transport similar numbers of regular program students daily and provide similar miles of service. All peers are either in the same linear density group as YISD or in the group below. The cost per mile reflects total annual costs, including capital, divided by all annual miles operated. Cost per rider reflects total cost divided by annual route riders and does not include extracurricular riders since these data are unavailable for peer districts. Cost per bus is the total reported transportation costs divided by the total fleet.
Exhibit 10-5 YISD and Peer ISD Cost Statistics
1995-96
Regular Program Special Program
District Cost/ Mile
Cost/ Rider
Cost/ Bus
Cost/ Mile
Cost/ Rider Cost/ Bus

Pharr/San Juan/Alamo $1.43 $1.22 $27,715 $1.64 $11.19 $30,477
Humble $1.57 $1.45 $19,076 $1.62 $11.36 $23,481
Midland $1.63 $1.62 $21,553 $1.59 $10.91 $26,693
El Paso $2.45 $2.58 $20,148 $4.16 $15.85 $72,352
McAllen $2.02 $1.48 $24,979 $1.80 $12.51 $28,445
Socorro $2.14 $1.65 $25,375 $2.77 $11.61 $24,367
Weighted Peer Average $1.83 $1.67 $22,148 $2.90 $14.03 $44,997
Ysleta $4.63 $2.17 $32,845 $2.57 $10.56 $23,928
% Different from Average 152% 30% 48% -11% 25% -47%
Sources: TEA School Transportation Operation Report, 1995-96; TEA School Transportation Route Services Report 1995-96; and information supplied by the Socorro ISD Transportation Department. At 152 percent higher than the peer average, Ysleta's cost per mile for the regular program is the highest of all its peer districts. The district's cost per rider is higher than all peers except El Paso and 30 percent higher than the peer average. Its annual cost per bus is the highest for all peer districts and 48 percent higher than the peer average. For the special program, Ysleta's cost per mile is 11 percent lower than the peer average; the cost per rider is 25 percent lower; and the cost per bus is 47 percent lower. El Paso has significantly higher special education costs; excluding EPISD from the special education peers produces an average cost per mile of $1.83, a cost per rider of $11.50, and a cost per bus of $26,031. Compared to these adjusted peer averages, Ysleta's cost per mile is 40 percent higher, its cost per rider is 8 percent lower, and its cost per bus is 8 percent lower. Exhibit 10-6 compares YISD's service performance with that of its peer districts.
Exhibit 10-6 Service Indicators
YISD versus Peer Districts 1995-96 School Year
Regular Program Special Program
District
Riders/ Mile
Riders/ Bus
Miles/ Bus
Riders/ Mile
Riders/ Bus
Miles/ Bus
El Paso 1.0 7,812 8,233 0.3 4,566 17,395
Midland 1.0 13,296 13,232 0.2 2,447 16,839

Humble 1.1 13,138 12,163 0.1 2,068 14,458
Pharr/San Juan/Alamo 1.2 22,647 19,388 0.2 2,723 18,548
Socorro 1.3 15,417 11,883 0.2 2,099 8,781
McAllen 1.4 16,876 12,385 0.1 2,273 15,791
Weighted Peer Average 1.1 13,279 12,070 0.2 3,206 15,511
Ysleta 2.1 15,157 7,100 0.2 2,265 9,306
% Different from Average 94% 14% -41% 14% 29% -40%
Sources: TEA School Transportation Operation Report, 1995-96; TEA School Transportation Route Services Report 1995-96; and information supplied by the Socorro ISD Transportation Department. For regular program service, Ysleta's riders per mile figure is the highest of all peer districts and 94 percent higher than the peer average. Ysleta's riders per bus measure is comparable to its peers and 18 percent higher than the peer average. Ysleta's miles per bus rank lowest of all its peers and 41 percent lower than the peer average. For special program service, Ysleta's riders per mile measure is comparable to peer districts and 14 percent higher than the peer average. Ysleta's riders per bus falls below most peer districts, with only Humble and Socorro carrying fewer riders per bus. YISD's overall performance is 29 percent lower than the peer average. Excluding Socorro, YISD's miles per bus ratio is lower than for all peer districts and 40 percent lower than the peer average. Exhibit 10-7 presents summary information combining the regular and special program categories.
Exhibit 10-7 YISD and Peer ISD System Statistics
1995-96 School year
District Cost/ Mile
Cost/ Rider
Cost/ Bus
Riders/ Mile
Rider/ Bus
Miles/ Bus
Pharr/San Juan/Alamo $1.46 $1.47 $28,190 1.0 19,219 19,244
Humble $1.58 $1.95 $20,193 0.8 10,333 12,744
Midland $1.62 $2.05 $22,621 0.8 11,042 13,982
McAllen $1.93 $2.27 $26,244 0.9 11,548 13,628
Socorro $2.32 $2.35 $25,014 1.0 10,642 10,771
El Paso $3.37 $5.83 $38,805 0.6 6,652 11,507

Weighted Peer Average $2.21 $2.80 $28,865 0.8 10,318 13,081
Ysleta $3.42 $3.34 $28,204 1.0 8,447 8,248
% Different from Average 55% 19% -2% 29% -18% -35%
Sources: TEA School Transportation Operation Report, 1995-96; TEA School Transportation Route Services Report 1995-96; and information supplied by the Socorro ISD Transportation Department. On these three exhibits, the indicators with the greatest difference are those involving mileage. Compared to the peer average, YISD's regular program cost per mile is 152 percent higher (Exhibit 10-5), and its regular program riders per mile measure is 94 percent higher (Exhibit 10-6). The district's total cost per mile is 55 percent higher than the peer average (Exhibit 10-7), while its regular program miles per bus measure is 41 percent lower (Exhibit 10-6), and its special program miles per bus is 40 percent lower (Exhibit 10-6). These results imply an undercounting of miles. This conclusion is supported by the regular program route mileage, which remained constant from 1994-95 to 1995-96. The district's reported mileage was 400,656 for both years. As this performance review was being prepared, data for 1996-97 became available. For 1996-97, regular program mileage increased to 690,579 or 72 percent. The "other" mileage, however, remained constant. YISD's director of Transportation said that the district does not use odometer/hubodometer readings for the purposes of TEA reporting. He also said that they do record odometer/hubodometer readings on a monthly basis. Based on these two comments, the actual miles may or may not be reported to TEA and properly allocated to the subprograms. YISD's reported ridership levels also are suspect. For 1996-97, total average daily regular program riders remained constant at 6,607 even though regular program mileage increased by 72 percent. This ridership level, however, has been distributed among the subprograms differently. In 1995-96, the department assigned all riders to the standard subprogram. In 1996-97, riders were distributed to the standard, pre/kindergarten, and year-round subprograms. The director of Transportation said this allocation was done in response to direction from the TEA. Recommendation 102: Improve the accuracy of data reported to TEA and make a one-time claim for inaccurate data submitted for 1995-96. YISD's mileage and ridership levels reported to TEA suggest that the district's mileage for regular program service was significantly underreported in 1995-96. Underreporting

resulted in a substantially higher cost per mile than that reported by peer districts. Underreporting also affected the district's state funding, which is based on miles of regular program service. TEA officials said they would consider a request for a retroactive funding adjustment. Inaccurate reporting to TEA affects funding received from the state as well as the district's ability to accurately evaluate the performance of its Transportation Department. Inaccurate reporting points to a lack of adequate management controls and performance monitoring within the department. IMPLEMENTATION SCHEDULE AND TIMELINE:
1. The director of Transportation reviews previously reported mileage and ridership data.
June 1998
2. The director of Transportation submits modified forms to TEA. June 1998
3. TEA adjusts reimbursement rates for 1995-96 and 1996-97. July 1998
4. The director of transportation institutes controls to improve accuracy of mileage and ridership counts for future. August 1998
5. The yardman records odometer/hubodometer readings for all vehicles.
Start of each fiscal year
FISCAL IMPACT In 1995-96 YISD reported 325,656 regular miles driven to serve student riders, however in 1996-97 YISD reported 551,880 regular miles without adding new routes and with a minimal decrease in riders. While TSPR is concerned with this variance the review team felt that the 1996-97 data is more accurate because it is more in line with what their peers were reporting. If the mileage were estimated to be 548,525 (the average mileage reported by YISD peers) this would make for a difference of 222,869 miles that should have been reported. At the reimbursement rate of $1.43 a mile, YISD would receive an additional $318,702 from the state. This increase in mileage would lower the district's cost per mile in 1995-96 from $4.63 to $3.35. This reduction, in turn, would lower the reimbursement rate for career and technology routes in 1996-97. If the lower reimbursement rate is applied to the 63,699 career and technology miles for that year, the funds received would drop from $294,926 to $213,392, a difference of $81,534. In all, then, Ysleta would receive a net increase in funds of $237,168 from the state.
Recommendation 1998-99 1999-2000 2000-01 2001-02 2002-03
Improve accuracy of $237,168 $237,168 $237,168 $237,168 $237,168

transportation data reported to TEA

Chapter 10
Organization and Staffing
B. Organization and Staffing CURRENT SITUATION The director of Transportation reports to the executive director for Auxiliary Programs. The Transportation department is responsible for providing school bus service for all schools and maintaining the buses and the district's general services fleet, which includes the support vehicles operated by other departments including Facilities, Maintenance, Warehouse, and Food Services. The Transportation Department operates from two facilities: the Service Center on Yermoland, south of I-10, and the Northeast Complex on Woodrow Bean Trans Mountain Road in the northeast area of the district. According to the district's October 23, 1997 Position Control Report, Transportation has 290 positions. These positions are organized into six divisions: five at the Service Center including the Maintenance Division and one at the Northeast Complex. The four Transportation Divisions at the Service Center are each headed by a field coordinator. A supervisor heads the division at the Northeast Complex, and a mechanic II heads the Maintenance Division. Three of the four field coordinators also supervise office personnel in addition to drivers and attendants. These three field coordinators schedule extra run service, such as field trips, and related billing and dispatching. Exhibit 10-8 illustrates the Transportation Department's organization.
Exhibit 10-8 YISD Transportation Department
October 1997 To obtain a copy of this exhibit, please contact the Texas Performance
Review at 512/475-0332, or via e-mail at [email protected].
Source: YISD Transportation Department. The supervisor and field coordinators supervise both drivers and attendants. The majority of the drivers are classified as part-time, permanent employees. These positions are guaranteed four hours a day. The substitute driver positions are classified as part-time, temporary employees and guaranteed two hours a day. Attendants are employees that ride with the bus driver to aid special

program students. Attendants help these students on and off the bus and maintain order during rides. FINDING The Transportation Department's turnover rate for drivers is 12.5 percent. The director, supervisor, and field coordinators said they do not perceive turnover as a problem. This turnover rate is lower than that experienced by YISD's peer districts. Socorro ISD, for example, has a 23 percent turnover rate. Driver wage rates were increased 5 percent in 1997-98, Exhibit 10-9 compares the wage rates for drivers for selected school districts in El Paso County.
Exhibit 10-9 Driver Wage Rates
1997-98
School District Minimum Midpoint Maximum
Canutillo $7.83 $9.23 $10.49
Clint $6.61 $8.60 $10.56
El Paso $6.65 $9.16 $11.65
Fabens $6.30 $7.40 $8.54
San Elizario $7.52 $9.19 $10.82
Socorro $6.57 $8.22 $9.87
Peer Average $6.91 $8.63 $10.73
Ysleta $8.22 $10.28 $12.33
Source: TSPR Analysis? The wage rate for drivers is 19 percent higher than the average for YISD's peer districts at the minimum and midpoint of the salary range and 15 percent higher at the maximum level. This higher rate results in lower turnover rates than those experienced by peer districts. COMMENDATION The Transportation Department pays its drivers and attendants a wage rate that promotes low turnover. FINDING

The director of Transportation has hired four new field coordinators within the past year. The organizational structure shown in Exhibit 10-8 was developed with information from several sources, since TSPR found conflicting descriptions of these reporting relationships. The total number of positions and their titles are from the October 23, 1997 Position Control Report. The number of drivers and attendants reporting to each field coordinator and the northeast supervisor are taken from an organizational chart supplied by the director, with the number of driver positions increased to reflect the 160 positions in the Position Control Report. The maintenance clerk in the Position Control Report is classified by the director as a budget clerk. The warehouse III position in the Position Control Report is classified by the director as a parts clerk. The director classifies the dispatcher clerk as a billing clerk. The Position Control Report lists four craft helper positions. The director said one of these positions is the yardman, and the other three positions have been labeled as mechanic helpers, even though the director's organization chart shows two mechanic helpers. The mechanic I - small engine on the Position Control Report is classified as a mechanic I on the chart above. The director said the position control report is outdated. The director's organizational chart does not reflect the field coordinators' understanding of their authority. The director said that the two mechanics at the Northeast Complex report to the northeast supervisor. The northeast supervisor said he has some control over their activity, but the head mechanic is responsible for their evaluations. Moreover, the director said that the remaining maintenance personnel report to one of the field coordinators. A field coordinator confirmed this, but the head mechanic told TSPR that he reports to the director. The field coordinators' and the northeast supervisor's count of the number of positions reporting to them do not match the numbers supplied by the director or the Position Control Report. Recommendation 103: Establish clear lines of authority in the Transportation Department and assign maintenance responsibilities to one of the field coordinators. IMPLEMENTATION STRATEGY AND TIMELINE
1. The director of Transportation meets with the supervisory staff to discuss the organizational structure.
June 1998
2. The director of Transportation appoints a coordinator over maintenance and establishes the authority and responsibilities of the
July 1998

position.
3. The director of Transportation implements the new organization structure.
August 1998
FISCAL IMPACT This recommendation can be implemented at no additional costs. FINDING The four field coordinators at the transportation center have between 53 and 60 positions reporting to each of them. Industry standards indicate that this number of staff is more than one individual can effectively supervise. The field coordinators find it difficult to evaluate the performance of each driver and attendant, and simultaneously provide effective supervision in the field. Many school districts have established a lead driver position. Individuals in this position drive a route but also aid in the supervision and evaluation of the other drivers and attendants. Socorro ISD has this structure in place. At Socorro, two team leader positions, which are equivalent to the field coordinators positions at Ysleta, each have between 57 and 69 drivers and attendants reporting to them. To assist the team leaders, two lead drivers are assigned to each team leader. The resulting span of control is approximately 30 to 35 drivers and attendants per lead driver. Recommendation 104: Establish a lead driver classification under each field coordinator. Each field coordinator of the Service Center should be assigned two lead drivers to assist in the supervision of the drivers and attendants. The lead drivers would have between 26 and 30 drivers and attendants for whom they would be responsible and included in their responsibilities would be to substitute drive when absences occur. IMPLEMENTATION STRATEGY AND TIMELINE
1. The director of Transportation meets with the associate superintendent of Human Resources to establish the new classification.
June 1998
2. The associate superintendent of Human Resources posts the July 1998

positions and begins the hiring process.
3. The field coordinators fill all open positions. August 1998
FISCAL IMPACT The eight new lead driver positions should be classified at a pay grade between those of the drivers and field coordinators. Eight drivers currently making $8.75 per hour on average, will be upgraded to lead drivers at a rate of $10.90 per hour, for a difference of $2.15 per hour. Therefore, based on 260 days at 8 hours a day, or 2,080 hours, the additional cost to the district will be $35,776 for the eight positions ($2.15 x 2,080 hours x 8 positions). Adding 36.85 percent benefits brings the annual cost to $48,959.
Recommendation 1998-99 1999-2000 2000-01 2001-02 2002-03
Establish a lead driver classification. ($48,959) ($48,959) ($48,959) ($48,959) ($48,959)
FINDING The director has been unable to supply a single comprehensive list of the district's bus routes to the TSPR team. The department installed an Edulog computer routing program in January and trained the staff in its use in February. When fully implemented, Edulog will be able to produce a single, comprehensive list of routes. In the meantime, based on separate lists prepared for each facility and phone discussions, TSPR identified a total of 144 routes. Of the 144 routes, 60 are regular program routes and 84 are special program routes. The district does not operate any separate career and technology program routes, but does operate additional trips on some of the regular program routes to serve vocational needs. The director said cocurricular trips occur during the school day and not during peak times. Therefore, the peak driver requirement is 144 drivers to operate the regular and special program routes. The staffing level of 160 driver positions is more than the peak requirement of 144 drivers. As discussed in a later finding, substitute

drivers are required to cover for drivers that are not at work. The level of permanent positions, however, is determined by the peak requirements. Recommendation 105: Reduce the number of permanent driver positions to match the peak driver requirement. The total peak requirement for bus drivers is 144 positions, or 16 fewer than the budgeted level. According to the October 23, 1997 Position Control Report, eight positions are vacant, not including three drivers on a leave of absence and three on workers' compensation. Permanent positions could be reduced by eliminating the eight vacancies and eliminating eight more positions through attrition (the attrition rate for bus driver is 5.4 percent in YISD) during the year. The promotion of drivers to the lead driver category would allow the district to eliminate still more driver positions. IMPLEMENTATION STRATEGY AND TIMELINE
1. The director of Transportation recommends to the associate superintendent of Human Resources a reduction in the number of driver positions.
June 1998
2. The associate superintendent of Human Resources reduces the number of permanent driver positions.
August 1998
FISCAL IMPACT The average driver works 4.5 hours a day. At an average wage rate of $8.78 an hour for a minimum 186 days a year, the elimination of 16 positions would save $117,582 a year. With benefits for ancillary personnel at 36.85 percent, total annual savings would be $160,911.
Recommendation 1998-99 1999-2000
2000-01 2001-02 2002-03
Reduce permanent driver positions by 16
$160,911 $160,911 $160,911 $160,911 $160,911
FINDING

YISD budgeted for 20 substitute drivers in 1997-98, however TSPR found that many of these positions are not necessary. Substitute drivers are used as result of there not being enough regular drivers available to drive the buses. Regular drivers may be unavailable due to drivers who are absent, those on workers' compensation, and staff vacancies. During 1996-97, TSPR calculated tha t an average of four drivers were absent on any given day. The director of Transportation reported that on average, four to five drivers are out on workers' compensation claims at any given time. The October 23, 1997 Position Control Report listed three drivers out on such claims. TSPR assumes that four drivers are out on workers' compensation claims on the average school day. TSPR found that an average of two authorized vacant positions will be unfilled on the average school day. In all, about ten driver positions remain unfilled on the average day. TSPR also found that YISD can expect to have an average of four attendant positions unfilled each day. The absentee rate for attendants is three attendant absences per day, approximately one attendant position will be vacant each day, and in 1996-97 had no attendants on worker's compensation. Between unfilled driver and attendant positions, the total number of unfilled positions related to student transportation averages 14 positions each day. Recommendation 106: Reclassify and combine the substitute driver and attendant categories as substitute driver/attendant and reduce the number of positions through attrition to the level required to cover expected absences. A combined category of drivers and attendants would allow these individuals to fill in for absentee workers in either category. This dual responsibility would give management greater flexibility to use these employees wherever an absence occurs, but would require all substitutes to be qualified drivers. The total requirement for substitute drivers and attendants is 14 positions. The eight lead drivers could partially fill this requirement. Using lead drivers in this capacity would allow the leads to become familiar with all of the district's routes, aiding them in their supervisory and training roles. Substitutes could fill in for the six remaining positions; this implies that the district does not need 14 of the 20 budgeted substitute positions. In the

October 23, 1997 Position Control Report, five of these positions were vacant. These vacancies should be eliminated and nine additional positions eliminated as vacancies occur. Encouraging substitutes to move into full-time employment as drivers or attendants would accelerate the filling of vacant positions. IMPLEMENTATION STRATEGY AND TIMELINE
1. The director of Transportation recommends to the associate superintendent of Human Resources the elimination of 14 substitute driver positions.
June 1998
2. The associate superintendent of Human Resources eliminates the positions.
August 1998
FISCAL IMPACT Substitute drivers receive a minimum wage of $7.61 an hour. At a minimum of two hours a day, 186 days a year, each position eliminated would save at least $2,831 annually. The total savings from this recommendation would be $39,634 annually.
Recommendation 1998-99
1999-2000
2000-01
2001-02
2002-03
Reclassify substitute drivers and attendants and reduce the number of substitute positions.
$39,634 $39,634 $39,634 $39,634 $39,634
Chapter 10
Organization and Staffing C. Management Policies CURRENT SITUATION Cocurricular tutoring routes during the school day are used to take students with specific needs to a location other than their home school to receive special instruction. Extracurricular field trips are trips to enrichment activities such as field trips to museums or athletic events after school. Tutoring routes are served by yellow school buses and field trips are served either by yellow school buses or by MCI over-the-road coaches. Over the past four years, the Transportation Department purchased eight refurbished MCI coaches equipped with restrooms specifically for use on long field trips. Principals at the individual schools are not charged for tutoring trips because they are considered a regular and recurring part of the student's education. Since these trips are regularly scheduled, they can be incorporated in daily driver schedules at no additional charge. Principals are charged for extracurricular trips, however, because of their infrequent and sporadic nature and the extra costs required to provide this service. The Transportation Department has adopted a pricing structure designed to recover the full cost of field trips. Separate charges are levied for mileage and the time required for each trip. These charges are $9 an hour and $1.65 a mile for field trips using a yellow school bus. Trips using the MCI coaches require a flat $170 charge per trip for maintenance costs, including cleaning and restocking bathroom supplies; a fuel cost of $1.50 a gallon; a driver cost of $9 an hour, and a $20 per diem meal expense when the driver stays overnight. The principal is not charged for the hotel room for the driver but is expected to furnish a room. The Transportation Department is considering an advertising program for the sides of its buses. The director of Transportation will be forming a committee to develop specific guidelines for the program and to formulate a trial. The committee is expected to convene after the Texas Department of Public Safety issues its guidelines for such advertising. Based on the experiences of neighboring districts, it is not unreasonable to expect revenues of up to $2,000 per regular education bus each year from this program. Based on a fleet size of 69 regular education buses, the total potential annual revenue is $138,000. This revenue will be lower in the trial period since the entire fleet will not be converted to advertising at first. FINDING A per-hour and per-mile charge for field trips reflects the cost of these field trips using a yellow school bus. The per-hour cost is designed to reflect the expenses of driver wages,

which are directly related to the number of hours a trip takes. For many field trips, such as for athletic events, drivers are paid for the time they spend waiting even though they are not driving. The per-mile cost reflects the cost of maintenance, fuel usage, and depreciation. Maintenance and fuel expenses are directly related to the distance traveled. TSPR has found, however, that Transportation does not keep adequate, reliable records to determine actual per-hour and per-mile costs. For example, driver wages are not recorded in sufficient detail to determine the amount of overtime paid for field trips. Maintenance expenses are not allocated to determine their cost per mile. For example, a mechanic's time spent filling in for absent drivers is not recorded separately from time spent maintaining buses. The warehouse records fuel costs for each driver, but does not record costs by bus, which would allow the district to determine cost per mile by type of bus or type of fuel used. The computer system is designed to track labor costs by activity, but the director of Transportation said the board decided not to use the system. The following analysis relies on YISD's fully allocated cost of $2.61 a mile, as reported on the 1996-97 TEA Operation Report. This cost includes transportation and maintenance costs in a total unit cost per mile. The director of Transportation could not supply a comprehensive list of field trips made during the past year since only paper copies of these records were kept and no tabulations were made. Since October 1997, field trips using yellow school buses have been entered into the computer program. The extra-run clerk was able to pull records for October, November, and the first week of December. TSPR then used this sample to extrapolate a number of field trips during the year; these data may overestimate actual field trip activity, since the fall football season is the busiest time of the year for field trips. During this nine-week period, Transportation provided 1,429 field trips that covered 40,615 miles, requiring 7,132 hours in driver pay time. The average trip took five hours and covered 28.4 miles. At $9 an hour and $1.65 a mile, principals were billed $91.81 for the average field trip. At the reported $2.61 fully allocated cost per mile for 1996-97, the average field trip cost the district $74.12, or $17.69 less than the amount billed to the principals. Any costs over the amount charged to principals are borne by the Transportation Department. However, at the previous year's higher cost of $4.63 per mile, the average field trip would cost $131.49, or $39.68 more than the charges to the principals. With such wide variation in reported costs per mile, it is impossible to determine the true cost of field trips. The average length of five hours indicates that most field trips with yellow buses do not interfere with peak bus operations, since about five hours are available between the 8:30 a.m. end-of-morning peak and the 1:30 p.m. start of the afternoon peak. The records indicate considerable variation in the duration of field trips, however, the 773 trips in October averaged less than two hours a trip while the 85 trips in the first week of December averaged more than 19 hours a trip.

Recommendation 107: Determine the true cost of field trips and charge accordingly, with an additional premium fare for trips that interfere with daily school routes. Once a true cost is determined, YISD should adopt a simpler pricing structure for field trips. This pricing structure should involve a flat fee for field trips lasting up to five hours, as long as they do not interfere with peak times. For additional hours that do not interfere with peak operations, an hourly charge should be determined and assessed based on actual costs. To discourage field trips during daily peak service, a premium charge of double the hourly rate should be charged for field trips that overlap with the peak. Given reported costs, this premium charge could range from $30 to $50. This higher rate would allow the Transportation Department to recover its costs for using an additional driver and bus. IMPLEMENTATION STRATEGY AND TIMELINE
1. The director of Transportation verifies the fully allocated cost per mile for 1996-97. June 1998
2. The director of Transportation implements new field trip charges. September 1998
3. The director of Transportation adjusts field trip charges based upon 1997-98 TEA data.
January 1999
4. The director of Transportation adjusts field trip charges based upon costs.
Annually
FISCAL IMPACT Adjusting field trip charges should not have any fiscal impact on the district. Since decreases or increases to the budgets of the individual principals would offset any change in charges received by the Transportation Department. FINDING The Transportation Department has acquired eight MCI coaches for use on long distance and overnight field trips. Based on a handwritten compilation of all field trips from August 1996 to July 1997 supplied by the department, these buses made 50 field trips requiring 70 buses. The average field trip billed 68 hours of driver time and covered 523 miles. The field trips totaled 3,381 annual billing hours and 25,612 annual miles. The department bought two of these coaches in each of the past four years. Six coaches are from the 1979 model year; one is a 1981 model and one is a 1982 model. The coaches

were bought refurbished at a total average cost per bus of $51,000, about the same cost as for a new yellow school bus. These coaches, however, are more comfortable than regular school buses, especially for overnight trips. The football and basketball teams are the major users of these coaches, with Midland and Lubbock as the most frequent destinations. The schools that make the greatest use of these coaches are Parkland, Eastwood, and Hanks High Schools. The charge for field trips using these coaches is intended to recover their cost. The flat $170 charge is designed to recover the maintenance costs and the $20 charge for dumping the bathroom. The hourly and fuel charges are designed to recover driver and fuel costs. Two operators are required per coach for field trips lasting more than eight hours. This practice avoids excessive driving time for any one operator. Exhibit 10-10 shows the estimated total costs and variable costs that increase as the level of service increases. The total cost per mile is $6.72 and the variable cost is $3.03.
Exhibit 10-10 MCI Coaches Estimated Annual Costs
Category Full Cost Variable Cost
Administration $11,254 $2,809
Operation $49,698 $49,698
Maintenance $50,914 $21,169
Overhead $5,446 $5,446
Capital $58,286 -
Total Annual Costs $175,598 $79,122
Total Annual Miles 26,135 26,135
Cost/Mile $6.72 $3.03
Source: LKC Consulting Services, Inc. Administrative costs have been included for the director and the head of maintenance even though the director said these individuals do not charge for their time outside of normal work hours on field trips. The cost represents the value of their time spent on the field trips. No costs have been included for general overhead expenses, such as utilities, which are not charged to the Transportation Department. The charges to a principal for the typical field trip are shown in Exhibit 10-11. The total charges shown do not include a $20 per diem for the drivers.

Exhibit 10-11 Billed Charges for Typical Coach Field Trip
As determined by YISD Transportation Department
Category Unit Cost Quantity Amount
Drivers $9.00 an hour 67.6 $609
Maintenance $170 a bus 1.4 $238
Fuel $1.50 a gallon 116.2 $174
Total $1,021
Source: YISD Director of Transportation. Actual costs for he same trip at 523 miles and $6.72 a mile costs YISD $3,515 or 244 percent more than the principal is billed for the trip. The review team conducted a survey of private transportation companies to obtain their prices for a typical bus trip in the area. For the survey, TSPR priced a trip to Midland from Friday night to Sunday night. The estimated mileage for the trip was 430 miles round-trip; the quoted prices ranged from $1,208 to $1,650 for an average cost of $1,411. For the same trip the district is 105 percent more expensive, or $2,890, which includes all fixed and variable costs. Recommendation 108: YISD's Transportation Department should fully recover the variable cost of using MCI coaches. YISD's Transportation Department should increase the unit cost per driver to $14.70 per hour ($49,698, operating costs divided by 3,381); the annual billing hours; plus $1.15 per mile ($21,169 annual variable maintenance cost; plus $5,446 annual variable overhead cost plus $2,809 annual variable administration costs; divided by 25,612 annual miles). For example a trip that would last the typical time of 67.6 hours over a typical distance 523 miles would cost $993.72 (67.6 hours x $14.70) plus $601.45 (523 miles x $1.15) for a total cost of $1,595.17 that would now be charged to the principals at the schools. TSPR has calculated that these rate would allow the Transportation Department to recover the variable cost for these field trips. IMPLEMENTATION STRATEGY AND TIMELINE
1. The director of Transportation institutes the higher charges for field trips. August 1998
2. The director of Transportation notifies the principals of the revised August

charges and puts new charges into effect 1998
FISCAL IMPACT Implementation of this recommendation shifts the costs of providing this service from the district's Transportation Department to the Schools in the district and therefore will not have a financial impact either way for YISD. FINDING Many public transit systems and private fleet managers conduct performance measurement. The critical role of such monitoring cannot be underestimated. Fleet managers use performance measures to determine the level of training employees need; decide promotions and incentive rewards; enhance preventive maintenance programs, to reduce repeat failures, roadcalls, and unscheduled maintenance; improve employee and customer satisfaction; and reduce costs. Some organizations use performance measures specifically to cut costs. United Parcel Service has had a specific company goal to reduce its maintenance costs by 10 percent and many other transportation organizations have set goals at a similar general level. When the Houston Metropolitan Transit Authority instituted performance measures, its cost per mile fell by 36 percent, from $5.26 to $3.39, over a two-year period. TSPR recommended a series of transportation performance indicators to the Houston ISD (HISD) as part of a previous review Exhibit 10-12. The target levels will be revised by HISD based on current information; for comparative purposes, the original recommended targets are shown. These indicators now are tracked on a regular basis and district officials say the indicators have created healthy competition among mechanics. HISD cannot identify specific savings, however, given the newness of its program.
Exhibit 10-12 Recommended HISD Performance Measures
Performance Indicator
HISD 1994-1995 Actual
TSRP Recommended Target
Safety Accidents per 100,000 miles Incidents per 100,000 miles
1.5 2.9
1.4 2.6
Cost-Efficiency Operation cost per mile Annual operation costs per route
$2.12 $29,350
$1.91 $26,500

Cost-Effectiveness Annual costs per rider Percent state reimbursement (TEA)
$699 47%
$602 60%
Service-Effectiveness Riders per mile Riders per route
0.6 40
0.7 48
Service Quality On-time performance Open routes due to unfilled positions Driver absentee rate Average rider trip time in minutes
Not available 5% Not available Not available
95% 0% 5% 45
Maintenance Performance Miles between road calls Percent PMs completed on time Turnover time per bus in repair
Not available Not available Not available
9,500 95% 6 hours
Source: HISD. These indicators are interrelated and have some degree of overlap. A high percentage of preventive maintenance checks done on time, for instance, will reduce the level of accidents due to mechanical failure. The indicators permit troubled areas to be pinpointed and allow improvements to be documented. YISD does not formally monitor any of these aspects of transportation. The district has, however, supplied sufficient information to develop some indicators. For example, From September 1995 to August 1996, the district's insurance company reported 44 insurance claims on bus drivers. If all claims were accidents, this equates to an annual rate of 3.1 accidents per 100,000 miles. The operation cost per mile is derived from annual data reported to the TEA. In 1996-97, the operation cost per mile was $2.46 for both regular and special education. According to TEA data, the operation cost per rider was $1.77 for regular riders and $11.77 for special education riders. The linear density can be calculated from TEA data. For regular education, the linear density, or ratio of regular route riders to regular route miles, was 2.69. For special education, the linear density was 0.23. The absentee and vacancy rates, as discussed in a previous finding were 3.1 percent for absenteeism and 1.4 percent for vacancies in 1996-97. No data were available from the district to calculate on-time performance, missed trips, miles between roadcalls, or preventive maintenance checks performed on time. Recommendation 109: Develop key indicators to measure and monitor the performance of regular and special education transportation.

Exhibit 10-13 lists the performance measures recommended for YISD's Transportation Department. These indicators were selected to measure the most important aspects of service and to track specific areas that have been identified in TSPR's findings as areas of concern. The most important performance indicators should be reported to the board on a monthly basis. These reports should help the board focus more attention on the critical function of transportation and impress upon the department the need to accurately and regularly track its performance.
Exhibit 10-13 Recommended YISD Performance Measures
Performance Indicator
YISD 1996-97 Actual Target
Safety Accidents per 100,000 miles 3.1* 2.6
Cost-Efficiency Operations cost per mile - Regular Operations cost per mile - Special
$2.46 $2.46
$2.24 $2.24
Cost-Effectiveness Operation cost per rider - Regular Operation cost per rider - Special
$1.77 $11.77
$1.61 $10.70
Service Effectiveness TEA linear density - Regular TEA linear density - Special
2.69 0.23
2.69 0.23
Service Quality On-time performance Missed trips
Not available Not available
95% 0%
Maintenance Performance Miles between road calls Percent PMs completed on time
Not available Not available
9,500 95%
Source: YISD Transportation Department. * Indicates 1995-96 data. All personnel in the Transportation Department should be informed about the standards and measures, the targets to be achieved, and progress toward the targets. A performance-based management program should allow the Transportation Department to demonstrate and quantify its successes. IMPLEMENTATION STRATEGY AND TIMELINE

1. The director of Transportation and field coordinators adopt key indicators to assess the department's performance and the indicators and targets are publicized to the transportation staff.
April 1998
2. The director of Transportation and field coordinators monitor the performance indicators and disseminate the results to all Transportation personnel.
Monthly
3. The director of Transportation annually adjusts performance targets to reflect experience.
September 1998
FISCAL IMPACT Based on the experience of other fleet managers, TSPR's performance measures have targeted a 10 percent or more improvement in costs per mile. Recommendations throughout this chapter can achieve this level of savings when fully implemented.

Chapter 10
Organization and Staffing
D. Routing and Scheduling CURRENT SITUATION YISD operates 60 regular program routes on a cluster-stop basis. Stops are not established for individual students, but instead are set up for neighborhoods as a whole; students are expected to walk a short distance to their neighborhood stop. The district's 84 special program routes, by contrast, change regularly since they pick up students at their homes. The special program routes are affected every time an existing student moves or a new student moves into a district. These routes also must be adjusted whenever a student changes schools, either because the student moves up from elementary to middle school or from middle school to high school, or because the student switches to a different school to obtain a more appropriate program. The director of Transportation, four field coordinators, and Northeast Complex supervisor perform all route planning for the district. The department has an Ecotran computer program to aid in routing. This program is seldom used, however, because it cannot route buses across attendance zones. The department purchased a new Edulog routing program last year, but it will not be completely functional until the district's detailed map of the district has been updated by the El Paso City Planning Office. Route planning for the current school year was primarily done by hand. FINDING YISD's typical regular bus route serves two schools, according to a November 3, 1997 report that lists the routes from the Service Center and a handwritten list of routes obtained from the Northeast Complex. TSPR found considerable variation between routes and schools served by the two facilities (Exhibit 10-14).
Exhibit 10-14 Average Number of Schools Served by Facility
Facility Regular Routes Schools Served School per Route

Service Center 48 76 1.6
Northeast 12 33 2.8
Total 60 109 1.8
Source: YISD Transportation Department "Report 1" and handwritten report list. The director of Transportation said the district permits each principal to set the bell time for his or her school under the site-based management program. As a result, there is little coordination among the schools. In the northeast area, however, the Transportation supervisor has worked with principals to coordinate their bell times. As a result, each regular bus is able to serve more than one school, with several buses serving four schools. If the same schools-per-route ratio in the south applied to the northeast, nine additional regular routes would be required. The lack of staggered bell times adds to the difficulties of special program routing. As with the regular routes, the special program routes in the south serve fewer schools than in the northeast, where the bell times are coordinated. In the south, the typical special program route serves 1.1 schools. In the northeast, the typical route serves 2.7 schools. The director of Transportation has recommended to the executive director of Auxiliary Programs that bell times be staggered for all of the schools in the district. This recommendation will be going to the District cabinet. The recommendation suggests setting the high school bell times at 7:30 a.m., middle school bell times at 8:00 a.m., and elementary school bell times at 8:15 to 8:30 a.m. Dismissal times in the afternoon would follow a similar pattern. Staggered bell times aid bus operations by allowing the same bus and driver to serve more than one school. If all schools start at the same time, a separate bus and driver are required for each individual route. If times at the schools are coordinated, the bus and driver can first serve a school with a 7:30 a.m. bell time, then return to the neighborhood and pick up more students for a school with an 8:00 a.m. or later bell time. Coordinated bell times reduce the required number of permanent drivers and attendants, which in turn reduces the number of substitute drivers and attendants needed. Fewer peak buses are required, which reduces the number of spare buses and mechanics needed. Recommendation 110:

Establish staggered bell times for all YISD schools to increase transportation efficiency. The recommended bell times should be established in close coordination with principals and the district administration. The bell times should reflect the best policy for the district as a whole. Some districts choose the latest bell time for high schools because of the assumption that most high school students wake up late. This practice also avoids giving high school students too much idle time in the afternoon. If a large percentage of high school students have after-school jobs, an earlier dismissal time is more appropriate. IMPLEMENTATION STRATEGY AND TIMELINE
1. The director of Transportation reviews his suggested bell times with the executive director for Auxiliary Programs. June 1998
2. The executive director establishes a committee with representatives of the school principals to finalize recommendation.
June 1998
3. The committee of representatives agrees to staggered bell times and the recommendation forwards to the district superintendent. August 1988
4. The superintendent forwards the recommendation to the District cabinet.
September 1998
5. The District cabinet adopts the recommendation. September 1998
6. The director of Transportation sends notices of the new bell times to parents.
December 1998
7. The new bell times become effective. January 1999
FISCAL IMPACT Since the northeast area already has coordinated times and serves a high number of schools a route, no savings are anticipated in this area for either regular or special program transportation. Raising the number of schools served in the south from 1.6 to 1.8 schools for regular program routes would allow the district to eliminate six routes. Based upon 1996-97 costs reported to TEA, the average regular program route costs YISD $36,024 annually, excluding capital. Eliminating six regular program routes would

save $216,146 annually. By increasing the number of schools served from 1.1 to 1.2 for special program routes in the south area, which is halfway to the regular route average of 1.4, nine special program routes could be eliminated. At the average cost per special program route in 1996-97 of $24,815, excluding capital, annua l savings from eliminating nine routes would be $223,335. Total savings for regular and special route reductions equals $439,400 annually ($46,100 regular and $223,300 special). In the first year, the savings will be in effect for one-half year.
Recommendation 1998-99 1999-2000
2000-01 2001-02 2002-03
Establish staggered bell times.
$219,700 $439,400 $439,400 $439,400 $439,400
FINDING The admission, review, and dismissal (ARD) process affects special program transportation requirements. One of the ARD committee's responsibilities is to decide whether related services, including special program transportation, should be provided. According to Transporting Students with Special Needs in Texas, a publication of TEA, this decision should take into account the student's ability to reach school without special transportation. To provide "special transportation only because the student has a disability violates the least restrictive environment [LRE] requirements." According to the director of Transportation, YISD's ARD committee feels that all special program students are entitled to receive special program transportation. Yet other district officials indicate that YISD will promote students' independent living skills whenever possible. Twenty-nine percent of the district's special program students rode special program buses in 1995-96 (Exhibit 10-15). This ridership is higher than in all peer districts except El Paso (47 percent). Other peer school districts carry between 14 and 28 percent of the special students.
Exhibit 10-15 Percentage of Special Education Students Who Ride
1995-96 School Year

District Total Students
School Bus Riders
Percent of Student Riders
El Paso 5,583 2,638 47%
Humble 2,318 425 18%
McAllen 2,472 341 14%
Midland 1,831 435 24%
Pharr/San Juan/Alamo
1,353 242 18%
Socorro 1,577 433 28%
Weighted Peer Average - - 30%
Ysleta 3,899 1,120 29%
Source: (1) Riders From TEA School Transportation Route Report (2) Enrollment From TEA Academic Excellence Indicator System (AEIS) Recommendation 111: Critically evaluate each individual student's need for special program transportation and provide transportation in the least restrictive environment. Appointing a transportation representative to the ARD committee would bring emphasis to providing transportation services to special need students in the least restrictive environment, while still serving their needs. IMPLEMENTATION STRATEGY AND TIMELINE
1. The director of Transportation appoints a representative to the ARD Committee.
June 1998
FISCAL IMPACT This recommendation can be implemented at no additional cost. FINDING
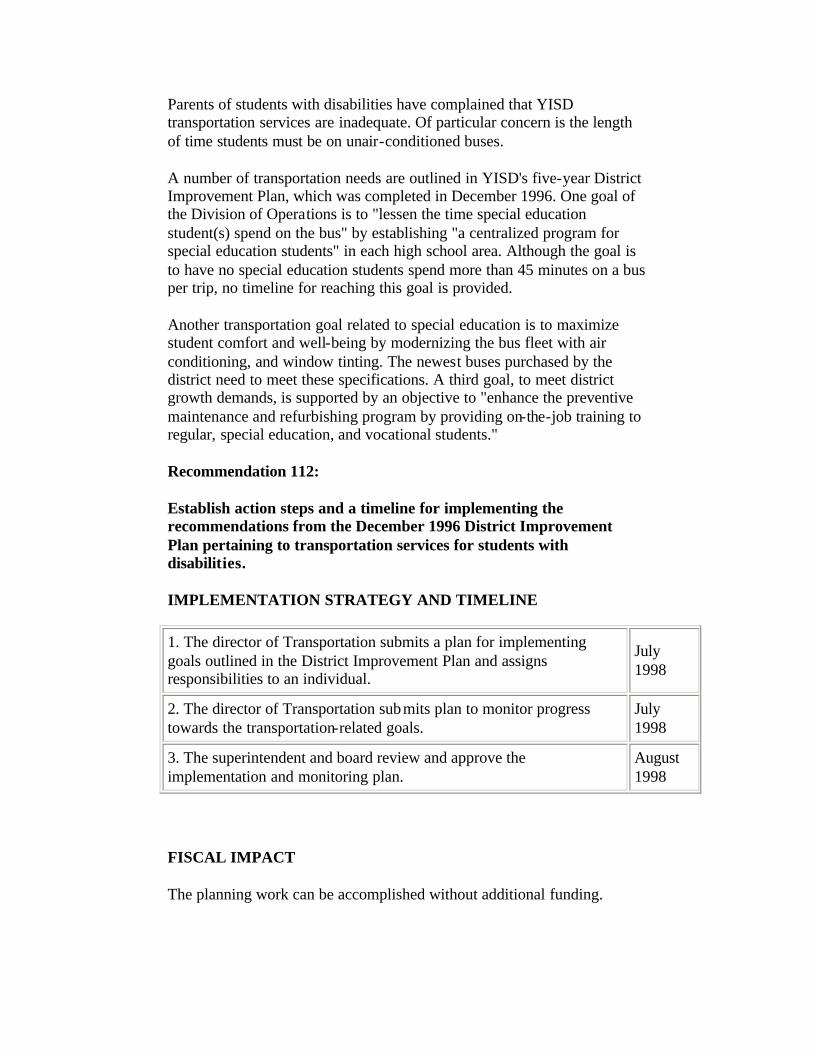
Parents of students with disabilities have complained that YISD transportation services are inadequate. Of particular concern is the length of time students must be on unair-conditioned buses. A number of transportation needs are outlined in YISD's five-year District Improvement Plan, which was completed in December 1996. One goal of the Division of Operations is to "lessen the time special education student(s) spend on the bus" by establishing "a centralized program for special education students" in each high school area. Although the goal is to have no special education students spend more than 45 minutes on a bus per trip, no timeline for reaching this goal is provided. Another transportation goal related to special education is to maximize student comfort and well-being by modernizing the bus fleet with air conditioning, and window tinting. The newest buses purchased by the district need to meet these specifications. A third goal, to meet district growth demands, is supported by an objective to "enhance the preventive maintenance and refurbishing program by providing on-the-job training to regular, special education, and vocational students." Recommendation 112: Establish action steps and a timeline for implementing the recommendations from the December 1996 District Improvement Plan pertaining to transportation services for students with disabilities. IMPLEMENTATION STRATEGY AND TIMELINE
1. The director of Transportation submits a plan for implementing goals outlined in the District Improvement Plan and assigns responsibilities to an individual.
July 1998
2. The director of Transportation submits plan to monitor progress towards the transportation-related goals.
July 1998
3. The superintendent and board review and approve the implementation and monitoring plan.
August 1998
FISCAL IMPACT The planning work can be accomplished without additional funding.

Chapter 10
Organization and Staffing E. Fleet Maintenance CURRENT SITUATION YISD's bus fleet consisted of 163 active school buses as of August 19, 1997. The fleet also contains eight Motor Coach Industries (MCI) coaches that are used exclusively for field trips and six inactive buses. The bus fleet is assigned to two facilities: the Service Center on the south side of the district and the Northeast Complex. Exhibit 10-16 shows the bus assignment by facility as of August 19, 1997.
Exhibit 10-16 YISD Active Bus Facility Assignment
Service Center Northeast Total
Regular Special Regular Special Regular Special
School Buses 59 78 15 11 74 89
MCI Coaches 8 0 0 0 8 0
Source: YISD Transportation Department; inactive buses are not included. Exhibit 10-17 shows the number of vehicles in the active fleet by model age, not including the coaches. The average age of the fleet is 12.3 years for regular program buses and 11.6 years for special program buses.
Exhibit 10-17 Active School Bus Fleet Inventory by Model Year
Year Regular Program Buses Special Program Buses
1977 0 2
1978 7 8
1979 7 1
1980 0 8
1981 0 10
1982 11 0
1983 3 6

1984 0 3
1985 9 4
1986 4 1
1987 10 9
1988 20 7
1989 0 13
1990 1 2
1991 0 8
1992 0 2
1993 2 2
1996 0 3
Total Fleet 74 89
Average Age in Years 12.3 11.6
Source: YISD fleet inventory as of August 19, 1997. No buses were purchased in 1994, 1995, or 1997. Inventory does not include eight MCI coaches or inactive buses. The Service Center houses 145 of 163 active buses. This facility is responsible for most bus maintenance and all support fleet maintenance. The facility has eight bays including two full repair bays, one pit repair bay, one wash bay, one bay half devoted to upholstery repair and half devoted to smaller vehicle repair, one bay half devoted to tire replacement and half devoted to small vehicle repair, and two exterior bays used for storage by the Facilities Department. The director of Transportation said the department has plans to enclose the latter two bays for their use. The Northeast Complex is located adjacent to Parkland High School on Woodrow Bean. This facility has two enclosed bays for maintenance activity, but has no fueling station. All buses are fueled at a public station away from the facility. FINDING The northeast portion of the district is somewhat removed from the remaining area of the district. The northeast area is wedged between El Paso ISD and Ft. Bliss in a triangle bordered by Railroad Drive on the east, McCombs on the west, and the state of New Mexico on the north. To reach this area from the Service Center requires a trip of more than 17 miles one way. To reduce the deadhead drive time-time to travel the distance between the garage and the

start of the route-the district constructed the Northeast Complex. This facility houses 26 buses and has two maintenance bays. With one shift of two mechanics, the two bays are adequate for this facility. Without the Northwest Complex, buses would travel 17 miles from the Service Center four times a day to and from the route in the morning and to and from the route in the evening. With a 180-day school year, the 22 routes assigned to this facility would have 269,280 additional miles. At an average cost per mile of $2.61 for regular and special education routes, the district is saving nearly $703,000 annually, by maintaining the northeast complex. COMMENDATION The Northeast Complex has reduced the districts transportation costs. FINDING The Transportation Department has a program in place to paint the tops of its school buses white to reduce their interior temperature on hot days. A white roof reflects more of the sun's rays, thereby reducing the temperature. Unlike many school districts and bus manufacturers that also paint bus tops white, Ysleta uses a special reflective acrylic porcelain paint that is an outgrowth of the space program. Hydro-Therm Protective Coatings in Amarillo manufactures the paint used by Ysleta. In a 1993 study conducted by the Mechanical Engineering Department at the University of Nevada-Las Vegas, a similar paint was shown to reduce energy consumption in identical rooms by 33 percent. The director of Transportation said the paint keeps the interior of buses 10 to 15 degrees cooler than standard white paint. This paint is used on all of the newer buses in the fleet and is applied when older buses are refurbished. The paint is useful even on buses equipped with air conditioning, since its insulating properties help the air conditioner work more effectively. The director of Transportation said that when coupled with tinted windows, the interior will be an additional five or six degrees cooler. The cost for this paint is only slightly more expensive than the standard white paint. According to the vendor used by Ysleta, a coat of this paint costs $2.50 per square foot, or from $325 to $800 depending upon the size of the bus. This cost includes a lifetime warranty. In contrast, the director of Transportation estimates that standard white paint costs $300 to $500 per bus. COMMENDATION The Transportation Department applies a special insulating paint to its bus rooftops to provide students with a cooler ride.

FINDING The operation of a transportation service requires spare vehicles to cover for vehicle breakdowns and vehicles out of service for regularly scheduled maintenance. The required number of spares is expressed as a spare ratio, the ratio of spare buses to buses required for peak service. The spare ratio typically ranges from 10 to 20 percent. The factors that most influence the spare ratio, according to the Synthesis 11, System-Specific Spare Bus Ratios, a report by Transit Cooperative Research Program (TCRP), are the age of the fleet, its operating environment, maintenance program, fleet mix, and training program. Exhibit 10-18 shows YISD's peak bus requirement and its available spare buses.
Exhibit 10-18 YISD Peak Bus Requirement Compared to Fleet Size
1997-98
Regular Program
Special Program
Total Fleet
Regular Program Peak 60 60
Special Program Peak 84 84
Career and Technology 0 0 0
Total Peak Buses (1997-98) 60 84 144
Total Fleet 74 89 163
Spare Buses 14 5 19
Spare Ratio 23% 6% 13%
Source: YISD Transportation Department. YISD does not have a plan for fleet procurement and replacement. The director of Transportation proposed purchasing 15 buses a year in a memo to the former associate superintendent of Operations in January 1995, but this recommendation did not include any cost/benefit analysis and the plan was not followed. The district purchases buses in response to critical needs. The fleet inventory indicates that few buses have been purchased in recent years. Consequently, a large number of buses need regular maintenance at the same time, causing service backlogs. Six buses are inactive and awaiting disposal. Two active special program buses are 20 years old. Another 51 regular and 49 special buses are 10 to 19 years old. Sixty percent of the entire fleet, or 102 buses, are 10 or more years old. The United States Department of Transportation's (DOT's) "National Highway Traffic

Safety Administration Highway Safety Program Guideline #17" recommends the replacement of pre-1977 buses "consistent with the economic realities which typically face school districts." Before 1977, buses were built without the crash-worthiness requirements now in place. Two regular buses in the inactive fleet are pre-1977 buses. School buses typically have a useful life between 10 and 15 years. TEA recommends a 10-year depreciation cycle, and most districts adopt a 10-year to 12-year life for buses. A 15-year life is possible with an aggressive maintenance program. Over the past 15 years, the district has purchased an average of three regular and four special education buses annually. This rate is equivalent to a 23-year procurement cycle. Keeping buses in the active fleet for longer periods of time increases maintenance costs each year. Ysleta does not keep maintenance records in sufficient detail to determine the maintenance cost per bus per year, and TSPR has not located data sources that analyze maintenance costs per year for the school bus industry. As a substitute for a specific examination of school bus costs, TSPR examined data from the transit industry. In 1988, the Transportation Research Board's (TRB's) Report 15: Transit Capital Investment to Reduce Operating Deficits - Alternative Bus Replacement Strategies, examined a nationwide sample of transit operators to determine the maintenance costs incurred for each additional year transit buses are kept in service. While these data have their limitations, the results should give a general indication of the additional costs Ysleta incurs from keeping buses active for longer periods of time. Report 15 calculated additional maintenance costs based upon additional miles traveled. The additional costs have been expressed as a constant factor applied to the cumulative mileage of the bus. The specific formula is:
Additional Maintenance Cost/Mile = $0.000253 * cumulative bus miles/1,000
Exhibit 10-19 shows the effect of this additional expense. The average bus at Ysleta travels 11,484 miles annually. The additional maintenance expense each year increases, reflecting the cumulative effort of running additional miles on the bus each year.
Exhibit 10-19 Estimated Additional YISD Maintenance Expense
By Age of Bus
Bus Age in Years 16 17 18 19 20 21 22 23
Cumulative Miles 183,745 195,229 206,713 218,198 231,978 241,166 252,650 264,134

Age Factor $0.000253 $0.000253 $0.000253 $0.000253 $0.000253 $0.000253 $0.000253 $0.000253
Additional Cost/Mile
$0.0465 $0.0494 $0.0523 $0.0552 $0.0587 $0.0610 $0.0639 $0.0668
Additional Annual Cost
$534 $567 $601 $634 $674 $701 $734 $767
Source: TRB Report 15: Transit Capital Investment to Reduce Operating Deficits - Alternative Bus Replacement Strategies. As this exhibit shows, the cost for each mile of operation increases as the cumulative miles on the bus increase. A 16-year old bus costs $534 more per year to maintain than does a new bus and a 23-year old bus costs $767 more per year. The total cumulative expense for years 16 through 23 will be $5,212 more than if the bus were retired at 15 years. Recommendation 113: Establish a 15 percent spare ratio for the fleet and an even procurement program to replace buses every 15 years. A 15-percent spare ratio would provide enough vehicles to cover for scheduled maintenance and vehicle breakdowns. With the overall growth in mileage at 6 percent and a declining ridership, a more aggressive spare ratio to accommodate growth is not required. This ratio is required for both the regular and special program subfleets. Based on current peak operations, a 15 percent spare ratio would require nine regular program and 13 special program buses, for a total of 22 spare buses and a total fleet size of 166 buses. The implementation of staggered bell times could reduce regular program routes by six routes and special program routes by nine. This reduction would decrease the peak bus requirement to 129. With the lower peak requirement, the spare bus requirement at 15 percent also would be reduced (Exhibit 10-20).
Exhibit 10-20 Required Fleet Size with Route Adjustments
Regular Program Special Program Total Fleet
Current Peak Buses 60 84 144
Route Reductions -6 -9 -15
Revised Peak Requirement

54
75
129
15% Spares 8 11 19
Fleet Requirement 62 86 148
Source: LKC Consulting Services, Inc. A fleet size over the required level requires the district to maintain additional spare parts and maintenance personnel. Buying a set number of buses each year offers two advantages. First, budgeting capital expenses far in advance prevents large expenditures in any one year. Second, spreading out the age of the fleet also spreads out the fleet's maintenance requirements. For example, a significant portion of the fleet would not require an engine overhaul in the same year. A younger fleet derives additional benefits. Given the recommended fleet size of 62 regular and 86 special program buses, an even 15-year procurement cycle would call for the purchase of four regular and six special program buses each year. Exhibit 10-21 shows the recommended bus procurements and retirements for the next five years.
Exhibit 10-21 1998-2002 Bus Procurements
Regular Buses Special Education Buses Total
Year Buses Purchased
Buses Retired
Buses Purchased
Buses Retired
Change in Buses
1998 4 10 6 6 -6
1999 4 10 6 9 -9
2000 4 4 6 6 0
2001 4 4 6 6 0
2002 4 4 6 6 0
Source: LKC Consulting Services, Inc. This procurement and replacement cycle assumes the recommended service reductions are implemented. Maintaining the existing number of routes would require five regular and six special program buses to be purchased each year. Six buses, or half of the extra regular program buses that are not required to support the spare ratio, would be retired in the first year. Only half are retired to permit a phase- in of the route changes.

In the second year, the remaining six extra regular program buses would be retired as well as the extra special program buses. In the remaining years of the five-year cycle, four regular and six special program buses would be purchased and retired, reflecting the requirements of the 15-year procurement cycle. IMPLEMENTATION STRATEGY AND TIMELINE
1. The director of Transportation develops a multiyear bus procurement plan that assumes a 6.7 percent replacement each year and a 15-percent spare ratio.
June 1998
2. The district superintendent and board adopt a long-term bus procurement plan with replacements each year.
July 1998
3. The board adopts a five-year capital budget for bus purchase and replacement.
August 1998
FISCAL IMPACT Based on data from YISD's peer districts, regular program buses cost an average of $52,500 and special program buses cost an average of $37,500. At the recommended 15-year procurement cycle, four regular program buses would cost $210,000 and six special program buses would cost $225,000, for a total of $435,000 each year. Over the past 15 years YISD has purchased on average, three regular and four special education buses at an annual cost of $307,500. The additional investment required ($435,000-$307,500) would be $127,500. The six buses in the inactive fleet should be sold in the first year at an estimated price of $300 for each bus, based on recent sales of inoperative buses by Houston ISD. Selling the retired buses would earn about $500 for each of the two buses produced before the 1977 DOT safety changes and $1,000 for the buses produced after the 1977 changes (see Exhibit 10-21). Retiring a bus at 15 years would save additional maintenance costs of $5,212 for years 16 through the typical retirement age of 23 years. These savings would be phased in over time as the oldest buses are retired from the fleet and the savings accumulate. Maximum savings would occur in year 15, when the procurement cycle has been completely changed from 23 years to 15 years. Calculations are not shown here but are available for review should this information prove useful.
Recommendation 1998-99 1999-2000 2000-01 2001-02 2002-03
Recommended fleet purchases less current ($127,500) ($127,500) ($127,500) ($127,500) ($127,500)

average budget for bus purchases.
Salvage value of retired buses $16,800 $19,000 $10,000 $10,000 $10,000
Maintenance savings $7,674 $15,015 $22,022 $28,762 $35,102
Net investment ($103,026) ($93,485) ($95,478) ($88,738) ($82,398)
FINDING YISD has a fleet of 171 school buses and 188 support vehicles, for a total fleet of 359. This fleet is maintained by 14 mechanics, including two mechanics assigned to the Northeast Complex and one diesel mechanic assigned to the MCI buses. The ratio of vehicles to mechanics is 25 to one. Common practice in the transportation industry is to establish a ratio of 20 to 30 vehicles a mechanic depending upon the age of the fleet, the level of maintenance equipment available, and the expertise of the mechanics. YISD is in the middle of this range when the diesel mechanic is included. Recommendation 114: Establish a staffing policy of 25 vehicles per mechanic. While at present the district has one mechanic for every 25 vehicles, reducing the school bus fleet from 163 buses to 148 would reduce the total bus fleet by 15 vehicles. The district should make the 25:1 ratio a standard staffing policy; as the fleet size is reduced or increased, the number of mechanics should be adjusted accordingly. IMPLEMENTATION STRATEGY AND TIMELINE
1. The director of Transportation and the associate superintendent for Human Resources adopt the recommended mechanic staffing policy.
August 1998
2. The director of Transportation recommends to the associate superintendent of Human Resources to reduce the number of mechanic positions.
January 1999
3. The associate superintendent of Human Resources reduces the number of mechanic positions.
May 1999
FISCAL IMPACT This recommendation can be implemented with no fiscal impact to the district.
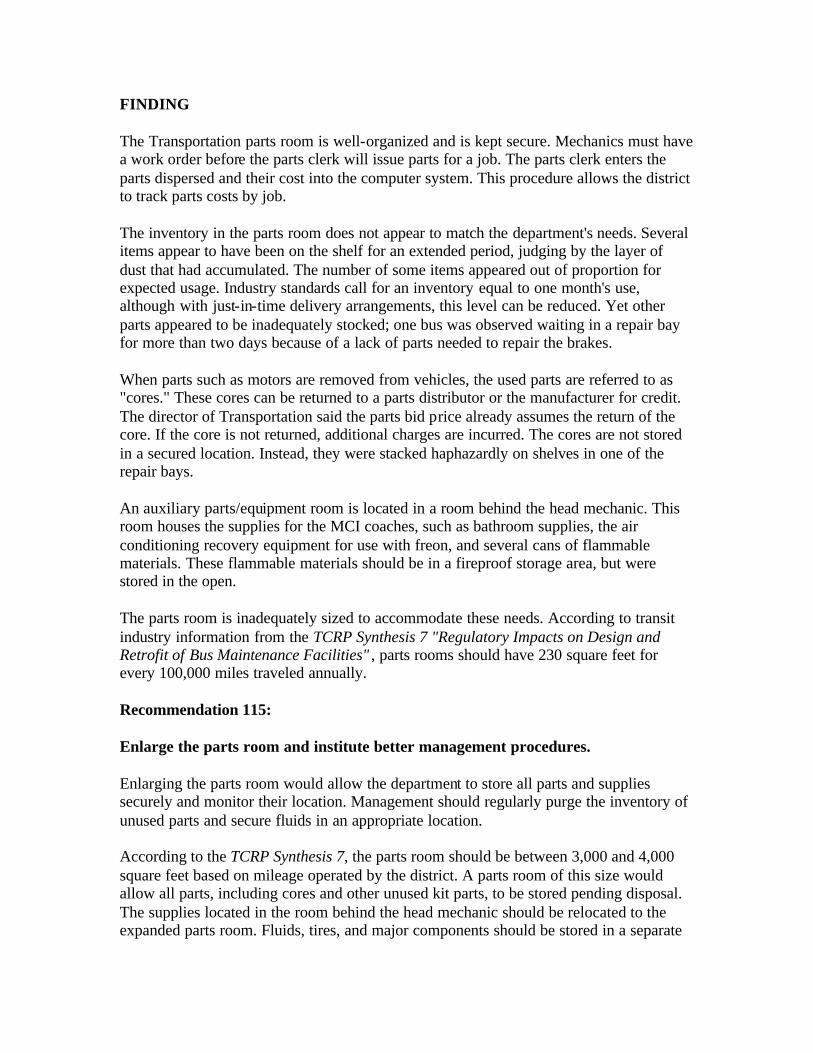
FINDING The Transportation parts room is well-organized and is kept secure. Mechanics must have a work order before the parts clerk will issue parts for a job. The parts clerk enters the parts dispersed and their cost into the computer system. This procedure allows the district to track parts costs by job. The inventory in the parts room does not appear to match the department's needs. Several items appear to have been on the shelf for an extended period, judging by the layer of dust that had accumulated. The number of some items appeared out of proportion for expected usage. Industry standards call for an inventory equal to one month's use, although with just-in-time delivery arrangements, this level can be reduced. Yet other parts appeared to be inadequately stocked; one bus was observed waiting in a repair bay for more than two days because of a lack of parts needed to repair the brakes. When parts such as motors are removed from vehicles, the used parts are referred to as "cores." These cores can be returned to a parts distributor or the manufacturer for credit. The director of Transportation said the parts bid price already assumes the return of the core. If the core is not returned, additional charges are incurred. The cores are not stored in a secured location. Instead, they were stacked haphazardly on shelves in one of the repair bays. An auxiliary parts/equipment room is located in a room behind the head mechanic. This room houses the supplies for the MCI coaches, such as bathroom supplies, the air conditioning recovery equipment for use with freon, and several cans of flammable materials. These flammable materials should be in a fireproof storage area, but were stored in the open. The parts room is inadequately sized to accommodate these needs. According to transit industry information from the TCRP Synthesis 7 "Regulatory Impacts on Design and Retrofit of Bus Maintenance Facilities" , parts rooms should have 230 square feet for every 100,000 miles traveled annually. Recommendation 115: Enlarge the parts room and institute better management procedures. Enlarging the parts room would allow the department to store all parts and supplies securely and monitor their location. Management should regularly purge the inventory of unused parts and secure fluids in an appropriate location. According to the TCRP Synthesis 7, the parts room should be between 3,000 and 4,000 square feet based on mileage operated by the district. A parts room of this size would allow all parts, including cores and other unused kit parts, to be stored pending disposal. The supplies located in the room behind the head mechanic should be relocated to the expanded parts room. Fluids, tires, and major components should be stored in a separate

secured location, with used fluids and parts segregated from new ones. The enlargement of the parts room could occur at the same time the Warehouse Department relocates to its new building. When that department moves, additional space in the parts room will become available. IMPLEMENTATION SCHEDULE AND TIMELINE
1. The director of Transportation meets with the director of Facilities to enlarge the parts room devoted to bus parts. June 1998
2. The director of Facilities starts enlarging the area for bus parts. July 1998
3. The director of Transportation installs a fireproof cabinet in the storage area behind the head mechanic. July 1998
4. The parts clerk relocates the cores to the auxiliary storage area until the main parts room is enlarged. July 1998
5. The director of Transportation appoints the parts clerk over the auxiliary storage area and issues him the key.
August 1998
FISCAL IMPACT The cost for enlarging the parts room is included in an overall recommendation to relocate the Warehouse Department. No additional cost is associated with enlarging the parts area if the warehousing functions are relocated to another building. FINDING One parts clerk is responsible for maintaining the Transportation parts room. His responsibilities include checking inventories and reordering when necessary; checking parts out to the mechanics for use on work orders; and entering parts checked out into the work order module in the integrated financial system. The parts clerk often is unable to perform these duties, however, since he must fill in for absent drivers. Only one shift works in the parts room, even though two shifts of mechanics are scheduled. During times when the parts clerk is absent, the head mechanic fills in to distribute parts as needed. Although this practice allows mechanics to continue repairs, it takes the head mechanic away from other duties. Recommendation 116: Add a second parts clerk position. The addition of a second parts clerk would permit the parts room to remain open for two

shifts, providing mechanics with more timely access to parts and eliminating the need for the head mechanic to be distracted from his other duties. Faster turnaround times for repairs and servicing should result. IMPLEMENTATION STRATEGY AND TIMELINE
1. The director of Transportation requests the addition of a second parts clerk position. June 1998
2. The associate superintendent of Human Resources adds a second parts clerk position. June 1998
3. Human Resources hires a second parts clerk. August 1998
FISCAL IMPACT The existing parts clerk is classified as a AN06 grade with a minimum salary of $7.61 per hour. At eight hours per day, 260 days per year (these positions are considered year round position that are based on calendar year and not school year), the annual salary would be $15,829. With benefits adding another 36.85 percent, the total annual budget impact would be $21,662.
Recommendation 1998-99 1999-2000 2000-01 2001-02 2002-03
Add a second parts clerk position ($21,662) ($21,662) ($21,662) ($21,662) ($21,662)
FINDING A good preventative maintenance (PM) program is critical to fleet maintenance. By regularly checking vehicles and making simple repairs early, mechanics can catch minor problems before they develop into major expenses. Maintenance programs reduce fleet wear and tear and the number of breakdowns. The Transportation Department has a PM program in place to inspect its buses and support fleet every 3,000 miles. Most fleet operators schedule PMs every 3,000 to 6,000 miles. The PM inspection calls for changing the oil and oil filter; topping off all fluids; and checking the brakes, belts, and hoses. The budget clerk is responsible for sending out a notice to maintenance personnel that a bus is due for a PM. The budget clerk bases this decision on a monthly check of the mileage on bus odometers or the passage of three months since the last check. The

department has no tracking mechanism to determine if PM inspections are completed on time or whether the buses required additional services outside of the PM checklist. The department has no records to show the number of times a mechanic must go into the field to repair a bus or the number of wrecker calls made. No system is in place to schedule needed repair work identified during a PM inspection. TSPR noted numerous oil leaks in the fleet during a site visit. A good vehicle maintenance information system (VMIS) can ensure a successful PM program. A VMIS tracks the due dates for PMs, the cost of parts and labor, the services or repairs performed, and the amount of fuel consumed. The district's integrated financial system is designed to function as a VMIS system. This program is beginning to be implemented by the Transportation Department, but not in a manner that will fully use its capabilities. For example, parts costs are tracked by work order, but labor hours are not. To determine the true cost of repairs on a vehicle, all costs must be accounted for, including labor, fluids, fuel, and parts. By using all of the features of the integrated financial system, YISD could record data by bus including PM inspections, labor costs by function, parts costs by repair category, and fuel use. Performance indicators such as inspections completed on time, maintenance hours per bus, repair costs per bus including labor and parts, miles per gallon of fuel, miles between repeat repair, and miles per major component before failure also could be tracked. Maintenance costs per bus could be tracked by type of vehicle based on fuel type, age, length, or special features such as air conditioning. Reports also could be prepared to compare average miles per bus or to calculate average miles between roadcalls by type of bus or type of service. This tracking capability would allow mechanics to determine the true cost of maintaining the fleet. The department could identify the most expensive vehicles to maintain and target them for retirement. By documenting unusual patterns, such as alternator problems on specific bus models, the mechanics can have the manufacturer perform warranty repair work. The VMIS reports also could highlight changes in fuel use and alert mechanics that a specific bus may need attention. Recommendation 117: Fully use the integrated financial system as a vehicle maintenance information system. This recommendation would provide a tool to track and record more detailed information for each vehicle in the fleet. The two parts clerks are the most appropriate individuals to enter information into the computer database. This data entry would require more time than these positions have available, since the parts clerks frequently fill in for absent drivers. With TSPR's recommended driver staffing changes, however, this interference would be reduced substantially, allowing the parts clerks to maintain the VMIS database.

All of the mechanics must be able to obtain data and review reports from the database. To ensure the accuracy of the VMIS, however, only the parts clerks or a supervisor should be authorized to enter or change information in the database. Once the information from each work order is completed by the mechanics or the shop foreman has been entered, the work orders would be closed so they can no longer be modified. IMPLEMENTATION STRATEGY AND TIMELINE 1. The director of Transportation directs mechanics to record June 1998 hours spent on each repair. 2. Drivers agree to record miles and fuel use for their vehicles. June 1998 3. The director of Transportation, maintenance foreman, July 1998 and other personnel determine desired reports. FISCAL IMPACT The additional reporting requirements could be adopted within existing resources. FINDING The Transportation Department does not track the use of commodities such as oil, antifreeze, and steering fluid. Risk Management tracks total oil use, but not by bus. Drums holding 55 gallons of used fluids were mixed with drums of new fluids in both interior and exterior locations. TSPR saw no procedures to monitor the use of the fluids and arrange for their eventual disposal. Moreover, the district lacks procedures for tracking the use of parts. The parts clerk can verify that parts under his control have been checked out for a specific work order, but he cannot verify, that the parts checked out have been used on a specific job. TSPR noted that air filter kits stacked against one wall had all been checked out for certain work orders, but no tracking of the specific parts used from the kits was available. By not returning unused parts from kits to the parts room, the district uses too many kits and misses an opportunity to return the parts for credit. Since the district has no tracking mechanism for supplies not controlled by the parts room, TSPR could not evaluate their use or determine the appropriateness of these uses. Furthermore, completed work orders are not entered into the integrated financial system program in a timely manner. During one site visit, TSPR learned that the head mechanic, who is responsible for entering completed work orders into the system, had not done so for more than a month. The delay apparently was due to a broken computer; even so, this delay indicates that accurate and timely records are perceived as a low priority.

Finally, the parts room does not have a printer. To print work orders, the parts clerk must use the printer in the head mechanic's office. Recommendation 118: Expand the duties of the parts clerks to enter all work orders and monitor all stockroom supplies. The two parts clerks should be responsible for entering completed work orders into the computer system. This would allow the head mechanic to concentrate on running the shop instead of maintaining records. The parts clerks should verify that the mechanics have correctly filled out work orders, noting the time spent and fluids used, in addition to the parts. This would provide an extra check on the tracking of the maintenance work. The parts clerks would be responsible for verifying that the parts used actually match the parts checked out. Any unused parts should be reclaimed and returned to storage or submitted to the vendor for credit. Two parts clerks would be able to maintain an inventory of cores and ensure they are promptly returned for credit. The tire and fluid inventory also would be tracked by the parts clerks, who would be responsible for ordering new fluids and tires in a timely manner and arranging for the disposal of used fluids and tires. IMPLEMENTATION STRATEGY AND TIMELINE 1. The director of Transportation redefines the duties of the parts June 1998 clerk position. 2. The parts clerk records hours, miles, and fuel use in the June 1998 computer system 3. The parts clerk prints out list of vehicles due for PM inspection. Monthly FISCAL IMPACT To support the parts clerks in their expanded responsibilities, the parts area should have a computer printer at an estimated cost of $500.
Recommendation 1998-99 1999-2000 2000-01 2001-02 2002-03
Expand duties of the parts clerk ($500) $0 $0 $0 $0
FINDING The Transportation Department has a program to refurbish older buses in the fleet. Depending upon the needs of the bus, the engine and drivetrain are rebuilt; seats and

floors removed and repaired; bodywork and glasswork repairs are made; and the entire bus is repainted. The director of Transportation said this work extends the life of the bus, although a specific number of additional years of life has not been calculated. Both YISD staff and vendors under contract perform the refurbishment work. Depending upon the bus, the YISD maintenance staff repairs and replaces the floors and seats and some of the engine and transmission work. Vendors are responsible for any body and glass repairs, including repainting. Buses are selected for this program in a variety of ways. If a bus is in an accident, the head of Maintenance evaluates the bus to determine its expected lifespan. If the damage is mostly cosmetic, the bus is a good candidate for rehabilitation. Similarly, if the bus requires an engine or transmission overhaul, body and paint work likely will be scheduled at the same time. Transportation does not perform any analysis of the expected costs and benefits for each bus. For example, is it cost effective to refurbish a bus with a very short remaining useful life, or will refurbishing substantially increase the buses useful life. This program may be a creative and responsible way to prolong the life of the fleet. Based on the average price of a new bus-$52,500 amortized over 15 years,-the annual cost of a new bus is approximately $3,500. For every $3,000 to $4,000 spent on rehabilitating a bus, one additional year of life should be gained to recover the costs. Furthermore, this program does not track labor hours. The director of Transportation said these hours are not tracked since they are part of the regularly scheduled hours for the mechanic. This practice, however, prevents the district from establishing the total costs of the rehabilitation program. The work performed by the vendors is not carefully checked. The district pays about $3,000 per bus for painting and minor body work. The painting is supposed to include a urethane coating to prolong the life of the paint. Based upon a field examination, however, some of the buses appear to have had only one coat of paint and no urethane. Other buses were missing rivets, indicating a lack of thorough inspection procedures when buses return from the vendors. Recommendation 119: Fully track the cost of the rehabilitation program and perform a cost/benefit analysis for each bus. The analysis of the costs of this program should include an assessment of the vendor's cost and the cost of the Transportation Department staff. Such an assessment should include the estimated labor hours for the repairs; the wage rate of the employees performing the work, including their benefits; and an allocation of the overhead expenses of the department. These costs could be assigned through the VMIS system, which can track costs by the work performed.

IMPLEMENTATION SCHEDULE AND TIMELINE 1. The director of Transportation instructs maintenance June 1998 staff to fully track the expenses of the program. 2. The head of Maintenance documents the selection criteria June 1998 for inclusion in the program. 3. The head of Maintenance prepares a cost estimate for Ongoing each bus to be included in the program. 4. The director of Transportation issues final approval for Ongoing rehabilitating the buses. 5. The director of Transportation performs a six-month review of the January 1999 program to determine if the program should continue. FISCAL IMPACT No additional fiscal impact is anticipated from increased monitoring of this program. Savings should result by better identification of the work to be performed and better monitoring of its progress. Savings also may also occur if the evaluation shows the overall costs of the program exceed the benefits received. FINDING The Service Center has six enclosed service bays, four that are dedicated to bus maintenance and two that are used for upholstery repair. Two partially enclosed bays are not used by the Transportation Department because they are filled with miscellaneous facility maintenance supplies and equipment. The six operational bays are inadequate to maintain the district's fleet of 145 buses and 188 support vehicles. Most transportation operations have one maintenance bay for every 20 to 30 vehicles. In a review of the Houston ISD, a survey revealed that a minimum of one bay for every 50 vehicles is required, assuming two shifts of mechanics are assigned to each bay. This implies that at least six repair bays are needed at the Service Center. Recommendation 120: Enclose and clean out the two exterior maintenance bays at the Service Center to increase maintenance capacity. With the recommended route reductions, the Service Center would house 130 buses and 188 support vehicles. At 50 buses per repair bay, six repair bays would be required. Enclosing the two exterior bays would provide six repair bays. The district is considering

this enclosure. The Maintenance Department under the Facilities Division would relocate materials stored in the bays. As noted in the facilities chapter, the district is considering purchasing an existing building for Warehouse, Purchasing, and Food Services. Moving these departments would free up space in the Service Center, allowing Transportation to take over the bays. No date for the move has been set. IMPLEMENTATION STRATEGY AND TIMELINE 1. The director of Transportation meets with the director of June 1998 facilities to arrange a takeover date (see Implementation Strategies and Timeline for Recommendation 5-10 in the facilities chapter). 2. The director of Facilities arranges takeover date. March 1999 3. Facilities/Distribution moves out of the two bays. March 1999 4. The director of Transportation solicits bids on enclosing the March 1999 two bays. 5. The district receives bids and awards the contract. April 1999 6. Contractor completes construction. May 1999 FISCAL IMPACT The space for the two bays is about 30 feet wide and 50 feet long, for a total area of 1,500 square feet. At a modest cost of $5 a square foot to complete the enclosure and $1,000 each for an overhead door, $9,500 would be required to complete the enclosure. This expense is not included in the propose purchase of new warehouse facility. The district would realize savings through better fleet maintenance; again, however, Transportation records are inadequate to produce any estimate of savings.
Recommendation 1998-99 1999-2000 2000-01 2001-02 2002-03
Enclose two exterior bays ($9,500) $0 $0 $0 $0

Chapter 10
Organization and Staffing F. Opportunities for Shared Services CURRENT SITUATION This section considers recommendations that are appropriately implemented on a regional basis. Their nature goes beyond the ability of a single district to implement effectively. The organizations described below may be appropriate for implementing the recommendations; however, another organization may be required. YISD is a member district of the Region XIX Educational Service Center (ESC) of the TEA. Region XIX, which covers El Paso and Hudspeth Counties, offers a TEA-approved 20-hour training course for new drivers. This five-day course covers all aspects of driver safety, from maintaining order inside the bus to pre-trip inspections to safe driving habits. Region XIX also offers an eight-hour recertification program. Drivers must take the five-day course initially and a recertification course every three years. YISD also is a member of the Sun Country Association for Pupil Transportation, which in turn is a member group of the Texas Association for Pupil Transportation. The Sun Country area covers approximately the same area as Region XIX. The primary purpose of this organization is professional development and networking opportunities. The El Paso Metropolitan Planning Organization covers Ysleta ISD and offers several programs to area governments. FINDING YISD's Transportation Department uses the resources of the Region XIX ESC to train newly hired bus drivers and to provide retraining for previously hired drivers. Before drivers can operate a bus, they must either be enrolled in or have passed the Region XIX course. Drivers are allowed to drive a bus before successfully completing the safety course because the course is only offered three or four times during the school year. Drivers are hired throughout the year and the Transportation Department does not wait until the next course is offered because it must fill its open positions. The new driver must complete a 20-hour YISD course before driving a new route, however. The periodic nature of the Region XIX course works to the disadvantage of all school districts in the region. Drivers are hired when vacancies occur, but if a vacancy occurs shortly after the course has been offered, the driver may operate a bus for some time before receiving the training.

The Texas Department of Public Safety (DPS) is scheduled to take over the bus driver certification program. The details of the DPS plan have not been established. The effect on training in addition to certification is unknown at this writing. Recommendation 121: Implement a more frequent driver-training course throughout the school year at the Region XIX Educational Service Center. The Region XIX ESC is the appropriate location for a driver-training course. YISD and surrounding districts should formally request that the ESC offer this training on a more frequent basis to all school districts in the area. The increased frequency of the training will reduce the time in which new drivers go without training. IMPLEMENTATION STRATEGY AND TIMELINE 1. The director of Transportation requests that the Region XIX ESC offer June 1988 more frequent classes. 2. The director of Transportation and Region XIX determine July 1998 the appropriate schedule. 3. Region XIX begins a more frequent schedule. September 1998 4. The director of Transportation and associate superintendent Ongoing of Human Resources coordinate hiring schedules to match raining schedules. FISCAL IMPACT The district would not have a fiscal impact for YISD because the district already pays for drivers to receive training at Region XIX. Assuming Region XIX covers the cost of the training through course fees, Region XIX also would incur no additional cost. FINDING YISD does not offer training and certification programs for its mechanics. A mechanic cannot obtain any training from YISD to become certified in school bus repair and maintenance. Such training is essential for mechanics to improve their skills and keep abreast of changes in technology. Training for mechanics parallels the district's mission to educate its students. A national program to test the skills and knowledge of mechanics has been established by the National Institute for Automotive Service Excellence (ASE). As of November 1997,

ASE developed a series of six School Bus Technician tests at the request of the National Association for Pupil Transportation. These exams cover body systems, diesel engines, the drive train, brakes, suspension and steering, and electrical systems. An additional two exams are being developed to make for a total of eight exams. These exams are offered at more than 700 centers nationwide in May and November each year. To become ASE-certified, a technician must pass one or more of the exams and present proof of two years of relevant work experience. Technicians must be recertified every five years. This ASE program is a testing-only program that certifies the knowledge and skills a mechanic already possesses. It is not a training program. To maintain ASE certification, a mechanic needs both initial and continuing training. Recommendation 122: Coordinate with El Paso County Community College to offer training courses designed to train participants for ASE certification. Ysleta has 14 mechanics, not enough to justify an in-house training program. By coordinating with the community college, a training course that leads to ASE certification could be developed for use by other school districts and the general public as well as YISD. To encourage participation in the program, the district should pay all course fees for its mechanics and offer a pay bonus for mechanics that successfully complete the certification. IMPLEMENTATION STRATEGY AND TIMELINE 1. The director of Transportation meets with neighboring school June 1998 districts and the community college district to determine course requirements. 2. The community college district designs an appropriate course. July 1998 3. The community college district begins the course offering. January 1999 4. The first mechanics receive their certification. June 1999 FISCAL IMPACT The training course is estimated to cost $200 a semester per mechanic. Two mechanics are assumed to take the course in the first semester, with two additional mechanics taking it each semester thereafter until at least 10 of 14 mechanics elect to receive the training. The training would be offered after hours and two semesters would be required to pass all ASE exams.

The pay incentives are estimated at a 50 cent an hour increase after four exams are passed and another 50 cent increase when the final four exams are passed. In the first fiscal year, the estimate assumes that two mechanics would take and pass one semester's course. Their raise would be effective for three months of the year. In the second year, four mechanics would take the course each semester, with raises in effect in January and June of each year.
Recommendation 1998-99 1999-2000 2000-01 2001-02 2002-03
Pay training fees for mechanics ($400) ($1,600) ($1,600) ($1,600) ($1,600)
Wage incentive pay ($520) ($6,240) ($10,400) ($14,560) ($18,720)
Total investment ($920) ($7,840) ($12,000) ($16,160) ($20,320)
FINDING The Transportation Department purchases seve ral items on a recurring basis, including fuel, school bus parts, and tires. Ysleta could receive bulk discounts on such items if it pooled its purchases with those of other districts. Cooperative purchasing with neighboring school districts and other transportation providers such as Sun Metro could result in improved buying power and lower costs. Larger purchasers are able to obtain significant discounts on fuel. Fuel prices can be negotiated as a markup on the spot market price, which is usually the lowest available price. Ysleta bids its fuel supply based on the spot market price as quoted by the Oil Price Information Service (OPIS), allowing Ysleta to receive a favorable fuel price. The bid price is one-half cent above the OPIS price for 210,000 gallons of unleaded and five cents above the OPIS price for 45,000 gallons of diesel. Other districts, such as Tyler ISD, have been able to negotiate prices below the OPIS levels. San Antonio ISD formed a buying cooperative with seven other school districts and several government agencies. In TSPR's 1991 review of San Antonio, the district was estimated to save $23,000 annually through this program. Other districts reporting similar cooperative purchases include San Angelo and Midland ISDs. Similarly, Spring ISD created a buying cooperative with eight other school districts to purchase tires. The cooperative has no overhead expenses and arranges for the purchasing and disposal of tires. Savings for all participating districts total $60,000 a year. Ysleta purchases its tires through the General Services Commission. Spring ISD reportedly receives a better discount through its local buying cooperative than through GSC. Recommendation 123:

Create a buying cooperative with other transportation providers in the region. A buying cooperative composed of all 12 school districts in Region XIX and Sun Metro would represent a sizable market. Such a cooperative could negotiate for lower prices on fuel, parts, tires, and repair services by outside vendors. A cooperative could avoid paying the state sales taxes that individual districts pay when small purchases do not justify the paperwork needed to avoid the taxes. IMPLEMENTATION STRATEGY AND TIMELINE 1. The director of Transportation meets with other districts. June 1998 2. The districts select a lead district July 1998 3. The districts sign an interlocal agreement. August 1998 4. Buying cooperative begins purchasing. August 1998 FISCAL IMPACT TSPR estimates that this cooperative could obtain unleaded at two-fifths of a cent above the OPIS price and diesel at four cents above the OPIS price. The revised unleaded price would save $210 a year, and the diesel price $225 annually. Based on savings experienced at Spring ISD and Ysleta's fleet size, Ysleta could realize savings of $6,000 annually on the purchase and disposal of tires alone. In total, the district should realize a minimum of $6,435 in savings from full implementation of this recommendation, and that amount should rise as other commodities are purchased cooperatively.
Recommendation 1998-99
1999-2000
2000-01
2001-02
2002-03
Create a buying cooperative for transportation. $6,435 $6,435 $6,435 $6,435 $6,435

Chapter 11
FOOD SERVICES This chapter reviews YISD's food service operations in four sections:
A. Organization and Staffing
B. Food Service Operations
C. Information Systems and Management Reports
D. Facilities
BACKGROUND A school food service program should provide high quality, nutritional breakfast and lunch meals to students while operating on a break-even basis. Several success factors can be used to evaluate the efficiency and effectiveness of a food service operation, including low food and labor costs, high student participation in both breakfast and lunch, popular menu items, meal variety, high nutritional value, and financial self-sufficiency.

Chapter 11
FOOD SERVICES A. Organization and Staffing CURRENT SITUATION YISD's Food and Nutrition Department employs 495 full-time equivalent employees (FTEs) who operate 54 kitchen facilities and provide service to 56 schools. The Food Service director reports to the executive director of Auxiliary Services. Exhibit 11-1 presents the organizational structure of the Food and Nutrition Department.
Exhibit 11-1 YISD Food and Nutrition Department
Organizational Structure
Source: YISD Food and Nutrition Department Exhibit 11-2 presents a typical campus organizational structure for Food and Nutrition operations at most YISD facilities. Staffing levels range from seven to 16 employees depending on the size of the school's operations.
Exhibit 11-2 YISD Food Service

Campus Organization Structure
Source: YISD Food & Nutrition Department. Cafeteria managers and assistant managers are responsible for the efficient operation of the food service program at their assigned schools in coordination with the school principals The major cook is respons ible for food preparation, inspection of kitchen equipment, and safety and sanitation practices. The cashier II processes free and reduced-price meal applications, handles monetary transactions, and monitors student participation. The helper assumes responsibilities and duties as assigned by the cafeteria manager. YISD's Food and Nutrition Department is in the process of eliminating all minor cook and cashier I positions through attrition. The district's annual turnover rate for Food and Nutrition Department employees is 5.4 percent. FINDING The Food and Nutrition Department has suffered from a lack of consistent management for the past 11 years and, as a result, has experienced poor operating results. The district has had three different Food and Nutrition directors in the past 11 years, with the district going as long as 10 months without a permanent director. This level of turnover in Food Service directors is somewhat uncommon for a public school district of YISD's size. Most recently, the last permanent Food and Nutrition director resigned in January 1998 after being employed for only six months. The director of Auxiliary Services is acting as interim Food and Nutrition director while a new director is sought.

More than 69 percent of the district's students are eligible for free and reduced-priced meals, yet on average only 15.9 percent of them participate in the district's breakfast program and only 50 percent participate in the district's lunch program. Also, while the district's food costs as a percentage of revenue are in line with industry standards, its labor cost as a percentage of revenue exceed suggested industry guidelines (Cost Control Manual for School Food Service Directors) by 16 percent. The combination of inconsistent Food and Nutrition management, low breakfast and lunch participation rates, and relatively high labor rates have caused the district's food service program to operate at a deficit in three of the last four years.
Exhibit 11-3 YISD Food and Nutrition Department
Key Operating Statistics 1996-97 School Year
Description
No. of Schools Served 54
Food Service Average Daily Attendance 96/97 47,384
# of Students Approved for Free/Reduced Priced Meals
- Free 62.1%
- Reduced 7.7%
- Total 69.3%
Avg. Number of Meals Served Daily
- Breakfast 7,531
- Lunch 23,710
Avg. Meal Participation Rate
- Breakfast 15.9%
- Lunch 50.0%
Open/Closed Campuses Open
Expenditure Data
- Labor cost % 56%
- Food Cost % 38%
- Operating Cost % 5%
- Other % 1%

Total 100%
Source: TEA Child Nutrition Program Division. Exhibit 11-4 summarizes other key food service program success factors that are identified and discussed in other sections of this chapter, and notes areas where YISD needs improvement.
Exhibit 11-4 YISD Food Service Compared Against Key Success Factors
Success Factor Status
Productivity All schools below industry norms for meals per labor hour (MPLH) by between five and 13 MPLH.
Management and Administrative Staff
Managers and field supervisory staff are not held responsible for cafeteria operations.
Management Information Systems and Automation
Systems are available at the high school campuses but all other campuses must track information manually.
Quality Control Inadequate for the identification and resolution of recurring quality control problems.
Preventive Maintenance/Work Order System
No preventive maintenance schedule in place.
Source: TSPR. Recommendation 124: Immediately hire or contract for food service management to implement a program that will operate profitably and meet key success factors. After hiring or contracting for food service management, YISD's executive director for Auxiliary Services should monitor improvements to its food service operations and management for one year and evaluate both operating statistics and key performance factors. The terms of employment, or contract, should include a set of expectations for improvement and a salary commensurate with the task at hand. Recruitment should not be limited to existing school district food service managers and could include obtaining proposals for management services from food services management companies. IMPLEMENTATION STRATEGIES AND TIMELINE

1. The executive director of Auxiliary Services prepares a tentative list of key performance measures, a job description, and salary plan, and seeks superintendents approval to proceed.
June 1998
2. The executive director of Auxiliary Services conducts an independent search for a director of Food and Nutrition operations.
July 1998
3. The executive director of Auxiliary Services presents various options to the superintendent for management of YISD's Food and Nutrition Department.
July 1999
4. The superintendent makes a recommendation to the board. August 1998
5. The board evaluates and approves the proposals for food service management.
August 1998
6. The new Food and Nutrition manager assumes position. August 1998
7. Annually, the board evaluates Food and Nutrition operations. Annually
FISCAL IMPACT During the first year of a performance-based food service management contract, YISD should expect to increase revenue through the implementation of best practices in the area of marketing and menu planning. Through staff reductions and the implementation of increased productivity strategies outlined in other recommendations throughout this report, the district also should expect a gradual reduction in labor costs and a corresponding budget surplus. The estimated budget surpluses each year should enable the district's Food Service program to operate profitably and begin to build its fund balance. FINDING Primary responsibilities for the field supervisor position includes ensuring safe food production, coordinating work schedules, managing inventory across campuses, and evaluating employee performance. Although these represent valuable activities to the district, field supervisors are not empowered or required to make management decisions regarding operations of cafeterias at their assigned schools. For example, the duties and responsibilities of the field supervisor position do not include performing financial analysis of prescribed operational and financial performance measures for school food service operations. If labor costs are too high and are contributing to operating losses at a specific facility, field supervisors currently do not have the responsibility or capability to monitor this situation, nor are they given the authority to effect change.

Additionally, three field supervisors oversee and monitor food service operations at about 18 schools each and the district has one field supervisor position, which is vacant. The span of control for the existing number of field supervisors is too large to provide adequate management and direction to such a large number of individual schools food service operations. Recommendation 125: Redefine the duties and responsibilities of the field supervisors so that they are held accountable for cafeteria operations. Fill the vacant field supervisor position. YISD should hire an additional supervisor to fill the current vacancy. An additional supervisor would reduce the number of schools managed by each supervisor to between 13 and 15. This reduced span of control should increase accountability and direction over food service operations through more focused management at each school. Furthermore, measurable goals relating to cafeteria performance should be set for each cafeteria manager and supervisor and for the director of the Food and Nutrition Department. Their performance should be monitored by the appropriate supervisors and reflected in employee evaluations. Field supervisors should conduct monthly and quarterly analyses of financial and operational performance; ensure that schools operate efficiently, and ensure that meals are nutritious and appetizing. Field supervisors should have the authority to make financial, operational, and staffing decisions at their school cafeterias based on operational and management reports. IMPLEMENTATION STRATEGIES AND TIMELINE
1. The Food and Nutrition director redefines the field supervisor duties and responsibilities to increase accountability and oversight responsibility for this position.
May 1998
2. The Food and Nutrition director contacts the Human Resources Department to advertise the vacant field supervisor position.
May 1998
3. The Food and Nutrition director interviews selected successful applicants. June 1998
4. The Food and Nutrition director facilitates the hiring, orientation, and training of the new field supervisor.
July 1998
5. The Food and Nutrition director informs all field service supervisors of their new job duties.
June 1998
6. The Food and Nutrition director implements the revised field supervisor job duties.
August 1998

FISCAL IMPACT This recommendation can be implemented with existing resources since the recommended hire is for a position that is already approved and funded.

Chapter 11
FOOD SERVICES B. Food Service Operations CURRENT SITUATION Food and Nutrition Department staff serve about 31,000 breakfasts and lunches daily, and more than 6 million meals annually. Food and Nutrition receives revenues both from federal reimbursements for students in low-income families, and from meal prices paid by students in families able to do so. Food and Nutrition employees receive free meals during working hours; school administrators, teachers, and parents are required to pay adult meal prices. YISD's food costs for school years 1993-94 through 1996-97 ranged from 37 to 39 percent of total department revenue. The district's food costs percentages are slightly below the industry standard of 40 percent of total revenue. Exhibit 11-5 presents YISD's Food and Nutrition revenue sources, expenses by major category, and the variance between expenses and revenues for school years 1993-94 through 1996-97. Food and Nutrition lost money on operations in three of the four previous fiscal years. According to the executive director of Auxiliary Services, the department has taken corrective actions and expects to show a positive fund balance by the end of 1997-98. To maintain the nonprofit status of the National School Lunch and Child Nutrition Programs (NSLP), the fund balance or net cash reserves of the food service account should not exceed three month's operating expenditures. YISD's food program fund balance was $1,023,738 at the end of 1996-97, which represents about one month of operating expenditures.
Exhibit 11-5 YISD Food and Nutrition Operations
Revenue and Expenses by Major Category

1993-1997
Local revenues include full-price breakfasts, lunches, a la carte items, and investment interest. Federal and state revenues are provided through the child nutrition breakfast and lunch programs and state matching funds for federal reimbursed lunches. YISD participates in three federal food programs including the National School Breakfast Program, National School Lunch Program, and the U.S. Department of Agriculture Donated Commodities and Food Distribution Program. At the beginning of each school year, YISD gives each student an application form for free and reduced-price meals. The student's parents complete and return the form to the school. Qualified students are then set up to receive free or reduced-price meals according to federal guidelines. Food and Nutrition is reimbursed by the federal government for each free and reduced-price breakfast or lunch served to eligible students. Exhibit 11-6 presents the reimbursable rates for each eligible breakfast and lunch served.
Exhibit 11-6 YISD Federal Reimbursable Rates
for Breakfast and Lunch
Breakfast Lunch
Full $0.1975 $0.1775
Reduced $0.7175 $1.4375
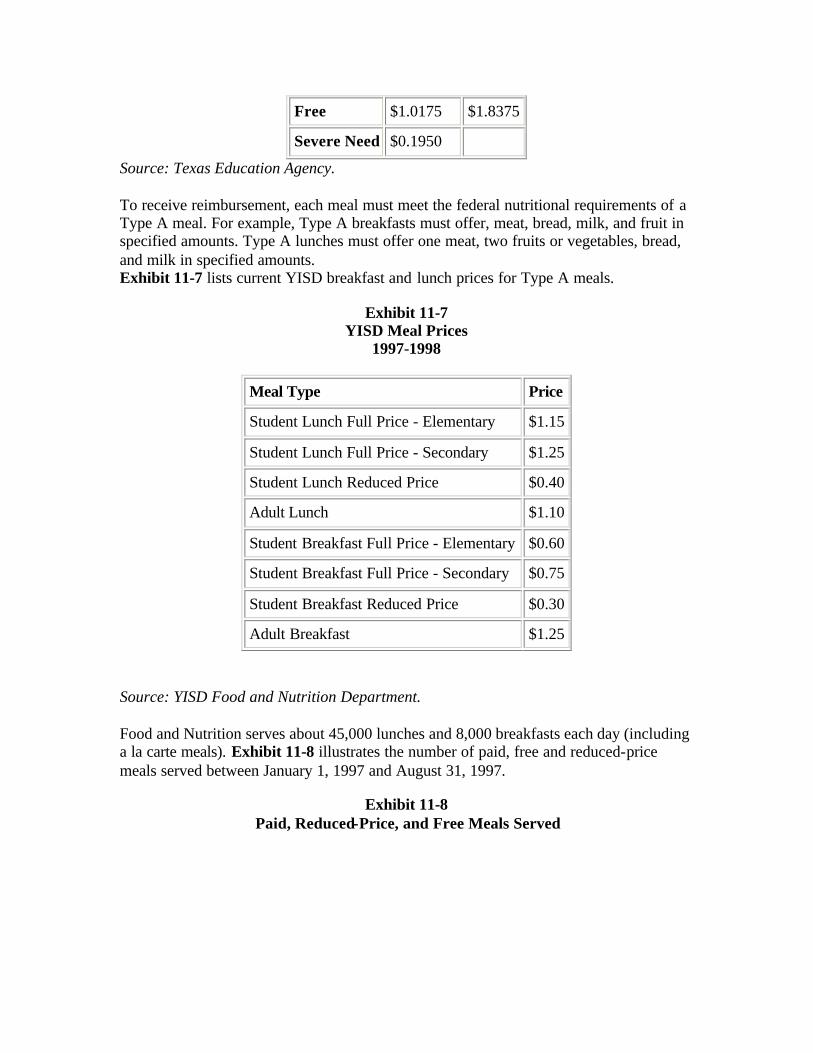
Free $1.0175 $1.8375
Severe Need $0.1950
Source: Texas Education Agency. To receive reimbursement, each meal must meet the federal nutritional requirements of a Type A meal. For example, Type A breakfasts must offer, meat, bread, milk, and fruit in specified amounts. Type A lunches must offer one meat, two fruits or vegetables, bread, and milk in specified amounts. Exhibit 11-7 lists current YISD breakfast and lunch prices for Type A meals.
Exhibit 11-7 YISD Meal Prices
1997-1998
Meal Type Price
Student Lunch Full Price - Elementary $1.15
Student Lunch Full Price - Secondary $1.25
Student Lunch Reduced Price $0.40
Adult Lunch $1.10
Student Breakfast Full Price - Elementary $0.60
Student Breakfast Full Price - Secondary $0.75
Student Breakfast Reduced Price $0.30
Adult Breakfast $1.25
Source: YISD Food and Nutrition Department. Food and Nutrition serves about 45,000 lunches and 8,000 breakfasts each day (including a la carte meals). Exhibit 11-8 illustrates the number of paid, free and reduced-price meals served between January 1, 1997 and August 31, 1997.
Exhibit 11-8 Paid, Reduced-Price, and Free Meals Served

January 1, 1997 - August 31, 1997
Source: Texas Education Agency FINDING Participation rates for YISD's lunch program are low. Exhibit 11-9 compares lunch participation at YISD with eight peer districts. The chart shows the number of schools in each district, average daily attendance (ADA) and average daily participation (ADP).
Exhibit 11-9 ADA and ADP of Lunch Meals
YISD versus Peer Districts September 9, 1996 - August 31, 1997
District Number of Schools Average Daily Attendance
Average Daily Participation
ADP as % of ADA
San Antonio 91 56,639 40,871 72.16%
Dallas 204 150,048 90,893 60.58%
Corpus Christi 62 39,518 20,989 53.11%
Ysleta 54 47,384 23,710 50.04%
El Paso 78 66,481 32,785 49.31%
Fort Worth 112 73,733 35,697 48.41%
Houston 240 204,241 92,954 45.51%
Socorro 22 19,935 8,843 44.36%
Austin 97 74,139 32,700 44.11%
Averages 107 81,346 42,160 51.83%
Source: Texas Education Agency

Although YISD's lunch participation is only 1.8 percent below the peer group average, the current participation level of 50.04 percent offers a good opportunity for improvement. YISD has recognized the need to increase participation and has recently implemented a pizza program in coordination with Pizza Hut. This program began in January 1998 at six pilot schools. Three additional schools were added to the program between February and April 1998. Participating schools include:
• Eastwood High
• Parkland High
• Hanks High
• Ysleta High
• Bel Air High
• Eastwood Middle
• Desert View
• Eastwood Knolls
• Ysleta Middle
Participation rates in YISD's breakfast program also are low. Exhibit 11-10 compares YISD's breakfast participation with its peer school districts.
Exhibit 11-10 ADA and ADP of Breakfast Meals
YISD versus Peer Districts September 9, 1996 - August 31, 1997
District Number of Schools Average Daily Attendance
Average Daily Participation
ADP as % of ADA
San Antonio 91 56,639 17,674 31.20%
Dallas 204 150,048 27,504 18.33%
Austin 97 74,139 12,749 17.20%
Houston 240 204,241 34,973 17.12%
Fort Worth 112 73,733 11,813 16.02%

Ysleta 54 47,384 7,531 15.89%
El Paso 78 66,481 9,964 14.99%
Corpus Christi 62 39,518 5,876 14.87%
Socorro 22 19,935 2,576 12.92%
Averages 107 81,346 14,518 17.86%
Source: Texas Education Agency. YISD's breakfast participation is 2 percent below the peer group average, and far below San Antonio's exemplary rate of 31.2 percent. San Antonio has qualified every student for free or reduced-price breakfast (universal feeding program) and has made class time scheduling changes to encourage student participation in the program. In January, February, and March 1997, only 24.7 percent, 29.2 percent and 28.8 percent, respectively, of YISD's students eligible for free breakfast participated. TSPR identified the following barriers to improved breakfast participation:
• Family-style meals, where breakfast is served from the serving line, making the use of mobile cart sales systems impractical. Individually wrapped items would allow students to grab a meal and go on to class or visit with friends before class.
• The district does not have electronic/wireless point-of-sale equipment (i.e., register or hand held computer) that can be used on mobile carts. If a grab-and-go style breakfast were offered on carts positioned around the school, sales would have to be manually recorded by food service workers.
• Buses often arrive late due to school schedules, which limits the available time for breakfast.
Because the breakfast program begins before the school day actually starts, many students elect not to participate. Identifying ways to encourage more students to participate in the breakfast program is an ongoing concern for most school districts. Additionally, during cafeteria visits YISD students told TSPR that the layout of the breakfast program is not convenient for students to quickly select meals and limits students' time to socialize with students who elect not to participate. Yet, studies have shown that children who eat breakfast learn better, are less likely to be absent, and have fever discipline problems than those who do not. Food carts are often used to present individually wrapped food items to students at strategic locations throughout the campus. YISD's food carts remain in the cafeteria area

prior to the start of school and during lunch so that meals can be recorded in the system. However, the district is considering the acquisition of a wireless point-of-sale system that would enable food carts to leave the cafeteria area, making meals more accessible to students. Some YISD schools recently instituted a "grab-and-go" breakfast concept to increase participation. Students in 37 elementary schools eat in cafeterias; students in four high schools eat on the bus in route to school, in cafeterias, snack bar, or the classroom. Grab-an go tests in two elementary schools increased participation by 50 and 90 percent. Some school districts have placed mobile carts around the driveways of schools, creating a "drive-through" meal atmosphere similar to that of fast- food restaurants. Other schools have established a morning snack time during which breakfasts- in-a-bag are loaded into shopping carts and delivered to students in class. Increasing the class time of the first or second period by 10 or 15 minutes for meditation or eating should help increase breakfast participation. Brownsville ISD instituted a breakfast-to-go program in 1994 that resulted in a 617 percent increase in participation at the high school where they tested the program. Recommendation 126: Increase participation in the breakfast program by implementing innovative breakfast programs such as "grab-and-go." YISD should implement the grab-and-go breakfast concept at all secondary schools and begin test programs at elementary schools. Breakfast meals should be prepackaged for ease of serving and handling and should be served on mobile carts or other easy access/high traffic locations where students tend to congregate each morning before class. IMPLEMENTATION STRATEGIES AND TIMELINE
1. The field supervisors develop cost effective breakfast-to-go meals. May 1998
2. The school board considers and adopts a ten-minute eating period at the beginning of the school day.
June 1998
3. The Food and Nutrition director, supervisors, and cafeteria managers at secondary schools implement the grab-and-go program.
August 1998
4. The Food and Nutrition director and supervisors gather feedback from principals, teachers, students, and cafeteria managers to refine the program and record progress.
October 1998
5. The Food and Nutrition director and supervisors oversee the implementation of the breakfast program in all YISD elementary and secondary schools.
January 1999

FISCAL IMPACT YISD's federal breakfast revenues for the 1996-1997 school year were $1,851,439. A conservatively estimated increase of 20 percent in breakfast participation would generate additional federal revenues of $370,288 annually. The only additional cost should be for food, since the same labor can be used to prepare and serve breakfast. Food costs are about 40 percent of total costs, therefore YISD should realize a net profit of $222,173 once the program is fully implemented across the district. Net profit calculations assume only a third of the student population would be affected in the next school year and that the program would not be fully implemented until the school year 1999-2000.
Recommendation 1998-99
1999-2000 2000-01 2001-02 2002-03
Implement a breakfast-to-go concept in all YISD schools $74,100 $222,200 $222,200 $222,200 $222,200
FINDING Lunch periods at some YISD secondary schools are not staggered. A single lunch period requires additional resources to meet high-volume demand from students and can affect the quality of service, thus reducing participation. Staggered lunch periods improves the flow of students through serving lines, allow kitchen workers to restock food lines, reduce cafeteria noise and confusion, and improve oversight and security during lunch periods. Recommendation 127: Stagger serving times at all schools. YISD should stagger lunch serving times to allow its schools to handle additional work requirements with existing resources. Care should be taken to begin meals at times that best meet the needs of the various student age groups. IMPLEMENTATION STRATEGIES AND TIMELINE
1. The Food and Nutrition director works with the supervisors and high school principals to determine the number of lunch periods required and the appropriate times.
June 1998
2. The Food and Nutrition director, supervisors, and managers prepare individualized campus lunch schedules and work programs for Food and Nutrition personnel.
July 1998

3. The staggered lunch periods are implemented districtwide. August 1998
FISCAL IMPACT This recommendation can be implemented with existing resources. FINDING YISD does not currently pre-cost or post-cost menu items on a regular basis. Pre-costing involves projecting menu costs prior to preparing a menu item to measure its costs per serving. Post-costing involves determining the actual costs of menu items prepared. However, in the absence of a Food and Nutrition director the district discontinued the practice of costing meals. As a result, Food and Nutrition does not know if its meals are cost-effective. Menu item costing is a critical component of successful food service operations as it allows managers to make necessary adjustments to ensure that meals are nutritious and appealing while still being cost-effective. TSPR asked Food and Nutrition to prepare food and labor cost estimates for lunch meals served during the 1996-97 school year and these costs ranged from $1.11 to $1.63. The district has not established meal cost targets to ensure that the Food and Nutrition operations either break even or operate at a profit. Since the district charges only $1.25 for a full-price meal at the secondary level it is easy to see that there are meals that obviously lose money, while there are others that break even or make a marginal profit. Pre-costing meals would allow managers to determine if a meal is cost-effective and should be included on the menu; post-costing meals would help determine whether employees are following recipes appropriately and if individual cafeterias are operating efficiently. Monitoring costs in this manner would allow cafeteria managers and supervisors to evaluate the performance of each campus and maximize revenues throughout the district. Recommendation 128: Establish meal cost targets and monitor the costs of all meals served. YISD should establish targets for its meal costs. Management reports should be developed to track meal costs and used to evaluate actual performance. The Food and Nutrition Department should accurately determine its food and labor costs for all meals served at each campus. This analysis should include a review and cost-benefit calculation of food preparation costs (such as prepared meals versus scratch baking) and labor (full-time vs. part-time, shift employees, etc.). IMPLEMENTATION STRATEGIES AND TIMELINE

1. The Food and Nutrition Director uses the production planning and use forms found in the Cost Control Manual for Food Service Directors written by Dorothy V. Pannell.
May 1998
2. The Food and Nutrition director develops management reports to monitor food and meal costs.
May 1998
3. The Food and Nutrition director establishes target meal costs. May 1998 and Ongoing
4. Supervisors monitor individual campus inventory and food usage, track food costs, and compare them to budgeted amounts weekly. August 1998
5. The Food and Nutrition director and supervisors monitor weekly reports to track food costs, evaluate the performance of each school, and maximize revenues throughout the district.
August 1998
FISCAL IMPACT This recommendation could be implemented with existing resources. FINDING Micro Check, an automated point-of-sale device that automatically records individual student participation, is available in YISD's high school cafeterias. Student participation can only be tracked manually at all elementary and middle schools. Furthermore, the Micro Check system cannot communicate with any district cash management or inventory system making it necessary to manually re-enter data into other systems. YISD recognizes the need for a more comprehensive system and to purchase and begin installation of a modern, wireless point-of-sale system before the end of 1997-98. The district has purchased computers to support the system for all cafeterias. The district also has applied for a federal technology grant for food service. YISD is considering buying either the Student Nutrition Accountability Program (SNAP) or the Lunch Box system. Either system, when fully implemented and used effectively, would save YISD both time and money. Modern point-of-sale devices can record and monitor inventory, purchasing, production, meal counts, and finances in an efficient and effective manner. While in the planning stages, and in the absence of a director, the acquisition and installation of this proposed system appears to be on hold. Additionally, these systems provide a menu nutritional analyses component, which could allow the district an opportunity to evaluate the nutritional content of each meal served and to make adjustments when necessary in accordance with USDA nutritional content guidelines.

Recommendation 129: Implement the proposed acquisition of an electronic point of sale system. The Food and Nutrition Department should validate the final requirements and specifications of an electronic point-of-sale system that fits YISD's needs as soon as possible. The system should include such features as cash management, student participation, operational data controls, ad hoc performance indicators, ad hoc management reporting, wireless access, and network capabilities. IMPLEMENTATION STRATEGIES AND TIMELINE
1. The Food and Nutrition director, supervisors, and managers develop specifications and user requirements for an electronic point-of-sale food service system.
May 1998
2. The board approves the acquisition of a system and authorizes the issuance of a request for quotes from qualified vendors.
June 1998
3. The Purchasing Department initiates bidding procedures, including vendor demonstrations of proposed systems.
July 1998
4. The Food and Nutrition director approves the system and works with the vendor on a suitable implementation strategy and timeline.
August 1998
FISCAL IMPACT YISD has received a cost estimate of $450,000 for implementation of a system in all district schools and is planning to use a portion of the food service fund balance to pay for it when approved.
Recommendation 1998-99 1999-2000
2000-01
2001-02
2002-03
Acquire an electronic point of sale system ($450,000) $0 $0 $0 $0
FINDING Three YISD schools serve meals to students on recyclable dishes and dinnerware. However, the waste from these disposable materials is not recycled. State law requires governmental entities, which includes public school districts, to recycle at least 40 percent of their solid waste.

Other school districts have received grants from government entities to subsidize recycling programs. For example, Alief ISD has instituted a nationally recognized recycling program with a $98,000 grant from the Houston-Galveston Area Council. Materials recycled include aluminum, corrugated cardboard, paper products, wood, plastic, and polystyrene. The program is breaking even after two years and Alief ISD is exploring cooperative efforts with other school districts in its area. Recommendation 130: Implement a recycling program for the Food and Nutrition Department's solid waste. YISD should apply for a grant with local agencies willing to provide funding to establish a recycling program; establish a cooperative recycling program with other school districts in the YISD area; or establish its own recycling program. The district should contact Alief ISD to study its process for establishing a recycling program. IMPLEMENTATION STRATEGIES AND TIMELINE
1. The Food and Nutrition director determines the type and quantity of solid waste generated.
May 1998
2. The Food and Nutrition director determines if other schools in the area could participate in a cooperative recycling effort.
June 1998
3. The Food and Nutrition director identifies potential grant sources within the state and the El Paso area.
June 1998
4. The Food and Nutrition director develops findings and implications concerning the implementation of a recycling program in the 1998-99 school year and reports these findings to the associate superintendent of Operations.
July 1998
5. The Food and Nutrition Department's recycling program is implemented throughout YISD.
August 1998
FISCAL IMPACT This recommendation should be cost-neutral to the district since grants and revenues from recycled waste should offset the cost of the program. FINDING Vending machines in YISD schools are managed by the individual schools and the commissions go to each school's activity fund. Vendors, contracts, and revenues vary from school to school.

Virginia's Chesterfield County's Food Service Department assumed control of that district's vending program, which formerly operated like YISD's program. Chesterfield County's centralized program provides vending services for 62 sites, including 56 schools, and splits its vending profits 50/50 with the schools. Coca-Cola offered the Madison, Wisconsin school district a $100,000 signing bonus and an advance commission of $515,000 for entering into its three-year contract, worth an estimated $1.5 million. Several school districts in Texas have entered into contracts with soft drink companies, including Tyler, Houston, Grapevine-Colleyville, Galena Park, Clear Creek, Katy, and Alvin. TSPR learned during a follow up visit to the district that Tyler ISD signed a 10-year exclusive contract with Pepsi, in which it received a $500,000 bonus that was earmarked for technology-related projects. Recommendation 131: Negotiate an exclusive districtwide vendor services contract. YISD should negotiate an exclusive contract for vending machines throughout the district. Any incentives and profits from the vending machines should be split with the schools. IMPLEMENTATION STRATEGIES AND TIMELINE
1. The Food and Nutrition director meets with the associate superintendent of Operations to receive approval to negotiate an exclusive vendor contract for vending machines.
May 1998
2. The Food and Nutrition director and associate superintendent of Operations seek approval from the superintendent and board to initiate an exclusive binding contract.
May 1998
3. The associate superintendent of Operations notifies principals of plans to negotiate a prime vendor contract. May 1998
4. The Food and Nutrition director works with the Purchasing Department to develop a request for proposals to be distributed to vendors.
May 1998
5. The Food and Nutrition Director sends a request for proposals to vendors.
June 1998
6. The Purchasing and Food and Nutrition directors review responses and recommend a vendor.
August 1998
7. The Purchasing director initiates the contract for a prime vendor. September 1998

FISCAL IMPACT Commissions received by school districts from vending companies typically total 38 percent of gross revenue, of which 2 percent would go to the Food and Nutrition Department in the form of a management fee. YISD could not provide figures on annual vending machine revenues that would allow TSPR to accurately calculate the fiscal impact of this recommendation. FINDING YISD's number of meals produced per labor hour (MPLH) at YISD is low compared to industry standards. Exhibit 11-11 compares the current number of MPLH produced by each YISD campus with the number recommended by TEA's Cost Control Manual for School Food Service Directors.
Exhibit 11-11 Current and Recommended Meals Per Hour

September 1997
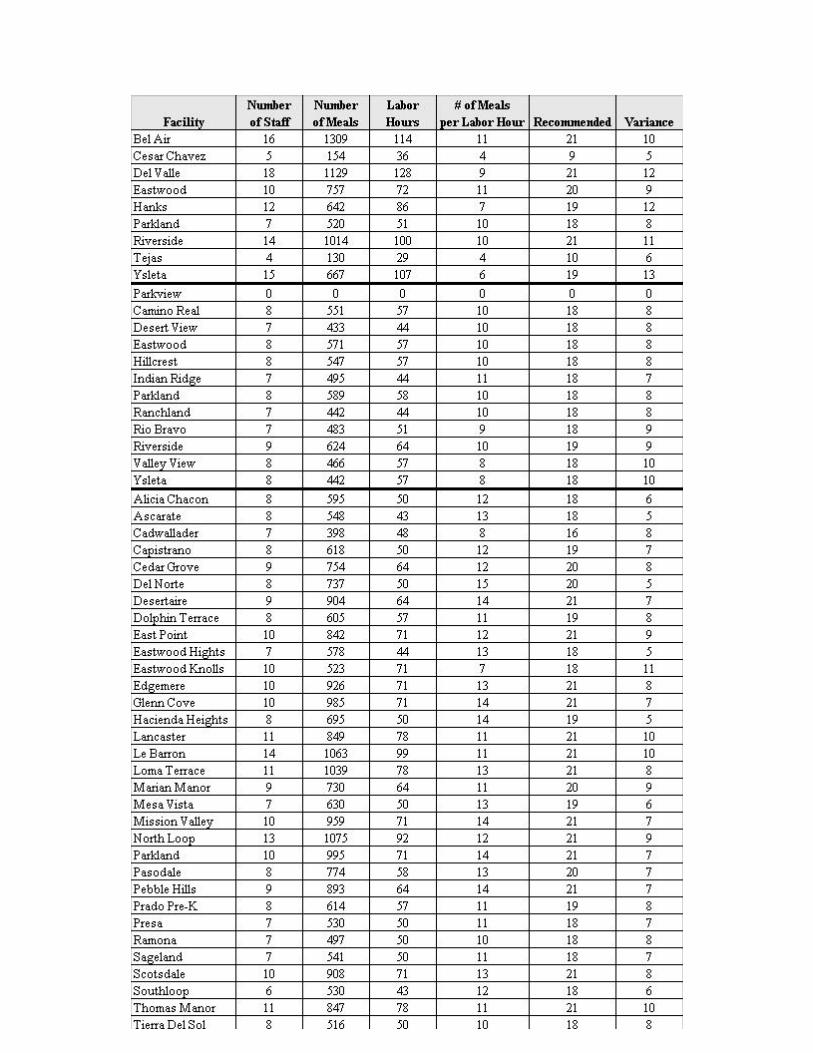

Source: YISD Food and Nutrition Department. Several factors contribute to the low number of MPLH of YISD's schools. These include the high number of menu items prepared from scratch, the use of silverware and non-disposable trays at most schools, the lack of automated/cashless systems at most schools, non-staggered meal service times, and non-staggered work schedules. Food and Nutrition supervisors indicated that due to the large quantities of government commodities the district receives and its limited storage space, they are forced to prepare many food items from scratch to avoid waste and spoilage. School districts that receive government commodities are typically not made aware of the type or amount of commodities until actually received. For this reason, scratch baking offers the best solution for commodity usage. Some districts have successfully addressed this issue by having commodities pre-processed into more useable forms. For example, whole turkeys may be pre-processed into turkey breasts, wieners, salami, and pot pies. If a single district does not have enough commodities to justify pre-processing, cooperatives are formed to allow a number of districts to go in together in pre-processing. In addition, Food and Nutrition appears to be overstaffed, another factor that can lower MPLH ratings. The department has identified eight positions that should be eliminated but has not taken steps to do so. Recommendation 132: Reduce food service labor costs to bring MPLH into industry standards. YISD's Food and Nutrition Department MPLH rate should be increased to industry standards suggested by TEA's Cost Control Manual for School Food Service Directors. Each school should be evaluated to determine the correct number of staff required to serve the students. The district should consider tactics such as the use of automated cashless systems, outsourcing of commodities processing, increased food storage capabilities, and staggered work schedules and meal service times to raise the number of meals produced per labor hour. The elimination of Food and Nutrition employees should be accomplished through attrition. IMPLEMENTATION STRATEGIES AND TIMELINE
1. The Food and Nutrition Director implements a hiring freeze. May 1998
2. The Food and Nutrition Director and supervisors create a plan and training program to increase productivity and reduce labor costs. May 1998
3. The Food and Nutrition supervisors train all cafeteria managers on new processes and strategies.
August 1998
4. The Food and Nutrition supervisors and appropriate cafeteria managers tailor the plan to fit the specific need of each YISD cafeteria.
September 1998

5. The Food and Nutrition director and supervisors review monthly management reports detailing MPLH by school.
October 1998
6. The Food and Nutrition director and supervisors evaluate progress, adjust specific school plans as needed, and share successful aspects of each plan with all cafeteria managers.
October 1998
FISCAL IMPACT Reducing labor costs to 40 percent of the food service operating budget, or 16 percent less than it currently is, will result in a five year savings of $4,140,084. The elimination of any food service employees should be accomplished through attrition. YISD's attrition rate for food service employees is 5.4 percent. Based on this attrition rate, YISD will not achieve its desired goal of reducing labor costs to 40 percent of its total operating budget until the 2000-01 school year. However, MPLH can be brought inline if strategies for increasing participation rates for breakfast and lunch are successful.
Recommendation 1998-99 1999-2000 2000-01 2001-02 2002-03
Reduce labor costs to bring MPLH into industry standards.
$345,007 $690,014 $1,035,021 $1,035,021 $1,035,021

Chapter 11
FOOD SERVICES C. Information Systems and Management Reports CURRENT SITUATION As noted above, YISD uses an electronic point-of-sale device with limited capabilities at each high school to track student accounts and provide participation information. Other than this system, all other systems Food and Nutrition Department reporting functions are performed manually. For example, cash reporting, inventory tracking, meals per labor hour, food costs, meal ticket tracking, student information, and other data either are not collected or are collected manually and inconsistently by cafeteria personnel at each campus. FINDING Food and Nutrition administrators, supervisors, and cafeteria managers are not using adequate management reports for their management of food service operations. Existing management reports do not provide managers with the information needed to manage food service operations effectively. Without standardized and ad hoc management reporting, management cannot effectively manage and evaluate its resource allocations and productivity. For example, inventory records are based on standard recipes rather than a perpetual inventory system that accurately tracks food and supply items ordered, received, used, and needed. Food and Nutrition staff reported that the last director began producing some management reports which were shared with the review team. These reports contained a good bit of information that could be used to make substantive changes in the way this department operates. However, prior to these reports being generated, it should be noted that no food services management reporting tools were used by Food and Nutrition Department Administration on a regular basis. As noted throughout this report, YISD has an automated financial system that has not been fully implemented. When the district's new financial accounting system is fully implemented, Food and Nutrition should benefit from improved financial reports for cafeteria operations. The district has purchased computers for every YISD cafeteria. Recommendation 133: Develop effective management reports and use them to monitor and evaluate food service operations. The Food and Nutrition director should work with the Accounting and Management Information Systems Departments to develop accurate, timely, and objective financial
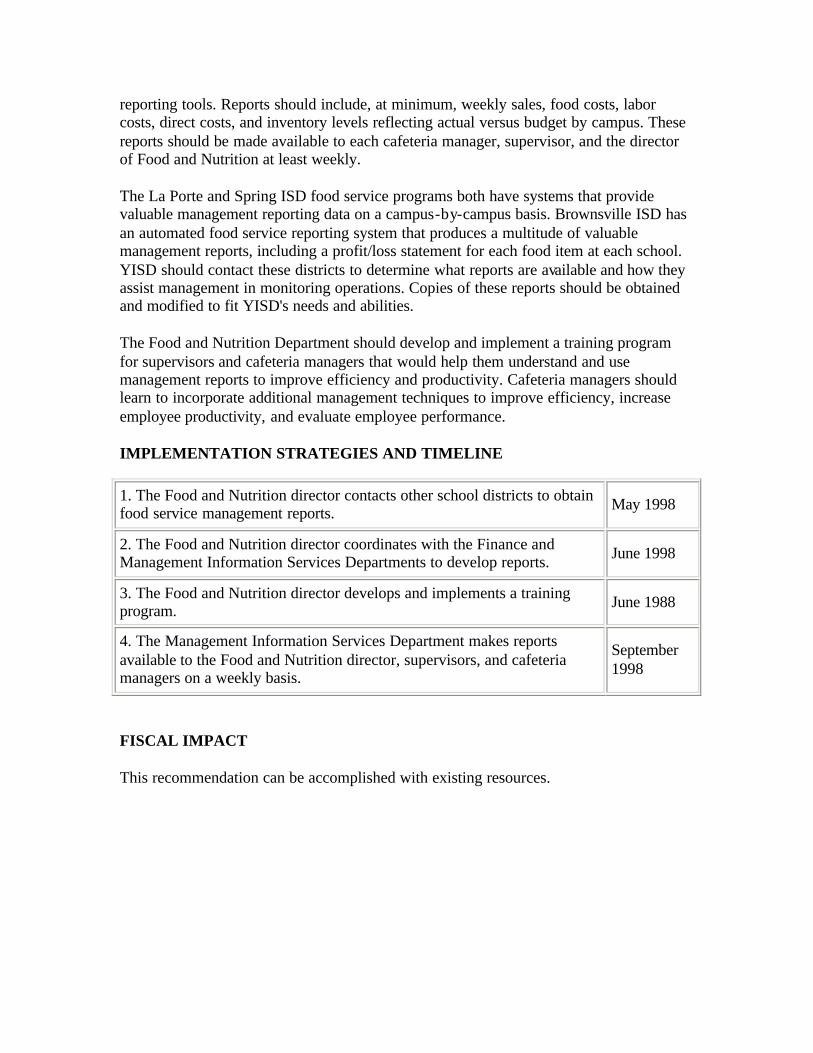
reporting tools. Reports should include, at minimum, weekly sales, food costs, labor costs, direct costs, and inventory levels reflecting actual versus budget by campus. These reports should be made available to each cafeteria manager, supervisor, and the director of Food and Nutrition at least weekly. The La Porte and Spring ISD food service programs both have systems that provide valuable management reporting data on a campus-by-campus basis. Brownsville ISD has an automated food service reporting system that produces a multitude of valuable management reports, including a profit/loss statement for each food item at each school. YISD should contact these districts to determine what reports are available and how they assist management in monitoring operations. Copies of these reports should be obtained and modified to fit YISD's needs and abilities. The Food and Nutrition Department should develop and implement a training program for supervisors and cafeteria managers that would help them understand and use management reports to improve efficiency and productivity. Cafeteria managers should learn to incorporate additional management techniques to improve efficiency, increase employee productivity, and evaluate employee performance. IMPLEMENTATION STRATEGIES AND TIMELINE
1. The Food and Nutrition director contacts other school districts to obtain food service management reports. May 1998
2. The Food and Nutrition director coordinates with the Finance and Management Information Services Departments to develop reports. June 1998
3. The Food and Nutrition director develops and implements a training program. June 1988
4. The Management Information Services Department makes reports available to the Food and Nutrition director, supervisors, and cafeteria managers on a weekly basis.
September 1998
FISCAL IMPACT This recommendation can be accomplished with existing resources.

Chapter 11
FOOD SERVICES D. Facilities FINDING Food and Nutrition does not have an effective preventative maintenance program. Instead, the department operates reactively, using three Maintenance Department employees to repair equipment as it breaks. Preventative maintenance programs are designed to increase the useful life of equipment with scheduled inspections, lubrication, part replacements, and repair. A high-quality preventative maintenance program should anticipate maintenance needs and notify the appropriate personnel of required maintenance and repairs to equipment and machinery. Recommendation 134: Implement a preventive maintenance program for all Food and Nutrition equipment and machinery. Food and Nutrition, in cooperation with the Maintenance and Management Information Systems Departments, should develop a maintenance program for all food service equipment and facilities. The maintenance program should be maintained on a computer system and provide management reports that indicate when equipment was placed into operation and when and what kind of maintenance and repairs have been performed. IMPLEMENTATION STRATEGIES AND TIMELINE
1. The Food and Nutrition director coordinates with the district's Maintenance and Management Information Systems Departments to determine the location, age, and condition of all equipment.
May 1998
2. The Food and Nutrition director, in coordination with the Maintenance Department, establishes scheduled preventive maintenance dates.
August 1998
3. The Food and Nutrition director reviews monthly reports of both scheduled maintenance and maintenance not completed.
September 1998
FISCAL IMPACT This recommendation can be accomplished with existing resources. FINDING

The age, size, appearance, and efficiency of YISD's school cafeterias varies significantly. Several of the newest facilities possess state-of-the-art equipment situated efficiently in large cooking and food preparation areas while many older kitchens are small, inadequately equipped, and poorly designed. The district is remodeling, renovating, or constructing new kitchen facilities at the following campuses (Exhibit 11-12):
Exhibit 11-12 Kitchen Remodeling, Renovation, and Construction Projects
Campus Work Performed Status
Alicia Chacon New Kitchen Complete
Cadwallader New Kitchen Complete
Presa New Kitchen Complete
Ysleta Elementary New Kitchen Complete
Ascarate Elementary New Kitchen Complete
Eastwood Knolls New Kitchen Complete
Rio Bravo New Kitchen Complete
Scotsdale Remodeled Complete
South Loop Remodeled Complete
Parkland High Construction Not Started
Riverside High Cafeteria Floor Not Started
Riverside High Snack Bar In Progress
Cesar Chavez Construction 2/98 Completion
Alternative Middle Construction Not Started
Cedar Grove Construction 5/98 Completion
Del Norte Construction Not Started
Dolphin Terrace New Cafeteria Not Started
East Point New Store Room Not Started
Hacienda Heights Construction Not Started
Loma Terrace Construction Not Started
Ramona Construction 6/98 Completion
Thomas Manor Construction Not Started

Source: YISD Food and Nutrition Department. TSPR visited about 25 percent of the YISD's cafeterias and observed that most cafeteria facilities have an institutional look. This impersonal atmosphere does not provide an incentive for students to stay on campus for lunch. Several high schools are located close to fast food restaurants, providing easy access to popular lunch alternatives. As a result, many students choose to leave campus at lunch. TSPR visited a high school cafeteria in the Corpus Christi ISD that is designed around the food court concept. Students can select from numerous alternatives such as a fajita bar, hamburger stand, soup and salad bar, or full-course meal. Students told the review team they didn't go off campus because the food was good at the school and the prices were better. As renovation takes place at YISD schools, some cafeterias are being designed around a food court concept to enhance their appeal for students. However, the district has no specific plan to remodel all cafeterias, particularly at the secondary level where increased meal participation is needed. Recommendation 135: Renovate all secondary school cafeteria facilities to reflect a food court appearance. High school cafeteria facilities should strive to achieve a food court appeal that is popular among students. The district should pilot the concept at one or two high schools and monitor its results. By adding food carts, colorful awnings, neon signs, flags, and graphics the cafeterias would brighten their image and take on a food court appearance. The food carts, flags, and awnings should be rotated or changed often to maintain the new look and variety appeal. Menus should be designed to carry out the themes of the food courts, all of which should be appealing to students both visually and in terms of taste. Food and Nutrition should assemble a committee of students at each school to obtain their input as to the types of foods that they would like to see incorporated into the food courts. IMPLEMENTATION STRATEGIES AND TIMELINE
1. The Food and Nutrition director identifies two schools to pilot the food courts.
May 1998
2. The Food and Nutrition director, supervisors, and student committees develop nutritious menus to simulate the appeal and taste of fast food or contract with fast food companies such as Taco Bell, Subway, Pizza Hut to serve meals (i.e., taco salad, low fat sandwiches, and vegetable topped pizza, etc.).
May 1998
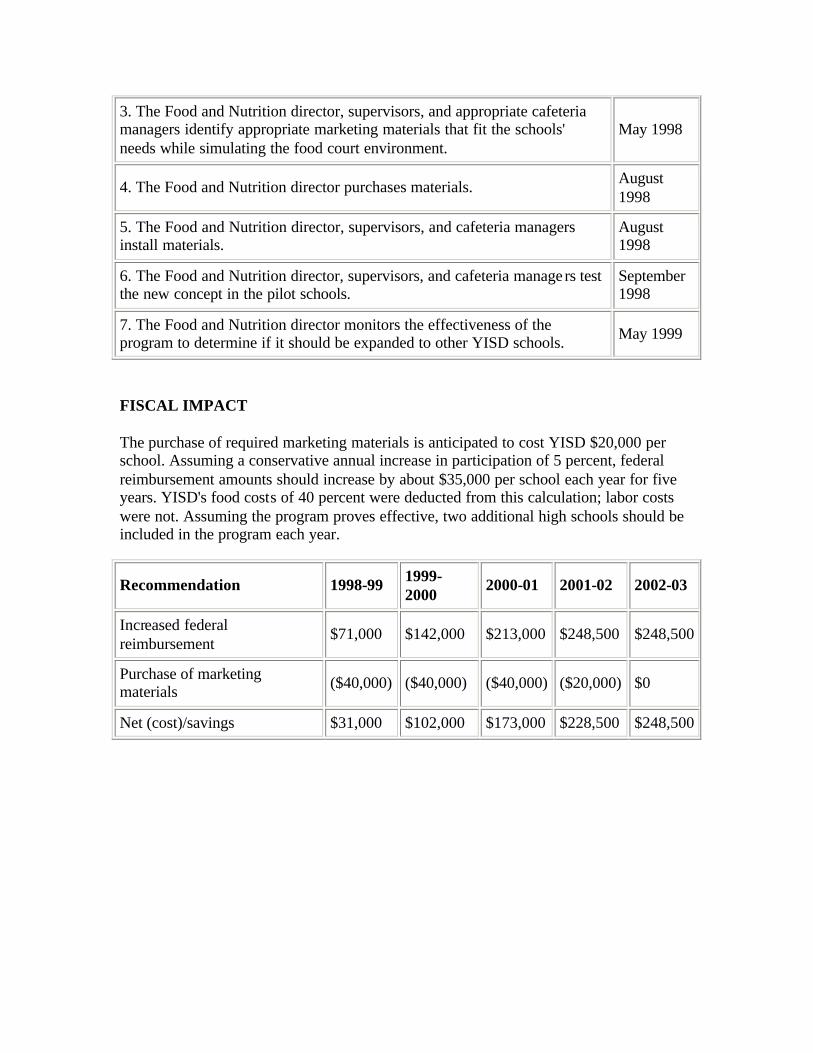
3. The Food and Nutrition director, supervisors, and appropriate cafeteria managers identify appropriate marketing materials that fit the schools' needs while simulating the food court environment.
May 1998
4. The Food and Nutrition director purchases materials. August 1998
5. The Food and Nutrition director, supervisors, and cafeteria managers install materials.
August 1998
6. The Food and Nutrition director, supervisors, and cafeteria managers test the new concept in the pilot schools.
September 1998
7. The Food and Nutrition director monitors the effectiveness of the program to determine if it should be expanded to other YISD schools. May 1999
FISCAL IMPACT The purchase of required marketing materials is anticipated to cost YISD $20,000 per school. Assuming a conservative annual increase in participation of 5 percent, federal reimbursement amounts should increase by about $35,000 per school each year for five years. YISD's food costs of 40 percent were deducted from this calculation; labor costs were not. Assuming the program proves effective, two additional high schools should be included in the program each year.
Recommendation 1998-99 1999-2000
2000-01 2001-02 2002-03
Increased federal reimbursement
$71,000 $142,000 $213,000 $248,500 $248,500
Purchase of marketing materials ($40,000) ($40,000) ($40,000) ($20,000) $0
Net (cost)/savings $31,000 $102,000 $173,000 $228,500 $248,500

Chapter 12
SAFETY AND SECURITY
This section of the report reviews overall safety and security of the Ysleta Independent School District (YISD), and is organized as follows:
A. Discipline Management B. Security C. Safety
BACKGROUND
School violence is one of the most critical issues facing public education today and the need to provide a safe and secure environment for students, teachers, and other school district employees is essential. Because of the priority placed on the safety and security of children by parents, educators, taxpayers, and the community, the 1995 Texas Legislature addressed school violence by establishing major safety and security related revisions in the Texas Education Code (Education Code).
According to the Education Code, each school must adopt a student code of conduct with the advice of a district-level committee and the juvenile board of each county in which the district is located. Additionally, students who engage in serious misconduct must be removed from regular education settings and placed in alternative education programs; specific information concerning the arrest or criminal conduct of students must be shared between law enforcement and local school districts. Moreover, the Education Code requires school districts, the juvenile board, and juvenile justice systems in counties with a population of greater than 125,000 to establish Juvenile Justice Alternative Education Program (JJAEP). The JJAEP operates under the jurisdiction of the Texas Juvenile Probation Commission. Its primary objective is to provide for the education of incarcerated youths and youths on probation.
To provide a safe and secure learning environment, safety and security programs must include elements of prevention, intervention, and enforcement, as well as cooperation with municipal and county governments. Its intervention programs should address discipline management and alternative education programs.

Chapter 12
SAFETY AND SECURITY A. Discipline Management Under the provisions of the Education Code, each Texas school district is required to adopt a student code of conduct that establishes standards for student behavior measured by levels of offenses. Depending on the type and level of offense by students, various discipline management techniques are suggested for teachers, campus administrators, and district administrators. For example, minor offenses may require student-teacher conferences or detention; major offenses may require suspension or placement in alternative educational programs. CURRENT SITUATION YISD's discipline management program is coordinated through the Office of Pupil and Parent Services. Pupil and Parent Services is responsible for publishing and distributing the student handbook to all students, parents, administrators, and teachers at the beginning of each school year. It also is responsible for distributing to principals policies containing a summary of YISD's Student Code of Conduct and regulations regarding the rights and responsibilities of students and methods of student discipline. Principals place this material in a prominent, readily accessible place in their schools. YISD's Student Code of Conduct has a six-part discipline management plan that includes: (1) the basic philosophy and goals of the discipline management program; (2) standards of conduct, defining the responsibility of students, parents, teachers, and administrators; (3) specific guidance on disciplinary techniques and options; (4) disciplinary guidelines for special education and Section 504 students; (5) specific guidance on student complaints, reporting requirements, cooperation with law enforcement, drug counseling, and searches and seizures; and (6) guidelines and provisions that address minor misbehavior, serious misconduct and consequences, placement in alternative education programs, suspension, and expulsion. YISD has three alternative schools for students who have been removed from regular education settings: Cesar Chavez Academy, Park View Alternative Middle School, and the Tejas School of Choice. Cesar Chavez Academy's enrollment includes high school and middle school students as well as adjudicated youth under the Juvenile Justice Alternative Education Program. Park View Alternative Middle School's enrollment includes middle school students and some elementary school students. The Tejas School of Choice's enrollment includes high school and middle school students who attend by choice. Pupil and Parent Services monitors alternative education program (AEP) placements in each alternative school and provides the board with monthly reports that identify the students who have been placed, their home school, the alternative school where they have

been placed, the date of their placement, the term of their placement, and the reason for their placement. Students are considered long-term alternative education placements if they remain in an alternative education setting for 90 days or more. Long-term placements are typically high school or middle school students. Short-term placements (less than 90 days) include middle school students enrolled in the Tejas School of Choice or students moved from regular education settings to in-school suspension or special assignment classrooms. Exhibit 12-1 presents long-term alternative education placements by home school for 1995-96 and 1996-97.
Exhibit 12-1 Long-Term Alternative Education Placements by Home School
1995-96 and 1996-97
School 1995-96 Placements
1996-97 Placements
Percent Increase (Decrease)
Bel Air High School 10 2 (80%)
Del Valle High School 16 27 69%
Eastwood High School 12 1 (92%)
Hanks High School 12 5 (58%)
Parkland High School 6 0 (100%)
Riverside High School 17 18 6%
Ysleta High School 17 12 (29%)
Tejas School of Choice 4 0 (100%)
Camino Real Middle School 14 1 (93%)
Desert View Middle School 4 4 0%
Eastwood Middle School 3 10 233%
Hillcrest Middle School 3 0 (100%)
Indian Ridge Middle School 1 0 (100%)
Parkland Middle School 1 1 0%
Ranchland Hills Middle School 4 6 50%
Riverside Middle School 15 3 (80%)
Valley View Middle School 11 6 (45%)

Ysleta Middle School 0 4 400%
Desertaire Elementary 1 0 (100%)
Dolphin Terrace Elementary 1 0 (100%)
Pebble Hills Elementary 0 1 100%
Scotsdale Elementary 0 1 100%
Thomas Manor Elementary 1 0 (100%)
Totals 153 102 (50%)
Source: Executive Summary of Alternative Placements, YISD Office of Pupil and Parent Services, November 1997 As presented in Exhibit 12-1, long-term alternative education placements decreased 50 percent between 1995-96 and 1996-97. This is primarily because of fewer placements from Bel Air, Eastwood, and Hanks high schools, and Camino Real and Riverside middle schools. Alternative education placements increased significantly only at Del Valle High School and Eastwood Middle School. FINDING Cesar Chavez Academy (Academy), established in 1993, is a full-service, model alternative school serving grades seven through 12 (including high school equivalency (GED) program students). The Academy was originally designed for expelled and adjudicated high school students. However, its student population has been expanded to include students attending by choice and students from the Texas Youth Commission serving in boot camps and working on GEDs. Exhibit 12-2 provides a summary of innovative alternative education and student discipline techniques implemented by the Academy.
Exhibit 12-2 Cesar Chavez Academy
Innovative Alternative Education and Student Discipline Techniques
Alternative Education or Student Discipline Technique
Description or Characteristics
Alternative Behavioral Classes (ABC)
· Special classes for students with disabilities and students with severe emotional problems. · Classes for students previously removed from regular education settings without instruction.

Legacy Program
· Special program for middle school students whose older brothers or sisters have completed the alternative education program. · Middle school students allowed to enroll in the Academy as a method of intervention for families with children that have discipline problems.
"Nova Net" Electronic Curriculum
· Computer based curriculum used by all students attending the Academy. · Classes use a predetermined schedule of chapters to read and exercises to complete in a specific time frame to monitor students' progress. · Students required to complete one hour of homework per class. · Electronic grading target established at 85 percent for all students. · Parent conferences held immediately if grading standard not met; students are held after school to complete unfinished work.
ACT/SAT Proficiency
· Students required to take both the ACT and SAT college entrance examinations. · Preparatory classes offered.
Exhibit 12-2 Cesar Chavez Academy
Innovative Alternative Education and Student Discipline Techniques (Continued)
Alternative Education or Student Discipline Technique
Description or Characteristics
Five Basic Rules of Discipline
· No drugs · No weapons · No fights · No accidents · Respect for yourself and others (includes dress, language, mannerisms, etc.-profanity not tolerated; on second offense treated as disorderly conduct, and parents or students must pay $150 fine)
Community Service Teams
· Students sentenced to perform community service by the juvenile justice system and enrolled in the Academy's JJAEP maintain grounds of the Academy to satisfy community service requirements.
Student Council · The Academy has a functional student council, complete with elected officers.
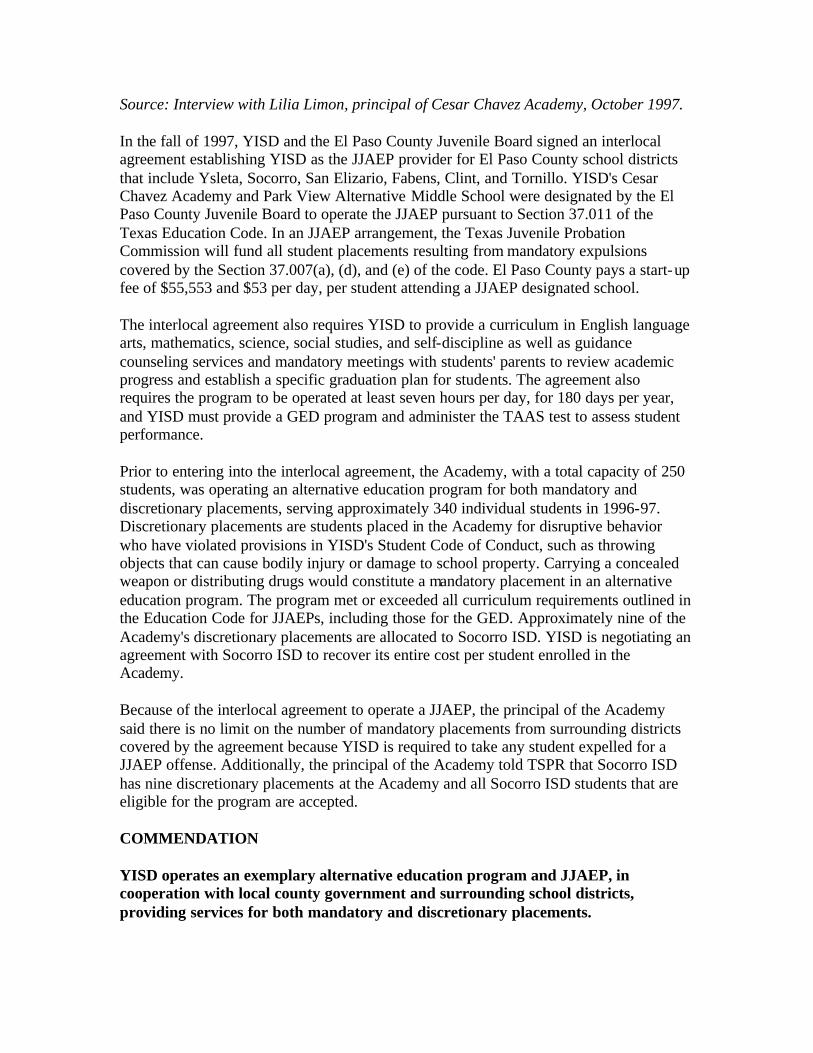
Source: Interview with Lilia Limon, principal of Cesar Chavez Academy, October 1997. In the fall of 1997, YISD and the El Paso County Juvenile Board signed an interlocal agreement establishing YISD as the JJAEP provider for El Paso County school districts that include Ysleta, Socorro, San Elizario, Fabens, Clint, and Tornillo. YISD's Cesar Chavez Academy and Park View Alternative Middle School were designated by the El Paso County Juvenile Board to operate the JJAEP pursuant to Section 37.011 of the Texas Education Code. In an JJAEP arrangement, the Texas Juvenile Probation Commission will fund all student placements resulting from mandatory expulsions covered by the Section 37.007(a), (d), and (e) of the code. El Paso County pays a start-up fee of $55,553 and $53 per day, per student attending a JJAEP designated school. The interlocal agreement also requires YISD to provide a curriculum in English language arts, mathematics, science, social studies, and self-discipline as well as guidance counseling services and mandatory meetings with students' parents to review academic progress and establish a specific graduation plan for students. The agreement also requires the program to be operated at least seven hours per day, for 180 days per year, and YISD must provide a GED program and administer the TAAS test to assess student performance. Prior to entering into the interlocal agreement, the Academy, with a total capacity of 250 students, was operating an alternative education program for both mandatory and discretionary placements, serving approximately 340 individual students in 1996-97. Discretionary placements are students placed in the Academy for disruptive behavior who have violated provisions in YISD's Student Code of Conduct, such as throwing objects that can cause bodily injury or damage to school property. Carrying a concealed weapon or distributing drugs would constitute a mandatory placement in an alternative education program. The program met or exceeded all curriculum requirements outlined in the Education Code for JJAEPs, including those for the GED. Approximately nine of the Academy's discretionary placements are allocated to Socorro ISD. YISD is negotiating an agreement with Socorro ISD to recover its entire cost per student enrolled in the Academy. Because of the interlocal agreement to operate a JJAEP, the principal of the Academy said there is no limit on the number of mandatory placements from surrounding districts covered by the agreement because YISD is required to take any student expelled for a JJAEP offense. Additionally, the principal of the Academy told TSPR that Socorro ISD has nine discretionary placements at the Academy and all Socorro ISD students that are eligible for the program are accepted. COMMENDATION YISD operates an exemplary alternative education program and JJAEP, in cooperation with local county government and surrounding school districts, providing services for both mandatory and discretionary placements.

FINDING During public input and individual interviews with parents and citizens, TSPR was told school district administrators had not followed the provisions of the Education Code or procedures outlined in YISD's Student Handbook, 1997-98 School Year, (Student Handbook) when removing a student from the regular education setting for being under the influence of drugs. YISD's Student Hand Book, page 94, cites special actions principals can take regarding the removal, rather than expulsion, of students from a school if the principal feels it is necessary for the protection of the student and/or the protection of other individuals. Teachers may ask a principal to remove students from regular classes for three reasons:
• being under the influence of alcohol or drugs; • being highly disruptive; or • suffering from a condition that threatens the student's welfare or the welfare of
others.
Page 95 of the Student Handbook further states that once removal from regular classes is recommended for one of the above reasons, a hearing which includes a school administrator, the teacher, parent, and student must be scheduled within three days of the removal of the student from class. After the hearing, the principal may suspend the student from school for six days, place the student in an alternative setting, or return the student to class. Students caught with possession of drugs are removed and placed in an alternative setting for 30 school days; students continually using drugs are placed in an alternative setting for the remainder of the semester for a second offense, and may be expelled after the next offense; and students selling or distributing drugs are placed in an alternative education setting for the remainder of the semester or expelled. Moreover, Section 37.009(a) of the Education code requires a hearing "...not later than the third class day after the day on which a student is removed from class..." and following the hearing "...the principal shall order placement of the student for a period consistent with the student code of conduct..." On October 24, 1997, a Hanks High School student was removed from regular classes for being under the influence of drugs and issued a citation by the El Paso Police Department. On that day, the student's mother was told by a Hanks High School assistant principal that her child would be moved from the regular classroom setting to the Academy. On Monday, October 27, 1997, (one class day after the student was removed from regular classes) a meeting was held with both parents, the student, the assistant principal, and principal's designee to discuss the removal. During the meeting, which the administration deemed to be a hearing, the student and parents were informed that the student would be enrolled in the Academy. When the parents attempted to enroll the student in the Academy on October 27, 1997, they were told by the principal that TAAS tests were being administered and the student

could not be enrolled until November 5, 1997-seven class days after the hearing. Faced with lost class time, the parents enrolled their child in a private school. At the November 13, 1997 board meeting, the parents requested that their child be allowed to re-enroll in Hanks High School in the spring semester. Between November 1997 and January 1998 the student was assigned to the Academy. In the spring semester, the student was reinstated at Hank High School, and the parents were reimbursed for legal fees they incurred in the matter. While this is only one incident, the community is concerned about the equitable treatment of students and regularly pointed to this incident. Recommendation 136: Clarify policies and document procedures for the placement of students in alternative education settings, and establish a system to consistently apply those procedures. YISD's Code of Conduct is clear about what will happen when a child is placed in an alternative education setting, but the term "hearing" is not clearly defined, and exceptions to the rules are not numerated. For example, if the district does not wish to place students in alternative education settings for the week before and during TAAS testing, provisions should be made in the policy to address this situation so that class time is not lost. Further, a procedure should be put in place to ensure that the policy is widely disseminated and consistently applied by regular and alternative education campuses. IMPLEMENTATION STRATEGIES AND TIMELINE
1. The assistant superintendent for Curriculum and Instruction drafts an amendment to the removal policy outlined in Student Handbook to clarify ambiguous terms and ensure the timely placement of students in alternative education settings to limit lost class time.
June 1998
2. The superintendent approves the change in policy. June 1998
3. The board conducts its first reading of the amended policy. July 1998
4. The board approves the amended policy. August 1998
5. The superintendent issues a formal memorandum to principals, assistant principals, and central administrators notifying them of the change in policy.
August 1998
FISCAL IMPACT

This recommendation can be implemented with existing resources. FINDING YISD does not have a central point of coordination for its student violence, self-discipline, peer mediation, and dropout prevention programs for at-risk students. The director of Auxiliary Services does not maintain a centralized file of all the programs in which the district participates because implementation and coordination of various programs addressing discipline management are left to principals and Campus Educational Improvement Councils (CEIC) at individual schools. Exhibit 12-3 presents a summary of programs addressing school violence, at-risk youth, and discipline management identified by the review team.
Exhibit 12-3 Programs Addressing
Student Violence, At-Risk Youth and Discipline Management
Community-Based Program Description of Activities
Peer Assistance and Leadership (PAL)
Peer-assistance program in which high school students in grades 11 through 12 are trained to work as peer helpers on their own campus or at feeder middle and elementary schools. Program goals include dropout prevention, informed and responsible decision-making, and peer group support.
Operation Sobresalir (Operation Capital)
Intervention program developed by the Junior ROTC Battalion at Bel Air High School to reduce drug and substance abuse, teenage sexual activity, high school dropouts, and gang-related activity, as well as increase academic achievement. Junior ROTC cadets work with at-risk students in middle schools and high schools.
Out of School Recreation Program
Out-of-school recreation program for elementary students in grades 4 through 6. Objective of program is to build athletic skills and self esteem through athletic improvement.
Community Youth Development Program ZIP CODE AREA 79924
Community Development Grant to provide youth activities in Northeast El Paso zip code 79924 to decrease juvenile crime. YISD activities covered by the grant include dropout prevention,

self discipline, job skills, and self esteem. Program encourages parents to actively participate in civic and school activities that deter youth involvement in juvenile crime.
Attendance, Behavior and Academics (ABaC) Project
Program provides effective intervention for potential dropouts and identifies problems that contribute to truancy, such as substance abuse, gang involvement, mental health problems, child abuse, runaway behavior, and family violence. Program serves students in Ysleta, El Paso, and Socorro ISDs at no cost.
Source: Office of the Executive Director of Auxiliary Services, November 1997. Although YISD's commitment to site-based decision-making allows individual schools to develop autonomous programs addressing student violence and discipline management, the absence of a central point of coordination does not allow the district to evaluate the districtwide effectiveness of the diverse programs. Recommendation 137: Designate the Office of Pupil and Parent Services as the central point for coordinating programs related to student violence, at-risk youth, and discipline management. Pupil and Parent Services is the logical point of coordination for YISD's varied programs that address student violence, at-risk youth, and discipline management in which schools participate under site-based decision-making. As a coordinator for programs, Pupil and Parent Services can set up procedures to evaluate the effectiveness of existing programs, assess the feasibility of establishing new programs, and contact potential sponsors for future programs with the district. IMPLEMENTATION STRATEGIES AND TIMELINE
1. The superintendent designates the Office of Pupil and Parent Services as the central coordinator of programs related to student violence, at-risk youth, and discipline management.
June 1998
2. The assistant superintendent for Curriculum and Instruction directs the director of the Pupil and Parent Services to develop a plan for identifying all programs within the district, collecting program performance data, and monitoring the effectiveness of each program.
July 1998
3. The director of Pupil and Parent Services develops and presents plan to the assistant superintendent for Curriculum and Instruction.
July - August 1998

4. The assistant superintendent for Curriculum and Instruction reviews and approves plan. August 1998
5. The director of Pupil and Parent Services begins collecting program performance data and monitoring the effectiveness of programs throughout the district.
September 1998 Ongoing
FISCAL IMPACT This recommendation can be implemented with existing resources.

Chapter 12
SAFETY AND SECURITY
B. Security CURRENT SITUATION YISD's Security Department oversees a districtwide security organization with 67 full-time security officers, 15 substitute security officers, and 20 El Paso Police Department (EPPD) officers. Five of the 67 full- time security officers are certified Texas Peace officers licensed by the Texas Commission on Law Enforcement Officers Standards and Education (TCLEOSE). The remaining security officers are commissioned to carry fire arms but are not certified through TCLEOSE. The Security Department's first priority is to ensure the safety of students, faculty, and district personnel; its secondary priority is to protect school property. The security force oversees four administrative and learning centers and seven high school feeder patterns. Security coordinators for each feeder pattern are stationed at each of the seven high schools and are responsible for coordinating security for elementary and middle schools within the feeder pattern. Using patrols and stationary officers, Security personnel provide security 365 days per year, 24 hours per day- including holidays and weekends. Off-duty EPPD officers are stationed at each of the seven high schools between 12:00 p.m. and 4:00 p.m. Monday through Friday to provide additional security. Exhibit 12-4 presents the organization structure for YISD's Police Department.
Exhibit 12-4 YISD Security Department
Organization Structure
To obtain a copy of this exhibit, please contact the Texas Performance Review at 512/475-0332, or via e-mail at [email protected].
Source: YISD Supervisor of Security, February 1998 Exhibit 12-5 presents YISD's districtwide security budget for the past three years.
Exhibit 12-5 YISD Districtwide Security Budget for 1995-96, 1996-97 and 1997-98
Line Item 1995-96 1996-97 1997-98 Percent Incr. (Decr.)

Payroll $2,520,076 $2,359,080 $2,464,110 (2%)
Contracted Services 15,120 15,120 16,230 8%
Materials and Supplies 17,350 20,081 20,081 16%
Other Operating Expenses 2,200 2,200 2,200 0%
Capital Outlay 19,320 21,970 24,420 26%
Totals $2,574,066 $2,418,451 $2,527,041 (2%)
Source: YISD Security Report by Object for fiscal year indicated. The districtwide security budget presented in Exhibit 12-5 decreased 2 percent between 1995-96 and 1997-98. The budget includes resources allocated to the Security Department, the seven high school feeder patterns, special centers (Student Entrepreneur ial Center and Adult Learning Center), and discretionary security funds for individual schools. Schools use discretionary funds to pay for extra security duty for school events held outside the normal school day. These funds represent 12 percent of YISD's districtwide security budget for 1997-98. Exhibit 12-6 presents YISD's Central Security Department budget for the past three years.
Exhibit 12-6 YISD Central Security Department Budget
for 1995-96, 1996-97, and 1997-98
Line Item 1995-96 1996-97 1997-98 Percent Incr. (Decr.)
Payroll $669,924 $653,178 $624,314 (7%)
Contracted Services 15,120 15,120 15,120 0%
Materials and Supplies 17,350 20,081 20,081 16%
Other Operating Expenses 2,200 2,200 2,200 0%
Capital Outlay 19,320 19,320 19,320 0%
Totals $723,914 $709,899 $681,035 (6%)
Source: YISD detail budget for fiscal year indicated. YISD's Central Security Department's budget includes security resources allocated to YISD's central administrative center, the district's service center, the director of security, and security coordinators (Exhibit 12-6). YISD's overall security department budget decreased 6 percent between 1995-96 and 1997-98. The Central Security Department budget represents 27 percent of YISD's districtwide

security budget for 1997-98. High school feeder patterns, which include all elementary, middle, and high schools in a specific geographic location, and special centers represent 61 percent of YISD's districtwide security budget for 1997-98. The remaining 39 percent of the security budget is allocated to central administration. YISD only budgets payroll costs for security personnel assigned to each feeder pattern or special center. Exhibit 12-7 presents YISD's security payroll costs budgeted for high school feeder patterns and special centers for the past three years.
Exhibit 12-7 YISD High School Feeder Pattern and Special Centers
Budgeted Security Payroll Costs for 1995-96, 1996-97, and 1997-98
Source: YISD Security Report by Organization for fiscal year indicated. As presented in Exhibit 12-7, the security budget for high school feeder patterns and special centers increased 15 percent between 1995-96 and 1997-98. This increase is primarily attributed to increases in payroll at the Del Valle, Eastwood, Riverside, and Ysleta high school attendance areas.
Exhibit 12-8 YISD Incident Statistics

1994-95 Through 1996-97
Source: Office of Auxiliary Services, November 1997 As presented in Exhibit 12-8, incidents of attempted burglary, theft, assault, arson, criminal mischief, damage to school property, and graffiti primarily contributed to the 106 percent increase between 1994-95 and 1996-97, because most of these incidents occurred during the evening. FINDING YISD's Security Department works with EPPD to provide a number of collaborative initiatives to ensure the safety and security of YISD schools. The district works with EPPD through its School Resource Officer (SRO) program, Drug Abuse Resistance Education (D.A.R.E.) program, gang initiatives, and undercover drug operations. The SRO program uses police officers to assist selected schools in addressing student problems that go beyond traditional policing. As equal partners with school faculty and staff, SROs show students how to deal with conflict, resolve problems, face peer pressure, and avoid criminal activity. SROs also instruct the D.A.R.E. program that shows YISD students how to refuse alcohol and drugs by:
• providing accurate information about drugs and alcohol;
• providing ideas for alternatives to drug use;
• teaching decision-making skills;
• showing students how to resist peer pressure; and
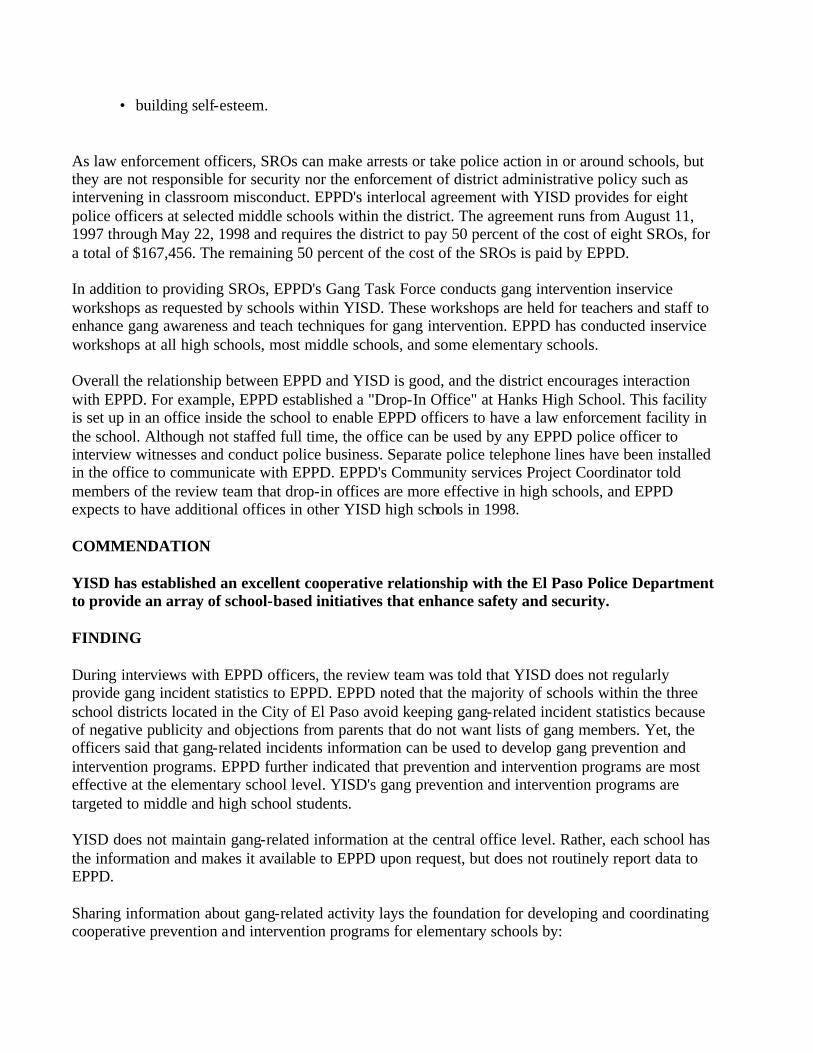
• building self-esteem.
As law enforcement officers, SROs can make arrests or take police action in or around schools, but they are not responsible for security nor the enforcement of district administrative policy such as intervening in classroom misconduct. EPPD's interlocal agreement with YISD provides for eight police officers at selected middle schools within the district. The agreement runs from August 11, 1997 through May 22, 1998 and requires the district to pay 50 percent of the cost of eight SROs, for a total of $167,456. The remaining 50 percent of the cost of the SROs is paid by EPPD. In addition to providing SROs, EPPD's Gang Task Force conducts gang intervention inservice workshops as requested by schools within YISD. These workshops are held for teachers and staff to enhance gang awareness and teach techniques for gang intervention. EPPD has conducted inservice workshops at all high schools, most middle schools, and some elementary schools. Overall the relationship between EPPD and YISD is good, and the district encourages interaction with EPPD. For example, EPPD established a "Drop-In Office" at Hanks High School. This facility is set up in an office inside the school to enable EPPD officers to have a law enforcement facility in the school. Although not staffed full time, the office can be used by any EPPD police officer to interview witnesses and conduct police business. Separate police telephone lines have been installed in the office to communicate with EPPD. EPPD's Community services Project Coordinator told members of the review team that drop-in offices are more effective in high schools, and EPPD expects to have additional offices in other YISD high schools in 1998. COMMENDATION YISD has established an excellent cooperative relationship with the El Paso Police Department to provide an array of school-based initiatives that enhance safety and security. FINDING During interviews with EPPD officers, the review team was told that YISD does not regularly provide gang incident statistics to EPPD. EPPD noted that the majority of schools within the three school districts located in the City of El Paso avoid keeping gang-related incident statistics because of negative publicity and objections from parents that do not want lists of gang members. Yet, the officers said that gang-related incidents information can be used to develop gang prevention and intervention programs. EPPD further indicated that prevention and intervention programs are most effective at the elementary school level. YISD's gang prevention and intervention programs are targeted to middle and high school students. YISD does not maintain gang-related information at the central office level. Rather, each school has the information and makes it available to EPPD upon request, but does not routinely report data to EPPD. Sharing information about gang-related activity lays the foundation for developing and coordinating cooperative prevention and intervention programs for elementary schools by:

• identifying areas where gang activity is concentrated and the type of illicit drug activities in which gangs are engaged,
• identifying and documenting various techniques used by gang members to attract young children to become involved with drugs and gangs, and
• using this information to develop programs to heighten elementary school students' awareness of techniques used by gang members to distribute drugs to younger kids and the reasons gangs want them to become involved with drugs.
Recommendation 138: Share information about gang-related incidents with the El Paso Police Department and cooperatively develop gang prevention and intervention programs for the elementary school level. YISD should begin sharing information about gang-related inc idents with EPPD on a routine basis. This information should lay the foundation for developing and coordinating cooperative prevention and intervention programs for elementary school students. These programs should include related topics such as drug abuse and truancy. IMPLEMENTATION STRATEGIES AND TIMELINE
1. The superintendent directs the executive director of Auxiliary Services to begin compiling data on gang-related incidents, by school, for reporting to EPPD. July 1998
2. The executive director of Auxiliary Services, in cooperation with the director of Pupil and Parent Services, compiles statistics on gang-related incidents.
August 1998 - September 1999 and Ongoing
3. The executive director of Auxiliary Services provides gang-related incident statistics to EPPD on a monthly basis.
August 1998 and Ongoing
4. The director of Pupil and Parent Services works with EPPD to develop a gang prevention and intervention program for elementary students.
August - November 1998
5. The assistant superintendent for Curriculum and Instruction approves the gang prevention and intervention program.
December 1998
6. The board approves the gang prevention and intervention program. December 1998
7. The assistant superintendent for Curriculum and Instruction implements the gang prevention and intervention program.
January 1999

FISCAL IMPACT This recommendation can be implemented with existing resources. FINDING The mayor of the City of El Paso advocates local governments, school districts, and private service organizations of all kinds to share services where practical. During interviews with the review team, the mayor said that providing security was not a "core educational function" and should not be provided by school districts. He said security can be best provided by the City of El Paso; dollars spent by school districts could be reallocated solely to instructional programs. YISD's security function is decentralized, with security officers at seven high schools responsible for coordinating security for all middle and elementary schools within the feeder pattern. Each high school has one full-time security officer stationed overnight. However, the district does not have adequate patrol coverage for middle and elementary schools within each feeder pattern. There are only two night patrols responsible for elementary and middle schools throughout the district. As a result, elementary and middle schools are not adequately patrolled and, if multiple incidents occur, it is virtually impossible for two patrols to respond without assistance from El Paso Police Department (EPPD). YISD stated that while this has not happened, it wants to ensure that prevention measures are in place so that it never happens. YISD does not have adequate security patrol resources based on the frequency of incidents in specific feeder patterns within the district. Allocating security patrol resources based on the frequency of incidents in specific geographic locations matches the demand for security patrols within a feeder pattern with the number and frequency of patrols required. Exhibit 12-9 shows the number of incidents recorded for each feeder pattern in 1996-97 compared to the number of security patrols.
Exhibit 12-9 Number of Incidents by Feeder Pattern
1996-97
Feeder Pattern Incidents Security Patrols
Incidents Per Security Patrol
Bel Air High 25 2 12.5
Del Valle High 17 2 8.5
Eastwood High 20 2 10.0
Hanks High 16 2 8.0
Parkland High 16 2 8.0
Riverside High 19 2 9.5

Ysleta High 21 2 10.5
Total/Average 134 2 67.0
Source: YISD Office of Auxiliary Services, November 1997 Exhibit 12-9 shows the frequency of incidents per security patrol is higher at Bel Air, Eastwood, and Ysleta high schools. Ysleta and Bel Air high school feeder patterns are located south of Interstate 10 (I-10) in the lower valley area of El Paso. The Eastwood High School feeder pattern is located north of I-10. To adequately cover these three feeder patterns YISD needs at least two security patrols, leaving the five remaining feeder patterns without security patrols for extended periods. Clearly, YISD does not have adequate resources to conduct thorough patrols. The Fort Worth Independent School District (FWISD) implemented a novel cooperative five-year program with the City of Fort Worth for the Fort Worth Police Department to provide shared security services for its secondary schools. Created as the "School Security Initiative," the City of Fort Worth passed a one-half cent sales tax to fund the initiative, which required payroll costs for 41 officers, one Sergeant, and one Lieutenant to be paid 50 percent by the City of Fort Worth and 50 percent by FWISD. The 41 officers are stationed in approximately 24 secondary schools that also provide coverage for elementary schools in each secondary school feeder pattern. Vehicles, equipment, supplies, and training are also funded by the School Security Initiative. FWISD reports that the increased presence of law enforcement has improved the schools' climate and resulted in positive changes in student behavior. YISD, in cooperation with the Mayor, is exploring the possibility of shared security services for the

entire district. This initiative will be in addition to the cost sharing arrangement between EPPD and YISD for SROs in which each pays 50 percent of the salary costs for eight officers assigned to the district. As shown in Exhibit 12-5, the districtwide security budget for 1997-98 is $2,527,041, including $2,464,110 in payroll costs for 68 full-time equivalent personnel. High school feeder patterns and education centers account for 55 security officers and $1,486,110 in payroll costs. Both the superintendent and the Mayor are developing a model interlocal agreement to be used to pilot shared security services between YISD and the City of El Paso. The mayor feels the shared security services pilot model could be implemented without increasing taxes. Discussions between YISD and the city are in the preliminary stages. Recommendation 139: Proceed with developing a model for shared security services between the City of El Paso and YISD. The superintendent should immediately proceed with developing a model for shared security services. The model should be based on an interlocal agreement to have the City of El Paso provide security services to the district at a minimum of one-half its current cost of security. The model should restructure YISD's districtwide security personnel as follows:
Eliminate 68 positions for YISD security personnel 68
Add: 37 EPPD officers as follows:
Bel Air High School feeder pattern 4
Del Valle High School feeder pattern 4
Eastwood High School feeder pattern 4
Hanks High School feeder pattern 4
Parkland High School feeder pattern 3
Riverside High School feeder pattern 4
Ysleta High School feeder pattern 5
Administrative Center 1
Student Entrepreneurial Center 1
Service Center 1
Night Patrols 6 37
Add: One Lieutenant 1
Add: One Sergeant 1
Total EPPD officers added 39

Net reduction security-related personnel 29
The addition of EPPD officers, with access to EPPD's dispatch capabilities, will enable YISD to reduce the amount of staff necessary to cover each feeder pattern. YISD should assist displaced security personnel to locate employment with other school districts, the City of El Paso, or in vacant positions, for which they are qualified, within YISD. This assistance should include counseling and retraining opportunities and should be funded by the district. The cost for counseling and retraining is estimated at $136,000 or $2,000 per displaced employee. Additionally, YISD should pay 50 percent of payroll costs and the cost of equipment, maintenance, materials and supplies, and training, with the City of El Paso funding the remaining 50 percent. IMPLEMENTATION STRATEGIES AND TIMELINE
1. The superintendent continues to work with the Mayor to develop a shared security services model for the City of El Paso and YISD.
June 1998 - October 1998
2. The superintendent and mayor identify funding sources for the shared services model. October - December 1998
3. The superintendent and mayor present a shared services model, with an interlocal agreement, to both the El Paso City Council and YISD board for approval.
January 1999
4. The YISD board and El Paso City Council approve interlocal agreement. March 1999
5. The superintendent and the executive director of Auxiliary Services develop action steps, with responsibility assignments and time lines, for implementing the interlocal agreement.
April - May 1999
6. The executive director of Auxiliary Services oversees the transition from YISD-controlled security to EPPD-controlled security.
June 1999 - August 1999

7. The superintendent, in conjunction with the executive director of Auxiliary Services, implements the interlocal agreement. September 1999
FISCAL IMPACT The fiscal impact of this recommendation is based on the restructuring outlined in the above recommendation. Average salaries and benefits (computed at 37 percent of salary) for EPPD officers were obtained from EPPD. Equipment, materials, supplies, and other expenses were obtained from estimates prepared by Fort Worth ISD for its 1997-98 School Security Initiative. Fiscal impact estimates as shown in Exhibit 12-10 assume that both YISD and the City of El Paso contribute 50 percent each in payroll, equipment, materials, supplies, and other costs.
Exhibit 12-10 Proposed Restructuring
of YISD Security Services
Line Item One-Time (Costs)
Annual (Costs) Savings
Payroll & Related Benefits
Eliminate 68 positions for YISD security personnel $2,464,110
Add: counseling and retraining for displaced security personnel (68 x $2,000) ($136,000)
Add: 37 EPPD officers (37 x $46,286 x 50%) (856,291)
Add: one Lieutenant ($60,280 x 50%) (30,140)
Add: one Sergeant ($53,430 x 50%) (26,715)
Add: overtime pay (160 hrs. x 37 officers x $24.36 per hr.) (72,106)
Net Savings (Cost) of Shared Payroll $1,342,858
Equipment
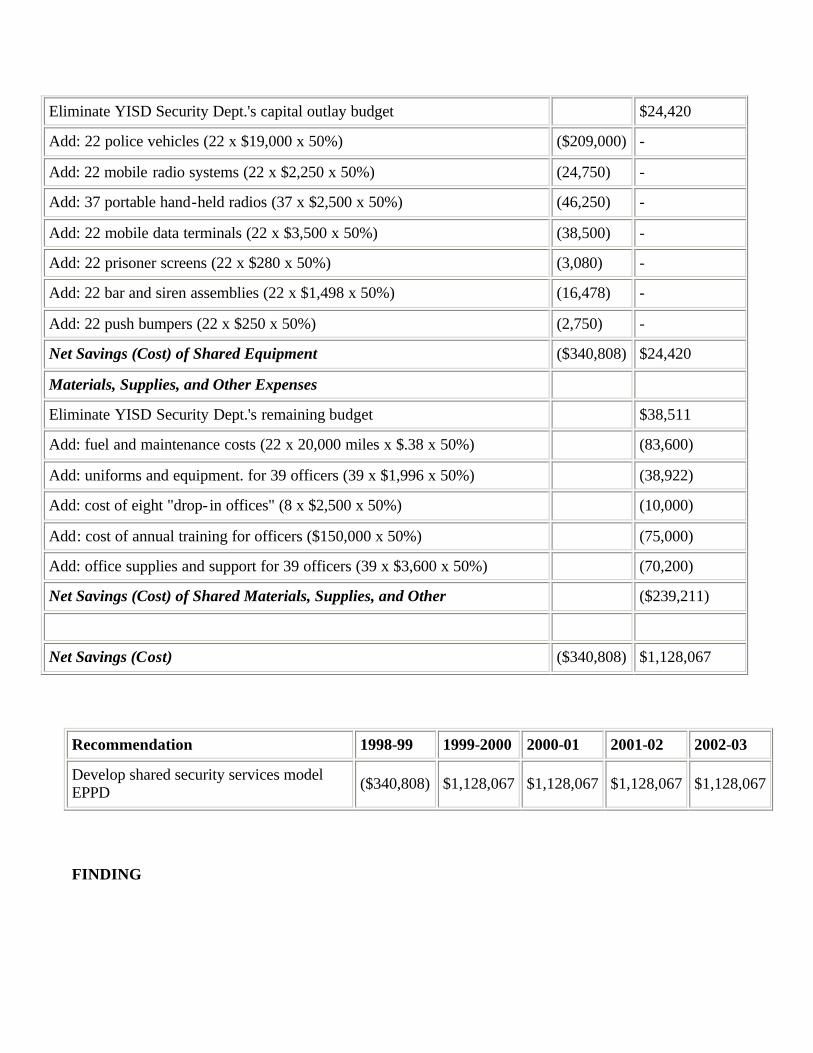
Eliminate YISD Security Dept.'s capital outlay budget $24,420
Add: 22 police vehicles (22 x $19,000 x 50%) ($209,000) -
Add: 22 mobile radio systems (22 x $2,250 x 50%) (24,750) -
Add: 37 portable hand-held radios (37 x $2,500 x 50%) (46,250) -
Add: 22 mobile data terminals (22 x $3,500 x 50%) (38,500) -
Add: 22 prisoner screens (22 x $280 x 50%) (3,080) -
Add: 22 bar and siren assemblies (22 x $1,498 x 50%) (16,478) -
Add: 22 push bumpers (22 x $250 x 50%) (2,750) -
Net Savings (Cost) of Shared Equipment ($340,808) $24,420
Materials, Supplies, and Other Expenses
Eliminate YISD Security Dept.'s remaining budget $38,511
Add: fuel and maintenance costs (22 x 20,000 miles x $.38 x 50%) (83,600)
Add: uniforms and equipment. for 39 officers (39 x $1,996 x 50%) (38,922)
Add: cost of eight "drop- in offices" (8 x $2,500 x 50%) (10,000)
Add: cost of annual training for officers ($150,000 x 50%) (75,000)
Add: office supplies and support for 39 officers (39 x $3,600 x 50%) (70,200)
Net Savings (Cost) of Shared Materials, Supplies, and Other ($239,211)
Net Savings (Cost) ($340,808) $1,128,067
Recommendation 1998-99 1999-2000 2000-01 2001-02 2002-03
Develop shared security services model EPPD ($340,808) $1,128,067 $1,128,067 $1,128,067 $1,128,067
FINDING

YISD provides security officers with training in Level I security (initial classroom training for new security officers) including blood-borne pathogens, use of weapons, dispatch and patrol, and defensive driving. However, security officers receive the majority of their training "on-the-job." Exhibit 12-11 summarizes the average number of training hours received by YISD security personnel compared to peer districts.
Exhibit 12-11 Average Training Hours for Police or Security Officers
1996-97
Peer District Average Number of Training Hours
Houston ISD 40
Dallas ISD 40
Fort Worth ISD 40
Austin ISD 80
El Paso ISD 75
San Antonio ISD 80
Corpus Christi ISD 40
Socorro ISD 24
Peer District Average 52
Ysleta ISD 32
Source: Telephone interviews with Abe Ramirez, YISD Security, December 1997 Exhibit 12-11 shows YISD provides significantly less annual training hours per security officer than the peer district average. Police or security officers in peer districts used for comparison to YISD averaged 52 training hours per year, or 86 percent more than the 32 hours of training received by YISD security officers. New security officers are required to take 64 hours of basic security training and receive Level I training in association with the Texas Board of Private Investigators. Security officers that have been employed by the district attend training as needed. During interviews with the

supervisor of Security, assistant coordinator of Security, and seven coordinators of security for high school feeder patterns, members of the review team were told the district did not provide adequate training for its security officers. Each person interviewed said additional training was needed on the Texas Family Code (Levels I, II, and III), the Texas Penal Code, sexual harassment, conflict resolution, interpersonal skills, and employee wellness. The Security supervisor told members of the review team the district expects to conduct training sessions for security officers in 1997-98 on the Texas Family Code, Texas Penal Code, and conflict resolution. Verbatim comments from participants in focus groups and public meetings reflect a perception that YISD security officers do a good job but are not as well- trained as they could be. Samples of comments from participants in focus groups and public meetings include:
• "...Security does the best they can dealing with students..."
• "...Security guards flirt more than they patrol. They should quit socializing and do their job..."
• "...Security is not an area where incompetent workers should be..."
• "...It is a shame that some security guards show so little professionalism and respect to our kids and parents at Del Valle. These security guards are transferred from one school to another rather than being dismissed..."
• "...The security force does not appear qualified; they seem afraid of stepping in..."
Recommendation 140: Provide additional training to security officers. YISD should expand its training program by providing additional training on the Texas Family Code, the Texas Penal Code, sexual harassment, conflict resolution, interpersonal skills, and employee wellness. A minimum of 40 to 50 hours of training should be mandatory for all officers and training courses should be updated annually. Ongoing training will keep security officers informed of there responsibilities to effectively deal with incidents on middle and high school campuses. IMPLEMENTATION STRATEGIES AND TIMELINE
1. The executive director of Auxiliary Services directs the supervisor of Security to expand security training offerings. June 1998
2. The executive director of Auxiliary Services reviews expanded training options and determines the annual cost of providing training for YISD security officers. July 1998
3. The executive director of Auxiliary Services, considering the potential for shared services August

with the City of El Paso in 1999-2000, presents a nine-month training plan with an accompanying budget to the chief financial officer and superintendent.
1998
4. The chief financial officer and superintendent approve the budget and training plan. August 1998
5. The board approves the security training budget. August 1998
6. The director of Auxiliary Services, considering the potential for shared security services with the City of El Paso, begins the security training plan for nine months.
September 1998
FISCAL IMPACT The fiscal impact of this recommendation will include additional training resources in the form of course materials, outside consultants, or in-district travel for a nine month period, assuming the district enters into an interlocal agreement with the City of El Paso to provide police officers in 1999-2000. Annual training costs are estimated to be $3,800 per officer for nine months ($3,800 x 68 = $258,400 x 75 percent = $193,800). Ongoing training costs in future years will be shared by YISD and the City of El Paso at $3,800 per officer per year ($3,800 x 68 x 50 percent)
Recommendation 1998-99 1999-2000 2000-01 2001-02 2002-03
Provide additional training to security officers
($193,800) ($129,200) ($129,200) ($129,200) ($129,200)

Chapter 12
SAFETY AND SECURITY C. Safety CURRENT SITUATION According to the district's Board Policy Manual, the board can authorize the superintendent or a designee to develop and implement a districtwide safety program. As the superintendent's designee, the director of Risk Management is responsible for developing, implementing, and monitoring YISD's safety program. The director of Risk Management and two safety specialists develop districtwide safety training programs; establish safety objectives in conjunction with school principals and develops safety procedures for all schools; conduct, coordinate, and monitor safety training at all schools and departments; and advise and report to the superintendent and board on all district safety-related matters. School principals and department managers provide and supervise safety training programs and meetings at their respective schools and departments. School and departmental safety coordinators are designated by principals and department managers to cooperate with Risk Management. The safety coordinators monitor the overall safety program for schools and departments, coordinate safety training, and develop initiatives to increase employee involvement in safety. Accordingly, each school has a safety committee made up of principals, teachers, custodians, and other school staff appointed by the principal. Through the principal, the safety committee provides feedback to Risk Management about safety-related issues that need to be corrected to improve the effectiveness of the district's safety program. FINDING Risk Management administers a comprehensive safety program for administrators, teachers, employees, and students within the district. Exhibit 12-12 summarizes the safety programs administered by Risk Management.
Exhibit 12-12 Components Safety Programs Administered by YISD
Safety Program Components Description
Instructional Management
· Promotes the use of proper tools and personal protective equipment to staff and students. · Provides driver safety training, drug and driver safety policies, hazardous communication, hazardous waste, and

bus driver training. · Ensures communication is established between employees and staff related to safety issues.
School/Organizational Improvement
· Investigates indoor air quality complaints, including lead-based products, volatile organic compounds, and microorganisms. · Coordinates with outside consultants and state and local health agencies to determine the legitimacy of indoor air quality complaints. · Coordinates maintenance activities to ensure that indoor air quality meets or exceeds federal and state guidelines.
Personnel Management
· Manages personnel effectively by delegating safety training to appropriate supervisors. · Recognizes exemplary safety performance by recommending awards for individuals (principals, custodians, and bus drivers).
Administration and Fiscal/Facilities Management
· Maintains administrative control of safety training through inspection and testing of employees. · Evaluates safety of campuses and facilities to ensure compliance with safety rules and procedures, and recommends physical controls for equipment. · Removes out-of-service or unsafe facilities or equipment from the work place.
Student/Management
· Works with faculty leaders to provide students with information and procedures on how to react in emergency situations. · Recommends safe walking routes to each campus. · Provides crossing guards with training and procedures to ensure safe and orderly student crossing.
Asbestos Abatement
· Inspects facilities for presence of asbestos. · Contracts for the removal of asbestos-containing material. · Ensures that district employees engaged in asbestos abatement are properly trained.
School/Community Relations
· Articulates the district's safety programs to parents and general public
Safety Employee of Month/Year
· Evaluates employees nominated for safety employee of the month by supervisors against predetermined safety criteria. · Establishes safety committee to select the safety employee of the year from the pool of monthly winners.
"Buster the Bus" · Uses remote controlled robot modeled after a school bus to

train students in Pre-K through 4th grade in how they observe bus safety rules. · Teaches students to cross the street safely using crosswalks. · Teaches students safety while waiting for, riding, and exiting school buses.
Wellness Program
· Establishes a structured wellness program that includes preventive benefits in a health plan and a comprehensive health risk assessment that help identify employees' health risk factors. · Provides employee health screenings in cooperation with the Columbia Life Care Center.
Train the Trainer Bus Driver Training
· Provides a YISD safety specialist (certified bus driver safety trainer) to attend bus driver safety training in partnership with the Texas Engineering Extension Service, the Texas Department of Transportation, the Texas Association of Pupil Transportation, the Texas Department of Public Safety, and Texas Education Agency to be able to train YISD bus drivers at district locations. · Provides behind-the-wheel training and classroom instruction for bus drivers.
Driver Check
· Provides timely information about on-the-road operation of all YISD vehicles. · Uses highly visible decals with the phone number 1-800-2-ADVISE attached to the rear of each vehicle. · Disciplines YISD employees reported by the public for bad driving to improve driver performance. YISD receives reports from Driver Check, Inc. and responds to driver behavior problems, emergency situations, or complimentary reports.
Drug/Alcohol Screening · Ensures that all drug and alcohol screening and testing administered to YISD employees complies with local, state, and federal regulations.
Source: YISD Office of Risk Management, November 1997 COMMENDATION YISD has implemented comprehensive safety training measures that ensure the safety of administrators, teachers, employees, and students. FINDING In 1995-96 YISD paid $703 per employee in workers' compensation claims (computed from Texas Association of School Board's Benchmarks and Texas Education Agency's

(TEA) Academic Excellence Indicator System Reports), compared to a peer district average of $527 per employee, or 33 percent more than comparative peer districts. YISD has mandatory training for ancillary and hourly employees and some paraprofessional employees. For example, employees handling asbestos materials and other hazardous materials all have mandatory training. Additionally, bus drivers undergo an additional 20 hours of driver training over and above the hours required by TEA; district employees that drive YISD-owned vehicles or their own vehicles on district business undergo mandatory driver safety training once every three years. YISD does not require mandatory safety training for all paraprofessional employees. Although paraprofessional employees receive basic safety training when hired, an ongoing training program reinforcing safety training to avoid work-related accidents is not required. Establishing annual, mandatory safety training for all district employees potentially lowers workers' compensation claims. Recommendation 141: Require mandatory safety training for paraprofessional employees. Paraprofessionals should be required to attend quarterly safety training workshops conducted by YISD Safety Specialists and department supervisors or mangers. Ongoing training will stress the importance of a safe working environment, and focus on accident prevention. This training program should result in lower workers' compensation claims and a safer working environment. IMPLEMENTATION STRATEGIES AND TIMELINE
1. The director of Risk Management drafts a policy requiring mandatory safety training for all paraprofessional employees.
June 1998
2. The associate superintendent for Human Resources reviews and approves the policy.
June 1998
3. The board reviews and approves the policy after first and second readings.
July - August 1998
4. The director of Risk Management, in cooperation with department managers, develops a mandatory safety training schedule for paraprofessional employees.
September - October 1998
5. The department managers, under the supervision of the director of Risk Management, begin conducting mandatory safety training for paraprofessionals on a quarterly basis.
December 1998 and quarterly thereafter
FISCAL IMPACT

This recommendation can be implemented with existing resources by using the safety specialists as coordinators and supervisors from the various departments as trainers.

Appendix A Summary of Survey Results METHODOLOGY Surveys of various stakeholders within the Ysleta Independent School District (YISD) were conducted during November 1997. The surveys gathered information from a representative sample of each stakeholder group regarding their views and opinions of YISD. Empirical Management Services (EMS) contracted Telesurveys, Inc. (Telesurveys) to conduct bilingual telephone surveys of YISD citizenry (public input survey results) during the month of November 1997. In addition, Telesurveys also conducted a self-administered (written) survey of the following stakeholders:
• YISD central and sub-district administrators • Principals and assistant principals • Teachers • Students
OBJECTIVES The surveys were used to determine stakeholder perceptions of:
• The quality of education and related changes over time; • School district administrators, principals, teachers and school board members; • The district's operational efficiency; • The district's educational programs; • The condition of the district's facilities; • Major issues facing the district; • Community involvement and support for the district (including community
opinions of the school district); and • Suggestions for improvement.
Sampling Parents, Taxpayers and Community-at-Large (Public Opinion Survey) Telesurveys obtained a random digit sample (RDD) for telephone exchanges lying within a specific geographic boundary defined by 7 zip codes. A total of 600 citizen interviews were completed from this sample, which is a proportionate-to-size probability sample of all telephone households in the designated YISD sampling frame. A sample of this size permits inferences to be made at a 95 percent confidence interval with a margin of error of plus or minus five percent. Exhibit A-1 presents the actual number of completed interviews by race and gender, along with an unweighted percentage distribution.

Exhibit A-1 YISD Community Public Opinion Survey Respondents
(Completed Interviews by Race and Gender)
Race Number Unweighted Percent
Anglo 132 22%
African American 12 2%
Hispanic 426 71%
Other 18 3%
Asian 6 1%
Refused to Reply 6 1%
Total 600 100%
Gender
Male 264 44%
Female 336 56%
Total 600 100%
YISD Central Administrators The review team administered the central administrator surveys in YISD during November 1997. One hundred and thirty-seven central administrators participated in the survey. Survey results were tabulated in Empirical Management Services' office using SPSS, a statistical analysis software program. Exhibit A-2 presents the actual number of completed interviews by race and gender, along with an unweighted percentage distribution.
Exhibit A-2 YISD Central and Sub-District Administrator Respondents
(Completed Interviews by Race and Gender)
Race Number Unweighted Percent
Anglo 41 30%
African American 0 0%
Hispanic 88 64%
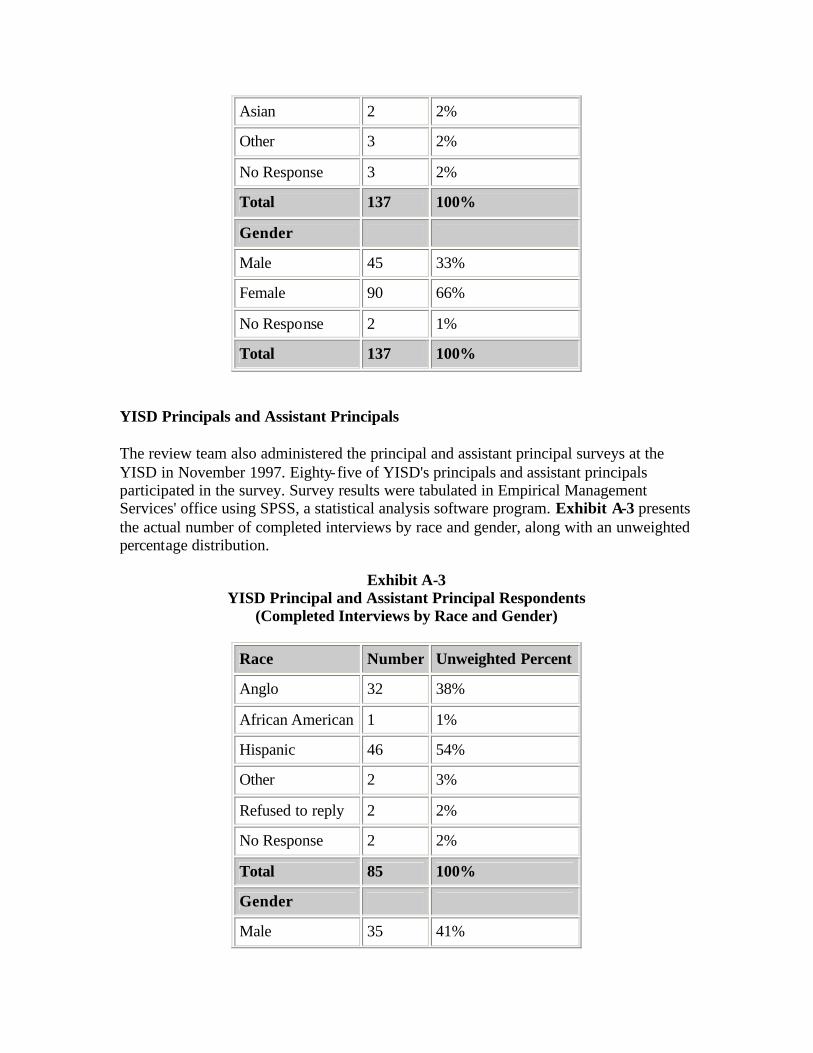
Asian 2 2%
Other 3 2%
No Response 3 2%
Total 137 100%
Gender
Male 45 33%
Female 90 66%
No Response 2 1%
Total 137 100%
YISD Principals and Assistant Principals The review team also administered the principal and assistant principal surveys at the YISD in November 1997. Eighty-five of YISD's principals and assistant principals participated in the survey. Survey results were tabulated in Empirical Management Services' office using SPSS, a statistical analysis software program. Exhibit A-3 presents the actual number of completed interviews by race and gender, along with an unweighted percentage distribution.
Exhibit A-3 YISD Principal and Assistant Principal Respondents
(Completed Interviews by Race and Gender)
Race Number Unweighted Percent
Anglo 32 38%
African American 1 1%
Hispanic 46 54%
Other 2 3%
Refused to reply 2 2%
No Response 2 2%
Total 85 100%
Gender
Male 35 41%

Female 49 58%
No Response 1 1%
Total 85 100%
YISD Teachers The review team randomly selected 30 percent of YISD's teachers to participate in the opinion survey in November 1997. Teacher survey instruments were distributed to YISD's schools and 413 survey instruments were returned. Survey results were tabulated in Empirical Management Services' office using SPSS, a statistical analysis software program. Exhibit A-4 presents the actual number of completed interviews by race and gender, along with an unweighted percentage distribution.
Exhibit A-4 YISD Teacher Respondents
(Completed Interviews by Race and Gender)
Race Number Unweighted Percent
Anglo 151 37%
African American 10 3%
Hispanic 192 46%
Asian 0 0%
Other 27 6%
No Response 33 8%
Total 413 100%
Gender
Male 134 32%
Female 259 63%
No Response 20 5%
Total 413 100%
YISD Students The review team randomly selected junior and senior high school students at each YISD

high school to participate in the student survey in November 1997. Seven hundred and seventy-three students responded to the survey. Survey results were tabulated in Empirical Management Services' office using SPSS, a statistical analysis software program. Exhibit A-5 presents the actual number of completed interviews by race and gender, along with an unweighted percentage distribution.
Exhibit A-5 YISD Student Respondents
(Completed Interviews by Race and Gender)
Race Number Unweighted Percent
Anglo 54 7%
African American 26 3%
Hispanic 635 82%
Asian 0 0%
Other 46 6%
No Response 12 2%
Total 773 100%
Gender
Male 407 52%
Female 364 47%
No Response 2 1%
Total 773 100%
Questionnaire Design The survey questionnaires were designed to obtain community members, central administrators, school administrators, teachers, and students' perceptions about the 12 specific focus areas to be reviewed during on-site activities including safety and security, food service and transportation. While conducting the public input survey of Ysleta community members, bilingual telephone interviewers used a Spanish language version, when required, for Spanish-speaking respondents. Copies of interview questionnaires for each survey are included later in the appendix, along with detailed survey results. SUMMARY RESULTS Major themes reflected in survey responses for each stakeholder group include:

Ysleta Citize nry, Parents, Taxpayers and Community-at-Large (Public Opinion Survey)
• The majority (72 percent) of community residents generally perceives the quality of education in the district to be good or excellent and 53 percent feel the quality of public education in YISD has improved over the past three years.
• Almost seven in ten community residents perceive YISD to be operating somewhat efficiently or very efficiently.
• Sixty-one percent of the respondents agree or strongly agree YISD schools are safe and secure.
• Eight out of ten community residents agree or strongly agree that schools in YISD are good places to learn; and 81 percent agree or strongly agree that that YISD teachers care about students' needs.
• Eighty-six percent of community residents agree or strongly agree that Ysleta parents are provided opportunities to play an active role in public schools.
• Ninety-four percent of respondents surveyed have children enrolled in YISD. Generally, the education at the elementary (85 percent), middle (75 percent), and high schools (75 percent) was rated as being either good or excellent.
• The majority of community residents (61 percent) feel that the district does a good job of preparing students for college or the workforce. Seventy-four percent feel that YISD places too much emphasis on TAAS testing, and not enough emphasis on providing students with a well-rounded education.
YISD Central and Sub-District Administrators
• Generally, YISD central and sub-district administrators feel that school board members have an average or below average knowledge of the educational needs of students in YISD. Almost seven in ten respondents gave the school board a grade of "C" or lower in this category.
• Seven in ten respondents feel the superintendent is doing a good job as an instructional leader, based on their grade of either "A" or "B" in this area, while 63 percent feel the superintendent is doing a good job in his role as chief administrator of YISD.
• Sixty percent of respondents feel site-based decision-making had been implemented effectively in YISD, assigning the effectiveness of implementation a grade of "A" or "B".
• Fifty-nine percent of respondents feel that YISD maintained effective programs for bilingual students.
• Sixty percent of respondents are satisfied with the authority that they have to carry out their administrative responsibilities, assigning a grade of either "A" or "B" in this area. This response level seems to indicate that central and sub-district administrators feel they are empowered to manage their respective functions with autonomy.
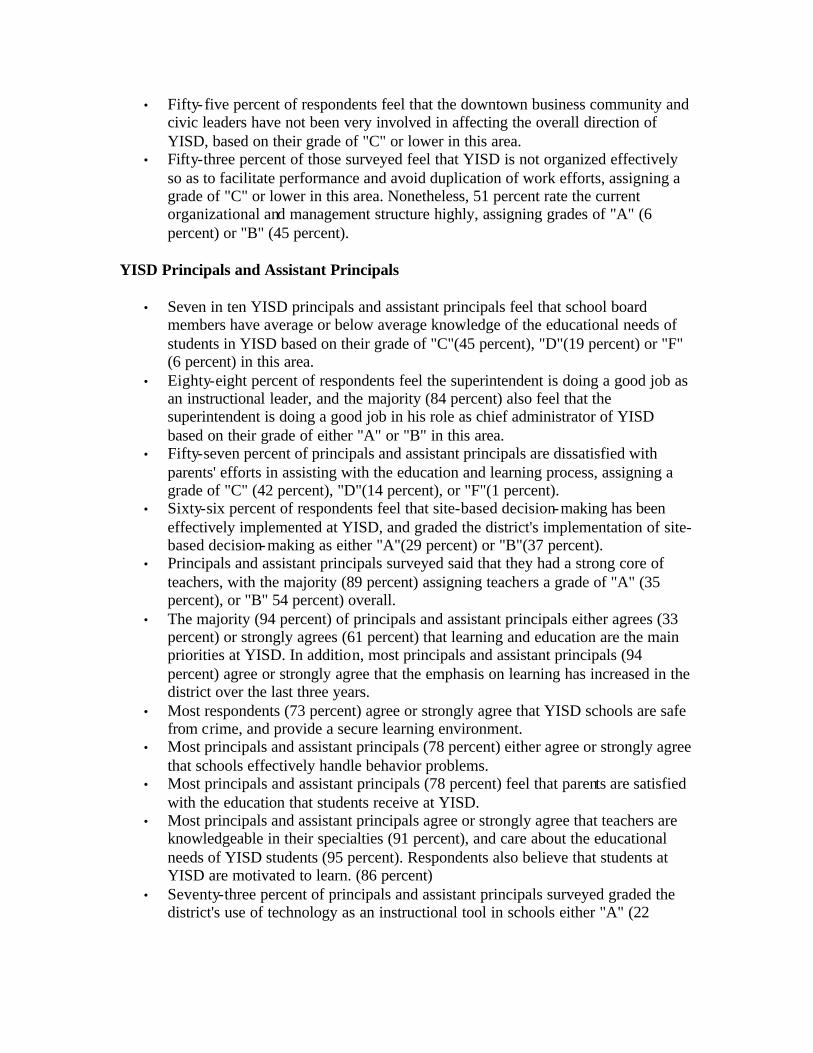
• Fifty-five percent of respondents feel that the downtown business community and civic leaders have not been very involved in affecting the overall direction of YISD, based on their grade of "C" or lower in this area.
• Fifty-three percent of those surveyed feel that YISD is not organized effectively so as to facilitate performance and avoid duplication of work efforts, assigning a grade of "C" or lower in this area. Nonetheless, 51 percent rate the current organizational and management structure highly, assigning grades of "A" (6 percent) or "B" (45 percent).
YISD Principals and Assistant Principals
• Seven in ten YISD principals and assistant principals feel that school board members have average or below average knowledge of the educational needs of students in YISD based on their grade of "C"(45 percent), "D"(19 percent) or "F" (6 percent) in this area.
• Eighty-eight percent of respondents feel the superintendent is doing a good job as an instructional leader, and the majority (84 percent) also feel that the superintendent is doing a good job in his role as chief administrator of YISD based on their grade of either "A" or "B" in this area.
• Fifty-seven percent of principals and assistant principals are dissatisfied with parents' efforts in assisting with the education and learning process, assigning a grade of "C" (42 percent), "D"(14 percent), or "F"(1 percent).
• Sixty-six percent of respondents feel that site-based decision-making has been effectively implemented at YISD, and graded the district's implementation of site-based decision-making as either "A"(29 percent) or "B"(37 percent).
• Principals and assistant principals surveyed said that they had a strong core of teachers, with the majority (89 percent) assigning teachers a grade of "A" (35 percent), or "B" 54 percent) overall.
• The majority (94 percent) of principals and assistant principals either agrees (33 percent) or strongly agrees (61 percent) that learning and education are the main priorities at YISD. In addition, most principals and assistant principals (94 percent) agree or strongly agree that the emphasis on learning has increased in the district over the last three years.
• Most respondents (73 percent) agree or strongly agree that YISD schools are safe from crime, and provide a secure learning environment.
• Most principals and assistant principals (78 percent) either agree or strongly agree that schools effectively handle behavior problems.
• Most principals and assistant principals (78 percent) feel that parents are satisfied with the education that students receive at YISD.
• Most principals and assistant principals agree or strongly agree that teachers are knowledgeable in their specialties (91 percent), and care about the educational needs of YISD students (95 percent). Respondents also believe that students at YISD are motivated to learn. (86 percent)
• Seventy-three percent of principals and assistant principals surveyed graded the district's use of technology as an instructional tool in schools either "A" (22

percent) or "B" (51 percent). Seventy-five percent of them gave the district an "A" or a "B" grade for its use of technology for administrative purposes.
YISD Teachers
• Seventy-three percent of YISD teachers feel that school board members have average or below average knowledge of the educational needs of students in YISD, assigning a grade of "C" or lower in this area.
• Sixty-one percent of the respondents feel that their principal is doing an above average job as an instructional leader of the school (34 percent assigned their principals a grade of "A"). Fifty-six percent also feel their principal is doing an above average job as manager of the school staff and teachers (30 percent assigned their principals a grade of "A").
• Sixty percent of the respondents feel that the superintendent is doing an average or below average job as the instructional leader and administrative manager of the district, assigning a grade of "C" or lower in this area.
• Seventy-five percent of respondents feel that parents' efforts in assisting with the education and learning process was average to below average, with 47 percent assigning parents' efforts a grade of "C" and 28 percent assigning parents' efforts grades of "D" and "F".
• Fifty-four percent of teachers rated the district's relationship with various groups within the community as being average or below average.
• Twenty-eight percent of teachers responding to the survey feel the assistance they received in their respective classrooms from representatives of the Instructional/Curriculum Services Department at YISD's central office merited a grade of "A" or "B". Seventy-one percent feel grades from "C" through "F" were more representative of the assistance received.
• Sixty-seven percent of those surveyed feel that the implementation of site-based decision-making was average or below average (twenty-seven percent assigned a grade of "C"). Thirty-two percent of the respondents feel YISD's implementation of site-based decision-making merited an "A" or "B".
• Eighty-one percent of the respondents said that for one or more follow-up contacts must be made with the principal or school clerk before requested supplies are received. Teachers gave YISD low marks in terms of overall ability to obtain needed supplies, and the methods used to obtain them. (31 percent responded "C"; 21 percent said "D" and 10 percent said "F").
• Almost six in ten teachers responding to the survey would like to have greater involvement with developing budgets for their school. Only thirty-six percent feel that their current level of involvement was at a good level.
• Forty-four percent of the respondents indicated that the principal or assistant principal visited their classrooms one to two times per month. Thirteen percent received visits three to four times per month. Eleven percent received visits five or more times per month. Thirty percent indicated that neither principals nor assistant principals visited their classrooms during the month. However, sixty-two percent of respondents feel they should receive one to two visits per month and twenty-two percent feel they should receive three to four visits per month.

• Fifty-three percent of the respondents feel that the staff development program used in their respective schools has improved their classroom teaching and management.
• Fifty-four percent of teachers rated the use of technology, including hardware, software, communications and support in the school as above average. (20 percent "A"; 34 percent "B"). Only 44 percent feel that YISD had done an above average job of integrating the use of computers with the regular educational curriculum.
• The majority (67 percent) of teachers agrees or strongly agrees that their work facilities are safe, and 69 percent agree or strongly agree that the facilities encourage a learning environment.
YISD Students
• Students responding to the survey feel they are receiving a quality education in YISD. Sixty-eight percent of the respondents graded the quality of education they are currently receiving as "A" (16 percent) or "B" (52 percent).
• Almost seven in ten respondents graded their teachers as "A" (20 percent) or "B" (49 percent) overall.
• Ninety-three percent of the respondents indicated that they feel fairly safe or very safe in their schools, with 65 percent feeling fairly safe. Sixty-nine percent of respondents feel that misbehavior interferes with classroom learning, while only 38 percent feel that most students try to do their best in class.
• Forty-eight percent of respondents either agree or strongly agree that teachers care about students' needs. Fifty-two percent agree or strongly agree that teachers give them individual attention, and 51 percent said that teachers praise them when they are doing well in school.
• Sixty-three percent of respondents feel that there are enough bilingual teachers at their school, while 50 percent of respondents feel that the actual programs are adequate at their school.
• Seventy-eight percent of the respondents plan to attend college when they graduate from high school. In addition, sixty-two percent of students agree or strongly agree that school counselors provide adequate guidance on career and college opportunities.
• Students surveyed said that both principals (73 percent) and assistant principals (76 percent) attend school activities either fairly often or very often. They do not, however, visit classrooms with the same regularity. Only a handful of students thought that either principals (4 percent), or assistant principals (5 percent), visited their classrooms either fairly often or very often.
• Eighty-five percent of the students surveyed either agree (41 percent), or strongly agree (44 percent) that learning is the school's most important goal. Most students either agree or strongly agree that the school supports this goal by offering a broad selection of challenging courses (61 percent), and a strong library (59 percent) with sufficient books and resources for students to use.

Appendix B Survey Questionnaires In addition to community meetings held to determine area of concern or praise for noteworthy accomplishments, surveys of the following groups were conducted:
• Central and district administrators
• Principals and assistant principals
• Teachers
• Students
• The public (members of the community living within YISD boundaries)
A statistically valid sample of each population was selected at random to determine the opinions of each group. This appendix contains a copy of questionnaires used to conduct each survey.
Ysleta Independent School District Management and Performance Review Public Input Survey Questionnaire
(Telephone Interview) Population n=600 Introduction
Good (morning/afternoon). This is [First & Last Name] with Telesurveys Research Associates, an opinion research firm in Houston, Texas. We are calling people in your area to get your opinions on important issues facing Ysleta Independent School District (YISD) and would like to include you in our study. The study is being conducted for the Texas State Comptroller of Public Accounts. Your responses to the survey will be treated with strict confidence and no names will ever be used in the report. There are no right or wrong answers. We just want your honest opinion.
1. First, do you live in the Ysleta Independent School District, or in some other school district?
Ysleta ISD Continue
Other District Terminate
Unsure Terminate
2. In your opinion, would you rate the quality of public education in YISD schools as...

Excellent Good Fair Poor
3. Over the past three years, would you say the quality of public education in YISD has...
Improved Gotten Worse Stayed the Same
Now, I am going to read a list of different groups of employees in YISD. Please use the grades A, B, C, D, or F to indicate how well you think each group performs their job.
4. First of all, in general, what grade would you give the YISD school board members' knowledge of the educational needs of students within YISD? Would you give the school board an A, B, C, D, or F?
A B C D F
5. Overall, would you rate the performance of the current school board an A, B, C, D, or F?
A B C D F
6. And, how would you rate the overall performance of Superintendent Anthony Trujillo? Would you give her an A, B, C, D, or F?
A B C D F
7. What about the overall performance of top administrators below the superintendent? Would you give them an A, B, C, D, or F?
A B C D F
8. Do you have any school age children living in your home?
Yes No
If Yes, ask: Are they enrolled in YISD schools or private schools?
YISD Private

Both Other (specify)
If YISD or Both, ask: Do you have children enrolled in a YISD...
Yes No
Elementary school
Middle school
High school
For each Yes in the above, ask: How would you rate the quality of education your child receives through a YISD elementary/middle/high school? Would you say it is...
Elementary Middle High
Excellent
Good
Fair
Poor
9. How much would you say you know about programs and services provided by YISD?
A Lot A Little Nothing
Based on what you know or have heard, do you strongly agree, agree, no opinion, disagree, or strongly disagree for each of the following statements about YISD:
10. Schools in YISD are safe and secure.
Strongly Agree Agree No Opinion Disagree Strongly Disagree
11. YISD elementary schools effectively handle problems of misbehavior.
Strongly Agree Agree No Opinion Disagree Strongly Disagree
12. YISD secondary schools effectively handle problems of misbehavior.

Strongly Agree Agree No Opinion Disagree Strongly Disagree
13. Schools in YISD have sufficient space and facilities to support the instructional programs.
Strongly Agree Agree No Opinion Disagree Strongly Disagree
14. School buildings in YISD are in good condition.
Strongly Agree Agree No Opinion Disagree Strongly Disagree
15. School buildings in YISD are clean and well maintained.
Strongly Agree Agree No Opinion Disagree Strongly Disagree
16. Schools in YISD are good places to learn.
Strongly Agree Agree No Opinion Disagree Strongly Disagree
17. Schools in this district have the materials and supplies necessary for instruction in basic skills programs.
Strongly Agree Agree No Opinion Disagree Strongly Disagree
18. YISD teachers care about students' needs.
Strongly Agree Agree No Opinion Disagree Strongly Disagree
19. YISD parents are given opportunities to play an active role in public schools.
Strongly Agree Agree No Opinion Disagree Strongly Disagree
20. YISD parents feel welcome when they visit a school.
Strongly Agree Agree No Opinion Disagree Strongly Disagree

21. YISD parents participate in school activities and organizations.
Strongly Agree Agree No Opinion Disagree Strongly Disagree
22. Community members take an active part in the education of children in YISD..
Strongly Agree Agree No Opinion Disagree Strongly Disagree
23. Community members feel welcome when they attend YISD school board meetings to express their views.
Strongly Agree Agree No Opinion Disagree Strongly Disagree
24. The superintendent and staff work to involve the community in YISD activities.
Strongly Agree Agree No Opinion Disagree Strongly Disagree
25. The school principals work to involve the community in campus activities.
Strongly Agree Agree No Opinion Disagree Strongly Disagree
26. YISD administration does a lot to promote good relations between the district and the community.
Strongly Agree Agree No Opinion Disagree Strongly Disagree
27. Communications are good between YISD district administration and the community.
Strongly Agree Agree No Opinion Disagree Strongly Disagree
28. The community is proud of public school education in YISD.
Strongly Agree Agree No Opinion Disagree Strongly Disagree
29. YISD places too much emphasis on passing the TAAS, and not enough emphasis on providing students with a well- rounded education.

Strongly Agree Agree No Opinion Disagree Strongly Disagree
30. YISD students are prepared to go on to college or directly into the work force when they graduate.
Strongly Agree Agree No Opinion Disagree Strongly Disagree
31. The local business community in El Paso does a lot to support YISD programs.
Strongly Agree Agree No Opinion Disagree Strongly Disagree
32. YISD does a good job of meeting the educational needs of a disadvantaged student population.
Strongly Agree Agree No Opinion Disagree Strongly Disagree
34. What about YISD's magnet school programs such as fine arts, health professions, and languages? Based on what you know or have heard, would you say that the magnet school programs are...
Excellent Good Fair Poor
Based on what you know or have heard about the magnet school, do you strongly agree, agree, no opinion, disagree, or strongly disagree with the following statement:
35. YISD should expand its magnet school programs to include additional programs such as science, engineering, music, etc.
Strongly Agree Agree No Opinion Disagree Strongly Disagree
36 YISD does a good job of managing the tax dollars used to operate the district.
Strongly Agree Agree No Opinion Disagree Strongly Disagree
37. Overall, based on everything you have seen, heard or read about the district, would you say YISD is operated...
Very Efficiently Efficiently Not Very Efficiently Inefficiently
38. What would you say is the most critical issue currently facing YISD?
Demographic Information
D1. Now, I have a few background questions and then we will be finished. First, how long have you lived in Ysleta?
1 to 2 years 3 to 5 years 6 to 10 years 10+ years
D2. Counting yourself, how many people live in your household?
1 2 3 4 5 6 7+
D3. What is the highest level of formal education you have completed?
Less than High School
High School Graduate
1 to 3 years of College
College Graduate plus
D4. Are you...
Married Widowed Separated Divorced Never Married Living Together
D5. Are you currently...
Employed full time
Employed part time Unemployed Retired or
Disabled Going to school
A Home Maker Other
If Married, ask:
D6. Is your spouse currently...
Employed full time
Employed part time Unemployed Retired or
Disabled Going to school
A Home Maker Other
D7. Do you...

Own Rent Live Rent Free
D8. What is your home zip code?
D9. In what group does your age fall? Are you...
18 to 24 years old
25 to 34 years old
35 to 49 years old
50 to 64 years old
65+ years old
D10. Do you consider yourself...
Anglo Hispanic Other
D11. What was your total annual household income for 1994 from all sources, before taxes.
Less than $5,000
$5,000 to $14,999
$15,000 to $24,999
$25,000 to $34,999
$35,000 to $49,999
$50,000 or more
D12. Interviewer: record gender of respondent
Male Female
Thank you very much for your cooperation.
Ysleta Independent School District Management And Performance Review Central Administrator Survey
(Written/Self-Administered) Population n=137 Introduction
The Texas State Comptroller's office has commissioned a Management and Performance Review of the Ysleta Independent School District (YISD). The three main objectives of

the performance review are to (1) enhance educational service delivery through better operating efficiency, (2) identify ways to improve management practices, and (3) identify opportunities for cost savings within district operations. Input from central administrators is critical to the management review process; therefore, we would like as many administrators as possible to complete the survey instrument. You have been randomly selected to participate in the survey. No names are requested on the survey instrument, so your responses will be treated with strict confidence. There are no right or wrong answers, however, your honest responses will ensure that central administrators in your district have accurate and unbiased input into the management and performance review process. Your completed survey should be mailed in the enclosed self-addressed, stamped envelope no later than November 14, 1997. Please circle the answer that best describes how you feel about the survey question asked. Provide a brief response to questions that require a narrative answer. Demographic Data
1. Please indicate your gender.
Male Female
2. Please indicate your ethnicity.
Anglo African American Hispanic Asian Other
3. How many years have you been an YISD administrator, including this school year?
1 - 5 6 - 10 11 - 15 16 - 20 21 - 25 26+
4. How many years have you been with YISD in total, including this school year?
1 - 5 6 - 10 11 - 15 16 - 20 21 - 25 26+
The next few questions deal with your general perceptions of YISD.
5. In general, what grade would you give the YISD school board members' knowledge of the educational needs of students in YISD? Would you give the board an A, B, C, D, or F?
A B C D F

6. In general, what grade would you give superintendent, Mr. Anthony Trujillo , in his role as the instructional leader of YISD?
A B C D F
7. How would you grade the YISD superintendent, Mr. Anthony Trujillo, in his role as the chief administrator of YISD?
A B C D F
8. In general, what grade would you give to the extent to which central administrative staff is supportive and actively involved on YISD campuses?
A B C D F
9. In general, what grade would you assign to YISD teachers' attitudes about their jobs?
A B C D F
The next few questions deal with specific programs and policies at YISD.
10. Using the grading system, how effective do you think site-based decision management has been implemented in YISD?
A B C D F
11. What grade do you give to the district's use of programs for bilingual students?
A B C D F
The next few questions deal with the financial management of YISD.
12. What grade would you assign to the efficiency of the budgeting process?
A B C D F

13. What role do you have in determining how funds are spent in the YISD district?
None or Very Little I make my own program Relay my needs to others Other
14. What role do you play in developing budgets?
None or Minor Direct Role in Budget Collaborative Role Other
15. Using the grading system above, please grade your level of satisfaction with the input you have in determining spending priorities for your administrative function.
A B C D F
16. Please grade your level of satisfaction with the input you have in developing budgets for your administrative area.
A B C D F
17. What grade would you assign to the accuracy, consistency and timeliness of information you receive from the Accounting and Finance departments?
A B C D F
18. What suggestions do you have for improving the efficiency and effectiveness of financial management at YISD?
The next few questions are about the overall organization and management at YISD.
19. Using the grading system, what grade would you assign to YISD in terms of being organized in a manner that facilitates performance and does not duplicate work efforts?
A B C D F

20. What grade would you assign to your level of satisfaction with the authority you have to effectively carry out your administrative responsibilities?
A B C D F
21. What grade would you give communications (both internal and external) at YISD?
A B C D F
22. What grade would you give to how involved community organizations (such as the downtown business community and various civic leaders) have been in affecting the direction of YISD?
A B C D F
23. Overall, what grade do you assign to YISD's current organizational and management structure?
A B C D F
24. What would you recommend to improve YISD's organizational and management structure?
The next few questions are about the personnel management function and some of the employee benefits at YISD.
25. How efficient is the current job posting and hiring process when it comes to meeting the district's staffing needs?
A B C D F
26. What grade would you assign to the efficiency of YISD's follow-up processes concerning issues such as dismissal, discipline and communication?
A B C D F

27. What grade would you assign to how well current procedures identify staff training needs, develop materials and deliver programs which meet training needs?
A B C D F
28. What grade would you assign to the effectiveness of current processes for personnel evaluation and assessment of success?
A B C D F
29. Overall, what grade would you give to YISD employee's job satisfaction and morale or motivation to work?
A B C D F
30. And overall, what grade would you assign to the effectiveness of YISD's current personnel management policies and procedures?
A B C D F
31. What grade would you assign to YISD's health insurance plan?
A B C D F
The next few questions are about YISD's management information systems function and instructional technology.
32. How would you rate the effectiveness of YISD's current technology to support your administrative functions?
A B C D F
33. What grade do you give to how well current technology supports instruction at YISD?
A B C D F
The next few questions are about the overall efficiency and effectiveness of YISD.

34. What comments do you have regarding the overall efficiency and effectiveness of the YISD?
35. Can you recommend any cost savings or other efficiencies to improve the efficiency and effectiveness of the functional areas under review?
36. What other concerns or general comments would you like to share with us about concerns we have not asked about or areas we need to explore as we conduct the review?
Ysleta Independent School District Management And Performance Review
Principal and Assistant Principal Survey
(Written/Self-Administered)
Population n=85
Introduction
The Texas State Comptroller's office is conducting a Management and Performance Review of the Ysleta Independent School District (YISD). The three main objectives of the performance review are to (1) enhance educational service delivery through better operating efficiency, (2) identify ways to improve management practices, and (3) identify opportunities for cost savings within district operations. Input from school administrators is critical to the management review process; therefore, we would like as many principals and assistant principals as possible to complete the survey instrument. No names are requested on the survey instrument, so your responses will be treated with strict confidence. There are no right or wrong answers, however, your honest responses will ensure that school administrators in your district have accurate and unbiased input into the manage and performance review process.

Your completed survey should be mailed in the enclosed self-addressed, stamped envelope no later than November 14, 1997. Please circle the answer that best describes how you feel about the survey question asked. Provide a brief response to questions that require a narrative answer.
Demographic Data 1. Gender...
Male Female
2. How long have you been employed by Ysleta ISD?
1-5 years 6-10 years 11-15 years 16-20 years 20+ years
3. Are you...
Anglo African American Hispanic Other Refused
4. Grades taught in your school...
Pre-K K - 5th 6th - 8th 9th - 12th
5. (Optional) Name of your school ... For the following set of questions please use the grades A, B, C, D, or F to indicate how well Ysleta ISD performs.
6. In general, what grade would you give the Ysleta ISD board of trustees...
A B C D F
7. What grade would you give the superintendent of Ysleta ISD...
A B C D F
8. In general, what grade would you give the other district-level administration in Ysleta ISD...

A B C D F
9. In general, what grade would you give the campus- level administration in Ysleta ISD...
A B C D F
10. In general, what grade would you give the teachers in Ysleta ISD...
A B C D F
Now on a scale of 1 thru 5, with 1 meaning you Strongly Agree and 5 meaning you Strongly Disagree, please indicate how you feel about each of the following. Remember a 1 is a strong agreement and 5 is a strong disagreement with a 3 being neither agreeing nor disagreeing.
Strongly Agree Strongly Disagree
11. Learning and education are the main priorities in Ysleta ISD...
1 2 3 4 5
12. Emphasis on learning has increased in the district in the past three years...
1 2 3 4 5
13. Ysleta ISD schools are safe from crime and provide a secure learning environment... 1 2 3 4 5
14. Schools effectively handle behavioral problems... 1 2 3 4 5
15. The necessary supplies and materials are made available to support instruction at Ysleta ISD...
1 2 3 4 5
16. Students are motivated to learn in Ysleta ISD... 1 2 3 4 5
17. Teachers are knowledgeable in the subject areas they teach...
1 2 3 4 5
18. Teachers care about the educational needs of the students in Ysleta ISD...
1 2 3 4 5
19. Principles/assistant principals actively work to meet students' needs... 1 2 3 4 5
20. Parents, in general, take responsibility for their children's 1 2 3 4 5

behavior in Ysleta ISD...
21. Parents are satisfied with the education students receive in Ysleta ISD...
1 2 3 4 5
22. District operations are cost effective and efficient... 1 2 3 4 5
23. Site-base decision management is implemented effectively in Ysleta ISD... 1 2 3 4 5
Going back to the grading scale, please tell me how you would rate the following using the A, B, C, D, and F grade.
24. The school boards' knowledge of the educational needs of students in Ysleta ISD... A B C D F
25. The school board members' ability to establish effective district policies... A B C D F
26. The superintendent's role as instructional leader of Ysleta ISD... A B C D F
27. The superintendent's role as chief administrator (manager) of Ysleta ISD... A B C D F
28. Principal's role as the instructional leader in Ysleta ISD schools... A B C D F
29. Principal's role as the manager of school staff and teachers in Ysleta ISD schools...
A B C D F
30. Teachers attitudes about their jobs... A B C D F
31. Amount of classroom time dedicated to TAAS preparation... A B C D F
32. Amount of classroom time dedicated to basic educational requirement such as reading, math, science, history... A B C D F
33. Parents' efforts in assis ting with the education and learning process... A B C D F
34. Parents' participation in school activities/organizations... A B C D F
35. District relationships with various groups in the community... A B C D F
36. The effectiveness of district communications (internal and external)..
A B C D F
37. District's use of technology as an instructional tool on your campus... A B C D F
38. District's use of technology for administrative purposes... A B C D F

39. District's use of programs for bilingual students... A B C D F
40. Conditions of Ysleta ISD facilities... A B C D F
For the next few questions please answer YES or NO.
41. Does Ysleta ISD fill vacancies and make promotions in staff/administration positions based on individual qualifications? YES N
O
42. Does an effective line of communication exist between your school and the central administration? YES N
O
43. Do you have sufficient time for planning curriculum at your campus? YES NO
44. In what one or two ways could the operational efficiency of Ysleta ISD be improved?
Again, using the grading system, please grade the combined efficiency and effectiveness for each of the following districtwide services of Ysleta ISD.
44 a. Instructional services... A B C D F
b. Maintenance services... A B C D F
c. Custodial services... A B C D F
d. Transportation services... A B C D F
e. Personnel services... A B C D F
f. Communications/community involvement... A B C D F
g. Food services... A B C D F
h. Financial services... A B C D F
i. Staff development... A B C D F
j. Management Information Services... A B C D F
k. Purchasing... A B C D F
l. Planning and Budgeting... A B C D F
m. Your overall grade for the operations of Ysleta ISD... A B C D F

Thank you very much for your cooperation. If you have additional comments, and would like to provide more input directly to the Comptroller's Office, you may call 1-800-531-5441, extension 5-3676.
Ysleta Independent School District Management and Performance Review
Teacher Survey Questionnaire (Written/Self-Administered)
Population
n=413
Introduction The Texas State Comptroller's office has commissioned a Management and Performance Review of the Ysleta Independent School District (YISD). The three main objectives of the performance review are to (1) enhance educational service delivery through better operating efficiency, (2) identify ways to improve management practices, and (3) identify opportunities for cost savings within district operations. You have been randomly selected to complete a survey questionnaire. Input from Ysleta ISD educators is critical to the management review process; therefore, we would like as many teachers as possible to participate. No names are requested on the actual survey instrument, so your responses are anonymous and will be treated with strict confidence. There are no right or wrong answers, however, your honest responses will ensure that teachers in your district have accurate and unbiased input into the management and performance review process. Your completed survey should be mailed in the enclosed self-addressed, stamped envelope no later than November 14, 1997. Please circle the answer that best describes how you feel about the survey question asked. Provide a brief response to questions that require a narrative answer.
1. What grade level(s) do you teach this year (circle all that apply)?
Pre-Kindergarten Kindergarten
First Grade Second Grade

Third Grade Fourth Grade
Fifth Grade Sixth Grade
Seventh Grade Eighth Grade
Ninth Grade Tenth Grade
Eleventh Grade Twelfth Grade
2. What type(s) of program(s) do you teach? Is it...(circle all that apply)
Regular Education
Bilingual/English Education
Career and Technology Education
Compensatory Education
Exceptional Education
Gifted and Talented Education
Everything
Other
3. How many years have you been with YISD in total, including this school year?
1 - 5 6 - 10 11 -15 16 - 20 21 - 25 25+
Please use the grades A, B, C, D, or F to indicate how well you think each group performs their jobs, with A being excellent and F being failing.
4. What grade would you give the YISD school board members' knowledge of the educational needs of students in YISD? Would you give the board an A, B, C, D, or F?
A B C D F
5. What grade would you assign to your principal as the instructional leader of your school?
A B C D F

6. What grade would you assign to your principal's work as the manager of the school staff and teachers?
A B C D F
7. What grade would you assign to the Superintendent as the instructional leader and administrative manager of the district?
A B C D F
The next few questions deal with YISD relations with the community.
8. Using the grading system from above, what grade would you assign to parents' efforts in assisting with the education and learning process?
A B C D F
9. How would you rate district relationships with various groups in the community?
A B C D F
The next few questions deal with specific programs and policies at YISD.
10. How would you rate the degree to which the curriculum is fitted to the students at your school?
A B C D F
11. Please rate how close a fit there is between your district curriculum guides, the curriculum you actually teach in your classroom, and the curriculum you test, such as the TAAS test, with A being a very close fit and F being a very loose fit.
A B C D F
12. What grade would you assign to the assistance you receive in your classroom from the Instructional/Curriculum Department at YISD's central office?

A B C D F
13. How effective do you think site-based decision making has been implemented in YISD, with A being very effective and F being very ineffective?
A B C D F
14. What grade do you give to the district's use of programs for bilingual students?
A B C D F
The next few questions deal with supplies and materials that you use in your teaching. Again, please use the grading system like you did above.
15. How would you grade the availability of the supplies, materials, equipment and textbooks you need to support instruction at YISD?
A B C D F
16. How would you grade the degree to which schools have the basic facilities (such as lab equipment and computers) to educate students within the current or projected curriculum and educational standards?
A B C D F
17. What grade would you give the requisition process in obtaining needed materials?
A B C D F
18. How many times do you have to follow-up with the principal or school clerk on ordering supplies you have requested before those supplies are received?
0 1 to 2 3 to 5 6 to 8 9 or More
19. Finally, what grade would you give to YISD overall in terms of obtaining the needed supplies and the methods used?

A B C D F
19a. How do you think this process could be improved?
The next few questions deal with the financial management of YISD.
20. How aware are you of what your school and YISD as a whole are spending or planning to spend to deliver education? Would you say you are...
Very Aware Somewhat Aware Not Very Aware Not at all Aware
21. What role do you play in developing budgets for your school?
22. Would you prefer greater involvement, less involvement, or is your involvement in this process at a level you like?
Greater Involvement Less Involvement At a Good Level
23. Now, using the grading system used before, what grade would you give to the quality of work in the payroll department?
A B C D F
The next questions deal with teacher relationships with administrators and students.
24. On average, how many times per month is the principal or assistant principal present in your classroom? Count visits of any length of time.
0 1 to 2 3 to 4 5 or More
25. What do you think is the ideal number of classroom visits for the principal or assistant principal to make in a month in order to give you constructive feedback on your teaching?

0 1 to 2 3 to 4 5 or More
The next few questions deal with the staff development program used in your school.
26. Do you strongly agree, agree, have no opinion, disagree, or strongly disagree that the staff development program used in your school has improved your classroom teaching and management?
Strongly Agree Agree No Opinion Disagree Strongly Disagree
27. What is the most important strength, if any, of the staff development program used in your school?
28. What is the most important weakness, if any, of the staff development program used in your school?
29. Finally, how well do you work with the other teachers and administrators at your school? Please circle the response that best describes how you feel.
Very well as a team
Somewhat well as a team
About average as a team compared with other work groups
Not very well as a team
Not at all well as a team
30. Which of the following do you feel is your most important source of feedback in improving your teaching? Is it from...
Students Administrators Other teachers Parents All of the above

31. And on average, how often do you receive feedback from this source in a week? Is it...
Less than once per week
Once per week
Every other day Everyday Several times per
day
32. Do you strongly agree, agree, have no opinion, disagree, or strongly disagree that the teacher evaluation program used in your school has improved your classroom teaching and management?
Strongly Agree Agree No Opinion Disagree Strongly Disagree
33. What is the most important strength of the teacher evaluation program used in your school?
34. What is the most important weakness of the teacher evaluation program used in your school?
35. What do you consider to be the most important factor outside of your control that negatively affects your ability to deliver effective teaching?
The next few questions involve the use of computers and other technology at your school.
36. Using the grading system, how would you rate the use of technology, including hardware, software, communications, and support, in your school?
A B C D F
37. What grade would you give to the integration of the use of computers with the

regular education curriculum?
A B C D F
The next few questions discuss the use and management of YISD facilities.
38. Using the same grading system, please grade the safety of your work facilities.
A B C D F
39. How do you think the safety of the facilities can be improved?
40. Please grade the schools with regard to their cleanliness and maintenance.
A B C D F
41. What grade would you give your school in terms of being overcrowded or underused?
A B C D F
42. Please grade the extent to which the facilities encourage a learning environment.
A B C D F
43. In what one or two ways do you think that the operational efficiency of YISD could be improved?
Demographic Information
D1. Please provide your ethnicity.

Anglo African American Hispanic Asian Other
D2. Do you have any children enrolled in YISD schools?
Yes No
D3. Please provide your gender.
Male Female
Thank you very much for your cooperation.
Ysleta Independent School District Management And Performance Review
Student Survey Questionnaire (Written/Self-Administered)
Population
n=773
Introduction Please select the best response to the question asked. Read each question carefully before answering.
BACKGROUND
Please place an "X" in the appropriate box.
(D1.) Please indicate your sex.
Female Male
(D2.) What is your classification?
Junior Senior

(D3.) What is your ethnic background?
African American Hispanic
Anglo Other
THE FOLLOWING STATEMENTS INDICATE MY GENERAL FEELINGS. Please indicate how you would grade your school on a scale of A through F. Please circle your response.
1. How would you grade your school for the quality of education you are receiving? A B C D F
2. How would you grade your teachers overall? A B C D F
Please indicate your feelings by placing an "X" in the appropriate box.
3. How safe do you feel in your school? Very Safe
Fairly Safe
Very Unsafe DK
4. How often do principals visit your classroom?
Very Often
Fairly Often
Once in a While
Never
5. How often do assistant principals visit your classroom?
Very Often
Fairly Often
Once in a While Never
6. How often do principals attend school activities?
Very Often
Fairly Often
Once in a While Never
7. How often do assistant principals attend school activities?
Very Often
Fairly Often
Once in a While Never
Using the following legend, please indicate whether you strongly agree (SA), agree (A), neither agree nor disagree (N), disagree (D), strongly disagree (SD) or don't know (DK).
8. Do you agree that learning is the school's most important goal?
SA A N D SD DK
9. Does your school offer a broad selection of challenging courses?
SA A N D SD DK

10. Does the school's library have enough books and resources for you to use? SA A N D SD DK
11. Do you think that teachers expect students to do their very best work? SA A N D SD DK
12. Do teachers explain materials and assignments to you so that you can understand them clearly? SA A N D SD DK
13. Do you feel that teachers care about students' needs? SA A N D SD DK
14. Do teachers give you individual attention? SA A N D SD DK
15. Do teachers praise you when you are doing well in your school work?
SA A N D SD DK
16. Do you think the school principal cares about students' needs? SA A N D SD DK
17. Do principals treat students with respect? SA A N D SD DK
18. Do assistant principals treat students with respect? SA A N D SD DK
19. Does the principal praise students for earning good grades? SA A N D SD DK
20. Are you and your fellow students proud of your school? SA A N D SD DK
21. Do you think that most students try to do their best in class? SA A N D SD DK
22. Do you think that misbehavior interferes with classroom learning? SA A N D SD DK
23. Do you have sufficient books, lab supplies and classroom materials?
SA A N D SD DK
24. Computers are available at my school whenever I need to use them.
SA A N D SD DK
25. There is good computer instruction at my school. SA A N D SD DK
26. Adequate career and college counseling opportunities are provided by counselors at my school.
SA A N D SD DK
27. There are enough bilingual teachers at my school. SA A N D SD DK
28. The bilingual programs are adequate at my school. SA A N D SD DK
29. There are good food options in the cafeteria at my school. SA A N D SD DK
30. The school bus service at my school is adequate. SA A N D SD DK

31. What do you think is the main reason that some students dropout of school at your campus?
32. What can be done to ensure that students stay in school? For example, would some type of program or counseling help?
33. What do you think needs to be done to ensure that students attend school more regularly?
34. Why do you think some students perform poorly on the TAAS test?
35. What would help improve students' scores on the TAAS exam?
36. What are your plans once you graduate from high school?
Go to college
Get a job
Join the military
Other Total
37. How has school prepared you to pursue your plans after graduation?
38. Name three things you like best about your school. (You may refer to the list below to help determine your answer).

39. Name three things you like least about your school. (You may refer to the list below to help determine your answer).
40. Based on what you know about this school, tell us one or two things you believe can be improved. (You may refer to the list below to help determine your answer).
Possible responses for questions 38 through 40
Administration/Principal Classes/Academics Counselors Facility/Location Open Campus Organization People
Pride/School spirit School Activities Security Sports Teachers Vocational/Work programs

Appendix C Public Input Results
Public Input Results (Telephone Interview)
Population
n=600
Survey Question Survey Response
Excellent Good Fair Poor Total
1. The quality of public education at YISD schools as...
20% 52% 22% 6% 100%
Improved Stayed the Same
Gotten Worse
Total
2. Over the past three years, the quality of education in the YISD has...
53% 39% 8% 100%
Students are often given the grades of A, B, C, D and F to denote their performance in the classroom. Using these same grades, for the next set of questions, rate the performance of the following individuals or groups associated with the Ysleta Independent School District.
A B C D F Total
4.
What grade would you give the YISD school board members' knowledge of the educational needs of students within YISD?
15% 37% 33% 10% 5% 100%
5. How would you rate the performance of the current board?
14% 38% 30% 12% 6% 100%
6. How would you rate the overall performance of Superintendent Anthony Trujillo?
17% 35% 22% 13% 13% 100%
7. What grade would you give the overall performance of top
15% 42% 31% 8% 4% 100%

administrators below the superintendent?
Yes No Total
8. Do you have school aged children in your home?
61% 39% 100%
YISD Private Both Other Total
8a. Are your children enrolled in YISD or private schools?
94% 4% 0% 2% 100%
Yes No Total
8b. Are your children enrolled in YISD elementary school?
66% 34% 100%
8c. Are your children enrolled in YISD middle school?
28% 72% 100%
8d. Are your children enrolled in YISD high school?
48% 52% 100%
Excellent Good Fair Poor Total
8e.
How would you rate the quality of education your child receives through a YISD elementary school?
38% 47% 12% 3% 100%
8f.
How would you rate the quality of education your child receives through a YISD middle school?
23% 52% 18% 7% 100%
8g. How would you rate the quality of education your child
23% 52% 19% 6% 100%

receives through a YISD high school?
A lot A little Nothing Total
9. Your knowledge of YISD programs and services...
33% 61% 6% 100%
Based on what you know or have heard, please answer if you strongly agree, agree, have no opinion, disagree, strongly disagree or don't know with the following series of statements about the public schools in the Ysleta Independent School District.
SA A NO D SD Total
10. Schools in YISD are safe and secure...
5% 56% 11% 26% 2% 100%
SA A NO D SD Total
11. YISD elementary schools effectively handle problems of misbehavior...
8% 56% 17% 17% 2% 100%
12. YISD secondary schools effectively handle problems of misbehavior...
5% 49% 17% 23% 6% 100%
13. Schools in YISD have sufficient space and facilities to support the instructional programs..
7% 55% 9% 23% 6% 100%
14. YISD school building are in good condition... 9% 66% 5% 17% 3% 100%
15. YISD school buildings are clean and well maintained...
10% 72% 6% 11% 1% 100%
16. Schools in YISD are good places to learn... 12% 72% 5% 10% 1% 100%

17. Schools in the district have materials and supplies necessary for instruction in basic skills programs...
8% 65% 9% 16% 2% 100%
18. YISD teachers care about students' needs... 19% 62% 9% 9% 1% 100%
19. YISD parents are given opportunities to play an active role in public schools...
17% 69% 6% 7% 1% 100%
20. YISD parents feel welcome when they visit a school...
15% 72% 7% 6% 0% 100%
21. YISD parents participate in school activities and organizations...
8% 63% 11% 16% 2% 100%
22. Community members take an active part in the education of children at YISD...
8% 59% 13% 18% 2% 100%
23. Community members feel welcome to express their views when they attend YISD school board meetings...
8% 58% 18% 13% 3% 100%
SA A NO D SD Total
24. The superintendent and staff work to involve the community in school activities...
7% 57% 15% 18% 3% 100%
25. The school principals work to involve the community in campus activities...
9% 64% 13% 13% 1% 100%
26. YISD administration does a lot to promote good public relations between the district and the community...
8% 57% 12% 20% 3% 100%

27. Communications are good between YISD district administration and the community...
5% 51% 14% 26% 4% 100%
28. The community is proud of the public school education in YISD...
7% 63% 14% 15% 1% 100%
29.
YISD places to much emphasis on passing the TAAS, and not enough emphasis on providing students with a well-rounded education...
29% 45% 11% 14% 1% 100%
30. YISD graduates are prepared to go on to college or directly into the work force when they graduate...
7% 54% 13% 23% 3% 100%
31. The local business community in El Paso does a lot to support YISD programs...
9% 57% 19% 15% 0% 100%
32. YISD does a good job of meeting the educational needs of a disadvantaged student population..
8% 62% 16% 12% 2% 100%
Now, let's rate YISD's bilingual education and limited English proficiency programs.
Excellent Good Fair Poor Total
33.
How well would you say YISD's bilingual education and limited English proficiency programs prepare students to perform in school...
15% 49% 25% 11% 100%
34. YISD's magnet school programs such as fine arts, health professions, and languages are...
22% 52% 22% 4% 100%
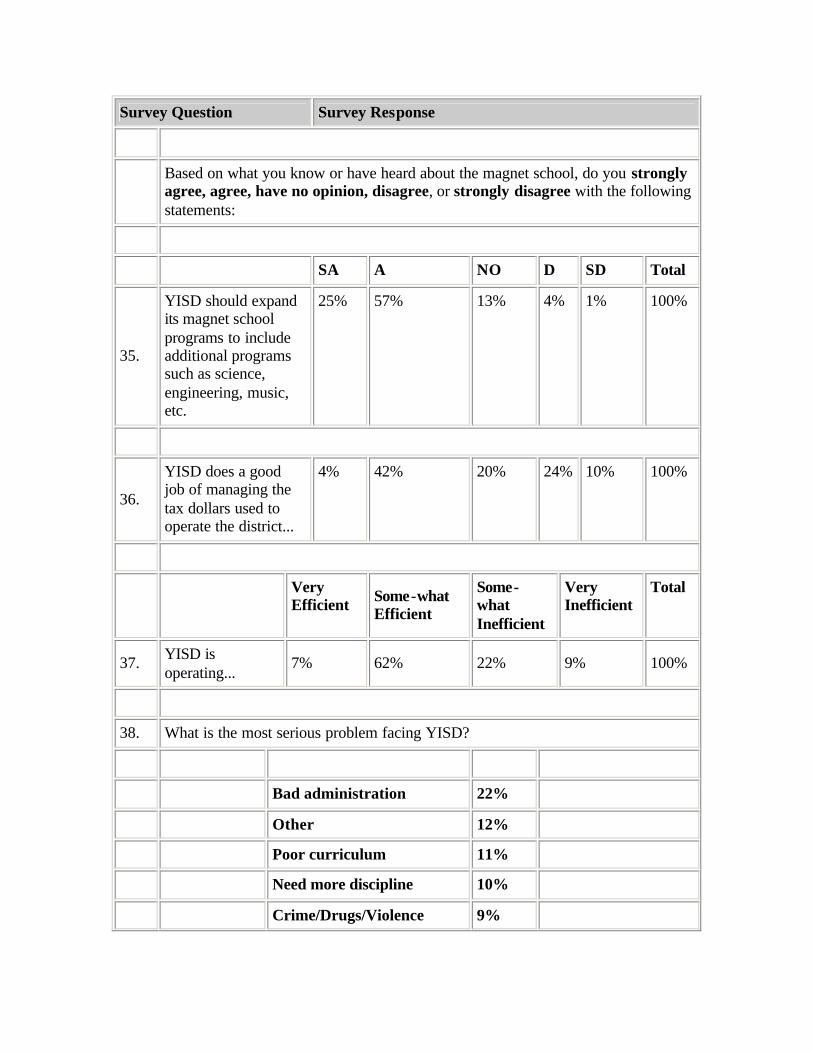
Survey Question Survey Response
Based on what you know or have heard about the magnet school, do you strongly agree, agree, have no opinion, disagree, or strongly disagree with the following statements:
SA A NO D SD Total
35.
YISD should expand its magnet school programs to include additional programs such as science, engineering, music, etc.
25% 57% 13% 4% 1% 100%
36.
YISD does a good job of managing the tax dollars used to operate the district...
4% 42% 20% 24% 10% 100%
Very Efficient Some-what
Efficient
Some-what Inefficient
Very Inefficient
Total
37. YISD is operating...
7% 62% 22% 9% 100%
38. What is the most serious problem facing YISD?
Bad administration 22%
Other 12%
Poor curriculum 11%
Need more discipline 10%
Crime/Drugs/Violence 9%

Over-emphasis on TAAS 8%
Funding 7%
Gangs 6%
Building maintenance 6%
Nothing 4%
Better/More teachers 4%
No response 1%
Total 100%
Demographics
To complete our survey, we need to ask a few questions about you and your household.
D1. How long have you lived in Ysleta?
D2. What is your highest level of formal education completed?

D3. Are you...
Demographics
D4. Are you currently...

D5. Is your spouse currently...
D6. Do you...
Demographics

D7. What is your zip code?
D8. In what group does your age fall?
Demographics
D9. Finally, for statistical purposes only, which of the following ranges describes your household income for last year (1996)?

D10. Ethnicity...
D11. Gender...
Demographics

D12. Language...
LEGEND
NR = No Response
RF = Refused
SA = Strongly Agree
A = Agree
D = Disagree
SD = Strongly Disagree
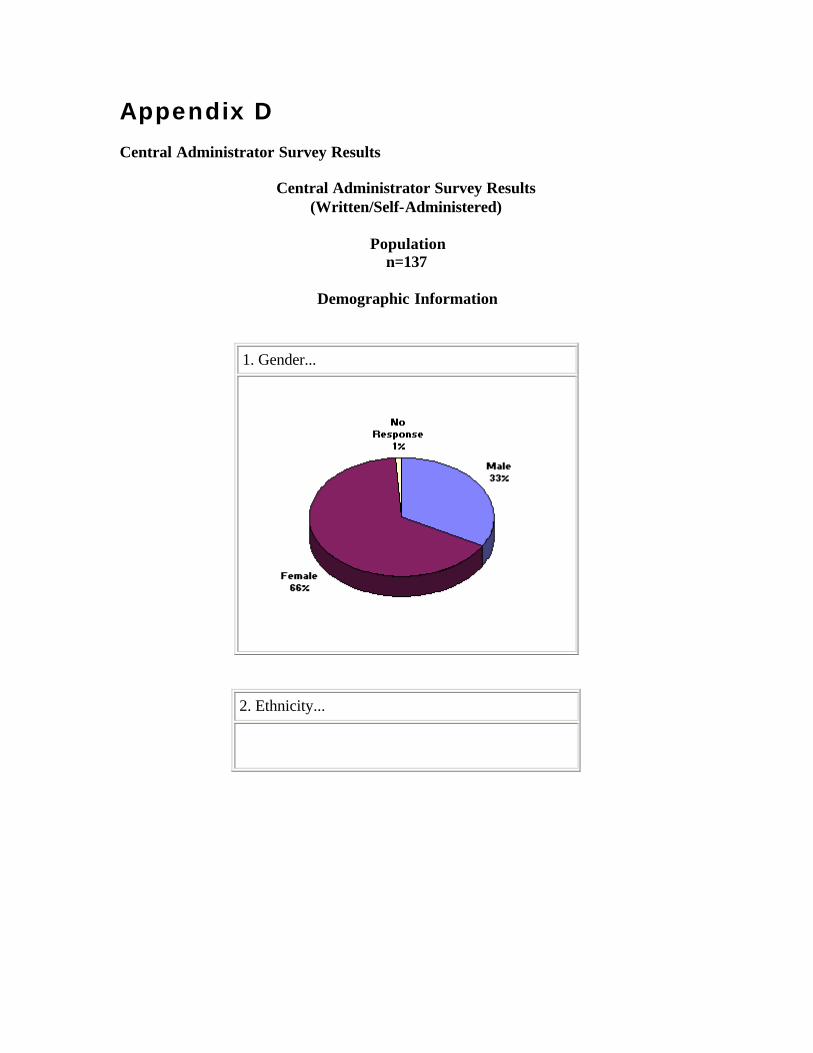
Appendix D Central Administrator Survey Results
Central Administrator Survey Results (Written/Self-Administered)
Population
n=137
Demographic Information
1. Gender...
2. Ethnicity...
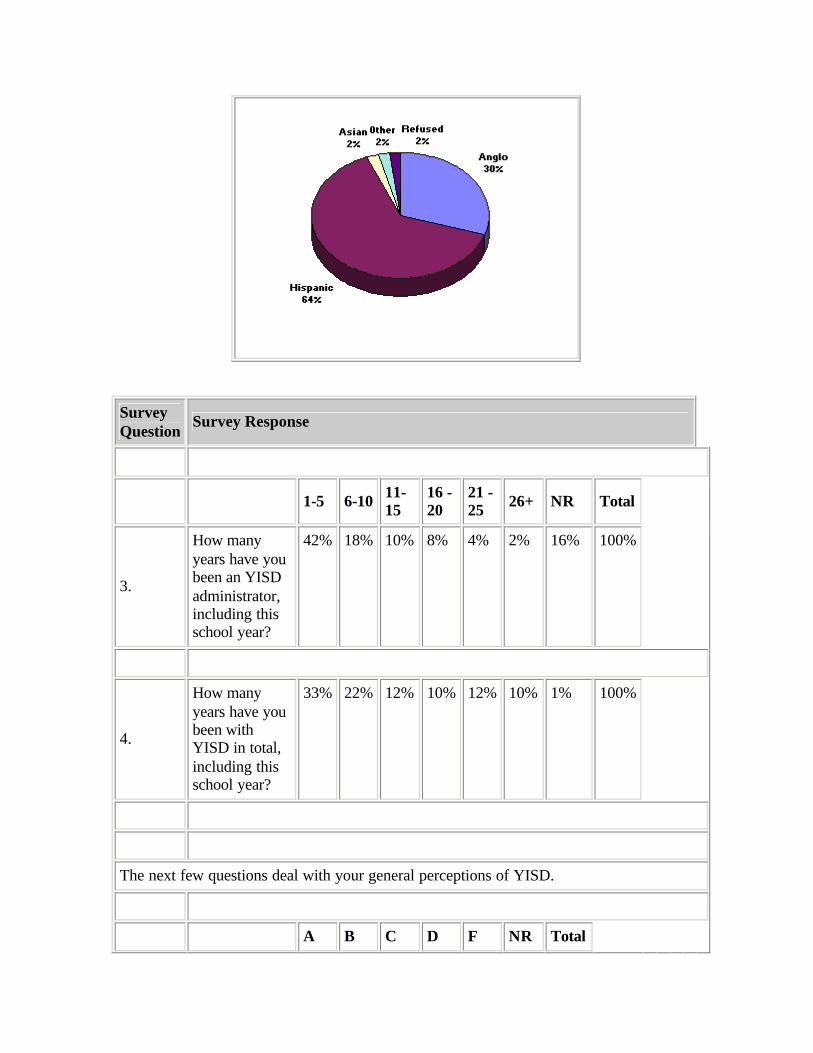
Survey Question
Survey Response
1-5 6-10 11-15
16 - 20
21 - 25 26+ NR Total
3.
How many years have you been an YISD administrator, including this school year?
42% 18% 10% 8% 4% 2% 16% 100%
4.
How many years have you been with YISD in total, including this school year?
33% 22% 12% 10% 12% 10% 1% 100%
The next few questions deal with your general perceptions of YISD.
A B C D F NR Total

5.
What grade would you give the YISD school board members' knowledge of the educational needs of students in YISD?
4% 26% 38% 21% 10% 1% 100%
6.
What grade would you give superintendent, Anthony Trujillo, in his role as the instructional leader of YISD?
38% 35% 14% 9% 3% 1% 100%
7.
What grade would you give superintendent, Anthony Trujillo, in his role as the chief administrator of YISD?
39% 24% 17% 13% 6% 1% 100%
8.
What grade would you give to the extent to which central administrative staff is supportive and actively
16% 44% 31% 5% 2% 2% 100%

involved on YISD campuses?
9.
What grade would you assign to YISD teachers' attitudes about their jobs?
9% 49% 29% 7% 0% 6% 100%
The next two questions deal with specific programs and policies at YISD.
A B C D F NR Total
10.
Using the grading system, how effective do you think site-based decision management has been implemented in YISD?
15% 45% 29% 8% 2% 1% 100%
11.
What grade do you give to the district's use of programs for bilingual students?
22% 37% 24% 9% 2% 6% 100%

The next few questions deal with the financial management of YISD.
A B C D F NR Total
12.
What grade would you assign to the efficiency of the budgeting process?
10% 46% 23% 16% 2% 3% 100%
None or Very Little
I make my own program
Relay my needs to others
Other NR Total
13.
What role do you have in determining how funds are spent in the YISD district?
45% 16% 31% 7% 1% 100%
None or Minor
Direct Role in Budget
Collab- orative Role
Other NR Total
14.
What role do you play in developing budgets?
55% 15% 26% 2% 2% 100%
A B C D F NR Total
15.
Using the grading system above, please grade your level of satisfaction
17% 36% 24% 9% 9% 5% 100%

with the input you have in determining spending priorities for your administrative function.
16.
Please grade your level of satisfaction with the input you have in developing budgets for your administrative area.
15% 34% 21% 11% 9% 10% 100%
A B C D F NR Total
17.
What grade would you assign to the accuracy, consistency and timeliness of information you receive from the Accounting and Finance departments?
8% 33% 27% 19% 8% 5% 100%
18. What suggestions do you have for improving the efficiency and effectiveness of financial management at YISD?
· We need to focus more on spending our money on students. For example, supplies, computers and giving them a well balanced meal daily. · We need better communication with Purchasing Department. · Respectful attitude and professionalism from all and to all in every day dealings. · J. D. Edwards does not work and will never work. It needs to be replaced. Purchasing agent does not need to approve most purchase orders. If you have budget and bid item numbers, then they should be able to issue purchase orders. This would save all kinds of time.

· Streamline the purchasing process and/or procedures to help campuses get needed supplies and materials on a timely basis. · Site-based management implies administrators who might not come from a budget background being placed in difficult situations by financial people who often come from an agenda that is frustrated by administrator's confusions. Communication is poor, weak, non-existent and sometimes rude. · Business office should be more customer driven. · More communication with bids and proper paperwork to be submitted to accounting. If we knew who had certain bids, there would be less back and forth communication. · I am satisfied with the way the YISD is maintaining the budget and have no suggestions at this time. · Stop passing the buck. Give us an answer ASAP and stop giving us the round ground. Why should we apologize for something we were not aware of? Why aren't we given information on how to follow the process? · Reduce amount of paperwork required to process all financial matters (ie. Payroll, purchasing, etc.). · Give decision makers in department positions more say and remove some centralized control over funds. Place money in funds for actual use. · Each department needs a true financial administrator, not a converted teacher or principal. The next few questions are about the overall organization and management at YISD.
A B C D F NR Total
19.
What grade would you assign to YISD in terms of being organized in a manner that facilitates performance and does not duplicate work efforts?
4% 42% 41% 9% 3% 1% 100%
20.
What grade would you assign to your level of satisfaction with the authority you have to effectively carry out your administrative responsibilities?
20% 40% 22% 6% 6% 6% 100%
21. What grade would you give communications (both internal and external) at YISD?
7% 28% 39% 17% 6% 3% 100%
22. What grade would you give to how involved community organizations (such as downtown business community
7% 31% 36% 17% 2% 7% 100%

and various civic leaders) have been in affecting the direction of YISD?
23. Overall, what grade do you assign to YISD's current organizational and management structure?
6% 45% 34% 10% 4% 1% 100%
24. What would you recommend to improve YISD's organizational and management structure?
· Departments tend to be very territorial here. Although intradepartmental structures are collaborative, they tend to be competitive. Aren't we working towards the same goal? · We need to take some power away from the administrators. The power is used to their own personal advantage, not for our students. We pay our taxes to make our schools better. · More customer service attitude at central office. · Remove politics and do not create positions without a need. · Site-based management has taken its toll with principals assuming they can make their own rules without parent consent. They shouldn't be given 100% authority to run the school as "they" wish. Parents should still be considered and their opinions taken into consideration. · Staff development and support teams should be combined. · More clerical positions could be a better financial venture, rather than so many administrators doing those clerical tasks. Administrators should be spending the majority of their time at the campus rather than on clerical work. · The "good old boy" syndrome needs to be done away with. · I recommend enhancing the communication structure among administrators, faculty and students. · Commit to have more meetings with staff concerning efforts of YISD and expectations administrators have of the staff they are directly involved with. · Job descriptions often tailored to meet he qualifications of the individual they want to hire. · Involve teachers in decisions that involve them. Teachers face the biggest challenges and they need to be heard through a well defined and understood system.
The next few questions are about the personnel management function and some of the employee benefits at YISD.
A B C D F NR Total
25. How efficient is the current job posting 12% 41% 26% 13% 5% 3% 100%

and hiring process when it comes to meeting the district's staffing needs?
26.
What grade would you assign to the efficiency of YISD's follow-up processes concerning issues such as dismissal, discipline and communication?
4% 35% 31% 19% 5% 6% 100%
27.
What grade would you assign to how well current procedures identify staff training needs, develop materials and deliver programs which meet training needs?
7% 31% 36% 20% 5% 1% 100%
28.
What grade would you assign to the effectiveness of current processes for personnel evaluation and assessment of success?
4% 36% 38% 10% 8% 4% 100%
29. What grade would you give to YISD employee's job satisfaction and morale or motivation to work?
5% 34% 37% 18% 5% 1% 100%
30.
What grade would you assign to the effectiveness of YISD's current personnel management policies and procedures?
4% 41% 37% 13% 2% 3% 100%
31. What grade would you assign to YISD's health insurance plan?
33% 45% 16% 4% 0% 2% 100%
The next two questions are about YISD's management information system function and instructional technology.
A B C D F NR Total
32. How would you rate the effectiveness of YISD's current technology to support your administrative functions?
7% 38% 31% 18% 3% 3% 100%
A B C D F NR Total
33. What grade do you give to how well current technology supports instruction at YISD?
8% 39% 30% 15% 4% 4% 100%

The next few questions are about the overall efficiency and effectiveness of YISD. 34. What comments do you have regarding the overall efficiency and effectiveness of YISD?
· I feel that we're doing much better when compared to other districts. On the other hand, there is always room for improvement and we still have a way to go. · I think overall the YISD far exceeds any district in this county, if not the state. Our results speak for themselves. · Some departments are doing well. Others, such as payroll, construction and budget, could use some help. · Campuses are allowed under site-based decision-making to be creative and innovative. Many have experienced recognition as a result of this flexibility. · Have superintendent stop having a plan that rewards old friends and big shots and think about what will impact students. · The payroll department needs improvement on both these as they provide paychecks to employees. This area has been very ineffective since they don't take concern for employees paid incorrectly, making you wait for your due pay. · There are real problems with communication. Those of us "out in the fields" don't understand their frustrations and the opposite is definitely true. It's as if teamwork and the concept of teamwork is non-existent. · Considering the size of the district. Ysleta does remarkably well in effectiveness of staff. Ysleta is to be commended for their TAAS Scores. · Central data processing is slow and ineffective, personnel issues are also too slow and cumbersome. · There is no combined effort to move ahead. Every department has their own agenda. Even the teams are not unified in their efforts. It is almost as if we have two separate districts within one. · The vision of our superintendent has been proven to be doable, its the administrators under him that have to believe and be on the same track. · Overall, I am pleased with the effectiveness and efficiency of other departments. On occasion, a snag is ran into, but it is usually remedied quickly. · Political game-playing wastes time and resources. Good emphasis on cost effective programs. · Overall, I feel YISD is doing a fair job in all areas considering some areas are understaffed and the morale is low.

35. Can you recommend any cost savings or other efficiencies to improve the efficiency and effectiveness of the functional areas under review?
· Department of Bilingual Education has to jump on board to help (actively help) campuses in the improvement of TAAS scores, but more importantly with high quality bilingual programs. · Get rid of some of the administrators at central that do very little. · Spend far less on extracurricular and more on basic education. · Identify areas of financial need rather than making "spur of the moment" decisions. · More positive, effective communication should be prioritized. · Networking computer system to improve efficiency between areas that work together. · Can there be a computer flow? Before instigating any changes, let everyone have some input. If you want people to buy into changes, they have to be part of the process. · Opening the lines of communication within departments will eliminate duplication of work. · Automation of what we do centrally is vital. Too much time and effort used on forms and travel of forms. · When disposing of furniture, it should be checked thoroughly to identify which should be salvaged or reusable. · Allow campuses/departments to handle their own purchasing rather than going through a central office department. · Reduction in certain forms not required that may lead to duplication of the same object that is needed to be obtained. · Lower the superintendent's salary and reduce the upper salaries. · Get rid of JD Edwards. It is costing too much money. · Get a different computer system and this time LISTEN to the people who do the evaluations of the different systems. · Terminate ineffective personnel. · Networking will improve efficiency. · Limit ALL travel to $100,000 per year for the whole district. If the "absolutely super" conferences, seminar, etc. were held in Dell City rather than Atlanta, Vegas, San Francisco, etc. we would get a far truer picture of our real travel needs. · Have principals explain why they need technology and what specifically they plan to do with it, before any more money is spent on instructional technology.
36. What other concerns or general comments would you like to share with us about concerns we have not asked about or areas we need to explore as we conduct the review?
· The overall morale of YISD employees is low and needs to be addressed. More employee oriented programs need to be implemented.

· We have gone a little overboard with site-based decision-making. At some point, central office needs to bite the bullet and mandate certain practices. We need to have the "Big Picture" and communicate that to campuses with certain expectations. Too much is left up to the campus where weaker instructional leaders are floundering with no focus for their campus. · Standardized policies that will remain after current administration changes. · Look into superintendent relationship to "wireless classrooms" management. · New construction is much more elaborate than needed and does not meet function. · Many times there are situations that put various departments against each other for many reasons. To an extent, a cohesive feeling of cooperation does not exist. · Review should include the "consistency" on pay rates for Paraprofessional and Ancillary areas. There is only one person who knows how "pay for previous experience" is determined and there is much inconsistency on these rate determinations. (ex. Clerk II, 183 days with 3 yrs. exp. can have a different salary than another one with same level, same days, same experience.) There is no SET TABLE. This is one area that definitely needs review. · I feel a general frustration whenever I have to contact central office or I get a call from them (it's always negative). · Please review the hiring and evaluation process to avoid the buddy system. · I feel that having a superintendent that is a visionary such as Mr. Trujillo has really helped to put YISD on the map. The organization and efficiencies do need to be reviewed and improved, but that is minimal when other issues are so positive. · I don't see the need to have a Media Relations department and Public Outreach department separate. They should be combined as they were in the past. · Why do we have JD Edwards. · Morale of staff and teachers is the best I've seen in a long time. Support to the schools in term of data processing, maintenance and construction. · The hiring process is deliberate discrimination on experienced personnel. Qualified, talented individuals are hired at lower salaries, than ones who have three to five years of experience. They say they want the best administrators for the job, but many times the best individuals are passed on because it would cost to much to hire them. So hire green and cheap seems to be going on that particular department. They call it a "career choice" to lose income for experience. · YISD staff is not well informed of the expectations the

administrators need to have on a daily basis. Recommendations and expectations could improve the manner in which they are served. · The district needs to learn to promote from within and stop bringing in people who have to be trained by the very people who aren't promoted. · I think administrators need to tell us more about what's going on. Sometimes the rumor mill is the only way we hear about what's gong on, especially how things impact our jobs and our department. · Communicate what's going on in the district to all levels of employees. Presently, we find out what's happening from the media or the public, not from within the district. · More clerical classifications. Once you become a Secretary III or Clerk III, you can't move up any higher without becoming an administrator. · Associate superintendent for Human Resources treats staff in a demeaning, intimidating and unkindly manner causing low morale and job dissatisfaction. Should be sent to charm school. · The TAAS test is becoming the focus of instruction. It may be an effective measurement tool, but it is NOT the sum total of what an education is. · Consultants should be limited to a maximum of $50,000 per year, and a maximum of two years. If their services are needed more than that, hire them. · Eliminate year-round schools.
NR = No Response

Appendix E Principal and Assistant Principal Survey Results
Principal and Assistant Principal Survey (Written/Self-Administered)
Population
n=85
Demographic Information 1. Gender...
2. How long have you been employed by Ysleta ISD?
Ethnicity...

Grades taught in your school...
5. (Optional) Name of your school...
· Eastwood High School · Riverside High School
· Loma Terrace Elementary · Eastwood Knolls
· Del Valle High · Ysleta Middle School
· Rio Bravo Middle · Cesar Chavez Academy
· Mission Valley · Glen Cove Elementary
· Chacon · Desert View Middle School
· Scotsdale · Pebble Hill Elementary

· LeBarron · Hacienda Heights
· Hanks · Ysleta High
· Tierra Del Sol · Thomas Manor
Survey Question Survey Response
For the following set of questions please use the grades A, B, C, D, or F to indicate how well Ysleta ISD performs.
A B C D F NR Total
6. In general, what grade would you give the Ysleta ISD board of trustees...
1% 14% 42% 28% 12% 3% 100%
7. What grade would you give the superintendent of Ysleta ISD... 47% 39% 7% 5% 1% 1% 100%
8. In general, what grade would you give the other district- level administration in Ysleta ISD...
14% 46% 32% 6% 0% 2% 100%
9. In general, what grade would you give the other campus- level administration in Ysleta ISD...
38% 51% 7% 2% 0% 2% 100%
10. In general, what grade would you give the teachers in Ysleta ISD... 35% 54% 6% 0% 0% 5% 100%
Now on a scale of 1 thru 5, with 1 meaning Strongly Agree and 5 meaning you Strongly Disagree, please indicate how you feel about each of the following. Remember a 1 is a strong agreement and 5 is a strong disagreement with a 3 being neither agreeing nor disagreeing.
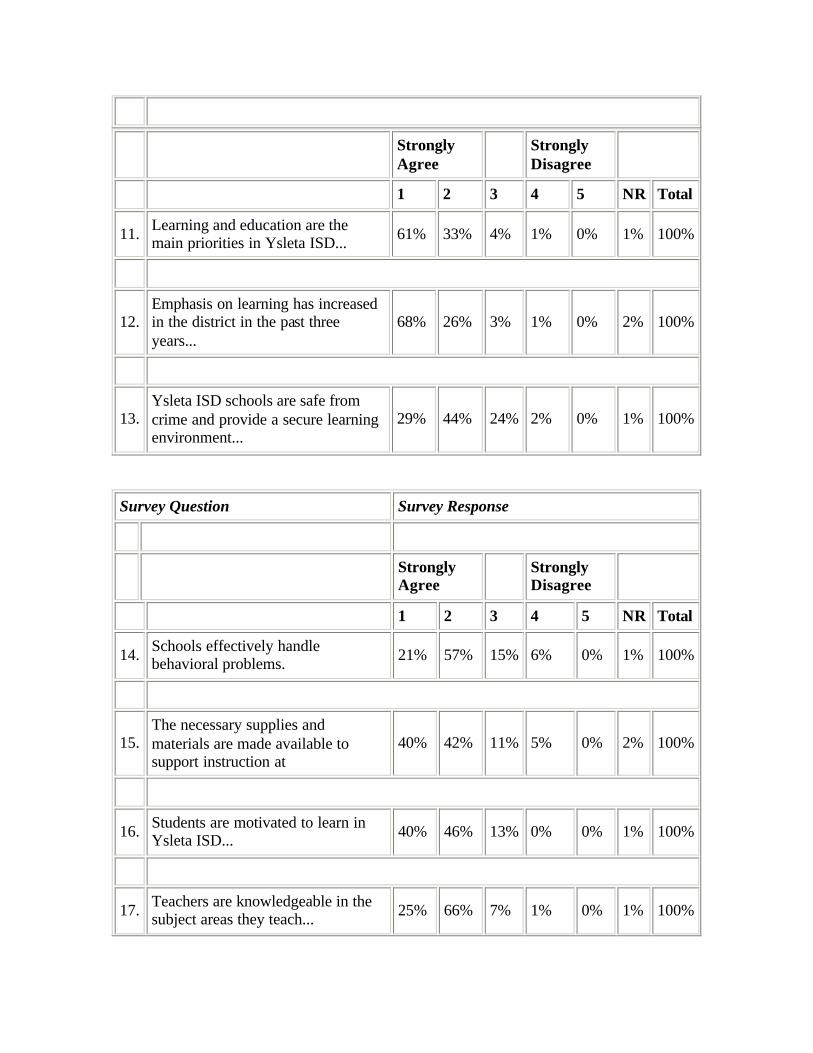
Strongly Agree
Strongly Disagree
1 2 3 4 5 NR Total
11. Learning and education are the main priorities in Ysleta ISD... 61% 33% 4% 1% 0% 1% 100%
12. Emphasis on learning has increased in the district in the past three years...
68% 26% 3% 1% 0% 2% 100%
13. Ysleta ISD schools are safe from crime and provide a secure learning environment...
29% 44% 24% 2% 0% 1% 100%
Survey Question Survey Response
Strongly Agree Strongly
Disagree
1 2 3 4 5 NR Total
14. Schools effectively handle behavioral problems. 21% 57% 15% 6% 0% 1% 100%
15. The necessary supplies and materials are made available to support instruction at
40% 42% 11% 5% 0% 2% 100%
16. Students are motivated to learn in Ysleta ISD... 40% 46% 13% 0% 0% 1% 100%
17. Teachers are knowledgeable in the subject areas they teach... 25% 66% 7% 1% 0% 1% 100%

18. Teachers care about the educational needs of the students in Ysleta ISD...
34% 61% 4% 0% 0% 1% 100%
19. Principals/assistant principals actively work to meet students' needs...
52% 41% 6% 0% 0% 1% 100%
20. Parents, in general, take responsibility for their children's behavior in Ysleta ISD...
9% 42% 31% 13% 4% 1% 100%
21. Parents are satisfied with the education students receive in Ysleta ISD...
19% 59% 19% 1% 1% 1% 100%
22. District operations are cost effective and efficient... 11% 34% 27% 24% 3% 1% 100%
23. Site-base decision management is implemented effectively in Ysleta ISD...
29% 37% 18% 13% 2% 1% 100%
Survey Question Survey Response
Going back to the grading scale please tell me how you would rate the following using the A, B, C, D, and F grade.
A B C D F NR Total
24. The school boards' knowledge of the educational needs of students in Ysleta ISD...
2% 25% 45% 19% 6% 3% 100%

25. The school board members' ability to establish effective district policies...
2% 20% 48% 18% 8% 4% 100%
26. The superintendent's role as instructional leader of Ysleta ISD... 51% 37% 6% 5% 1% 0% 100%
27. The superintendent's role as chief administrator (manager) of Ysleta ISD... 57% 27% 9% 5% 1% 1% 100%
28. Principal's role as the instructional leader in Ysleta ISD schools... 55% 35% 6% 2% 0% 2% 100%
29. Principal's role as the manager of school staff and teachers in Ysleta ISD schools...
52% 39% 5% 4% 0% 0% 100%
30. Teachers attitudes about their jobs... 15% 62% 20% 2% 0% 1% 100%
31. Amount of classroom time dedicated to TAAS preparation... 27% 52% 15% 2% 0% 4% 100%
32. Amount of classroom time dedicated to basic educational requirement such as reading, math, science, history...
35% 49% 12% 3% 0% 1% 100%
Survey Question Survey Response
A B C D F NR Total
33. Parent's efforts in assisting with the education and learning process... 7% 34% 42% 14% 1% 2% 100%

34. Parents participation in school activities/ organizations. 8% 37% 39% 16% 0% 0% 100%
35. District relationships with various groups in the community...
18% 45% 31% 6% 0% 0% 100%
36. The effectiveness of district communications (internal and external)...
8% 42% 33% 14% 2% 1% 100%
37. District's use of technology as an instructional tool on your campus... 22% 51% 19% 7% 1% 0% 100%
38. District's use of technology for administrative purposes...
18% 57% 19% 5% 1% 0% 100%
39. District's use of programs for bilingual students...
13% 52% 26% 7% 2% 0% 100%
40. Conditions of Ysleta ISD facilities... 11% 60% 24% 5% 0% 0% 100%
For the next few questions please answer YES or NO.
Yes No NR Total
41. Does Ysleta ISD fill vacancies and make promotions in staff/administration positions based on individual qualifications?
67% 27% 6% 100%
42. Does an effective line of communication exist between your school and the central administration.
77% 19% 4% 100%
43. Do you have sufficient time for planning curriculum at 59% 37% 4% 100%

your campus?
44. In what one or two ways could the operational efficiency of Ysleta ISD be improved?
· Make purchasing department more supportive and helpful. Making purchases is incredibly difficult, especially for technology.
· Establish accountability for maintenance and grounds personnel.
· Do away with site-based management. It is not used effectively. Teachers have no say in anything.
· Reduce paperwork due to requests from each separate department.
· Improve building maintenance, ground maintenance, and facilitate purchasing through better procedures. Have responsive and visible MIS support.
· Allow principals to purchase items from vendors without so much red tape.
· Principals "professional" treatment of staff.
· Effective communication. Effective use of site -based decision-making.
· Allow schools to contract minor repairs (building).
· More flexibility in spending.
· More harmony and focus of school board.
· Schools should adopt year round calendar. Build in additional curriculum planning time to the year round calendar. Look at the school day for kindergarten, first and second grade.
· The maintenance department is extremely inefficient. Adequate central support for this vital service is totally inadequate.
· Less emphasis on just TAAS test and more emphasis on a balanced curriculum. Less political connection with board and superintendent.
· Improvement of budget process and attitudes. Improvement in the bilingual department and support services. Also, improvement in health services at the central offices.
· Computer training for administrators (ie. e-mail).
· Increase concept of additional TEAM assignments. Increase central office assistance to more curriculum development efforts (more qualified staff resources).

· Maintenance of plants could be improved considerably.
· As an assistant principal, access to student data through computer availability would enhance my performance.
· Ask for more input from all campuses. Listen to what is being asked from all and try to implement some type of plan. Better communication.
Survey Question Survey Response
Again, using the grading system, please grade the combined efficiency and effectiveness for each of the following district wide services of Ysleta ISD.
A B C D F NR Total
45a. Instructional services... 23% 53% 22% 0% 1% 1% 100%
45b. Maintenance services... 4% 15% 35% 26% 20% 0% 100%
45c. Custodial services... 18% 33% 35% 13% 0% 1% 100%
45d. Transportation services... 2% 35% 30% 27% 5% 1% 100%
45e. Personnel services... 35% 37% 19% 6% 3% 0% 100%
45f. Communications/community involvement... 17% 42% 33% 6% 1% 1% 100%
45g. Food services... 12% 41% 37% 7% 3% 0% 100%
45h. Financial services... 6% 37% 35% 17% 5% 0% 100%

45i. Staff development... 24% 49% 19% 4% 2% 2% 100%
45j. Management Information Services... 5% 29% 37% 15% 13% 1% 100%
45k. Purchasing 6% 22% 32% 25% 14% 1% 100%
45l. Planning and Budgeting... 12% 40% 33% 9% 5% 1% 100%
45m. Your overall grade for the operations of Ysleta ISD... 8% 46% 33% 5% 1% 7% 100%
NR = No Response RF = Refused
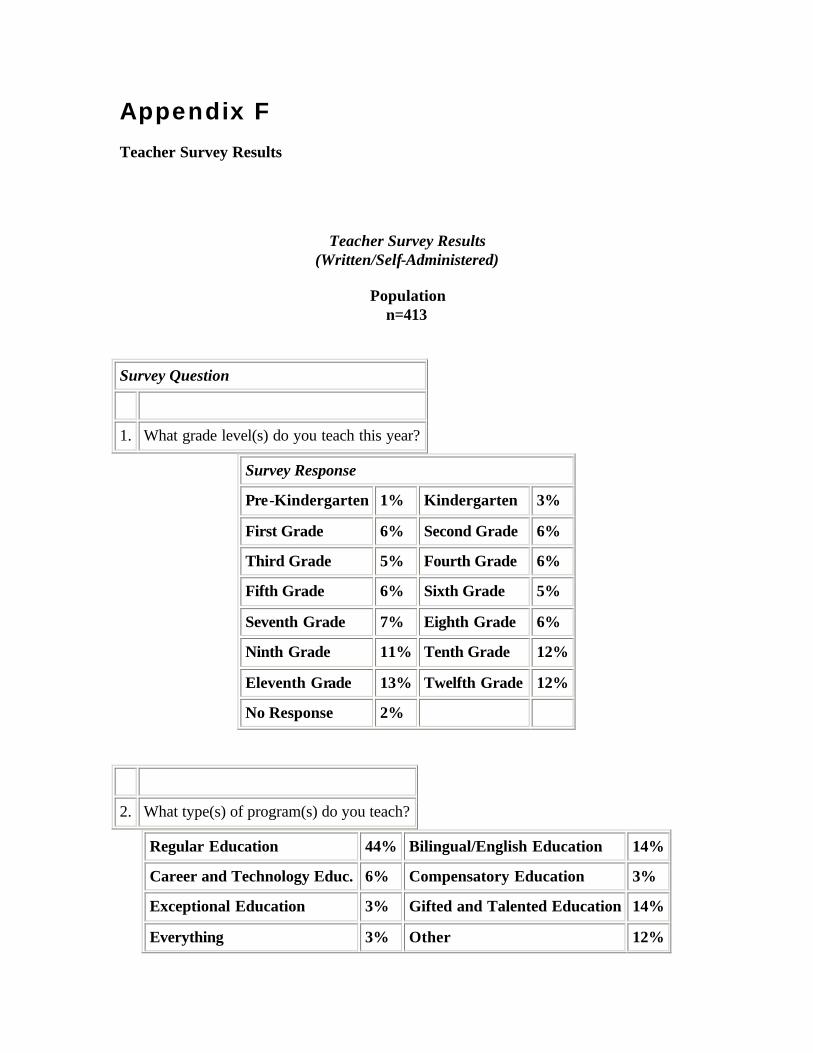
Appendix F Teacher Survey Results
Teacher Survey Results (Written/Self-Administered)
Population
n=413
Survey Question
1. What grade level(s) do you teach this year?
Survey Response
Pre-Kindergarten 1% Kindergarten 3%
First Grade 6% Second Grade 6%
Third Grade 5% Fourth Grade 6%
Fifth Grade 6% Sixth Grade 5%
Seventh Grade 7% Eighth Grade 6%
Ninth Grade 11% Tenth Grade 12%
Eleventh Grade 13% Twelfth Grade 12%
No Response 2%
2. What type(s) of program(s) do you teach?
Regular Education 44% Bilingual/English Education 14%
Career and Technology Educ. 6% Compensatory Education 3%
Exceptional Education 3% Gifted and Talented Education 14%
Everything 3% Other 12%

No Response 1%
1-5 6-10 11-15
16-20
21-25 25+ NR Total
3. How many years have you been with YISD in total, including this school year?
28% 23% 17% 15% 11% 6% 0% 100%
Survey Question Survey Response
Please use the grades A, B, C, D, or F to indicate how well you think each group performs their jobs, with A being excellent and F being failing.
A B C D F NR Total
4.
What grade would you give the YISD school board members' knowledge of the educational needs of students in YISD?
4% 22% 42% 24% 7% 1% 100%
5. What grade would you assign to your principal as the instructional leader of your school?
34% 27% 22% 10% 7% 0% 100%
6. What grade would you assign to your principal's work as the manager of the school staff and teachers?
30% 26% 19% 16% 9% 0% 100%
7.
What grade would you assign to the Superintendent as the instructional leader and administrative manager of the district?
10% 29% 27% 17% 16% 1% 100%

The next few questions deal with YISD relations with the community.
A B C D F NR Total
8. What grade would you assign to parents' efforts in assisting with the education and learning process?
3% 22% 47% 23% 5% 0% 100%
9. How would you rate district relationships with various groups in the community?
4% 40% 42% 10% 2% 2% 100%
The next few questions deal with specific programs and policies at YISD.
A B C D F NR Total
10. How would you rate the degree to which the curriculum is fitted to the students at your school?
17% 47% 26% 8% 2% 0% 100%
Survey Question Survey Response
A B C D F NR Total
11.
Rate how close a fit there is between your district curriculum guides, the curriculum you actually teach in your classroom and the curriculum you test, such as the TAAS test, with A being a very close fit and F being very loose fit.
19% 38% 25% 12% 5% 1% 100%
12.
What grade would you assign to the assistance you receive in your classroom from the Instructional/ Curriculum Department at YISD's central office?
6% 22% 30% 23% 18% 1% 100%

13.
How effective do you think site-based decision making has been implemented in YISD, with A being very effective and F being very ineffective?
12% 20% 27% 22% 18% 1% 100%
14. What grade do you give to the district's use of programs for bilingual students?
7% 30% 34% 20% 8% 1% 100%
The next few questions deal with supplies and materials that you use in your teaching. Again, please use the grading system like you did above.
A B C D F NR Total
15.
How would you grade the availability of the supplies, materials, equipment and textbooks you need to support instruction at YISD?
17% 32% 22% 19% 9% 1% 100%
16.
How would you grade the degree to which schools have the basic facilities (such as lab equipment and computers) to educate students within the current or projected curriculum and educational standards?
12% 30% 30% 20% 7% 1% 100%
Survey Question Survey Response
A B C D F NR Total
17.
What grade would you give the requisition process in obtaining needed materials?
7% 20% 27% 26% 18% 2% 100%
0 1 to 2 3 to 5 6 to 8 9 or NR Total

More
18.
How many times do you have to follow-up with the principal or school clerk on ordering supplies you have requested before those supplies are received?
17% 40% 28% 8% 5% 2% 100%
A B C D F NR Total
19.
What grade would you give to YISD overall in terms of obtaining the needed supplies and the methods used?
8% 30% 31% 21% 10% 0% 100%
19a. How do you think this process could be improved?
• If each teacher were given a credit card (credit for supplies at warehouse) he or she could get supplies when needed and not have to go through the red tape of paperwork and ordering.
• Shorten the paper process.
• There should be a district wide process of dissemination of information/procedures, rather than campus to campus.
• There are some materials which cannot be obtained through central office. It would help to allow each campus to have a "petty cash" fund.
• Better correlation between the warehouse/home school/central office for faster results.
• More clear cut guidelines, procedures and budgets. Something published with which to follow.
• Allowing us to order supplies from the least expensive vendor so our money will go farther, instead of buying from the warehouse or the vendors YISD
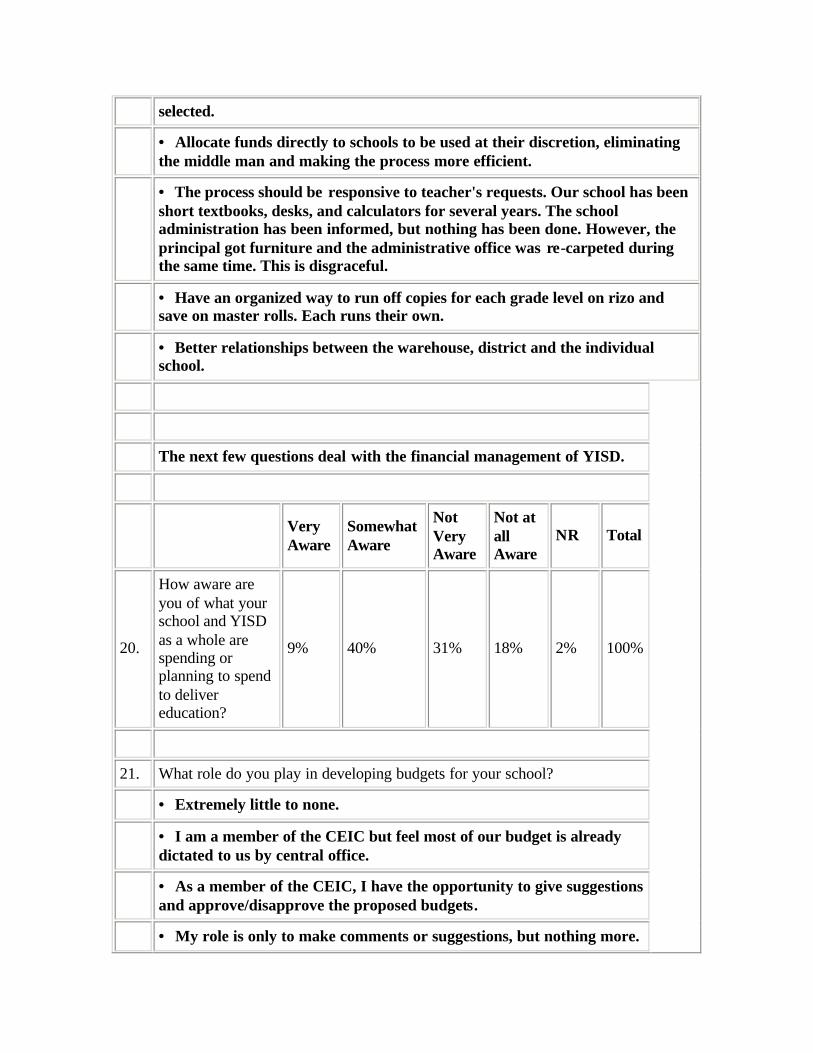
selected.
• Allocate funds directly to schools to be used at their discretion, eliminating the middle man and making the process more efficient.
• The process should be responsive to teacher's requests. Our school has been short textbooks, desks, and calculators for several years. The school administration has been informed, but nothing has been done. However, the principal got furniture and the administrative office was re-carpeted during the same time. This is disgraceful.
• Have an organized way to run off copies for each grade level on rizo and save on master rolls. Each runs their own.
• Better relationships between the warehouse, district and the individual school.
The next few questions deal with the financial management of YISD.
Very Aware
Somewhat Aware
Not Very Aware
Not at all Aware
NR Total
20.
How aware are you of what your school and YISD as a whole are spending or planning to spend to deliver education?
9% 40% 31% 18% 2% 100%
21. What role do you play in developing budgets for your school?
• Extremely little to none.
• I am a member of the CEIC but feel most of our budget is already dictated to us by central office.
• As a member of the CEIC, I have the opportunity to give suggestions and approve/disapprove the proposed budgets.
• My role is only to make comments or suggestions, but nothing more.

• Regularly informed through staff meetings, but input from teachers is minimal.
• We are truly a site-based managed campus. Budgets and cuts are discussed at faculty meetings and through our CEIC committee.
• None. The principal makes all the decisions and is completely indifferent to suggestions, whether recommendations are made orally or formally in writing. He has his own agenda. The budget is a political item, not an educational program.
• Our principal manipulates as she wishes and has us sign a year later for whatever we were funded.
• Absolutely none! When I've given my opinion on frivolous consultant fees for useless workshops, my opinion have been completely ignored. Again, what the principal wants she gets!
• Essentially, none. This year we have a mini-dictatorship; if the principal approves it, it might get done. Suggestions often fall on deaf ears.
• None. I do not know of any teachers in my building involved in the budget process.
Greater Involvement
Less Involvement
At a Good Level
NR Total
22.
Would you prefer greater involvement, less involvement, or is your involvement in this process at a level you like?
59% 3% 36% 2% 100%
A B C D F NR Total
23. What grade would you give to the quality of work in the payroll department?
32% 41% 17% 6% 1% 3% 100%

The next questions deal with teacher relationships with administrators and students.
0 1 to 2 3 to 4 5 or More
NR Total
24.
On average, how many times per month is the principal or assistant principal present in your classroom?
30% 44% 13% 11% 2% 100%
25.
What do you think is the ideal number of classroom visits for the principal or assistant principal to make in a month in order to give you constructive feedback on your teaching?
7% 62% 22% 8% 1% 100%
The next few questions deal with the staff development program used in your school.
SA A NO D SD NR Total
26.
The staff development program used in your school has improved your classroom teaching and management?
15% 38% 12% 20% 14% 1% 100%
27. What is the most important strength, if any, of the staff development program used in your school?
• We are able to receive the latest techniques in training. I was able to first hand experience a feeling of pride at a Texas Teacher Conference when I knew we were up to par with other Texas schools who lead the State.
• TAAS test strategies taught during staff development were very helpful.
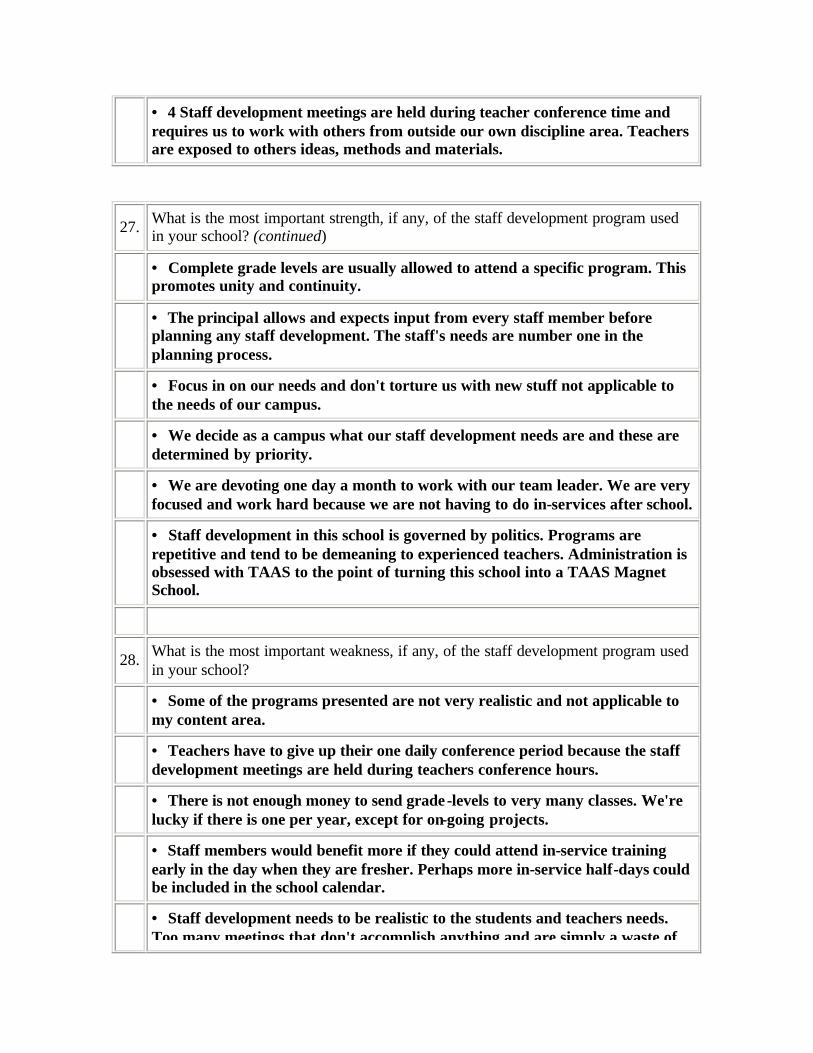
• 4 Staff development meetings are held during teacher conference time and requires us to work with others from outside our own discipline area. Teachers are exposed to others ideas, methods and materials.
27. What is the most important strength, if any, of the staff development program used in your school? (continued)
• Complete grade levels are usually allowed to attend a specific program. This promotes unity and continuity.
• The principal allows and expects input from every staff member before planning any staff development. The staff's needs are number one in the planning process.
• Focus in on our needs and don't torture us with new stuff not applicable to the needs of our campus.
• We decide as a campus what our staff development needs are and these are determined by priority.
• We are devoting one day a month to work with our team leader. We are very focused and work hard because we are not having to do in-services after school.
• Staff development in this school is governed by politics. Programs are repetitive and tend to be demeaning to experienced teachers. Administration is obsessed with TAAS to the point of turning this school into a TAAS Magnet School.
28. What is the most important weakness, if any, of the staff development program used in your school?
• Some of the programs presented are not very realistic and not applicable to my content area.
• Teachers have to give up their one daily conference period because the staff development meetings are held during teachers conference hours.
• There is not enough money to send grade-levels to very many classes. We're lucky if there is one per year, except for on-going projects.
• Staff members would benefit more if they could attend in-service training early in the day when they are fresher. Perhaps more in-service half-days could be included in the school calendar.
• Staff development needs to be realistic to the students and teachers needs. Too many meetings that don't accomplish anything and are simply a waste of

time. This wasted time could be used in the classroom.
• Let us have at least one hour to work in our rooms those days we have all day in-service.
• On occasion, speakers that we requested have not been available and the alternates that are sent are not as knowledgeable.
• I would like one or two outsider presenters a year.
• We have too many new programs happening all at once that it's to a point where we aren't able to implement any of them correctly.
• The excessive number of meetings held during school hours. Students do not accel under the direction of substitute teachers.
28. What is the most important weakness, if any, of the staff development program used in your school? (continued)
• Training that does not meet teachers needs.
• Not teacher centered or directed. Sometimes we are given erroneous information.
• With waivers to do it at school time, it takes away from instructional time and planning periods. We are in last place on TAAS scores in our district!
• The principal does not allow feedback on programs that she has implemented. There are too many programs going on at the same time and there are meetings. Just have to have meetings!
29. How well do you work with the other teachers and administrators at our school?
Very well as a team 47%
Somewhat well as a team 31%
About average as a team compared with other work groups 14%
Not very well as a team 4%
Not at all well as a team 2%
No Reply 2%

Total 100%
30. Which of the following do you feel is your most important source of feedback in improving your teaching?
Students 30%
Administrators 4%
Other Teachers 23%
Parents 5%
All of the above 37%
No Response 1%
Total 100%
31. On average, how often do you receive feedback from this source in a week?
Less than once per week 22%
Once per week 22%
Every other day 13%
Everyday 30%
Several times per day 11%
No Response 2%
Total 100%
Survey Question Survey Response

SA A NO D SD NR Total
32.
Teacher evaluation program used in your school has improved your classroom teaching and management...
3% 17% 23% 31% 24% 2% 100%
33. What is the most important strength of the teacher evaluation program used in your school?
• The Teacher Self-Report Form gives me the opportunity to state in writing and reflect on how I have adjusted to my students needs. What approaches I have used and how I have monitored students performances.
• The portfolio assessment allowed for reflection and helped the principal know her staff as individuals with goals and personal attributes as well. Unfortunately, we will be using the PDASA instead.
• I loved teacher portfolios. I documented my year and the next year I could use my portfolio as a source book.
• I think the drop-in evaluations are the best because they show your real teaching.
• The scheduled observations are sometimes a show. They are not always a good indictor of what is really going on.
• None. The system lacks integrity. It's as phony as a three dollar bill. I'm aware that evaluations have been based on absolutely nothing. I, myself, have not been evaluated during the last two years. I know that's hard to believe, but it's true.
• More than one evaluator has input into your education (i.e., both principal and assistant principal).
• It makes some teachers teach at least two days out of the year.
• The feedback given to you afterwards.
• I do not think this new system is a fair evaluation since we can't control what any given child will do on the TAAS. We can only see to it that they are taught the basic skills. What they do with it on the test is out of our hands.
34. What is the most important weakness of the teacher evaluation program used in your school?
• It does not capture any consistency or any accurate average on how a
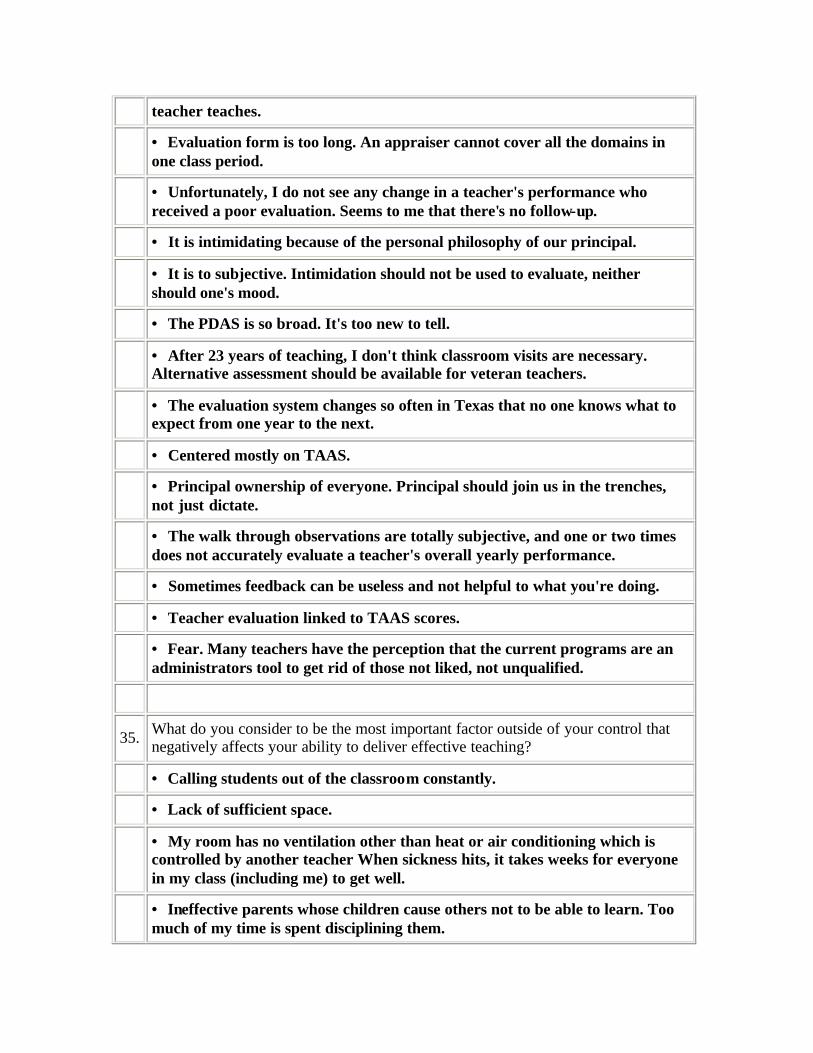
teacher teaches.
• Evaluation form is too long. An appraiser cannot cover all the domains in one class period.
• Unfortunately, I do not see any change in a teacher's performance who received a poor evaluation. Seems to me that there's no follow-up.
• It is intimidating because of the personal philosophy of our principal.
• It is to subjective. Intimidation should not be used to evaluate, neither should one's mood.
• The PDAS is so broad. It's too new to tell.
• After 23 years of teaching, I don't think classroom visits are necessary. Alternative assessment should be available for veteran teachers.
• The evaluation system changes so often in Texas that no one knows what to expect from one year to the next.
• Centered mostly on TAAS.
• Principal ownership of everyone. Principal should join us in the trenches, not just dictate.
• The walk through observations are totally subjective, and one or two times does not accurately evaluate a teacher's overall yearly performance.
• Sometimes feedback can be useless and not helpful to what you're doing.
• Teacher evaluation linked to TAAS scores.
• Fear. Many teachers have the perception that the current programs are an administrators tool to get rid of those not liked, not unqualified.
35. What do you consider to be the most important factor outside of your control that negatively affects your ability to deliver effective teaching?
• Calling students out of the classroom constantly.
• Lack of sufficient space.
• My room has no ventilation other than heat or air conditioning which is controlled by another teacher When sickness hits, it takes weeks for everyone in my class (including me) to get well.
• Ineffective parents whose children cause others not to be able to learn. Too much of my time is spent disciplining them.

• The amount of available funding to support current technology and support personnel.
• Lack of supplies for effective instruction.
• No one listens to our complaints or investigates as to what we have to say, everything is kept hush, hush!
• Harassment of principals to implement needless programs that do not help/assist students' learning.
• Principals put absolutely too much pressure on us to do well on TAAS so other things that need to be taught aren't.
• Language barriers and some of the cultural beliefs.
• The principal and his favoritism.
• Excessive paperwork. Writing and re -writing what we do to address TAAS initiatives takes time from my actually teaching.
• Too much is going on and you have so many other responsibilities that it tires you and robs you of energy needed in the classroom.
• Too much emphasis on TAAS.
A B C D F NR Total
36.
How would you rate the use of technology, including hardware, software, communications, and support, in your school?
20% 34% 28% 12% 5% 1% 100%
37.
What grade would you give to the integration of the use of computers with the regular education curriculum?
16% 28% 29% 17% 7% 3% 100%
38. Please grade the safety of your work facilities.
30% 37% 19% 10% 3% 1% 100%
39. How do you think the safety of the facilities can be improved?
• Stricter rules against violent students remaining in school.

• Once construction has been completed the work facilities should be safe.
• When heavy construction is needed, the school campus should section that part off completely; instead of attempting to hold classes in the mist of construction.
• Update and modernize heating, cooling and water quality. Asbestos removal should be considered.
• More lighting outside is needed since many staff members work late and for parents when we have classes and seminars at night.
• Bigger doors are needed at all the entrances to handle the crowds.
• Outlets need to be more numerous and in sensible places to accommodate power cords. I worry about students tripping on them.
• Repairs to building. Carpet needs to be replaced, leaks in roof repaired and room cleaned thoroughly.
• When you report the smell of gas, it should be fully checked by a professional, not just a (smoker) head custodian who can't smell!
• Perform hazardous removal and construction on days students are out of school.
• Better drainage around portables. During rains someone might drown getting to class.
A B C D F NR Total
40. Please grade the schools with regard to their cleanliness and maintenance.
23% 37% 25% 11% 2% 2% 100%
41. What grade would you give your school in terms of being overcrowded or underused?
16% 33% 32% 11% 4% 4% 100%
42. Please grade the extent to which the facilities encourage a learning environment.
27% 42% 20% 7% 2% 2% 100%
43. In what one or two ways do you think that the operational efficiency of YISD could be improved?

• An equal distribution of technological equipment and supplies.
• Improve teacher morale; this is in reference to more pay.
• Implement communication and truthful communication between administrators and teachers (presently too many hidden agendas exist).
• Allow for cross-district grade level gatherings so professionals can discuss, talk, collaborate and in general, find out what other teachers in the same grade level in the district are doing.
• More efficient time frames for projects so that the school receives its requests when needed.
• Better maintenance materials such as water pumps and motors need to be available for immediate use whenever needed. Too much paperwork and time is needed to buy these types of things in order to repair.
• Update physical elements of classrooms to accommodate increased technology and rising student populations.
• Our YISD transportation system is totally inefficient and unavailable to our students. We have to charge the students $3.00 for a trip downtown that we could ride the city bus for $1.00 and they still do no show up on time and push you to return before the field trip is even over. It's ridiculous and these cases are "the norm" not isolated incidents.
• We have had problems with maintenance workers who come to our school once a week or less. There has been broken car windows when using a weedeater and urinating in the sand while classes are outside. I think they might be able to hire better people or at least get rid of the unqualified ones.
• Increase financial efficiency by replacing the highly paid superintendent.
• Conduct complete audit of district expenses.
• Have e -mail capacity between the schools and central office. Use the internet and intranet connections available. Allow communication to open up (like the rest of the world).
• Stop moving staff around and work on continuity of program offerings. Stop putting in new programs so often. Schools in this country change so often that programs never have time to be evaluated. Private industry allows 3-5 years, why don't we?
• Eliminate about 50 percent of administrative bureaucracy and use money in the classroom.
• Check Maintenance Department (grounds) where they are allotted money to go to courses out of the city and fly to Austin to take tests for irrigation license

and flunk and go again and again and I cannot go to an educational conference in the city. This is not needed. It's for personal contracts.
• Quicker method of responding to small emergency requests such as plumbing and air conditioning/heating problems. Last year during one of the coldest winters in El Paso my school's heaters weren't working. When I complained to the principal, she responded "coldness does not cause illnesses."
• Get rid of Trujillo. The total lack of respect and recognition of the people that are truly making this district shine are neglected, disrespected and unappreciated, but we still continue to make a difference.
Demographic Information
Anglo African American Hispanic Asian Other RF Total
D1. Ethnicity... 37% 2% 47% 0% 6% 8% 100%
Yes No NR Total
D2. Do you have any children enrolled in YISD schools?
32% 66% 2% 100%
Male Female NR Total
D3. Gender... 32% 63% 5% 100%

Appendix G Student Survey Results
Student Survey Results (Written/Self-Administered)
Population n=773
Demographic Information
D1. Gender...
D2. Classification...

D3. Ethnicity...
Please indicate how you would grade your school on a scale of A through F.
A B C D F NR Total
1. How would you grade your school for the quality of education you are receiving?
16% 52% 26% 5% 1% 0% 100%
2. How would you grade your teachers overall?
20% 49% 24% 5% 2% 0% 100%

Very Safe
Fairly Safe
Very Unsafe
DK NR Total
3. How safe do you feel in your school?
28% 65% 5% 2% 0% 100%
Very Often
Fairly Often
Once in a While
Never NR Total
4. How often do principals visit your classroom?
1% 3% 36% 60% 0% 100%
5. How often do assistant principals visit your classroom?
1% 4% 42% 53% 0% 100%
6. How often do principals attend school activities?
40% 33% 19% 6% 2% 100%
7. How often do assistant principals attend school activities?
36% 40% 17% 6% 1% 100%
Survey Question Survey Response
Using the following legend please indicate whether you strongly agree (SA), agree (A), neither agree nor disagree (N), disagree (D), strongly disagree (SD) or don't know (DK).
SA A N D SD DK Total
8. Do you agree that learning is the school's most important goal?
44% 41% 7% 5% 1% 2% 100%
9. Does your school offer a broad selection of challenging courses?
17% 44% 19% 8% 2% 10% 100%

10. Does the school's library have enough books and resources for you to use?
17% 42% 14% 13% 7% 7% 100%
11. Do you think that teachers expect students to do their very best work?
29% 46% 14% 6% 3% 2% 100%
12. Do teachers explain material and assignments to you so that you can understand them clearly?
16% 40% 23% 15% 5% 1% 100%
13. Do you feel that teachers care about student's needs?
14% 34% 26% 12% 8% 6% 100%
14. Do teachers give you individual attention?
12% 40% 26% 14% 7% 1% 100%
15. Do teachers praise you when you are doing well in your school work?
13% 38% 23% 16% 8% 3% 100%
16. Do you think the school principal cares about students' needs?
14% 29% 22% 13% 13% 9% 100%
17. Do principals treat students with respect?
17% 36% 18% 10% 9% 10% 100%
18. Do assistant principals treat students with respect?
14% 36% 20% 11% 11% 8% 100%
19. Does the principal praise the students for earning good grades?
8% 18% 23% 17% 19% 15% 100%

Survey Question Survey Response
SA A N D SD DK Total
20. Are you and your fellow students proud of your school?
21% 34% 22% 9% 8% 6% 100%
21. Do you think that most students try to do their best in class?
9% 29% 23% 21% 11% 7% 100%
22. Do you think that misbehavior interferes with classroom learning?
32% 37% 13% 8% 5% 5% 100%
23. Do you have sufficient books, lab supplies and classroom materials?
12% 35% 15% 19% 15% 4% 100%
24. Computers are available at my school whenever I need to use them.
33% 37% 9% 11% 7% 3% 100%
25. There is good computer instruction at my school.
24% 36% 16% 11% 5% 8% 100%
26. Adequate career and college counseling opportunities are provided by counselors at my school.
24% 38% 13% 8% 8% 9% 100%
27. There are enough Bilingual teachers at my school.
23% 40% 11% 6% 4% 16% 100%
28. The bilingual programs are adequate at my school.
16% 34% 16% 6% 3% 25% 100%

29. There are good food options in the cafeteria at my school.
5% 19% 17% 17% 27% 15% 100%
30. The school bus service at my school is adequate.
5% 17% 19% 6% 5% 48% 100%
31. What do you think is the main reason that some students dropout of school at your campus?
· It think it's because of problems at home. Some students have too many things on their minds and they figure they can't handle school.
· I think the main reason is that they just choose not to work hard and they want to be lazy. Sometimes there's no motivation for them to stay in school.
· They get tired of school or they have problems they need to solve.
· They don't care or they don't think it's cool to go to school.
· They are overwhelmed with work and put if off. They get behind or don't understand the lessons.
· Some students don't enjoy being at school or have problems understanding their work.
· Lack of encouragement from the teachers and especially the principals.
· They are pregnant or confused. Problems at home or with themselves prevent them from learning. They don't realize how important education is.
· I think the main reason students drop out of school is because they get bored. They get bored in the classroom by the assignments and teachers.
· The main reason would be because they got pregnant or they just don't like school.
· They have a lot of problems at home.
· A lot of them have personal problems and they feel school isn't important.
· They either don't like school or one of the teachers.
· Their either pregnant, lazy or influenced by their friends.
· They give up.
· They do not have their priorities straight.

· They are either pregnant or not interested in school.
32. What can be done to ensure that students stay in school? For example, would some type of program or counseling help?
· Teachers need to show them they can do it. Maybe some counseling would help. There are some teachers here that are excellent, others are just here. Motivation is the key.
· I think that a program and counseling would help the students who have low grades and it will let them talk about their problems.
· The Drop Out Recovery is good, but the teachers at RHS need to reach out to the students because they have actual contact with them.
· Make sure they understand what needs to be done. It might help for a guest speaker to talk to them about his/her struggles.
· Tutoring after school or having a class were students could receive help in their studies.
· I think that our school administrators should be more courteous toward the students.
· Alumni and other programs would help emphasize the need for education.
· Counseling won't help because teenagers won't listen. Teachers have to change their methods of teaching. Make the lesson appeal to the students.
· Make school interesting in other ways, instead of just opening books, reading, and working on book assignments. I think a program will help better than counseling.
· Nothing is promising, but maybe some sort of program would help. A lot of students drop out because they are parents and they need money to take care of their child. A day care might help.
· Make teaching and learning fun, but still teaching what needs to be taught.
· No. They drop out because they want to. It's their choice and having some program is only spoiling them.
· A program such as the Phoenix program where students work at their own pace.
33. What do you think needs to be done to ensure that students attend school more regularly?

· Try to get the parents involved.
· Make sure the teacher(s) and students don't have a problem with each other.
· Offer rewards for perfect attendance.
· I think we should give a reward for the class with the best attendance (i.e., pizza party).
· It needs to be fun. They should have more pep rally's or other activities during school.
· Make the classes a little less boring.
· Have a more courteous staff.
· Detention might help. Also, calling the parents after two unexcused absences. In more serious cases, counseling with the parents is needed.
· Principals need to talk to guardians. Also, send students to court or make them pay a fine.
· It should be more safe and comfortable.
· I think the parents, community, and school should use a positive reinforcement to get students motivated.
· Nothing can be done. It's just the desire people need to want do something.
· Pay us.
· If school becomes something students like, then they will enjoy coming and want to continue attending.
· Have field trips.
· Schools needs to be interesting. The Superintendent, Principals, and some students from each high school should get together and decided on activities that will ensure a better attendance record.
· Be strict on absences.
· More praise and rewards.
34. Why do you think some students perform poorly on the TAAS test?
· Maybe it's because at the last minute everyone is cramming study skills down their throats. Students need breaks and GOOD, not cramming, study skills.
· They might perform poorly because they're really nervous.

· Some students think it is just a joke.
· They don't ask for help if they need it.
· They don't take it serious.
· Lack of encouragement.
· I think students are not challenged enough. Passing regular classes is enough for them.
· They perform bad on the TAAS because of fear. Teachers and staff push the TAAS so much that it scares them.
· Many students don't think it's important and some are just not taught what to study for.
· They probably tend to get nervous or the quietness makes them sleepy.
· Maybe they have had to many TAAS activities before and are simply bored of it.
· They don't study and they don't realize how important the test is until they're seniors and trying to graduate.
· Either they don't like being under pressure or they don't pay attention in school.
· They just guess because they want to get it over with.
· They perform poorly either because they skip class or the teacher isn't explaining to their understanding.
35. What would help improve students' scores on the TAAS exam?
· They should start reviewing a month or two in advance. Give them a reward for passing it the first time. MOTIVATION.
· Set them in a place where they can relax with someone watching them, but not standing over their shoulder.
· What the teachers do is really important. They should push the TAAS and take time to go over test material.
· Special classes that go at their pace of learning.
· Make students feel comfortable and don't put to much pressure on them.
· Workshops.
· There could be more TAAS practice in the classrooms. Also, they should be
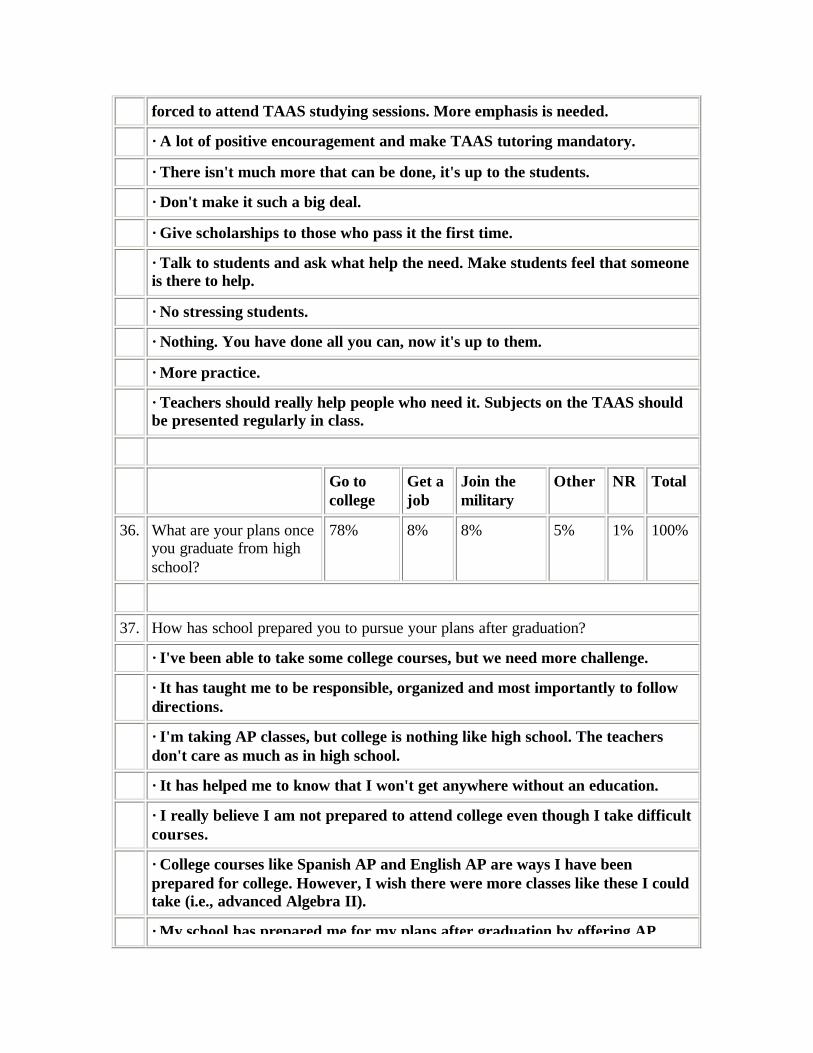
forced to attend TAAS studying sessions. More emphasis is needed.
· A lot of positive encouragement and make TAAS tutoring mandatory.
· There isn't much more that can be done, it's up to the students.
· Don't make it such a big deal.
· Give scholarships to those who pass it the first time.
· Talk to students and ask what help the need. Make students feel that someone is there to help.
· No stressing students.
· Nothing. You have done all you can, now it's up to them.
· More practice.
· Teachers should really help people who need it. Subjects on the TAAS should be presented regularly in class.
Go to college
Get a job
Join the military
Other NR Total
36. What are your plans once you graduate from high school?
78% 8% 8% 5% 1% 100%
37. How has school prepared you to pursue your plans after graduation?
· I've been able to take some college courses, but we need more challenge.
· It has taught me to be responsible, organized and most importantly to follow directions.
· I'm taking AP classes, but college is nothing like high school. The teachers don't care as much as in high school.
· It has helped me to know that I won't get anywhere without an education.
· I really believe I am not prepared to attend college even though I take difficult courses.
· College courses like Spanish AP and English AP are ways I have been prepared for college. However, I wish there were more classes like these I could take (i.e., advanced Algebra II).
· My school has prepared me for my plans after graduation by offering AP

classes, vocational and many other programs.
· School has opened my eyes to all the great opportunities life has to offer.
· It has helped me to know how important it is to go to college.
· It's not school that's really helped me. In the past years teachers were really good , but as they got new ones, they were to inexperienced and not ready to teach. They really had no idea what to do.
· They have college fairs, presentations and computer programs that help you choose a college.
· School has allowed me to mature.
· I learned more about myself and how to get along with others. I want to succeed and I got that encouragement from my teachers.
· It has taught me how to work, work, work. It has taught me that my grades reflect my own effort and understanding.
38. Name three things you like best about your school. (You may refer to the list below to help determine your answer).
1. Sports
Open Campus
2. Teachers
1. Friends/People
Other responses ranked in order of frequency:
4. School Activities
1. Vocational/Work Programs
6. Pride/School Spirit
Counselors
7. ROTC
8. Four classes per day
39. Name three things you like least about your school. (You may refer to the list below to help determine your answer).

1. Assistant Principal
Principal/Administration
2. Pride/School Spirit
1. Friends
People
Other responses ranked in order of frequency:
4. Short Lunch Periods
Cafeteria Food
39. Name three things you like least about your school. (You may refer to the list below to help determine your answer). (continued)
5. Teachers
7. Facilities (Bathrooms)
Heating & Cooling
7. Fights (Violence)
Gangs
8. Organizations
Counselors
Classes/Academics
40. Based on what you know about your school, tell us one or two things you believe can be improved. (You may refer to the list below to help determine your answer).
1. Assistant Principal
Principal/Administration
2. Pride/School Spirit
1. Security
Other responses ranked in order of frequency:

4. Teachers
School Activities
Classes/Academics
5. Longer Lunch Periods
4. Cafeteria Food
6. Buildings
Size of School
7. Library Resources
8. TAAS Scores
NR = No Response
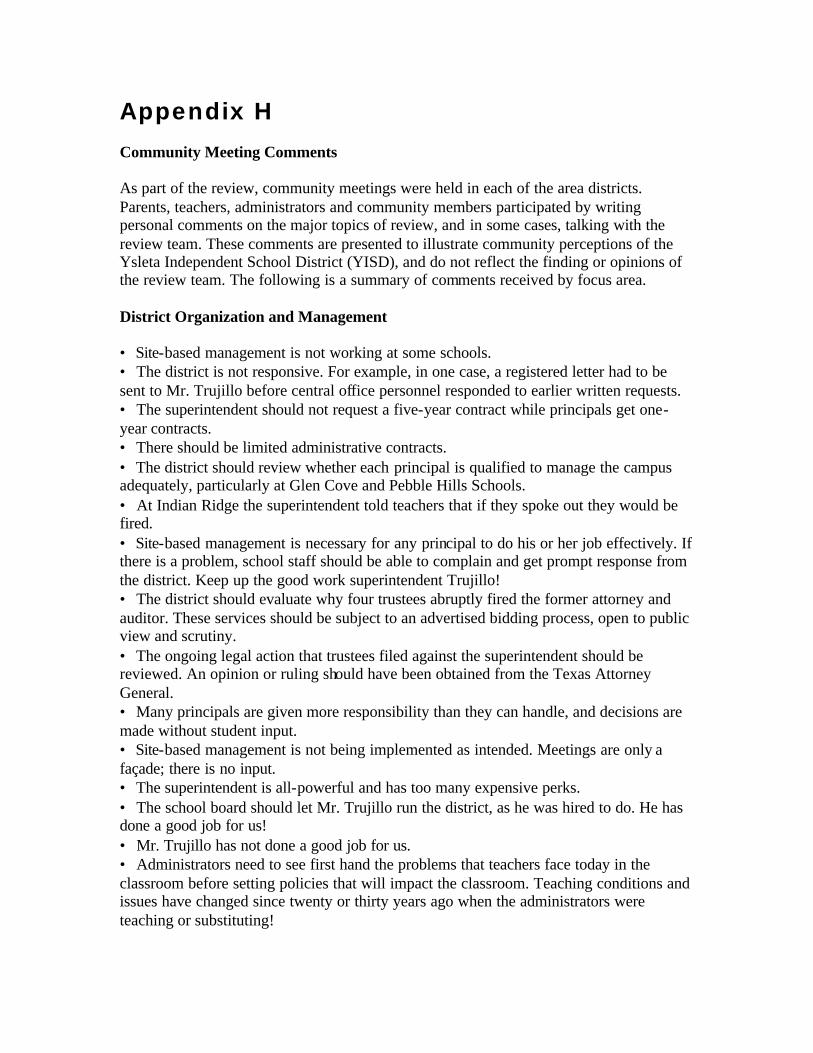
Appendix H Community Meeting Comments As part of the review, community meetings were held in each of the area districts. Parents, teachers, administrators and community members participated by writing personal comments on the major topics of review, and in some cases, talking with the review team. These comments are presented to illustrate community perceptions of the Ysleta Independent School District (YISD), and do not reflect the finding or opinions of the review team. The following is a summary of comments received by focus area. District Organization and Management
• Site-based management is not working at some schools. • The district is not responsive. For example, in one case, a registered letter had to be sent to Mr. Trujillo before central office personnel responded to earlier written requests. • The superintendent should not request a five-year contract while principals get one-year contracts. • There should be limited administrative contracts. • The district should review whether each principal is qualified to manage the campus adequately, particularly at Glen Cove and Pebble Hills Schools. • At Indian Ridge the superintendent told teachers that if they spoke out they would be fired. • Site-based management is necessary for any principal to do his or her job effectively. If there is a problem, school staff should be able to complain and get prompt response from the district. Keep up the good work superintendent Trujillo! • The district should evaluate why four trustees abruptly fired the former attorney and auditor. These services should be subject to an advertised bidding process, open to public view and scrutiny. • The ongoing legal action that trustees filed against the superintendent should be reviewed. An opinion or ruling should have been obtained from the Texas Attorney General. • Many principals are given more responsibility than they can handle, and decisions are made without student input. • Site-based management is not being implemented as intended. Meetings are only a façade; there is no input. • The superintendent is all-powerful and has too many expensive perks. • The school board should let Mr. Trujillo run the district, as he was hired to do. He has done a good job for us! • Mr. Trujillo has not done a good job for us. • Administrators need to see first hand the problems that teachers face today in the classroom before setting policies that will impact the classroom. Teaching conditions and issues have changed since twenty or thirty years ago when the administrators were teaching or substituting!

• A principal dissolved the Parent Teachers Association (PTA) at a campus. Good teachers and staff have left because of this principal. The principal is unprofessional and should be evaluated. • Complaints filed with the district office are not addressed. • Schools should teach students about all cultures, not just the Hispanic culture. • The superintendent believes in the phrase, "take from the rich to give to the poor." He assumes homeowners are rich and should be penalized. All schools except magnet schools or schools for the economically disadvantaged need books and supplies. • All schools should be treated fairly, and have input on the superintendent's decisions. • The Attorney General of Texas should investigate concerns raised about this district. • Mr. Trujillo should spend the district's money on improvements, not to increase his salary. • Construction should be done over the summer, not during the school year because of the inconvenience and health hazards to both students and staff. • The board is disorganized and self-serving. • The district should not need three law firms to represent it. • The American flag was removed from all classrooms at Ranchland Hills and the pledge of allegiance is no longer recited. • It is not fair that religious pamphlets be distributed on school property if the pledge of allegiance is not allowed. • It seems unconstitutional for a principal to ask teachers to sign an oath requiring that conversations he ld in the principal's office be kept confidential. • The board should abide by the rules and not change policy to serve individual interests. • The board's agenda should be communicated to the public in advance either via the Internet, through the schools or even on the YISD TV channel. • Under site-based management principals have the power to become dictators of their campuses. For example, one principal at Glen Cove Elementary School has told several parents that if they aren't happy with her decis ions, they can transfer. She also said "This is my campus and I'll do what I want to do." Site-based management has the potential to make principals monsters that the children and parents are stuck with. • Mr. Trujillo should not be able to suspend school policy and state law to re-elect school board officers because he doesn't like the existing officers. • The district changed its legal representation from one good law firm to two terrible firms at the whim of a few board members. • The district would be better served by hiring fewer people, but raising hiring standards. • Site-based decision-making works with responsive central office support. The community still does not display a real interest in education. • Cesar Chavez Academy has an excellent program and an excellent principal. • School facilities should remain open for students to use after school. • I expressed an interest in serving on the site-based committee at Eastwood High School, but didn't receive a response. I would like to see a monthly summary of minutes of site-based meetings distributed to parents. • If schools are being decentralized, it should not be so hard to find a parking space at central office. It seems more people are being hired, at the central office level, at the expense of individual schools.

• The principal at Cesar Chavez is very well organized and provides structure for the school and staff. • Schools that are successful are being supported and recognized for their successes with increased opportunities for self-governance and creativity. • Central office personnel should be more creative in their daily interaction with campuses. It seems that students' needs are put on hold, because no on has clear decision-making authority to resolve problems. Decisions should be made at the campus-level. Site-based decision-making should be implemented and supported throughout the district. • If site-based decision-making is to be effective, then schools should allow all members of the Campus Education Improvement Committee (CEIC) to make decisions. Instead, the CEIC is often told about decisions made by administrators only after the fact, especially as regards budget decisions. • The superintendent has a vision, but is too political. Schools represented by board members who oppose the superintendent seem to get more funding in order to appease them while Parkland school is neglected. • Board members should be trained regarding appropriate duties and behavior at board meetings, before they take office. • The selection of kindergarten students for Alicia R. Chacon International should be done by public lottery, not pre-selection. In addition, some sort of recourse should be offered for students who are denied access to the school. • Final appeal should rest with Texas Education Agency and not with local superintendents. • Site-based decision-making is not implemented consistently. • Parents are quite happy with the management and organization at Cesar Chavez Academy. • Campus level operations are open to CEIC and all parents; however, central office administrators make decisions and implement programs without ever visiting campuses; they should sit in classrooms to evaluate teaching strategies and programs. • I appreciate and applaud Mr. Trujillo's vision, energy and commitment to our students. More central administrators should follow Mr. Trujillo's lead, and spend time on campuses speaking with students, staff and parents! • Central office should play a greater role in serving schools. • At last we have a superintendent who shares our vision that all students can succeed. • Site-based decision-making is well implemented at Cesar Chavez Academy. The administrator achieves great results. • Mr. Trujillo is a true leader working towards a vision of student success for all. • Site-based decision-making at Del Valle High School is a good idea, but staff should be hired based solely on qualifications. The superintendent needs to make the process of funding and awarding new projects less political. • Mr. Trujillo is not always available to answer parents' questions. Administrative meetings are held behind closed doors, where parents are unable to participate. The decision processes for selecting 132 students to Alicia Chacon School was done by lottery and involves a lot of favoritism. Educational Service Delivery and Performance Measures

• The gifted and talented program is practically non-existent at some schools. One teacher is responsible for all students in their grade level. It is unclear what last year's budget of almost eight thousand dollars was spent on. • The district should be more committed to gifted and talented students. • The comments below reflect the climate of the district. At Glen Grove Elementary School, gifted and talented programs are non-existent, while bilingual programs strong. In all fairness, I want my gifted child to get what he deserves, just as bilingual kids should get what they deserve. • This principal works hard to achieve perfect attendance because the school is funded based on attendance levels. • The student vision statement, which reads: "all high school students will graduate fluently bilingual and be prepared to enter a four-year college or university" should apply to special education students too. • All students should receive bilingual education, not just Spanish-speaking students. • Teachers should be given more control over their classrooms. • The special education department should be audited. • The hooked on phonics programs should be used in K-1 and first grade. • Special programs are not working. Students are graduating from elementary school without basic skills, such as reading. Educational standards should be raised. • TAAS testing should be discontinued. • Stop teaching our children only the TAAS curriculum! • One school has had no Spanish teacher for several years. • Student academic performance should be consistently recognized. YISD should have a "Texas Scholars" program. • Less emphasis should be placed on the TAAS test because it is unfair to some students. • The school board needs to rethink its policy requiring four years of math and science to graduate. Only 25-30 percent of jobs require a four-year degree, but many jobs require training and technical skills. All students go to work, but not all go to college. Give students the skills they need to be successful in the workplace. Let's go with the state plan and drop the four-year requirement. • The gifted and talented programs are inadequate. We need truly challenging and innovative programs for our future leaders. • All students should know how to speak English, even if classes must be taught at night. • The district should provide more opportunities for instructional technology within the schools and libraries. • We need better programs for teen parents to prepare them for their new roles as parents. • The school needs a bigger orchestra and band room. • Students should be aware of what is going on in the community. • Students who learn slowly should be grouped in separate so that faster learners are not held back. • Gifted and talented students are ignored. • YISD should not concentrate on TAAS testing at the expense of other educational areas.

• Gifted and talented programs are nonexistent. Trujillo seems to believe they are bad. Gifted students have rights just as special education and bilingual students do. Funds designated for gifted and talented programs may be being misused. • Multiage classrooms work well; more of them should be implemented. We need better special education teachers and facilities. • More funding should go into advanced placement programs so students get hands-on college experience. • We have no gifted and talented program at the middle and high school level. It's not acceptable at elementary. • Libraries need to have more technology available to parents, students and teachers. • The Texas Education Agency (TEA) developed excellent library standards, but made the district responsible for funding. Perhaps the state can provide supplemental funding. • We need summer school for retained students and students who fail the TAAS. • Students are advanced to next grade level even if unprepared and have not mastered the prior grade. • It is hypocritical for YISD to say it has high expectations when it accepts minimum standards of achievement. • YISD's mission statement reads "All students who graduate from YISD will be prepared to enter a four year college". Students may enter college, but may need remedial classes or not even graduate. • Gifted students need more programs. Similarly, the initiatives currently in place are to be lauded not criticized. The successes at Cesar Chavez Academy should be duplicated all over the district. Thank you Mr. Trujillo and Mrs. Limon. • Some alternative programs are not well supervised. • Not all classes have the required textbooks. • It is unclear whether there is a limit on expenditures at elite schools like Cesar Chavez Academy/Alicia Chacon. Funding appears to be given to these schools at the expense of others. • The question of why Edgewood High School's budget was cut by more than twenty percent should be examined. • The budget cut at Edgewood High School was based on poor forecasting. • Strong, independent principals who are supported by the community should not be replaced with Trujillo's friends. • It is frustrating that there is very little help for gifted and talented students. In the El Paso district, children in the gifted and talented (GT) program are grouped together in one class. Even in England, the top performers are grouped together in special classes. • No research supports homogeneous grouping. YISD realizes that its gifted and talented program is inadequate, and is training staff to implement the necessary improvements. • More community education would help special programs target the right students. • I am very happy with Cesar Chavez school. I have two sons who have graduated from there and it is a great school. I am very pleased with Ms. Limon. • There are too many programs and not enough emphasis on rewarding students who are top performers. • The YISD does not adequately address the needs of special education students. These students deserve a solid education.

• I think YISD has excellent programs, such as dropout recovery, special education, at-risk, and English as a second language (ESL). However, the needs of mainstream students are often overlooked. • The quality of education provided at Cesar Chavez is excellent. Student performance is very high. • The district should focus on preparing students for college preparatory exams as well as for the TAAS test. • It is good that the principal and the teachers at Parkland High School go the extra mile for students. • The district needs to educate teachers about laws regarding learning disabled students. • The district has made a lot of progress in the last five years under Mr. Trujillo's leadership, in spite of criticism to the contrary. Before he took office the district was almost dormant. • The state, not taxpayers, should pay to implement mandatory requirements. • The state and federal governments are notorious for issuing mandates without adequate funding. The emphasis should be on teaching students instead. • Parents should not be required to show proof of income to register students for Pre-K, since this has never been required before. • School dress codes should require shirts with collars, belts, short haircuts, and no make-up. • Attendance at pre-K should be mandatory, not optional. • Schools can prioritize educational programs to meet students' needs. Parkland High School's integrated curriculum program prepares students for higher education. Teachers serve students more effectively through relevant, connected educational experiences. • Special education is very good. It has helped my son a lot and I would like that program to continue. The instructional technology has helped in this area. • Honors (AP) courses at Bel Air are excellent! • It is excellent that campuses have the freedom to select the programs, curriculum, and initiatives that best meet students' needs. Parents feel welcome to visit classrooms and campuses at any time. • With the number of student pregnancies on the rise, all campuses need to be better informed about school policies that govern this issue. • Students with severe physical and mental handicaps should be accommodated at a central facility. • Stronger gifted and talented programs are needed at the elementary level, with appropriate teachers and services provided to challenge these students. These students are often ignored. • Math should be taught at middle school to prepare students for high school level math. • Students should be able to write and read in order to complete applications. • Students cannot spell, read or write. • Special education is out of control. State and federal laws are a hindrance. There is a general fear of litigation. The needs of mainstream students are being given a lower priority as a result. • Students at Del Valle who fail and are ineligible for extra-curricular activities as a result should not be dismissed early from class.

• Parents at all levels should be educated about child development. • Children from Pre-K through high school should be taught to be respectful and care for property and the earth. Students need practical life skills to function effectively in the real world. • Pregnant students should be sent to specialized schools and taught parenting skills. • Pre-K attendance should be mandatory, and combined with kindergarten to prepare students for the first grade. Community Involvement
• YISD totally discourages parental involvement. Parents who vo ice their concerns about the education and safety of their children are referred to by the principal as "loiterers" or "trouble makers" and are not called to volunteer. • The communication from some schools is poor, because misinformation is disseminated frequently, and important dates are missed. • There is not clear communication. • Parent formats should be instituted to discuss problems at least once a month. • The district should develop a volunteer program to accommodate working parents. • Teachers are committed to teaching children and helping them to learn practical life skills. • Parents should become as involved with their school as possible. Every school is a direct reflection of its members. School staff should make it a priority to establish open communication lines with parents through organizations such as the PTA. • Monthly board meeting should be broadcast on public access television. • Glen Cove school has no follow-up communication for the community on any meetings. Parents are not told in advance about scheduled CEIC meetings that are open to the public. The principal would prefer not to have any parent involvement. • Students should be taught work-related skills rather than placing so much emphasis on academic skills. They need skills. There is no room in students' schedules to take courses that provide these skills and still get a good rating on the AEIS. • There is little communication with the public to publicize programs and events in advance. • District communication has improved. Newsletters help tremendously. • Community involvement levels should be increased through additional advertising. Libraries should be open to students after school or on weekends. • Parents should have input into the issue of whether a school is multi-age. • The superintendent has been given too much power. The board is just a rubber stamp. • Community involvement in El Paso is a joke. • Thomas Manor school has no PTA or parent liaison, and the principal is uncooperative. • The local media should present balanced coverage of the district and superintendent. • Community members are burned out, scared, or move to places with lower school taxes. • Community involvement starts at home! We must teach our children to become aware and be involved.

• Each school nurtures community involvement. When parents feel welcome, wanted, and needed, they attend. • More parents would become involved if they were better informed of volunteer opportunities. It was five years before I heard of a CEIC committee. • Parent involvement is slowly moving in the right direction. • Parents have only minimal involvement with school activities and teachers, yet they want to blame teachers for everything. • If schools clearly communicated the role they would like parents and businesses to play, these groups would be more responsive. • Parent attendance at PTA meetings and teachers' conferences should be mandatory. By documenting parental involvement, schools and parents could take joint responsibility for student success. • The Parkland area needs additional parent involvement. • At Cesar Chavez, parental involvement is important. Ms. Limon has consistent contact with parents, which makes it very efficient to work with the students. • The district should find more creative ways to involve parents. Parents need to feel that they are welcome and appreciated. • Parkland Elementary is definitely moving in the right direction with parental involvement. They are making progress toward having a great parent center. • Parental involvement is necessary for students' development. • The volunteer program at Bel Air is fantastic. • The level of parent involvement is increasing, but the Parent Center needs improvement. Parents would feel more comfortable if an area were designated for classes and social activities. • Parents at Bel Air High School who participate in the CEIC are very involved in school decisions and are knowledgeable about the school curriculum. Thanks to Mr. Legarrot, band boosters are very strong, and all students benefit. • I admire the commitment that parents and the community demonstrate in the Bel-Air/Ranchland feeder pattern. Parental involvement and attendance at meetings is at an all-time high. Students perform positively on those five campuses as a result. • Spanish-speaking parents need a translator for meetings and for information that is sent home for signatures. Information should presented in English and Spanish. • The community should be made to feel welcome at Del Valle, but should not be pressured to participate. • Cesar Chavez Academy has a ninety- percent level of parental involvement. Many local businesses support the scholarship fund-raiser. • More parent involvement is needed. All parents, including those who work, need to be involved in school activities to enhance students' success. • The level of community involvement has increased at Bel-Air High School. • The community supports Bel-Air High School. • More parental involvement is needed at the junior and high school levels. Ramona Elementary school has exemplary parent programs that take parents and students on field trips, including economically disadvantaged parents who otherwise could not afford to go. • Parents should be educated in their children's development.

• High school students should help the community through volunteer programs such as elder and day care. Personnel Management
• The principal at Glen Cove Elementary School hires personnel based on friendship rather than qualifications. Thus employees try to befriend the principal to get their relatives and friends hired. • Schools need teachers who are generalists, not specialists. • Teachers should be educated as to the latest research in children's language acquisition. • Support personnel needs more staff development. • Principals and Mr. Trujillo should be given the authority and responsibility for employee hiring and firing in order to hold them accountable for these decisions. • Teachers are being overworked and underpaid. This should be corrected. • Salary increases should be reviewed since salaries represent about eighty percent of the district's budget. • A teacher with seven years of service was reassigned, which seems like a questionable decision. • Hanks high should provide parking space for faculty and staff. • The school should hire clerks and staff who want to work in schools. Students shouldn't have to face clerks who have negative attitudes. • Also, counselors are not receptive to student issues. • Some teachers do not seem to care about students or are afraid of them. • The district should cultivate internal candidates instead of paying external consultants huge sums of money. • Teachers should have due process so that they cannot be arbitrarily transferred to the warehouse at a principal's discretion. • There should be a better system of checks and balances so those incompetent teachers can be replaced swiftly. • Teachers often miss school to attend workshops and are replaced by substitutes in the classroom. Perhaps they could attend workshops outside of school hours and be paid for their time. • Personnel issues seem to be handled efficiently. • Cesar Chavez has an organized hiring team, and staff development is emphasized. • The pay scale for entry level administrators is ridiculous. In order for a teacher with 15-20 years of experience to enter administration, they have to take a $5,000 to$10,000 cut in pay. If we want experienced instructional leaders on the campuses, then we need to be willing to pay for them. • Our principal is always looking ahead to try to benefit students at Parkland High School. Principals in this area work together to the advantage of the students. • Local schools should have more hiring power. There is considerable hiring power, but sometimes schools are forced to hire someone against their wishes. In addition, attention is needed in math, science, and technology. A college graduate makes twice the starting salary of a math or chemistry teacher, so it becomes difficult to find qualified candidates for the positions.

• The personnel department makes hiring difficult. The district needs a professional certification officer to contact necessary state officials. • Staff development must focus on campus needs. Many goals are more important than being a TAAS recognized schools. • Schools are overly restricted by requirements for certifications and degrees in specialized areas. A band director for example, should not be required for a bagpipe band. • The staff is very organized with the students. • It is excellent that schools solicit input from students and parents on the proper levels of staffing and student identification to ensure students' safety. • School personnel should receive raises. • The political aspect of hiring and recruiting at Del Valle should be eliminated and the community should provide input on the qualifications of personnel being hired. • If the superintendent merits a bonus or raise, then teachers, who directly impact students' success, should merit the same incentives. • The middle school math teacher and program were superior to the one in high school. • Teachers do a good job and they deserve good salaries, just as managers do. • Some teachers in magnet programs are not qualified to teach. Just because someone has work experience in a certain area doesn't mean they are qualified to teach. • Money should be spent on staff development at schools. • It is unclear whether YISD has true magnet programs. • High school students should be taught moral values to help them function in society. • Students should be taught better social and coping skills. • All pregnant students and their partners should have parenting classes. Asset and Risk Management
• Perhaps bond issues are not being pursued aggressively enough as evidenced by the fact that the district's facilities need so many construction and building improvements. • The district should keep the community better informed about any planned changes in insurance carriers for the district. Many teachers lost cancer insurance last year because the district did not use the established method of changing and revising- insurance coverage. • As an employee I am very satisfied with the insurance program offered in our district. • Insurance programs run effectively at the district. • Asset protection has improved with graffiti removal. • YISD, like other districts, should be named as the beneficiary in the superintendent's life insurance policy. • Asset protection is non-existent. Large amounts of money have been lost to theft and not replaced because of high insurance deductibles. • New elementary schools are needed to expand communities. Rapid implementation of the northeast building plan is important. • Teachers should be able to use sick leave for other types of absences, such as maternity leave.

Financial Management
• Some schools have no budget committee, and cannot get budget information from principals or the district office. CEIC has not seen a budget in at least two years, and has no financial accountability. Principals seem to be conducting their own fund-raisers without CEIC knowledge. • Budget information is essential. • Tax credits are needed to put children in private school. • It is unclear how special education funds are spent. • Parents should be able to review school budgets. • Building budgets should be more fairly allocated, for example as regards portables. Vista Hills Elementary has 19 portables. A new wing has been on the waiting list too long. • Each school should have an open budget tha t parents can review. • Schools should report fund-raising activity and results. Glen Grove raised $24,000 last year and $10,000 was spent on students. The rest of the money was used to relocate the computer lab. This money should have been spent on students and schools. • All schools are funded on a per student basis, however, chapter I schools receive federal money as well. Schools that don't qualify are left without the funds to implement new programs or keep abreast of new technologies, which leaves students at non-chapter I schools at a disadvantage. Both exemplary schools are chapter I schools and can fund many programs and services. Mini grant dollars should be used to make school funding equitable. • Budgets are allocated to schools based on student enrollment. This is a good policy. Previously they allocated budgets equally regardless of varying schools' needs. • Large items such as the student entrepreneur center, IMAX and the superintendent's contract should be reviewed. • An internal audit is needed for all areas because there are no checks and balances. • The public needs an honest accountant to monitor spending. • I suspect fraud. YISD should have an audit done by a big six firm. • Teachers should be recognized for their dedication. • We are losing teachers to El Paso ISD (EPISD) and Socorro ISD (SISD), because they pay better. YISD has a large number of new teachers who transfer to other districts as soon as they gain additional experience. • Better pay would attract and keep experienced teachers. • Teachers at the upper end of the pay scale should not be discriminated against for pay raises. • The district should not use old buses because it is not cost effective to operate them. • Money is spent on radio, TV, and newspaper ads each month. Thousands of dollars are wasted advertising the student entrepreneur center. • Principals, not the superintendent, are responsible for budgets. As a result, principals may need more continuing education courses on finance. • Functions such as bus maintenance and accounting should be consolidated.

• The district should freeze all taxes until the year 2000, and learn to budget on a fixed income. The district does not have money problems, it has management problems. • Payroll personnel could be more polite in handling conflicts. Everyone should be paid every two weeks, not just support staff. Monthly payroll is outdated and inefficient. • Taxpayers have little input into how district funds are spent. The board and superintendent claim to be doing a lot for children through projects such as the IMAX Theater, but theses projects do not seem cost-effective. • I feel an IMAX would be a good use of money, and would offer the district and community an alternative income source. • I sit on two CEIC's in the Parkland area and the principals consider members' input before deciding how to allocate money. • Finance department budgetary policies are very restrictive when campuses are trying to get a request filled immediately, and need a check cut the same day an item is purchased. • Academic organizations need additional funding. • The budget and finance departments need training in schools policies and procedures. • Previous budget funding has forced the present administration at Del Valle to reduce teacher's classroom budgets, which impacts students. Students should not suffer because management fails to monitor the budget. • Salary increases should be given to lower level staff where it is merited. Wages for top administrators such as Trujillo should be reduced to more reasonable levels. Purchasing
• Cesar Chavez Academy needs more textbooks. • The Purchasing department procedures and practices should be thoroughly reviewed. Contracts are revoked 30 days after distribution. • Purchase orders take too long to process. It is not cost-effective to have certified personnel working in the warehouse. • Food service should improve the quality of raw materials supplied to schools. • The district should be accountable for spending tax dollars. • The warehouse is very restricted on the bid process-staff can purchase less expensive items at local stores! Why have a warehouse if it can't buy in bulk and get good discounts. • If teachers are going to use the new computer system for ordering supplies they need training and a reference book. Teachers should fill out order forms, but secretaries should input the information. • Procedures and paperwork should be simplified. • Teachers do not have the materials they need to teach. • The budget is too low. Manuals are never received if a teacher is moved to a new grade level. • Schools need safe and adequate science equipment and labs. • The district could save money by not having to order from designated vendors. • The bidding and contract processes are unclear. The district does not always take the lowest bid, and when this is pointed out, the district has to pay two contracts.

• The district has a bad image with the business community, especially this year with the re-opening of bids with El Paso banks. • The number of construction and bid overruns in the district should be evaluated. • Purchase orders take too long to be approved. Schools often pay higher prices to vendors on bids. • Allowing bids to expire before new ones are prepared wastes money and time. • Purchases should be consolidated across school districts to get better prices, and the process simplified. • Purchasing entails a lot of red tape, particularly at the state level. As someone who administers grants and runs a department, I find it very frustrating to be constantly told by central office staff that the things I need for my department cannot be ordered because of state regulations. • Central office procedures hinder service to students. The staff is insensitive. • Competitive bidding is very restrictive when you are under time constraints, possibly raise the amount for what has to be placed on bid. • Many "bid items" can be purchased elsewhere for less. • The bidding process is not the best. Many "bid items" can be purchased elsewhere for less than the bid price. • The district should have central office support, not hinder the campuses by delaying "process". • More personnel should be hired for this department to run more efficiently. Computers and Technology
• Tierra Del Sol Elementary no longer has a computer teacher. • The computer lab is being dismantled; there are only 14 computers left. • Cesar Chavez Academy needs more computers. • The computer lab has been taken away from children at Pebbles Hills. • Pebble Hills Elementary has had no computer classes since last year. • We have computers in school, but basic typing skills don't seem to be taught. • Every classroom should have access to the Internet. • Speed up implementation of the new financial software system! • Computer literacy for students should have the highest priority in every aspect of education. Our children must have these skills to compete in the twenty-first century. • Technology is said to be a priority, but we have no funds to continue a computer lab and only have one computer per class. How can our kids become computer literate with only one computer per class? • Any schools requiring computers for their labs should contact logistics division at WBAMC 569-2827/26. • Schools need more upgraded computers. • We need more computers that work. • Those responsible for assisting students in computer technology should teach clearly as teachers without using jargon. According to them someday they will have modems and Internet available. They should deal with what they have now instead of worrying about what they are going to have someday.

• The district is far behind in computer and technology. • Other districts require students to have one hour of computer time daily. • More computers are needed for students to use. • Our zeal for computers and technology should not replace basic tools such as pencils and paper. Basic tools and technological skills are both critical elements of a well-rounded education. • Eastwood High needs a new computer lab. • Good computers should be accessible to the students and faculty, but if these privileges are abused, they should be withdrawn. • Schools need computers that work. • Computer labs are vital to implement technology at an elementary campus. No teacher can effectively teach her students computer skills with only three computers in the room. • Computer rooms should be open in the evenings. • The district buys computers, but computers are not available for students to use. • The decision to purchase computers rests with the principal and staff. It is crazy to believe that my daughter did not have access to a computer when she took a microcomputer class at EASTWOOD HIGH SCHOOL! I suggested a rotation plan to the principal so all students could have access to a computer. She ignored it. Responsibility for such decisions needs to rest on the principal-not Mr. Trujillo. • All schools should be online. Special fund-raisers should be held to help purchase computers for individual schools. • The district promises a lot, but offers no real help. • Because of district funds, technology improvements are slow; but need improvement. • We need to determine what system we are going to adopt. We use conflicting technology all over the district. Let's bite the bullet and get on with it. • We have not made any progress with this program; it is time all district schools were updated. • Grants are needed to assist with funding. • Technology is growing. • MIS should provide stronger technical support. • Computers play a big part in education at Cesar Chavez. Many of these students become computer literate. • Long range plans are excellent, but greater MIS support is needed at the campus level immediately. • Schools need more computers to be brought up to par with other schools. • We want schools in the northeast to be equipped with the technology that will make our students competitive with students all over the country. • The northeast schools, especially Parkland High School, need district support to be brought up to par with other district high schools in the area of technology. • There has been a growing recognition of the importance of technology. Money has been set aside to purchase technology, but more technical support and training is needed. Right now it takes months to get a computer repaired. • Computers and software should be updated. • More staff is needed to handle all of the schools computers. • Technology staff should be placed at the campus level.

• It is so disappointing that the district supports the acquisition and implementation of technology but lacks an informed technical staff to support campus problems and situations. • It is disappointing and frustrating to work with MIS. • More advanced technology should be introduced in the schools to help students. • More than one high school credit in technology should be required to adequately educate students in the use of computers. • Some elementary schools are considering getting rid of their computer labs, which seems like a step backwards. • At Del Valle, when budget funding is held until school starts, students are not given the proper equipment and technology. • Technology is very important at Cesar Chavez Academy. All students seem very literate in computers. • All schools need computers, not just "special" schools. • More computers are needed for accessibility. • More staff is needed to support schools or provide a technology person on campus. • More technology is needed at all levels. Students must learn multiple languages to compete globally. Facilities and Use Management
• The bathrooms at Glen Cove are filthy and I have discouraged my children from using them unless it is an emergency. I wonder what the teachers' restroom looks like? • The swim team at Hanks High School has not been issued lockers for their swimming equipment. Swim team members must carry equipment to class, yet all other sports tams have lockers. All high school students need lockers. My daughter developed a back problem from carrying thirty pounds a day. • The question is-which campuses have no portable classrooms? Unfortunately, permanent classrooms cost money. • Custodial staff at Tierra Del Sol keeps the school in great condition, even with constant cuts in staff and funding. • School facilities, especially high school facilities, need to be made available to students after school- Tierra Del Sol need to be open to the public on Saturdays or evenings. • The review team should examine the districts building programs. • Custodians should clean Tierra Del Sol. • Glen Cove school is not performing crossing guard duties. • Building an IMAX theater and the student entrepreneur center is a waste, when we have no fine arts for K-5. Don't even think about it (IMAX theater)! YISD is not in a position to risk their dollars on this type of business venture. • The district should provide after school supervision of kids until parents pick them up. • Charge the parents who use this program much the same as the YWCA does. After all we are providing the facility for them to make money. • Trash is scattered all around high school. Schools should take greater responsibility for better maintenance. Schools do have equa l facilities in terms of conditions and supplies.

• Students should police the grounds each day for litter; they are old enough to take care and have pride in school. Teach them not to litter their neighborhoods too. • Students and staff need more access to school facilities. • The bathrooms are very dirty. Soaps or toilet paper are never available in the students' bathroom. • The bathrooms are very filthy. Eastwood High School has one without faucets. • At Eastwood High School the PA system is ve ry ineffective. • The air conditioning does not work most of the time especially when it is hot. The same applies to the heater. • All classrooms need sinks. • East point has too many cottages, and has been bumped from the construction list numerous times. • Bathrooms need bigger stalls. • If we had better financial management, we could use our funds wisely to provide these services. • At one school, the air conditioning is not working in the cafeteria and in the band room. • Some football fields need to be repaired. • Bathrooms at Eastwood High School are smelly and clogged. • I feel that the band room at Eastwood High School is inefficient. The students work hard and cannot change store instruments, etc. It is probably unsafe. • We need more soap, toilet paper and sanitary-machines. Bathrooms should be cleaned often. • Many water fountains do not work. • Schools need more joint use of facilities. • Pebble Hills lights the parking lot, but not the field where scores of people walk every night. Eastwood Knolls orchestra and band classes meet in a regular classroom designed to teach reading. The room is too small to accommodate 50-60 students- it was designed for a regular classes of 30-35 students. • Eastwood high School is a dirty, poorly maintained school. Last winter when it snowed, an ice pack about 4 inches thick was never removed in front of the gym. Someone could have gotten hurt. • Several parts of the bleachers have been broken for over two years now and they still have not been fixed. If someone gets hurt, the school rather than the district should be sued. • We need a new school as soon as possible. • Parkland High School is the only school in the district without a dance room or a computer center. • The facilities at Parkland High School are not adequate for special education students. • The maintenance department should spend more money on supplies to maintain the schools rather than on excessive personnel. • More space is needed in the northeast area. I feel we have been neglected long enough. • Parkland needs another elementary school. • We also need construction to begin in this area.

• The school conditions at Cesar Chavez are never neglected, custodial services are great and Cesar Chavez is growing. • Parkland High School should have more work centers, and a dance room. We are one of the only schools without a dance room. • There should be a better system for evaluating custodians' work. Many custodians are doing very little work. Tax dollars should not be wasted on people who do not want to work. • Parkland Elementary School needs a lot of work, especially the bathroom facilities. They are dirty, smelly and often do not work properly. • I have been here for six years. I have heard that a new wing has been planned. Facilities, although maintained well, are inadequate for the student body. The proposed wing is a great improvement, but additional money is needed to renovate the older structure. • The northeast is shamefully neglected. Students do not have equitable access to science labs, computer technology, or classrooms. Maintenance of existing buildings is also neglected. • The high school was originally built as an elementary school, and needs to be renovated to reflect its current use. • Groundskeepers do a wonderful job keeping up with all facilities. • Some buildings, although remodeled, are still inappropriate for student population and needs. • Gym space is limited. Not all students or parents can fit in the facility used for assemblies and meetings. • Portables are not conducive to learning. The school needs a new wing to accommodate students. • Bathroom facilities are too old and inappropriate for students' needs. Students must travel long distances to use facilities and there are not enough commodes to accommodate the entire student population. • The band room is too small for such a big band. More band rooms should be constructed to meet demand. Bel-Air High School's band room is small and very old. This project should be top priority. • The side entrance to the school is not paved. It gets really muddy when it rains and everyone has to go around the school to get to a sidewalk that is paved. It would be helpful if it were paved or had grass so everyone could enter the school through several entrances without getting muddy. • The basketball courts are not straight and the water stagnates there when it rains. • Restroom facilities need to be kept fully stocked. The custodial staff is excellent. • Restrooms need soap and hot water for students to wash their hands. • Responsibility for maintenance budgets should be decentralized. • Campuses should be made accessible for the disabled. Restrooms should be kept stocked at all times. • Cesar Chavez Academy is always very clean and beautifully maintained. Custodians do a great job. • The girls' bathroom is dirty and toilets often do not work. • Outdoor field facilities have inadequate space.

• Bel-Air needs a new field house. • Community service programs at Del Valle should be instituted at the schools to assist custodial services; they should not be denied because of the high cost of paying overtime to the supervising custodians. • More programs are needed at all levels to educate parents about child development. Programs such as the YISD Pre-K Center should be encouraged. • The open enrollment system is a good one. • Dogs and police should be available to deter drugs on school grounds at all junior high and high school campuses. • Facilities at Prado Pre-K are run-down and dirty. Bathrooms at Scottsdale smell bad and are dirty. Transportation
• Cesar Chavez Academy transportation facilities are unevenly distributed. • New charter buses bought by the district are always breaking down. • Victor Valdiva is very disorganized and unreliable. We need good support from the department. • There should be transportation for the students that participate in sport activities after school. • Some buses need air conditioning. • Buses should be on time • More buses offered for students that ride. • It should not cost more for students to use the district's bus than to charter a private bus. • Disabled children were left on a bus. The excuse given was a substitute driver! • The district's bus broke down while out of town. If we charter private buses will they be more reliable. • EPISO should have the first rights to use the chartered buses YISD bought. • The district needs longer bus routes. • The district needs larger buses that are kept intact. • Buses are never on time. • While the "big white buses" are a good idea, they seem to have a lot of problems keeping them operational. The problem could be in the transportation department. • Bus drivers should not be allowed to bid on and select the routes they want. This should be a site-based decision, so we can remove bad drivers. • Bus pick-up is too early. My son attends Cesar Chavez and the bus picks him up at 6:45 a.m. to attend school at 8:15 a.m. That's too early, especially in the winter. • Parkland Elementary is congested because cars and buses are dropping off and picking up children at the same time. There are small children beside, behind and in front of the buses. • If the buses could pick up and drop off the students in front of the school, on Quail Avenue, it would be safer and less crowded. • MCI buses are a waste of money for YISD. This money could be put to better use in upgrading the regular school buses and the educational programs.

• Someone needs to look very closely at the transportation supervisor and his practices. • District boundaries should not lie at busy intersections where children have to cross the street without the assistance if crossing guards. Buses should be provided instead for students at Eastwood Middle School. • The bus transportation is well scheduled at Cesar Chavez. Students are never late and this helps the schedule at Cesar Chavez run smoothly. • It is difficult to use the bus service because buses run only during certain hours. This often means students can't get to events or they have to leave class early. • More vehicles should be purchased to accommodate student needs. • The present overcrowding of buses is a safety hazard and should be addressed before a tragedy occurs. • The district needs more small buses or large vans and flexible time schedules to accommodate student needs. • Parents transport students at Cesar Chavez. Buses always run on schedule, so there is no problem. • Transportation needs to support student activities more effectively, and also needs better accounting methods and procedures. • The lack of organization in the transportation department causes problems at Del Valle. Students are bussed to other middle schools that do not feed our high school when our feeder school is within four or five blocks. • More money should be spent on improving transportation. Last year's band trip to Midland was terrible. Buses broke down and several drivers got lost. Transportation needs to be provided for magnet students who live out of district and participate in extra activities. Food Service
• The serving portions are sometimes too small, but overall the food service department is doing all they can do with what they have to work with; meal prices are too high for what they get. • A snack bar should be offered for students who hate the menu. • The quality of our food must compete with that of the private industry or we lose our students dollars and confidence. If the district cannot do this, let private industry compete. Have you seen the line outside McDonalds across the street from Hanks at lunchtime? • Cheese nachos should not be served at lunch. • It is unclear why lunches are free during the summer. • Better food and nutrition are desperately needed. • Food trays are prepared and left on the counter before students are lined up, so food gets cold. The district needs better food. • Students complain about the length of the food lines and that they have to eat quickly. • Why are lunches so expensive during the school year, yet they are free during the summer? • Food service does a great job with limited staff. • The hamburgers are slimy; students need more variety, and better-cooked food.

• Privatizing creates profit; it does not help students. • Schools need more coke machines and better snack machines. • School needs more variety and better tasting food on the menu. • Schools need to avoid privatization. • I cannot afford to pay for lunches in the schools for five children, so my children bring sack lunches. It would be more equitable if the low-income children were offered sandwiches or cheese and crackers instead of cooked meals. • With the amount of food thrown away, everyone at each school could eat for free. We waste a lot of food. • The quality of food at Cesar Chavez is great. Food is always served on time; the staff is friendly and the facilities are very clean. • The school menu should appeal to students. • Adult menu choices are needed. • Menu choices should be more nutritious. There are too many high fat foods being served. • Cafeteria service needs improvement in many areas such as food quality, quantity, portion size and temperature. Food prices are also ridiculous. • The cafeteria managers' guidelines are too restrictive. • Although the schools are under federal guidelines and cannot serve certain items, the students prefer regional foods such as menudo, which are not allowed to be served. We would be more cost effective if managers could buy menu items that students would eat. • Parents are unhappy about the food at the school and students don't like it. The school should offer more nutritious foods. Give students food they will enjoy and not throw out. • Food service at Cesar Chavez is very good and offers a large variety. It is always served hot, and the facilities are very clean. • Although nutrition is important, it is also important to serve food that students will eat and not waste. • More site-based decision-making is needed at the campus level. • Outside vendors such as Pizza Hut and McDonald's should be allowed to provide food on campuses. • Getting vendors may keep students on campus and out of trouble. • The food is good. • Sometimes the food is too fatty. • More green vegetables should be offered. • Food is being thrown away; this excessive waste should be prevented and the funds used for other school needs. Safety and Security
• At Tierra Del Sol Elementary class sizes of thirty students in fifth and sixth grade make classroom management teaching and discipline difficult. • There is a huge concern for our children's safety at Glen Cove Elementary. Incidents are not being handled properly and effectively. • The dress code is not consistently enforced. • Schools need stricter discipline program!

• Students need to be made responsible for their school facilities. • Security guards from Hanks should have noticed the students across the street smoking marijuana. • Parents need to be more involved with the security of their own school. After all it is their children that are usually the cause of most of the problems. • Along stricter discipline-there also needs to be respect for students in implementation of any disciplinary action. • Teachers are allowed to do this because the principal allows it! • Teachers should show more respect for students, not just the other way around. • With policemen on campus personnel tend to feel more secure. • Schools need more security. The security officers we have are great but underpaid. • Security guards flirt more than they patrol. They should quit socializing and do their job. • Security is not an area where incompetent workers should be. • Hire more security guards; need to watch the cars at all times. • Need more security in the parking lot! • We need to make the school safer for our kids so that they will concentrate on school and not worrying about gangs and violence. • Riverside Middle School needs a drop area for the students and parking for visitors and parents. There is only parking for staff/teachers and parents cannot drop off their children in front of the school. • The pay phone in front of Riverside Middle School is not working. • They should be more worried about keeping the school safe than winning a popularity contest. • More security in parking lot. • Security guards should not even fraternize with the hoodlums they bust. If the idiot kids need an example, they should go to their teachers, not the people responsible for handling them when they commit crimes. • We need more security to watch cars and protect school from violence. • If religious teaching is out then moral teaching should be in on a daily basis to erase graffiti and undesirable behavior in and out of classes. • You cannot love your country and destroy property-teach honest and true patriotism. • At Thomas Manor students are playing at the city park unsupervised. • As an administrator of Cesar Chavez Academy, I changed last year from district security to off duty police officers. You will not find tagging or vandalism at the school. Eastwood High School is covered with different gang tags. • I worry about the elementary school being to close to the high school. Please keep the high school kids off the Parkland Elementary campus. • El Paso Police on secondary campuses should handle security. • Policemen as well as drug-sniffing dogs should be used in the elementary as well as the middle schools. • At Cesar Chavez, security is always alert. Safety is a priority at the school. More emphasis should be placed on the "Zero Tolerance" for violence and drug policies. It seems that most offenders get a slap on the wrist and return to continue disruption in the school.

• Non-coercive environments are necessary to ensure student learning. • Students that sell drugs to other students should not be allowed to return to the same school. • The use of hall monitors cuts down on truancies and graffiti. • Additional security officers are needed at some of the campuses. Support is needed from all personnel at central office and campus level on discipline management. There should be a policy of zero tolerance. • It is unfortunate that although many campuses have been remodeled, improved and have had a high level of technology infusion, the district has not installed a cost effective "security alarm" system at these campuses. When there are break-ins, money is never recovered and replacements cost twice as much. • Emergency alarms should be audible not only inside the building, but all the way out to the portables. • It is a shame that some security guards show so little professionalism and respect to our kids and parents at Del Valle. These security guards are transferred from one school to another rather than being dismissed. • Having uniforms will help protect students from gangs. • With site-based security there is no need for a central command. • Part-time police department staffing seems adequate to address security needs on our campus. • Uniforms are a good idea for Bel Air. The school needs metal detectors with security guards monitoring doors. Problem students should be expelled for the safety of those who want to learn and teach. Administration needs to back up security guards and not back down just because parents and students make threats. Security guards need to be at all special events, because they know the students better than police officers do. Better control is needed in the classrooms. YISD policy should be followed. • Dogs to sniff for drugs should be available throughout the schools. • Applicants should be screened for past drug use. • School uniforms help to distinguish students from outsiders. • The junior high and high schools are not drug-free. • Uniforms should be mandated by all to ensure the children's safety and to place a greater emphasis on education. • School should require a stricter dress code that requires that young boys have short hair, keep their shirts tucked in, and wear belts. The code should ban young boys from wearing T-shirts, ducktails or earrings. • Students should be taught to care for books and keep them covered to emphasize the importance of books and education.

Appendix I Focus Group Comments Several focus group sessions were conducted during the early stages of the review process. Groups of parents, volunteers, district personnel, community and business leaders, as well as the general public were invited to participate in the sessions. A variety of individuals representing various Ysleta Independent School District stakeholders were interviewed, including:
• El Paso Learning Disabilities Association of Texas • El Paso Collaborative for Academic Excellence • Churches and Religious groups • Private businesses • Concerned Citizens • YISD Taxpayers • Colleges and Universities • Various El Paso Chambers of Commerce:
o The Greater El Paso Chamber of Commerce o The Hispanic Chamber of Commerce o The Black Chamber of Commerce
• Ysleta Council of PTA's
Information obtained from the sessions helped guide the review team through the management and performance review. The following is a summary of the comments received from the focus groups. Comments received from the groups follow. The opinions expressed, which are listed by the topic, are presented to illustrate community perceptions of YISD and do not reflect the findings or opinions of the review team. District Organization and Management
• The School Board is overly involved in management. They should only deal with policy issues. Management decisions should be left to the superintendent, Mr. Trujillo. • The goal of the school board after the Texas Education Agency (TEA) master left YISD was higher quality education for all students.

• The school board faces personality conflicts and in-fighting which detract from the educational process. • The superintendent focuses attention on having all students achieve at high levels at YISD. • Mr. Trujillo visits schools in the district and talks with teachers. • The superintendent is not responsive to complaints and concerns of parents against principals. • The board does not carry out its fiduciary responsibility and has given its power to hire, fire and evaluate to the superintendent. • The board has given the superintendent powers that should be dictated by board policy. • Neither teachers nor principals have recourse beyond the superintendent. • The superintendent is very dishonest. • Board members who have interest in business get school district contracts for services, e.g. landscaping. This is a conflict of interest. • Board members do not consistently follow policy, and suspend policies when convenient. • The superintendent is doing a great job. He is very concerned, accessible and responsive, especially on students' issues. Friction with the board seems personal rather than district related. • Personality conflicts sometimes seem to take precedence over student issues. • Politics drives policy-setting and decision-making. • There is no public input during open forums; it is an open forum in name only. • Community participation is not encouraged. • Site-based decision-making management exists in name only; teachers aren't always involved in decisions; this system works better at some campuses than others. They are "democratic dictatorships". • The superintendent puts students first; and tries to effect positive change as regards to students despite the fact that his hands are tied. • The superintendent should clarify his stance on media issues through stronger public relations. • This is a large, well-run school district, and has been around a long time. • The school board is diverse, open and receptive. • The school is willing to let the district experiment. • An active approach to remedial programs is encouraged; site-based management allows schools to tailor their responses on various issues. • The board and superintendent do not portray a united front. Although both parties have students' interests of students at heart, they may have different approaches. • It is unclear how friction between the board and the superintendent impact teachers' morale. • The board and superintendent need to set aside personal and political agendas. • There is a disparity in principals' attitudes toward encouraging staff development for counselors and teachers. • Site-based management is positive; because it involves the community. • The public misunderstands the mission statement; elitists feel it to diminishes importance of two-year degrees.

• The perception is that in-fighting between board members and the superintendent resulted in neglect and backlash toward the school, which trickled down to students and staff. • The board has translations from English to Spanish but not the reverse. • The school board gave the superintendent the power to hire and fire, hear grievances, and respond to the community. This power was written into the superintendent's contract, the board has no control of the superintendent. • It has become difficult to get on the board agenda. Previously, citizens could get on the board agenda by going through the board member representing their district. Citizens must now go through the superintendent, who is non-respons ive on certain issues. (for example, a thirteen years old student was subjected to verbal assault by a teacher, yet it took a while to fire teacher). • The superintendent is making too much money for the job he is doing. • The superintendent is getting rid of African American teachers. • Site-based decision-making management is not effective. When parents and community members come to the central administration for something, site-based decision-making management is used as a scapegoat to delegate responsibility to the schools. • The District Education Improvement Council (DEIC) hand-picks Campus Educational Improvement Council (CEIC) members, who are cronies of the superintendent or area superintendents. • The district is extremely disorganized and poorly informed about of federal and state law. • There is no trained leadership. • The superintendent is not aware of what is happening in the district, and does not want to know. • The superintendent is not accessible. • There is confusion and chaos at board meetings. • The superintendent is not interested in understanding his responsibility to abide by laws regarding students with disabilities. • It is unclear how special education funds are being used. • At board meetings the same issue comes up repeatedly and is never resolved. • There is no response to written requests. • There is lots of talk, but no answers. • The board is a joke. • The superintendent and board should spend as much time with student performance as they do with their power struggles. • The board focuses on egos more than students do. • The negative board atmosphere trickles down to students. • One of the reasons that teachers' morale is low is that the superintendent's salary is high. • Overall, the superintendent has done a good job, and has brought in innovative programs. • The superintendent must fight the board tooth and nail to get his programs across.

• The superintendent upgraded facilities in the lower valley and the northeast where he perceived the need to be greatest. • Site-based decision-making management does not work well; parents who sit on CEIC have their opinions ignored. The parents are there as window dressing. • Site-based decision-making management has created many "tyrants"; for example principals have absolute authority over all decisions by CEIC. • On some campus CEIC's, parents do not receive minutes of meetings. • Teachers miss having a level of supervisors between cabinet level and principal. • Central administration needs to do a better job of administering the district. • There are too many people in central administration with titles but little responsibility. • Under the site-based decision-making management programs, it is more difficult to get approval for expensive than those and are free. • The board fights too much; factions become personal. • The superintendent is doing a fair job. He has goals and a vision. • Site-based decision-making management depends upon the leader as to how well it works. • There is constant fighting between the superintendent and the school board. • The superintendent is not accessible. • The superintendent does not listen; it is either his way or no way. • Policies are put into action without the board's approval. • Schools can function autonomously. • Principals move around every two to three years in high schools regardless of how good a job they are doing which makes cohesive planning difficult. • YISD has innovative career and technical programs that are the best anywhere. The superintendent does not acknowledge the benefits of these programs; he thinks all students need to go to colleges and universities. • The school board members have personal agendas rather than education policy agendas. Educational Service Delivery & Performance Measures
• The delivery system has been streamlined since Trujillo came. • The programs implemented in the last three years are better aligned with the goals of improving student achievement. • Higher standards are evident in many schools. As necessary, Mr. Trujillo help all schools and programs achieve these higher standards. Special programs, such as special education have not been integrated as a part of these revised standards yet. • The revised, higher curricula standards need to be made clear to all schools and pushed by the district. • The needs of gifted and talented students are not being addressed at some campuses. • Scholarships, including those through the dropout and recovery program, are disproportionately awarded to Hispanics at the expense of blacks and whites. • Bilingual standards are not consistently applied. • Bilingual classes have a much lower teacher to student ratio than do regular classes. • Several physical therapists have left because of salary concerns.

• The curriculum is biased toward the Hispanic culture. • Black History month is ignored in the schools. • Some students are not challenged to function in an English-speaking environment. • The needs of special education students should be met as well. • The superintendent goes the extra mile to ensure that programs for special education students are implemented and successful despite the resistance of the board. • Special education programs were effective and cared about students' needs. • Schools appear to have a gender bias. For example girls were discouraged from pursuing traditionally masculine courses such as auto-mechanic and woodworking. • Beginning fall 1998 students will have to take TASP before entering college. The way in which YISD prepares students in this area could impact financial aid. • The Science and Technology school is excellent. Vocational programs at Riverside High are also good. Students praise the quality of these programs. • The question is whether facilities will be adequate for future educational delivery. • The international school has excellent teachers, and a strong track record of college placement. • Although there are good counselors and teachers at YISD, it is unclear to what extent career counselors help juniors and seniors who are neither vocationally nor academically excellent. • It is unclear how YISD addresses the issue of adult education. • YISD does a good job in the area of bilingual education. • Although summer school is an excellent concept, in theory it falls short of its goals. • YISD should better prepare students for the workforce. YISD should solicit input from business on how to prepare students. • Bilingual education is used to discriminate against non-Spanish speaking cultures; Bilingual programs should be made available to other non-English speaking culture, and African American students. • Bilingual appears to be only for Hispanics. • Languages other than Spanish are downplayed by the district. • YISD's mission statement proves that only Spanish-speaking students can get into bilingual programs. • YISD has done a good job preparing students to pass the TAAS test. • There is too much emphasis on TAAS testing, which does not teach students to be critical thinkers. • African American students are deficient in English, reading comprehension and math skills, yet YISD is not working to correct this deficiency. • African American teachers are given a higher percentage of students who are slow learners or have disciplinary problems, which subsequently hurts their performance evaluations. • Diversity training is needed for students, teachers, and administrators throughout the school district. • There are serious African American/Hispanic racial problems within YISD that need to be addressed. • Programs are not tailored to individual needs. • The district lacks planning.

• Teachers are poorly trained with regard to learning disabilities although this training is mandated by law. • It is unclear who is enforcing curriculum-accountability. • Students with learning disabilities are not identified early enough. • Students should be tested on all subjects, not just subjects related to TAAS testing. • The no pass no play policy has a negative effect on students with learning disabilities. • Parents are asked to bill their insurance companies for evaluations and services. • Services are being denied due to lack of funding. • Unaccredited teachers are employed to teach, as for example in special education. • Students complain that they do not have enough books. • Teachers are responsible for enhancing student performance, but are not given the appropriate tools. • There is too much emphasis on training teachers for TAAS. Schools use substitutes when teachers are out and they only copy teaching materials rather than teach. • My daughter's teacher has been absent two or three times per week since school started, which impacts students. • YISD places too much emphasis on TAAS; students are only learning generic information. There is too much pressure put on principals and teachers, and it is affecting students. • YISD should implement remedial programs after the third grade if students cannot read. Students need basic skills to be successful. • Special needs students are not always identified early, and as a result remain in a regular setting. • Students should not study video arts in middle school; this topic is better taught at the high school level. • Early diagnosis of special needs students is critical and needs to be consistent. • Parents need to be educated on the pros and cons of evaluating special needs students. • YISD should educate parents about TAAS testing and grading. • YISD is no longer teaching fine arts at the elementary school level. • YISD is deceiving community and parents by saying that teachers are not teaching TAAS, when they are. • Students are aware that teachers are evaluated based on TAAS and sometimes fail tests deliberately to get rid of teachers. • YISD needs to teach students about the potential for international commerce in El Paso. Ysleta loses eighty-seven percent of the top two percent of students to other communities. • Programs change frequently. • Magnet schools are new, so it is difficult to judge their effectiveness although there is student interest. • Grants are written for basic supplies that the district should provide. Community Involvement
• A feeder high school: Feeder high had the opportunity to showcase its school and students at the board meetings.

• Summer school tuition is free if parents spend one to two hours per week in each child's school. Parenting workshops are held at the schools and universities. • YISD should increase the number of parent centers staffed to teach English as a Second Language (ESL), citizenship classes, technology training, innovative initiative and prenatal classes. • YISD administrators are talking to the community about YISD. • There is good communication between schools and parents. • The local media often sensationalizes stories; for example when board members quibble. The media misrepresents education issues and often presents the superintendent in a positive light. • The district does not have an open-door policy. • Parents often get involvement only if there is a problem. • The superintendent's dictatorial style does not encourage parental involvement. • EISO (a religious organization) has inappropriate alignment with schools. • Hispanic parents are given blatant preferential treatment in adult enrichment classes. • Spanish language dominates district communication and promotion materials. • Public relations regarding district is good if the program or agency initiate it. • Public relations for superintendent needs to be stronger. • Parent participation seems stronger when program is held on campus. • Parents should be more directly involved in the learning process. • Summer programs should have involved parents, but was not effective. It is easier for parents to pay than participate in summer schools and pay no tuition. The time frame for parent attendance is flexible. If parents did not speak English there was no translation. • Site-based management recruits parents to work as a community. Parental involvement in school issues is good. • Media attention should be shifted to highlighting the issues; stronger public relations are needed for model programs. • Sensitive media issues could be handled by a committee instead of the board. • The public access channel is positive. • Superintendent reacts to certain members of the African American Community rather than to the community at large. • YISD does not emphasize the accomplishments of the African American community. • There is predominantly Hispanic community involvement throughout the district. YISD does not include other cultures in community initiatives. • African American parents can become involved in programs such as athletic booster clubs. • The district only uses Hispanic and Anglo students to make daily announcements of lunch menus and should seek out African Americans also. • YISD does not have African American representation in its community relations department. • YISD should have more African American participation in television coverage. The African American community should not be totally ignored. • Public speaking at board meetings was cut back. • No responses to questions raised are provided at board meetings.

• Elementary parents are notified of TSPR visit-but not secondary parents. • Parents feel intimidated. • There is parental involvement for elementary school programs but very little for secondary and special education programs. Participation in these programs should be incentive. • Family Preservation has brought families and the community together. • YISD should expand the mentor program better to help students. • Most campuses receive financial support from local businesses through the "Partners in Education" program. • YISD should look for businesses that want to bring students on site to mentor them, not just to give money. • Successful community involvement initiatives should be communicated to all campuses. The Northeast section of the district does not know what the schools in the lower valley are doing. Communication problem is also between campuses. • Parental involvement with students' education decreases after the elementary school level. • The perception that teachers do not care can be addressed by educating parents and teachers. • A simple "hello" from teachers to parents will go a long way to addressing the poor perception that parents have of teachers. • YISD is very involved in the El Paso community. The administration is encouraged to participate in community activities. • The district is doing a good job at getting community involved. • The person in charge is doing a lot of work with businesses and parents. • The district tries to reach out to the community. • The local media only reports half of a story. • YISD reports to Ysleta residents and businesses contain only positive articles. • Parents feel there is adequate communication between themselves and the district however, businesses do not. The local chief of communication has met with the superintendent and the board to discuss issues, but the superintendent was not interested. • Parents were required to spend two hours a week at each child's school in order to get free tuition for summer school. Financial Management
• Significant controls are in place. • Greater communication is needed between education program staff and the finance office. Financial reporting would be enhanced with better communication among educational program staff, schools and the finance office. • Budget should be aligned with the district's goals of the district. • Central financial office provides regular reports and information. • Teachers have to buy their own supplies which may suggest financial mismanagement. • Budget allocation does not necessarily reflect teachers' needs. • There is unequal distribution of district resources between bilingual and monolingual programs.

• The district does not reward efforts to pursue continuing education. • In some cases, principals permit abuses of the payroll system. • The abuse of site-based management allows principals to unevenly distribute resources. • Nepotism and friendship in hiring is another abuse of site-based management. • There is no public input into the budget process; taxpayers want input and information flow. • Budget information is not factually communicated, but slanted through the media. • The only aspect of the budget process that includes public input is the mini-grant program. • The district is well prepared on budget issues. • The district deadlocked and has limited tax base. • Open enrollment is used to supplement incoming funds. • Taxes are increasing each year, but YISD officials are not accountable for the manner in which funds are spent. • Open enrollment policies affect the local tax base. Taxpayers should not pay local taxes for students from other districts . • Public hearings on the YISD budget are not effectively communicated to the public. • Not all facilities are in compliance with ADA because of a lack of funding. • Financial reports are not accessible, so many expenses are hidden. For example, litigation costs involving parents who go through ARD sessions. • Common sense, enforcement, and accountability could prevent a lot of litigation. • It is unclear whether the TEA is involved in YISD and how tax money is used. • The presentation of the budget is not user friendly. • The school board discusses budget information late at night during long board meetings which is not conducive to involving members of the community. • Budgets are approved too late; the board approves the budget at the end of August just before school starts. • Principals determine budgets, and how money is spent depends on their vision. • The superintendent is on the "edge" of being financia lly mismanaged. Activities appear inappropriate even illegal. Some board members understand finances, others do not. The superintendent takes advantage of board member's with lack of financial background. Personnel Management
• YISD does a good job of recruiting. • The following incentives should be established to retain teachers:
- Add five days to new teacher contracts for professional development. - Hold student teacher job fairs. - Hire first time teachers at the beginning of summer so that new teachers can prepare for the classroom by becoming involved in summer school.
• Teachers in math, science, and reading compete for professional development. • The district promotes Hispanics at the expense of African Americans and Anglos.

• Principals only have one-year contracts, which is used as a weapon. • The district is biased against older people, African Americans, and Anglos in its hiring practices. • Teachers are placed in undesirable positions in an effort to eliminate them. • Teachers are given unfair evaluations by principals; grievances are not heard. • EEOC complaints are not heard. • Job communication is closed; hiring is largely internal, and is dependent upon friendships rather than qualifications. • Site-based management makes hiring difficult; interviews, hiring, and screening should be centralized, not site-based. The hiring process is confusing and fragmented. • The wage structure seems fair. • Many of people want to work for the district. • Retirees need optiona l retirement programs and can't live on normal retirement plan. • The career ladder for faculty is positive. • There are no African Americans in central administration and upper management positions. • There is only one African American assistant principal and one African American principal in YISD. • YISD is not making a reasonable effort to recruit African American teachers. • YISD is replacing qualified African American teachers with less qualified Hispanic and Anglo teachers. • The district promotes Hispanic teachers and administrators at the expense of African Americans. • There is no training for recruiters who hire special education teachers. • There is a lack of specialized service personnel such as physical, occupational therapists, speech and language pathologists. • The district would rather hire unqualified substitutes and aides than qualified or certified personnel. • The district is reluctant to contract out for service providers. • Special education testing is done by uncertified personnel because the district has no special education counselors. • The superintendent said: "I don't care about teachers", which negatively affected teachers' morale. • YISD, like other school districts in Texas, has a shortage of teachers. • The early retirement incentive program made the district lose experienced teachers and the district has suffered as a result. • Teacher's salaries at YISD are competitive locally. • YISD's grievance process is not worth the effort one has to go through to pursue a grievance. • Compensation for teachers is fair, but could be improved. • Benefits at YISD are good. • YISD's appraisal process too complicated and subjective.

• The superintendent "flattened" the organizational structure to mirror business. A lot of middle management people are missing, e.g. counselors. There is no counselors in central administration. • YISD has a strong staff and faculty, although ninety percent have less than five years teaching experience. More experienced teachers are being replaced with younger teachers. • YISD doesn't hear listen to suggestions regarding recruiting. Asset and Risk Management
• Health benefits at YISD are competitive. • Communication at YISD is good. • Some employees have expressed concern that there was retaliation based on their filing worker's compensation claim, based on hearsay from a board meeting. • YISD's health insurance plan is good. • YISD's health coverage may not be comprehensive • The district does not follow policy on worker's compensation issues. • The management review team should evaluate whether bond proceeds were used for the designated specified purpose (based on board meeting conversation). • The public is not aware of what's going on. • Teachers who filed workers compensation were harassed; some left YISD for other teaching positions. • There is reluctance to assist teachers with disabilities. Teacher with polio using leg braces and crutches must park across the street and other side of school to get to her class. • A student's teeth were knocked out in an accident on campus and YISD refused to pay for it. • Workers' compensation claims processing is really efficient. Computers and Technology
• Student access to information is a priority. • Development of fiber optic cabling should be developed for all schools. • Parents can be trained on computers and given access to laptops to take home. • At dropout recreation centers, the curriculum was provided via computers. • There is adequate technology in the schools. • There is unfair distribution of computers to students with ESL. • There is a concern that computers aren't placed in black households. • There are lots of computers in schools, but no access to Internet. • Students are computer-literate. • The district is wired for fiber optics, which is good. • A good technology master plan was developed two years ago. • The science and technology school is excellent. • YISD does not allocate computers equitably throughout the district. The Parkland area, which is predominantly African American is not getting its fair share of computer technology. The Parkland area is an African American area.

• There are no Black teachers in the area of computer instruction. • Computers are outdated and there are not enough of them. • Learning disabled students are allowed to use the computer if they complete their work on time. • Teachers are not well trained. • There are few incentives for students • Learning disabled students learn better using computers. • Computer keyboards are not modified. • The district does not use Regulation XIX and its resources for technology and computers. Teachers do not know what Regulation XIX is. • Technical support is not accessible. • Senior teachers have been intimidated by the new technology, and YISD has not provided appropriate training. • In some schools, technology is not implemented fast enough. • Some campuses have technology, while others are resisting technological advancement. • YISD should provide more training with using computer technology. • The superintendent has a strong vision regarding technology. • Hardware and software have become out dated because they are not continuously updated. • The district relies too much on technology. • The district is wired for fiber optic. • Computers are very effective. More computer technology is needed at the high school levels, less so at the elementary and middle school levels. Purchasing
• There is a concern that bids are awarded to friends and allies of the superintendent. • The district needs more ads in local newspaper and public access channel. • "Good old boy" system. • Purchasing does not respond promptly to vendors. • Purchasing should collaborate more with local groups for purchasing. • Purchasing should use more local and small businesses. • Bids should rotate at least every two years • The district does follow bidding laws. The superintendent has authority to award contracts under one hundred thousand dollars. Purchases over one hundred thousand dollars board must be approved. This is a good system, because it helps small businesses. • Teachers must sometimes purchase their own instruction supplies in some instances. • The majority of YISD's budgets are allocated to salaries rather than supplies. • The greater El Paso area is attempting to consolidate purchasing for the county, city, and school districts. • Competitive bidding practices are questionable; most of YISD's contractors are Hispanic. • Black contractors do not get their fair share of contracts with YISD, because they are not notified of bid opportunities.

• There are lots of hidden expenses in purchasing. • There is a lack of competitive bidding for related services. • The bid process lacks specifications. • Potential bidders are hand-picked. • Medicaid financial guidelines should be used to pay independent service providers. • The bidding process is inefficient, and not cost effective. • YISD buys from a local electronics company that will not lower prices for bulk sales. • The purchasing process is cumbersome, unwieldy, and inefficient. • The purchasing department looks for the best bid, but improved technology could help purchasing to more effectively research the best pricing available. • Services to campuses are poor. • Schools not allowed to select their own vendors • The purchasing process is long, and limits vendor selection. • Most difficult to deal with: refuses to provide paperwork to pay for purchases. Facilities Use and Management
• The superintendent places a priority on renovating, school facilities, especially in lower income areas. • The superintendent is aware of facilities problems in schools and corrects them as quickly as possible. • The schools are not overcrowded. • Facilities are well maintained. • Some schools do not have adequate bathroom facilities. • When students and employees take ownership of their campus facilities will remain clean. • A long range maintenance plan should be developed and communicated to the public. • Long range plans are not implemented, and plans are changed mid-stream. • A new building should be planned with "excess" rooms to accommodate growth. • Facilities need a six-year plan (not one or two years) which places greater emphasis on planning. • There is only one architectural firm will work with the district, because it is seen negatively by community as a closed system. • At Eastwood High School the air-conditioning and heating system didn't work over a four year period. • Hanks High school facilities are too small, and not always in good repair. • Facilities are not well maintained. • Parkland High School is overcrowded. • The YISD administration facility is excellent, and open to the public. • Facilities are open at night for adult learning. • Buses should be used to transport students between schools to alleviate overcrowded campuses. • Schools in the Parkland Area which is predominantly Black, are not in good condition.

• Schools south of Interstate 10 which are in a predominantly Hispanic area are in poor condition as well • YISD has too many portable classrooms because of the influx students from Mexico and from other schools districts). • Generally, schools are overcrowded. • Facilities need to be better planned and managed. • Construction has cost overruns because of frequent orders. • The superintendent opens the central administration facility to the public. • Custodians do a good job maintaining YISD schools. • There are very few African American custodians employed by YISD. • Facilities are Extremely overcrowded and underused. • Custodial management is poor. • Restrooms should not be locked during the day. They are only available during lunch time. • Many facilities are not in compliance with ADA guidelines • There is a lack of adherence with health codes. • There should be greater cooperation with community agencies for facility use. • Event planning is inconsistent. • The condition of facilities varies from school-to-school. • There are rooms on some campuses that are not being used. • Generally, schools are well maintained. • Custodians do not dust the top of cabinets or shelves; they only clean floors. • Some campuses require more preventative maintenance than others. • The superintendent made a smart move when he sectored YISD into teams; this system provides quicker service. • YISD's facilities maintenance varies by school. • YISD's facilities department is very cooperative in event planning for internal and external functions. • YISD is land locked and can't grow. • YISD facilities are not overcrowded. • YISD has no custodial problems. Transportation
• Buses run on schedule, and students are safe. • There is no consistent procedure across schools for chaperoning students during extracurricular activities events (may vary by school). • Buses are well maintained. • There should be seat belts on buses. • Bus drivers are not treated fairly regarding bus route assignments, which may result in driver turnover (based on board management comments). • Some bus drivers complain that the same drivers are always getting better routes. • There is a problem with the billing process used for buses for events; billings take too long. The transportation department should be able to project costs.

• The transportation department is responsive. • Buses are well maintained. • Drivers are excellent and knowledgeable • Bus scheduling is difficult for special events, and needs to be better coordinated and prioritized. Schedules should be centralized and communicated. • Clarification is needed regarding scheduling and rates for buses for special events. • The transportation department need employees to be experts, and communicate and facilitate the scheduling of special events • Buses are generally safe, however some do not feel safe. • Bus scheduling is not service-oriented. • Drivers should be trained on how to handle different groups of students, for example the physically challenged. • Video cameras and "dumb boxes" are needed on buses. • Buses were overcrowded • Gas tanks on school buses need to be reviewed. • It is unclear whether buses are available to accommodate handicapped individuals. • There is no air-conditioning for disabled students as required by the mediation settlement two years ago. • Special education buses do not have supervisory personnel. • There is a lack of trained and knowledgeable personnel to supervise special needs students such as the hearing impaired. • Different students are grouped together on the same buses, for example grade levels and special education. • Buses are not always on time. • Riders on buses have to stand, which is unsafe. • YISD does not have enough buses for extracurricular activities. • Buses sometimes break down and students arrive to school late. • YISD's bus drivers deserve a lot of credit for driving safely and getting students to their destinations on time. • The buses are in good condition. • The superintendent bought six air-conditioning tour buses for the students to use, but instead they are used for other purposes. • Buses are adequately maintained. • Drivers have a good safety record. Food Service
• YISD cafeterias offer a wide variety of food. • Teachers are complaining that the cost of food is too high. • The menu does not include a wide variety of food; mainly Mexican. • Food service does not follow the published menu. • The food on the menu are high in fat and starch. • Federal subsidies for free meals may be too low, resulting in poor menu planning. • The quality of food preparation is poor; in some schools.

• It is unclear how students with special dietary needs are addressed. • The portions of food served are too small and not regulated properly among age groups. • Some kitchens are run by dictators. • Food is thrown away; schools need better menus. • Food service should give leftovers to non-profit organizations. • Students should be allowed second helpings and take home leftovers. • There are no juice machines on campus. • Food Service offers good programs and good variety. • Food should taste good. • Programs teaching students culinary arts are good. • The food is good but it is still institutional food; make it more attractive and tasty or students will not eat it. • Cafeteria workers have negative attitudes, which impacts students. • If a food court were offered students would be more likely to stay on campus during lunch. • The nutritional content of meals served by the district should be monitored. • Meals are served on time in an orderly fashion. • Food served is not good, many students go out for fast food. • Unused food is thrown away which is a waste of food. • Lunch and breakfast breaks are too short. • Middle schools offered salad options. • At middle schools there are special foods for teachers but not for students. • Students throw away too much food. • The appearance of food is not appealing to students. • Students at elementary schools eat early (before 1:00 p.m.). • Middle schools serve too many hamburgers, fries, pizza, and nachos. • There are short lines in high school cafeterias because campuses are open for lunch. • Students complain about hair in their food. • The food is not always good. • The menu sometimes has too little variety. • The cafeteria in the administrative building is excellent. Safety and Security
• The environment s graffiti- free. • Security guards in some schools help make gang related disciplinary problems worse. • In some cases there is a cover-up by principal of illegal weapons/contraband brought to school to avoid dealing with problems; this situation creates an environment of intimidation that keeps teachers silent. Such cover-ups and neglect may jeopardize students' safety • Sometimes a particular teacher may unfairly be assigned a high percentage of at-risk students. Teachers are afraid to report disciplinary problems for fear of being given poor evaluation from administrators for classroom management.

• Each teacher needs an emergency button to call security from the classroom. • Some campuses have their own police force, while others do not. • Schools are generally safe for students; certain areas are fenced for added safety. • Sometimes school administrators are reluctant to prosecute • Principals are sometimes dictatorial. • Safety issues that do arise need to be carefully handled by public relations. • The district needs to be accountable, not appear to cover-up. • The security force does not appear qualified; they seem afraid of stepping in. • Schools should have their own security force that would know students and feel stronger ties to the school. • Students throw rocks at rival school buses. • It is unclear how having a police force on campus impacts the school's Gangs are strong in schools. • Schools should consider using drug-sniffing dogs. • Students face peer pressure to join gangs and should be counseled at the elementary level. Schools should offer a positive alternative to gangs such as rallies and sports. • Schools are actively trying to prevent students from forming and participating in gangs. • African American students receive more harsh punishment for similar offenses. • YISD has a problem with gangs and drug use throughout the district. • YISD had police on campuses in the past. • YISD should conduct more weapon searches because students are bringing weapons to school. • Community based organizations assist with YISD gang and drug intervention initiatives. • Schools should institute uniforms for students because it diminishes theft and violence in the schools. • The D.A.R.E. program is quite active in YISD. • African American students are routinely sent out in the halls if there are disciplinary problems. • There are a lot of drug-related fights; students poor behavior is often overlooked by biased guards. • There is an increasing level of concern that teachers are abusing students. • Incidents are not always reported to police and child protective services (CPS). • It is unclear whether security officers are trained or certified. • There are fewer confrontations in the halls when kids wear uniforms. • Teachers should be better informed about why students are removed from the classroom for weapons possessions, violence, or drugs. • Principals are in denial about YISD's gang problem. • Schools have drugs, alcohol, and weapons related incidents, but do not appear to be addressing these problems. • Teachers are discouraged from writing reports on disruptive students. • Counselors are not used effectively in case of discipline management. • Campuses are safe. • Security does the best as they can n dealing with students.

• The head of security is excellent. • A collaborative agreement with the El Paso Police Department (EPPD) will put uniformed officers on the campuses. • Students are often left in school rather than being expelled. • Drugs are widely used; rhyphonol, the date-rape-drug is especially prevalent among gangs. Additional Comments
• YISD offers possible options for girls and boys either as participants or trainers in athletic programs. • YISD has strong tutoring and support services. • YISD has a good support program for young parents to help them stay in school. • The student entrepreneur center should be expanded to include more students. • Large districts should be split into smaller districts. Although splitting a district would increase costs, it would also improve effectiveness. YISD should be split into two districts and El Paso into three districts. • The superintendent should be dismissed.

Appendix J
TEXAS EDUCATION AGENCY Academic Excellence Indicator System
1996-97 District Performance
Indicator: State Region XIX
Ysleta Houston San Antonio
Corpus Christi
Fort Worth
Dallas Austin El Paso
Socorro
TAAS % Passing
Grade 3
Reading 1997 81.50% 79.30% 82.10% 79.40% 58.30% 81.50% 70.00% 62.80% 78.40% 78.30% 81.50%
1996 80.50% 79.60% 81.00% 77.60% 59.10% 81.50% 68.80% 63.20% 75.70% 80.90% 80.30%
Math 1997 81.70% 80.80% 82.50% 76.10% 60.80% 80.80% 71.00% 61.80% 76.20% 80.60% 82.00%
1996 76.70% 76.30% 82.10% 74.70% 56.50% 77.90% 63.10% 58.90% 68.10% 74.90% 77.40%
All Tests 1997 74.20% 71.40% 74.30% 69.30% 49.30% 73.30% 60.70% 52.20% 69.50% 70.40% 74.20%
1996 70.40% 68.60% 73.30% 68.10% 46.70% 71.90% 55.80% 50.90% 62.10% 68.50% 68.80%
TAAS % Passing
Spanish Grade 3
Reading 1997 44.60% 47.50% 64.30% 50.90% 19.30% 19.00% 42.70% 22.60% 35.40% 34.20% 45.20%

Math 1997 53.50% 57.20% 76.10% 58.70% 27.40% 35.00% 56.30% 26.70% 42.40% 46.10% 51.50%
All Tests 1997 37.20% 40.60% 58.30% 43.50% 16.10% 19.00% 35.30% 14.00% 26.50% 27.90% 39.10%
Indicator: State Region XIX
Ysleta Houston San Antonio
Corpus Christi
Fort Worth
Dallas Austin El Paso
Socorro
TAAS % Passing
Grade 4
Reading 1997 82.50% 80.30% 83.10% 82.00% 62.20% 85.20% 70.40% 63.60% 78.90% 80.70% 81.00%
1996 78.30% 75.10% 76.00% 78.10% 54.40% 79.10% 66.70% 61.10% 74.20% 75.20% 78.50%
Writing 1997 87.10% 85.70% 89.10% 87.60% 76.00% 90.50% 77.30% 73.90% 83.50% 84.80% 87.50%
1996 86.30% 84.60% 86.60% 88.20% 71.10% 89.70% 75.30% 76.30% 82.80% 83.50% 85.30%
Math 1997 82.60% 81.50% 87.40% 77.70% 62.90% 82.70% 71.30% 62.90% 75.60% 80.80% 81.50%
1996 78.50% 75.20% 79.30% 78.00% 55.10% 77.90% 62.40% 61.70% 70.90% 73.10% 77.90%
All Tests 1997 72.00% 68.70% 74.30% 68.90% 48.60% 74.40% 57.30% 49.80% 66.10% 68.00% 69.80%
1996 67.20% 61.70% 65.40% 67.00% 40.80% 68.60% 50.70% 48.80% 61.80% 60.30% 63.50%

TAAS % Passing
Spanish Grade 4
Reading 1997 36.80% 43.90% 54.60% 42.60% 29.40% 18.80% 30.70% 25.30% 23.60% 34.40% 48.90%
Math 1997 48.00% 59.00% 77.10% 54.00% 30.00% 20.00% 40.60% 30.50% 34.20% 47.30% 55.80%
All Tests 1997 29.60% 37.40% 50.10% 34.20% 20.50% 5.90% 22.80% 17.40% 19.30% 28.70% 34.70%
Indicator: State Region XIX
Ysleta Houston San Antonio
Corpus Christi
Fort Worth
Dallas Austin El Paso
Socorro
TAAS % Passing
Grade 5
Reading 1997 84.80% 81.00% 85.80% 84.60% 66.40% 85.20% 74.70% 65.50% 79.60% 81.80% 82.30%
1996 83.00% 79.90% 81.90% 82.90% 61.70% 83.40% 72.10% 66.90% 77.00% 81.60% 81.50%
Math 1997 86.20% 82.80% 90.00% 84.10% 67.30% 85.50% 74.20% 67.50% 77.30% 81.30% 83.00%
1996 79.00% 75.10% 80.40% 76.90% 57.20% 78.20% 64.60% 61.70% 72.60% 73.40% 78.50%
All Tests 1997 79.20% 73.90% 81.40% 77.40% 56.30% 78.40% 66.20% 56.20% 71.00% 73.50% 74.50%
1996 73.50% 68.50% 72.70% 71.50% 48.30% 72.70% 58.60% 53.80% 66.80% 68.20% 71.50%

Indicator: State Region XIX
Ysleta Houston San Antonio
Corpus Christi
Fort Worth
Dallas Austin El Paso
Socorro
TAAS % Passing
Grade 6
Reading 1997 84.60% 80.30% 88.50% 73.90% 65.70% 82.50% 70.10% 74.10% 79.20% 77.60% 79.80%
1996 78.40% 73.80% 78.90% 65.50% 54.50% 74.80% 63.90% 70.70% 71.30% 71.40% 74.50%
Math 1997 81.80% 77.60% 89.10% 70.00% 56.80% 78.90% 65.10% 72.50% 72.60% 73.10% 72.60%
1996 77.80% 74.00% 82.30% 65.70% 50.10% 73.20% 61.60% 70.80% 64.50% 68.30% 72.10%
All Tests 1997 76.80% 71.40% 83.30% 62.70% 49.70% 73.40% 58.00% 64.70% 67.70% 67.10% 67.40%
1996 70.10% 64.30% 72.00% 55.40% 40.00% 64.70% 52.00% 61.30% 58.60% 60.00% 63.10%
Indicator: State Region XIX
Ysleta Houston San Antonio
Corpus Christi
Fort Worth
Dallas Austin El Paso
Socorro
TAAS % Passing
Grade 7

Reading 1997 84.50% 81.20% 87.30% 74.90% 70.30% 80.80% 70.40% 70.80% 76.20% 81.00% 81.20%
1996 82.60% 80.90% 87.60% 72.50% 65.60% 80.00% 70.80% 70.00% 75.30% 79.20% 78.10%
Math 1997 79.70% 76.10% 84.90% 67.10% 59.00% 73.00% 61.30% 63.70% 68.30% 73.40% 73.70%
1996 71.50% 66.00% 73.70% 56.10% 44.00% 63.40% 55.50% 54.90% 58.20% 62.80% 63.60%
All Tests 1997 75.10% 70.50% 79.50% 60.90% 52.80% 68.00% 55.70% 56.90% 63.80% 68.40% 68.00%
1996 68.00% 62.40% 70.50% 52.00% 40.60% 60.10% 51.50% 50.40% 55.20% 59.70% 58.80%
Indicator: State Region XIX
Ysleta Houston San Antonio
Corpus Christi
Fort Worth
Dallas Austin El Paso
Socorro
TAAS % Passing
Grade 8
Reading 1997 83.90% 81.50% 85.60% 75.00% 67.70% 80.60% 71.50% 70.50% 75.40% 81.70% 81.20%
1996 78.30% 75.80% 80.40% 64.70% 56.60% 72.40% 64.00% 65.70% 68.40% 74.40% 74.80%
Writing 1997 80.70% 77.10% 83.50% 70.30% 65.30% 80.00% 64.40% 67.00% 73.20% 77.30% 76.50%
1996 76.90% 73.90% 79.20% 61.70% 61.50% 74.50% 67.10% 67.10% 68.30% 73.40% 73.30%
Math 1997
76.30% 71.40% 76.50% 63.10% 50.00% 69.70% 58.10% 59.50% 62.70% 70.30% 69.10%

1996 69.00% 64.10% 69.80% 53.30% 41.40% 60.00% 52.20% 54.70% 54.20% 61.10% 62.30%
Science 1997
84.60% 82.30% 84.00% 74.40% 68.80% 79.30% 69.50% 65.30% 77.80% 83.80% 82.70%
1996 78.00% 75.00% 78.70% 64.60% 57.80% 70.40% 63.70% 60.70% 69.60% 74.50% 75.80%
Social S. 1997 67.40% 60.50% 60.20% 53.30% 42.40% 57.60% 50.50% 46.60% 60.90% 63.90% 64.30%
1996 70.20% 67.30% 70.50% 55.80% 46.80% 61.70% 54.10% 53.40% 61.70% 68.00% 65.10%
All Tests 1997
57.30% 49.50% 51.80% 41.60% 30.30% 47.70% 38.20% 34.90% 47.90% 52.70% 48.90%
1996 53.70% 47.30% 52.00% 35.80% 26.40% 44.20% 38.00% 35.70% 43.40% 46.90% 45.80%
Indicator: State Region XIX
Ysleta Houston San Antonio
Corpus Christi
Fort Worth
Dallas Austin El Paso
Socorro
TAAS % Passing
Grade 10
Reading 1997 86.10% 78.90% 82.30% 79.70% 71.70% 85.10% 77.40% 77.80% 84.00% 78.50% 81.80%
1996 81.90% 75.60% 75.50% 71.10% 65.30% 83.20% 71.90% 70.60% 81.00% 77.10% 81.90%
Writing 1997 88.50% 82.20% 87.40% 79.90% 75.40% 89.50% 79.50% 79.90% 86.20% 80.00% 88.80%

1996 86.00% 81.60% 82.60% 74.60% 71.90% 88.30% 77.10% 76.00% 82.90% 81.90% 88.70%
Math 1997 72.60% 59.40% 60.50% 60.70% 48.30% 65.10% 57.80% 60.60% 70.60% 58.20% 66.00%
1996 66.50% 59.00% 53.20% 53.30% 42.00% 61.10% 54.90% 54.80% 63.70% 61.20% 68.50%
All Tests 1997 67.80% 54.20% 56.70% 55.10% 42.20% 61.00% 53.10% 53.80% 65.60% 52.90% 61.30%
1996 60.70% 52.10% 48.10% 46.00% 35.80% 56.90% 48.40% 45.80% 58.90% 54.50% 62.40%
Indicator: State Region XIX
Ysleta Houston San Antonio
Corpus Christi
Fort Worth
Dallas Austin El Paso
Socorro
TAAS % Passing
Sum of 3-8 & 10
Accountability Subset
Reading 1997 84.00% 80.40% 85.20% 78.30% 65.90% 82.90% 72.00% 69.10% 78.70% 79.90% 81.20%
1996 80.40% 77.20% 80.30% 73.10% 59.40% 79.10% 68.20% 66.70% 74.50% 76.90% 78.40%
Writing 1997 85.30% 81.40% 86.30% 79.00% 72.30% 86.50% 73.60% 73.20% 80.60% 80.40% 84.10%
1996 82.90% 79.70% 82.50% 74.50% 68.00% 83.90% 73.00% 73.10% 77.80% 79.30% 81.90%
Math 1997 80.10% 75.10% 80.80% 71.30% 58.20% 76.60% 65.70% 64.20% 72.10% 73.30% 75.10%
1996 74.20% 69.50% 73.70% 65.60% 49.90% 70.20% 59.30% 59.80% 64.80% 67.40% 71.20%
All Tests 1997 73.20% 66.90% 73.40% 63.80% 48.70% 69.80% 57.00% 54.50% 65.50% 65.60% 67.40%

1996 67.10% 61.20% 65.40% 57.30% 40.90% 63.50% 51.60% 50.80% 58.80% 60.00% 62.60%
TAAS Cumulative
Pass Rate - Exit
Class of 1997 86.60% 80.10% 77.70% 76.80% 73.30% 83.00% 81.00% 81.50% 81.60% 81.50% 87.00%
Class of 1996 84.70% 76.80% 74.50% 74.00% 68.90% 82.40% 77.30% 77.50% 82.90% 76.50% 90.00%
Indicator: State Region XIX
Ysleta Houston San Antonio
Corpus Christi
Fort Worth
Dallas Austin El Paso
Socorro
TAAS % Exempted
Sum of 3-8 & 10
Reading
LEP 97 2.70% 3.00% 1.80% 6.60% 1.10% 0.30% 3.30% 10.30% 1.70% 3.10% 4.80%
LEP 96 3.80% 8.20% 3.90% 8.60% 3.90% 0.40% 5.00% 16.70% 1.30% 8.10% 11.10%
Sp. Ed. (ARD) 97 6.20% 3.20% 2.00% 10.20% 7.50% 4.90% 11.00% 8.00% 5.50% 2.80% 6.50%
Sp. Ed. (ARD) 96 6.30% 4.40% 2.60% 9.60% 7.60% 5.30% 10.40% 8.30% 6.00% 4.40% 8.00%
Writing
LEP 97 2.80% 3.90% 2.60% 5.80% 1.90% 0.60% 3.90% 10.60% 2.00% 3.40% 7.40%

LEP 96 4.00% 8.50% 4.80% 9.60% 4.20% 0.70% 5.30% 17.20% 1.80% 8.30% 11.00%
Sp. Ed. (ARD) 97 6.20% 3.30% 2.20% 10.60% 7.70% 5.00% 10.50% 7.20% 5.10% 3.00% 5.30%
Sp. Ed. (ARD) 96 6.30% 4.10% 2.50% 9.30% 7.60% 5.20% 9.50% 7.80% 5.40% 4.00% 8.20%
Math
LEP 97 2.60% 3.00% 1.80% 6.60% 1.10% 0.30% 3.30% 10.30% 1.60% 3.10% 4.80%
LEP 96 3.80% 8.20% 3.90% 8.80% 3.90% 0.40% 4.90% 16.60% 1.30% 8.10% 11.10%
Sp. Ed. (ARD) 97 5.70% 3.00% 1.80% 9.30% 6.60% 4.60% 10.90% 7.90% 5.00% 2.70% 6.00%
Sp. Ed. (ARD) 96 5.90% 4.10% 2.20% 8.80% 6.80% 5.10% 10.30% 8.30% 5.60% 4.20% 7.70%
Indicator: State Region XIX
Ysleta Houston San Antonio
Corpus Christi
Fort Worth
Dallas Austin El Paso
Socorro
End-of-Course
Exam
(% Taking)
Biology I
Grades 8-12 97 19.70% 20.50% 25.00% 17.10% 21.80% 22.90% 17.40% 17.10% 20.80% 17.70% 16.60%
96 19.90% 21.60% 24.30% 17.10% 21.80% 16.50% 17.30% 19.40% 19.70% 17.70% 23.90%
Algebra I

Grades 7-12 97 18.30% 18.50% 17.70% 15.00% 22.80% 18.20% 18.40% 21.30% 18.80% 17.50% 22.90%
96 17.80% 18.50% 17.70% 14.20% 20.60% 15.20% 16.70% 18.10% 15.20% 17.40% 22.50%
Attendance Rate
1995/96 95.10% 95.10% 94.90% 93.80% 93.90% 94.40% 93.60% 94.10% 93.50% 95.10% 95.10%
1994/95 95.10% 95.00% 94.70% 93.70% 94.00% 95.00% 93.60% 93.40% 93.70% 95.00% 95.40%
Dropout Rate
1995/96 1.80% 1.80% 3.70% 4.20% 2.90% 2.00% 2.40% 1.60% 2.00% 0.80% 0.80%
1994/95 1.80% 2.40% 4.80% 3.70% 3.50% 0.80% 2.10% 1.80% 3.10% 1.00% 0.60%
% Adv. Courses
1995/96 17.30% 12.10% 11.60% 12.90% 13.70% 12.70% 16.10% 17.50% 14.40% 12.80% 9.20%
1994/95 15.10% 7.60% 2.20% 12.30% 12.50% 13.40% 16.60% 10.80% 13.30% 8.40% 11.60%
Indicator: State Region XIX
Ysleta Houston San Antonio
Corpus Christi
Fort Worth
Dallas Austin El Paso
Socorro
% Rec. HS Pgm.
Class of 1996 0.50% 0.60% 1.50% 0.00% 0.00% 0.00% 0.00% 0.00% 0.00% 0.00% 0.00%
Class of 1995 0.30% 0.10% 0.00% 0.00% 0.00% 0.00% 0.00% 0.00% 0.00% 0.00% 0.00%
AP Results

% Taking
1996-97 8.50% 6.90% 8.40% 5.30% 9.00% 3.80% 8.30% 11.50% 22.20% 8.10% 1.10%
1995-96 7.60% 5.10% 5.00% 5.00% 6.50% 3.50% 7.50% 8.00% 18.00% 6.50% 2.00%
% Scores >= 3
1996-97 58.70% 41.20% 28.10% 67.00% 31.40% 65.30% 50.90% 34.20% 55.30% 53.20% 57.70%
1995-96 60.60% 43.40% 38.40% 66.40% 36.80% 53.80% 57.20% 33.80% 59.00% 49.80% 43.80%
% Examinees >= 3
1996-97 61.70% 45.90% 34.80% 68.10% 36.30% 73.70% 55.80% 38.30% 63.30% 57.30% 71.40%
1995-96 62.60% 47.60% 45.60% 68.40% 41.40% 63.20% 55.60% 37.00% 65.40% 53.60% 44.40%
TAAS/TASP Equiv.
Class of 1996 40.00% 27.90% 25.90% 30.90% 21.50% 36.30% 35.00% 24.30% 42.50% 33.60% 24.90%
Class of 1995 39.90% 27.20% 25.70% 30.90% 18.50% 35.10% 30.50% 23.10% 44.20% 30.80% 24.50%
SAT/ACT Results
% At/Above Crit.
Class of 1996 26.30% 14.50% 10.00% 20.40% 5.90% 21.90% 25.30% 13.00% 39.70% 20.70% 12.80%
Indicator: State Region XIX
Ysleta Houston San Antonio
Corpus Christi
Fort Worth
Dallas Austin El Paso
Socorro

% Tested
Class of 1996 64.70% 58.00% 62.70% 61.40% 80.30% 64.90% 68.90% 54.10% 64.90% 58.60% 49.20%
Class of 1995 64.80% 59.10% 65.90% 59.50% 69.10% 64.60% 60.90% 53.40% 63.60% 57.30% 50.80%
Mean SAT I Score
Class of 1996 993 909 878 932 830 983 959 874 1051 949 908
Mean ACT Score
Class of 1996 20.1 19.5 19.1 18.9 17 19.3 19.6 17.2 21.3 20.6 18.7
Class of 1995 20 19.3 19.2 19.1 17.2 19.4 18.9 17.8 21.5 20.6 18.1
Indicator: State Region XIX
Ysleta Houston San Antonio
Corpus Christi
Fort Worth
Dallas Austin El Paso
Socorro
TAAS % Passing
Sum of 3-8 & 10
Special Ed. Subset
Reading 1997 47.10% 37.40% 40.50% 56.80% 21.70% 37.20% 48.40% 38.80% 31.60% 32.10% 55.80%

1996 44.30% 36.10% 34.50% 57.20% 18.70% 32.80% 41.10% 45.40% 32.10% 33.90% 58.90%
Writing 1997 44.50% 36.70% 38.10% 54.60% 25.10% 34.20% 48.00% 32.80% 30.00% 33.10% 59.30%
1996 43.00% 35.00% 33.50% 58.20% 23.50% 34.10% 41.60% 41.10% 30.60% 35.60% 51.00%
Math 1997 41.80% 32.60% 38.80% 47.00% 18.40% 29.30% 42.20% 32.00% 25.80% 25.50% 44.60%
1996 36.70% 28.20% 27.60% 46.70% 15.80% 26.00% 32.70% 32.70% 21.10% 24.50% 53.30%
All Tests 1997 31.10% 22.40% 25.60% 40.20% 11.20% 21.30% 32.50% 24.10% 17.50% 17.00% 37.30%
1996 27.80% 20.40% 17.70% 39.20% 10.10% 19.00% 25.50% 26.50% 15.60% 18.50% 42.70%
TAAS % Passing
Sum of 3-4
Spanish Subset
Reading 1997 41.60% 46.00% 60.10% 47.80% 22.90% 18.90% 38.50% 23.90% 31.20% 34.30% 46.60%
Math 1997 51.40% 57.90% 76.60% 56.90% 28.40% 28.60% 50.90% 28.50% 39.50% 46.60% 53.10%
All Tests 1997 34.30% 39.30% 54.80% 40.00% 17.70% 13.20% 30.90% 15.60% 23.90% 28.20% 37.50%
TAAS % Passing
Sum of 3-

8 & 10
Inclusive Subset
Reading 1997 80.30% 74.50% 78.80% 75.20% 61.30% 77.70% 70.00% 67.20% 73.30% 72.60% 79.00%
Writing 1997 82.20% 78.30% 82.30% 78.10% 69.00% 81.20% 72.60% 72.60% 76.60% 76.90% 83.10%
Math 1997 76.40% 70.40% 76.50% 69.00% 53.80% 71.10% 64.20% 62.60% 66.90% 67.30% 72.90%
All Tests 1997 68.80% 61.20% 67.30% 60.80% 44.40% 64.00% 55.00% 52.80% 59.80% 58.70% 64.80%